Abstract
To address the challenges of data fragmentation, inconsistent standards, and weak interactivity in oil and gas field surface engineering, this study proposes an intelligent delivery system integrated with three-dimensional dynamic modeling. Utilizing a layered collaborative framework, the system combines optimization algorithms and anomaly detection methods during data processing to enhance the relevance and reliability of high-dimensional data. The model construction adopts a structured data architecture and dynamic governance strategies, supporting multi-project secure collaboration and full lifecycle data management. At the application level, it integrates three-dimensional visualization and semantic parsing capabilities to achieve interactive display and intelligent analysis of cross-modal data. Validated through practical engineering cases, the platform enables real-time linkage of equipment parameters, documentation, and three-dimensional models, significantly improving data integration efficiency and decision-making capabilities. This advancement drives the transformation of oil and gas field engineering toward intelligent and knowledge-driven practices.
1. Introduction
1.1. Motivation
With the continuous growth of global energy demand and the increasing complexity of oil and gas field development, the data isolation among construction, design, and procurement parties in oil and gas field surface engineering projects severely restricts project efficiency. In the design phase, design data is disconnected from actual construction. The drawings provided by design institutes are often based on ideal working conditions, and problems such as discrepancies between design elevations and actual sites, and conflicts between pipeline routes and existing facilities frequently occur during on-site construction. Moreover, the design change process is lengthy, with an average of 5 working days for a change order to circulate, while construction parties often make adjustments on their own to meet deadlines, resulting in a deviation rate of over 15% between the final as-built drawings and the original design. In the procurement phase, the “one item, multiple codes” phenomenon is widespread; for instance, the same model of a gate valve has six coding variants, and 12% of the delivered materials do not match the order parameters. During the construction process, data is fragmented; quality records such as weld inspection reports and hidden works images are scattered among multiple contractors, making it difficult for supervisors to obtain complete data in a timely manner. These issues stem from inconsistent data standards among the three parties, the absence of a collaborative platform, and ambiguous responsibility boundaries. They not only lead to a 3% to 5% material waste but also consume 40% of management time in data coordination.
Therefore, digital delivery in oil and gas field surface engineering urgently needs to break through traditional data silos, build a technical system for deeply integrating multi-source heterogeneous data, achieve bidirectional data flow and closed-loop verification between design, procurement, and construction, and support intelligent analysis and collaborative optimization throughout the entire life cycle. This will provide the core driving force for the safe, precise, and efficient transformation and upgrading of oil and gas field engineering in the digital wave.
1.2. Literature Review
Currently, the global oil and gas industry is undergoing a rapid digital transformation, and leading oil and gas companies worldwide have initiated the development of intelligent oil and gas fields. International oil majors such as ExxonMobil and Total are actively cooperating with technology companies to develop intelligent solutions [1] based on cloud computing and AI. Domestic oil and gas enterprises are promoting the intelligent upgrade of the entire industrial chain by deeply integrating digital technology with industrial scenarios. The Yanchang Petroleum Safety and Fire Protection Integrated Platform focuses on safety prevention and control as well as unmanned operation and maintenance. It integrates security and fire protection systems to achieve 7 × 24-hour intelligent monitoring of the plant and station [2]. The Internet of Things platform of Changqing Oilfield has been connected to 23,000 gas Wells, achieving automatic collection of production data. The RDC platform of Xinjiang Oilfield has realized remote monitoring of drilling/fracturing, which has shortened the construction period of Well Zhongjia ZJHW203 by 30 days compared with the adjacent Wells and increased the supervision efficiency by five times [3]. The material supply chain platform of Daqing Oilfield has established a “grid-based+digitalized+big data” management model, and the procurement efficiency has increased by 21.3% [4].
In the wave of digital transformation in the oil and gas industry, digital delivery technology, as a key link connecting engineering design, construction production operation and maintenance, is facing new challenges and opportunities. Scholars at home and abroad have carried out multi-dimensional exploration around this field and promoted the continuous deepening of technology. Tao et al. discussed the application of digital delivery in the construction of oil depot engineering [5]. Wu et al. put forward the process and method of knowledge map construction in the oil and gas pipeline industry, and discussed the application of knowledge map in the decision-making process, application scenario and decision result of intelligent assessment of oil and gas pipeline geological hazards [6]. Guan et al. extracted knowledge from multi-source heterogeneous knowledge carriers and built a graphical knowledge base to improve work efficiency in the process of oil and gas exploration and development [7]. At the same time, digital twin technology, as an emerging means, provides new possibilities [8] for the whole life cycle management of smart oil fields by creating dynamic virtual models of physical entities or systems in virtual space. Since Grieves first proposed the concept of digital twins [9]. Andrey Konchenko has extended the digital twin technology to the petrochemical industry, creating visual simulation systems for running three-dimensional layouts based on pipeline, terrain and network inputs in the context of many years of oilfield development [10]. In addition, domestic scholars have also actively devoted themselves to the application research of digital twin technology in oil and gas fields. Based on the Xinjiang oilfield, Teng et al. studied and explored digital twin technology, built a virtual and real integrated construction and operation model, and realized the integrated management of the whole life cycle of intelligent factory construction, operation, and maintenance [11]. Based on the concept of digital twin, Yu proposed the integration theory and overall conceptual model of digital twin oil field waterflood system, and designed and developed the visualization platform of digital twin oil field waterflood system [12].
However, the prior art system still faces significant bottlenecks: on the one hand, the integration of multi-source heterogeneous data relies on the traditional similarity algorithm, and the analysis ability of high-dimensional engineering features is insufficient, resulting in limited data association accuracy; On the other hand, the design data of text technical documents and drawings have been separated for a long time, and there is a lack of semantic-driven cross-modal fusion mechanism [13]. In addition, three-dimensional visualization technology mostly stays in static model display, and dynamic data driving ability is weak, which is difficult to support complex engineering scenes.
Given this, this study builds a “data-model-scene” collaborative optimization framework based on hierarchical decoupling architecture. In the data layer, the data cleaning technology is used to process the original data, and the improved starfish algorithm is used to strengthen the data association accuracy. In the model layer, the multi-modal linkage engine is designed to open up the spatial-semantic mapping between documents, drawings and three-dimensional models, and the display consistency is improved by coordinate system transformation and geometric binding technology. In the application layer, the real-time interactive digital twin platform is developed to realize the multimodal display and interaction of gas field surface engineering data through the deep integration of knowledge graphs and digital twins. It aims to solve the problems of insufficient correlation degree of engineering data, cross-modal segmentation management, and weak visual interaction, and promote the transition of the industry from “data delivery” to “knowledge delivery”.
1.3. Contributions
The main contributions of this study are as follows:
- (1)
- In this paper, a layered collaboration framework for a digital delivery system is developed, which realizes the real-time linkage of equipment parameters, documents and models and significantly improves the efficiency of data integration.
- (2)
- This study combines knowledge graph and digital twin technology to establish a cross-modal fusion mechanism to bridge structured and unstructured data through semantic connection to support dynamic knowledge services.
- (3)
- This study designs a standardized data architecture with multi-tenant models and dynamic optimization mechanisms to ensure data quality, enable multi-project collaboration, and advance full lifecycle management of field operations.
1.4. Paper Organization
The subsequent part of this paper systematically introduces the layered collaborative framework for intelligent digital delivery of oil and gas field surface engineering. The structure of this study is organized as follows: Section 2 reviews the technology gap and digital delivery architecture of ground engineering digital delivery. Section 3 describes the core methods, including data processing, model construction and scene linkage techniques. Section 4 verifies the system through a practical engineering case study. Finally, Section 5 summarizes the research results.
2. System Description
2.1. Digital Delivery Form
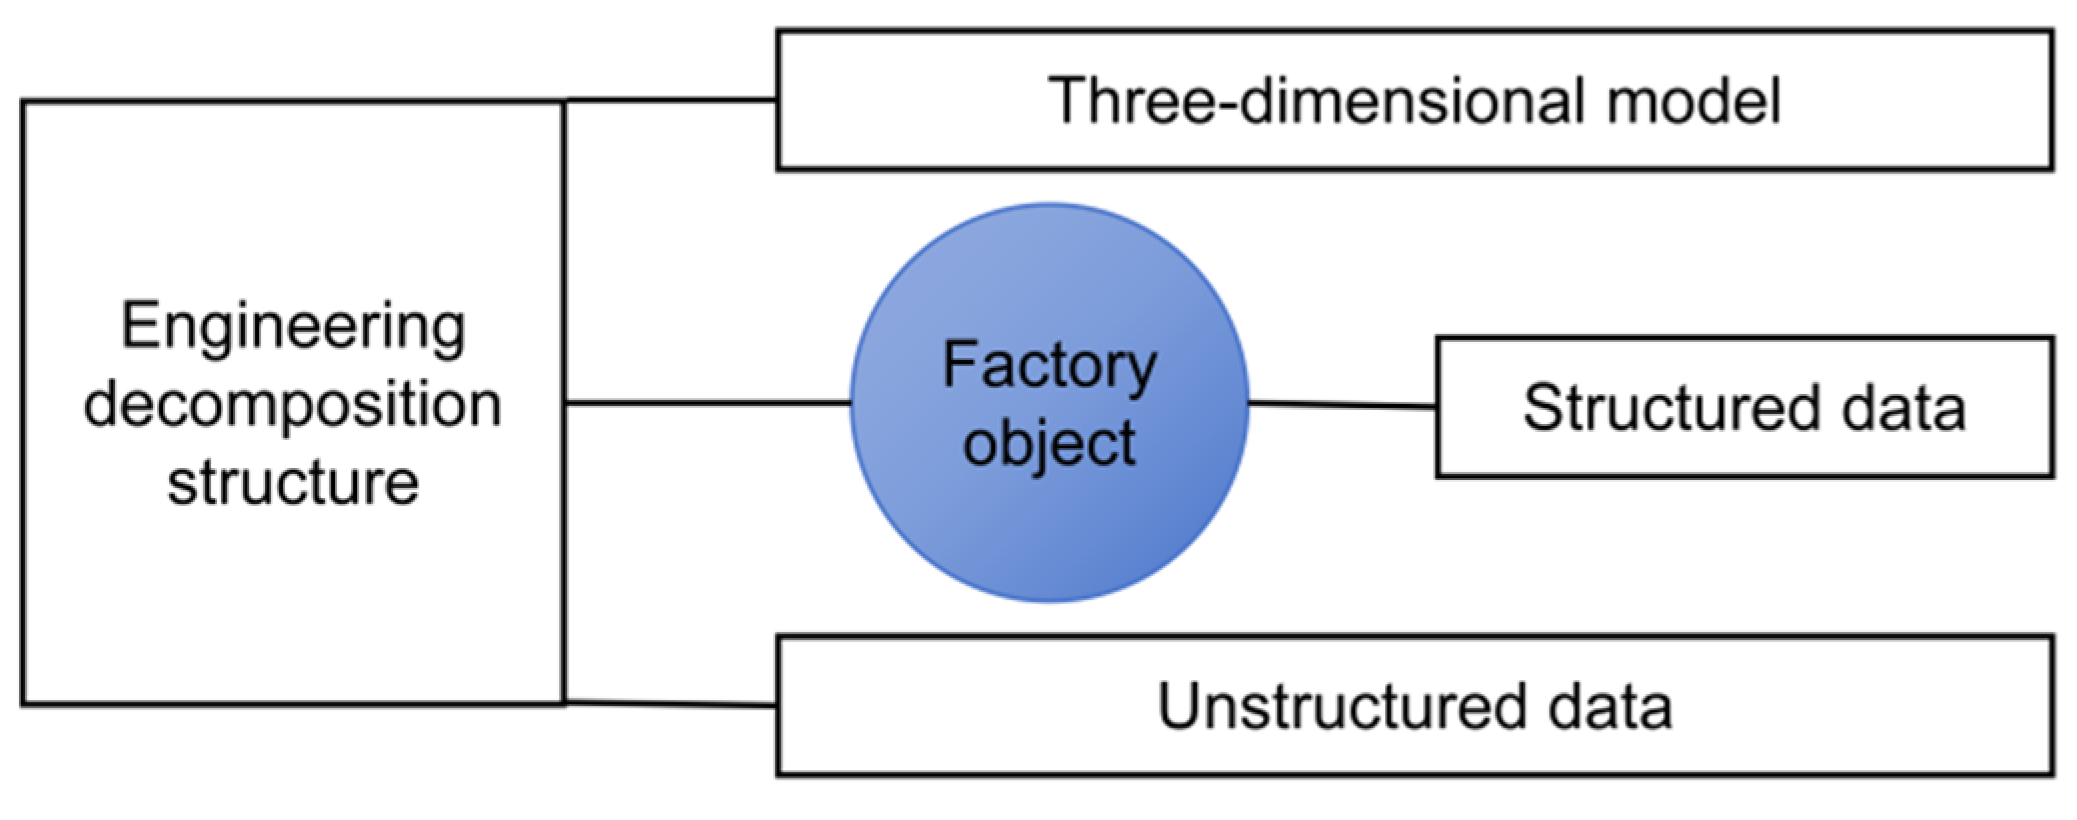
As a systematic engineering information management mode, the core of digital delivery is to digitally create, integrate and transfer the static information in the engineering construction stage through a multi-modal collaborative architecture, so as to provide dynamic knowledge support for the whole life cycle management of the project, as shown in Figure 1. In the field of oil and gas field surface engineering, digital delivery builds a hierarchical and semantic engineering data management system through the organic integration of structured data, unstructured documents and a three-dimensional information model, and realizes the transformation [14,15,16] from information island to knowledge network. The management of engineering data requires the coordination of structured and unstructured data, and the three-dimensional information model is used to achieve a comprehensive visual presentation. Structured data stores equipment parameters and process indicators in standardized metadata format, and uses unique identifiers to realize the mapping between data and physical objects. Unstructured documents provide supplementary explanations and technical support for structured data, helping to explain the logic and background behind the data. On this basis, the three-dimensional information model is built through high-precision mapping technology, and the spatial coordinate system and object identification are used to achieve the visual presentation of engineering entities, further integrating structured data and unstructured documents into an intuitive three-dimensional environment.
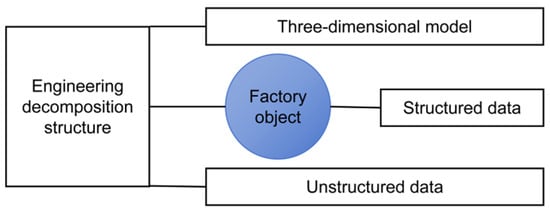
Figure 1.
Digitized deliverables.
2.2. Digital Delivery System Architecture
The architecture of the digital delivery system builds a complete closed loop from the bottom-level data collection to the top-level application service through the deep integration of data flow, control flow and knowledge flow, as shown in Figure 2. The data layer, as the foundation of the system, acquires structured parameters, unstructured documents and 3D point cloud data through multi-source acquisition interfaces. It preprocesses the data through data missing value supplementation technology and outlier detection technology. The association algorithm establishes a semantic association network among the data, providing the upper layer with high-quality data raw materials that have been treated. The knowledge base construction layer interacts with the data layer through two paths: ontology mapping and case reasoning. On the one hand, the cleaned structured data is terminally aligned with the industry standard ontology (GB/T 51296-2018 [17]) to form standardized knowledge nodes. On the other hand, conduct in-depth semantic parsing of unstructured documents, extract engineering empirical rules and store them in the case base to achieve the explicit transformation of tacit knowledge. The model construction layer, as the core hub that connects the upper and lower levels, not only receives business rule constraints from the knowledge base but also concretizes these constraints as data verification logic through the entity relationship model. The metadata framework established in this layer not only guarantees the scalability of the data model, but also ensures the traceability of the data evolution process through the version control mechanism. When serving the application layer upwards, the model layer simultaneously supports real-time data requests of the 3D scene rendering engine and semantic queries of the knowledge graph service through dynamic apis, achieving the integration of geometric space and business knowledge. The visualization interaction module of the application layer maintains interaction with the lower layer through an event-driven mechanism: The user’s operation on the 3D model triggers data retrieval instructions, which are traced back to the relevant information in the knowledge graph through the association engine, and finally presented in the form of multi-view interaction.
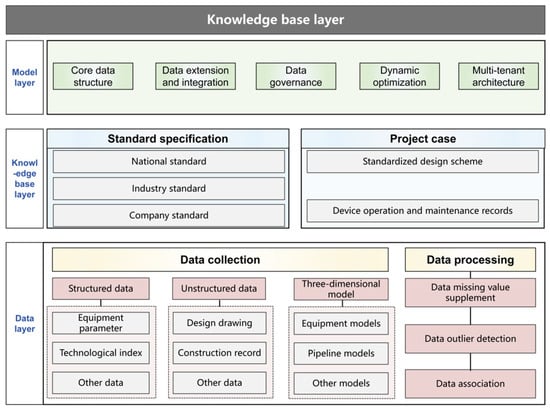
Figure 2.
Architecture of digital delivery system.
3. Key Technologies of Digital Platform Construction
The construction of a digital delivery platform relies on three core technology modules: data processing technology, data model construction technology and two/three-dimensional scene linkage technology, forming a full link technical support from data collection to intelligent decision-making. The data processing technology fixes the missing time sequence values of equipment operating parameters by linear interpolation method, and combines local outlier factor algorithm to accurately identify local outliers in non-uniformly distributed data. At the same time, aiming at the low correlation accuracy of high-dimensional engineering data, The StarFish Optimization Algorithm (SFOA) and k-means algorithm were used to jointly optimize, and the feature association of structured data was deeply mined to provide a high-reliability data foundation for the platform construction. The data model construction technology realizes the standardized storage of equipment attributes, process parameters and engineering events through five basic tables such as object naming table and location information table, and relies on multi-tenant architecture to support the independent management of multi-regional projects and cross-regional data sharing, to improve resource allocation and collaborative efficiency. The two/three-dimensional scene linkage technology deeply integrates knowledge graph and digital twin technology to build an entity-relationship network. Users can click on equipment parts to access historical operation and maintenance records in real-time to improve operation and maintenance efficiency. The three technologies jointly build a “data-model-scene” trinity of technical ecology, through the data collection, knowledge mining and intelligent decision-making of the whole life cycle closed loop, to ensure high-quality data input, standardized storage and management, as well as the seamless transformation of data to intelligent scenes.
3.1. Data Processing Technology
3.1.1. Data Missing Value Supplement Technology
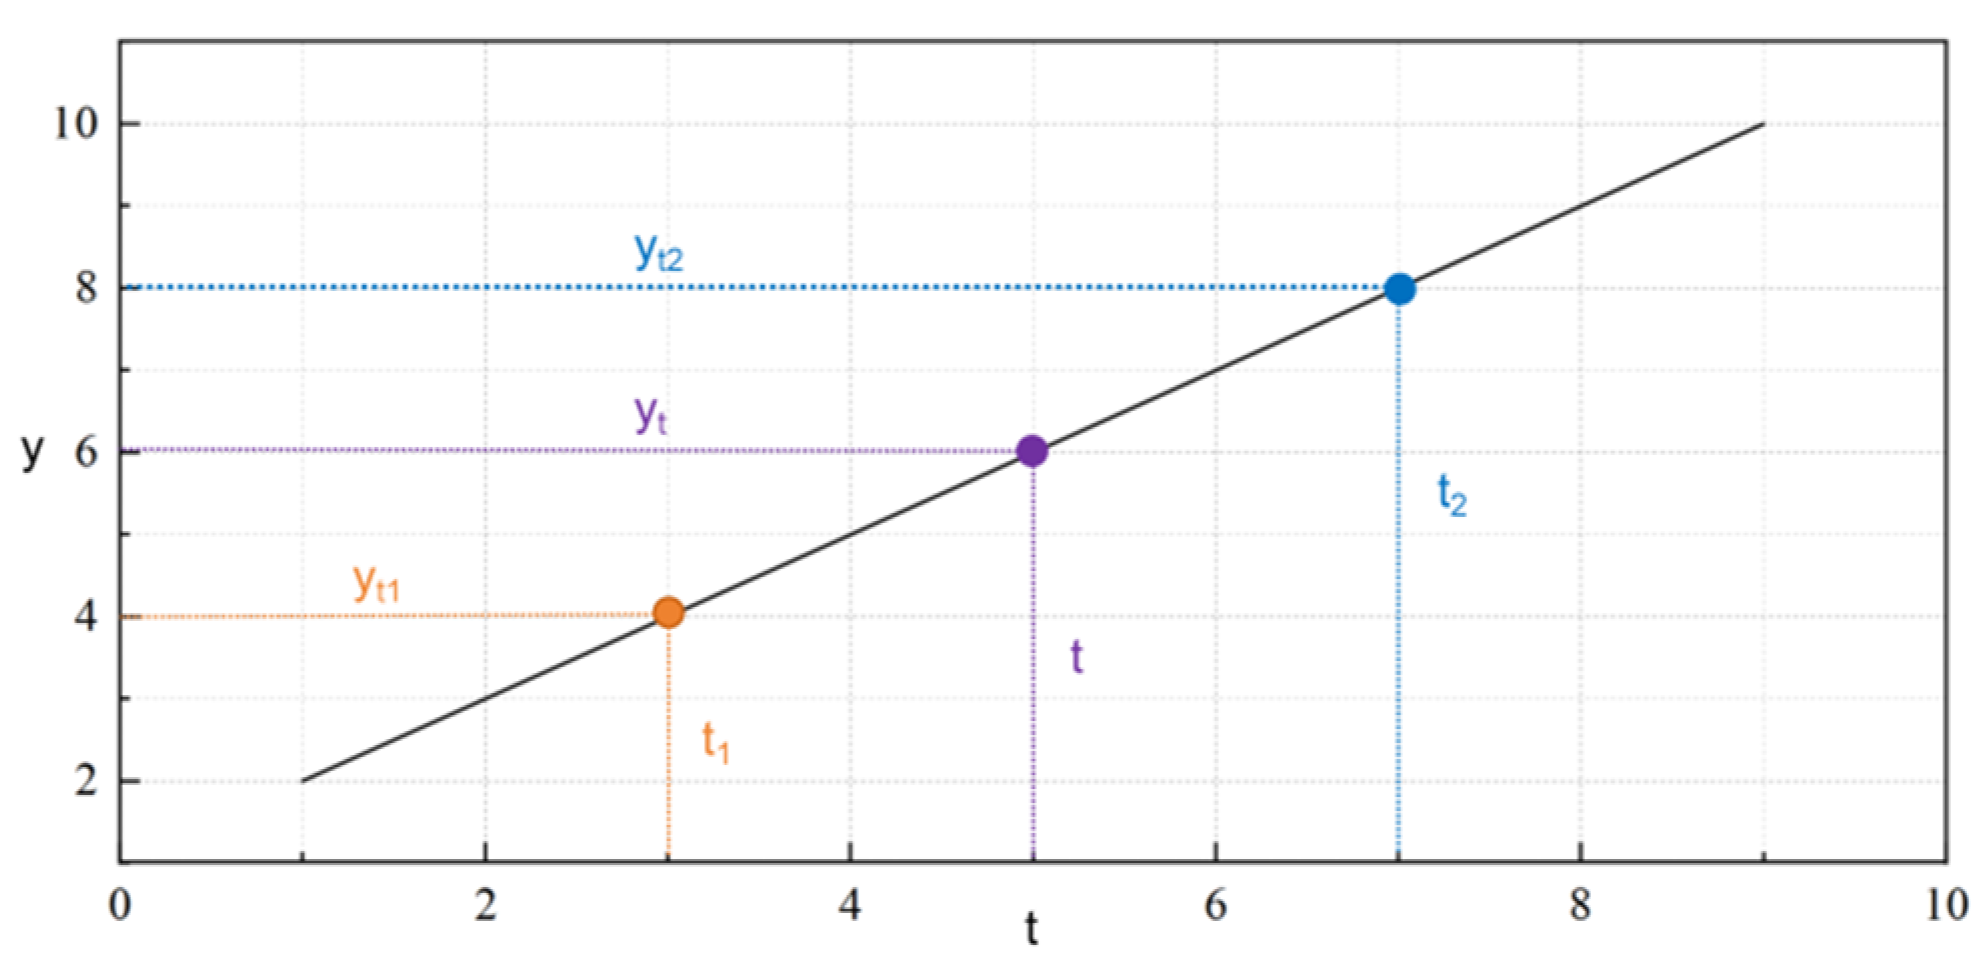
Due to the significant sequential continuity and high sampling frequency of oil and gas field surface engineering data, when discrete data is missing due to equipment failure or transmission interruption, the linear interpolation method can build a linear relationship model based on adjacent effective data points, and fill in the missing values by calculating the time-weighted average value, to ensure the integrity and continuity of data series. The linear interpolation method fills in the missing values based on the linear relationship of adjacent effective data points, as shown in Figure 3. The method first locates the missing point t by time stamp, and extracts its adjacent effective time point t1 and the corresponding value y2 at time y1 and t2 in the value formula. The missing value calculation formula is shown in Equation (1).
where, is the missing value at time t; is the value at time ; is the value at a time .
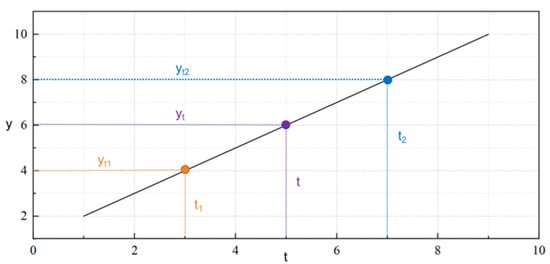
Figure 3.
Linear interpolation method.
3.1.2. Data Outlier Detection Technology
Due to the linear assumption of data change trend, the application of the linear interpolation method is limited under severe fluctuation conditions, and it is necessary to combine anomaly detection technology to optimize the interpolation strategy. Traditional methods (such as Z-score or boxplot) rely on the global statistical distribution assumption, which makes it difficult to capture the local anomaly characteristics of complex engineering data. In this paper, the local outlier factor algorithm [18] is adopted, and the calculation steps are shown below. LOF identifies anomalies by progressively analyzing the local density differences of data points. Firstly, the algorithm determines the K-proximity distance of each data point based on the preset neighborhood range parameters to define the local analysis boundary. Subsequently, the spatial relationship between data points and their neighbors is adjusted by calculating the reachable distance to avoid misjudgments caused by uneven distribution. The reachable distance takes the larger value of the original distance and the K-neighborhood distance of the neighbor itself, so that the points in the sparse area will not be mistakenly classified as anomalies in the dense area. Next, the algorithm calculates the local reachability density and quantifies the neighborhood density in the reciprocal of the reachability distance. Finally, anomalies are determined by comparing the density ratio of the data point to its neighbors: If the density ratio is significantly greater than 1, it indicates that the density of this point is much lower than that of the neighborhood, and it is judged as an anomaly. The algorithm quantifies the anomaly degree of data points through density deviation. Compared with traditional methods, the local outlier factor algorithm can effectively identify local density anomaly points and makes no prior assumptions about the data distribution. It is suitable for handling complex data sets with non-uniform distribution and multi-cluster structure that are common in oil and gas field engineering.
The algorithm first determines the KTH nearest neighbor distance of the data point, which is used to quantify the local neighborhood range of the data point. The k-proximity distance calculation formula is shown in Equation (2).
where p is the data point to be analyzed. o is the k-th nearest neighbor point of p. dk (p) is the distance between the k-nearest point and point p among the points nearest to point p. d (p, o) is the Euclidean distance between p and o.
Adjust the distance between data points and neighboring points by Equation (3) to eliminate the interference of uneven data distribution on anomaly determination.
where rdk(p,o) is the reachable distance of p relative to o, and dk(o) is the nearest neighbor distance of o.
To reflect the degree of local data aggregation, the algorithm defines density as the reciprocal of “reachability” to calculate the reachability density for each data point week, as shown in Equation (4).
where, lrdk(p) is the locally accessible density of p, and Nk(p) is the nearest neighbor distance of p.
Finally, the algorithm determines the anomaly by comparing the density difference between the data point and its neighbors, and the calculation formula is shown in Equation (5). When LOFk(p) ≈ 1 indicates that the density of the data point is consistent with that of the surrounding points, the data is normal; LOFk(p) >> 1 indicates that the data points are significantly sparse relative to the neighborhood, and the data is abnormal.
where, LOFk(p) is the anomaly degree score of p, and lrdk(o) is the local reachable density of o.
3.1.3. Data Association Technology
In the digital delivery of gas field surface engineering, data types are diverse, while traditional solutions (such as rule matching or cosine similarity) can only deal with the shallow features of data, restricting the value mining of data assets. To this end, StarFish Optimization Algorithm (SFOA), as a new meta-heuristic algorithm, simulates the exploration, predation and regeneration behavior of starfish and adopts a hybrid search mechanism combining five and one-dimensional search modes to significantly improve the computational efficiency [19]. At the same time, k-means algorithm, with its simple, efficient and easy-to-implement characteristics, is suitable for processing large-scale data sets. The fusion of the two forms the SFOA-kmeans hybrid model. Aiming at the low association accuracy of high-dimensional engineering data, it not only solves the problem that k-means is sensitive to initial values and easily falls into local optimality, but also improves the association accuracy of high-dimensional and non-linear data, and enhances the adaptability and practicability of the algorithm in complex engineering scenarios. In the initialization stage, randomly generate the individual of sea stars as the potential cluster center, and cover the solution space to increase diversity; In the global exploration stage, simulate the random disturbance of the sea star and the interactive behavior of the group, evaluate the individual quality through the fitness function, and screen the high-quality candidate centers; In the local development stage, K-means iteration is carried out around highly adaptive individuals, the clustering boundary is gradually refined, and the center position is updated to minimize the objective function; Terminate the decision stage, stop the optimization according to the preset iteration number or convergence threshold, and output the global optimal clustering result.
- Similarity calculation and initial clustering
According to the imported data, the algorithm divides the training set and the verification set according to the preset proportion and constructs the structured feature matrix and the unstructured semantic vector library. Then, the cosine Angle is used to characterize the similarity between the text data vector and the classification dimension, and the distance between the data vector and the initial clustering center of each initial starfish population is calculated. Then, according to the principle of maximum similarity, the vectorized standard text data vector is allocated to k class clusters, and all the standard text data vectors in the training set are allocated to generate k class clusters. And so on, the standard text data vectors of the next starfish individual are allocated until the calculation of all starfish individuals is completed, and Y types of delivery data clustering results are obtained. The cosine Angle calculation formula is shown in Equation (6).
where, k is the number of clusters; is the cluster center of the cluster; is the optimal starfish individual of the class cluster.
- 2.
- Exploration phase
The exploration stage is a global search, by randomly selecting individual positions and introducing random perturbations, the solution space is widely explored to avoid falling into the local optimal. The individual renewal formula in the exploration stage is shown in Equations (7) and (8).
where, T is the number of iterations; is the position of the starfish when iterating T times; is the starfish energy; is the position where the starfish iterates T−1 times; and are the p-dimensional positions of 2 randomly selected starfish; and are 2 random numbers between (−1, 1).
- 3.
- Development phase
The development phase is used for local search, fine-tuning around the current optimal solution to improve the accuracy and convergence speed of the solution. The individual update formula for the development phase is shown in Equation (9).
where, and is 2 random numbers between (0,1); is the distance obtained between the five globally optimal starfish and other starfish; and are random positions in .
- 4.
- Termination condition
Judge whether the improved SFOA-Kmeans algorithm reaches the preset maximum number of iterations, if so, output the fitness value and location of the global optimal individual starfish, and output the corresponding classification results according to the clustering center; If not, the cosine formula is repeatedly executed until the maximum number of iterations is reached.
The test set is used to evaluate the classification model after training. The evaluation index is classification accuracy, and the calculation formula is shown in Equation (10). When the classification accuracy of the model is greater than 90%, the model is considered to perform well, the training is stopped, and the model is applied to the data association module.
where, is the accuracy rate of model classification; is the standard quantity that the classification result is consistent with the reality, and is the standard quantity that the classification result is inconsistent with the reality.
- 5.
- Model verification
Conduct association validity verification based on the verification set, embed the optimized clustering model into the data association engine, and realize intelligent association mapping of new input data. This study adopted a certain wellhead high-frequency monitoring dataset, which contained more than 20,000 sets of pressure-temperature time series samples. As shown in Figure 4, different colors is the different clusters, and the cross is the cluster center. The data had the characteristics of high time series density, strong coupling, measurement noise and nonlinearity. In terms of algorithm parameter Settings, in order to correspond to the typical working conditions at the wellhead, the number of clusters is determined to be 4 clusters. For the stopping criterion, the maximum number of iterations in the starfish stage is set at 100 times, and the step size attenuation rate is 0.98. In the K-means stage, the maximum number of iterations is set at 100 times as the stopping condition. In terms of error control, the initial step size is set to 0.3 during global search, and the intensity coefficient of local disturbance is 0.2. The execution results of the algorithm show that after processing by SFOA-kmeans, the obtained clustering results are shown in Figure 4. The center of mass coordinates of each cluster present an obvious separation state, and the pressure range is between 10 and 17 MPa. The temperature range is between 13 and 38 °C.
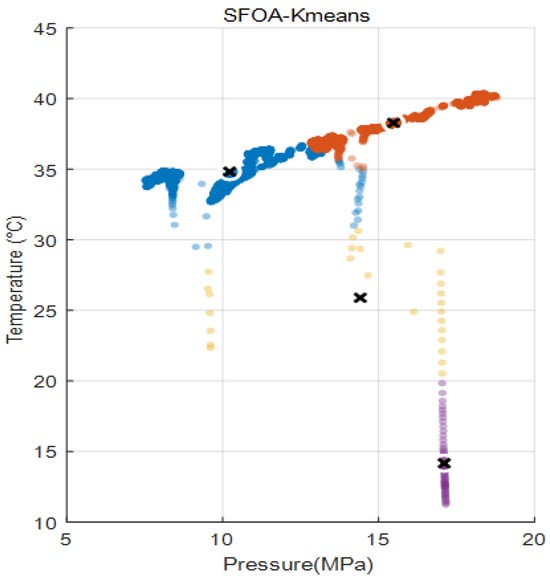
Figure 4.
Clustering results.
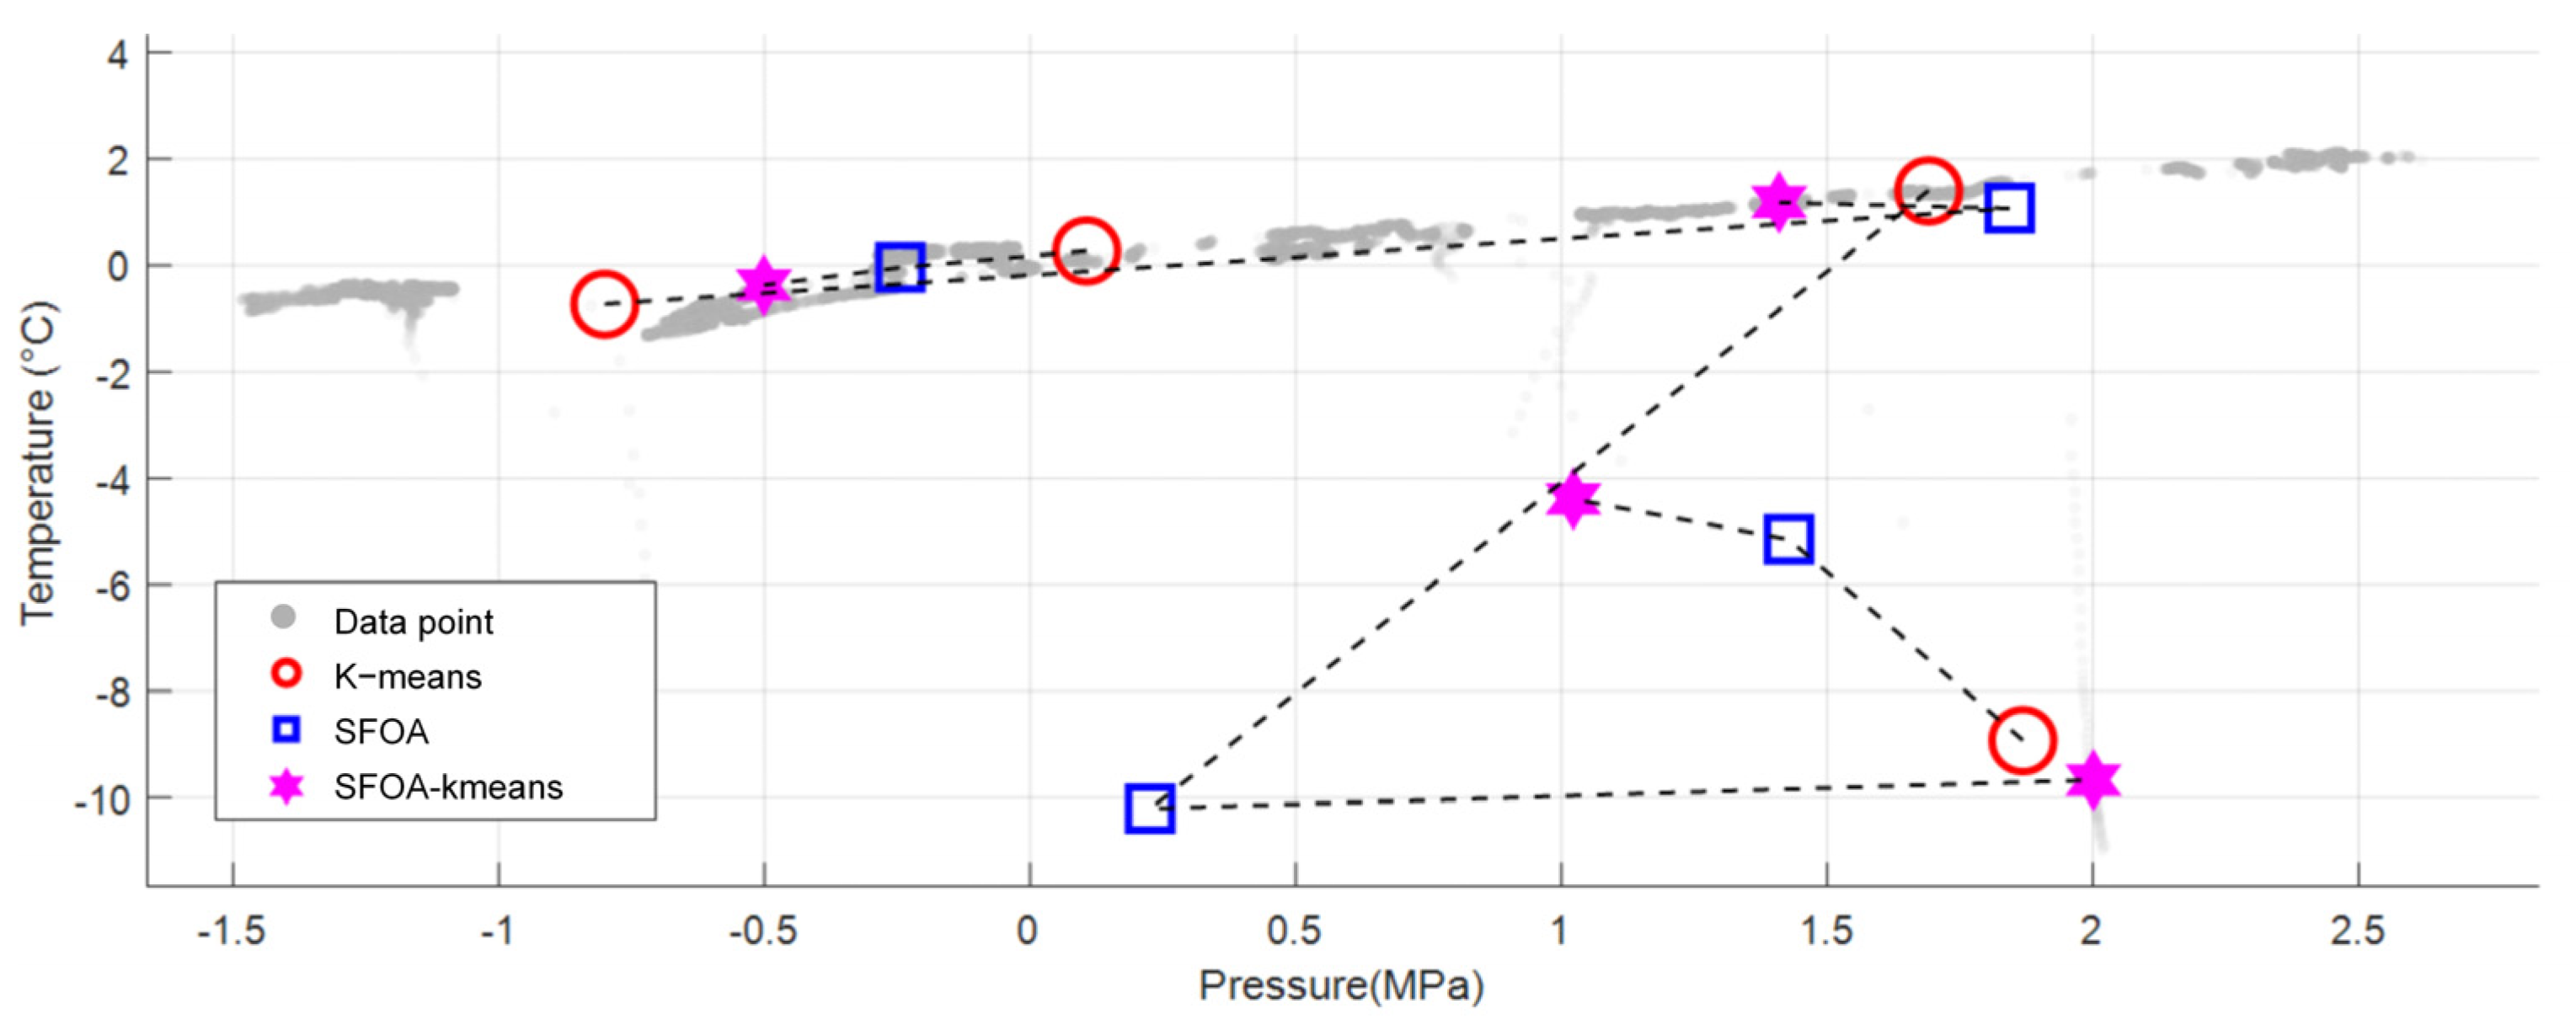
As shown in Figure 5, the shaded areas in the figure represent the original data points. From the perspective of the centroid evolution path, K-means is prone to fall into local optimum when facing strong data coupling and noise, and the path presents an oscillating broken line. SFOA conducts global exploration through swarm intelligence, has strong noise resistance and smooth paths, but its convergence speed is relatively slow. The SFOA-Kmeans hybrid strategy integrates the core advantages of both. In the early stage, the wide-area search of SFOA is used to avoid local optima and buffer noise interference. In the later stage, the K-means fast convergence mechanism is switched, and its iterative path presents an “L-shaped turning point” that is slow at first and then steep, significantly improving the efficiency.
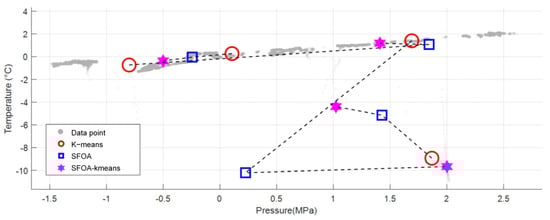
Figure 5.
Centroid evolution paths of different algorithms.
From the perspective of algorithm running time, as shown in Table 1, the K-means algorithm has the longest running time and falls into the local optimal solution, the SFOA algorithm has the middle running time, and the SFOA-Kmeans algorithm only takes 0.11 s to run, fully proving its efficiency when dealing with large industrial datasets.

Table 1.
Comparison of the operation of different algorithms.
3.2. Data Model Construction Technology
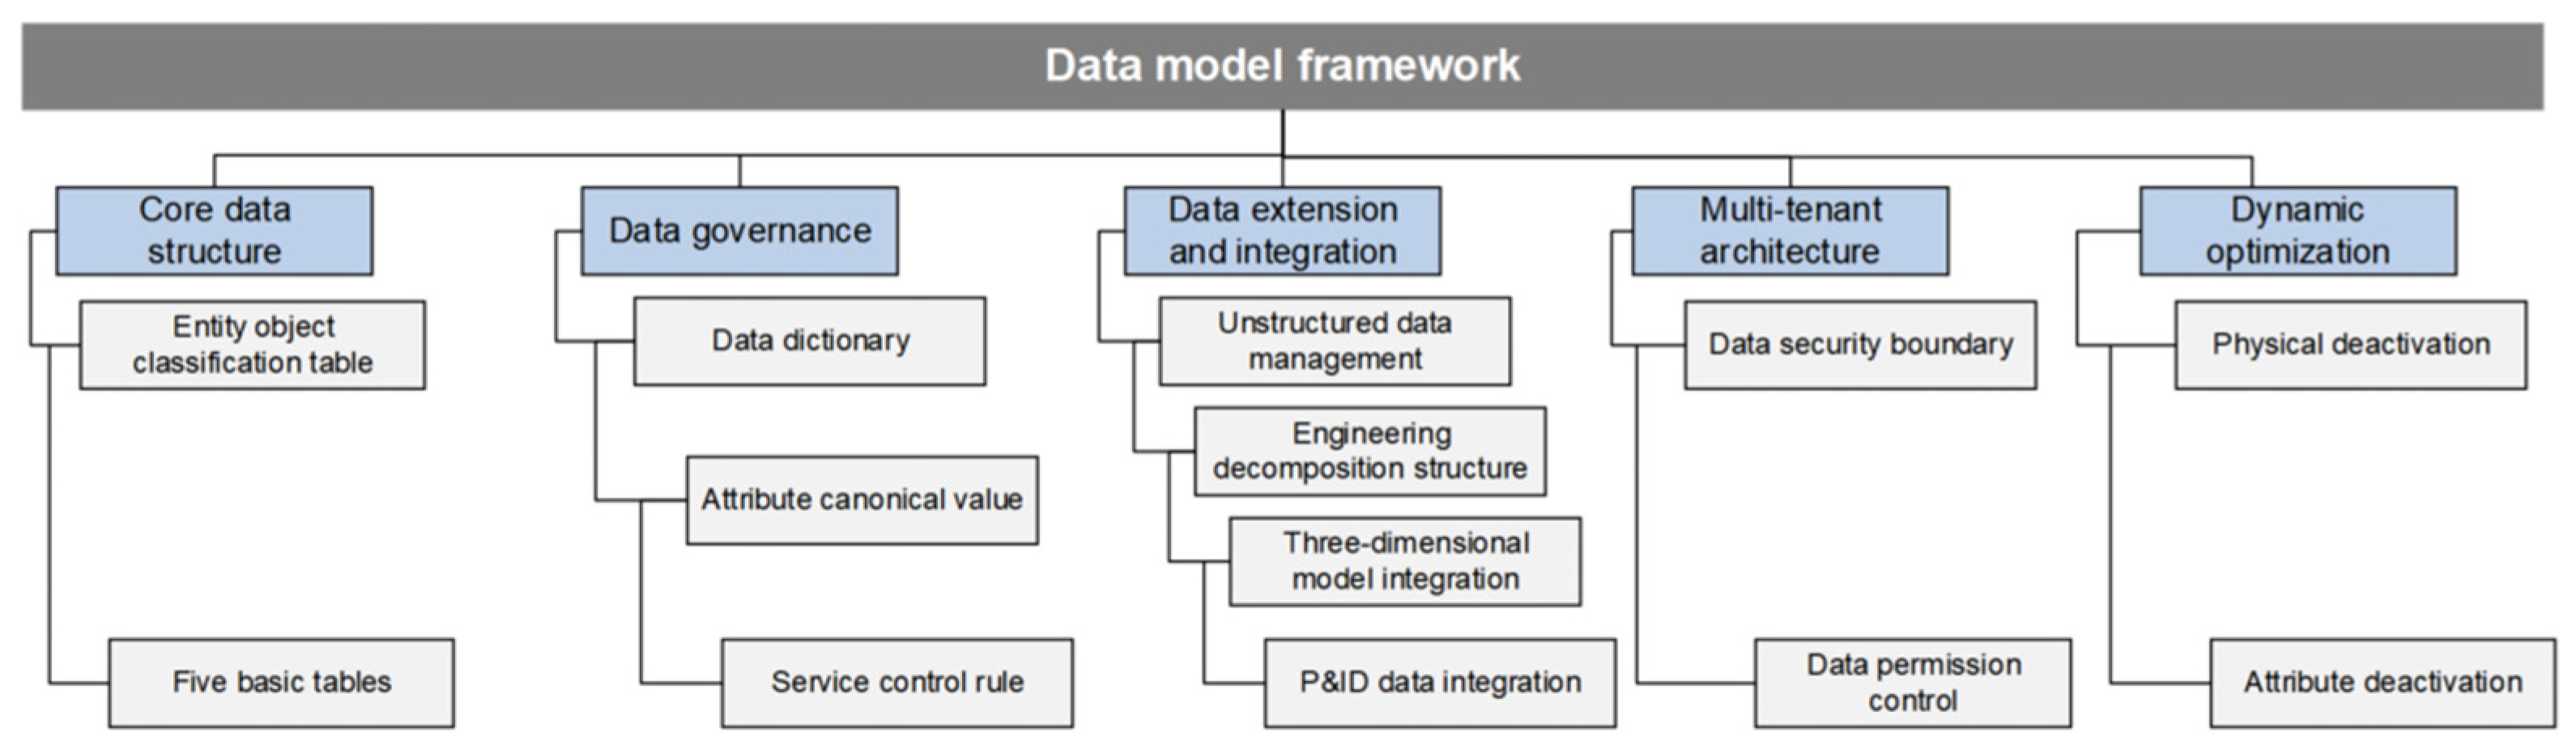
As the scale and complexity of oil and gas field projects increase, traditional data management methods are difficult to meet the needs. The digital delivery data model provides a unified digital foundation for engineering design, construction, operation and maintenance by solving the problem of data silos, ensuring data accuracy, consistency and traceability. The digital delivery data model takes the entity-relationship theory as the cornerstone, systematically designs around the entity object, defines and organizes the physical entity and logical entity through the metadata framework, and builds a multi-dimensional heterogeneous and highly structured data system, as shown in Figure 6.

Figure 6.
Digital delivery data model.
3.2.1. Core Data Structure
The data model relies on five types of basic tables (object naming table, location information table, basic parameter table, activity record table, and event record table) to realize the storage of entity attributes.
3.2.2. Data Governance
The data model adopts a three-tier progressive governance architecture to ensure standardization and high quality throughout the data life cycle. The first layer standardizes the definition of metadata through a data dictionary to realize the unification of field semantics and data types; The second layer ensures the standardization and consistency of data input through the preset rules of attribute specification values and the structured verification mechanism; The third layer implements logical verification through business quality control rules to build a data quality closed-loop management system.
3.2.3. Data Expansion and Integration
The data model realizes dynamic expansion and integration of data through unstructured data management, engineering decomposition structure, three-dimensional model integration and P&ID data control. Unstructured data management supports the dynamic expansion and cross-system integration of file classification, ensuring the integrity and availability of files such as documents and drawings. The engineering decomposition structure supports the organization and expansion of complex projects through hierarchical design and dynamic configuration, providing a clear structural framework for the project. Three-dimensional model integration realizes the bidirectional binding of model and solid object, enhances the visualization ability of data, and enables users to view and operate related data intuitively. P&ID data control improves design efficiency and data consistency by associating drawings with physical objects, ensuring a seamless connection between drawings and data.
3.2.4. Multi-Tenant Architecture
Aiming at the complex requirements of concurrent management of multiple projects, the model adopts multi-tenant architecture to achieve logical isolation of project data and refined permission control. Through the tenant identification and permission management mechanism, the data independence and security between different projects are ensured, and cross-project collaborative management and data sharing are supported to meet the requirements of multi-task parallelism and resource optimization in large-scale engineering environments.
3.2.5. Dynamic Optimization Mechanism
The data model introduces a dynamic deactivation mechanism, optimizes the architecture design through logical markup, and supports the progressive iterative update of entities and attributes without damaging the integrity of data. The mechanism realizes the dynamic management of entity objects and their attributes through the entity object deactivation table and entity object attribute deactivation table. Users can disable unnecessary entity object classifications or attributes on demand, making them hidden from the user interface to optimize the operating experience while retaining background data for future recovery.
3.3. Two/Three-Dimensional Scene Linkage Technology
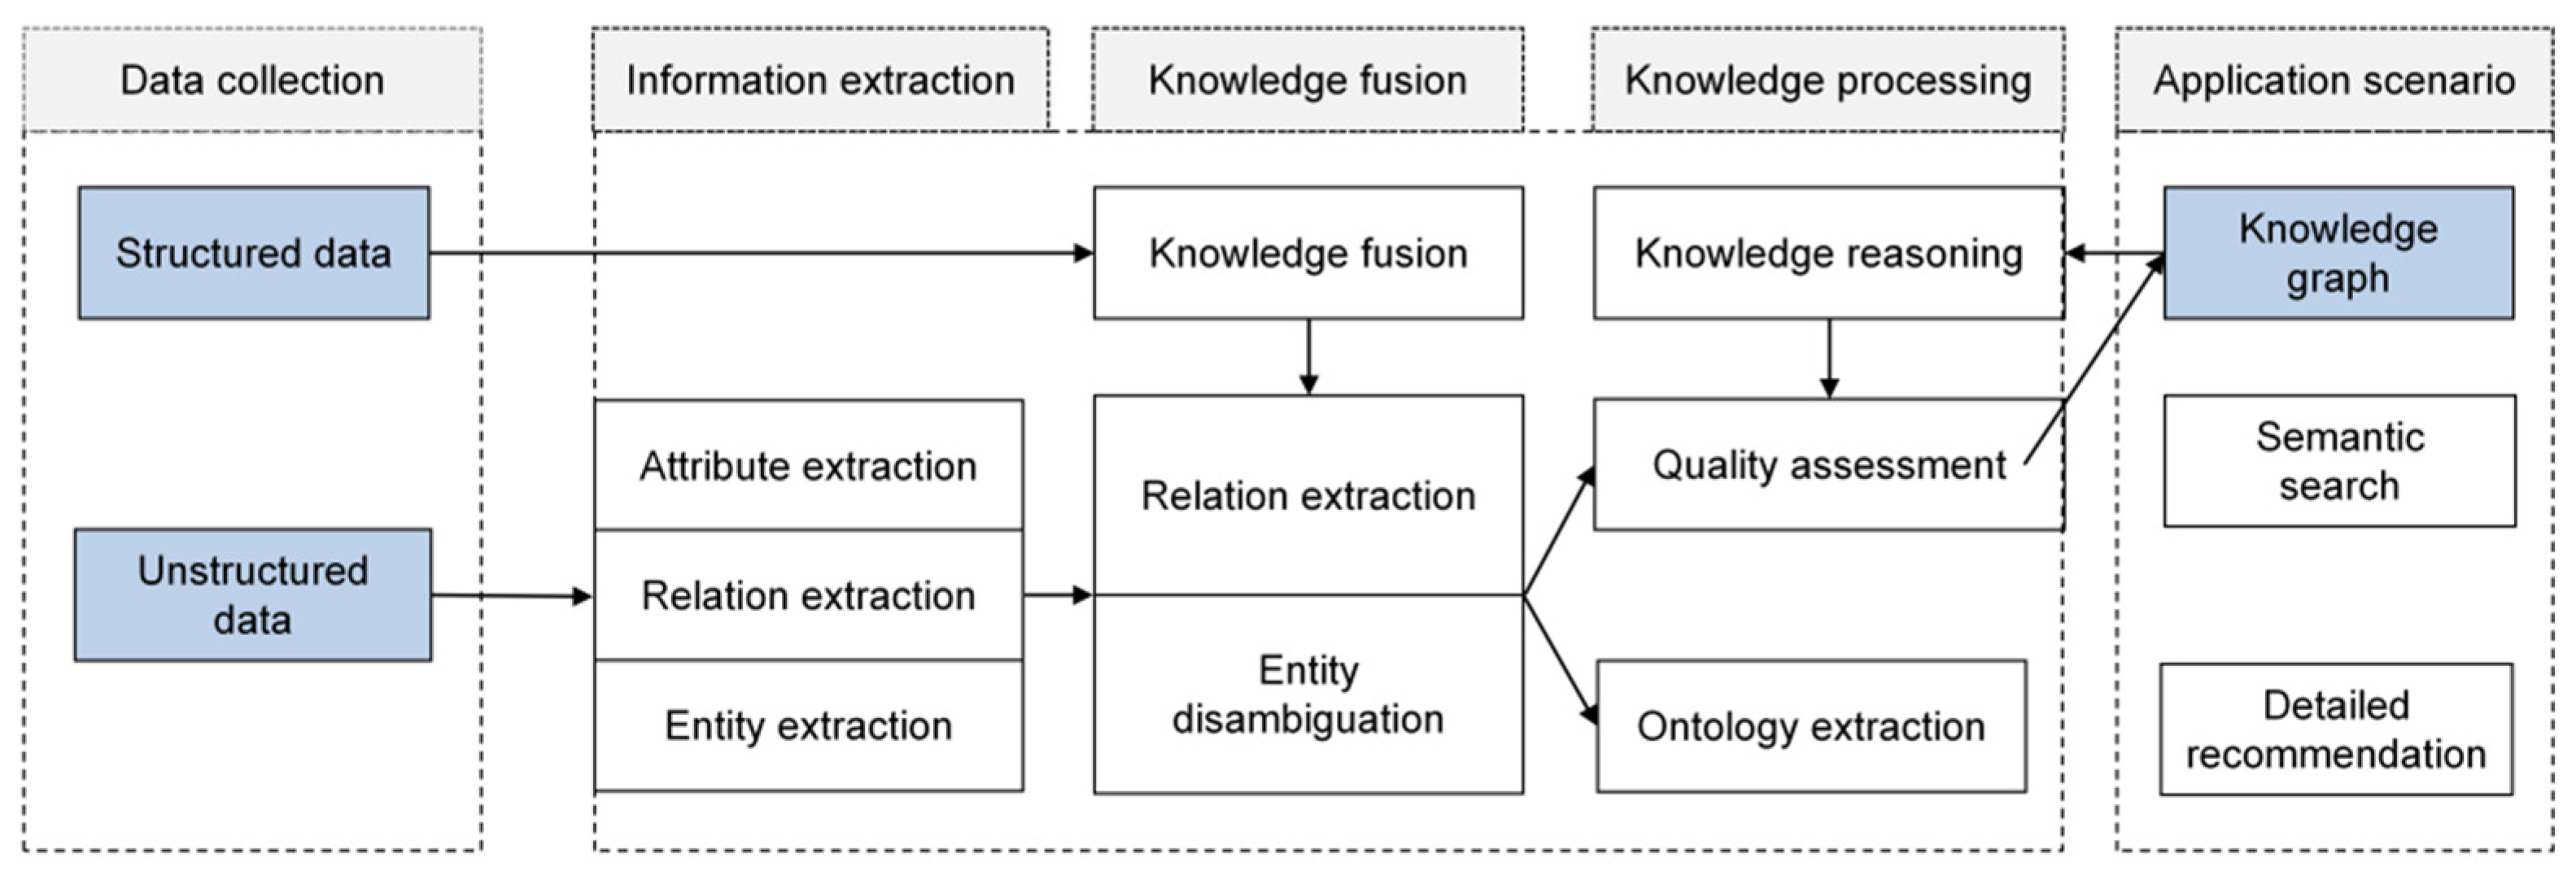
The knowledge graph is a semantic network that describes concepts, entities, and their relationships in the objective world in a structured form. It simulates the association pattern between things through nodes (entities) and edges (relationships). When adding new entities or relationships, it can be realized by adding nodes and connecting edges, and supports the alignment of entities across the graph to build complex association networks. The construction process of the knowledge graph consists of four core steps, as shown in Figure 7. The data collection stage integrates multi-source heterogeneous data, including structured databases and unstructured documents, to provide the original material for the knowledge system; The information extraction stage extracts entities, attributes and relationships based on natural language processing technology to form a preliminary knowledge unit; In the knowledge fusion stage, redundancy and ambiguity are eliminated by reference resolution and entity disambiguation, and fragmented knowledge is integrated into a coherent semantic network. In the knowledge processing stage, ontology construction is used to define the domain concept level, and logical reasoning and quality assessment are combined to form a structured and extensible knowledge base.
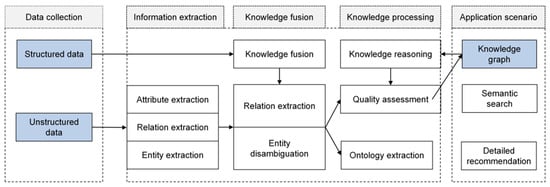
Figure 7.
Knowledge graph technology.
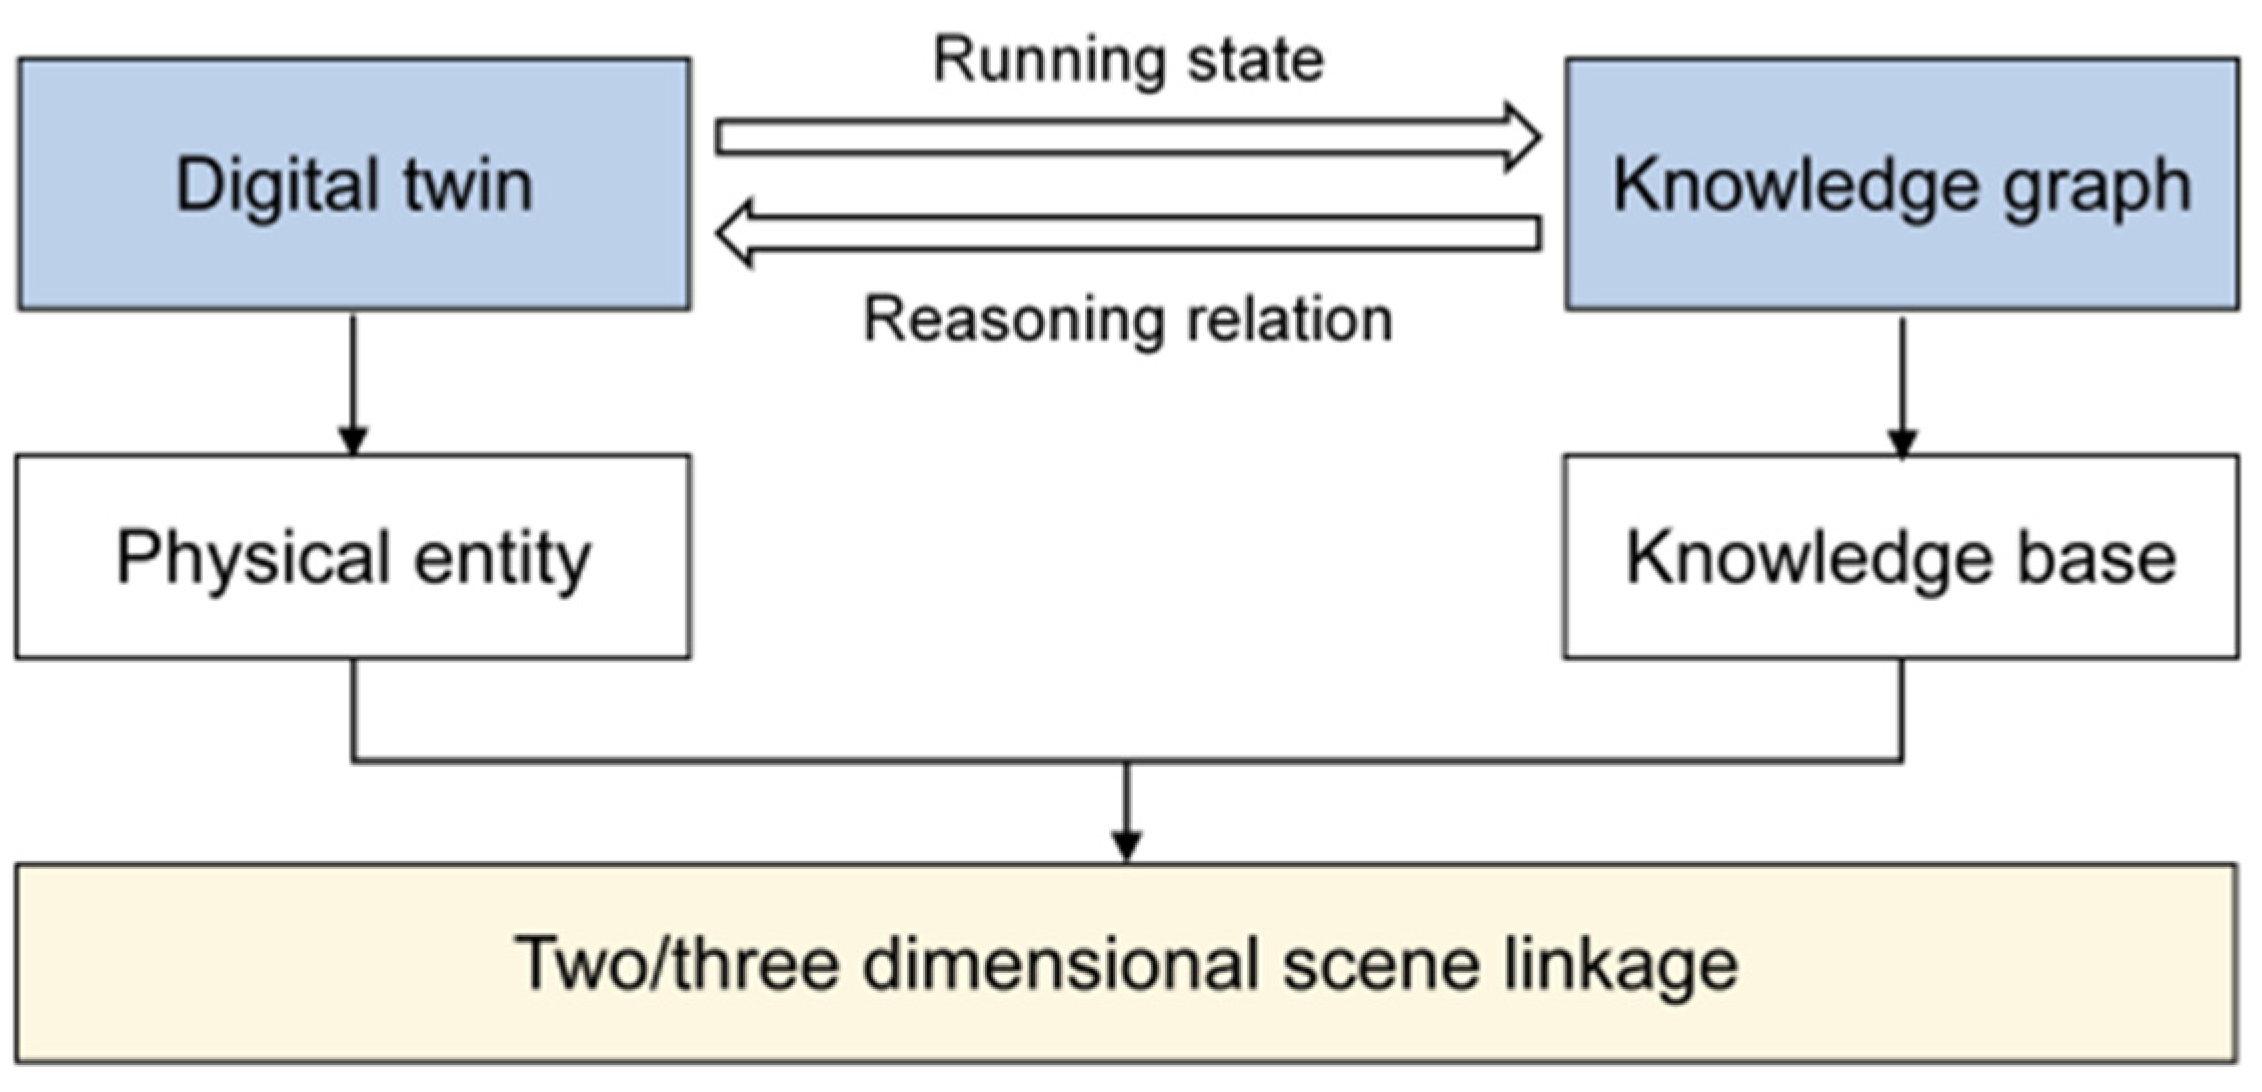
Knowledge graph technology focuses on the integration of structured knowledge, while digital twin technology realizes virtual-real interaction by constructing virtual models of physical entities, and the two form complementary solutions to realize the linkage of two/three-dimensional scenes in the digital delivery of oil and gas field surface engineering, as shown in Figure 8. In view of the lack of decentralized display and interaction of multi-modal data in ground engineering, digital twin technology relies on three-dimensional point cloud data and equipment parameter table to generate high-precision dynamic models, and supports users to access parameters in real time by clicking on model components. The knowledge graph is based on a semantic analysis engine to analyze technical documents and construction records, build an entity relationship network, and realize the detailed information [20] of associated documents can be traced by clicking nodes. By deeply integrating the three-dimensional dynamic model with the knowledge base, the digital system can not only solve the problem of data silos but also realize the unified display and interactive exploration of multi-dimensional data such as drawings, texts and three-dimensional space.
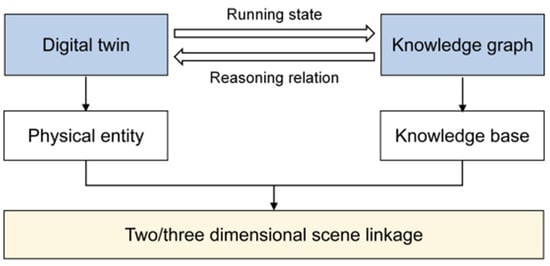
Figure 8.
Linkage technology of knowledge graph and digital twin.
4. Platform Development
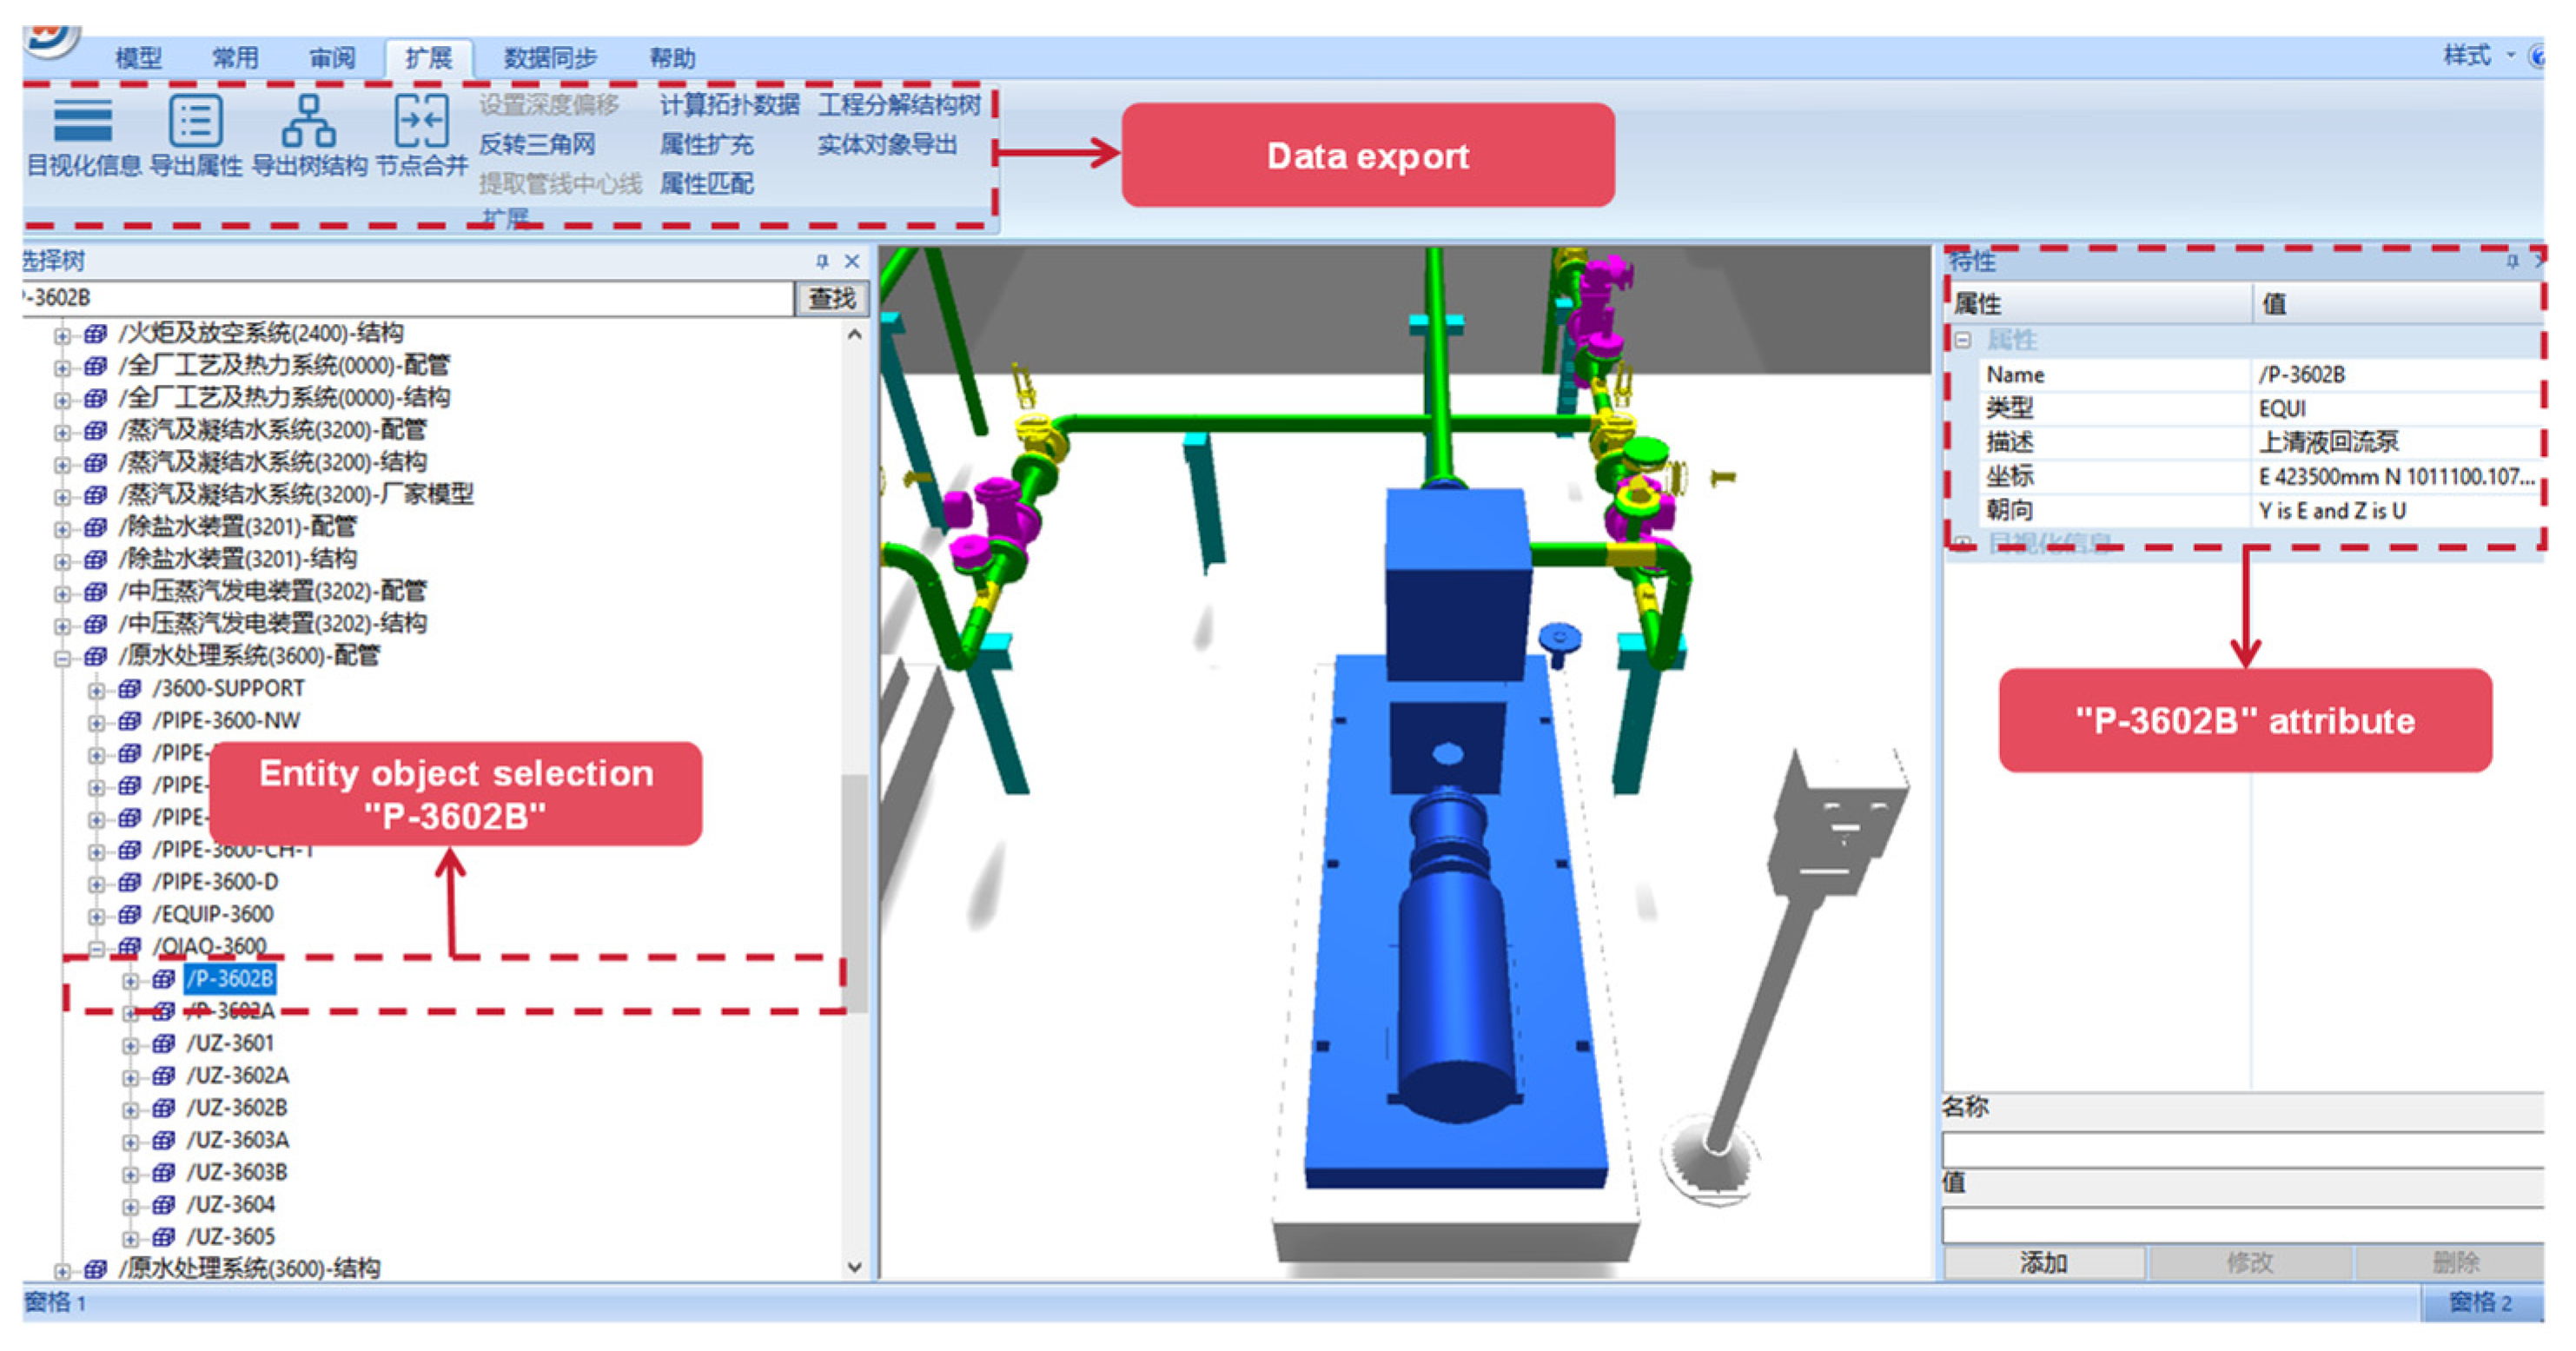
Based on the digital system framework and the application of data processing technology, data model construction technology and two- and three-dimensional scene linkage mechanism, this paper builds a digital delivery platform for oil and gas field surface engineering covering multi-source heterogeneous data integration, intelligent analysis and visual expression, as shown in Figure 9. The platform assigns a unique entity object bit number to each engineering entity. Through the bit number, the 3D model is bound to structured data, unstructured files, and PID. In the specific implementation, first of all, the original 3D model provided by the design unit is preprocessed through tools, and redundant nodes are merged to ensure that each solid object corresponds to only a single model. Subsequently, the system associates the model nodes with the entity bit numbers in the database through the matching algorithm. After the matching is completed, structured data and unstructured files are automatically injected into the model through bit numbers, forming an interactive digital twin. Take retrieving the data of the centrifugal pump with the position number “P-3602B” as an example. Under the traditional data management mode of gas field surface engineering, retrieving the complete engineering information of specific equipment requires crossing multiple fragmented systems. Engineers first need to locate the equipment symbols in hundreds of pages of PID drawings, then sift through the basic parameter tables in the electronic ledgers, and finally go to the archives to review the test reports. The entire process is time-consuming and there is a risk of version mismatch. The digital delivery system based on the 3D model has completely restructured this workflow. When the user clicks on the P-3602B pump model in the 3D scene, “P-3602B” first parses the key attributes such as the oilfield code and the station code through rules, and establishes an accurate mapping with the meta-database. Meanwhile, the model is mounted with structured data such as rotational speed and head, and associated with unstructured data such as design drawings and test reports. When the user clicks on the pump body model, the system triggers the association engine to aggregate equipment parameters, historical detection documents and associated pipeline topologies within seconds, transforming the traditional discrete data silos into an organic knowledge network indexed by spatial coordinates, as shown in Figure 10.
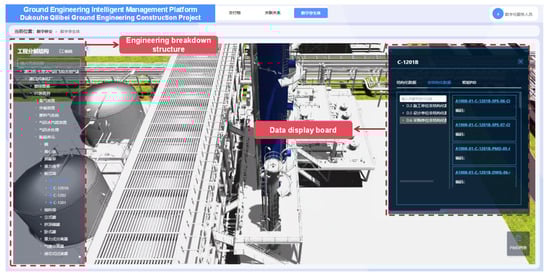
Figure 9.
Digital delivery platform for oil and gas field surface engineering.

Figure 10.
Operation example of digital delivery platform for oil and gas field surface engineering.
This study, based on the actual engineering verification of the Dukou River project, shows that the improved platform has increased the association accuracy rate to 98.7% (only 121 items of 9402 devices need to be rechecked), which is 36.3% higher than the traditional method. The response time for design changes was shortened from 5 days to 4.3 h, and the consistency of material codes reached 99.8%. In terms of system performance, the platform supports real-time data-driven operation of over 8000 measurement points, and the accuracy rate of the linkage between 3D models and monitoring data is 99.2%. All indicators were confirmed through total station sampling measurement and third-party audit by the owner, confirming the effectiveness of this digital delivery solution in the actual engineering practice.
5. Conclusions
- (1)
- The digital delivery platform for oil and gas field surface engineering constructed in this study provides the industry with reusable intelligent management tools. Based on the verification of the Dukou River project, this platform has effectively broken through the limitations of the traditional model: it has solved the problem of data fragmentation in links such as design, procurement and construction; Through unified coding, the “one account” management of material information and the accuracy rate of procurement have been achieved at 100%, the automatic reading rate of process design and delivery data has reached 80%, and human resources have been reduced by 30%.
- (2)
- The digital delivery platform for gas field surface engineering constructed in this study effectively solves the problems of integration and standardized management of multi-source heterogeneous data, laying a data foundation for intelligent applications. The platform architecture adopts a hierarchical and decoupled design. While ensuring the standardization of data governance, it supports the provision of data resources in the form of API interfaces, achieving the management of data layer sharing and publishing interfaces. At the same time, it can meet the demands of the system and other systems for ground engineering data by setting a whitelist and applying for interface approval. For real-time risk prediction, the platform supports the deep coupling of dynamic operational data streams and prediction models. In terms of resource optimization, by integrating static engineering parameters with dynamic production data, it supports the construction of an optimization decision-making model driven by data, reserving expansion space for the implementation of cutting-edge technologies in smart gas fields and promoting a substantive leap from data management to knowledge services in gas field surface engineering.
Author Contributions
Conceptualization, W.Z. and Z.D.; methodology, W.Z. and T.X.; software, W.Z., Y.Z. and T.X.; validation, Z.D., G.C. and Y.Z.; formal analysis, T.X.; investigation, G.C.; resources, Y.Z.; data curation, Z.D.; writing—original draft preparation, W.Z.; writing—review and editing, C.L. and J.Z.; visualization, T.X.; supervision, J.Z.; project administration, W.Z.; funding acquisition, J.Z. All authors have read and agreed to the published version of the manuscript.
Funding
This research was funded by [The National Natural Science Foundation of China] grant number [51704253]. And The APC was funded by [The National Natural Science Foundation of China].
Data Availability Statement
All data, models, and code generated or used during the study appear in the submitted article.
Conflicts of Interest
Authors Wei Zhang, Zhixiang Dai, Taiwu Xia, Gangping Chen and Yihua Zhang were employed by the company PetroChina Southwest Oil and Gas Field Company. The remaining authors declare that the research was conducted in the absence of any commercial or financial relationships that could be construed as a potential conflict of interest.
References
- Zhang, K.; Zhao, X.G.; Zhang, L.M.; Zhang, H.Q.; Wang, H.C.; Chen, G.D.; Zhao, M.J.; Jiang, Y.Q. Research status and prospect of big Data and intelligent optimization theory and method in intelligent oilfield development. J. China Univ. Pet. Nat. Sci. Ed. 2020, 44, 11. [Google Scholar]
- Wang, X.Z.; Dang, H.L.; Zhang, L.; Wang, T.C.; Ding, J.Y. Digital and intelligent oil and gas exploration and development integrated with three-dimensional geographic information—Practice and prospect of yanchang petroleum. Drill. Prod. Technol. 2025, 48, 121–129. [Google Scholar]
- Hu, J.G.; Ma, J.J.; Li, Q.S. Achievements and practice in construction of digital intelligent in changqing oil and gas field. Pet. Sci. Technol. Forum 2023, 42, 30–40. [Google Scholar]
- Cao, W.Y. Optimizing daqing oilfield surface engineering digital construction scheme. Pet. Plan. Des. 2021, 32, 62–65. [Google Scholar]
- Tao, J.F.; Zeng, Y.Z.; Huabing, L. Application of digital delivery technology in oil depot engineering construction. Chem. Ind. Manag. 2024, 9, 75–77. [Google Scholar]
- Wu, Z.Z. Construction and Application of knowledge map of Oil and gas pipeline geological disaster risk management. Oil Gas Storage Transp. 2023, 42, 241–248. [Google Scholar]
- Qing, G.; Zhang, F.L.; Zhang, E.L. Application prospect of knowledge graph technology in knowledge management of oil and gas exploration and development. In Proceedings of the 2019 2nd International Conference on Artificial Intelligence and Big Data (ICAIBD), IEEE, Chengdu, China, 25–28 May 2019. [Google Scholar]
- Tao, F.; Sui, F.; Liu, A.; Qi, Q.; Zhang, M.; Song, B.; Guo, Z.; Lu, S.C.-Y.; Nee, A.Y.C. Digital twin-driven product design framework. Int. J. Prod. Res. 2018, 57, 3935–3953. [Google Scholar] [CrossRef]
- Grieves, M.; Vickers, J. Digital Twin: Mitigating Unpredictable, Undesirable Emergent Behavior in Complex Systems; Springer International Publishing: New York, NY, USA, 2017. [Google Scholar]
- Konchenko, A.; Chatar, C.; Doronichev, S.; Saetern, D.; Bruns, J. Oilfield virtual twin. In Proceedings of the SPE Annual Technical Conference and Exhibition, Virtual, 26–29 October 2020. [Google Scholar]
- Teng, W.W.; Yu, H.S.; Shi, F.; Hao, H.J. Application research of oil and gas field surface engineering based on digital twin. Comput. Simul. 2023, 40, 74–76. [Google Scholar]
- Yu, Y.Z. Design and Research of Visualization Platform of Digital Twin Oil Field Water Injection System. MSc. Thesis, Northeast Petroleum University, Daqing, China, 2023. [Google Scholar]
- Huang, S.; Mou, J.R.; Wang, K.Y.; Yan, W.; Yang, X.X.; Zhang, J.H. Research on digital service platform based on standard knowledge map in oilfield field. Stand. Sci. 2023, 5, 71–75. [Google Scholar]
- Hu, Y.Y. Research on key technologies of digital twin Construction for intelligent Oil and Gas fields. Metall. Ser. 2020, 5, 3–4. [Google Scholar]
- Zhang, D.F.; Yao, W.T.; Dong, Z.C. Application and Exploration of “digital twin” in oil field surface oil and gas station. Surf. Eng. Oil Gas Field 2022, 41, 1–7. [Google Scholar]
- Wang, H.S.; Yu, S.L.; Liu, W.; Lu, W.L.; Lou, Y.F. Research on Digital Delivery Standard of Land Transportation Infrastructure. Railw. Stand. Des. 2019, 69, 22–28. [Google Scholar]
- GB/T 51296-2018; Digital Delivery Standard for Petrochemical Engineering. Ministry of Housing and Urban-Rural Development: Beijing, China, 2018.
- Liu, H.; Zhu, S.J.; Bi, T.S. Continuous bad data detection method of PMU based on local outlier factor. Autom. Electr. Power Syst. 2022, 46, 8. [Google Scholar]
- Zhong, C.; Li, G.; Meng, Z.; Li, H.; Yildiz, A.R.; Mirjalili, S. Starfish optimization algorithm (SFOA): A bio-inspired metaheuristic algorithm for global optimization compared with 100 optimizers. Neural Comput. Appl. 2025, 37, 3641–3683. [Google Scholar] [CrossRef]
- Huang, S.J.; Wang, Y.Y.; Yu, X. Design and implementation of oil and gas information on intelligent search engine based on knowledge graph. J. Phys. Conf. Ser. 2020, 1621, 012010. [Google Scholar] [CrossRef]


Disclaimer/Publisher’s Note: The statements, opinions and data contained in all publications are solely those of the individual author(s) and contributor(s) and not of MDPI and/or the editor(s). MDPI and/or the editor(s) disclaim responsibility for any injury to people or property resulting from any ideas, methods, instructions or products referred to in the content. |
© 2025 by the authors. Licensee MDPI, Basel, Switzerland. This article is an open access article distributed under the terms and conditions of the Creative Commons Attribution (CC BY) license (https://creativecommons.org/licenses/by/4.0/).