Article

Multi-Entity Collaboration Mechanism of Key Core Technology Innovation Based on Differential Game

1
School of Business, Shandong Normal University, Jinan 250014, China
2
School of QILU Transportation, Shandong University, Jinan 250061, China
3
School of Business Administration, South China University of Technology, Guangzhou 510641, China
*
Author to whom correspondence should be addressed.
Systems 2025, 13(6), 436; https://doi.org/10.3390/systems13060436
Submission received: 8 April 2025 / Revised: 23 May 2025 / Accepted: 28 May 2025 / Published: 4 June 2025
(This article belongs to the Section Systems Practice in Social Science)

Abstract

Key core technology innovation has become an important strategic path for countries to maintain industrial security amid intensifying global technological competition. As an important innovation paradigm, R&D collaboration is generally regarded as an effective way to achieve such innovation. However, the key issue of which collaborative mechanism is most effective at promoting key core technology innovation remains insufficiently explored. Therefore, systematically comparing the effectiveness of different mechanisms of collaborative innovation is of great strategic significance for achieving key core technology innovation and overcoming Western technological blockades. In this study, the R&D level and market share of key core technology were incorporated into an analytical framework and applied to a differential game focused on the innovation behaviors of leading enterprises, supporting enterprises, and academic research institutions under Nash non-collaborative, cost-sharing, and collaborative mechanisms. A simulation analysis was conducted using the MATLAB 2020a software. The results show that the optimal strategies for the key core technology innovation of innovation entities are negatively correlated with the cost coefficient, discount rate, technology, and market recession coefficient. Meanwhile, they are positively correlated with the sensitivity coefficient of technology R&D and market promotion. Furthermore, the R&D levels and market shares of key core technology are highest under the collaborative mechanism. In this scenario, the revenues of the innovation entity and the overall system reach Pareto optimality. Within a threshold range, the cost-sharing mechanism significantly improves innovative efforts, the R&D level, and the market share of key core technology, leading to a Pareto improvement for both the participants’ and overall system’s revenues compared to the non-collaborative mechanism. This study not only contributes to theoretical results of differential games but also provides valuable suggestions for policymakers and innovation entities to foster key core technology innovation from the perspective of collaboration.

1. Introduction

External shocks, particularly geo-technological rivalries and Sino–US tech competition, are currently accelerating the restructuring of the global innovation landscape. As a result, the focus of competition between enterprises, industries, and nations has progressively shifted from general innovation activities toward more strategic, high-value-creation domains centered on key core technology innovation [1,2,3]. Key core technology innovation serves as a pivotal strategic approach to breaking technological lock-in, enhancing the resilience of industrial chains, and safeguarding national economic sovereignty [4]. For example, in September 2020, the U.S. Department of Commerce imposed a technology blockade under the Foreign Direct Product Rule (FDPR), compelling TSMC to halt the production of advanced-process chips (7 nm and below) for Huawei. This disruption in access to key core technology not only caused an 81% year-on-year decline in HiSilicon’s semiconductor design revenue in 2021 but also significantly reduced Huawei’s global smartphone market share. This event highlights the systemic vulnerability of the semiconductor supply chain, which is susceptible to external constraints on key core technology. As a key innovation paradigm, key core technology is a complex, indispensable, and unique technology system that occupies a central position in the innovation chain, which is characterized as extensive, market-oriented, and systematic [1,4]. Key core technology catch-up and competition have extended beyond individual technology nodes [3] to encompass the overall collaboration between all functional elements within the innovation chain. As key participants in the innovation chain, leading enterprises, supporting enterprises, and academic research institutions collaboratively drive key core technology innovation through strategic leadership, collaborative manufacturing, and technical support [1,5,6,7]. Thus, multi-agent collaboration innovation strengthens the systemicity of technology research and development (R&D) and facilitates resource integration and capability complementarity [7,8,9], providing sustainable power support for key core technology innovation and overcoming the technology blockade [10,11]. However, because of the significant differences in the strategic selection, revenue distribution, and innovation needs of leading enterprises, supporting enterprises, and academic research institutions, it is difficult to establish effective collaborative mechanisms [12,13]. This seriously restricts key core technology innovation. Therefore, exploring collaboration strategies and optimal collaborative mechanisms among innovation entities, as well as identifying their influencing factors, has become a key issue to resolve in key core technology innovation.
Since the introduction of key core technology innovation, scholars have made significant contributions to understanding collaborative innovation logic in this field. Qualitative research based on multiple case comparisons and grounded theory [14,15] has revealed that existing modes of innovation collaboration exhibit characteristics such as entity synergy, governance diversification, and knowledge networking [12,16]. Quantitative research based on the resource-based view, social network, and innovation ecosystem theories [7,17] has analyzed the collaborative innovation mechanisms and boundary conditions at the enterprise, industry, and ecosystem levels [2,10]. While these theoretical perspectives provide a technical rationale for key core technology innovation, the existing literature largely assumes that such innovations can autonomously translate into market applications and provide added value [2], which ignores the value co-creation aspect of the market promotion process after the R&D of key core technology [3,13]. This implies that technology R&D alone cannot fully solve the commercialization predicament of innovative products and therefore fails to effectively support the realization of key core technology innovation [18].
According to innovation chain theory, innovation is a systematic process in which innovation entities, guided by market demand, produce R&D outputs and provide added value through collaboration [19,20]. To achieve key core technology innovation, innovation entities need to understand “how to innovate” and pay attention to “how to profit from innovation” [20,21,22,23]. Building a comprehensive chain that links technology R&D to market promotion is a crucial factor in achieving key core technology innovation [12,24] and a fundamental strategy for overcoming low-end lock-in within the industrial chain [4]. On the one hand, in the process of technology R&D, continuous market feedback significantly influences key core technology evolution and performance optimization [25]. On the other hand, the market promotion of innovative products is a prerequisite for generating economic revenue [20] which, in turn, will constitute the core driving force for continuous key core technology innovation [10,21,26]. Therefore, it is imperative to fully harness the synergy between leading enterprises, supporting enterprises, and academic research institutions to enhance technology R&D and the market promotion of key core technology [13,27,28]. This initiative provides a solid theoretical and practical framework to guide Chinese enterprises in achieving independent innovation in key core technology amidst technological blockades.
As mentioned above, existing research has mainly focused on aspects such as the collaborative modes, influencing factors, and internal mechanisms of key core technology innovation, but it lacks the necessary discussion of the behavioral coordination and interaction mechanisms between heterogeneous innovation entities [2,7,12], especially under asymmetric collaboration scenarios. Additionally, the dynamic evolution regularity of key core technology innovation (technology R&D and market promotion) has not been fully explored [1,3]. Key core technology R&D and market promotion are characterized by their complexity and long-term nature [3], which will change over time during the process of innovation [29]. Therefore, innovation entities need to adjust their collaborative decisions to meet specific needs at different stages of key core technology R&D and market promotion [19]. According to differential game theory, a differential game—as a key model for exploring multi-entity strategic interactions in continuous-time dynamic systems [30]—provides a theoretical framework for revealing the dynamic evolution of competitive and collaborative relationships between heterogeneous innovation entities [18,31,32]. Therefore, based on innovation chain and differential game theories, this study deconstructed the process of key core technology innovation into two stages: R&D and market promotion. Taking leading enterprises, supporting enterprises, and academic research institutions as the core innovation entities, this study aimed not only to explore the strategic selection and behavioral coordination of innovation entities under the Nash non-collaborative, cost-sharing, and collaborative mechanisms [33] but also to investigate the time-varying regularity of the revenue distribution, R&D level, and market share within the system [18,30].
This study reveals the dynamic collaborative mechanism of heterogeneous innovation entities of key core technology innovation, providing a theoretical framework and practical implication for overcoming the transformation predicament of “R&D–market”, while also contributing novel perspectives to innovation chain and differential game theories.
The main contributions of this study are primarily in the following three areas: (1) This study explores the value co-creation mechanism of key core technology innovation from the perspectives of the innovation chain and differential games. It addresses the limitation of previous studies that analyzed the logic of technological innovation solely from the perspective of technology R&D [7,17], reveals the dynamic regularity of collaborative innovation in key core technology “R&D–market” processes, and provides new theoretical explanations and practical insights for solving the “two-world paradox” of the disconnect between basic research and market application [12,20]. (2) This study investigates the impacts of the collaborative mechanism of innovation entities in asymmetric collaboration scenarios. In contrast to prior research, which primarily focused on the collaborative innovation logic of general types of enterprises [34,35], this study innovatively proposes a collaborative framework that includes leading enterprises (innovation leaders), supporting enterprises (technology implementers), and academic research institutions (knowledge providers). Based on the role differences and heterogeneous advantages of each innovation entity [6], this study systematically reveals the complementary synergy of innovation entities under different cooperation mechanisms. (3) Previous studies focused on organizational collaborative behaviors in the catch-up process for key core technology through case studies and empirical tests [2,10]. However, they failed to fully describe behaviors in the strategic interactions of innovation entities and paid insufficient attention to the dynamic evolution characteristics of key core technology innovation. The differential game model constructed in this study reveals the behavioral coordination mechanism for achieving key core technology innovation from a dynamic perspective, which can provide a more comprehensive understanding of key core technology innovation.

2. Issue Description and Hypotheses

As crucial innovation entities in the R&D and market promotion of key core technology, leading enterprises, supporting enterprises, and academic research institutions drive key core technology innovation through resource sharing and integration. First, during the R&D phase of key core technology, innovation entities must facilitate resource sharing and information exchange to achieve technological breakthroughs where leading enterprises, endowed with superior technological accumulation and resource integration capabilities, play a vital role in defining the direction of R&D and formulating strategic planning [5,6]. Supporting enterprises, because of their heterogeneous innovation resource endowments, are tasked with optimizing the industrial chain ecosystem and facilitating the advancement of key core technology innovation in collaboration with leading enterprises. As the knowledge source of basic research, academic research institutions provide theoretical support for key core technology innovation through the knowledge spillover effect [36,37,38]. In the market promotion process, leading enterprises, by virtue of their market demonstration effect, lead key core technology innovation’s market promotion process and maintain their market dominance through strategic behaviors such as industry standard setting, brand building, and channel integration. Supporting enterprises ensure the supply chain stability and market application of innovative products through specialized division of labor and large-scale production. Additionally, academic research institutions adjust the theoretical research direction according to market feedback, promoting the coupling of technological achievements and market demand. Thus, the three parties jointly promote key core technology’s market promotion process. Table 1 shows the key parameters and variables of this study.
Hypothesis 1.
The efforts of leading enterprises, supporting enterprises, and academic research institutions in the R&D stage of key core technology are, respectively, L T , F T , and S T . The efforts in the market promotion stage are, respectively, L K , F K , and S K . Considering that the effort cost of innovation entities is related to their level of effort and exhibits significant convex characteristics [39], the cost functions of leading enterprises, supporting enterprises, and academic research institutions in the processes of key core technology R&D ( C F T , C F T , and C S T ) and market promotion ( C L K , C F K , and C S K ) are, respectively, defined as follows [40,41]:
C L T ( t ) = 1 2 η L T L 2 T ( t ) , C F T ( t ) = 1 2 η F T F 2 T ( t ) , C S T ( t ) = 1 2 η S T S 2 T ( t ) C L K ( t ) = 1 2 η L K L 2 K ( t ) , C F K ( t ) = 1 2 η F K F 2 K ( t ) , C S K ( t ) = 1 2 η S K S 2 K ( t )
Hypothesis 2.
In line with Zhang et al. (2025) [18], the current study regards the key core technology R&D level as a dynamic process, denoted by K A ( t ) . The R&D effort of each participant and the degree of technological recession jointly shape this process [39,41,42]. Therefore, the key core technology R&D level at time t can be expressed as follows:
K A ( t ) = d K A ( t ) d t = α L L T ( t ) + α F F T ( t ) + α S S T ( t ) ζ K A ( t ) K ( 0 ) = k 0 0
In the initial state, K ( 0 ) = k 0 0 and k 0 and K A ( t ) represent the initial R&D level of key core technology and its rate of change over time. Furthermore, because the R&D process of key core technology goes through continuous technological obsolescence, we further introduce the technology recession rate ( ζ ) into our model.
Hypothesis 3.
Market share represents the performance of market promotion. We further constructed the equation for market share. Given that the market share of key core technology L A ( t ) is influenced by the marketing efforts of each participant and the market recession coefficient [43,44], this study defines the change in the market share of key core technology as follows [40]:
L A ( t ) = d L A ( t ) d t = β L L K ( t ) + β F F K ( t ) + β S S K ( t ) γ L A ( t ) L ( 0 ) = l 0 0
where l 0 and L A ( t ) denote the initial market share of key core technology and the rate of change in its market share over time, respectively.
Hypothesis 4.
To encourage supporting enterprises and academic research institutions to participate in the R&D and market promotion process of key core technology [30], leading enterprises bear technology R&D costs of σ 1 ( t ) and σ 2 ( t ) and market promotion costs of υ 1 ( t ) and υ 2 ( t ) for supporting enterprises and academic research institutions, respectively. Thus,  0 σ 1 ( t ) , σ 2 ( t ) 1 and 0 υ 1 ( t ) , υ 2 ( t ) 1 [39,40].
Hypothesis 5.
It is assumed that the revenues from key core technology innovation of leading enterprises, supporting enterprises, and academic research institutions are influenced by the innovation efforts made by the three parties in the game (including both the technology R&D and market promotion stages), as well as the market share and the R&D level of the key core technology. The revenues of leading enterprises, supporting enterprises, and academic research institutions can be expressed as follows [45,46]:
π L = a 1 L T + b 1 F T + c 1 S T + m 1 L K + n 1 F K + f 1 S K + o 1 K + τ 1 L
π F = a 2 L T + b 2 F T + c 2 S T + m 2 L K + n 2 F K + f 2 S K + o 2 K + τ 2 L
π S = a 3 L T + b 3 F T + c 3 S T + m 3 L K + n 3 F K + f 3 S K + o 3 K + τ 3 L
The discount rate for all three parties is ρ and ρ > 0 .

3. Model Construction

This study further considers the optimal strategy and revenue distribution of leading enterprises, supporting enterprises, and academic research institutions under three mechanisms: Nash non-collaboration, cost sharing, and collaboration. We also systematically discuss the dynamic evolution characteristics of the R&D level and market share of key core technology, aiming to reveal the critical conditions and collaborative mechanisms for each innovation entity and the whole system to achieve Pareto optimal decisions.

3.1. Nash Non-Collaborative Mechanism

In the Nash non-collaborative mechanism, leading enterprises, supporting enterprises, and academic research institutions, as rational economic entities, all aim to maximize their own revenues [47]. At this time, leading enterprises do not share the technology R&D and marketing promotion costs of supporting enterprises and academic research institutions, that is, σ 1 , σ 2 = 0 and υ 1 , υ 2 = 0 [30]. In the following, N is used to indicate the Nash non-collaborative mechanism. Then the objective functions of leading enterprises, supporting enterprises, and academic research institutions are set as follows [40]:
max J L N = 0 e ρ t a 1 L T + b 1 F T + c 1 S T + m 1 L K + n 1 F K + f 1 S K + o 1 K + τ 1 L 1 2 η L T L 2 T 1 2 η L K L 2 K d t
max J F N = 0 e ρ t a 2 L T + b 2 F T + c 2 S T + m 2 L K + n 2 F K + f 2 S K + o 2 K + τ 2 L 1 2 η F T F 2 T 1 2 η F K F 2 K d t
max J S N = 0 e ρ t a 3 L T + b 3 F T + c 3 S T + m 3 L K + n 3 F K + f 3 S K + o 3 K + τ 3 L 1 2 η S T S 2 T 1 2 η S K S 2 K d t
Proposition 1.
In the non-collaborative mechanism, the optimal strategies of leading enterprises, supporting enterprises, and academic research institutions are, respectively,
( L T N , L K N ) = ( a 1 ( ρ + ζ ) + o 1 α L ( ρ + ζ ) η L T , m 1 ( ρ + γ ) + τ 1 β L ( ρ + γ ) η L K )
( F T N , F K N ) = ( b 2 ( ρ + ζ ) + o 2 α F ( ρ + ζ ) η F T , n 2 ( ρ + γ ) + τ 2 β F ( ρ + γ ) η F K )
( S T N , S K N ) = ( c 3 ( ρ + ζ ) + o 3 α S ( ρ + ζ ) η S T , f 3 ( ρ + γ ) + τ 3 β S ( ρ + γ ) η S K )
Proof: see Supplementary Materials.
The R&D level and market share of key core technology under the non-collaborative mechanism are obtained as follows:
K N = O N ζ + ( k 0 O N ζ ) e ζ t
L N = G N γ + ( l 0 G N γ ) e γ t
where
O N = α L a 1 ( ρ + ζ ) + o 1 α L ( ρ + ζ ) η L T + α F b 2 ( ρ + ζ ) + o 2 α F ( ρ + ζ ) η F T + α S c 3 ( ρ + ζ ) + o 3 α S ( ρ + ζ ) η S T
G N = β L m 1 ( ρ + γ ) + τ 1 β L ( ρ + γ ) η L K + β F n 2 ( ρ + γ ) + τ 2 β F ( ρ + γ ) η F K + β S f 3 ( ρ + γ ) + τ 3 β S ( ρ + γ ) η S K
Proof: see Supplementary Materials.
The optimal revenues of leading enterprises, supporting enterprises, academic research institutions, and the overall system under the non-collaborative mechanism can be obtained, respectively, as follows:
V L N ( K , L ) = o 1 ρ + ζ K + τ 1 ρ + γ L + a 1 ( ρ + ζ ) + o 1 α L 2 2 ρ ( ρ + ζ ) 2 η L T + m 1 ( ρ + γ ) + τ 1 β L 2 2 ρ ( ρ + γ ) 2 η L K + b 2 ( ρ + ζ ) + o 2 α F b 1 ( ρ + ζ ) + o 1 α F ρ ( ρ + ζ ) 2 η F T + n 1 ( ρ + γ ) + τ 1 β F n 2 ( ρ + γ ) + τ 2 β F ρ ( ρ + γ ) 2 η F K + c 1 ( ρ + ζ ) + o 1 α S c 3 ( ρ + ζ ) + o 3 α S ρ ( ρ + ζ ) 2 η S T + f 1 ( ρ + γ ) + τ 1 β S f 3 ( ρ + γ ) + τ 3 β S ρ ( ρ + γ ) 2 η S K
V F N ( K , L ) = o 2 ρ + ζ K + τ 2 ρ + γ L + a 2 ( ρ + ζ ) + o 2 α L a 1 ( ρ + ζ ) + o 1 α L ρ ( ρ + ζ ) 2 η L T + b 2 ( ρ + ζ ) + o 2 α F 2 2 ρ ( ρ + ζ ) 2 η F T + c 2 ( ρ + ζ ) + o 2 α S c 3 ( ρ + ζ ) + o 3 α S ρ ( ρ + ζ ) 2 η S T + n 2 ( ρ + γ ) + τ 2 β F 2 2 ρ ( ρ + γ ) 2 η F K + m 2 ( ρ + γ ) + τ 2 β L m 1 ( ρ + γ ) + τ 1 β L ρ ( ρ + γ ) 2 η L K + f 2 ( ρ + γ ) + τ 2 β S f 3 ( ρ + γ ) + τ 3 β S ρ ( ρ + γ ) 2 η S K
V S N ( K , L ) = o 3 ρ + ζ K + τ 3 ρ + γ L + a 3 ( ρ + ζ ) + o 3 α L a 1 ( ρ + ζ ) + o 1 α L ρ ( ρ + ζ ) 2 η L T + c 3 ( ρ + ζ ) + o 3 α S 2 2 ρ ( ρ + ζ ) 2 η S T + m 3 ( ρ + γ ) + τ 3 β L m 1 ( ρ + γ ) + τ 1 β L ρ ( ρ + γ ) 2 η L K + n 3 ( ρ + γ ) + τ 3 β F n 2 ( ρ + γ ) + τ 2 β F ρ ( ρ + γ ) 2 η F K + f 3 ( ρ + γ ) + τ 3 β S 2 2 ρ ( ρ + γ ) 2 η S K + b 3 ( ρ + ζ ) + o 3 α F b 2 ( ρ + ζ ) + o 2 α F ρ ( ρ + ζ ) 2 η F T
V N ( K , L ) = o 1 + o 2 + o 3 ρ + ζ K + τ 1 + τ 2 + τ 3 ρ + γ L + ( a 1 + 2 a 2 + 2 a 3 ) ( ρ + ζ ) + ( o 1 + 2 o 2 + 2 o 3 ) α L a 1 ( ρ + ζ ) + o 1 α L 2 ρ ( ρ + ζ ) 2 η L T + ( m 1 + 2 m 2 + 2 m 3 ) ( ρ + γ ) + ( τ 1 + 2 τ 2 + 2 τ 3 ) β L m 1 ( ρ + γ ) + τ 1 β L 2 ρ ( ρ + γ ) 2 η L K + ( 2 b 1 + b 2 + 2 b 3 ) ( ρ + ζ ) + ( 2 o 1 + o 2 + 2 o 3 ) α F b 2 ( ρ + ζ ) + o 2 α F 2 ρ ( ρ + ζ ) 2 η F T + ( 2 n 1 + n 2 + 2 n 3 ) ( ρ + γ ) + ( 2 τ 1 + τ 2 + 2 τ 3 ) β F n 2 ( ρ + γ ) + τ 2 β F 2 ρ ( ρ + γ ) 2 η F K + ( 2 c 1 + 2 c 2 + c 3 ) ( ρ + ζ ) + ( 2 o 1 + 2 o 2 + o 3 ) α S c 3 ( ρ + ζ ) + o 3 α S 2 ρ ( ρ + ζ ) 2 η S T + ( 2 f 1 + 2 f 2 + f 3 ) ( ρ + γ ) + ( 2 τ 1 + 2 τ 2 + τ 3 ) β S f 3 ( ρ + γ ) + τ 3 β S 2 ρ ( ρ + γ ) 2 η S K
Proof: see Supplementary Materials.

3.2. Cost-Sharing Mechanism

Under the cost-sharing mechanism, leading enterprises, as the leaders in the R&D process, take the lead in determining the R&D efforts, technology R&D subsidies ( σ 1 ( t ) , σ 2 ( t ) ), and marketing promotion subsidies ( υ 1 ( t ) , υ 2 ( t ) ) of supporting enterprises and academic research institutions by virtue of their technological and market advantages: 0 σ 1 ( t ) , σ 2 ( t ) 1 ; 0 υ 1 ( t ) , υ 2 ( t ) 1 [47]. Supporting enterprises and academic research institutions, as followers, adjust their R&D investments and resource allocation strategies based on the dynamic decisions of leading enterprises to maximize their revenues [12,30]. Thus, a Stackelberg game with a leader–follower relationship is created. The objective functions of the three parties in the game are as follows [40]:
J L S = 0 e ρ t [ a 1 L T + b 1 F T + c 1 S T + m 1 L K + n 1 F K + f 1 S K + o 1 K + τ 1 L 1 2 η L T L 2 T ( t ) 1 2 η L K L 2 K ( t ) 1 2 σ 1 ( t ) η F T F 2 T ( t ) 1 2 υ 1 ( t ) η F K F 2 K ( t ) 1 2 σ 2 ( t ) η S T S 2 T ( t ) 1 2 υ 2 ( t ) η S K S 2 K ( t ) ] d t
J F S = 0 e ρ t a 2 L T + b 2 F T + c 2 S T + m 2 L K + n 2 F K + f 2 S K + o 2 K + τ 2 L 1 2 ( 1 σ 1 ( t ) ) η F T F 2 T ( t ) 1 2 ( 1 υ 1 ( t ) ) η F K F 2 K ( t ) d t
J S S = 0 e ρ t a 3 L T + b 3 F T + c 3 S T + m 3 L K + n 3 F K + f 3 S K + o 3 K + τ 3 L 1 2 ( 1 σ 2 ( t ) ) η S T S 2 T ( t ) 1 2 ( 1 υ 2 ( t ) ) η S K S 2 K ( t ) d t
Proposition 2.
Under the cost-sharing mechanism, the optimal strategies of leading enterprises, supporting enterprises, and academic research institutions and the optimal subsidy ratios of leading enterprises are as follows:
( L T S , L K S ) = ( a 1 ( ρ + ζ ) + o 1 α L ( ρ + ζ ) η L T , m 1 ( ρ + γ ) + τ 1 β L ( ρ + γ ) η L K )
( F T S , F K S ) = ( ( 2 b 1 + b 2 ) ( ρ + ζ ) + ( o 2 + 2 o 1 ) α F 2 ( ρ + ζ ) η F T , ( 2 n 1 + n 2 ) ( ρ + γ ) + ( τ 2 + 2 τ 1 ) β F 2 ( ρ + γ ) η F K )
( S T S , S K S ) = ( ( 2 c 1 + c 3 ) ( ρ + ζ ) + ( o 3 + 2 o 1 ) α S 2 ( ρ + ζ ) η S T , ( 2 f 1 + f 3 ) ( ρ + γ ) + ( τ 3 + 2 τ 1 ) β S 2 ( ρ + γ ) η F K )
σ 1 = ( 2 b 1 b 2 ) ( ρ + ζ ) + ( 2 o 1 o 2 ) α F ( 2 b 1 + b 2 ) ( ρ + ζ ) + ( 2 o 1 + o 2 ) α F
b 1 > ( o 2 2 o 1 ) 2 ( ρ + ζ ) α F + b 2 2
σ 2 = ( 2 c 1 c 3 ) ( ρ + ζ ) + ( 2 o 1 o 3 ) α S ( 2 c 1 + c 3 ) ( ρ + ζ ) + ( 2 o 1 + o 3 ) α S
c 1 > ( o 3 2 o 1 ) 2 ( ρ + ζ ) α S + c 3 2
υ 1 = ( 2 n 1 n 2 ) ( ρ + γ ) + ( 2 τ 1 τ 2 ) β F ( 2 n 1 + n 2 ) ( ρ + γ ) + ( 2 τ 1 + τ 2 ) β F
n 1 > ( τ 2 2 τ 1 ) 2 ( ρ + γ ) β F + n 2 2
υ 2 = ( 2 f 1 f 3 ) ( ρ + γ ) + ( 2 τ 1 τ 3 ) β s ( 2 f 1 + f 3 ) ( ρ + γ ) + ( 2 τ 1 + τ 3 ) β s
f 1 > ( τ 3 2 τ 1 ) 2 ( ρ + γ ) β s + f 3 2
Proof: see Supplementary Materials.
Proposition 2 shows that, under the cost-sharing mechanism, the behavior of leading enterprises in subsidizing the costs of supporting enterprises and academic research institutions is subject to specific conditions. Specifically, leading enterprises are motivated to bear the costs of key core technology R&D and market promotion only when the impact coefficient ( b 1 , c 1 , n 1 , f 1 ) of the efforts of supporting enterprises and academic research institutions on leading enterprises’ revenues exceeds a certain threshold. The results align with the common perception that, as commercialized innovators, leading enterprises’ decision-making behavior follows the cost–revenue principle and the assumption of rational economic actors. In other words, the cost–subsidy decision is economically justified only if the R&D efforts of supporting enterprises and academic research institutions can generate significant marginal revenues for leading enterprises. Additionally, the incentive-compatible mechanism based on the optimal threshold can effectively stimulate the enthusiasm of supporting enterprises and academic research institutions for R&D investment, which helps effectively alleviate the imbalance between innovation resources and the “free-riding” behavior caused by the moral hazard and information asymmetry [47,48]. In contrast, if the R&D efforts of supporting enterprises and academic research institutions yield revenues to leading enterprises that are lower than the associated subsidy costs and anticipated revenues, these leading enterprises are generally hesitant to share the innovation costs.
The R&D level and market share of key core technology under the cost-sharing mechanism are obtained as follows:
K S = O S ζ + ( k 0 O S ζ ) e ζ t
L S = G S γ + ( l 0 G S γ ) e γ t
where
O S = α L a 1 ( ρ + ζ ) + o 1 α L ( ρ + ζ ) η L T + α F ( 2 b 1 + b 2 ) ( ρ + ζ ) + ( o 2 + 2 o 1 ) α F 2 ( ρ + ζ ) η F T + α S ( 2 c 1 + c 3 ) ( ρ + ζ ) + ( o 3 + 2 o 1 ) α S 2 ( ρ + ζ ) η S T
G S = β L m 1 ( ρ + γ ) + τ 1 β L ( ρ + γ ) η L K + β F ( 2 n 1 + n 2 ) ( ρ + γ ) + ( τ 2 + 2 τ 1 ) β F 2 ( ρ + γ ) η F K + β S ( 2 f 1 + f 3 ) ( ρ + γ ) + ( τ 3 + 2 τ 1 ) β S 2 ( ρ + γ ) η S K
Proof: see Supplementary Materials.
The optimal revenues of leading enterprises, supporting enterprises, academic research institutions, and the overall system under the cost-sharing mechanism can be obtained, respectively, as follows:
V L S ( K , L ) = o 1 ρ + ζ K + τ 1 ρ + γ L + a 1 ( ρ + ζ ) + o 1 α L 2 2 ρ ( ρ + ζ ) 2 η L T + m 1 ( ρ + γ ) + τ 1 β L 2 2 ρ ( ρ + γ ) 2 η L K + ( 2 b 1 + b 2 ) ( ρ + ζ ) + ( o 2 + 2 o 1 ) α F 2 8 ρ ( ρ + ζ ) 2 η F T + ( 2 c 1 + c 3 ) ( ρ + ζ ) + ( o 3 + 2 o 1 ) α S 2 8 ρ ( ρ + ζ ) 2 η S T + ( 2 f 1 + f 3 ) ( ρ + γ ) + ( τ 3 + 2 τ 1 ) β S 2 8 ρ ( ρ + γ ) 2 η S K + ( 2 n 1 + n 2 ) ( ρ + γ ) + ( τ 2 + 2 τ 1 ) β F 2 8 ρ ( ρ + γ ) 2 η F K
V F S ( K , L ) = o 2 ρ + ζ K + τ 2 ρ + γ L + a 2 ( ρ + ζ ) + o 2 α L a 1 ( ρ + ζ ) + o 1 α L ρ ( ρ + ζ ) 2 η L T + m 2 ( ρ + γ ) + τ 2 β L m 1 ( ρ + γ ) + τ 1 β L ρ ( ρ + γ ) 2 η L K + ( 2 b 1 + b 2 ) ( ρ + ζ ) + ( o 2 + 2 o 1 ) α F ) b 2 ( ρ + ζ ) + o 2 α F 4 ρ ( ρ + ζ ) 2 η F T + ( 2 c 1 + c 3 ) ( ρ + ζ ) + ( o 3 + 2 o 1 ) α S c 2 ( ρ + ζ ) + o 2 α S 2 ρ ( ρ + ζ ) 2 η S T + ( 2 f 1 + f 3 ) ( ρ + γ ) + ( τ 3 + 2 τ 1 ) β S f 2 ( ρ + γ ) + τ 2 β S 2 ρ ( ρ + γ ) 2 η S K + ( 2 n 1 + n 2 ) ( ρ + γ ) + ( τ 2 + 2 τ 1 ) β F n 2 ( ρ + γ ) + τ 2 β F 4 ρ ( ρ + γ ) 2 η F K
V S S ( K , L ) = o 3 ρ + ζ K + τ 3 ρ + γ L + a 3 ( ρ + ζ ) + o 3 α L a 1 ( ρ + ζ ) + o 1 α L ρ ( ρ + ζ ) 2 η L T + m 3 ( ρ + γ ) + τ 3 β L m 1 ( ρ + γ ) + τ 1 β L ρ ( ρ + γ ) 2 η L K + ( 2 b 1 + b 2 ) ( ρ + ζ ) + ( o 2 + 2 o 1 ) α F b 3 ( ρ + ζ ) + o 3 α F 2 ρ ( ρ + ζ ) 2 η F T + ( 2 c 1 + c 3 ) ( ρ + ζ ) + ( o 3 + 2 o 1 ) α S c 3 ( ρ + ζ ) + o 3 α S 4 ρ ( ρ + ζ ) 2 η S T + ( 2 n 1 + n 2 ) ( ρ + γ ) + ( τ 2 + 2 τ 1 ) β F n 3 ( ρ + γ ) + τ 3 β F 2 ρ ( ρ + γ ) 2 η F K + ( 2 f 1 + f 3 ) ( ρ + γ ) + ( τ 3 + 2 τ 1 ) β S [ f 3 ( ρ + γ ) + τ 3 β S ] 4 ρ ( ρ + γ ) 2 η S K
V S ( K , L ) = o 1 + o 2 + o 3 ρ + ζ K + τ 1 + τ 2 + τ 3 ρ + γ L + ( a 1 + 2 a 2 + 2 a 3 ) ( ρ + ζ ) + ( o 1 + 2 o 2 + 2 o 3 ) α L a 1 ( ρ + ζ ) + o 1 α L 2 ρ ( ρ + ζ ) 2 η L T + ( m 1 + 2 m 2 + 2 m 3 ) ( ρ + γ ) + ( τ 1 + 2 τ 2 + 2 τ 3 ) β L m 1 ( ρ + γ ) + τ 1 β L 2 ρ ( ρ + γ ) 2 η L K + ( 2 b 1 + b 2 ) ( ρ + ζ ) + ( o 2 + 2 o 1 ) α F ) ( 2 b 1 + 3 b 2 + 4 b 3 ) ( ρ + ζ ) + ( 2 o 1 + 3 o 2 + 4 o 3 ) α F 8 ρ ( ρ + ζ ) 2 η F T + ( 2 c 1 + c 3 ) ( ρ + ζ ) + ( o 3 + 2 o 1 ) α S ( 2 c 1 + 3 c 3 + 4 c 2 ) ( ρ + ζ ) + ( 2 o 1 + 3 o 3 + 4 o 2 ) α S 8 ρ ( ρ + ζ ) 2 η S T + ( 2 f 1 + f 3 ) ( ρ + γ ) + ( τ 3 + 2 τ 1 ) β S ( 4 f 2 + 3 f 3 + 2 f 1 ) ( ρ + γ ) + ( 4 τ 2 + 3 τ 3 + 2 τ 1 ) β S 8 ρ ( ρ + γ ) 2 η S K + ( 2 n 1 + n 2 ) ( ρ + γ ) + ( τ 2 + 2 τ 1 ) β F ( 2 n 1 + 3 n 2 + 4 n 3 ) ( ρ + γ ) + ( 2 τ 1 + 3 τ 2 + 4 τ 3 ) β F 8 ρ ( ρ + γ ) 2 η F K
Proof: see Supplementary Materials.

3.3. Collaborative Mechanism

The collaborative mechanism (denoted by the superscript C) is a strategic alliance formed by leading enterprises, supporting enterprises, and academic research institutions with the primary objective of maximizing system revenue [30,47]. All participants collaboratively determine optimal strategies for both the R&D and market promotion of key core technology, aiming to ensure system-wide optimization. This mechanism’s collective objective function can be formally expressed as follows:
J C = 0 e ρ t ( a 1 + a 2 + a 3 ) L T + ( b 1 + b 2 + b 3 ) F T + ( c 1 + c 2 + c 3 ) S T + ( m 1 + m 2 + m 3 ) L K + ( n 1 + n 2 + n 3 ) F K + ( f 1 + f 2 + f 3 ) S K + ( o 1 + o 2 + o 3 ) K + ( τ 1 + τ 2 + τ 3 ) L 1 2 η L T L T 2 ( t ) 1 2 η F K F K 2 ( t ) 1 2 η S T S T 2 ( t ) 1 2 η S K S K 2 ( t ) 1 2 η L K L K 2 ( t ) 1 2 η F T F T 2 ( t ) d t
Proposition 3.
In the collaborative mechanism, the optimal strategies of leading enterprises, supporting enterprises, and academic research institutions are as follows:
( L T C , L K C ) = ( ( a 1 + a 2 + a 3 ) ( ρ + ζ ) + ( o 1 + o 2 + o 3 ) α L ( ρ + ζ ) η L T , ( m 1 + m 2 + m 3 ) ( ρ + γ ) + ( τ 1 + τ 2 + τ 3 ) β L ( ρ + γ ) η L K )
( F T C , F K C ) = ( ( b 1 + b 2 + b 3 ) ( ρ + ζ ) + ( o 1 + o 2 + o 3 ) α F ( ρ + ζ ) η F T , ( n 1 + n 2 + n 3 ) ( ρ + γ ) + ( τ 1 + τ 2 + τ 3 ) β F ( ρ + γ ) η F K )
( S T C , S K C ) = ( c 1 + c 2 + c 3 ) ( ρ + ζ ) + ( o 1 + o 2 + o 3 ) α S ( ρ + ζ ) η S T , ( f 1 + f 2 + f 3 ) ( ρ + γ ) + ( τ 1 + τ 2 + τ 3 ) β S ( ρ + γ ) η S K )
The R&D level and market share of key core technology under the collaborative mechanism are obtained as follows:
K C = O C ξ + ( k 0 O C ξ ) e ξ t
L C = G C γ + ( l 0 G C γ ) e γ t
where
O C = α L ( a 1 + a 2 + a 3 ) ( ρ + ζ ) + ( o 1 + o 2 + o 3 ) α L ( ρ + ζ ) η L T + α F ( b 1 + b 2 + b 3 ) ( ρ + ζ ) + ( o 1 + o 2 + o 3 ) α F ( ρ + ζ ) η F T + α S ( c 1 + c 2 + c 3 ) ( ρ + ζ ) + ( o 1 + o 2 + o 3 ) α S ( ρ + ζ ) η S T
G C = β L ( m 1 + m 2 + m 3 ) ( ρ + γ ) + ( τ 1 + τ 2 + τ 3 ) β L ( ρ + γ ) η L K + β F ( n 1 + n 2 + n 3 ) ( ρ + γ ) + ( τ 1 + τ 2 + τ 3 ) β F ( ρ + γ ) η F K + β S ( f 1 + f 2 + f 3 ) ( ρ + γ ) + ( τ 1 + τ 2 + τ 3 ) β S ( ρ + γ ) η S K
Proof: see Supplementary Materials.
The collaborative mechanism aims to maximize the system’s overall revenue as the principle for decision making, thereby overcoming the limitation of a single entity’s interest being focused solely on maximizing its own revenue. Under this mechanism, only the optimal solution of the overall revenue of the system is investigated, instead of calculating the individual revenues of each participant separately. Therefore, the optimal revenues of the system can be obtained as follows:
V C ( K , L ) = o 1 + o 2 + o 3 ρ + ζ K + τ 1 + τ 2 + τ 3 ρ + γ L + ( a 1 + a 2 + a 3 ) ( ρ + ζ ) + ( o 1 + o 2 + o 3 ) α L 2 2 ρ ( ρ + ζ ) 2 η L T + ( m 1 + m 2 + m 3 ) ( ρ + γ ) + ( τ 1 + τ 2 + τ 3 ) β L 2 2 ρ ( ρ + γ ) 2 η L K + ( b 1 + b 2 + b 3 ) ( ρ + ζ ) + ( o 1 + o 2 + o 3 ) α F 2 2 ρ ( ρ + ζ ) 2 η F T + ( f 1 + f 2 + f 3 ) ( ρ + γ ) + ( τ 1 + τ 2 + τ 3 ) β S 2 2 ρ ( ρ + γ ) 2 η S K + ( c 1 + c 2 + c 3 ) ( ρ + ζ ) + ( o 1 + o 2 + o 3 ) α S 2 2 ( ρ + ζ ) 2 η S T + ( n 1 + n 2 + n 3 ) ( ρ + γ ) + ( τ 1 + τ 2 + τ 3 ) β F 2 2 ρ ( ρ + γ ) 2 η F K
Proof: see Supplementary Materials.

4. Comparative Analysis

By comparing the optimal strategies and revenues among leading enterprises, supporting enterprises, and academic research institutions, as well as the R&D levels and market shares of key core technology under the three mechanisms, the following conclusions can be drawn.
Proposition 4.
Under various collaborative mechanisms, the optimal strategies of key core technology innovation of leading enterprises, supporting enterprises, and academic research institutions are negatively correlated with the cost coefficient, discount rate, technology, and market recession coefficient. They are positively correlated with the influence coefficient of technological innovation effort on innovation revenues and the sensitivity coefficient of technology R&D and market promotion. Proposition 4 indicates that multiple factors jointly influence the optimal strategy for key core technology innovation of leading enterprises, supporting enterprises, and academic research institutions. Specifically, increasing the impact coefficient of innovation effort on revenues and the sensitivity coefficient of technology R&D and market promotion are important ways to stimulate the innovation motivation of various entities. At the same time, reducing the cost of innovation and the degree of technology and market recession will also help improve innovation entities’ R&D efforts.
Proposition 5.
Under the three mechanisms, the results of the comparison of the optimal strategies for key core technology innovation among leading enterprises, supporting enterprises, and academic research institutions are as follows:
L T N = L T S < L T C ,
L K N = L K S < L K C
  • If
    b 1 > ( o 2 2 o 1 ) 2 ( ρ + ζ ) α F + b 2 2 ,
    c 1 > ( o 3 2 o 1 ) 2 ( ρ + ζ ) α S + c 3 2 ,
    n 1 > ( τ 2 2 τ 1 ) 2 ( ρ + γ ) β F + n 2 2 ,
    f 1 > ( τ 3 2 τ 1 ) 2 ( ρ + γ ) β s + f 3 2 ,
    then F T N < F T S < F T C ; F K N < F K S < F K C ; S T N < S T S < S T C ; S K N < S K S < S K C .
  • Otherwise, F T S < F T N < F T C ; F K S < F K N < F K C ; S T S < S T N < S T C ; S K S < S K N < S K C .
Proposition 5 demonstrates that, in the context of a cost-sharing mechanism within a certain threshold, the optimal strategy for leading enterprises in key core technology R&D and market promotion aligns with the Nash non-collaborative mechanism. However, the innovation efforts of supporting enterprises and academic institutions are enhanced. The increase is equal to the proportion of the cost ( σ 1 , σ 2 , υ 1 , υ 2 ) shared by leading enterprises with supporting enterprises and academic research institutions. Otherwise, under the Nash non-collaborative mechanism, innovation efforts tend to be higher. This indicates that providing subsidies for technology R&D and market promotion can effectively incentivize supporting enterprises and academic research institutions to carry out key core technology innovation, with the cost-sharing ratio being positively correlated with the incentive effect. This is because introducing a cost-sharing mechanism can help supporting enterprises and academic research institutions share the R&D risks and innovation costs and motivate them to devote more effort to innovation. When the cost-sharing ratio exceeds a specific threshold, the marginal revenue of additional efforts will no longer cover the marginal cost because of the law of diminishing marginal revenues. This reduces the efforts of innovation entities. The existence of threshold effects indicates that innovation strategies are state-dependent, which contradicts the view in existing research that participants in an evolutionary game adjust their strategies simultaneously [40,49]. Under the collaborative mechanism, the innovation efforts of the three innovation entities are maximized. The establishment of long-term collaborative relationships and a trust mechanism effectively reduces disparities in revenue distribution and opportunistic behavior, thereby fully stimulating the participating entities’ willingness to innovate and increase their innovation efforts.
Proposition 6.
The following presents a comparison of the optimal revenues for leading enterprises, supporting enterprises, and academic research institutions, as well as the system-wide revenue from key core technology innovation under the three mechanisms:
  • If
    b 1 > ( o 2 2 o 1 ) 2 ( ρ + ζ ) α F + b 2 2 ;
    c 1 > ( o 3 2 o 1 ) 2 ( ρ + ζ ) α S + c 3 2 ;
    n 1 > ( τ 2 2 τ 1 ) 2 ( ρ + γ ) β F + n 2 2 ;
    f 1 > ( τ 3 2 τ 1 ) 2 ( ρ + γ ) β s + f 3 2 ,
    then V L S > V L N , V F S > V F N , V S S > V S N , V C > V S > V N .
Proposition 6 illustrates that the system revenues under the Nash non-collaboration, cost-sharing, and collaboration mechanisms include technology R&D revenues and cover key core technology innovation’s market revenues. Within a certain threshold range, the optimal revenues of leading enterprises, supporting enterprises, and academic research organizations in the cost-sharing mechanism, as well as the overall revenues of the system, are higher than the corresponding values in the Nash non-collaborative mechanism. Further, under the collaborative mechanism, the system revenue of key core technology innovation reaches Pareto optimization. These results show that, on the one hand, under the premise of guaranteeing the expected revenues of leading enterprises, the behavior of these enterprises in sharing the innovation costs of supporting enterprises and academic research institutions effectively reduces the R&D risks of all parties, which plays the role of innovation incentives and thus increases the revenues of innovation entities and the overall system. On the other hand, the collaborative mechanism can effectively integrate the heterogeneous resources of innovation entities and coordinate the interests of all parties to achieve Pareto optimization of the overall revenues within the system.
Proposition 7.
The results of the comparison of the R&D level and market share of key core technology within the system under the three mechanisms are as follows:
  • If
    b 1 > ( o 2 2 o 1 ) 2 ( ρ + ζ ) α F + b 2 2 ,
    c 1 > ( o 3 2 o 1 ) 2 ( ρ + ζ ) α S + c 3 2 ,
    n 1 > ( τ 2 2 τ 1 ) 2 ( ρ + γ ) β F + n 2 2 ,
    f 1 > ( τ 3 2 τ 1 ) 2 ( ρ + γ ) β s + f 3 2 ,
    then K C < K S < K N , L C < L S < L N .
Proposition 7 states that within a certain threshold range, leading enterprises cover the costs of technology R&D and market promotion for supporting enterprises and academic research institutions. This can enhance the R&D level and market share of key core technology by increasing the innovation efforts of supporting enterprises. In the collaborative mechanism, when the innovation efforts of leading enterprises, supporting enterprises, and academic research institutions reach their maximum, the technology R&D level and market share of key core technology within the system are also maximized.

5. Simulation and Analysis

5.1. Parameter Assignment

This section describes numerical simulations performed using the MATLAB software to analyze factors influencing the optimal strategy, optimal revenue, R&D level, and market share of key core technology in leading enterprises, supporting enterprises, and academic research institutions under the Nash non-collaboration, cost-sharing, and collaboration mechanisms. Based on the applicable parameter ranges and the related literatures [30,47,48], the following parameters are defined:
ρ = 0.2 ,   ζ = 0.2 ,   γ = 0.2 ,   k 0 = 3 ,   l 0 = 4 , η L T = 0.4 ,   η F T = 0.5 ,   η S T = 0.6 ,   η L K = 0.3 ,   η F K = 0.3 ,   η S K = 0.4 ,   α L = 0.6 ,   α F = 0.4 ,   α S = 0.2 ,   β L = 0.4 ,   β F = 0.3 ,   β S = 0.2 , { a i } i = 1 3 = { 0.5 ,   0.3 ,   0.1 } ,   { b i } i = 1 3 = { 0.4 ,   0.3 ,   0.2 } ,   { c i } i = 1 3 = { 0.3 ,   0.4 ,   0.2 } ,   { m i } i = 1 3 = { 0.2 ,   0.3 ,   0.1 } , { n i } i = 1 3 = { 0.2 ,   0.4 ,   0.1 } ,   { f i } i = 1 3 = { 0.1 ,   0.3 ,   0.1 } ,   { o i } i = 1 3 = { 0.3 ,   0.2 ,   0.2 } ,   { τ i } i = 1 3 = { 0.3 ,   0.4 ,   0.3 } .

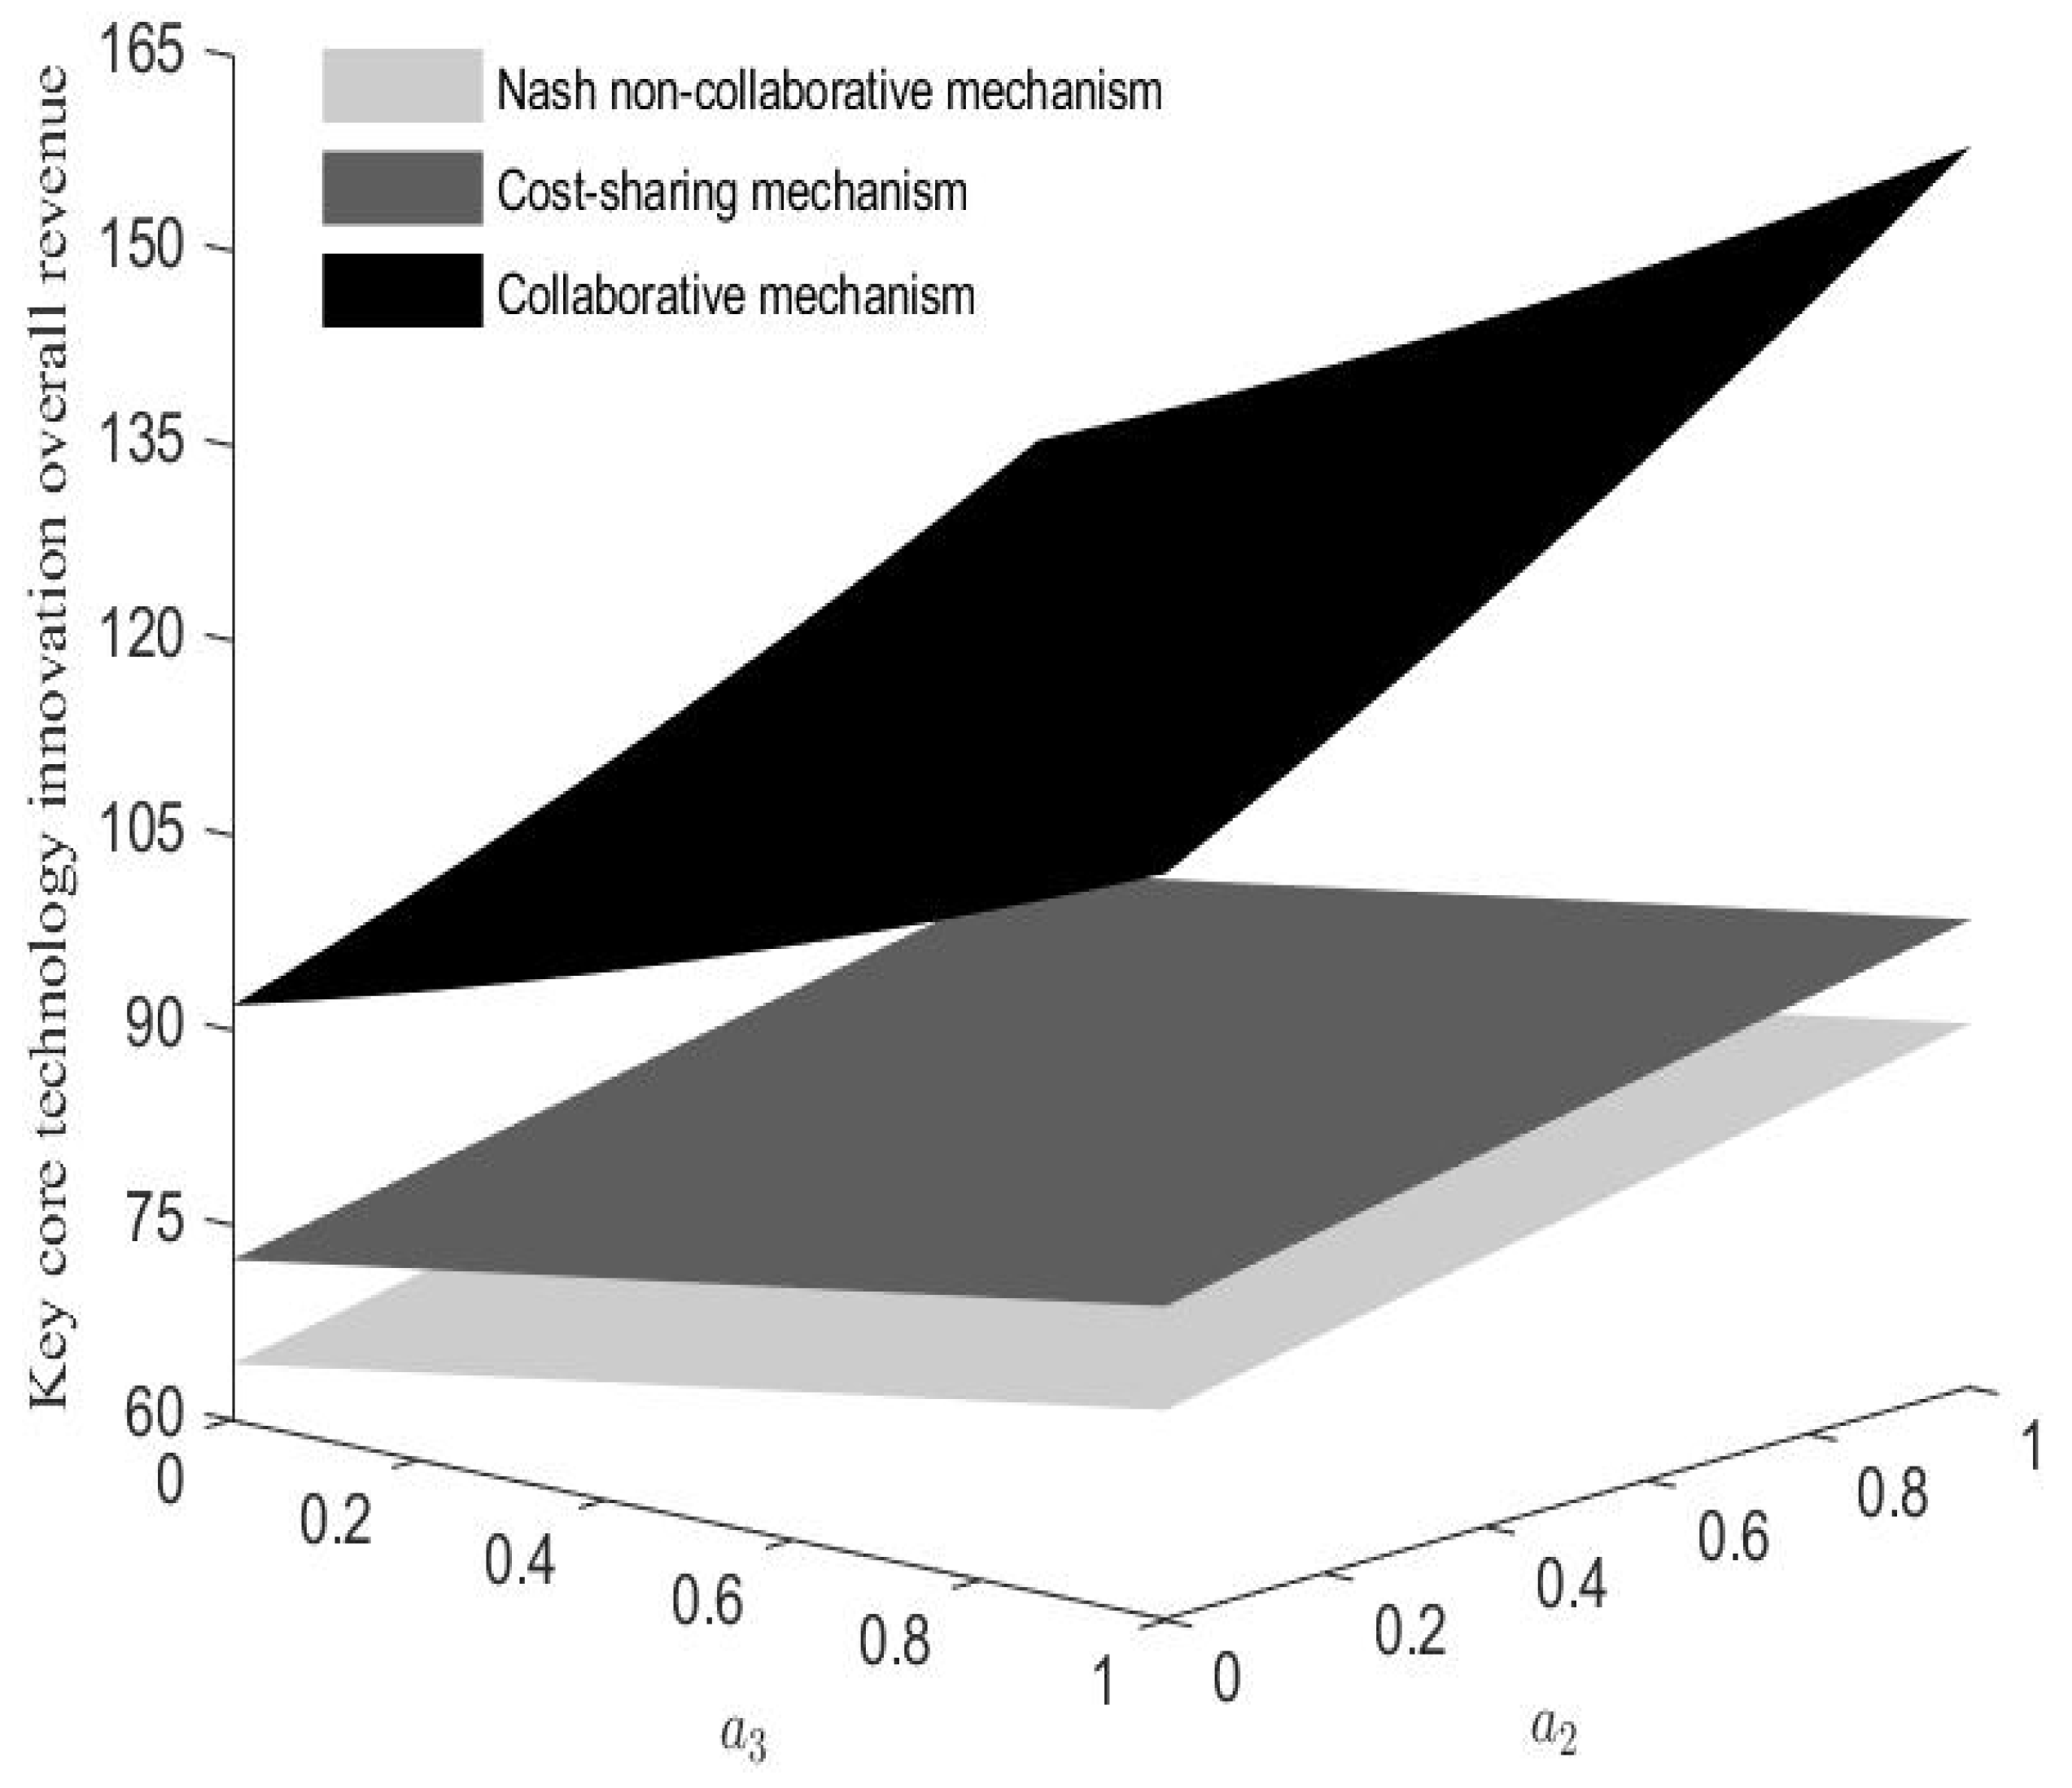
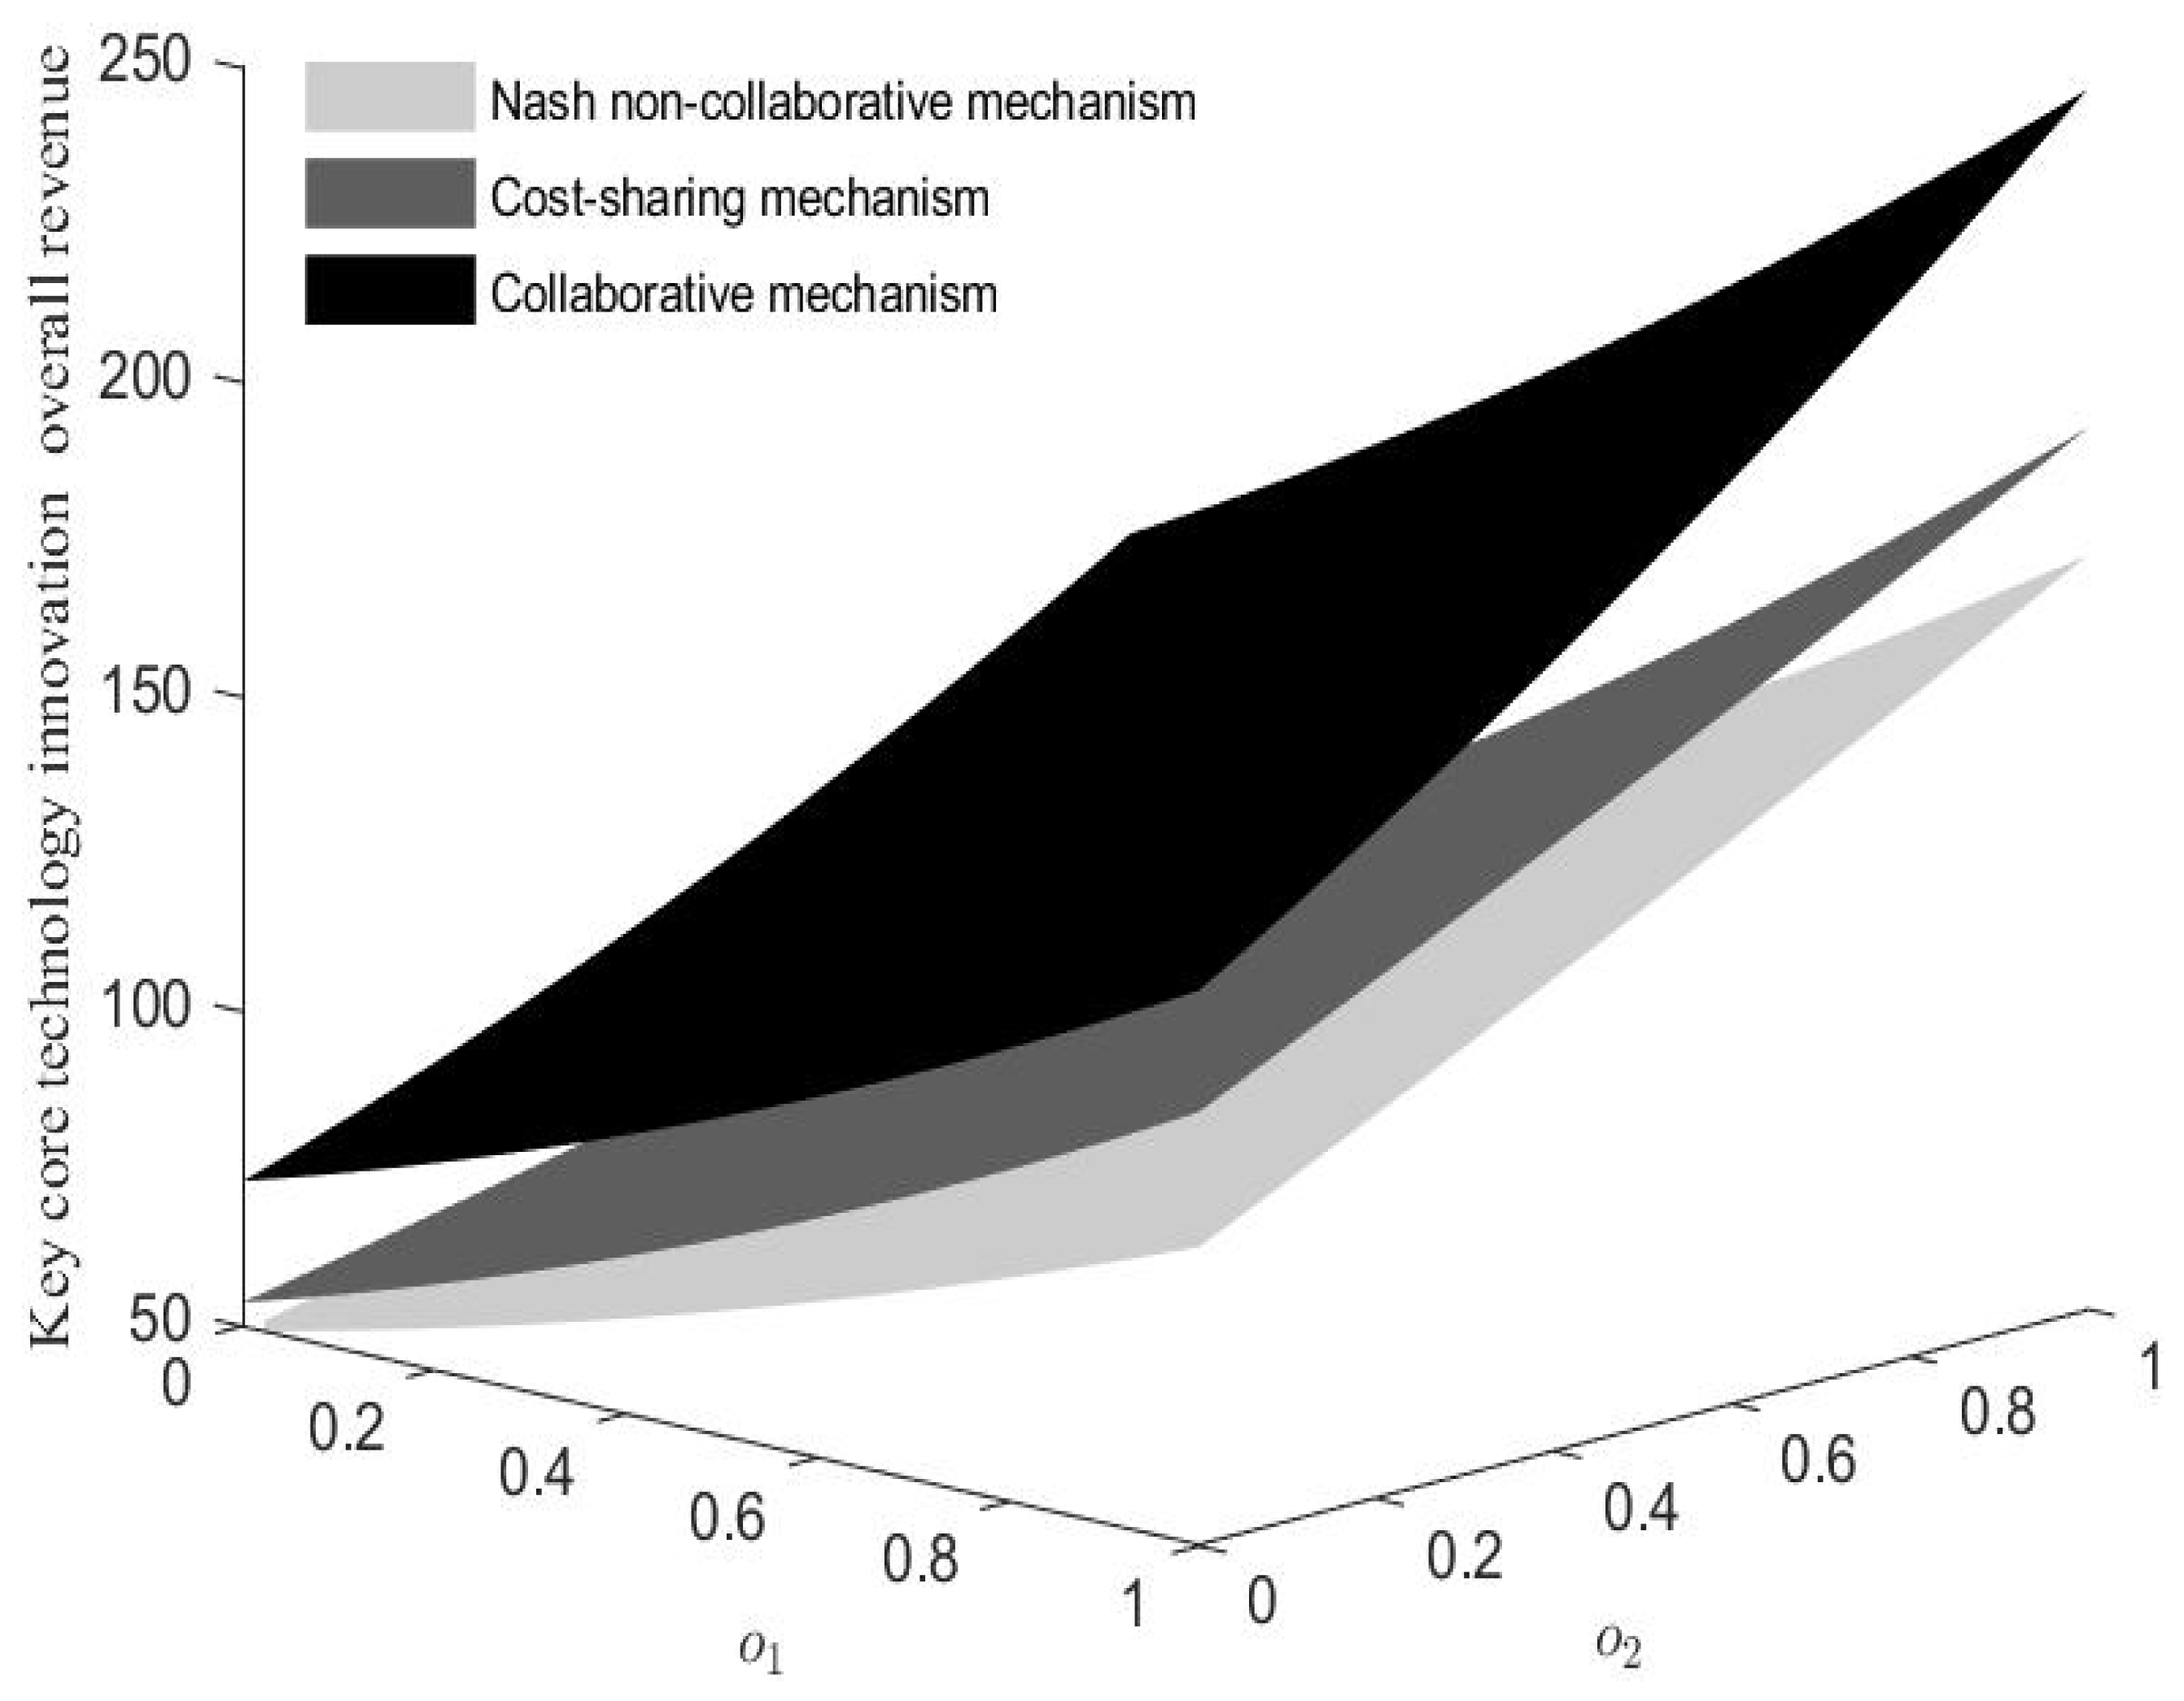
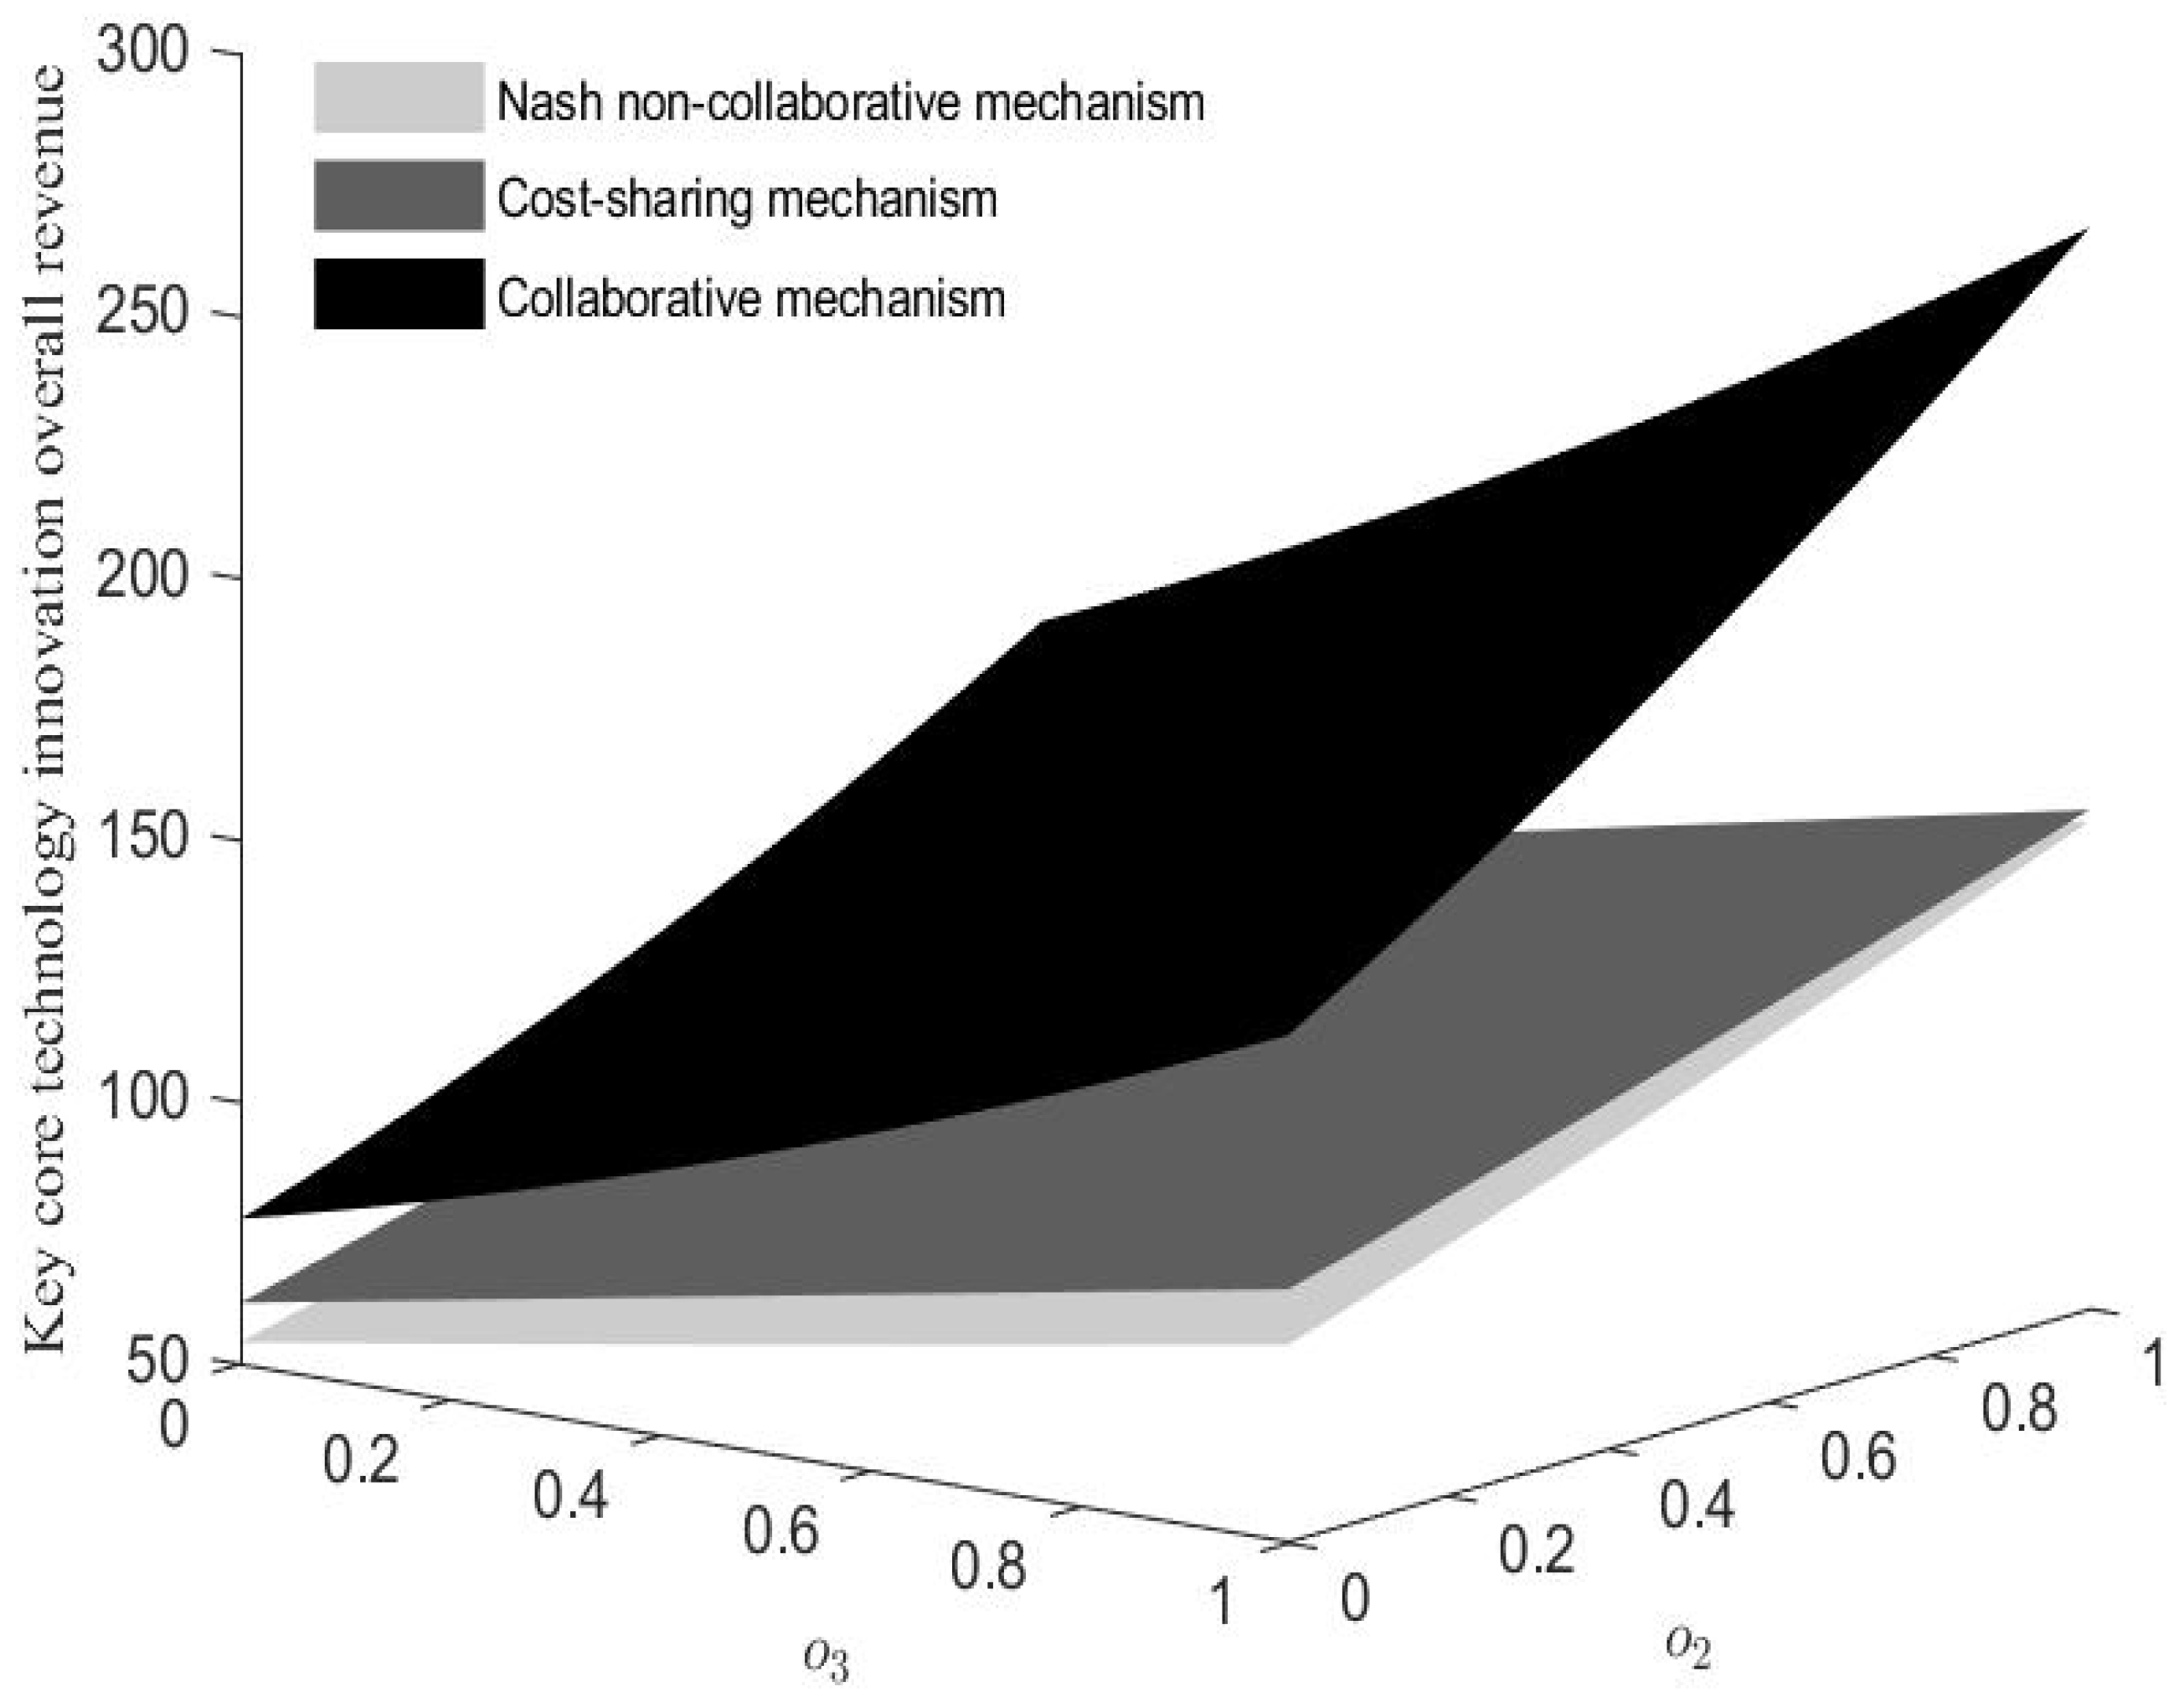
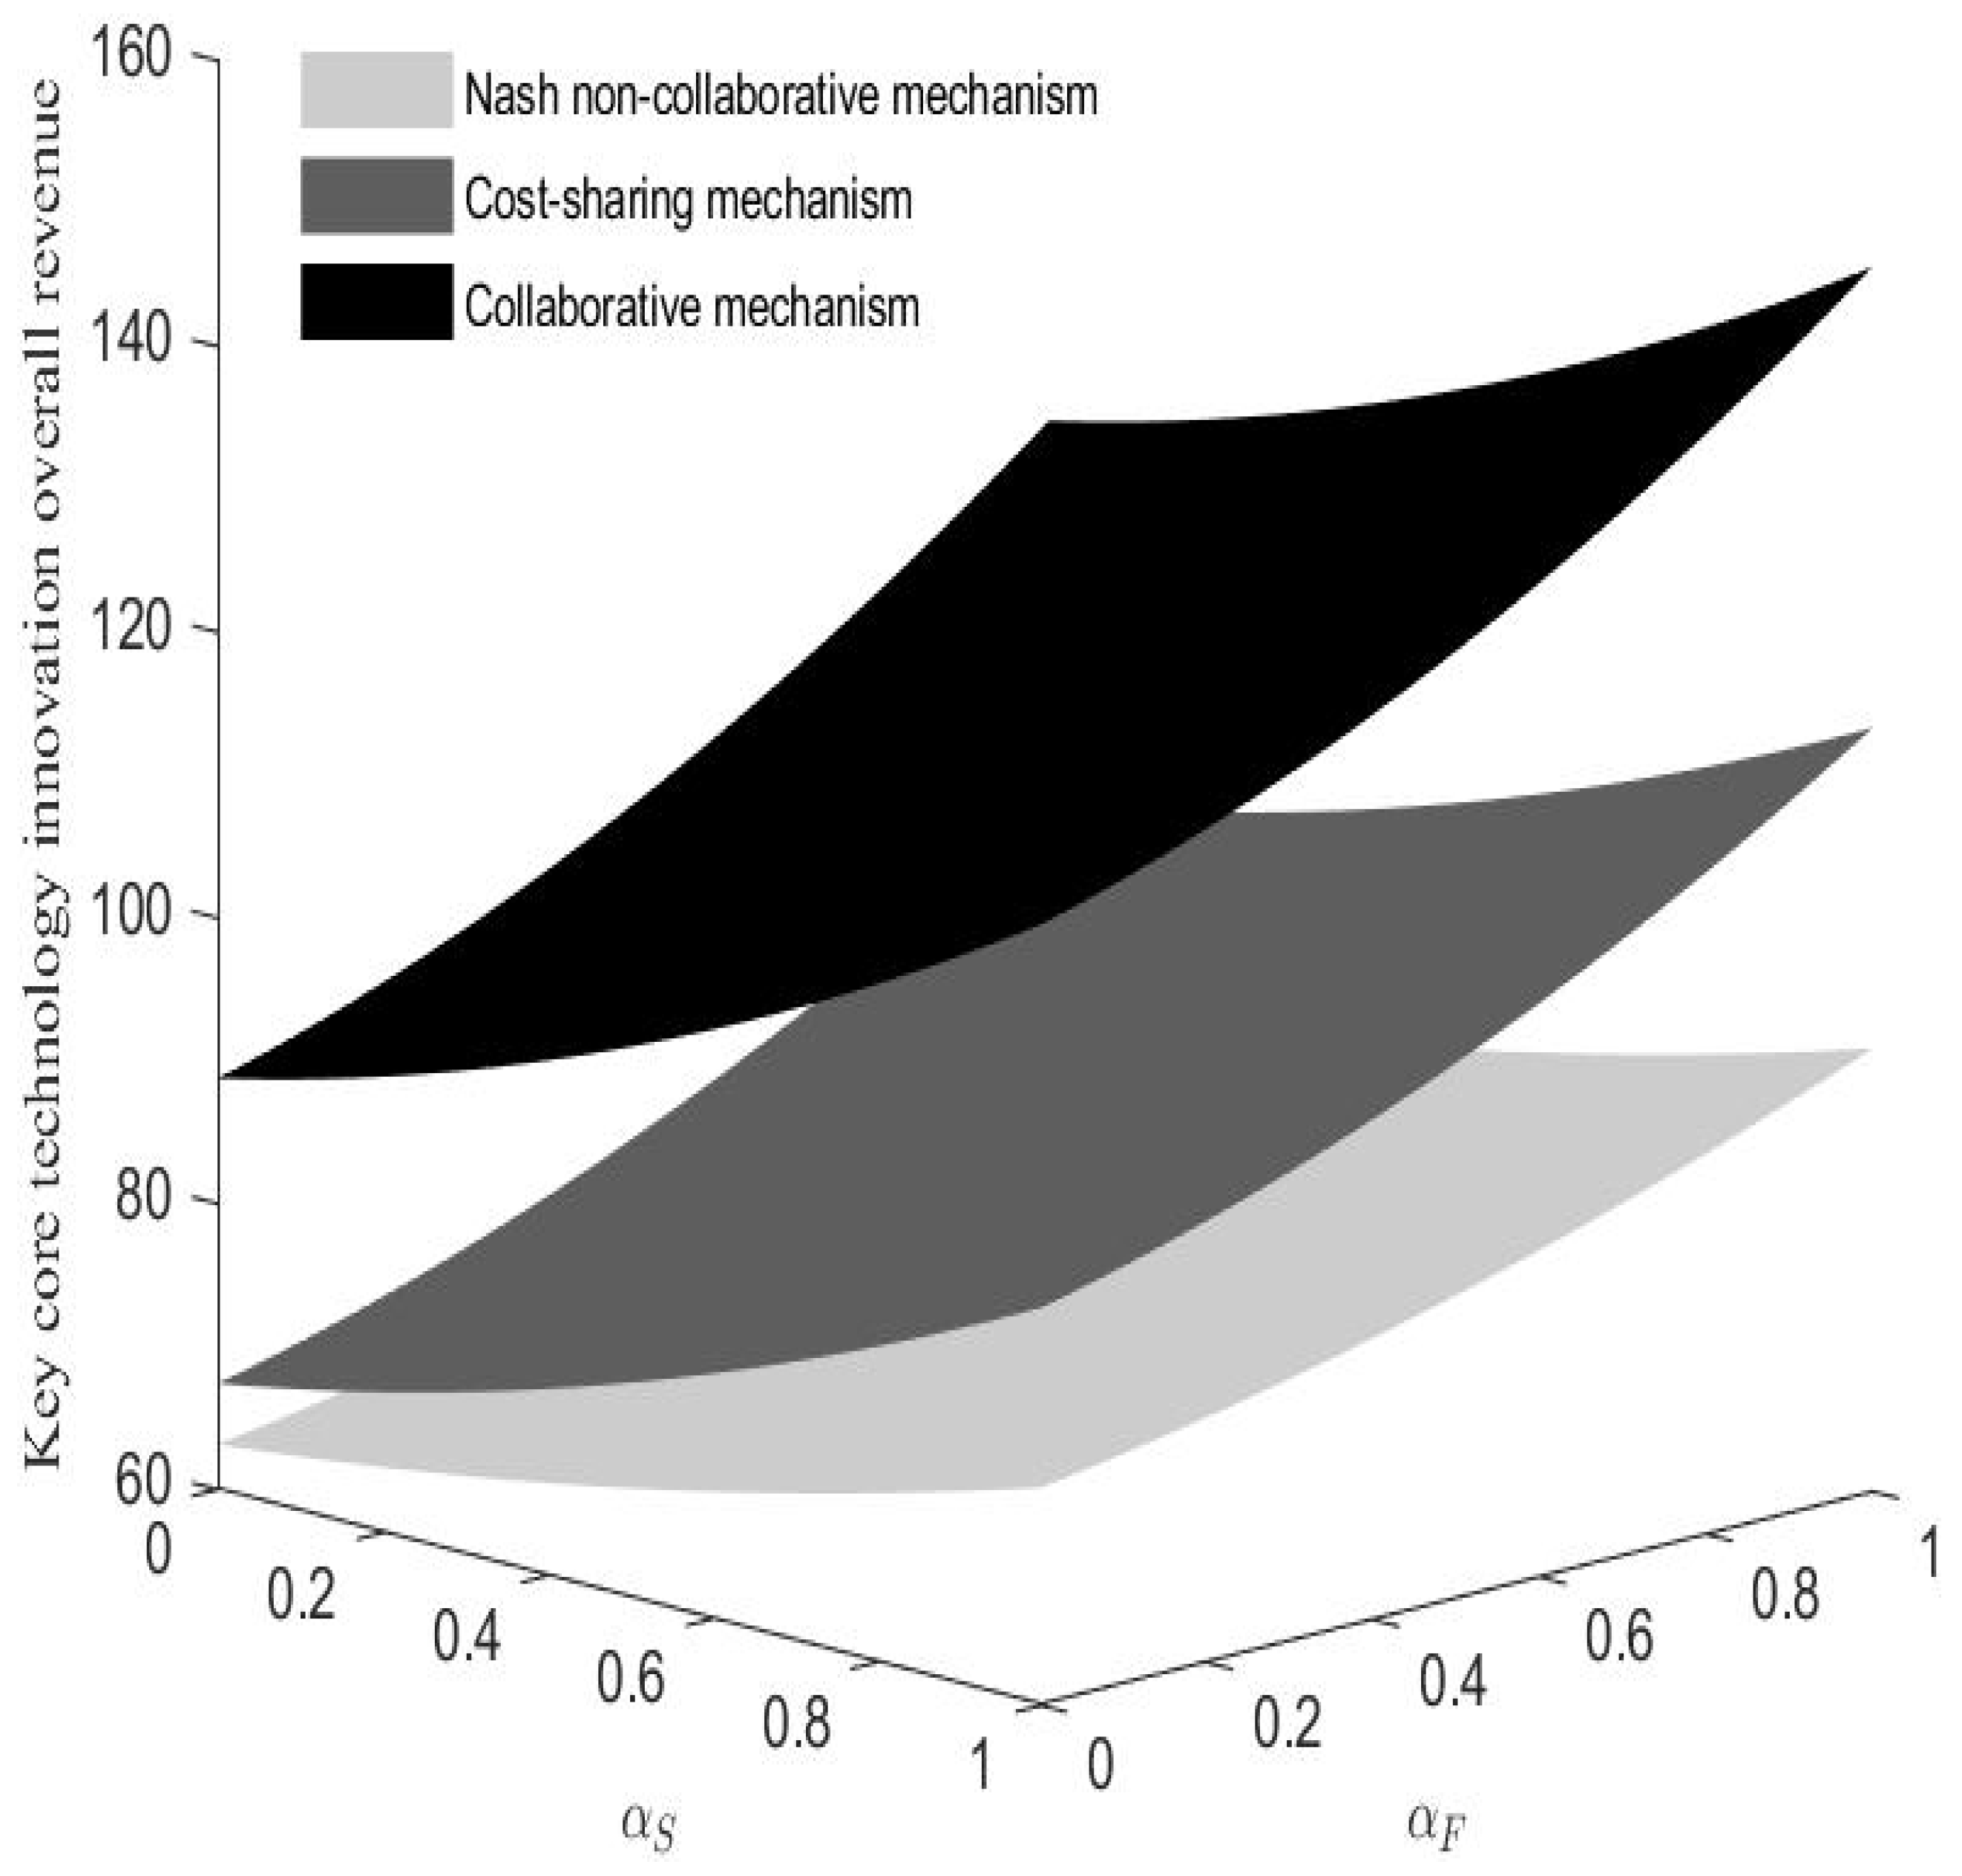
5.2. Simulation Analysis

Figure 1, Figure 2 and Figure 3 depict the trends in R&D efforts of leading enterprises, supporting enterprises, and academic research institutions, as influenced by changes in the cost coefficient under three different game scenarios. The results show that the R&D efforts of all three entities are significantly negatively correlated with the cost coefficient, which represents the marginal production cost of the enterprise. A higher cost coefficient means that more resources are required to produce each unit of the innovative product. These findings further support those of Gkypali et al. (2017) [50], who reported that an increase in R&D costs raises innovation risks and reduces organizations’ willingness to achieve innovation. The conclusion of the current study further reinforces the risk-averse nature of innovation entities, particularly in the context of key core technology innovation.
As Figure 4 and Figure 5 show, the overall revenue derived from key core technology innovation initially declines before stabilizing as the cost coefficient increases. According to the principle of risk aversion, high innovation costs increase the risk of R&D failure for innovators, which is not conducive to improving the overall system revenue. In addition, high innovation costs will weaken the willingness of entities to innovate and reduce their innovation input. With respect to system revenue, total revenue is maximized under the collaborative mechanism, followed by the cost-sharing mechanism. In contrast, system revenue under the Nash non-collaborative mechanism is significantly lower than that of the other two mechanisms.
Figure 6 and Figure 7 indicate that the influence coefficient of R&D efforts of innovation entities on their respective revenues is positively correlated with the overall revenue from key core technology innovation. In other words, key core technology innovation follows the logic of “individual effort–individual revenue–system revenue”. Enterprise R&D investment drives value creation through a dual mechanism: First, the increased intensity of R&D efforts directly promotes the growth in revenue for innovation entities. Second, the technology spillover effect generated by knowledge externalities significantly enhances the overall revenue of the system. The results suggest that stimulating the enthusiasm of innovation entities and increasing R&D investment levels are critical strategic methods for achieving key core technology innovation.
According to Figure 8 and Figure 9, the influence coefficient of key core technology R&D on the revenues of innovation entities shows a significant positive correlation with the overall system revenues. This result clearly indicates that a higher level of R&D can boost the revenues of innovation entities by improving R&D efficiency and product market competitiveness, generating a substantial spillover effect that benefits the entire system. It also confirms the causal mechanism between the improvement in R&D capabilities and innovation performance, offering a practical explanation for the “R&D multiplier effect”.
From Figure 10 and Figure 11, we can conclude that the sensitivity coefficients of technology R&D for leading enterprises, supporting enterprises, and academic research institutions have a significant positive impact on the system’s overall revenues from key core technology innovation. The results suggest that enhancing the technology R&D sensitivity coefficient can significantly increase innovation entities’ R&D success rate and generate knowledge spillover, thereby positively influencing the system’s overall innovation revenues. Generally, a high R&D sensitivity of technology R&D means a greater ability to identify, absorb, and apply technologies. Thus, each unit of R&D investment can have a significant impact on technological innovation, which, in turn, can advance the R&D level of key core technology and increase the overall revenues of the system. In this context, optimizing incentives and resource allocation can effectively enhance R&D efficiency, thereby significantly enhancing the system’s overall innovation revenue.
As Figure 12 and Figure 13 show, there are significant differences in the equilibrium states of key core technology R&D levels and market share under different mechanisms. Specifically, under the non-collaborative mechanism, the equilibrium values of key core technology R&D level and market share are 10% and 6%, respectively; under the cost-sharing mechanism, these increase to 12% and 7%; and under the collaborative mechanism, the R&D level and market share of key core technology rise to 24% and 20%, respectively. These results suggest that in the early stages of key core technology innovation, when the system’s key core technology R&D level and market share are relatively low, decentralized decision making by leading enterprises, supporting enterprises, and academic research institutions can effectively achieve key core technology innovation. When the initial key core technology R&D level and market share are at a medium level, the cost-sharing mechanism can better coordinate system members’ behavior to achieve a higher technology R&D level and market promotion effect. These results further verify that the cost-sharing mechanism can play a role in promoting key core technology innovation by sharing R&D costs and risks, alleviating conflicts of interest among system members, and promoting resource sharing between system members. When the system’s R&D level and market share of the key core technology are at a high level, leading enterprises, supporting enterprises, and academic research institutions can further achieve the improvement of technology R&D level and market share by adopting collaboration innovation strategies. This is primarily because such a collaborative mechanism fosters deep integration of resources and forward-looking learning among innovation entities, enabling them to swiftly adjust their R&D direction and respond to market demands. At this point, innovation entities aim to maximize system revenues, thereby achieving a greater degree of synergistic improvement in technology R&D levels and market share of the three parties involved in the game. The results show that the R&D and market promotion effects of key core technology are highly dependent on the collaboration mechanism between innovation entities. At different stages of technological innovation (low, medium, and high R&D levels), differentiated collaborative mechanisms should be adopted.
Figure 14 and Figure 15 reveal that both the technology recession rate and the discount rate significantly hinder improvements in the R&D level of key core technology. Additionally, there is a strong negative correlation between the market recession coefficient, the discount rate, and the market share of key core technology. These results suggest that a decline in technology R&D and market demand will reduce the R&D and market promotion levels of key core technology within the system. This is because the reduced speed of technological iteration and the decrease in market demand will lead to a decline in the expected rate of revenue. As a result, enterprises will reduce their investment in R&D and innovation efforts, which will negatively impact the R&D level and the market share of key core technology. Additionally, a high discount rate significantly lowers the present value of future revenue, which causes participants to prioritize short-term gains, often at the expense of long-term investments and innovation efforts. The myopic behavior of innovation entities induced by the high discount rate will undermine the R&D efforts of leading enterprises, supporting enterprises, and academic research institutions, hindering key core technology innovation. Overall, the R&D level and market share of key core technology under the collaborative mechanism are consistently better than those under other mechanisms, further validating the important role of synergistic collaboration in promoting R&D and market promotion of key core technology.

6. Conclusions

Based on differential game and innovation chain theories, this study adopts the dynamic analysis method to systematically study the value co-creation mechanism of key core technology innovation. Using the HJB equation, we analyze the optimal strategies and revenues of leading enterprises, supporting enterprises, and academic research institutions under the Nash non-collaboration, cost-sharing, and collaboration mechanisms. Our study further investigates the dynamic evolution of R&D level and market share of key core technology, leading to the following conclusions.

Main Conclusions

First, under the three mechanisms, the optimal strategies of leading enterprises, supporting enterprises, and academic research institutions are inversely related to the cost coefficient, discount rate, and technology/market recession coefficient. In contrast, they are positively correlated with the sensitivity coefficients of technology R&D and market promotion, the impact coefficient of innovation effort on revenues, and the impact coefficient of R&D level and market share on revenues.
Second, the cost-sharing mechanism increases the innovative efforts of supporting enterprises and academic research institutions, with the extent of the increase being proportional to the cost share borne by the leading enterprise. However, it does not affect the innovation strategy of the leading enterprise. An optimal threshold exists for the strategy choices of supporting enterprises, where their innovation efforts are higher under cost-sharing than under the Nash non-collaborative mechanism, but lower beyond this threshold. Under the collaborative mechanism, the innovation efforts and revenues of key core technology innovation for each participant achieve Pareto optimality.
Third, the R&D level and market share of key core technology vary significantly across the three mechanisms. Specifically, when both are low, all mechanisms contribute to their improvement. At moderate levels, the cost-sharing mechanism shows a significant advantage in enhancing both of them through risk-sharing and revenue coordination. However, when the R&D level and market share reach high levels, only the collaborative mechanism—through efficient resource integration and collaborative innovation—can substantially elevate both aspects of key core technology.

7. Discussion

7.1. Theoretical Contributions

First, from the theoretical perspective of key core technology innovation, this study deepens the research achievements of innovation chain theory at the micro level. Unlike existing studies that simply equate technological innovation with technology R&D [35,50], this study reveals the driving mechanism of technology R&D and market promotion based on innovation chain theory. This insight provides a novel perspective for understanding the key technology innovation process based on innovation chain theory and deepens the cognition of the nature of technological innovation.
Second, this study introduces differential game theory into the analytical framework of key core technology innovation and deeply discusses the optimal strategies, optimal revenues, and dynamic evolution patterns of the R&D level and market share of key core technology under these three mechanisms. Although differential game theory has been widely used in supply chain research, few studies have applied it to the field of collaborative innovation [48]. They have failed to reveal dynamic decision-making interactions, optimal resource allocation, and long-term equilibrium strategies among innovation entities under evolving conditions. From the perspective of key core technology innovation, this research expands the applicability of differential game theory [18,39]. Further, by constructing a dynamic game analysis framework of key core technology from R&D to market promotion, we innovatively integrate innovation chain theory with differential game theory and reveal the influencing factors and implementation process of key core technology innovation from a dynamic perspective.
Third, this study systematically analyzed the evolution of key core technology R&D levels and market share in relation to their initial values, recession coefficients, and discount rates. The findings indicate that the optimal collaborative mechanism for innovation entities depends on the R&D level and market share, thus overcoming the limitations of prior research that treated collaborative mechanisms as static and predetermined choices [10]. We have extended the view that the optimal collaborative innovation mechanism must align with the specific stages of technology and the market from the perspective of key core technology innovation, providing theoretical guidance for selecting organizational collaborative mechanisms in different contexts [18,49]. The differential impact of cost subsidies on the behavioral choices of innovation entities at varying threshold ranges challenges the traditional assumption of a synchronous strategy adjustment in evolutionary game theory, thereby contributing a novel theoretical perspective of “state-dependent innovation decision-making” [40,49]. Furthermore, by constructing a multi-dimensional parameter system, this study thoroughly characterizes the impacts of the sensitivity coefficient of technology R&D and market promotion and the cost coefficient on multi-agent innovation strategy selection and revenue distribution, providing theoretical support for multi-agent collaborative innovation from the perspectives of marginal revenues and risk preferences.

7.2. Practical Implications

First, this study advocates for the establishment of collaborative innovation mechanisms to enhance the awareness of synergy among entities [30]. It is essential to establish innovation collaboration platforms for open collaboration and governance, promoting cross-organizational and interdisciplinary exchanges [18]. Additionally, leading enterprises with core resources in the system should share innovation costs with supporting enterprises and academic research institutes [47], as seen in the practices of enterprises such as Huawei and Alibaba in AI and cloud computing. This cost-sharing approach alleviates excessive R&D investments, leading to Pareto improvements in revenue for all parties and boosting the overall effectiveness of core technology innovation.
Second, it is essential to reinforce the core role of leading enterprises in technology R&D, resource integration, and market expansion while fully leveraging their leadership in driving the structural upgrade of the industrial chain. Policymakers can enhance innovation in supporting enterprises and academic research institutions through incentives such as subsidies, intellectual property sharing, and policy support [18,47]. For example, the “Made in China 2025” plan highlights the positive impact of government policies in accelerating industry–academic-research collaboration in R&D and improving market competitiveness.
Third, innovation entities should assess the initial technical level and market share of key technologies and choose appropriate collaborative mechanisms based on their development stage [30]. A dynamic benefit-sharing model, aligned with each entity’s technological contributions, resource investments, and market value creation, should be established to reward sharing and enhance the internal stability of innovation systems [48]. It is well known that Apple has employed distinct collaborative modes at various stages of technological development with suppliers such as Foxconn, systematically overcoming technological barriers and strengthening the resilience of its supply chain. Similarly, the partnership between Tesla and Panasonic in battery technology is a successful example of dynamic benefit-sharing, where both parties share the rewards based on their respective contributions, ensuring a balanced distribution of risk and benefit.

7.3. Limitations and Model Extensions

There are several avenues for the extension of our model:
We considered the unidirectional impact of different collaborative mechanisms on technology R&D and market promotion. In the future, the support coefficient of market share for technology R&D can be introduced into the model to quantitatively analyze the feedback effect of market revenue in supporting technological R&D [21,26,51] and reveal the dynamic law of “market–technology” co-evolution.
Alternatively, this study primarily focused on the immediate impact of R&D collaboration on innovation outputs, assuming that R&D investment can be directly transformed into technological innovations [52]. A differential game with time-delay parameters and knowledge spillover coefficients can accurately depict the dynamic transformation of R&D investment into technological innovation [53], demonstrating how innovation outputs can achieve the coordinated development of innovation entities in the upstream and downstream of the industrial chain through knowledge spillover.
Adding the government’s intervention is also a topic of great interest [30]. This element is particularly relevant to coordinate conflicts of interest and alleviate market failures, potentially offering more policy guidance value to our model.

Supplementary Materials

The following supporting information can be downloaded at: https://www.mdpi.com/article/10.3390/systems13060436/s1.

Author Contributions

Conceptualization, X.F. and D.X.; methodology, X.F. and G.Z.; software, X.F., P.H., and L.C.; validation, X.F., P.H. and L.C.; formal analysis, D.X.; investigation, L.C.; resources, D.X.; data curation, X.F. and L.C.; writing—original draft preparation, X.F.; writing—review and editing, X.F. and G.Z.; visualization, X.F.; supervision, G.Z.; project administration, D.X.; funding acquisition, D.X. and G.Z. All authors have read and agreed to the published version of the manuscript.

Funding

This research was funded by the National Natural Science Foundation of China (71874102, U1901222) and the Shandong Province social science planning research project (24CKFJ31). And The APC was funded by the National Natural Science Foundation of China (71874102).

Data Availability Statement

Some or all of the data, models, or code that support the findings of this study are available from the corresponding author upon reasonable request.

Acknowledgments

The authors want to acknowledge all people for the suggestions provided for this study.

Conflicts of Interest

The authors declare no potential conflicts of interest with respect to the research, authorship, and publication of this article.

References

  1. Lai, X.; Nie, L. Maturity of knowledge inputs and the breakthrough of key core technology. Scientometrics 2024, 129, 6551–6570. [Google Scholar] [CrossRef]
  2. Liu, Y.; Liu, Z.; Xu, K. Imitative innovation or independent innovation strategic choice of emerging economies in non-cooperative innovation competition. J. Ind. Manag. Optim. 2023, 19, 1893–1910. [Google Scholar] [CrossRef]
  3. Yu, M.; Xu, Z.; Ma, C. The role of venture capital in promoting innovation in key & core technology companies: A pre-registered study. Pac.-Basin Financ. J. 2024, 83, 102222. [Google Scholar] [CrossRef]
  4. Wang, F.; Huang, Z. Analysis of international competitive situation of key core technology in strategic emerging industries: New generation of information technology industry as an example. PLoS ONE 2023, 18, e0287034. [Google Scholar] [CrossRef]
  5. An, X.; Tong, L. Research on the stable strategies for collaborative R&D in innovation consortiums formed by leading enterprises with multi-agent participation. Technol. Anal. Strat. Manag. 2025, 1–19. [Google Scholar] [CrossRef]
  6. Ma, B.; Li, K.; Xu, H.; An, J.; Wang, Y.; Zhang, Y. Research on heterogeneous financial support mechanisms for innovation in different types of technology enterprises. Financ. Res. Lett. 2024, 68, 105992. [Google Scholar] [CrossRef]
  7. Masucci, M.; Brusoni, S.; Cennamo, C. Removing bottlenecks in business ecosystems: The strategic role of outbound open innovation. Res. Policy 2020, 49, 103823. [Google Scholar] [CrossRef]
  8. Schøtt, T.; Jensen, K.W. Firms’ innovation benefiting from networking and institutional support: A global analysis of national and firm effects. Res. Policy 2016, 45, 1233–1246. [Google Scholar] [CrossRef]
  9. Yuan, N.; Li, M. Research on collaborative innovation behavior of enterprise innovation ecosystem under evolutionary game. Technol. Forecast. Soc. Change 2024, 206, 123508. [Google Scholar] [CrossRef]
  10. Qi, N.; Zhang, A. Technological cooperation relationships among supply chain enterprises under the perspective of technological blockade: A tripartite evolutionary game model. J. Clean. Prod. 2024, 447, 141240. [Google Scholar] [CrossRef]
  11. Shi, J. Adaptive change: Emerging economy enterprises respond to the international business environment challenge. Technovation 2024, 133, 102998. [Google Scholar] [CrossRef]
  12. Aubry, M.; Wang, Y. Vertical cooperation stability in R&D programs: A game theory analysis of the semiconductor industry. Technol. Forecast. Soc. Change 2024, 209, 123738. [Google Scholar] [CrossRef]
  13. Wang, Y.C.; Phillips, F.; Yang, C. Bridging innovation and commercialization to create value: An open innovation study. J. Bus. Res. 2021, 123, 255–266. [Google Scholar] [CrossRef]
  14. Haakonsson, S.J.; Kirkegaard, J.K. Configuration of technology networks in the wind turbine industry. A comparative study of technology management models in European and Chinese lead firms. Int. J. Technol. Manag. 2016, 70, 281–299. [Google Scholar] [CrossRef]
  15. Li, X.; Zheng, F.; Qi, Y.; Zhang, H. Study on the identification of key core technology “strangled” problem of the new generation information technology industry. Kybernetes 2024. [Google Scholar] [CrossRef]
  16. Eghbali, M.A.; Rasti-Barzoki, M.; Altmann, J. An evolutionary game-theoretic approach to analysis the green innovation chain dynamics under government policies. Technol. Soc. 2024, 77, 102568. [Google Scholar] [CrossRef]
  17. Xie, C.; Yang, N.; Wang, Y.; Zhang, M. Firm’s openness and innovation radicalness within R&D networks: Reconciling the openness paradox through the network pluralism view. Technovation 2025, 141, 103163. [Google Scholar] [CrossRef]
  18. Zhang, R.J.; Tai, H.W.; Cao, Z.X.; Cheng, K.T.; Wei, C.C. Innovation ecosystem based on low-carbon technology: Value co-creation mechanism and differential game analysis. Technol. Forecast. Soc. Change 2025, 210, 123852. [Google Scholar] [CrossRef]
  19. Elhelaly, N.; Ray, S. Collaborating to innovate: Balancing strategy dividend and transactional efficiencies. J. Mark. 2024, 88, 153–179. [Google Scholar] [CrossRef]
  20. Marcon, A.; Ribeiro, J.L.D.; Olteanu, Y.; Fichter, K. How the interplay between innovation ecosystems and market contingency factors impacts startup innovation. Technol. Soc. 2024, 76, 102424. [Google Scholar] [CrossRef]
  21. Aarikka-Stenroos, L.; Sandberg, B.; Lehtimäki, T. Networks for the commercialization of innovations: A review of how divergent network actors contribute. Ind. Mark. Manag. 2014, 43, 365–381. [Google Scholar] [CrossRef]
  22. Arora, A.; Fosfuri, A.; Rønde, T. The missing middle: Value capture in the market for startups. Res. Policy 2024, 53, 104958. [Google Scholar] [CrossRef]
  23. Haki, K.; Tanriverdi, H.; Safaei, D.; Schmid, M.; Aier, S.; Winter, R. Generativity and profitability on B2B innovation platforms: A simulation-based theory development. MIS Q. 2024, 48, 583–612. [Google Scholar] [CrossRef]
  24. Zilberman, D.; Reardon, T.; Silver, J.; Lu, L.; Heiman, A. From the laboratory to the consumer: Innovation, supply chain, and adoption with applications to natural resources. Proc. Natl. Acad. Sci. USA 2022, 119, e2115880119. [Google Scholar] [CrossRef]
  25. Kenzhaliyev, O.; Ilmaliyev, Z.B.; Tsekhovoy, A.; Triyono, M.B.; Kassymova, G.; Alibekova, G.Z.; Tayauova, G.Z. Conditions to facilitate commercialization of R & D in case of Kazakhstan. Technol. Soc. 2021, 67, 101792. [Google Scholar] [CrossRef]
  26. Lambrecht, D.; Block, J.; Neuenkirch, M.; Steinmetz, H.; Willeke, T. The interdependence of intellectual property rights and sales in the manufacturing industry: Evidence from the triangle of patents, trademarks, and sales. Econ. Innov. New Technol. 2025, 1–25. [Google Scholar] [CrossRef]
  27. Aarikka-Stenroos, L.; Sandberg, B. From new-product development to commercialization through networks. J. Bus. Res. 2012, 65, 198–206. [Google Scholar] [CrossRef]
  28. Stojčić, N. Collaborative innovation in emerging innovation systems: Evidence from Central and Eastern Europe. J. Technol. Transf. 2021, 46, 531–562. [Google Scholar] [CrossRef]
  29. Moradlou, H.; Roscoe, S.; Reefke, H.; Handfield, R. Using not-for-profit innovation networks to transition new technologies across the valley of death. Int. J. Oper. Prod. Manag. 2024, 44, 591–616. [Google Scholar] [CrossRef]
  30. Mukherjee, A.; Carvalho, M. Dynamic decision making in a mixed market under cooperation: Towards sustainability. Int. J. Prod. Econ. 2021, 241, 108270. [Google Scholar] [CrossRef]
  31. Jond, H.B.; Platoš, J. Differential game-based optimal control of autonomous vehicle convoy. IEEE Trans. Intell. Transp. Syst. 2022, 24, 2903–2919. [Google Scholar] [CrossRef]
  32. Sadana, U.; Reddy, P.V.; Zaccour, G. Nash equilibria in nonzero-sum differential games with impulse control. Eur. J. Oper. Res. 2021, 295, 792–805. [Google Scholar] [CrossRef]
  33. Zhao, C.; Zhu, W. Strategic IPO timing of technology innovation-driven enterprises: A differential game analysis of market returns, disclosure costs, and industry dynamics. Financ. Res. Lett. 2025, 72, 106588. [Google Scholar] [CrossRef]
  34. Ferrer-Serrano, M.; Latorre-Martinez, M.P.; Fuentelsaz, L. Regional knowledge asymmetries and innovation performance from collaborations across European regions. J. Technol. Transf. 2025. [Google Scholar] [CrossRef]
  35. Li, C.; Shafait, M. Assessing the impact of network embeddedness on SMEs innovation performance through resource bricolage: A mediated-moderated model. Oper. Manag. Res. 2025, 18, 72–88. [Google Scholar] [CrossRef]
  36. Leng, X.; Zhang, Y. The frontiers in manufacturing technologies initiative and university innovation. China World Econ. 2024, 32, 197–225. [Google Scholar] [CrossRef]
  37. Robertson, J.; McCarthy, I.P.; Pitt, L. Leveraging social capital in university-industry knowledge transfer strategies: A comparative positioning framework. Knowl. Manag. Res. Pract. 2019, 17, 461–472. [Google Scholar] [CrossRef]
  38. Xu, A.; Qiu, K.; Zhu, Y. The measurements and decomposition of innovation inequality: Based on Industry-University-Research perspective. J. Bus. Res. 2023, 157, 113556. [Google Scholar] [CrossRef]
  39. Deng, M.; Chen, J.; Ding, J. Improving success probability of innovation through multi-agent collaboration: A differential game model. Technol. Anal. Strat. Manag. 2025, 37, 109–124. [Google Scholar] [CrossRef]
  40. Wang, J.; Liu, W.; Wang, Z.; Shi, S. A four-party evolutionary game analysis of collaborative construction strategies for zero-carbon tourism cities. Manag. Decis. Econ. 2024, 45, 5125–5145. [Google Scholar] [CrossRef]
  41. Yi, H.; Zhang, Q. How does product innovation affect the performance of university-industry collaboration? A dynamic knowledge transfer perspective. Int. J. Technol. Manag. 2024, 95, 55–89. [Google Scholar] [CrossRef]
  42. Manikas, A.S.; Patel, P.C. The value of operational response in varied industries during the great recession. IEEE Trans. Eng. Manag. 2018, 67, 54–69. [Google Scholar] [CrossRef]
  43. Haefner, N.; Wincent, J.; Parida, V.; Gassmann, O. Artificial intelligence and innovation management: A review, framework, and research agenda. Technol. Forecast. Soc. Change 2021, 162, 120392. [Google Scholar] [CrossRef]
  44. Yu, A.; Shi, Y.; You, J.; Zhu, J. Innovation performance evaluation for high-tech companies using a dynamic network data envelopment analysis approach. Eur. J. Oper. Res. 2021, 292, 199–212. [Google Scholar] [CrossRef]
  45. Bzhalava, L.; Cantner, U. The journey towards open innovation: Why do firms choose different routes? Eurasian Bus. Rev. 2018, 8, 245–265. [Google Scholar] [CrossRef]
  46. Kshetri, N. The evolution of the internet of things industry and market in China: An interplay of institutions, demands and supply. Telecommun. Policy 2017, 41, 49–67. [Google Scholar] [CrossRef]
  47. Wei, J.; Wang, C. Improving interaction mechanism of carbon reduction technology innovation between supply chain enterprises and government by means of differential game. J. Clean. Prod. 2021, 296, 126578. [Google Scholar] [CrossRef]
  48. Sun, R.; He, D.Y.; Yan, J.J. Dynamic analysis of green technology innovation in products and processes under supply chain competition scenarios—A study based on stochastic differential game model. J. Environ. Manag. 2025, 373, 123545. [Google Scholar] [CrossRef]
  49. Su, N.; Shi, Z.; Zhu, X.; Xin, Y. An evolutionary game model of collaborative innovation between enterprises and colleges under government participation of China. SAGE Open 2021, 11, 21582440219. [Google Scholar] [CrossRef]
  50. Gkypali, A.; Filiou, D.; Tsekouras, K. R&D collaborations: Is diversity enhancing innovation performance? Technol. Forecast. Soc. Change 2017, 118, 143–152. [Google Scholar] [CrossRef]
  51. Munoz-Penas, J.; Clarke, A.H.; Evald, M.R. Building a commercialization capability: A dynamic capability view. Ind. Mark. Manag. 2024, 117, 344–355. [Google Scholar] [CrossRef]
  52. He, B.; Tian, S.; Zhang, X. Does the pilot free trade zone policy increase regional innovation ability? Evidence from China. Appl. Econ. Lett. 2025, 32, 576–581. [Google Scholar] [CrossRef]
  53. Boakye, D.; Sarpong, D.; Mordi, C. Regulatory review of new product innovation: Conceptual clarity and future research directions. Technol. Forecast. Soc. Change 2022, 175, 121419. [Google Scholar] [CrossRef]
Figure 1. Impact of η L T on R&D efforts of leading enterprises.
Systems 13 00436 g001
Figure 2. Impact of η F T on R&D efforts of supporting enterprises.
Systems 13 00436 g002
Figure 3. Impact of on R&D efforts of academic research institutions.
Systems 13 00436 g003
Figure 4. Impact of η F T , η L T on key core technology innovation overall revenue.
Systems 13 00436 g004
Figure 5. Impact of η F T , η S T on key core technology innovation overall revenue.
Systems 13 00436 g005
Figure 6. Impact of a1, a2 on key core technology innovation overall revenue.
Systems 13 00436 g006
Figure 7. Impact of a2, a3 on key core technology innovation overall revenue.
Systems 13 00436 g007
Figure 8. Impact of o1, o2 on key core technology innovation overall revenue.
Systems 13 00436 g008
Figure 9. Impact of o2, o3 on key core technology innovation overall revenue.
Systems 13 00436 g009
Figure 10. Impact of α L , α F on key core technology innovation overall revenue.
Systems 13 00436 g010
Figure 11. Impact of α S , α F on key core technology innovation overall revenue.
Systems 13 00436 g011
Figure 12. Impact of k0, t on key core technology R&D level.
Systems 13 00436 g012
Figure 13. Impact of l0, t on key core technology market share.
Systems 13 00436 g013
Figure 14. Impact of ρ , ζ on key core technology R&D level.
Systems 13 00436 g014
Figure 15. Impact of ρ , γ on key core technology market share.
Systems 13 00436 g015
Table 1. Notations of parameters and variables.
NotationsDescriptionsSpecific Implications
Parameters
η L , η F , η S Cost coefficients for all three partiesThe degree of costs or resource consumption required to achieve technological R&D and market promotion
α L , α F , α S The sensitivity coefficients of technology R&D for all three partiesThe impact of R&D effort of the innovation entities on the R&D level of key core technology
β L , β F , β S The sensitivity coefficients of market promotion for innovation entitiesThe impact of market effort of the innovation entities on the market promotion of key core technology
a i , b i , c i ( i = 1 , 2 , 3 )The influence coefficient of the R&D effort of key core technology of all three parties on their respective revenuesThe impact of R&D efforts on the revenues of innovation entities
m i , n i , f i ( i = 1 , 2 , 3 )The influence coefficient of market promotion effort on respective revenues of the three partiesThe impact of market promotion efforts on the revenues of innovation entities
o i , τ i ( i = 1 , 2 , 3 )The influence coefficient of technology R&D and market share on the revenues of the three parties.The impact of the R&D level and market share on the revenues of innovation entities
( ζ > 0 ) Technology recession rateThe degree of slowdown or regression in the development of key core technology
γ ( γ > 0 ) Market recession coefficientThe degree of slowdown or regression in the market demand of key core technology
ρ ( ρ > 0 ) Discount rateThe present value of future cash flows
Decision Variables
K A ( t ) The R&D level of key core technology at time t/
L A ( t ) The market share of key core technology at time t/
π L , π F , π S Revenues of leading enterprises, supporting enterprises, and academic research institutions, respectively/
Variables
L T ( t ) , F T ( t ) , S T ( t ) The R&D efforts of key core technology of all three parties at time tThe R&D efforts of the innovation entities
L K ( t ) , F K ( t ) , S K ( t ) The market promotion efforts of key core technology of all three parties at time tThe marketing efforts of the innovation entities
σ 1 ( t ) , σ 2 ( t ) The proportion of technology R&D costs borne by leading enterprises for supporting enterprises and academic research institutions/
υ 1 ( t ) , υ 2 ( t ) The proportion of market promotion costs borne by leading enterprises for supporting enterprises and academic research institutions/
Disclaimer/Publisher’s Note: The statements, opinions and data contained in all publications are solely those of the individual author(s) and contributor(s) and not of MDPI and/or the editor(s). MDPI and/or the editor(s) disclaim responsibility for any injury to people or property resulting from any ideas, methods, instructions or products referred to in the content.

