Article

CSR Input and Recycling Decisions for Closed-Loop Supply Chain with Asymmetric Demand Information

1
School of Economics and Management, Heilongjiang Institute of Technology, Harbin 150080, China
2
School of Economics and Management, Harbin University of Science and Technology, Harbin 150080, China
*
Author to whom correspondence should be addressed.
Systems 2025, 13(6), 432; https://doi.org/10.3390/systems13060432
Submission received: 28 April 2025 / Revised: 30 May 2025 / Accepted: 31 May 2025 / Published: 3 June 2025

Abstract

:
In reality, there is often information asymmetry between upstream and downstream enterprises in a closed-loop supply chain (CLSC) system, which can have a profound impact on the decisions of member enterprises and the operation of the system. Under asymmetric market demand information, this study examines CSR input and recycling decision making in CLSC. Four decision-making models were developed for CLSC, and the effects of consumer sensitivity to CSR input and demand information asymmetry on CLSC optimization were studied. The results indicate that higher consumer sensitivity to CSR input enhances both CSR levels and recycling rates, benefiting both manufacturer and retailer by increasing profits. In terms of increasing CSR levels, the manufacturer achieves the best results when independently managing CSR input and recycling. However, for improving recycling rates and market demand, the retailer is more effective when responsible for CSR input, with the manufacturer handling recycling. Additionally, demand information asymmetry reduces the manufacturer’s profit but may not affect the retailer’s profit. The retailer–manufacturer cooperation model proves more beneficial for overall CLSC system performance compared to information symmetry.

1. Introduction

With the general enhancement of people’s awareness of environmental protection, in order to deal with the environmental pollution caused by a large number of waste products, countries in the world have issued laws and regulations on waste product recycling; the environmental directives in the European Union (EU) [1,2] and Japan [3] were introduced earlier. Other countries, such as the United States, advocate that enterprises actively carry out recycling activities for used and end-of-life products and set up convenient recycling facilities to increase consumer participation in their recycling activities [4]. The Chinese government also issued relevant guidance encouraging local authorities to accelerate the development of the waste recycling industry [5]. Meanwhile, the economic value of used products can be increased through refurbishment, remanufacturing, or conversion into recycled materials, which also indirectly reduces raw material consumption and results in manufacturing cost savings [6]. Driven by environmental regulations and economic benefits, manufacturers in most industries are actively engaged in the business of recycling products into recycled materials or remanufactured products, thus establishing a closed-loop supply chain (CLSC) management system. For example, Nike, the global leading athletic brand, has launched the “Nike Grind” program to enable the conversion of manufacturing waste and end-of-life footwear into recyclable Nike Grind materials and incorporate them into new product designs [7]. Apple is making trade-in announcements through its official website to establish a self-recycling channel so that consumers can participate. Moreover, some manufacturers, such as Kodak, choose to engage retailers in product take-back operations. Kodak entrusts the recycling of its disposable cameras to some large retailers and compensates them for the costs incurred in the collection process through fixed payments [8]. In brief, collection reflects the manufacturers’ sense of responsibility to protect the environment.
Corporate social responsibility (CSR) is a public welfare behavior of enterprises voluntarily contributing to the environment and society, which also enhances reputation and competitive advantage [9,10]. Instead of being confined to a fixed concept, CSR encompasses a broad spectrum of principles, practices, and initiatives, including environmental liability, charity donation, community service, etc. As a matter of fact, a global poll by Ernst and Young in 2002 revealed that 94% of corporations believed that adopting CSR behavior might have a positive impact on businesses [11]. In recent years, under the influence of government regulations and consumer preferences, more and more enterprises have begun to pay attention to corporate social responsibility (CSR) while pursuing profits. Since 2012, the Guiding Opinions on the Fulfillment of Social Responsibilities by Central Enterprises issued by the Chinese government provides provisions and guidance for the disclosure of CSR by central enterprises and requires enterprises to publish CSR reports every year. In China, taking the CSR operation of the CLSC with electronic products as an example, in January 2020, Gree Electric Appliances donated 2 million yuan of epidemic materials to Jinyintan Hospital in a love action. The Coca-Cola Foundation, an offshoot of Coca-Cola, revealed that it has awarded more than USD 1.4 billion in grants to accelerate sustainable community initiatives around the world. In addition, the foundation is donating 2.0 percent of its operating revenue to local communities in 2021 [12]. At the same time, due to their direct contact with consumers, retailers often invest in CSR to stimulate consumption. For example, Walmart once held the “Love Food” charity donation activity to fulfill its CSR by actively donating to the society. Until 2018, Walmart’s total donations are expected to exceed CNY 18 million [13]. As reported, 84% of consumers believe that a company’s social and environmental initiatives influence their decision to purchase its products or services [14]. Nielsen’s 2023 study uncovered that as many as 73% of consumers demonstrate a willingness to pay higher prices for products supporting causes they care about [15]. This reflects a significant trend in the marketplace where CSR influences consumer choices, which is becoming a critical indicator of market demand.
Demand information asymmetry is one of the manifestations of information asymmetry in supply chain systems and another critical indicator of market demand. In real-world business operations, retailers—being positioned closer to end consumers and possessing more comprehensive and accurate sales data—typically exhibit superior market demand awareness compared to manufacturers. This inherent advantage may exacerbate information asymmetry between upstream manufacturers and downstream retailers within the supply chain [16]. For example, retailers such as Walmart can obtain more accurate information about demand than manufacturers through rich consumption data. Due to the poor transmission of market demand information, manufacturers may overestimate or underestimate the impact of CSR input on their own brand image, thus affecting their willingness to invest in CSR. Therefore, in the case of asymmetric market demand information of manufacturers, it is of great theoretical significance and practical value to discuss the CSR input and recycling decision making of member enterprises of CLSC for promoting environmental protection and sustainable development.
Motivated by above observations, we focus on the following primary questions for CLSC:
(1)
How does the sensitivity coefficient of consumer CSR input affect the CLSC members and the overall operation?
(2)
How does the asymmetric demand information of the manufacturer affect the profits and recycling strategies of CLSC members?
(3)
Under the asymmetric market demand information of manufacturer, what is the best CSR input and recycling strategy for CLSC?
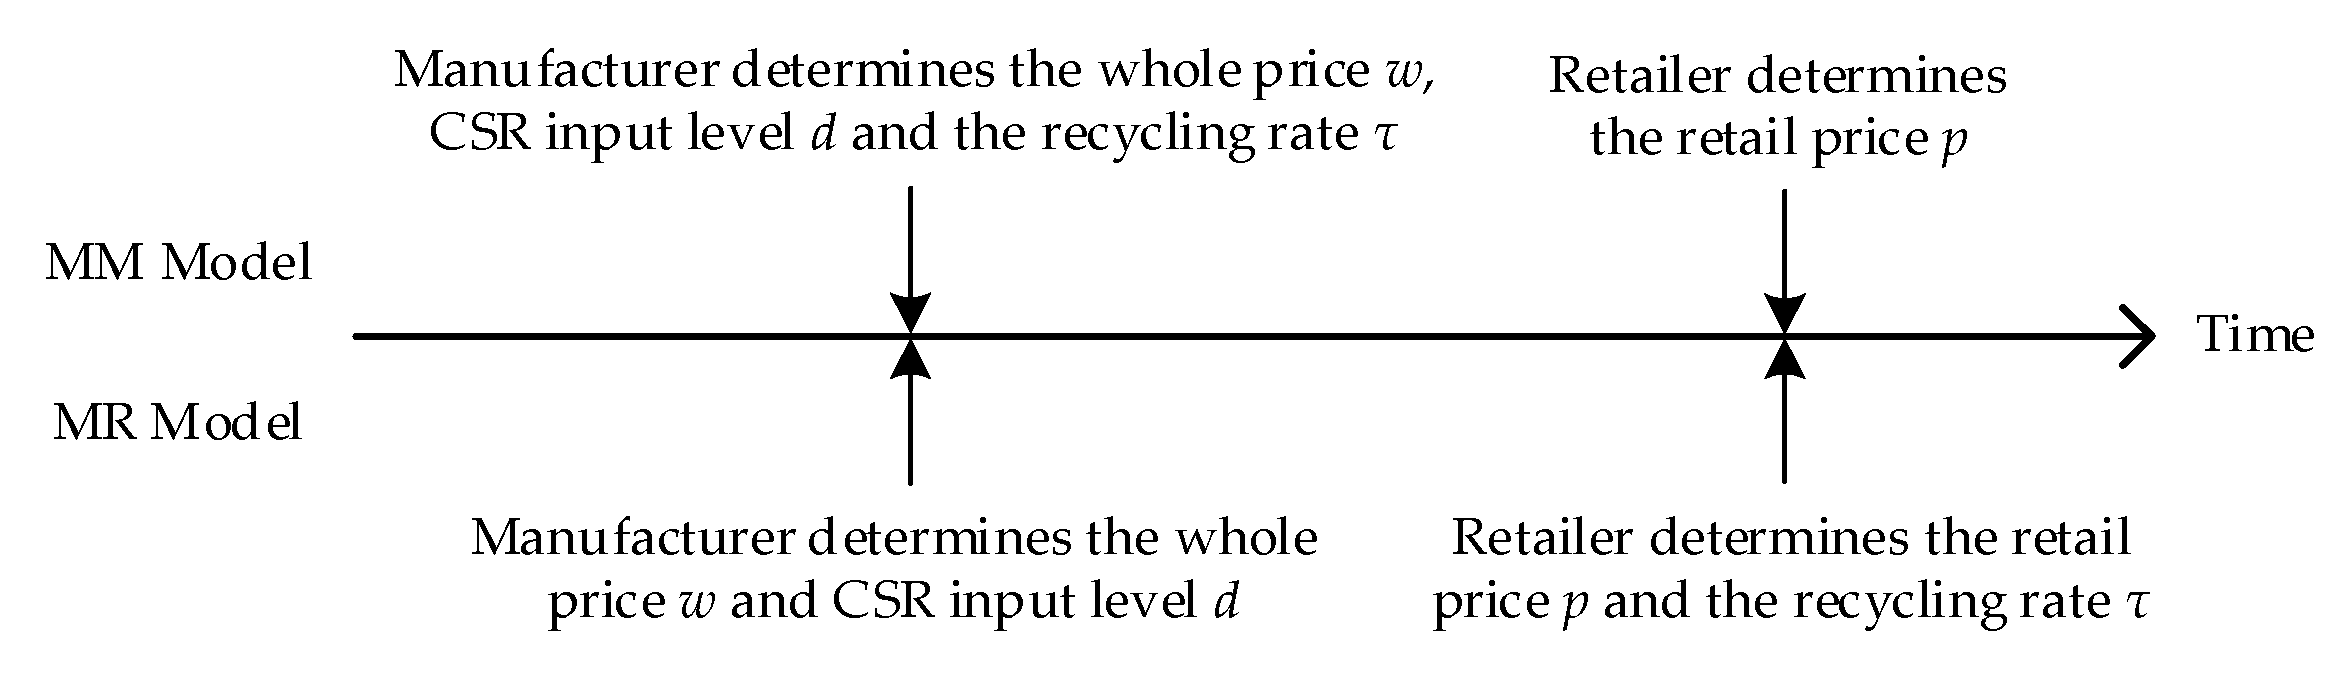
To address these problems, in a CLSC system consisting of a manufacturer and a retailer, we consider the manufacturer collection options: The manufacturer directly collect or delegates the retailer to collect and the different members who invest in CSR: the manufacturer or the retailer. Based on this, we establish four Stackelberg game models. Next, we use numerical simulation to explore the impact of factors such as consumer sensitivity coefficients and CSR input levels on product return rate and members’ profits. Finally, the interaction between CSR inputs and manufacturer’s collection choices in the context of demand information asymmetry is further explored.
Compared to previous studies, the primary innovations of our paper are reflected in the following aspects: First, in the case of asymmetric demand information, the decision-making models in CLSC when both the manufacturer and retailer carry out CSR input and recycling are constructed, and the influence of different CSR input strategies on the operation of CLSC are analyzed. Second, the impact mechanism of the consumer CSR input sensitivity coefficient and manufacturer demand information asymmetry on the product pricing, waste product recycling rate, CSR input level, and performance of CLSC are revealed. Third, the optimal CSR input and recycling channel selection strategy for CLSC under asymmetric demand information are established.
The remaining sections of our paper are structured as follows: In Section 2, we review the pertinent literature. We introduce the pertinent hypotheses and symbols used of our paper in Section 3. In Section 4, we establish game models and solve the optimal equilibrium results. We analyze the equilibrium results in Section 5. In Section 6, we carry out numerical simulation analysis. We present the key conclusions along with suggestions for additional research in Section 7.

2. Literature Review

The literature closely related to this paper mainly involves three aspects: recycling channel selection in CLSC, CSR behavior in CLSC, and supply chain information asymmetry.

2.1. Recycling Channel Selection in CLSC

Recycling channel selection and optimization has always been one of the hot research issues in CLSC, and abundant research results have been obtained. Savaskan et al. [6] first discussed the three recycling modes of CLSC and pointed out that for manufacturer, the recycling effect implemented by the retailer is better. Subsequently, an increasing number of scholars began to focus on the study of recycling channel in CLSC. Huang et al. [17] studied the optimal pricing decisions of retailers and third parties in the competitive recycling of waste products and made a comparative analysis of dual-channel recycling and single-channel recycling. Shi et al. [18] constructed three different recycling remanufacturing modes, analyzed the results of the three modes, and pointed out that different subjects choose different recycling modes. Feng et al. [19] researched the design and coordination of a reverse supply chain with dual recycling channels, considering consumer behavior, and showed that mixed recycling channels are always better than single recycling channels. Wang et al. [20] studied the recycling channel selection and pricing of manufacturers and found that the recycling channel selection depends on the recycling cost and the recycling compensation when outsourcing recycling. Yang et al. [21] discussed the conditions under which a manufacturer chooses a third-party recycle or a retailer recycle. Wang et al. [22] compared and analyzed the optimal decisions of sales mode and recovery mode in the E-CLSC. Cao et al. [23] studied the optimal recycling strategy for a manufacturer under the EPR Regulations. Zhang et al. [24] analyzed the impact of government policies on power battery recycling under different recycling modes. Wan et al. [25] examined the impact of government intervention on CLSC recycling under differential recycling strategies. Huang et al. [26] conducted a comparative analysis by constructing three differential game models, including manufacturer recycling, retailer recycling, and third-party recycling and found that manufacturer-led recycling is the optimal choice. Miao et al. [27] investigated the influence of different sales models on a manufacturer’s recycling strategy selection. Their findings indicate that agency sales can effectively mitigate the double marginalization effect within the CLSC and reduce the costs associated with direct manufacturer recycling.
The above literature studied different recycling channel selection strategies in CLSC and the impact of different recycling channels on the recycling rate and system operation performance but did not discuss the impact of CSR input on the operation of CLSC.

2.2. CSR Behavior in CLSC

In recent years, academics and industries are increasingly concerned about the fulfillment of CSR, which is developing into a sustainable development strategy for enterprises. Ni et al. [28,29] studied how two supply chain members interact in terms of CSR behavior. Modak et al. [30] believed that CSR input is a kind of social donation behavior and introduced the CSR into the two-level supply chain to study the selection and coordination of recycling channels. As the relevant research develops, some scholars have begun to focus on the study of CSR behavior in CLSC. The existing literature on CSR in CLSC can be roughly divided into two categories, which are distinguished by the different models used to portray CSR behavior. One type of research focuses on the issue of CSR behavior awareness, such as that of Panda et al. [10], which introduced CSR behavior into CLSC modeling earlier, finding that the recycling of waste products is also the embodiment of CSR fulfillment by enterprises and pointing out that CSR behavior of enterprises can help improve the overall performance of CLSC. Wang et al. [31] examined how the CSR coefficient, fairness concerns, and government subsidies affect decision making by contrasting the ideal solutions of CLSC models. Wang et al. [32] investigated the influence of channel power structure on the CLSC, which consists of a CSR-conscious manufacturer, a retailer with sales efforts, and a third party that takes on the responsibility for collecting used goods. Yi et al. [33], within the context of a trade-in-based CLSC, integrated financial constraints and CSR into their analytical framework to examine decision-making behaviors under various financing scenarios. Another type of research focuses on CSR input: Modak et al. [34] further studied the selection of optimal recycling channels in the CLSC under the manufacturer’s CSR input and designed two pricing coordination contracts. In recent years, many scholars have discussed the optimization of CLSC operations considering CSR from the perspective of CSR input. Liu et al. [11] discussed the decision-making and coordination problems of two competing retailers in terms of CSR input and pointed out that the retailer with CSR input will obtain more profits than the retailer without CSR input. Mondal et al. [35] studied the CSR input behavior of retailers, established the centralized and decentralized decision models according to three different recycling models of waste products, and discussed the influence of retailers’ CSR on the optimal decision. Taking CSR behavior into account, Chen et al. [36] investigated the equilibrium strategies for a dyadic CLSC consisting of one manufacturer, one fairness-concerned retailer, and one capital-constrained recycler in the static and dynamic frameworks, respectively. Liu et al. [37] explored the incentive strategies for CSR recyclers to outperform and how the equilibrium is affected by the recyclers’ Stackelberg game. The above literature discusses issues such as CSR behavior awareness and input decision of the supply chain from different perspectives, but only a few scholars have studied demand information asymmetry, such as Vosooghidizaji et al. [38], who studied the problem of coordinating CSR in a dyadic supply chain when a supplier and a manufacturer, two independent entities, commit CSR activities while both possessing private CSR cost information, which constitutes bilateral information asymmetry. Consistent with the above, our study is primarily related to CSR input. However, the recycling decision making of CLSC with CSR under asymmetric demand information is not discussed in the above literature.

2.3. Supply Chain Information Asymmetry

Research on information asymmetry in supply chains mainly focuses on the upstream and downstream enterprises, including demand information asymmetry, cost information asymmetry, etc. For the research on cost information asymmetry, Ma et al. [39] designed the wholesale price contract under the background of asymmetric CSR effort cost information. Vosooghidizaji et al. [38] explored the mechanisms of interaction between upstream and downstream firms’ CSR behaviors in the context of CSR cost information asymmetry (bilateral information asymmetry). Huang et al. [40] investigated the optimal contract design with countervailing incentives under asymmetric selling cost information in a dual-channel supply chain comprising a manufacturer and retailer. Regarding asymmetric demand information, Li et al. [41] designed the wholesale price contract without sharing information and the two-part pricing contract with sharing information and pointed out that the two-part pricing contract can be the dominant choice under certain conditions. Mobini et al. [42] studied how suppliers design the optimal contract when retailers have private information about customer demand and cost parameters. Considering the double information asymmetry of manufacturers’ demand information and green impact efforts, Xia et al. [43] designed a menu contract to ensure manufacturers’ profitability and compliance with environmental responsibility. Xu et al. [44] discussed the channel encroachment and carbon reduction strategies of the production enterprise under no information and information asymmetry. Meanwhile, some scholars have begun to study the problem of information asymmetry in CLSC. For example, Suvadarshini et al. [45] studied the impact of reverse channel competition, individual rationality, and information asymmetry on multi-channel CLSC design. Xie et al. [46] investigated the complexity of decision-making outcomes in e-commerce-based CLSC, focusing on scenarios involving information asymmetry between different supply chain entities. Wang et al. [47] discussed information sharing strategies in a CLSC comprising three echelons and dual channels and pointed out the optimal strategy for information sharing by the retailer. Zhao et al. [48] examined the effects of information asymmetry on green advertising strategies for remanufactured products within CLSC and revealed that, under conditions of information asymmetry, manufacturers with high green advertising return (GAR) efficiency may strategically mimic those with lower GAR efficiency to gain competitive advantage. Zhao et al. [49] also investigated the channel invasion strategies within dual-channel CLSC under conditions of information asymmetry and indicated that information asymmetry may adversely affect high-type retailers, potentially undermining their competitive position in the CLSC.
The above literature discusses the issues of supply chain pricing, recycling decisions, and coordination contract design under asymmetric demand information; however, as far as we know, no studies have been found that discuss the CSR input and recycling decision of CLSC under asymmetric demand information. The summary of the relevant literature and comparison with this paper are shown in Table 1.
The existing literature has contributed fruitful research on the selection and design of recycling channels, CSR behavioral awareness, and input in CLSC. However, most previous studies have assumed that channel information between CLSC members is symmetric, ignoring the impact of asymmetric demand information on the decisions of CLSC members and overall. To the best of our knowledge, no research has been found that explores the CSR input and recycling decision problems of CLSC under asymmetric demand information as well as the impact mechanism of the consumer CSR input sensitivity coefficient and demand information asymmetry on the performance of CLSC system.

3. Problem Description and Assumptions

In this section, we consider a CLSC system consisting of one manufacturer and one retailer, in which two players belong to the Stackelberg game with the asymmetry of market demand information. The manufacturer, as the sales channel leader, is in the dominant position and responsible for the production of new products and the remanufacturing of waste products. The retailer, as the sales channel follower, is responsible for the sale of new and remanufactured products and has real information about market demand. Meanwhile, we also consider a reverse channel structure in which the manufacturer directly recycles or entrusts the retailer to recycle the waste products, also under asymmetrical manufacturer market demand information. Under the asymmetric market demand information of the manufacturer, four scenarios are considered: the manufacturer is responsible for CSR input and recycling (MM model), the manufacturer is responsible for CSR input and the retailer recycling (MR Model), the retailer is responsible for CSR input and the manufacturer recycling (RM model), and the retailer is responsible for CSR input and recycling (RR model). The specific CLSC structure is shown in Figure 1.
Other related symbols are described in Table 2.
Assumption 1.
There is no difference between new products and remanufactured products. In fact, by recycling used PET bottles, Coca-Cola reprocesses recycled bottles that are identical to the new products in terms of appearance and capabilities, and consumers cannot distinguish them when purchasing. Accordingly, we assume that the performance and appearance of products made utilizing waste parts and those made with new raw materials are the same (Savaskan et al. [6]; Choi et al. [50]).
Assumption 2.
Assume that market capacity  a  is the retailer’s private information, and the manufacturer’s forecast market capacity  γ = a 0 + ε . Consider that although there is diversity in consumer demand and purchasing behavior, it tends to converge around the mean overall, forming a symmetrical distribution. We believe that   ε  follows the normal distribution, ε ~ N ( 0 , v ) , and can be regarded as an indicator of prediction accuracy; the smaller   v  is, the higher the prediction accuracy will be, and the larger  v  is, the lower the prediction accuracy will be (Modak et al. [34]).
Assumption 3.
Assume that the recycling cost of waste products is  k τ 2 , which is quadratically related to the recycling rate of waste products. CSR input cost is  g d 2 , which is quadratically related to CSR input level (Mobini et al. [42]; Liu et al. [11]).
Assumption 4.
The market demand has a linear relationship with sales price and CSR input level (Liu et al. [11]). The retailer’s known market demand is  Q = a b p + θ d , while the market demand predicted by the manufacturer is  Q = γ b p + θ d , which are negatively proportional to the selling price per unit of products but positively proportional to the CSR input level. For simplicity of calculation, it is assumed that all mentioned factors are linearly correlated with Market demand, although the reality is likely to be more complex.

4. Model Construction and Solution

In this section, we give the game order of the participants in CLSC, as shown in Figure 2 and Figure 3, and establish the profit functions of manufacturer and retailer in each model. Finally, we obtain the optimal equilibrium results by using backward induction. This section focuses on solving the equilibrium results in each model. Their theoretical comparisons and visualizations are presented in Section 5 and Section 6, which further details their meaning.

4.1. MM Model

In the MM model, the manufacturer is responsible for CSR input, new product production, and waste product remanufacturing, and the retailer is responsible for product sales. The decision sequence CLSC is as follows: First, the manufacturer determines the wholesale price w , CSR input level d , and the recycling rate τ of waste products; then, the retailer decides the retail price p of the product. At this time, the expected profit functions of manufacturer and retailer are as follows:
m a x ( w , τ , d )   E ( Π m M M ) = E [ ( w C m ) ( γ b p + θ d ) + ( C m C r ) τ ( γ b p + θ d ) k τ 2 g d 2 ]
m a x ( p )   E ( Π r M M ) = E [ ( p w ) ( a b p + θ d ) ]
In Equation (1), the first term is the manufacturer’s sales revenue from wholesale of the products; the second term is the indirect benefit generated by the manufacturer through the recycling of the products, which shows the production cost savings due to remanufacturing; the third term is the collection investment cost for establishing reverse channel; and the last term is the CSR input cost for the manufacturer. Equation (2) represents the retailer’s sales revenue.
The relevant equilibrium results obtained by solving using the reverse recursion method are shown in the first column of Table 3. See Appendix A for the specific solution and proof process.

4.2. MR Model

In the MR model, the manufacturer is responsible for the CSR input, production of new products, and remanufacturing of used products, while the retailer is responsible for the recycling of used products and sales of new products and remanufactured products. The decision sequence CLSC is as follows: First, the manufacturer determines the wholesale price w and CSR input level d , and then, the retailer decides the retail price p and the recycling rate τ . At this time, the expected profit functions of manufacturer and retailer are as follows:
m a x ( w , d )   E ( Π m M R ) = E [ ( w C m ) ( γ b p + θ d ) + ( C m C r m ) τ ( γ b p + θ d ) g d 2 ]
m a x ( p , τ )   E ( Π r M R ) = E [ ( p w + m τ ) ( a b p + θ d ) k τ 2 ]
In Equation (1), the first term is the manufacturer’s sales revenue from wholesale of the products; the second term is the indirect benefit generated by the manufacturer through the recycling of the products, which shows the production cost savings due to remanufacturing; and the last term is the CSR input cost for the manufacturer. In Equation (2), the first term is the retailer’s sales revenue, and the second term is the collection investment cost for establishing reverse channel. Similar to the treatment in Section 4.1, using backward induction, it is easy to obtain the Hessian matrix of manufacturer’s profit with respect to w and d as
H M R = 4 k b ( b m ( C m C r ) 4 k ) ( b m 2 4 k ) 2 2 k θ ( b m ( m 2 C m + 2 C r ) + 4 k ) ( b m 2 4 k ) 2 2 k θ ( b m ( m 2 C m + 2 C r ) + 4 k ) ( b m 2 4 k ) 2 2 b 2 m 4 g + 4 k m 2 ( 4 b g θ 2 ) + 4 k θ 2 m ( C m C r ) 32 g k 2 ( b m 2 4 k ) 2
Under the assumption of the scale parameter k , it is known that the Hessian matrix is negative and definite. The equilibrium result under the condition that the manufacturer is responsible for CSR input and the retailer recycles can be obtained according to the first-order condition. The relevant equilibrium results obtained by solving using the reverse recursion method are shown in the second column of Table 3.

4.3. RM Model

In the RM model, the retailer is responsible for the CSR input and sales of new products and remanufactured products, while the manufacturer is responsible for the recycling of used products, production of new products, and remanufacturing of used products. The decision sequence CLSC is as follows: First, the manufacturer determines the wholesale price w and the recycling rate τ ; then, the retailer decides the retail price p and CSR input level d . At this time, the expected profit functions of manufacturer and retailer are as follows:
m a x ( w , τ )   E ( Π m R M ) = E [ ( w C m ) ( γ b p + θ d ) + ( C m C r ) τ ( γ b p + θ d ) k τ 2 ]
m a x ( p , d )   E ( Π r R M ) = E [ ( p w ) ( a b p + θ d ) g d 2 ]
In Equation (1), the first term is the manufacturer’s sales revenue from wholesale of the products; the second term is the indirect benefit generated by the manufacturer through the recycling of the products, which shows the production cost savings due to remanufacturing; and the last term is the collection investment cost. In Equation (2), the first term is the retailer’s sales revenue, and the second term is the CSR input cost for the retailer. Similar to the treatment in Section 4.1, using backward induction, it is easy to obtain the Hessian matrix of the manufacturer’s profit with respect to w and τ as
H R M = 4 b 2 g 4 b g θ 2 2 b 2 g ( C m C r ) 4 b g θ 2 2 b 2 g ( C m C r ) 4 b g θ 2 2 k
Under the assumption of the scale parameter k , it is known that the Hessian matrix is negative and definite. The equilibrium result under the condition that the retailer is responsible for CSR input and the manufacturer recycles can be obtained according to the first-order condition. The relevant equilibrium results obtained by solving using the reverse recursion method are shown in the second column of Table 4.

4.4. RR Model

In the RR model, the retailer is responsible for CSR input, waste product recycling, and new product sales, while the manufacturer is responsible for new product production and waste product remanufacturing. The decision sequence CLSC is as follows: First, the manufacturer determines the wholesale price w , and then, the retailer decides the retail price p , CSR input level d , and the recycling rate τ . At this time, the expected profit functions of manufacturer and retailer are as follows:
m a x ( w )   E ( Π m R R ) = E [ ( w C m ) ( γ b p + θ d ) + ( C m C r m ) τ ( γ b p + θ d ) ]
m a x ( p , d , τ )   E ( Π r R R ) = E [ ( p w + m τ ) ( a b p + θ d ) k τ 2 g d 2 ]
In Equation (1), the first term is the manufacturer’s sales revenue from wholesale of the products; the second term is the indirect benefit generated by the manufacturer through the recycling of the products, which shows the production cost savings due to remanufacturing. In Equation (2), the first term is the revenue from retailer’s sales and recycling; the second term is the collection investment cost; and the last term is the CSR input cost for the retailer. Similar to the treatment in Section 4.1, using backward induction, the second derivative of easy manufacturer’s profit with respect to w is d 2 Π m R R d w 2 = 4 k g b 2 Δ 11 ( b 2 m 2 g 4 b g k + θ 2 k ) 2 < 0 .
Under the assumption of the scale parameter k , it is known that the Hessian matrix is negative and definite. Therefore, the equilibrium result under the condition that the retailer is responsible for CSR input and self-recovery can be obtained according to the first-order condition. The relevant equilibrium results obtained by solving using the reverse recursion method are shown in the first column of Table 4.

5. Equilibrium Result Analysis

Property 1.
In the CLSC with asymmetric demand information, under the MM model, it satisfies  d M M * θ > 0 ,  τ M M * θ > 0 ,  w M M * θ > 0 ,  p M M * θ > 0 ,  Q M M * θ > 0 ,  Π m M M * θ > 0 ,  Π r M M * θ > 0 , and Π s M M * θ > 0 .
Property 1 shows that in the CLSC with asymmetric demand information, when the manufacturer is responsible for CSR input and recovers by itself, its CSR input level, waste product recycling rate, unit product wholesale price and sales price, and market demand are all positively correlated with the sensitivity coefficient of consumers’ CSR input. The increase of the sensitivity coefficient of consumers’ CSR input is conducive to the profits of the manufacturer and retailer.
In fact, the increase in the CSR input sensitivity coefficient of consumers not only prompts the manufacturer to increase the CSR input level but also increases wholesale prices, which can make up for the loss caused by CSR input. At the same time, the increase in wholesale prices will also lead retailers to increase sales prices, but it will not offset the positive effect of increasing the consumer CSR sensitivity coefficient and CSR input level on market demand. Therefore, market demand will increase, which will improve the profits of the manufacturer and retailer and enhance the enthusiasm of the manufacturer to recycle waste products and increase the recycling rate of waste products. Therefore, from the perspective of the government and enterprises, continuous cultivation and guidance of consumers’ CSR input sensitivity is one of the effective means for improving the recycling rate of waste products and achieving environmental protection.
Property 2.
In the CLSC with asymmetric demand information, under the MR model, it satisfies  d M R * θ > 0 ,  τ M R * θ > 0 ,  w M R * θ > 0 ,  p M R * θ > 0 ,  Q M R * θ > 0 ,  Π m M R * θ > 0 ,  Π r M R * θ > 0 , and  Π s M R * θ > 0 .
Property 2 shows that in the CLSC with asymmetric demand information, when the manufacturer is responsible for CSR input, and the retailer recycles, the manufacturer’s CSR input level, waste product recycling rate, unit product wholesale price and selling price, market demand, and the profits of the manufacturer and retailer are all positively correlated with the sensitivity coefficient of consumers’ CSR input.
It can be seen from Property 2 that with the increase in the CSR input sensitivity coefficient of consumers, the CSR input level of manufacturer, the recycling rate of waste products, the wholesale and selling price of unit product, the market demand, and the profits of the manufacturer and retailer all increase. In fact, the greater the CSR input sensitivity coefficient of consumers, the more willing consumers will be to buy the products of CSR enterprises, so enterprises will be motivated to respond to consumers’ purchasing behavior by increasing the level of CSR input so as to form a good positive cycle. At the same time, the increase in the CSR input level of enterprises will also bring a corresponding cost expenditure. Therefore, enterprises will increase revenue by appropriately raising product prices on the one hand and increase the recycling rate of waste products on the other hand to reduce production costs. As prices rise in tandem with demand, both the manufacturer and retailer gain more. Therefore, the increase of consumers’ CSR input sensitivity coefficient can indirectly promote enterprises’ CSR input level, increase the recycling rate of waste products, and improve the overall performance of member enterprises and CLSC system. Similar to Panda et al. [10], the implementation of CSR by the manufacturer not only promotes more efficient recycling of used products by retailer but also positively affects channel members’ profits. It can be seen that despite the asymmetric demand information, CSR investment still has a positive effect on market demand and firms’ profitability.
Property 3.
In the CLSC with asymmetric demand information, under the RM model, it satisfies  d R M * θ > 0 ,  τ R M * θ > 0 ,  w R M * θ < 0 ,  p R M * θ > 0 ,  Q R M * θ > 0 ,  Π m R M * θ > 0 ,  Π r R M * θ > 0 , and Π s R M * θ > 0 .
Property 3 shows that in the CLSC with asymmetric demand information, when the retailer is responsible for CSR input, and the manufacturer recycles, with the increase in consumers’ CSR input sensitivity coefficient, the retailer’s CSR input level, recycling rate of waste products, selling price, and market demand will all increase, while the wholesale price of unit product will decrease, and the profits of the manufacturer and retailer will also increase; all of them increase with the increase in the sensitivity coefficient of consumer CSR input.
It can be seen from Property 3 that the increase in the CSR input sensitivity coefficient of consumers not only promotes the retailer to increase the CSR input level but also increases consumers’ willingness to buy products of enterprises with CSR input behavior. Therefore, while promoting the increase in product selling price, the manufacturer is forced to reduce the wholesale price. Therefore, the increase in the CSR input sensitivity coefficient of consumers is more conducive to CSR inputs benefit. The increase in sales price will not offset the positive effect on market demand brought by the increase in CSR input level and the increase in consumers’ purchase intention. Therefore, market demand will increase, which will improve the profits of the manufacturer and retailer and increase the enthusiasm of the manufacturer to recycle waste products and the recycling rate of waste products.
Property 4.
In the CLSC with asymmetric demand information, under the RR model, it satisfies  w R R * θ < 0 ,  d R R * θ > 0 ,  τ R R * θ > 0 ,  p R R * θ > 0 ,  Q R R * θ > 0 ,  Π m R R * θ > 0 ,  Π r R R * θ > 0 , and Π s R R * θ > 0 .
Property 4 shows that in the CLSC with asymmetric demand information, when the retailer is responsible for CSR input and recycling, with the increase in consumers’ CSR input sensitivity coefficient, the retailer’s CSR input level, recycling rate of waste products, selling price, and market demand will all increase, while the wholesale price of unit products will decrease, and the profits of both manufacturer and retailer will be equal. The sensitivity coefficient of CSR input increases with consumers.
It can be seen from Property 4 that the situation in which the retailer is responsible for CSR input and recycling is similar to Property 3. The increase in consumers’ CSR sensitivity coefficient is beneficial to the improvement in CSR input level, recycling rate of waste products, and overall performance of the CLSC system.
Property 5.
In the CLSC with asymmetric demand information, under the MM model, it satisfies  w M M * a 0 < 0 ,  p M M * a 0 < 0 ,  d M M * a 0 < 0 ,  τ M M * a 0 < 0 ,  Q M M * a 0 > 0 ,  Π r M M * a 0 > 0 , and Π s M M * a 0 > 0 Π m M M * a 0 > 0  when  a 0 < a ;  Π m M M * a 0 < 0  when  a 0 > a .
Property 5 shows that in the CLSC with asymmetric demand information, when the manufacturer is responsible for CSR input and recycling, the market demand will increase with the increase in the certain part of the manufacturer’s forecast market capacity, but the wholesale price, CSR input level, recycling rate of waste products, and selling price will all decrease. With the increase in the determining part of the market capacity of the manufacturer’s forecast, the retailer’s profit increases, and the manufacturer’s profit reaches the maximum when a = a 0 .
As can be seen from Property 5, in the case that the manufacturer is responsible for CSR input and recycling, when a 0 = a , the market capacity predicted by the manufacturer is equal to the real market capacity; that is, the manufacturer can accurately predict the real market capacity information market at this time, and the profits of the manufacturer and retailer and overall under asymmetry of demand information are equal to the profits under symmetry of market demand information. Therefore, the equilibrium result when a 0 = a can be taken as the equilibrium result under market demand information symmetry. When a 0 > a , the market demand and the overall profit of the CLSC system under asymmetric demand information are larger. However, under asymmetric demand information, the wholesale price, selling price, CSR input level, waste product recycling rate, and manufacturer’s profit are all lower. When a 0 < a , the market demand information is asymmetric; the profits of manufacturer and retailer are smaller than that when the market demand information is symmetric. However, under asymmetric demand information, the wholesale price, sales price, CSR input level, and waste product recycling rate are higher.
Property 6.
In the CLSC with asymmetric demand information, under the MM model, it satisfies  w M R * a 0 < 0 ,  p M R * a 0 < 0 ,  d M R * a 0 < 0 ,  τ M R * a 0 > 0 ,  Q M R * a 0 > 0 ,  Π r M R * a 0 > 0 , and Π s M R * a 0 > 0 .
Property 6 shows that in the CLSC with asymmetric demand information, when the manufacturer is responsible for CSR input, and the retailer recycles, the market demand and recycling rate of waste products will increase with the increase in the manufacturer’s prediction of market capacity, but the wholesale price, CSR input level, and sales price will all decrease. The retailer’s profit rises as the manufacturer’s forecast increases the portion of the market that determines capacity. Due to the complexity of the partial derivative analysis of the manufacturer’s profit on its market-forecast capacity, this paper further explores the numerical simulation part.
As can be seen from Property 6, in the case that the manufacturer is responsible for CSR input and recycling, when a 0 > a , compared with market demand information symmetry (that is, when a 0 = a ), the overall profit of market demand and CLSC system under asymmetric demand information is larger. However, under asymmetric demand information, the wholesale price, sales price, CSR input level, and waste product recycling rate are all lower. When a 0 < a , compared with market demand information symmetry (that is, when a 0 = a ), the overall profit of market demand and CLSC system under asymmetric demand information is lower. However, under asymmetric demand information, the wholesale price, sales price, CSR input level, and waste product recycling rate are all higher.
Property 7.
In the CLSC with asymmetric demand information, under the RM model, it satisfies  w R M * a 0 < 0 ,  p R M * a 0 < 0 ,  d R M * a 0 > 0 ,  τ R M * a 0 < 0 ,  Q R M * a 0 > 0 ,  Π r R M * a 0 > 0 , and  Π s R M * a 0 > 0 . Π m R M * a 0 > 0  when  a 0 < a ;  Π m R M * a 0 < 0  when  a 0 > a .
Property 7 shows that when the manufacturer’s demand information is asymmetric, the market demand and CSR input level will increase with the increase in the certain part of the manufacturer’s forecast market capacity, but the wholesale price, waste product recycling rate, and selling price will all decrease. With the increase in the determining part of the market capacity of the manufacturer’s forecast, the retailer’s profit increases, and when a = a 0 , the manufacturer’s profit reaches the maximum.
It can be seen from Property 7 that the retailer is responsible for CSR input, and the manufacturer recycles, similar to Property 5. The asymmetric demand information of the manufacturer will reduce its own profit. When the market-forecast capacity of the manufacturer is higher than the real market capacity, it is conducive to increasing the profit of the retailer. On the contrary, it will reduce the profit of the retailer.
Property 8.
In the CLSC with asymmetric demand information, under the RR model, it satisfies   w R R * a 0 < 0 ,  p R R * a 0 < 0 ,  d R R * a 0 > 0 ,  τ R R * a 0 > 0 ,  Q R R * a 0 > 0 ,  Π r R R * a 0 > 0 , and  Π s R R * a 0 > 0 .
Property 8 shows that in the CLSC with asymmetric demand information, when the retailer is responsible for CSR input and recycling, the market demand, CSR input level, and waste product recycling rate will increase with the increase in the manufacturer’s market-forecast capacity, but the wholesale price and selling price will decrease. As the manufacturer increases the capacity determination part of the market forecast, the retailer’s profit increases. Due to the complexity of the partial derivative analysis of manufacturer’s profit on its market-forecast capacity, this paper will further explore it in the numerical simulation part.
It can be seen from Property 8 that the situation in which the retailer is responsible for CSR input and recycling is similar to Property 6. Compared with the case of information symmetry, when the manufacturer’s predicted market capacity is higher than the true market capacity, the CSR input level, waste product recycling rate, market capacity, and the overall performance of CLSC system are all greater.
It can be seen from Properties 5–8 that the retailer’s profit increases with the a 0 increase, and when a 0 = a , the retailer’s profit at this time is just equal to the profit under the symmetry of market demand information. Therefore, Π r * ( a 0 > a ) > Π r * ( a 0 = a ) , and Π r * ( a 0 < a ) < Π r * ( a 0 = a ) ; it can be concluded that when the market-forecast capacity of the manufacturer is higher than the real market capacity, it is conducive to increasing the retailer’s profit and vice versa.
Proposition 1.
In the CLSC with asymmetric demand information, under four different situations, it satisfies  d M M * > d M R * > d R M * > d R R *  and  τ R M * > τ M M * > τ R R * > τ M R * .
Proposition 1 shows that the level of CSR input is highest when the manufacturer is responsible for CSR input and recycling, and the level of CSR input is lowest when the retailer is responsible for CSR input and recycling. When the retailer is responsible for CSR input, and the manufacturer recycles, the recycling rate of used products is the highest, and when the manufacturer is responsible for CSR input, and the retailer recycles, the recycling rate of used products is the lowest. This finding is contrary to the findings of Modak et al. [34]. This suggests that although the manufacturers do not have accurate information about market demand, the recycling of waste products is more efficient when the manufacturers invest in CSR and carry out recycling activities.
The above research conclusions reveal that regardless of whether the manufacturer or the retailer is responsible for CSR input, the recycling rate of the manufacturer is higher when the manufacturer is responsible for recycling. This is because the asymmetric information demand of the manufacturer leads to a lower profit in the forward supply chain. Thus, the manufacturer has stronger motivation to recycle, which is obviously conducive to its own recycling and remanufacturing. Therefore, in the CLSC with manufacturer asymmetric demand information, the operation mode in which the manufacturer is responsible for the recycling of waste products is more effective.
On the basis of information symmetry (Savaskan et al. [6] and Hong et al. [51]), the retailer-recycling model is considered to be superior to the manufacturer-recycling model when CSR inputs are not taken into account. However, in the case of asymmetric demand information and CSR input of the manufacturer or the retailer, the research shows that compared with the retailer recycling mode, the recycling effect of waste products is better when the manufacturer is responsible for recycling. This also indicates that asymmetry of demand information and the difference in CSR input mode are some of the important factors affecting the selection of recycling channels in CLSC.
Proposition 2.
In the CLSC with asymmetric demand information, under four different situations, it satisfies  Q R M * > Q M M * > Q R R * > Q M R * .
Proposition 2 shows that the market demand is greatest when the retailer is responsible for CSR input, and the manufacturer recycles, while the market demand is minimum when the manufacturer is responsible for CSR input, and the retailer recycles. Regardless of whether the manufacturer or the retailer is responsible for CSR input, the market demand is greater when the manufacturer recycles the used products. In the manufacturer-led CLSC, CSR input by the channel follower is more conducive to increasing market demand.

6. Numerical Simulation Analysis

Due to the complexity of the equilibrium results in Section 2, we only compare prices, recovery rates, and demand in various models in the previous section. This section analyzes and verifies the above properties and propositions through numerical simulation and reveals the influence of the consumer CSR input sensitivity coefficient on the optimal decision and profit of each member of the CLSC. We further analyze and compare the profits of the manufacturer and the retailer in various models because the expression for the optimal profit is so complex that it is not compared in Section 4.
On the premise of satisfying the relevant parameter assumptions in Section 3 and guaranteeing the feasibility of solving the equilibrium results in Section 4, for the sake of analysis and comparison, we refer to the parameter settings of Liu et al. [11], Modak et al. [35], Ma et al. [40], and Li et al. [42]. The values of the relevant parameters are assumed to be a = 100 , a 0 = 95 , b = 1 , C m = 6 , C r = 4 , k = 50 , g = 8 , and m = 0.2 (Liu et al. [11]). According to the relevant research results of this paper, the specific simulation results are shown in Figure 4, Figure 5, Figure 6, Figure 7, Figure 8, Figure 9, Figure 10, Figure 11, Figure 12, Figure 13, Figure 14, Figure 15 and Figure 16.
As can be seen from Figure 4, under the four different situations, the CSR input level increases with the increase in consumers’ CSR sensitivity coefficient, and it meets d M M * > d M R * > d R M * > d R R * . Since the highest product selling price that consumers are willing to pay is related to the sensitivity coefficient of CSR input, and the level of CSR input is increasing, both the manufacturer and retailer have stronger motivation to increase the level of CSR input to increase their own profit, which also verifies the relevant conclusions of Proposition 1.
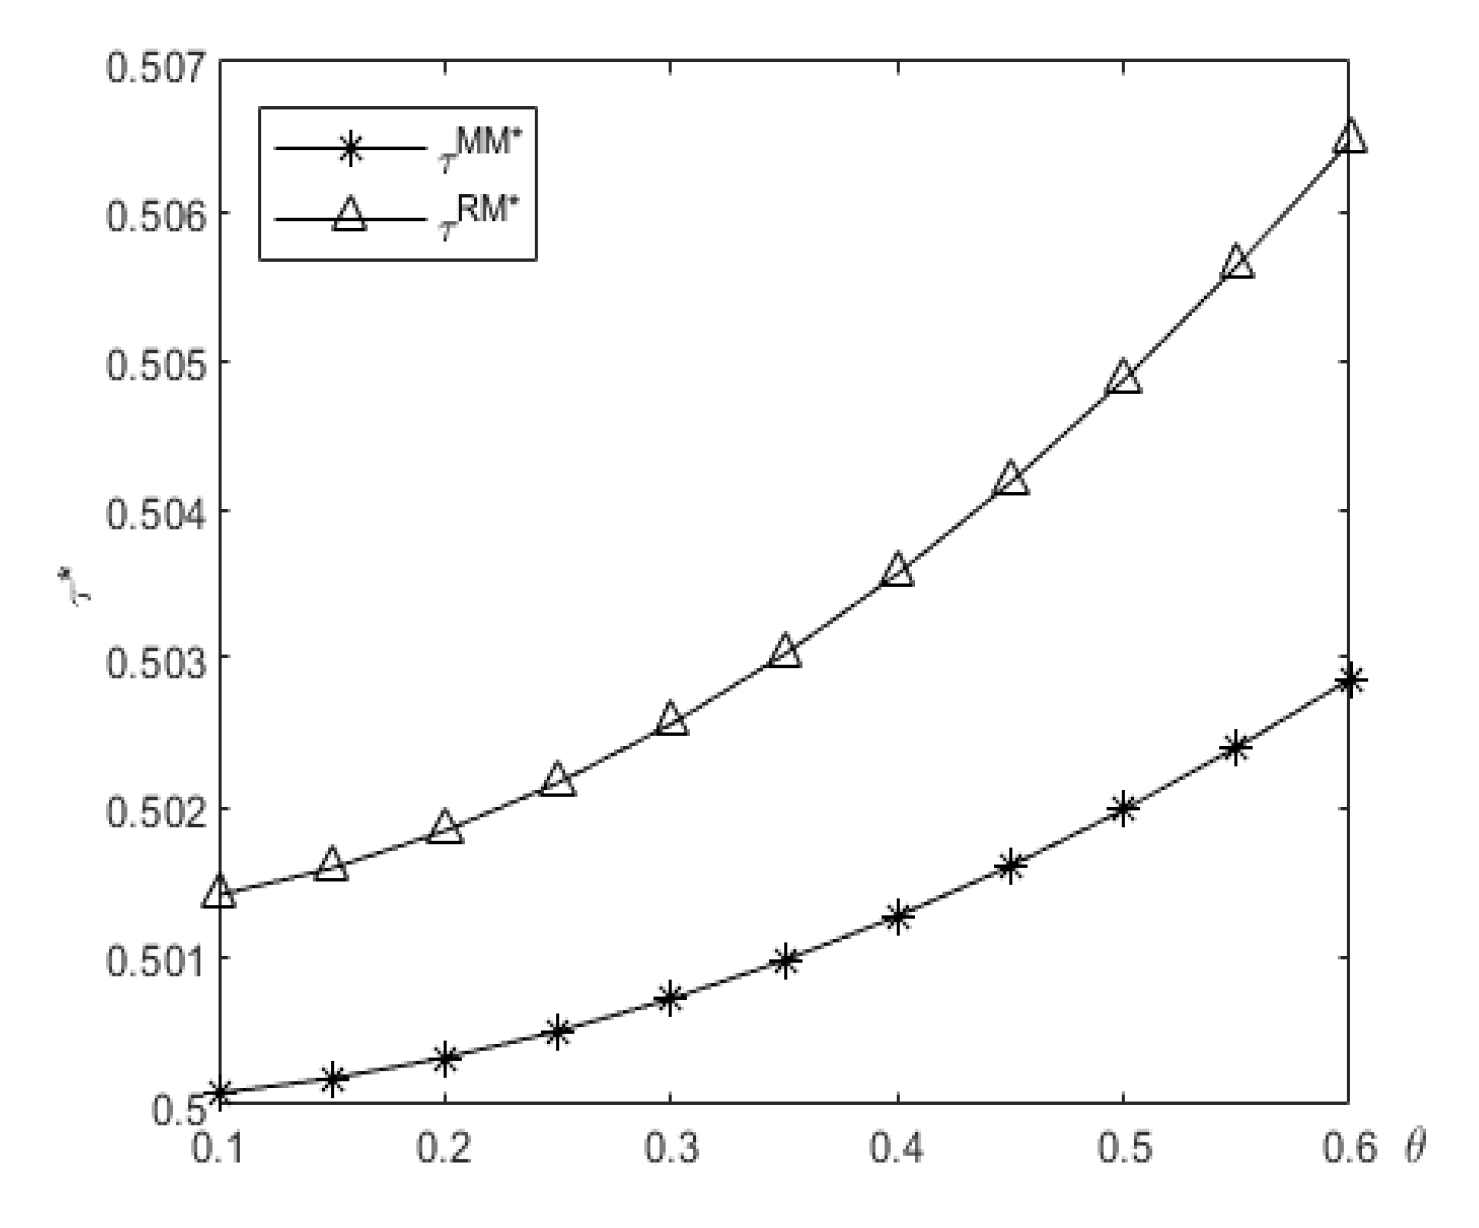
Counterintuitively, it can be seen from Figure 5 and Figure 6 that the recycling rate of waste products by the manufacturer is higher than that by the retailer. In the case of information symmetry, many previous studies have pointed out that “because retailers are closer to consumers than manufacturers, it is better for manufacturers to be responsible for recycling by retailers”, while this paper shows that the demand information of the manufacturer is incorrect. In this case, whether the manufacturer or the retailer is responsible for CSR input, the recycling effect by the manufacturer is better, which also validates the relevant conclusions of Proposition 1.
For w * and p * without analytical solution comparative analysis, we add a set of data with a 0 = 100 and draw Figure 7 and Figure 8. By adding a set of data for comparison, it can be found that the change of a 0 does not change the trend of graph change and the relative size relationship. From Figure 7 and Figure 10, it is clear that w M R * > w R R * > w M M * > w R M * , and with the increase of consumers’ CSR input sensitivity coefficient, the CSR input by the manufacturer is conducive to increasing wholesale prices, thus making up for the losses caused by CSR input. On the contrary, when the retailer makes CSR inputs, the manufacturer will reduce wholesale prices to make up for the losses caused by retailer’s CSR input. This also confirms the relevant conclusion of Property 3. As can be seen from Figure 6 and Figure 7, p M R * > p R R * > p M M * > p R M * , and the sales price of new products will increase in four different situations with the increase in consumers’ CSR sensitivity coefficient. However, when the retailer is responsible for CSR input, the sales price will increase faster because when the retailer is responsible for CSR input, it will increase the sales price to offset the loss caused by CSR input, while when the manufacturer is responsible for CSR input, the manufacturer will increase the sales price. The loss caused by CSR input will be offset by increasing wholesale prices, which will lead the retailer to increase the selling prices of products. As can be seen from Figure 11, Q R M * > Q M M * > Q R R * > Q M R * , and the increase in CSR input sensitivity coefficient of consumers is conducive to increasing market demand. This is because with the increase in the CSR input sensitivity coefficient of consumers, both the manufacturer and retailer choose to maximize their profit by increasing CSR input level, and at the same time, the increase in CSR input level will stimulate market demand.
Corollary 1.
It can be seen from Figure 4, Figure 9 and Figure 11 that market demand mainly depends on sales price, while consumer CSR sensitivity coefficient and CSR input level are only secondary influencing factors on market demand.
For Π m * and Π r * without analytical solution comparative analysis, we add a set of data with a 0 = 100 and draw Figure 13 and Figure 15. As can be seen from Figure 12 and Figure 13, the recycling of waste products by the manufacturer is more conducive to maximizing its own profit. This finding is consistent with the finding of Mondal et al. [36] that when retailers invest in CSR activities, it is more beneficial for manufacturers to directly recycle used products for their own profits. And we further find that the increase in consumers’ CSR input sensitivity coefficient is conducive to the manufacturer obtaining a higher profit. As can be seen from Figure 14 and Figure 15, Π r R M * > Π r M M * > Π r R R * > Π r M R * , and in any case, the increase in consumers’ CSR input sensitivity coefficient is conducive to the retailer obtaining greater profit. It can be further seen from Figure 12, Figure 13, Figure 14 and Figure 15 that when the retailer is responsible for the CSR input, and the manufacturer recycles, it is more conducive to realizing the overall profit of the CLSC system. This finding is consistent with Mondal et al. [35]: when retailers invest in CSR activities, it is more beneficial for manufacturers to directly recycle used products for their own profits. This also indicates that under asymmetric manufacturer information, the manufacturer’s responsibility for recycling waste products is not only conducive to improving the recycling rate of waste products but also conducive to increasing the overall performance of the CLSC. The channel follower’s responsibility for CSR input is conducive to increasing the market demand and the overall performance of CLSC. This also reveals that the asymmetry of the manufacturer demand information has a certain impact on the recycling channel but has a low impact on the selection of CSR input members.
As can be seen from Property 5, Property 7 and Figure 14, when the market capacity predicted by the manufacturer is equal to the real market capacity (that is, when the market demand information is symmetric), the manufacturer’s profit reaches the maximum. Therefore, when the market capacity predicted by the manufacturer is not equal to the real market capacity, the manufacturer’s profit is lower than the manufacturer’s profit under the information symmetry, so it is compared with the information symmetry. The asymmetric demand information of the manufacturer will lead to a reduction in its own profit. This also indicates that timely and accurate market demand information is particularly critical for the manufacturer. Manufacturers should constantly strengthen cooperation with retailers to improve the ability to obtain market demand information, which will help improve their own performance and maintain the stable operation of CLSC.

7. Conclusions

In the real business environment, asymmetric information is a commonly occurring phenomenon, especially asymmetric demand information. Retailers have more comprehensive information about demand than manufacturers do. For the manufacturer of CLSC, a comprehensive understanding of market demand information is conducive to product pricing, the selection of recycling strategies, and CSR investment decisions, thereby enhancing the efficiency of the company’s operational decision making. Consequently, in the case of a manufacturer having asymmetric market demand information, this paper constructed four CLSC decision models for CSR input and recycling decision making of a CLSC consisting of a dominant manufacturer and a retailer. Then, we analyzed the impact of the consumer CSR input sensitivity coefficient and asymmetric demand information on the optimization of CLSC and drew the following conclusions: (1) Regardless of the combination strategy of CSR input and recycling channel, the increase in consumers’ CSR input sensitivity coefficient is conducive to improving the CSR input level and market demand of CLSC and improving the profits of the manufacturer and retailer. (2) The level of CSR input is the highest when the manufacturer is responsible for CSR input and recycles, and the market demand is the highest when the retailer is responsible for CSR input, and the manufacturer recycles. (3) It is counterintuitive that the recycling rate of waste products is higher when the manufacturer is responsible for the recycling of waste products, and the asymmetry of the manufacturer’s market demand information leads it to be more inclined to recycle rather than entrust the recycling to retailers. (4) When the retailer is responsible for the CSR input, and the manufacturer recycles, the profit of both the manufacturer and the retailer is the highest. Therefore, for the CLSC as a whole, it is best to choose the operation mode in which the retailer is responsible for CSR input, and the manufacturer recycles. (5) Compared with the case of information symmetry, asymmetric demand information of the manufacturer will lead to a reduction in its own profit. When the manufacturer’s market-forecast capacity is higher than the real market capacity, it is beneficial to increase the retailer’s profit and vice versa.
Based on the above research conclusions, this paper draws the following management implications: First, in terms of the optimization of CLSC system operation, enterprises need to improve the overall performance of the CLSC by establishing a good CSR reputation and enhancing consumers’ CSR input sensitivity. A good CSR corporate reputation can effectively reduce the negative impact of information asymmetry. When a company actively fulfills its social responsibility and discloses information about its environmental protection initiatives and product recycling process, it can enhance the trust of consumers and partners and obtain more significant feedback from the market. Secondly, as a regulator, the government can further improve the differentiated incentive mechanism for CSR investment and implement tax reduction and subsidy policies to varying degrees according to the different CSR investments of enterprises. At the same time, it should encourage enterprises to disclose CSR using emerging technologies such as blockchain to prevent greenwashing and false advertising. These policies and measures can significantly change the cost–benefit structure of enterprises, stimulate enterprises to take the initiative to invest resources to improve the recycling network and optimize production processes, and encourage enterprises to take the initiative to assume environmental protection responsibilities and social public service functions while pursuing economic benefits. Finally, manufacturers should strengthen cooperation with retailers through the construction of data sharing platforms, the establishment of joint forecasting mechanisms, etc., which can accurately capture market demand dynamics. As an important bridge between manufacturers and consumers, retailers who fulfill CSR can gain consumer trust and brand loyalty, which leads to an increase in market share and sales performance. Deepening cooperation between upstream and downstream enterprises is beneficial for improving their own performance and maintaining the stable operation of CLSC.
This paper only considers game models for CLSC with a single recycling mode under the background of information asymmetry. In the future, third-party recycling can be further introduced, and the CSR investment decision-making problem of CLSC under different mixed recycling modes can be studied. In addition, exploring CSR investment and information disclosure strategies in CLSC under information asymmetry is also a future research direction.

Author Contributions

Conceptualization, M.N., W.B. and F.Y.; data curation, W.B.; formal analysis, X.Q.; funding acquisition, F.Y.; investigation, M.N.; methodology, W.B.; project administration, M.N., W.B. and F.Y.; resources, W.B. and F.Y.; software, X.Q.; supervision, F.Y.; validation, M.N., W.B., X.Q. and F.Y.; visualization, X.Q.; writing—original draft, M.N., W.B. and F.Y.; writing—review and editing, M.N., W.B. and F.Y. All authors have read and agreed to the published version of the manuscript.

Funding

This research was supported from the Heilongjiang Provincial Natural Science Foundation of China (No. LH2023G016).

Data Availability Statement

The original contributions presented in this study are included in the article material. Further inquiries can be directed to the corresponding author.

Acknowledgments

The authors appreciate the valuable comments and constructive suggestions of the reviewers. These comments and suggestions were very useful in the improvement of the presentation of this paper.

Conflicts of Interest

The authors declare that there are no conflicts of interest regarding the publication of this study.

Appendix A

Proof of Theorem 1 and 3.
The proof process of Theorem 3 is similar to Theorem 1, which is omitted here. The proof procedure is modeled as MM:
It can be seen 2 Π r M M p 2 = 2 from Equation m a x ( w , d , τ )   E ( Π r M M ) = E [ ( p w ) ( a b p + θ d ) ] that it is a concave function with respect to p . According to the first-order condition, the best feedback function of the retailer is p = a + θ d + b w 2 b since the manufacturer does not know the true value of a ; therefore, the manufacturer can only substitute the predicted value p = a 0 + θ d + b w + ε 2 b into Formula (1), and we can thus obtain
m a x ( p )   E ( Π m M M ) = E [ ( w C m ) ( γ b a 0 + θ d + b w + ε 2 b + θ d )     + ( C m C r ) τ ( γ b a 0 + θ d + b w + ε 2 b + θ d ) k τ 2 g d 2 ]
It is easy to find the Hessian matrix of Π m M M ( w , τ , d ) with respect to w , τ , d : H M M = b ( C m C r ) b 2 θ 2 ( C m C r ) b 2 2 k ( C m C r ) θ 2 θ 2 ( C m C r ) θ 2 2 g . Under the assumption of scale parameter k , b < 0 , b ( C m C r ) b 2 ( C m C r ) b 2 2 k = b 4 ( 8 k ( C m C r ) 2 b ) > 0 , and H 1 = 4 k b g + θ 2 k 2 + ( C m C r ) 2 b 2 g 2 < 0 , so the Hessian matrix is negative and definite. According to backward induction, the equilibrium results under the MM model can be obtained. □
Proof of Theorem 2 and 4.
The proof process of Theorem 4 is similar to Theorem 2, which is omitted here. The proof procedure is modeled as MR:
The Hessian matrix of retailer profit with respect to p , τ is easily obtained from Formula (4) as H 2 = 2 b m b m b 2 k . With the proof of Theorem 1, it is easy to obtain the Hessian matrix of manufacturer’s profit with respect to w , d as
H 3 = 4 k b ( b m ( C m C r ) 4 k ) ( b m 2 4 k ) 2 2 k θ ( b m ( m 2 C m + 2 C r ) + 4 k ) ( b m 2 4 k ) 2 2 k θ ( b m ( m 2 C m + 2 C r ) + 4 k ) ( b m 2 4 k ) 2 2 b 2 m 4 g + 4 k m 2 ( 4 b g θ 2 ) + 4 k θ 2 m ( C m C r ) 32 g k 2 ( b m 2 4 k ) 2
Under the assumption of scale parameter k , 4 k b ( 4 k b m ( C m C r ) ) ( 4 k b m 2 ) 2 < 0 , and H 3 = 4 k ( 2 m g b 2 ( C m C r ) 8 b g k + k θ 2 ) ( b m 2 4 k ) 2 > 0 , so the Hessian matrix is negative and definite. According to backward induction, the equilibrium result under the MR model can be obtained. □
Proof of Property 1.
According to Theorem 1, we can easily find
d M M * θ = k ( 2 Δ + a 0 b C m ) ( g b 2 Δ 0 2 + 8 b g k + k θ 2 ) ( g b 2 Δ 0 2 8 b g k + k θ 2 ) 2 > 0 , τ M M * θ = 2 b g k θ Δ 0 ( 2 Δ + a 0 b C m ) ( g b 2 Δ 0 2 8 b g k + k θ 2 ) 2 > 0 , w M M * θ = 2 g k θ ( 4 k b Δ 0 2 ) ( 2 Δ + a 0 b C m ) ( g b 2 Δ 0 2 8 b g k + k θ 2 ) 2 > 0 , p M M * θ = 2 k θ g ( 6 k b Δ 0 ) ( 2 Δ + a 0 b C m ) ( g b 2 Δ 0 8 b g k + k θ 2 ) 2 > 0 , Π m M M * θ = 2 g θ k 2 ( a 0 b C m ) ( 2 Δ + a 0 b C m ) ( g b 2 Δ 0 8 b g k + k θ 2 ) 2 > 0 .  
Proof of Property 2.
According to Theorem 2, it is easy to get
d M R * θ = ( ( m Δ ( C m C r ) + 2 k C m ) b 2 k ( 2 Δ + a 0 ) ) ( 2 m g b 2 ( C m C r ) 8 b g k k θ 2 ) 2 ( 2 m g b 2 ( C m C r ) 8 b g k + k θ 2 ) 2 > 0 , w M R * θ = g θ ( 2 k ( 2 Δ + a 0 b C m ) b m Δ ( C m C r ) ) ( 4 k b m ( 2 C m 2 C r m ) ) ( 2 m g b 2 ( C m C r ) 8 b g k + k θ 2 ) 2 > 0 , p M R * θ = 2 g θ ( 2 k ( 2 Δ + a 0 b C m ) b m Δ ( C m C r ) ) ( 3 k m b ( C m C r ) ) ( 2 m g b 2 ( C m C r ) 8 b g k + k θ 2 ) 2 > 0 , τ M R * θ = 2 g m b θ ( 2 k ( Δ 2 b C m ) b m Δ 1 ( C m C r ) ) ( 2 m g b 2 ( C m C r ) 8 b g k + k θ 2 ) 2 > 0 , Q M R * θ = 2 g b k θ ( 2 k ( 2 Δ + a 0 b C m ) b m Δ ( C m C r ) ) ( 2 m g b 2 ( C m C r ) 8 g b k + k θ 2 ) 2 > 0 .  
The proof of Properties 3 and 4 is similar to the proof of Properties 1 and 2 and is also omitted here.
Proof of Property 5.
According to Theorem 1, we can easily find
w M M * a 0 = g ( 4 k b Δ 0 2 ) g b 2 Δ 0 2 8 b g k + k θ 2 < 0 , p M M * a 0 = g b 2 Δ 0 2 + 4 k b g + k θ 2 2 b ( g b 2 Δ 0 2 8 b g k + k θ 2 ) < 0 , d M M * a 0 = θ k g b 2 Δ 0 2 8 b g k + k θ 2 < 0 , τ M M * a 0 = b g Δ 0 ( g b 2 Δ 0 2 8 b g k + k θ 2 ) < 0 , Q M M * a 0 = g b 2 Δ 0 2 4 k b g + k θ 2 2 g b 2 Δ 0 2 16 b g k + 2 k θ 2 > 0 , s , Π r M M * a 0 = 2 ( g b 2 ( 4 k C m + Δ 0 2 Δ ) + 4 a 0 b g k + k θ 2 Δ ) ( g b 2 Δ 0 2 + 4 b g k k θ 2 ) 4 b ( g b 2 Δ 0 2 8 b g k + k θ 2 ) 2 > 0 .  
Proof of Proposition 1.
According to Theorems 1–4, we can easily find
d M M * d M R * = b θ Δ 0 ( ( 2 g b k ( Δ 0 ( 2 Δ + a 0 ) 2 m a 0 ) k m θ 2 Δ g b 2 ( Δ 0 ( m Δ 0 Δ + 2 k C m ) 4 m k C m ) ) 2 ( g b 2 Δ 0 2 8 b g k + k θ 2 ) Δ 1 > 0 , d M M * d R M * = θ ( Δ 12 4 a g b Δ 7 ) ( Δ 7 k θ 2 ) 4 g b θ k Δ 7 ( 4 g b θ 2 ) ( 2 Δ + a 0 b C m ) 4 g b Δ 7 ( 4 g b θ 2 ) ( g b 2 Δ 0 2 8 b g k + k θ 2 ) > 0 , d M M * d R R * = 4 g b θ k Δ 10 Δ 14 ( 2 Δ + a 0 b C m ) + θ Δ 7 ( g b 2 Δ 0 2 8 b g k + k θ 2 ) 4 g b Δ 10 Δ 14 ( g b 2 Δ 0 2 8 b g k + k θ 2 ) > 0 , τ M M * τ R M * = θ 2 Δ 0 2 ( Δ + 2 g b k ( 2 Δ + a 0 b C m ) ) 2 Δ 7 ( Δ 7 k θ 2 ) < 0 , τ M M * τ R R * = 4 b g k Δ 10 Δ 14 Δ 0 ( 2 Δ + a 0 b C m ) m Δ 13 ( Δ 7 + k θ 2 ) 4 k Δ 10 Δ 14 ( Δ 7 + k θ 2 ) > 0 .  
Table A1. The additional parts of the more complex equilibrium ( Δ i > 0 ,   i   =   1 , 2 , 14 ).
SymbolDefinition
Δ 0 C m C r
Δ 1 2 m g b 2 Δ 0 8 g b k + k θ 2
Δ 2 m Δ 0 Δ + 2 k C m
Δ 3 4 k m Δ 2 ( 2 k b m 2 ) ( 8 g b k m 2 g b 2 m 2 Δ 0 + k θ 2 ( Δ 0 m ) )
Δ 4 4 g b 2 k 2 m 2 C m ( 2 a b C m ) ( 8 k b m 2 )
Δ 5 g b 3 m 2 ( 2 k C m m Δ 0 Δ ) 2 k g b 2 ( 4 k C m m 2 ( 2 Δ a 0 ) )
Δ 6 ( 2 g b ( 2 Δ + a 0 ) Δ θ 2 ) ( 8 b g k g b 2 Δ 0 2 2 k θ 2 ) + 4 g b 2 k C m ( 4 g b θ 2 )
Δ 7 8 b g k g b 2 Δ 0 2 2 k θ 2
Δ 8 g b ( 8 a 0 k g θ 2 ( m ( Δ 0 + m ) Δ 2 k C m ) )
Δ 9 k θ 4 Δ 2 g θ 2 k b ( 2 Δ a 0 )
Δ 10 4 b g k Δ 0 m g b 2 k θ 2
Δ 11 g b ( ( g b 3 m 2 ( 2 k C m m Δ 0 Δ ) ) 2 ( k g b 2 ( 4 k C m m 2 ( 2 Δ a 0 ) ) ) ) + k ( b Δ 8 Δ 9 ) )
Δ 12 ( 2 g b ( 2 Δ + a 0 ) Δ θ 2 ) ( Δ 7 g b 2 Δ 0 2 ) + 4 g b 2 k C m ( 4 g b θ 2 )
Δ 13 g b Δ 5 k b Δ 8 k Δ 9
Δ 14 4 g b k m 2 g b 2 k θ 2

References

  1. Official Journal of the European Union. Directive 2006/12/EC of the European Parliament and of the Council of 5 April 2006 on Waste. 2006. Available online: http://data.europa.eu/eli/dir/1975/442/2006-05-17 (accessed on 27 April 2006).
  2. Official Journal of the European Union. Directive 2008/98/EC of the European Parliament and of the Council of 19 November 2008 on Waste and Repealing Certain Directives. 2008. Available online: http://data.europa.eu/eli/dir/2008/98/oj (accessed on 28 November 2008).
  3. Ministry of the Environment, Government of Japan. Waste & Recycling. 2005. Available online: https://www.env.go.jp/en/laws/recycle/index.html (accessed on 7 March 2005).
  4. Global Mayor Magazine. U.S. Establishes Convenient e-Waste Recycling System. 2015. Available online: http://www.globalmayor.org/magazine-detail.aspx?id=375&classcode=007008 (accessed on 1 January 2015).
  5. Yu, S.H. China’s Recycling Volume Will Reach 350 Million Tons of Renewable Resources in 2020. 2017. Available online: https://www.gov.cn/xinwen/2017-01/26/content_5163750.htm (accessed on 26 January 2017).
  6. Savaskan, R.C.; Bhattacharya, S.; Wassenhove, L.N.V. Closed-loop supply chain models with product remanufacturing. Manag. Sci. 2004, 50, 239–252. [Google Scholar] [CrossRef]
  7. Nike Grind. Changing the Game from the Ground Up. 2025. Available online: https://www.nikegrind.com/ (accessed on 1 January 2025).
  8. Kamal, M.M.; Mamat, R.; Mangla, S.K.; Kumar, P.; Despoudi, S.; Dora, M.; Tjahjono, B. Immediate return in circular economy: Business to consumer product return information sharing framework to support sustainable manufacturing in small and medium enterprises. J. Bus. Res. 2022, 151, 379–396. [Google Scholar] [CrossRef]
  9. Saeidi, S.P.; Sofian, S.; Saeidi, P.; Saeidi, S.P.; Saaeidi, S.A. How does corporate social responsibility contribute to firm financial performance? The mediating role of competitive advantage, reputation, and customer satisfaction. J. Bus. Res. 2015, 68, 341–350. [Google Scholar] [CrossRef]
  10. Panda, S.; Modak, N.M.; Cárdenas-Barrónc, L.E. Coordinating a socially responsible closed-loop supply chain with product recycling. Int. J. Prod. Econ. 2017, 188, 11–21. [Google Scholar] [CrossRef]
  11. Liu, S.; Yao, F.M.; Chen, D.Y. CSR investment decision and coordination strategy for closed-loop supply chain with two competing retailers. J. Clean. Prod. 2021, 310, 127378. [Google Scholar] [CrossRef]
  12. Pactman Blog. Top 5 Global Companies That Donate to Nonprofits. 2023. Available online: https://pactman.org/blog/1315/top-5-global-companies-that-donate-to-nonprofits/ (accessed on 5 January 2023).
  13. Walmart (China). Responsibility. 2024. Available online: https://en.walmart.cn/sustainability-12/ (accessed on 10 September 2024).
  14. Tandem Theory. Profit with Purpose: Marketing Meets CSR. 2025. Available online: https://tandemtheory.com/news/purpose-driven-profits/ (accessed on 20 January 2025).
  15. Neilsen. 2023 Consumer Survey Report: How Consumers’ Response to Macroeconomic Events Can Inform Marketing Strategies. 2023. Available online: https://www.nielsen.com/wp-content/uploads/sites/2/2023/11/2023-Consumer-Survey-Report.pdf?trk=public_post_comment-text (accessed on 28 November 2023).
  16. Li, L.; Zhang, H.T. Confidentiality and information sharing in supply chain coordination. Manag. Sci. 2008, 54, 1467–1481. [Google Scholar] [CrossRef]
  17. Huang, M.; Song, M.; Lee, L.H.; Ching, W.K. Analysis for strategy of closed-loop supply chain with dual recycling channel. Int. J. Prod. Econ. 2013, 144, 510–520. [Google Scholar] [CrossRef]
  18. Shi, Y.; Nie, J.; Qu, T.; Chu, L.-K.; Sculli, D. Choosing reverse channels under collection responsibility sharing in a closed-loop supply chain with re-manufacturing. J. Intell. Manuf. 2015, 26, 387–402. [Google Scholar] [CrossRef]
  19. Feng, L.P.; Govindan, K.; Li, C.F. Strategic planning: Design and coordination for dual-recycling channel reverse supply chain considering consumer behavior. Eur. J. Oper. Res. 2017, 260, 601–612. [Google Scholar] [CrossRef]
  20. Wang, N.M.; He, Q.D.; Jiang, B. Hybrid closed-loop supply chains with competition in recycling and product markets. Int. J. Prod. Econ. 2019, 217, 246–258. [Google Scholar] [CrossRef]
  21. Yang, L.; Hu, Y.; Huang, L. Collecting mode selection in a remanufacturing supply chain under cap-and-trade regulation. Eur. J. Oper. Res. 2020, 287, 480–496. [Google Scholar] [CrossRef]
  22. Wang, Y.; Yu, Z.; Shen, L.; Jin, M. Operational modes of e-closed loop supply chain considering platforms’ services. Int. J. Prod. Econ. 2022, 251, 108551. [Google Scholar] [CrossRef]
  23. Cao, J.; Gong, X.; Lu, J.; Bian, Z. Optimal Manufacturer Recycling Strategy under EPR Regulations. Processes 2023, 11, 166. [Google Scholar] [CrossRef]
  24. Zhang, M.; Wu, W.Q.; Song, Y. Study on the impact of government policies on power battery recycling under different recycling models. J. Clean. Prod. 2023, 413, 137492. [Google Scholar] [CrossRef]
  25. Wan, Y.; Yang, L. Differential recycling strategies and government intervention in a closed-loop supply chain. Comput. Ind. Eng. 2024, 187, 109816. [Google Scholar] [CrossRef]
  26. Huang, Z.; Zhao, Y.; Cheng, T.E.; Sethi, S.P. Reverse channel selection in a dynamic stochastic closed-loop supply chain. Transport Res. E-Log. 2024, 192, 103774. [Google Scholar] [CrossRef]
  27. Miao, Z.W.; Peng, H.M.; Lan, Y.Q. The role of online platform selling mode in recycling channel selection: A game-theoretic analysis of profit and environmental impact. Int. J. Prod. Econ. 2025, 280, 109471. [Google Scholar] [CrossRef]
  28. Ni, D.B.; Li, K.W.; Tang, X.W. Social responsibility allocation in two-echelon supply chains: Insights from wholesale price contracts. Eur. J. Oper. Res. 2010, 207, 1269–1279. [Google Scholar] [CrossRef]
  29. Ni, D.B.; Li, K.W. A game-theoretic analysis of social responsibility conduct in two-echelon supply chains. Int. J. Prod. Econ. 2012, 138, 303–313. [Google Scholar] [CrossRef]
  30. Modak, N.M.; Panda, S.; Sana, S.S.; Basu, M. Corporate social responsibility, coordination and profit distribution in a dual-channel supply chain. Pac. Sci. Rev. 2014, 16, 235–249. [Google Scholar] [CrossRef]
  31. Wang, Y.; Su, M.; Shen, L.; Tang, R. Decision-making of closed-loop supply chain under corporate social responsibility and fairness concerns. J. Clean. Prod. 2021, 284, 125373. [Google Scholar] [CrossRef]
  32. Wang, Q.; Chen, K.; Wang, S.; Liu, W. Channel structures and information value in a closed-loop supply chain with corporate social responsibility based on the third-party collection. Appl. Math. Model. 2022, 106, 482–506. [Google Scholar] [CrossRef]
  33. Yi, Y.; He, X.; Li, Y.; Li, C. Decision-making in a green trade-ins closed-loop supply chain under financial constraints and corporate social responsibility (CSR). Comput. Ind. Eng. 2024, 197, 110626. [Google Scholar] [CrossRef]
  34. Modak, N.M.; Kazemi, N.; Cárdenas-Barrónc, L.E. Investigating structure of a two-echelon closed-loop supply chain using social work donation as a corporate social responsibility practice. Int. J. Prod. Econ. 2019, 207, 19–33. [Google Scholar] [CrossRef]
  35. Mondal, C.; Giri, B.C.; Biswas, S. Integrating corporate social responsibility in a closed-loop supply chain under government subsidy and used products collection strategies. Flex. Serv. Manuf. J. 2022, 34, 65–100. [Google Scholar] [CrossRef]
  36. Chen, J.; Hou, R.; Xiao, L.; Zhang, T.; Zhou, Y. Dynamic corporate social responsibility adjustment strategies of a closed-loop supply chain with fairness concerns and supply chain financing. Chaos Solitons Fract. 2023, 168, 113158. [Google Scholar] [CrossRef]
  37. Liu, Q.Y.; Zhu, X.D. Incentive strategies for retired power battery closed-loop supply chain considering corporate social responsibility. Environ. Dev. Sustain. 2024, 26, 19013–19050. [Google Scholar] [CrossRef]
  38. Vosooghidizaji, M.; Taghipour, A.; Canel-Depitre, B. Coordinating corporate social responsibility in a two-level supply chain under bilateral information asymmetry. J. Clean. Prod. 2022, 364, 132627. [Google Scholar] [CrossRef]
  39. Ma, P.; Shang, J.; Wang, H.Y. Enhancing corporate social responsibility: Contract design under information asymmetry. Omega 2017, 67, 19–30. [Google Scholar] [CrossRef]
  40. Huang, S.; Wang, Y.; Zhang, X. Contracting with countervailing incentives under asymmetric cost information in a dual-channel supply chain. Transport Res. E-Log. 2023, 171, 103038. [Google Scholar] [CrossRef]
  41. Li, X.J.; Chen, J.; Ai, X.Z. Contract design in a cross-sales supply chain with demand information asymmetry. Eur. J. Oper. Res. 2018, 275, 939–956. [Google Scholar] [CrossRef]
  42. Mobini, Z.; Heuvel, W.V.D.; Wagelmans, A. Designing multi-period supply contracts in a two-echelon supply chain with asymmetric information. Eur. J. Oper. Res. 2019, 277, 542–560. [Google Scholar] [CrossRef]
  43. Xia, J.; Niu, W.J. Carbon-reducing contract design for a supply chain with environmental responsibility under asymmetric information. Omega 2020, 102, 102390. [Google Scholar] [CrossRef]
  44. Xu, W.; Xu, H. Channel encroachment and carbon reduction with demand information asymmetry. J. Clean. Prod. 2022, 371, 133443. [Google Scholar] [CrossRef]
  45. Suvadarshini, P.; Biswas, I.; Srivastava, S.K. Impact of reverse channel competition, individual rationality, and information asymmetry on multi-channel closed-loop supply chain design. Int. J. Prod. Econ. 2023, 259, 108818. [Google Scholar] [CrossRef]
  46. Xie, F.J.; Wen, L.Y.; Cui, W.T.; Shen, X.Y. Complexity analysis and control of output competition in a closed-loop supply chain of cross-border e-commerce under different logistics modes considering Chain-to-Chain information asymmetry. Entropy 2024, 26, 1073. [Google Scholar] [CrossRef] [PubMed]
  47. Wang, T.Y.; Chen, Z.S.; Wang, X.J.; Govindan, K.; Skibniewski, M.J. Strategic information sharing in the dual-channel closed loop supply chain with nonlinear production cost. Inform. Sci. 2024, 657, 119944. [Google Scholar] [CrossRef]
  48. Zhao, S.; Wang, M.; Zhu, Q.; Zhou, Q.; Mao, R. Effects of information asymmetry on green advertising for remanufacturing within a closed-loop supply chain. Transport Res. E-Log. 2024, 188, 103618. [Google Scholar] [CrossRef]
  49. Zhao, S.; Wang, M.; Zhou, Q.; Xia, X. Managing manufacturer encroachment and product conflicts in a closed-loop supply chain: The case of information asymmetry. Omega 2025, 132, 103236. [Google Scholar] [CrossRef]
  50. Choi, T.M.; Li, Y.; Xu, L. Channel leadership, performance and coordination in closed loop supply chains. Int. J. Prod. Econ. 2013, 146, 371–380. [Google Scholar] [CrossRef]
  51. Hong, X.; Zhang, H.; Zhong, Q.; Liu, L. Optimal decisions of a hybrid manufacturing-remanufacturing system within a closed-loop supply chain. Eur. J. Ind. Eng. 2016, 10, 21–50. [Google Scholar] [CrossRef]
Figure 1. CLSC structure with different CSR input and recycling modes.
Systems 13 00432 g001
Figure 2. Decision sequence in MM and MR models.
Systems 13 00432 g002
Figure 3. Decision sequence in RM and MR models.
Systems 13 00432 g003
Figure 4. Influence of consumer CSR input sensitivity coefficient on CSR input level.
Systems 13 00432 g004
Figure 5. Recycling rate of waste products when manufacturer is responsible for recycling.
Systems 13 00432 g005
Figure 6. Recycling rate of waste products when the retailer is responsible for recycling.
Systems 13 00432 g006
Figure 7. Influence of consumer CSR input sensitivity coefficient on wholesale price ( a 0 = 100 ).
Systems 13 00432 g007
Figure 8. Influence of consumer CSR input sensitivity coefficient on selling price ( a 0 = 100 ).
Systems 13 00432 g008
Figure 9. Influence of consumer CSR input sensitivity coefficient on selling price ( a 0 = 95 ).
Systems 13 00432 g009
Figure 10. Influence of consumer CSR input sensitivity coefficient on wholesale price ( a 0 = 95 ).
Systems 13 00432 g010
Figure 11. Influence of consumer CSR input sensitivity coefficient on market demand ( a 0 = 95 ).
Systems 13 00432 g011
Figure 12. Influence of consumer CSR input sensitivity coefficient on manufacturer’s profit.
Systems 13 00432 g012
Figure 13. Influence of consumer CSR input sensitivity coefficient on manufacturer’s profit ( a 0 = 100 ).
Systems 13 00432 g013
Figure 14. Influence of consumer CSR input sensitivity coefficient on retailer’s profit.
Systems 13 00432 g014
Figure 15. Influence of consumer CSR input sensitivity coefficient on retailer’s profit ( a 0 = 100 ).
Systems 13 00432 g015
Figure 16. Influence of market capacity predicted by manufacturer on its profit.
Systems 13 00432 g016
Table 1. Summary of the relevant literature and comparison with this paper.
PapersRecycling Channel StructureInformation AsymmetryCSR
Savaskan et al. [6], Shi et al. [18], and Huang et al. [26]
Feng et al. [19]
Panda et al. [10] and Wang et al. [31]
Yi et al. [33]
Modak et al. [34]
Chen et al. [36]
Wang et al. [47]
Zhao et al. [49]
Vosooghidizaji et al. [38]
Ma et al. [39]
Li et al. [41], Mobini et al. [42], Xia et al. [43], and Xu et al. [44]
This paper
Table 2. Description of symbols.
SymbolDefinition
w Wholesale price per unit of product
p Selling price per unit of product
a Market capacity, a > 0
a 0 Market capacity determination part, a 0 > 0
b Price sensitivity coefficient, b > 0
Q Market demand
C m The unit production cost of new products
C r The unit production cost of remanufactured products
Π m Manufacturer’s profit
Π r Retailer’s profit
Π s CLSC system’s profit
τ The recycling rate of waste products, 0 < τ < 1
k Coefficient of the recycling cost, k > 0
g CSR input cost coefficient, g > 0
d CSR input level, 0 < d < 1
θ Sensitivity coefficient of consumers to CSR input, θ > 0
ε Market capacity information uncertainty degree
γ Market capacity predicted by the manufacturer, γ > 0
m Unit transfer payment of waste product, m > 0
Δ Demand error ( Δ = a a 0 )
Table 3. The equilibrium results under models MM and MR.
Model M M ( Z = M M )Model M R ( Z = M R )
w Z * 4 k g ( 2 Δ + a 0 + b C m ) 4 k g b Δ 0 2 ( a + Δ ) k θ 2 C m Δ 7 + k θ 2 2 m k b g ( 2 a ( Δ 0 m ) + m ( 4 Δ + a 0 + b C m ) ) ( b 2 m g Δ 0 + k θ 2 ) m 2 Δ 8 g k 2 ( ( 2 Δ + a 0 + b C m ) + k θ 2 Δ 2 2 k Δ 1
p Z * 4 k g b 2 C m g b 2 Δ 0 2 ( 2 a + Δ ) + 4 k b ( g ( 3 a + Δ ) 2 C m θ 2 ) + k θ 2 Δ 2 b ( Δ 7 + k θ 2 ) 4 a m g b 2 ( b m 4 k Δ 0 ) 2 Δ 5 + 4 k 2 θ 2 Δ + ( b m 2 4 k ) ( b θ 2 Δ 2 4 k b g ( 3 a + ) ) 2 b Δ 1 ( b m 2 4 k )
d Z * θ k ( ( 2 Δ + a 0 b C m ) Δ 7 + k θ 2 θ ( b Δ 2 2 k ( 2 Δ + a 0 ) ) 2 Δ 1
τ Z * b g Δ 0 ( ( 2 Δ + a 0 b C m ) Δ 7 + k θ 2 m ( ( 8 a 0 g k θ 2 m 2 Δ ) k b + 2 k 2 θ 2 Δ + Δ 5 ) 2 k Δ 1 ( b m 2 4 k )
Q Z * ( g b 2 Δ 0 2 + k θ 2 ) Δ + 4 b g k ( a 0 b C m ) 2 ( Δ 7 + k θ 2 ) ( ( 8 a 0 g k θ 2 m 2 Δ ) k b + 2 k 2 θ 2 Δ ) + Δ 5 Δ 1 ( b m 2 4 k )
π m Z * g k ( a 0 b C m ) ( ( 2 Δ + a 0 b C m ) Δ 7 + k θ 2 ( g b 4 m 6 Δ 0 2 4 k g b 3 m 5 Δ 0 2 ) Δ 2 2 g b k 2 m 2 ( 2 Δ + a 0 ) 2 ( b m 2 + 16 k ) ( Δ 3 + Δ 4 ) 64 g k 4 ( a 0 b C m ) ( 2 Δ + a 0 b C m ) 4 k Δ 1 ( b m 2 4 k ) 2
π r Z * ( 4 b g k ( 2 Δ + a 0 b C m ) ( 8 b g k g b 2 Δ 0 2 k θ 2 ) Δ ) 2 4 b ( Δ 7 + k θ 2 ) 2 ( ( ( 8 a 0 g k θ 2 m 2 Δ ) k b + 2 k 2 θ 2 Δ ) + Δ 5 ) 2 4 k b Δ 1 2 ( 4 k b m 2 )
π s Z * 4 b g k ( a 0 b C m ) ( ( 2 Δ a + a 0 b C m ) ( 8 b g k g b 2 Δ 0 2 k θ 2 ) + ( g b 2 ( 4 k C m + Δ 0 2 Δ ) + 4 a 0 b g k + k θ 2 Δ ) 2 4 b ( Δ 7 + k θ 2 ) 2 g b 5 m 6 Δ 0 2 Δ 2 4 k g b 4 m 5 Δ 0 Δ 2 2 g b 2 k 2 m 2 Δ 2 2 ( b m 2 + 16 k ) + ( 4 k b m 2 ) ( ( 8 a 0 g k θ 2 m 2 Δ ) k b + 2 k 2 θ 2 Δ + ( a b C m ) ) 2 b ( Δ 3 + Δ 4 ) 64 g b k 4 ( a 0 b C m ) ( 2 Δ a + a 0 b C m ) 4 k b Δ 1 ( 4 k b m 2 ) 2
Note: Δ 0 , Δ 1 , Δ 2 , Δ 3 , Δ 4 , Δ 5 , and Δ 7 are shown in Table A1 of the Appendix A.
Table 4. The equilibrium results under models RM and RR.
Model R M ( Z = R M )Model R R ( Z = R R )
w Z * Δ 6 4 g b 2 Δ 7 4 a b g k Δ 10 Δ 11 4 g b 2 k Δ 10
p Z * 8 a g 2 b 2 Δ 7 + Δ 6 ( 2 g b θ 2 ) 4 g b 2 Δ 7 ( 4 b g θ 2 ) 4 a b g Δ 10 Δ 14 ( 2 g b θ 2 ) Δ 11 4 g b 2 Δ 10 Δ 14
d Z * θ ( 4 a g b Δ 7 Δ 6 ) 4 g b Δ 7 ( 4 g b θ 2 ) θ Δ 11 4 g b Δ 10 Δ 14
τ Z * Δ 0 ( 2 g b ( ( 2 Δ + a 0 b C m ) θ 2 Δ 2 Δ 7 m Δ 11 4 k Δ 10 Δ 14
Q Z * 4 a g b Δ 7 Δ 6 2 Δ 7 ( 4 g b θ 2 ) Δ 11 2 Δ 10 Δ 14
π m Z * k ( 2 b g ( a 0 b C m ) + θ 2 Δ ) ( 2 g b ( 2 Δ + a 0 b C m ) θ 2 Δ ) 4 g b 2 Δ 7 Δ 13 ( g b 2 m ( Δ 0 m ) Δ 11 + ( 4 g b k ( a b C m ) Δ 10 Δ 11 ) Δ 14 ) 8 g b 2 k Δ 10 2 Δ 14 2
π r Z * ( 4 a g b Δ 7 Δ 6 ) 2 16 g b 2 ( 4 g b θ 2 ) Δ 7 2 Δ 11 2 16 g b 2 k Δ 10 2 Δ 14 2
π s Z * 4 k Δ 7 ( 4 g b θ 2 ) ( 2 b g ( a 0 b C m ) + θ 2 Δ ) ( 2 g b ( 2 Δ + a 0 b C m ) θ 2 Δ ) + ( 4 a g b Δ 7 Δ 6 ) 2 16 g b 2 ( 4 g b θ 2 ) Δ 7 2 Δ 13 ( 2 g b 2 m Δ Δ 11 + 8 g b k ( a b C m ) Δ 10 ( Δ 14 Δ 11 Δ 14 ) 16 g b 2 k Δ 10 2 Δ 14 2
Note: Δ 0 , Δ 6 , Δ 7 , Δ 8 , Δ 9 , Δ 10 , Δ 13 , and Δ 14 are shown in Table A1 of the Appendix A.
Disclaimer/Publisher’s Note: The statements, opinions and data contained in all publications are solely those of the individual author(s) and contributor(s) and not of MDPI and/or the editor(s). MDPI and/or the editor(s) disclaim responsibility for any injury to people or property resulting from any ideas, methods, instructions or products referred to in the content.

