Article

How Does the Manufacturer Optimize Pricing Decision and Channel Strategy Under Platform Encroachment?

by
Hao Li
1,2 and
Xin Yuan
2,*
1
School of Economics and Management, Chongqing Jiaotong University, Chongqing 400074, China
2
Western China Transportation-Economy-Society Development Studies Center, Chongqing Jiaotong University, Chongqing 400074, China
*
Author to whom correspondence should be addressed.
Systems 2025, 13(6), 416; https://doi.org/10.3390/systems13060416
Submission received: 24 March 2025 / Revised: 18 May 2025 / Accepted: 22 May 2025 / Published: 28 May 2025
(This article belongs to the Section Systems Practice in Social Science)

Abstract

:
The rise of platform competition, driven by the rapid emergence of new e-commerce platforms, has fundamentally reshaped traditional supply chain structures. Under platform encroachment, the manufacturer faces the critical challenge of optimizing their channel strategies to expand market demand and increase profit. To address this, this paper develops a game model considering a manufacturer, a retailer, and two e-commerce platforms (an incumbent and an entrant). The model examines three channel strategies: the single-platform strategy, the synchronous channel strategy, and the reset channel strategy. This paper analyzes how the platform service differentiation and the unit channel setup cost of the manufacturer under the reset channel strategy influence pricing decisions and the manufacturer’s channel strategy. The findings indicate that the synchronous channel strategy yields a higher product price than the reset channel strategy while maximizing dual-platform demand when the extent of platform service differentiation is moderate and the unit channel setup cost is low. Under these conditions, the synchronous and reset channel strategies yield higher expected profits for the manufacturer and retailer than the single-platform strategy. Moreover, the best option for the manufacturer is the synchronous channel strategy when the extent of platform service differentiation is moderate and the unit channel setup cost is relatively high, which achieves a Pareto improvement for all participants. However, the reset channel strategy benefits the entrant platform when the unit channel setup cost is low. The study provides a theoretical foundation for the manufacturers to optimize their channel configurations and effectively adapt to platform competition.

1. Introduction

With the rapid development of the digital economy, the platform economy has become a core component of the global business system. Incumbent platforms, such as Amazon and Taobao, have long dominated the market with their huge user base, mature logistics network, and strong influence. However, entrant platforms such as Pinduoduo, Shopify, Mercado Libre, Etsy, etc. have rapidly risen through differentiated services [1]. According to data from Chuhai.com, the number of global e-commerce platforms increased from 9.2 million to more than 2620 between 2019 and 2023. These entrant platforms have attracted a large number of product manufacturers to settle in with innovative strategies such as low entry barriers, precise traffic matching, and flexible pricing, posing competitive pressure on the incumbent platforms. However, platform encroachment is not just a multi-channel expansion of the manufacturers, but its essence is the channel reconstruction of the manufacturers under the platform’s differentiated services and cost constraints. Incumbent platforms rely on consumer loyalty to maintain premium capabilities, while entrant platforms divert market demand by reducing commission rates and other means. In this competitive landscape, the manufacturers have to balance between “relying on a single platform” and “multi-platform collaborative operation” to maximize market coverage and profit [2].
Therefore, in the context of platform encroachment, the manufacturers of consumer electronics, household appliances, fast-moving consumer goods (FMCG), etc., which are highly standardized and strongly dependent on the channel, are facing a critical strategic question: whether and how to expand market coverage by entering the entrant platform? The manufacturers usually adopt three channel strategies: single-platform strategy, synchronous channel strategy, and reset channel strategy. The single-platform strategy means that manufacturers only sell the product through the incumbent platform. Its advantages are to simplify operation management and reduce the costs of channel coordination, but its disadvantages are limited market coverage and difficulty in coping with the competition of the entrant platform. The synchronous channel strategy is manifested in that the existing supply chain system is extended to the entrant platform under the premise of maintaining a cooperative relationship with original retailers to achieve multi-channel parallel distribution. Taking Xiaomi as an example, they maintain cooperation with the original retailers (Suning, etc.) and implement the synchronous channel strategy on Pinduoduo (The entrant platform) by synchronizing with the same retailer. The advantage of this strategy is that it can quickly adapt to the new platform, make full use of existing supply chain resources, and reduce initial investment costs on the basis of maintaining a good cooperative relationship. However, this also means that manufacturers need to effectively coordinate and manage across multiple platforms to prevent internal vicious competition and ensure the consistency of brand value [3]. The reset channel strategy involves the manufacturer independently building a new supply chain—including a new retailer—tailored to the characteristics of the entrant platform, through which sales activities are conducted. For example, after entering JD.com, XGIMI Technology established an independent platform supply chain to sell its products, such as opening the official flagship store of XGIMI Technology. In contrast, although the reset channel strategy can better fit the characteristics and needs of the new platform, it is also accompanied by higher startup costs and risks, which may have a certain impact on the manufacturer’s short-term profit.
It is worth noting that a study by the journal Science Investment pointed out that in the cases of manufacturers’ multi-platform strategy failures, 49% were attributed to the wrong choice of channel strategy, which is much higher than the wrong strategic direction (23%) and improper execution (28%). This shows that choosing the optimal channel strategy is the key to manufacturers’ success. Therefore, when confronted with platform encroachment, manufacturers must assess their internal conditions, market dynamics, and channel demand, carefully determining whether and how to adjust their channel strategies to secure a competitive advantage in an increasingly fierce market environment.
Consequently, this study investigates the issue of selling channel reconfiguration for the manufacturer under platform encroachment. Specifically, this study considers a supply chain consisting of a manufacturer, a retailer, an incumbent platform, and an entrant platform, exploring three channel strategies. Under the single-platform strategy, the manufacturer exclusively operates on the incumbent platform. The synchronous channel strategy leverages existing retailers to distribute across platforms, while the reset channel strategy requires the manufacturer to establish independent channels specifically for the entrant platform. This study analyzes the product pricing under these three strategies and systematically evaluates the effectiveness of each channel strategy. Accordingly, our research seeks to investigate the following questions:
RQ1: How does the manufacturer optimize pricing decisions under platform encroachment?
RQ2: How do the channel setup cost and the extent of platform service differentiation influence the manufacturer’s pricing decisions and channel strategy?
RQ3: How does the manufacturer choose and modify channel strategy in light of channel demand and platform encroachment?
To address these questions, the platform, the manufacturer, and the retailer interact within a game framework. In platform-based economies, platforms typically hold a dominant position in pricing decisions. In the current setting, the manufacturer sells its products through agency sales on an incumbent platform. However, the emergence of a new entrant platform—characterized by differentiated services—attracts the manufacturer to consider entry, thereby intensifying competition between the two platforms. Within the context of platform encroachment, this paper analyzes three channel strategies available to the manufacturer: the single-platform strategy, the synchronous channel strategy, and the reset channel strategy. This paper assumes that consumers perceive differences in platform service and that the reset channel strategy entails a unit channel setup cost for the manufacturer. Subsequently, we derive the pricing decisions, platform demand, and expected profits associated with each channel strategy. Finally, through comparative analysis, we identify the conditions under which each channel strategy is optimal for the manufacturer.
This study demonstrates that the synchronous channel strategy consistently leads to higher wholesale and retail prices compared to the reset channel strategy. This is because the reset channel strategy not only intensifies competition between platforms but also introduces intra-retailer competition. Therefore, wholesale and retail prices have decreased due to the dual competition. Furthermore, since the demand of the two platforms under the synchronous channel strategy exceeds that of the single-platform and reset channel strategies, this strategy increases the market share of both platforms when platform service differentiation is moderate and the unit channel setup cost is low. Under these conditions, the expected profits of both the manufacturer and the retailer under the synchronous channel strategy and the reset channel strategy surpass those under the single-platform strategy, indicating that the manufacturer’s entry into the entrant platform can generate incremental benefits for both participants. From the manufacturer’s perspective, the synchronous channel strategy is optimal when platform service differentiation is moderate and the unit channel setup cost is relatively high. This strategy leads to a Pareto improvement for all involved participants. However, when the unit channel setup cost is low, the synchronous channel strategy benefits the manufacturer, retailer, and incumbent platform while disadvantaging the entrant platform.
This study has the following three main contributions: First, to analyze the manufacturer’s channel strategy within the context of platform encroachment, this study incorporates the coefficient of platform service differentiation. Recognizing that the extent of platform service differentiation significantly influences the manufacturer’s profit and channel strategy, this study enhances the realism of our model by explicitly accounting for this factor. By integrating the platform service differentiation, our study provides a more accurate reflection of consumer behavior and its implications for the manufacturer’s strategic decisions. Second, this study conducts a comparative analysis of the synchronous and reset channel strategies, examining their effectiveness and equilibrium market outcomes. While prior research has primarily focused on the manufacturer’s choice of the reset channel strategy, the synchronous channel strategy has received relatively little attention. By introducing and analyzing the synchronous channel strategy within the context of platform encroachment, our study offers valuable insights into the optimal channel strategy for the manufacturer. Lastly, this study considers the impact of the manufacturer’s unit channel setup cost on channel strategy. While many existing studies overlook the setup costs associated with the reset channel strategy and fail to examine the impact on the manufacturer’s channel strategy, our analysis reveals that the channel setup costs play a critical role in shaping the manufacturer’s pricing and channel strategy under platform encroachment. Therefore, this study examines the manufacturer’s optimal product price and channel strategy based on the integrated impact of the extent of platform service differentiation and the unit channel setup cost.
The rest of this paper is organized as follows: Section 2 provides the literature review. Section 3 introduces the model and related assumptions. Section 4 analyzes the pricing decisions of all participants under the single-platform, synchronous, and reset channel strategies. Section 5 compares equilibrium prices and profits under the three channel strategies. Section 6 uses numerical simulations to verify the conclusions further and obtain managerial insights. Section 7 concludes the study and discusses future research directions. Appendix A provides all of the proofs.

2. Literature Review

Studies related to our work concerning platform encroachment can be categorized into the following two streams: the effects of platform encroachment on the pricing decisions and profits of chain members and the manufacturers’ channel selection under platform competition.

2.1. Platform Encroachment

Some previous studies have concentrated on the impact of retailer encroachment on the pricing decisions and profits of chain members. Some scholars often argue that retailer encroachment intensifies price competition and generates “channel conflicts”, which can harm the profits of upstream manufacturers [4,5]. For example, Li et al. [6], Li and Li [7], and Zhang et al. [8] examined retailer encroachment in platform competition and found that it intensifies internal supply chain conflicts, leading to profit losses for both manufacturers and retailers. However, other scholars argue that retailer encroachment can reduce the double marginalisation of the supply chain and increase the profits of both the manufacturers and retailers under different market conditions. For example, Arya et al. [9], Zhang et al. [10], and Guan et al. [11] found that under certain conditions, such as weakened competition, platform entry, or improved consumer perception, retailer encroachment can enhance the profit of manufacturers and even benefit both supply chain parties. Furthermore, Guo and Shang [12] explored the strategic behavior of incumbent retailers and new entrants regarding information sharing and free delivery strategies, showing that when the new entrant retailer does not provide free delivery, the incumbent retailers earn higher profits. Yuan et al. [13] studied retailer encroachment behavior in a low-carbon supply chain environment, finding that retailer encroachment could increase overall profit by improving channel efficiency. While existing studies primarily focus on the double-edged effects of traditional retailer encroachment on supply chain profit, this paper investigates how manufacturers can strategically reconfigure their selling channels in response to platform encroachment in the platform economy to maximize their profit.
It is worth noting that most studies are based on the assumption of a unilateral market, while platform encroachment, as an emerging research field, is characterized by the dynamic interaction of bilateral user groups. Platform encroachment usually refers to the entry of a new platform into a market dominated initially by an incumbent platform, directly competing with the incumbent platform, and forming a platform competition market structure [14]. Therefore, many scholars have studied the optimal pricing decisions of chain members under platform competition. For example, Sun and Xu [15], Zhen and Xu [16], Tang and Guo [17], and Tirole and Bisceglia [18] analyzed the pricing strategies and welfare implications under platform competition, highlighting that intensified competition reduces platform profits, while platform differentiation and controlled market entry can enhance social welfare or consumer surplus. However, Sun et al. [19] investigated a DDQN-based dynamic pricing model for e-commerce platforms, demonstrating that the DDQN algorithm increases product pricing profits compared to baseline strategies, providing algorithmic support for platforms to optimize pricing decisions amid market competition and demand fluctuations. Moreover, Jiang et al. [20], Zha et al. [21], and Wang and Yang [22] focused on manufacturers’ strategic responses, showing how commission rates, revenue models, and consumer preferences influence business model choice under platform encroachment. Zhong et al. [23] developed game-theoretic models to analyze e-commerce platforms’ sourcing channel strategy under encroachment, revealing that differentiated sourcing mitigates profit erosion on third-party retailers, and cross-sourcing expands the market while balancing competition. Although existing research has extensively examined manufacturers’ optimal pricing under platform encroachment, relatively little attention has been paid to how manufacturers strategically choose channel strategy in response to platform encroachment.
However, most of the literature above focuses on the optimal pricing decisions of chain members under retailer encroachment and platform competition. In contrast, our model considers the scenario of platform encroachment, where we construct a platform supply chain consisting of a single manufacturer and two e-commerce platforms (an incumbent platform and an entrant platform). This scenario captures the consumer perception of platform service differentiation selling the same product (Boakye, Natesan, and Prybutok [24] and Cai, Choi, and Zhang [25]). By introducing a coefficient of platform service differentiation, our study more accurately captures the channel demand under platform encroachment.

2.2. Manufacturer’s Channel Selection

Early studies mainly focused on the channel selection of the manufacturer under the traditional dual-channel mode. The manufacturers’ direct and distribution channel selection has attracted much attention, and many studies have conducted in-depth discussions from different perspectives, such as consumer preferences and the product’s fit to the consumer. Chiang et al. [26] noted that when consumers have different preferences for direct channel and distribution channel, establishing a direct channel can reduce the double marginalisation of the supply chain in the original retail channels, creating a Pareto optimal region where both manufacturers and retailers are more profitable in a competitive environment. Hendershott and Zhang [27] argued that when a product does not fit consumer preferences, resetting a channel generates higher profits by attracting high-value consumers, which leads the manufacturer to choose the direct channel. With the development of the platform economy, the research has gradually shifted from traditional offline channels to platform channels, and from a dual-channel structure to a multi-channel mode. Abhishek et al. [28], Shen et al. [29], Chen et al. [30] and Yan et al. [31] studied the competition and cooperation relationship between the offline channel and the platform channel, and considered the impact of channel spillover effects, platform entry costs and channel competition on manufacturers’ channel selection. Ryan et al. [32], Wang et al. [33] and Yi et al. [34] further studied manufacturers’ choice of the direct channel and platform channel in the context of channel competition. Although the above literature has explored manufacturers’ choice between direct and platform channels under competitive settings, relatively few studies have examined how manufacturers choose between dual-platform and single-platform strategies in the face of platform encroachment.
As platform competition intensifies, the manufacturer’s channel selection is affected by factors such as the platform’s pricing, commission rate and market structure. Ballerini et al. [35] found that under intense platform competition, the manufacturers are more likely to choose a direct channel as they reduce costs and profit losses caused by intermediate links; however, when platform competition is not intense, the manufacturers prefer a hybrid model to balance the interests of the channels. Zhang et al. [36] examined the impact of the channel competition and service differentiation between platforms on the manufacturers’ channel selection, finding that the manufacturer prefers setting up a channel when the platform service differentiation is high. Li and Wu [37] analyzed three channel strategies—manufacturer-operated platform channel, direct channel, and resale channel—and found that the direct channel is not the optimal choice under various information-sharing conditions, with the equilibrium strategy being a combination of the manufacturer-operated platform channel and no information sharing when sales costs are low. In addition, Ha et al. [2], Ha et al. [38], and Luo et al. [39] regarded the platform reselling channel and agency channel as two distinct channels, studying whether a manufacturer should adopt a single-channel or dual-channel strategy, highlighting the wholesale price effect and channel transfer effect under the dual-channel mode.
Although the above research has deeply explored the channel selection problem of the manufacturer within a single platform, less attention has been paid to the manufacturer’s choice of dual-platform channels. Therefore, in the context of platform encroachment, our model analyses how the platform service differentiation affects the manufacturer’s optimal pricing decision and channel strategy, and compares the effectiveness of a single channel strategy and a dual channel strategy (synchronous channel strategy and reset channel strategy).
Table 1 provides a summary of contributions to emphasise this study’s novelty and contribution to existing literature.

3. Definition of Model and Assumptions

3.1. The Model

Consider a platform-based supply chain composed of a manufacturer (denoted as m ), a retailer (denoted as r ), and an e-commerce platform (denoted as platform A ). In order to reduce the complexity of the model while maintaining analytical generality, this study considers a supply chain structure involving a single manufacturer, following the approach adopted in Reference [40]. In the manufacturer’s original platform selling channel, the manufacturer wholesales the product to the retailer at a wholesale price w , and the retailer sells the product on the platform at a retail price p . The e-commerce platform acts as an intermediary and charges a unit commission rate θ to the retailer or the manufacturer.
There is a potential entrant platform (denoted as platform B ), which attracts the manufacturer to join and competes with the incumbent platform in the market. Due to the strong brand effect and the consumer loyalty of the incumbent platform, the entrant platform is relatively weak in terms of competitiveness and struggles to challenge the market dominance of the existing platforms. The manufacturer may choose to broaden its selling channels by entering the entrant platform, aiming to capture additional market demand.
Consistent with the assumptions in Reference [41], and due to the manufacturer’s limited knowledge of the new platform, this study assumes that the supply chain structure in the original channel remains unchanged. Building upon the existing platform channel, the manufacturer has three channel configuration strategies in the face of the potential entrant platform B :
(i).
Single-Platform Strategy (denoted as Strategy N ): The manufacturer only sells on platform A , as shown in Figure 1a.
(ii).
Synchronous Channel Strategy (denoted as Strategy L ): The manufacturer maintains the selling channel on platform A while also entering platform B in collaboration with the same retailer on platform A , as shown in Figure 1b.
(iii).
Reset Channel Strategy (denoted as Strategy R ): The manufacturer maintains the selling channel on platform A while establishing a new channel on platform B , as shown in Figure 1c. To address the computational complexity and streamline the analytical process, we model the manufacturer and the new retailer on the entrant platform as an integrated entity. As a result, the new retailer’s individual decision-making in the new selling channel is not explicitly considered under strategy R . Therefore, we refer to the original retailer simply as “the retailer” throughout the paper.
The value of consumers regarding the product sold on platform A is denoted by v , which follows a uniform distribution on [ 0 , 1 ] . Similarly, the valuation of the product sold on platform B is denoted by β v , and the coefficient of the platform service quality differentiation is denoted by β , where 0 < β < 1 . This assumption is based on the fact that the incumbent platform, with its more extended operational history, typically benefits from a more loyal base of customers, stronger brand recognition, and greater industry expertise, all of which enhance consumer trust in the platform A . As β increases, the differentiation in platform service quality decreases.

3.2. Abbreviation and Game Sequence

Let i = { N , L , R } denotes the three channel configuration strategies of the manufacturer, and let j = { A , B } represents the two platforms, with k = { m , r } denoting the manufacturer and retailer, respectively. The main parameters of the model are shown in Table 2.
The model assumes that the platform, the manufacturer, and the retailer act in a game framework. While platforms typically play a dominant role in pricing decisions within platform-based economies, this study centers on the manufacturer’s strategic channel choices in the context of platform encroachment. Accordingly, consistent with established market conventions and as noted in [42], the decision-making order for all participants is as follows. (1) The stage of the manufacturer’s channel strategy selection: The manufacturer decides what kind of selling channel strategy to select [43]. (2) The stage of pricing: First, the two platforms determine the unit commission rate θ charged to the manufacturer or retailer [42,44]. Second, the manufacturer sets the wholesale price w under the strategy i [45]. Finally, either the retailer or the manufacturer sets the retail price p under the strategy i . (3) The stage of consumer purchase decision-making: Consumers either refrain from purchasing the product or purchase through the platforms.

3.3. Market Demand Analysis in Strategy L and Strategy R

This study uses a linear function to describe the consumer utility. The utility of a consumer purchasing the product on platform A is denoted by U A i = v p A i , and the utility of purchasing on platform B is denoted by U B i = β v p B i . Assuming U A i = 0 , the indifference point where consumers are indifferent between purchasing from platform A or not is denoted as v 1 = p A i . Similarly, assuming U B i = 0 , the indifference point for platform B is denoted as v 2 = p B i β . The indifference point at which consumers derive equal utility from purchasing the product from both platforms satisfies the condition U A i = U B i , leading to the indifference point v ˜ = p A i p B i 1 β .We can calculate the demand distribution intervals based on the relative sizes of v 1 , v 2 and v ˜ , displayed in Figure 2.
As demonstrated in Figure 2:
(i)
If 0 < v 2 < v 1 < v ˜ < 1 (i.e., p B i β < p A i < p B i + ( 1 β ) , the consumers with valuations in the interval v ˜ , 1 will choose to purchase from platform A , while those in the interval v 2 , v ˜ will choose platform B . As shown in Figure 2a, the demand for the channels will be D A i = 1 v ˜ = 1 p A i p B i 1 β and D B i = v ˜ v 2 = p A i p B i 1 β p B i β .
(ii)
If 0 < v ˜ < v 1 < v 2 < 1 (i.e., p A i < p B i β ), the consumers in the range v 1 , 1 will purchase from platform A , and platform B has no demand in this case, as shown in Figure 2b. Therefore, the demand for the channels will be D A i = 1 v 1 = 1 p A i and D B i = 0 .
(iii)
If v 2 < 1 , v 1 > 1 and v ˜ > 1 (i.e., p A i > p B i + ( 1 β ) ), the consumers in the interval v 2 , 1 will choose platform B , and platform A has no demand, as shown in Figure 2c. Thus, the demand for the channels will be D A i = 0 and D B i = 1 v 2 = 1 p B i β .
(iv)
If 0 < v 2 < v ˜ < v 1 < 1 , v 2 < v ˜ can be inferred that p A i > p B i β . However, when v ˜ < v 1 , we obtain p A i < p B i β . Therefore, case (iv) does not hold based on the above analysis.
(v)
If 0 < v 1 < v ˜ < v 2 < 1 , 0 < v 1 < v 2 < v ˜ < 1 , and 0 < v ˜ < v 2 < v 1 < 1 , the analysis of case (v) is similar to case (iv). Therefore, case (v) does not hold.
In summary, when the manufacturer enters the entrant platform, the demand for the two channels is shown in Equations (1) and (2):
D A i = 1 p A i , p A i < p B i β 1 p A i p B i 1 β , p B i β < p A i < p B i + ( 1 β ) 0 , p A i > p B i + ( 1 β )
D B i = 0 , p A i < p B i β p A i p B i 1 β p B i β , p B i β < p A i < p B i + ( 1 β ) 1 p B i β , p A i > p B i + ( 1 β )
According to the principle of “incentive compatibility” [46], this paper only considers the case where the demand for the channels in strategy L and strategy R is greater than zero. Therefore, based on Equations (1) and (2), this paper only analyzes the equilibrium under the condition where p B i β < p A i < p B i + ( 1 β ) .

4. Market Equilibrium Analysis Under Three Strategies

4.1. Equilibrium Analysis Under Strategy N

In strategy N , due to the manufacturer does not enter platform B , the demands for the two channels are D A N = 1 p A N and D B N = 0 , respectively. The profit of the retailer, the manufacturer, and platform A can be obtained as shown in Equations (3)–(5):
π r N = 1 p A N p A N w N θ A N
π m N = w A N 1 p A N
π A N = θ A N 1 p A N
By applying backward induction to solve for the equilibrium decisions of all participants, we obtain Proposition 1.
Proposition 1.
In strategy N , the market equilibrium results are shown in Table 3.
The proof of Proposition 1 can be found in Appendix A.

4.2. Equilibrium Analysis Under Strategy L

In the synchronous channel strategy, according to Equations (1) and (2), the profits for the retailer, the manufacturer, and the two platforms are as follows:
π r L = ( 1 p A L p B L 1 β ) ( p A L w L θ A L ) + ( p A L p B L 1 β p B L β ) ( p B L w L θ B L )
π m L = ( 1 p B L β ) w L
π A L = ( 1 p A L p B L 1 β ) θ A L
π B L = ( p A L p B L 1 β p B L β ) θ B L
Similarly, based on the profit expressions from Equations (6)–(9), the equilibrium prices and expected profits can be derived through backward induction, leading to Proposition 2.
Proposition 2.
In strategy L , the market equilibrium outcomes are shown in Table 4.
Appendix A contains the proof of Proposition 2. From Proposition 2, we obtain the influence of the extent of platform service differentiation on the equilibrium prices and channels’ demands in strategy L , as shown in Corollary 1.
Corollary 1.
(a) 
p A L β < 0 , p B L β > 0 , w L β > 0 , D A L β > 0 , D B L β > 0 , θ A L β < 0 .
(b) 
θ B L β > 0 if 0 < β < 4 2 3 , θ B L β < 0 otherwise.
The proof of Corollary 1 is given in Appendix A. Corollary 1a demonstrates that under strategy L , the retail price p A L falls while p B L rises, resulting in a significant price leverage effect, as the coefficient of the platform service quality differentiation increases (i.e., the consumers’ recognition of the service quality of the two platforms becomes more similar). This is because, in order to offset the income loss brought by the drop in the retail price, the platform A lowers the unit commission rate. It can be inferred from Corollary 1b that this significantly increases both the demand for the channels and the wholesale price received by the manufacturer.
Both platforms raise their unit commission rates to generate more extra profit when β is relatively low (i.e., 0 < β < 4 2 3 ). The competition between the two platforms, however, causes the unit commission rate for both platforms to drop when β is reasonably high (i.e., β > 4 2 3 ).

4.3. Equilibrium Analysis Under Strategy R

For ease of analysis and solution, this study models the manufacturer and the new retailer on the entrant platform as an integrated entity. As a result, in strategy R , the profit functions for the retailer, the manufacturer, platform A and platform B are as follows:
π r R = ( 1 p A R p B R 1 β ) ( p A R w 1 R θ A R )
π m R = w R ( 1 p A R p B R 1 β ) + ( p A R p B R 1 β p B R β ) p B R θ B R δ
π A R = θ A R ( 1 p A R p B R 1 β )
π B R = θ B R ( p A R p B R 1 β p B R β )
The corresponding equilibrium prices and profits are presented in Proposition 3. The proof of Proposition 3 is provided in Appendix A. In addition, this study defines δ 1 = β 5 + 2 β 4 21 β 3 22 β 2 + 40 β β 4 β 3 21 β 2 16 β + 64 .
Proposition 3.
In strategy R , the equilibrium prices and expected profits for all participants are shown in Table 5 when 0 < δ < δ 1 and β 1 < β < β 2 , where β 1 and β 2 represent two solutions to β 5 + ( 2 δ ) β 4 ( 21 δ ) β 3 ( 22 21 δ ) β 2 + ( 40 + 16 δ ) β 64 δ = 0 .
  • where
    M 1 = β 5 ( 3 + 3 δ ) β 4 + ( 5 δ + 22 ) β 3 + ( 42 δ + 56 ) β 2 + ( 96 24 δ ) β 64 δ 128 M 2 = β 13 ( 2 δ + 12 ) β 12 + ( 25 + 3 δ 2 ) β 11 ( 4 δ 2 54 δ 622 ) β 10 ( 126 δ 2 + 396 δ 165 ) β 9 ( 213 δ 2 + 942 δ + 11763 ) β 8 ( 1565 δ 2 13122 δ + 9408 ) β 7 ( 5519 δ 2 14676 δ 97716 ) β 6 ( 11040 δ 2 + 138768 δ 88224 ) β 5 ( 56000 δ 2 + 104832 δ + 332480 ) β 4 + ( 54784 δ 2 + 536576 δ ) β 3 + 279552 β 3 ( 233472 δ 2 270336 δ 315392 ) β 2 ( 98304 δ 2 + 589824 δ 131072 ) β .
The proof of Proposition 3 is provided in Appendix A.
Due to the complexity of the functions of the equilibrium prices, the following numerical simulation analyzes the trend of equilibrium prices as the parameters β and δ , which are depicted in Figure 3 and Figure 4. To ensure that both the equilibrium prices and the channel demands remain strictly positive while satisfying the conditions related to parameters β and δ , this study varies β within the interval [ 0.38 , 0.81 ] and δ within the range 0 , 0.25 .
We draw the following conclusions from the analysis:
(1).
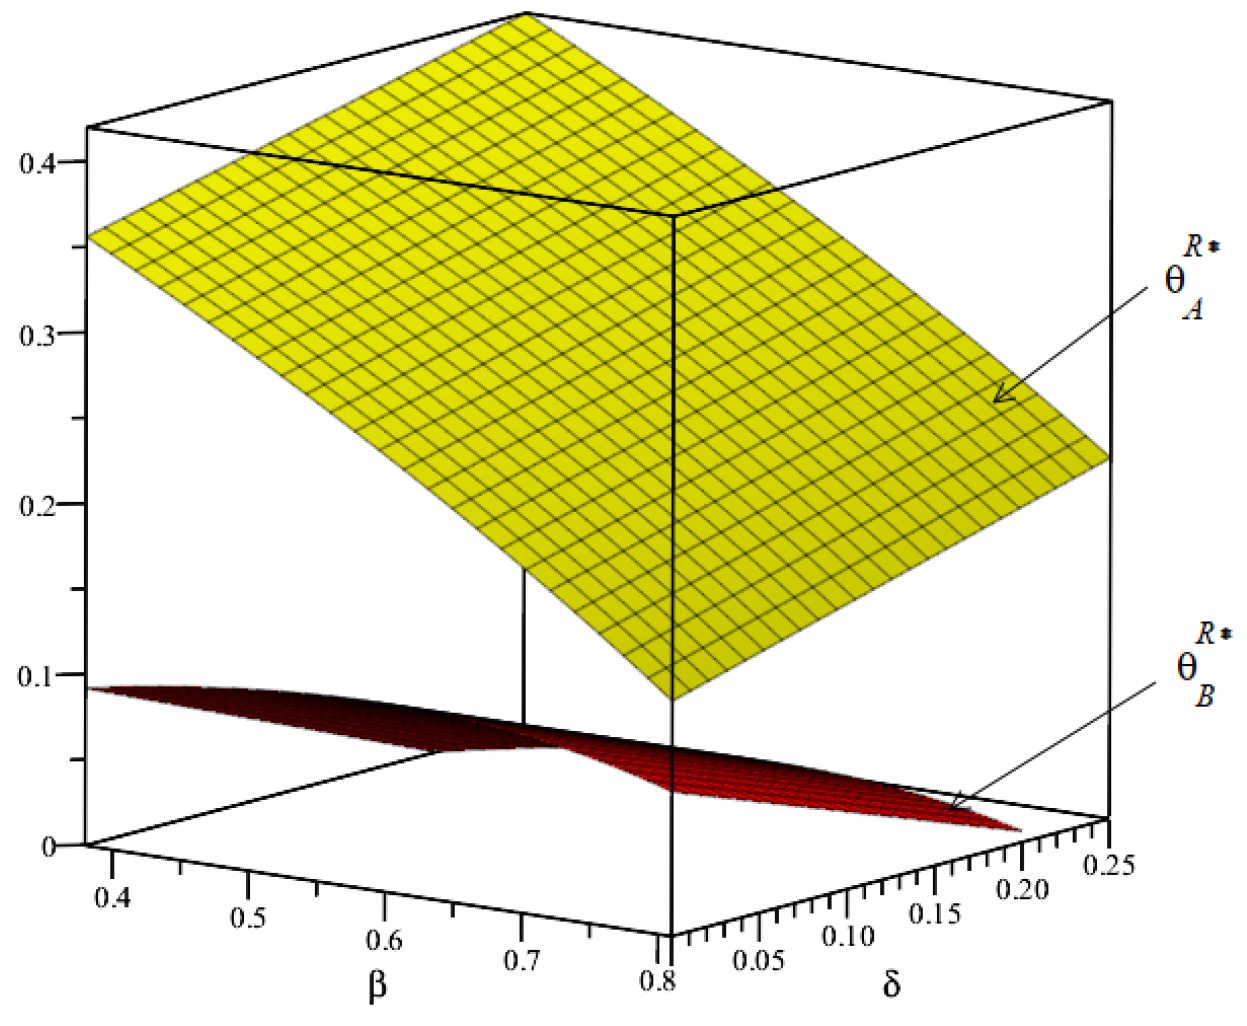
While the retail price of the product on platform B rises, the retail price p A R decreases when β increases. This downward trend demonstrates that the market equilibrium price in strategy R continues to show a pronounced leverage effect under the impact of β . The unit commission rate for the two platforms decreases with an increase in β , indicating that the reset channel strategy intensifies rivalry between the retailer and the new channel as well as between the two platforms.
(2).
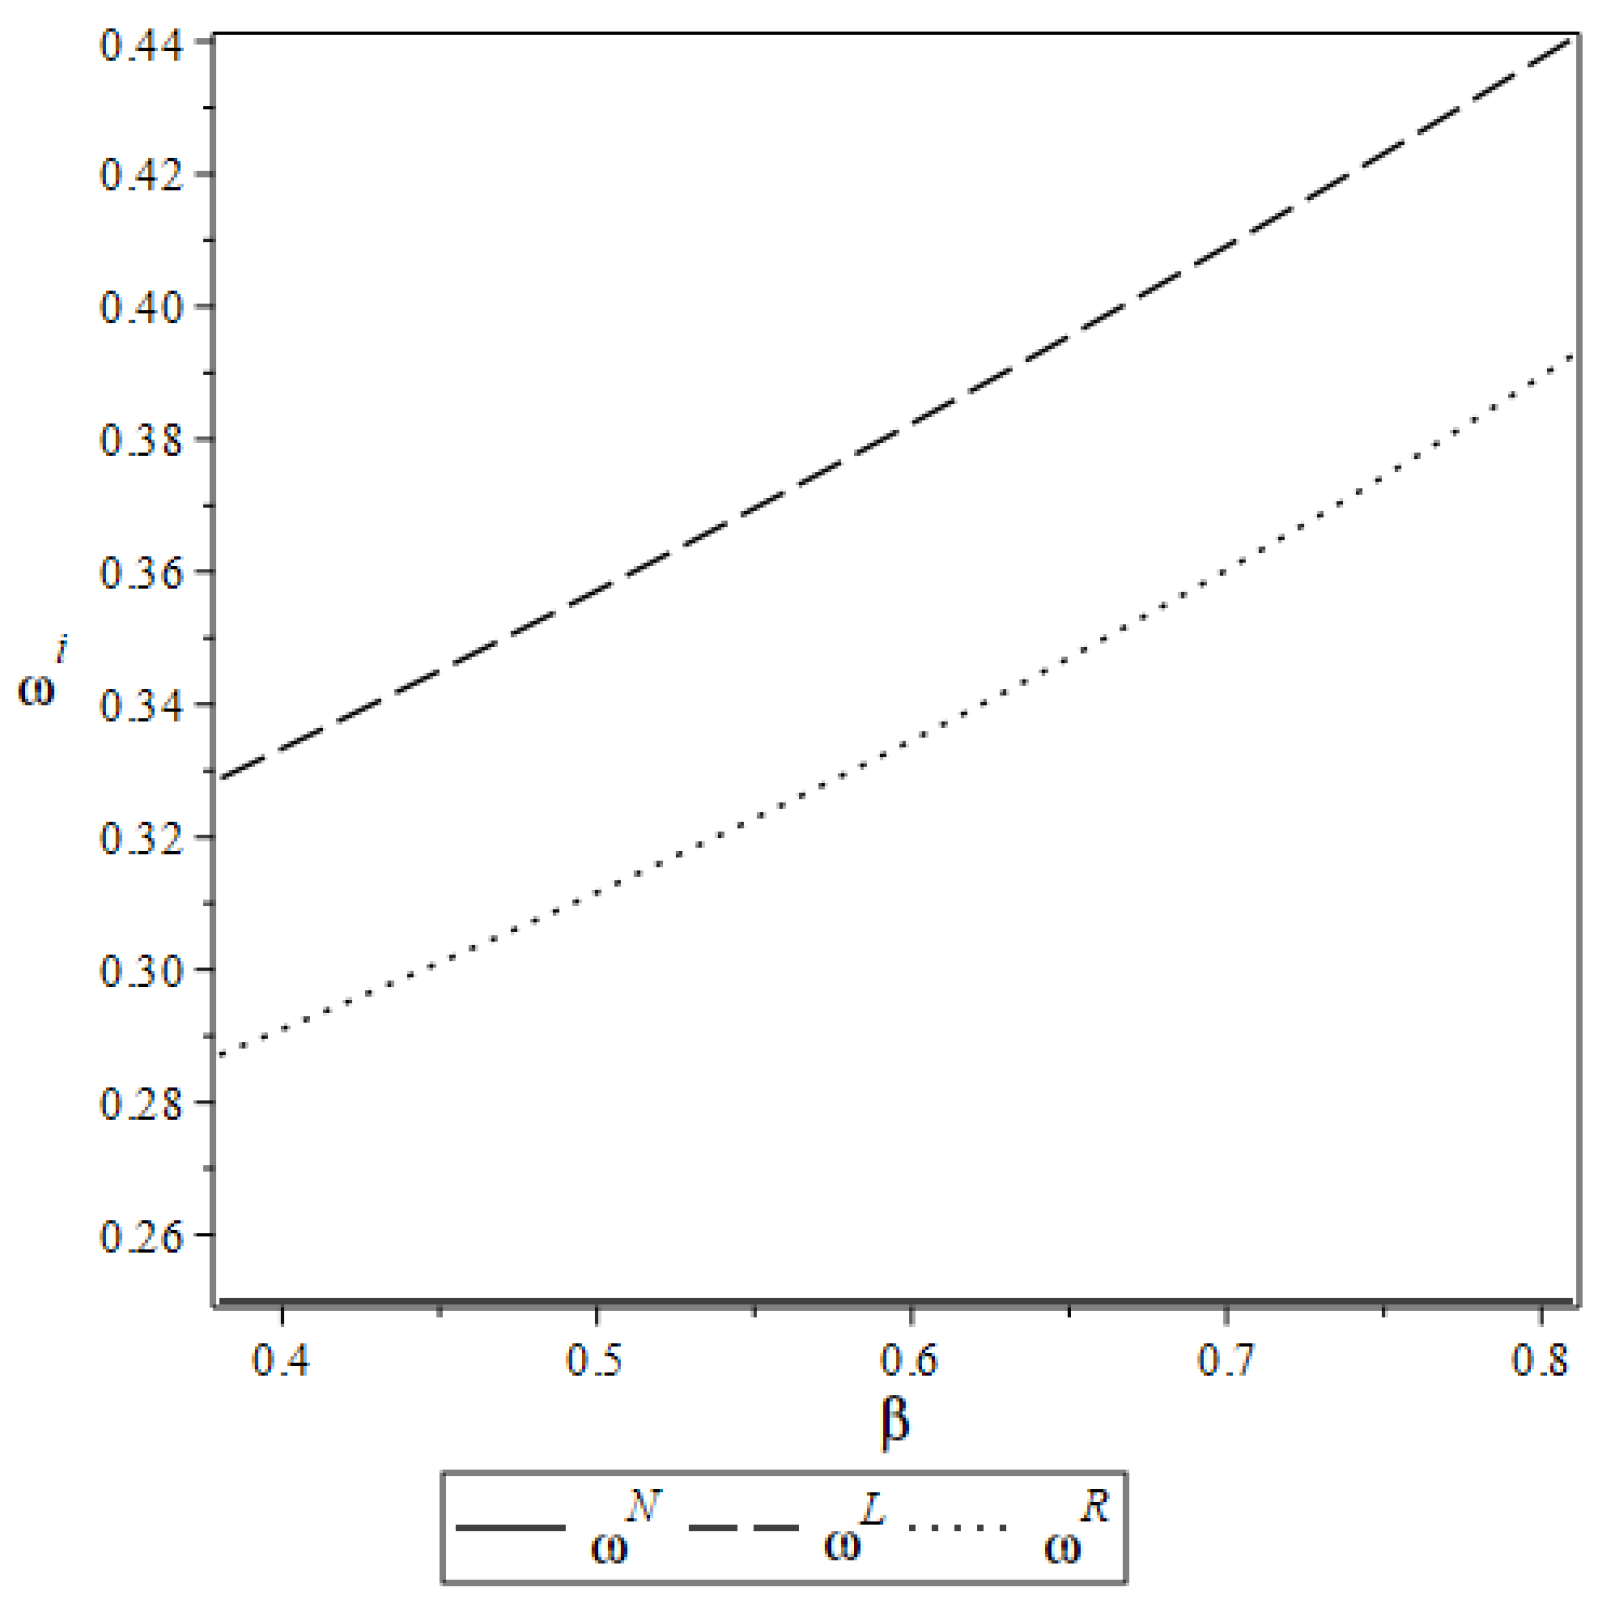
The retail prices of the product (i.e., p A R and p B R ) and θ A R are increasing in δ for 0 < δ < δ 1 . However, the manufacturer’s wholesale price (i.e., w R ) and θ B R decrease when δ increases. On the one hand, the manufacturer increases the retail price in strategy R to offset the negative impact of the unit channel setup cost of the manufacturer as a result of the increase in δ . The retail price p A R also increases, forming a tacit collusion between the two channels in the strategy R . On the other hand, platform A is further motivated to increase its unit commission rate to enhance its profit due to the higher cost of creating a new channel and the increase in the retailer’s price. To maintain the stability of the selling channel on platform A , the manufacturer will, nevertheless, reduce its wholesale price.

5. Comparative Analysis

5.1. Comparative Analysis of Different Channel Strategies

Based on the equilibrium results of Propositions 1, 2, and 3, the feasible region where all three channel strategies are valid is characterized by the parameter intervals 0 < δ < δ 1 and β 1 < β < β 2 . To satisfy the corresponding constraint conditions and to facilitate numerical analysis, parameter β is varied within the interval [ 0.38 , 0.81 ] , while parameter δ is varied within the range 0 , 0.25 .

5.1.1. Comparative Analysis of Equilibrium Prices

As illustrated in Figure 5 and Figure 6, we explore the extent of platform service differentiation on retail price (i.e., p j i ) and wholesale prices (i.e., ω i ). In strategy L , the retail price on platform A declines when the platform service differentiation coefficient decreases, whereas the retail price on platform B increases, supporting the findings of Propositions 1 and 2. Furthermore, it is evident that the wholesale and retail prices under strategy L are consistently greater than those under strategy R . It is comparable to the study shown in Figure 3.

5.1.2. Comparative Analysis of Channel’s Demand

As illustrated in Figure 7, it is evident that as β increases, the channel demand D A L , D A R and D B L increases accordingly. The evolution of platform competition is apparent in the non-monotonic effect of β on D B R , which originally shows an increase and then a reduction as β increases. When β is low, the channel B ’s demand is increased by attracting manufacturers and retailers by lowering the commission rate in an effort to increase market share. But when β is high, the platform competition intensifies, and the entrant platform loses its competitive edge due to a smaller customer base and less merchant loyalty, which lowers product’s demand.
Furthermore, this study can deduce that strategy L generates higher demand across both platforms compared to strategies N and R (i.e., D A L > D A R > D A N , D B L > D B R > D B N ), indicating that the synchronous channel strategy may be able to increase market share under specific circumstances. In order to improve customer satisfaction and build their partnerships with retailers and entrant platforms, manufacturers should employ the synchronous channel strategy. This will allow them to increase their market share.

5.2. Comparative Analysis of Expected Profits Under Different Channel Strategies

First, as demonstrated in Proposition 4, the expected profit in the single-platform strategy is contrasted with that of the synchronous and reset channel strategy. For the sake of the discussion that follows, this study defines:
δ 2 = ( 4 β ) ( 4 β 4 4 β 3 + 72 β 2 + 64 β 128 + 2 4096 4 β 7 56 β 6 165 β 5 + 455 β 4 + 1738 β 3 1968 β 2 4096 β ) 4 ( 8 β 2 β ) ( 8 + β 2 ) δ 3 = β ( 2 + β ) ( 1 β ) ( 2 β 4 + 4 β 3 54 β 2 56 β + 320 32768 8 β 7 112 β 6 282 β 5 + 1534 β 4 + 4928 β 3 9600 β 2 20480 β ) 2 ( 8 β 2 β ) ( β 4 β 3 21 β 2 16 β + 64 ) δ 4 = β ( 2 + β ) ( 1 β ) ( 2 β 4 + 4 β 3 54 β 2 56 β + 320 + 32768 8 β 7 112 β 6 282 β 5 + 1534 β 4 + 4928 β 3 9600 β 2 20480 β ) 2 ( 8 β 2 β ) ( β 4 β 3 21 β 2 16 β + 64 )
According to the definition, it is evident that 0 < max { δ 2 , δ 3 } < δ 1 < δ 4 .
Proposition 4.
(a) 
The expected profits of the manufacturer, retailer, and platforms are ordered as π r L > π r N , π m L > π m N , π A L > π A N , π B L > π B N .
(b) 
If β 1 < β < β 2 and 0 < δ < δ 1 , π r R > π r N , π m R > π m N , π B R > π B N .
(c) 
If β 1 < β < β 2 and 0 < δ < δ 2 , π A R < π A N . If β 1 < β < β 2 and δ 2 < δ < δ 1 , π A R > π A N .
Appendix A provides proof of Proposition 4. It is evident from Proposition 4a that the expected profits of the manufacturer and retailer under strategy L are consistently greater than those under strategy N . This starkly contrasts the results of Qi et al. [47], who show that platform encroachment decreases the manufacturer’s profit under protective regimes. It also supports the conclusion of Wang and Yan [48] that, in certain situations, platform encroachment can simultaneously increase the profits of both the manufacturer and the retailer. Additionally, Proposition 4b indicates the necessary condition for the manufacturer to implement a reset channel strategy: the manufacturer’s expected profit in strategy R is higher than in strategy N if the platform service differentiation coefficient is moderate and the cost of channel setup is low. Otherwise, strategy N would be the best option for the manufacturer.
Next, this study compares the expected profits of all participants in strategy R and strategy L , as stated in Proposition 5. The proof is provided in Appendix A.
Proposition 5.
(a) 
If β 1 < β < β 2 and 0 < δ < δ 1 , π r L > π r R , π A L > π A R , π m L > π m R .
(b) 
If β 1 < β < β 2 and 0 < δ < δ 3 , π B L < π B R . If β 1 < β < β 2 and δ 3 < δ < δ 1 , π B L > π B R .
According to Proposition 5a, the synchronous channel strategy always increases the expected profits of the retailer, the manufacturer, and the incumbent platform when the platform service differentiation coefficient is moderate (i.e., β 1 < β < β 2 ) and the unit channel setup cost is low (i.e., 0 < δ < δ 1 ). From Proposition 5b, it can be seen that when β 1 < β < β 2 , and if the unit channel setup cost of the manufacturer is very low (i.e., 0 < δ < δ 3 ), strategy R benefits the entrant platform (i.e., π B L < π B R ). The results provide an explanation for why e-commerce platforms (like Shopee and Pinduoduo) have aggressively lowered the entry barriers for manufacturers. For instance, Shopee and Temu have implemented “zero entry fee” policies, which drastically reduce the initial investment costs for manufacturers, enabling them to explore new selling channels. Consequently, manufacturers are more inclined to reorganize their supply chains to capitalize on the market opportunities presented by these new platforms.
However, the synchronous channel strategy is more beneficial for the entrant platform if the manufacturer’s setup cost rises due to a relatively high unit channel setup cost (i.e., δ 3 < δ < δ 1 ). This decreases the manufacturer’s motivation to reset the channel.
Based on the above analysis, Proposition 6 can be derived, and the proof is provided in Appendix A.
Proposition 6.
(a) 
π r L > π r R > π r N , π m L > π m R > π m N , π A L > π A R > π A N , π B L > π B R > π B N , if β 1 < β < β 2 and max δ 2 , δ 3 < δ < δ 1 .
(b) 
π r L > π r R > π r N , π m L > π m R > π m N , π A L > π A N > π A R , π B R > π B L > π B N , if β 1 < β < β 2 and 0 < δ < min δ 2 , δ 3 .
(c) 
π r L > π r R > π r N , π m L > π m R > π m N , π A L > π A R > π A N , π B R > π B L > π B N , if β 1 < β < β and δ 2 < δ < δ 3 .
(d) 
π r L > π r R > π r N , π m L > π m R > π m N , π A L > π A N > π A R , π B L > π B R > π B N , if β < β < β 2 and δ 3 < δ < δ 2 .
According to Proposition 6, the synchronous channel strategy can result in a Pareto improvement that benefits every participant involved when the manufacturer’s unit channel setup cost is relatively high (i.e., max δ 2 , δ 3 < δ < δ 1 ). To support multi-platform distribution without incurring substantial costs for developing new channels, the strategy L utilizes existing supply chain resources to facilitate rapid deployment on the entrant platform. In addition, it reduces manufacturers’ dependence on a single platform and enhances their adaptability to market changes, such as increasing commission rates, within a competitive multi-platform environment.
However, the synchronous channel strategy benefits the retailer, the manufacturer, and the incumbent platform but disadvantages the entrant platform when the unit channel setup cost is low (i.e., 0 < δ < min δ 2 , δ 3 ). This is because the manufacturer and retailer work together more effectively on the incumbent platform, which is attributable to the synchronous channel strategy. However, this strengthens the incumbent platform’s position in the market, making it harder for the entrant platform to draw in the original retailers.

6. Numerical Simulation

Based on the conclusions of Proposition 4 and Proposition 5, this study next focuses solely on analyzing the profit differentials of all participants under strategy L and strategy R . Given the relative complexity of the expected profits of each participant under strategy L and strategy R , the numerical simulations are utilized to examine the profit differential between the two channel strategies. In addition, this study defines Δ π j L R = π j L π j R and Δ π k L R = π k L π k R , where k = { m , r } and j = { A , B } . To better examine the impact of key parameter δ and β on the profit differentials of all participants, this paper sets a series of values ( δ = 0.05 , 0.15 , 0.25 , β = 0.4 , 0.6 , 0.8 ), which correspond to the interval 0 , 0.25 and [ 0.38 , 0.81 ] [49,50].
From Figure 8, Figure 9, Figure 10 and Figure 11, it can be observed that the synchronous channel strategy generates additional profits for the retailer, the manufacturer, and the incumbent platform under certain conditions in the context of platform encroachment. From Figure 10b, it can be seen that Δ π A L R gradually diminishes as the unit channel setup cost increases. The reason is that the platform’s profit is not affected by δ under strategy L . Whereas, under the strategy R , both the platform’s demand and the unit commission rate increase with δ increases, which correspondingly increases the platform’s profit, thereby reducing Δ π A L R as δ increases. It is evident that the platform’s expected profit is higher under the synchronous channel strategy than under the reset channel strategy. Although the unit commission rate increases, it is insufficient to offset the profit loss caused by the substantial decline in demand (i.e., D A R < D A L ).
Figure 11a shows that when the platform service differentiation coefficient is moderate, there is a threshold δ 3 . If δ 3 < δ < δ 1 , the profit for the entrant platform under strategy L exceeds that under the strategy R . From Figure 11b, it can be seen that the profit differential of the entrant platform shifts from a negative value to a positive value as the unit channel setup cost increases. Specifically, strategy R is more beneficial for the entrant platform, maximizing its profit when δ is low (i.e., 0 < δ < δ 3 ). Conversely, strategy L benefits the entrant platform when δ is high. The explanation aligns with the profit comparison of the two strategies discussed in Proposition 5.

7. Conclusions

In the context of platform encroachment, the manufacturers face the critical challenge of optimizing their channel strategies to expand market demand and increase profit. This study, therefore, explores the issue of channel reconfiguration from the perspective of the manufacturer within a competitive multi-platform environment. The research is based on a platform supply chain consisting of a single manufacturer and two e-commerce platforms—an incumbent platform and an entrant platform. A competitive game model is developed, and it examines three channel strategies for the manufacturer: the single-platform strategy, the synchronous channel strategy, and the reset channel strategy. The study derives the equilibrium prices and expected profits under these three channel strategies. Additionally, a sensitivity analysis is conducted to assess the impact of the extent of platform service differentiation and the unit channel setup cost on the prices and profits of each participant. A comparative analysis is also performed to examine the equilibrium prices, demands, and expected profits for the various members of the platform supply chain under different channel strategies. Ultimately, the manufacturer’s optimal pricing and channel strategy in a multi-platform competitive environment are identified. The main findings of this study are as follows:
(i).
The retail price under the synchronous channel strategy is always higher than that under the reset channel strategy, even when the extent of platform service differentiation is moderate and the unit channel setup cost is low. Additionally, since the demand of the two platforms under the synchronous channel strategy is higher than that of the single-platform and reset channel strategies, this strategy can increase the market share of both platforms.
(ii).
Regardless of the synchronous channel strategy or reset channel strategy, the expected profits for the manufacturer and retailer are larger than the single-platform strategy when the unit channel setup cost is low and the extent of platform service differentiation is moderate. This suggests that both the manufacturer and the retailer benefit from increased profits due to the manufacturer’s entry into the entrant platform. This also explains why many manufacturers jump at the chance to join a new platform as soon as it launches to increase their market share and profits.
(iii).
The synchronous channel strategy is the best choice for the manufacturer when the extent of platform service differentiation is moderate and the unit channel setup cost is relatively high. This strategy produces a Pareto improvement for all participants. However, the reset channel strategy benefits the entrant platform when the unit channel setup cost is low.
This study provides several managerial insights for the manufacturer and entrant platform under platform encroachment. Adopting a synchronous channel strategy for product manufacturers traditionally reliant on the incumbent platforms can facilitate market expansion and lessen reliance on a single platform. However, the sensitivity analysis reveals that such a strategy may undermine the profit of the entrant platform when the unit channel setup cost is low. To address this, the manufacturers should reassess their revenue distribution models and negotiate performance-based profit-sharing mechanisms with the entrant platforms. For instance, establishing tiered profit-sharing incentives based on the channel demand can increase profit and enhance the long-term viability of channel partnerships. From the perspective of entrant platforms (such as the cross-border e-commerce platform in Southeast Asia and Latin America, where logistics infrastructure is still developing), attracting manufacturers requires lowering costs, such as offering initial subsidies or implementing tiered commission structures to mitigate entry barriers. Additionally, service differentiation is essential for market competitiveness. Investing in AI-powered consumer insights, personalized recommendation systems, and advanced logistics technologies can improve the shopping experience and foster stronger manufacturer-platform partnerships. Entrant platforms can enhance the manufacturer’s loyalty and establish long-term competitive advantages by positioning themselves as value-added partners rather than merely alternative selling channels.
In addition, this study acknowledges several limitations, which also provide promising directions for future research. First, the model does not account for the reference price effect, a behavioral factor rooted in prospect theory proposed by Kahneman and Tversky [51]. This effect captures how consumers’ expectations regarding product prices (i.e., reference prices) influence their purchase decisions. When identical products are offered at different prices across competing platforms, consumers’ internalized reference prices can significantly affect their willingness to buy, thereby impacting both the manufacturer’s pricing decisions and overall profitability [52]. In recent years, an increasing number of studies have examined the role of reference prices in supply chain decision-making [53]. Future research could incorporate reference price dynamics to better reflect consumer behavior in competitive multi-channel environments. Second, the current analysis is based on the assumption of complete and symmetric information among all market participants. However, in real-world scenarios, platforms often possess private or superior information regarding market demand and consumer preferences. Such information asymmetry can significantly alter the strategic interactions between manufacturers and platforms. Therefore, an important extension would be to examine how asymmetric information affects the manufacturer’s channel selection and pricing strategies. Third, this study focuses on a single-product framework. Yet, in practice, manufacturers typically manage a portfolio of products that vary in cost structures, demand elasticities, and platform suitability. Extending the model to a multi-product context would introduce additional layers of decision complexity, such as optimal product-channel alignment and cross-product coordination. Moreover, such a setting may offer novel insights into inter-manufacturer competition when multiple firms vie for advantageous product placements across digital platforms.

Author Contributions

All authors contributed to the conceptualization of this study who made contributions to all sections of the manuscript. They collaboratively developed the competitive game models for synchronous and reset channels and drafted the manuscript. All authors have read and agreed to the published version of the manuscript.

Funding

This work was supported by the National Social Science Foundation of China (Grant. No. 19XGL016) and the Chongqing Social Science Planning Talent Program (Grant No. 2024YC019).

Data Availability Statement

Data are contained within the article.

Conflicts of Interest

The authors declare no conflict of interest.

Appendix A

Proof of Proposition 1.
From the equation 2 ( π r N ) ( p A N ) 2 = 2 < 0 , by setting π r N p A N = 0 , we obtain p A N , and substituting this into Equation (4) gives the result 2 ( π m N ) ( w N ) 2 < 0 . By solving π m N w N = 0 , we obtain w N , and substituting this into Equation (5) gives θ A N . Finally, substituting the results from Equations (3)–(5) into the expressions gives the results in Table 3. □
Proof of Proposition 2.
According to Equation (6), the Hessian matrix is H = 2 1 β 2 1 β 2 1 β 2 β ( 1 β ) , where H 1 = 2 1 β < 0 , H 2 = 4 β ( 1 β ) > 0 . Hence, π r L is jointly concave in p A L and p B L . By solving π r L p A L = 0 and π r L p B L = 0 simultaneously, we obtain p A L = 1 + w L + θ A L 2 , p B L = β + w L + θ B L 2 . Substituting p A L and p B L into Equation (7), and solving for π m L w L = 0 , we obtain w L = β θ B L 2 . Substituting the results into Equations (8) and (9) yields 2 π A L ( θ A L ) 2 = 1 2 ( 1 β ) < 0 and 2 π B L ( θ B L ) 2 = 1 2 β ( 1 β ) < 0 . By solving π A L θ A L = 0 and π B L θ B L = 0 simultaneously, we obtain θ A L = 2 ( 1 β ) 4 β , θ B L = β ( 1 β ) 4 β . Therefore, the equilibrium prices and expected profits for all players is illustrated in Table 4. Substituting the equilibrium prices into equation p B L β < p A L < p B L + ( 1 β ) , we find that for any value of β , the condition holds. □
Proof of Corollary 1.
From Proposition 2, it is evident that p A L β = 3 2 ( 4 β ) 2 < 0 , p B L β = β 2 8 β + 13 ( 4 β ) 2 > 0 , w L β = 6 ( 4 β ) 2 > 0 , θ A L β = 6 ( 4 β ) 2 < 0 , D B L β = 1 ( 2 β 8 ) 2 > 0 and D A L β = 2 β 2 10 β + 17 2 ( 1 β ) 2 ( 4 β ) 2 > 0 are all valid. When θ B L β = β 2 8 β + 4 ( 4 β ) 2 > 0 , we have 0 < β < 4 2 3 , which gives us the conclusion that θ B L β > 0 if 0 < β < 4 2 3 . □
Proof of Proposition 3.
Given the equations 2 π r R ( p A L ) 2 = 2 ( 1 β ) < 0 and 2 π m R ( p B L ) 2 = 2 β ( 1 β ) < 0 , simultaneously solve for π r R p A R = 0 and π m R p B R = 0 , obtaining values for p A R = 2 ( 1 β ) + ( 2 + β ) w R + 2 θ A R + θ B R + δ 4 β and p B R = β ( 1 β ) + 3 β w R + β θ A R + 2 θ B R + 2 δ 4 β . Substituting these results into Equation (11), we obtain 2 π m R ( w 1 R ) 2 = 16 + 2 β ( 4 β ) 2 < 0 . Let π m R w 1 R = 0 , we obtain w R = β 2 β θ B R 8 θ A R + 8 2 ( 8 + β ) . Similarly, we can derive values for θ A R = β 5 + ( 3 δ ) β 4 + ( 22 δ ) β 3 56 β 2 96 + 8 δ β + 64 δ + 128 2 ( 4 β ) ( 2 + β ) ( 16 2 β 2 5 β ) and θ B R = β 5 + ( 2 δ ) β 4 + ( δ 21 ) β 3 + ( 21 δ 22 ) β 2 + ( 16 δ + 40 ) β 64 δ ( 4 β ) ( 2 + β ) ( 16 2 β 2 5 β ) by setting π A R θ A R = 0 and π B R θ B R = 0 . To ensure that θ A R > 0 and θ B R > 0 , there exists threshold δ 1 = β 5 + 2 β 4 21 β 3 22 β 2 + 40 β β 4 β 3 21 β 2 16 β + 64 as well as β 1 and β 2 ( 0 < β 1 < β 2 < 1 ), such that β 5 + ( 2 δ ) β 4 ( 21 δ ) β 3 ( 22 21 δ ) β 2 + ( 40 + 16 δ ) β 64 δ = 0  is satisfied. Therefore, we can obtain β 1 < β < β 2 and 0 < δ < δ 1 . Thus, we obtain the equilibrium prices and expected profits for the various entities, as shown in Table 5. Substituting the equilibrium prices into the condition, we derive the following result:
p A R p B R β = ( 8 β 2 - β ) ( β 5 + 2 β 4 21 β 3 22 β 2 + 40 β ) + ( β 4 β 3 21 β 2 16 β + 64 ) δ 4 ( 4 β ) ( 2 + β ) ( 16 2 β 2 5 β ) ( 8 + β ) 0 p B R p A R + 1 β = β 5 + ( 3 δ + 3 ) β 4 + ( 5 δ + 22 ) β 3 ( 56 + 42 δ ) β 2 + ( 24 δ 96 ) β + 64 δ + 128 2 ( 4 β ) ( 2 + β ) ( 16 2 β 2 5 β ) ( 8 + β ) 0
Proof of Proposition 4.
First, we define Δ π r L N = π r L π r N and Δ π m L N = π m L π m N , where Δ π r L N = β 3 37 β 2 + 44 β + 64 64 ( 4 β ) 2 ( 1 β ) and Δ π m L N = β 3 37 β 2 + 44 β + 64 32 ( 4 β ) 2 ( 1 β ) . Let f ( β ) = β 3 37 β 2 + 44 β + 64 be a parameter, and since 0 < β < 1 , we can derive a result 2 f ( β ) 2 = 6 β 74 < 0 . Let f β = 3 β 2 74 β + 44 = 0 , and solving for β 3 = 37 1237 3 , we find that there exists a threshold 0 < β 3 < 1 that maximizes f ( β 3 ) within the desired range 0 , 1 , ensuring f ( 0 ) = 64 > 0 and f ( 1 ) = 72 > 0 . Thus, when satisfies the condition, we can obtain Δ π r L N > 0 and Δ π m L N > 0 . Second Δ π r R N and Δ π m R N are monotonic continuous function. If β 1 < β < β 2 , let δ = 0 and δ = δ 1 , we can obtain Δ π r R N = 16 β 10 92 β 9 512 β 8 + 3781 β 7 + 3055 β 6 256 β ( 4 β ) 2 ( 1 β ) ( 8 β 2 2.5 β ) 2 ( 8 + β ) 2 + 50456 β 5 + 35248 β 4 + 210688 β 3 30032 β 2 + 98304 β 64 β ( 4 β ) 2 ( 1 β ) ( 8 β 2 2.5 β ) 2 ( 8 + β ) 2 ( 2 + β ) 2 > 0 and Δ π r R N = 16 β 10 + 47 β 9 166 β 8 231 β 7 + 2366 β 6 + 4055 β 5 10728 β 4 30592 β 3 64 ( β 4 β 3 21 β 2 16 β + 64 ) 2 ( 8 + β ) + 4096 β 2 + 32768 β 64 ( β 4 β 3 21 β 2 16 β + 64 ) 2 ( 8 + β ) > 0 respectively. Similarly, we can obtain Δ π m R N = 8 β 13 92 β 12 + 264 β 11 + 5016 β 10 1365 β 9 101856 β 8 35316 β 7 + 900864 β 6 64 β ( 4 β ) 2 ( 1 β ) ( 8 β 2 2.5 β ) 2 ( 8 + β ) 2 ( 2 + β ) 2 + 443328 β 5 3246592 β 4 1404298 β 3 + 3440640 β 2 64 β ( 4 β ) 2 ( 1 β ) ( 8 β 2 2.5 β ) 2 ( 8 + β ) 2 ( 2 + β ) 2 > 0 and Δ π m R N = 7 β 9 22 β 8 87 β 7 + 606 β 6 + 343 β 5 7528 β 4 9856 β 3 + 21504 β 2 + 40960 β 32 ( β 4 β 3 21 β 2 16 β + 64 ) 2 ( 8 + β ) > 0 . Therefore, if β 1 < β < β 2 and 0 < δ < δ 1 , we obtain Δ π r R N > 0 , Δ π m R N > 0 . Finally, let Δ π A L N = π A L π A N , Δ π B L N = π B L π B N , Δ π A R N = π A R π A N and Δ π B R N = π B R π B N , we find Δ π B R N = ( β 5 + ( δ 2 ) 47 β 4 + ( 21 δ ) β 3 + ( 22 21 δ ) β 2 ( 16 δ + 40 ) β + 64 δ ) 2 ( 8 β 2 β ) 8 β ( 8 + β ) ( 1 β ) ( 2 + β ) 2 ( β 2 + 2.5 β 8 ) 2 ( 4 β ) 2 > 0 Δ π A L N = β 2 24 β + 64 16 ( 4 β ) 2 > 0 , and Δ π B L N = β ( 1 β ) 4 ( 4 β ) 2 > 0 . Δ π A R N is a monotonic continuous function. Let δ = 0 and δ = δ 1 , we obtain Δ π A R N < 0 and Δ π A R N > 0 respectively. Applying the intermediate value theorem, we can assert that there exists a unique threshold
δ 2 = ( 4 β ) ( 4 β 4 4 β 3 + 72 β 2 + 64 β 128 + 2 4096 4 β 7 56 β 6 165 β 5 + 455 β 4 + 1738 β 3 1968 β 2 4096 β ) 4 ( 8 β 2 β ) ( 8 + β 2 )
such that π A R < π A N if 0 < δ < δ 2 . □
Proof of Proposition 5.
Let:
Δ π A L R = Δ π A L Δ π A R = M 3 4096 δ 2 16384 δ + 65536 16 ( 4 β ) 2 ( 1 β ) ( 8 β 2 2.5 β ) 2 ( 8 + β ) ( 2 + β ) Δ π r L R = Δ π r L Δ π r R = M 4 16384 δ 2 65536 δ + 262144 16 ( 4 β ) 2 ( β 1 ) ( 8 β 2 2.5 β ) 2 ( 8 + β ) ( 2 + β ) Δ π m L R = Δ π m L Δ π m R = M 5 16384 δ 2 65536 δ + 262144 64 ( 4 β ) 2 ( 1 β ) ( 8 β 2 2.5 β ) 2 ( 8 + β ) 2
where:
M 3 = β 10 + ( 6 2 δ ) β 9 + ( 67 δ 2 + 4 δ ) β 8 + ( 124 2 δ 2 + 50 δ ) β 7 ( δ 2 + 84 δ + 140 ) β 6 ( 64 δ 2 5632 δ + 1472 ) β 2 ( 1024 δ 2 14336 δ + 90112 ) β ( 16 δ 2 + 128 δ + 3644 ) β 5 ( 122 δ 2 32 δ + 4484 ) β 4 + ( 128 δ 2 3456 δ + 34120 ) β 3 M 4 = 4 β 10 + ( 8 δ + 24 ) β 9 + ( 12 δ 2 8 δ + 112 ) β 8 ( 32 δ 2 + 392 δ + 1544 ) β 7 ( 148 δ 2 664 δ + 4619 ) β 6 + ( 24 δ 2 + 5680 δ + 14077 ) β 5 + ( 256 δ 2 11840 δ + 48100 ) β 4 ( 2368 δ 2 + 25856 δ + 36608 ) β 3 + ( 11520 δ 2 + 56320 δ 220928 ) β 2 + ( 4096 δ 2 + 40960 δ + 57344 ) β M 5 = 4 β 10 + ( 8 δ + 24 ) β 9 + ( 12 δ 2 8 δ + 112 ) β 8 ( 32 δ 2 + 392 δ + 1544 ) β 7 ( 148 δ 2 664 δ + 4619 ) β 6 + ( 24 δ 2 + 5680 δ + 14077 ) β 5 ( 256 δ 2 + 11840 δ 48100 ) β 4 ( 2368 δ 2 + 25856 δ + 36608 ) β 3 + ( 11520 δ 2 + 56320 δ 220928 ) β 2 + ( 4096 δ 2 + 40960 δ + 57344 ) β
Thus, from the equations we deduce Δ π A L R > 0 , Δ π > 0 and Δ π m L R > 0 . Similarly, when δ 3 < δ < δ 1 , Δ π B L R > 0 holds true. When 0 < δ < δ 3 or δ 4 < δ < 1 , we obtain Δ π B L R < 0 . Given that δ 3 < δ 1 < δ 4 , we conclude Proposition 5b. □
Proof of Proposition 6.
It is clear that there exists β where δ 3 = δ 2 holds. Hence, we obtain δ 3 > δ 2 if β 1 < β < β , or δ 3 < δ 2 . Based on the proofs of Proposition 4 and Proposition 5, Proposition 6 follows naturally. □

References

  1. Wu, J.; Bi, G.; Xu, Y.; Dang, X. Channel structure of E-platform encroachment. RAIRO Oper. Res. 2023, 57, 157–181. [Google Scholar] [CrossRef]
  2. Ha, A.Y.; Tong, S.; Wang, Y. Channel structures of online retail platforms. Manuf. Serv. Oper. Manag. 2022, 24, 1547–1561. [Google Scholar] [CrossRef]
  3. Xie, P.; Shi, R.; Xu, D. Retailer service strategy on livestreaming platforms considering free riding behavior. Ann. Oper. Res. 2025, 344, 647–677. [Google Scholar] [CrossRef]
  4. Liu, Y.; Zhang, Z.J. Research note—The benefits of personalized pricing in a channel. Mark. Sci. 2006, 25, 97–105. [Google Scholar] [CrossRef]
  5. Ha, A.; Long, X.; Nasiry, J. Quality in supply chain encroachment. Manuf. Serv. Oper. Manag. 2016, 18, 280–298. [Google Scholar] [CrossRef]
  6. Li, T.; Xie, J.; Zhao, X. Supplier encroachment in competitive supply chains. Int. J. Prod. Econ. 2015, 165, 120–131. [Google Scholar] [CrossRef]
  7. Li, H.; Li, Z. Supplier encroachment in the supply chain in the e-commerce age: A systematic literature review. J. Theor. Appl. Electron. Commer. Res. 2021, 16, 2655–2671. [Google Scholar] [CrossRef]
  8. Zhang, C.; Li, C.; Lv, R. Research on platform encroachment considering service quality difference and quality sensitivity. Ind. Eng. Manag. 2020, 25, 77–85. [Google Scholar]
  9. Arya, A.; Mittendorf, B.; Sappington, D.E. The bright side of supplier encroachment. Mark. Sci. 2007, 26, 651–659. [Google Scholar] [CrossRef]
  10. Zhang, X.; Li, G.; Liu, M.; Sethi, S.P. Online platform service investment: A bane or a boon for supplier encroachment. Int. J. Prod. Econ. 2021, 235, 108079. [Google Scholar] [CrossRef]
  11. Guan, X.; Liu, B.; Chen, Y.J.; Wang, H. Inducing supply chain transparency through supplier encroachment. Prod. Oper. Manag. 2020, 29, 725–749. [Google Scholar] [CrossRef]
  12. Guo, L.; Shang, Y. Decision-making of cross-border e-commerce platform supply chains considering information sharing and free shipping. Sustainability 2023, 15, 3350. [Google Scholar] [CrossRef]
  13. Yuan, P.; Sun, J.; Ivanov, D. Manufacturer encroachment and carbon reduction decisions considering cap-and-trade policy and retailer investment. Front. Eng. Manag. 2024, 11, 326–344. [Google Scholar] [CrossRef]
  14. Yoon, D.H. Supplier encroachment and investment spillovers. Prod. Oper. Manag. 2016, 25, 1839–1854. [Google Scholar] [CrossRef]
  15. Sun, Z.M.; Xu, Q. Dynamic pricing for ride-hailing platforms with different competition conditions under stochastic demand. Chin. J. Manag. Sci. 2021, 29, 138–148. [Google Scholar]
  16. Zhen, X.; Xu, S. Who should introduce the third-party platform channel under different pricing strategies? Eur. J. Oper. Res. 2022, 299, 168–182. [Google Scholar] [CrossRef]
  17. Tang, F.; Guo, H.; Chen, L. Pricing strategy of platform competition considering cross-network externality. Chin. J. Manag. Sci. 2024, 32, 219–228. [Google Scholar]
  18. Tirole, J.; Bisceglia, M. Fair gatekeeing in digital ecosystems. J. Digit. Econ. 2023, 2, 45–67. [Google Scholar]
  19. Sun, J.; Wang, Z.; Qiao, Z.; Li, X. Dynamic Pricing Model for E-commerce Products Based on DDQN. J. Compr. Bus. Adm. Res. 2024, 1, 171–178. [Google Scholar] [CrossRef]
  20. Jiang, Y.; Xiang, L.; Liu, F.; Zheng, X. Retail platform business model selection considering heterogeneous consumers. Manag. Rev. 2022, 34, 192–202. [Google Scholar]
  21. Zha, Y.; Ren, L.; Li, Q. Cooperation or Coopetition? Online Platforms’ Private Label Products Encroachment and Brand Manufacturers’ Pricing Model Selection. J. Model. Manag. 2025, 20, 1081–1101. [Google Scholar] [CrossRef]
  22. Wang, Z.; Yang, T. Research on the Product Positioning Strategy of the Independent Seller under Platform Encroachment. Systems 2024, 12, 36. [Google Scholar] [CrossRef]
  23. Zhong, Q.; Wang, J.; Xie, J.; Lai, X. Sourcing channel decision in the presence of platform encroachment with quantity competition. Asia-Pac. J. Oper. Res. 2025, 42, 1–34. [Google Scholar] [CrossRef]
  24. Boakye, K.G.; Natesan, P.; Prybutok, V.R. A correlated uniqueness model of service quality measurement among users of cloud-based service platforms. J. Retail. Consum. Serv. 2020, 55, 102098. [Google Scholar] [CrossRef]
  25. Cai, Y.J.; Choi, T.M.; Zhang, J. Platform supported supply chain operations in the blockchain era: Supply contracting and moral hazards. Decis. Sci. 2021, 52, 866–892. [Google Scholar] [CrossRef]
  26. Chiang, W.Y.K.; Chhajed, D.; Hess, J.D. Direct marketing, indirect profits: A strategic analysis of dual-channel supply-chain design. Manag. Sci. 2003, 49, 1–20. [Google Scholar] [CrossRef]
  27. Hendershott, T.; Zhang, J. A model of direct and intermediated sales. J. Econ. Manag. Strategy 2006, 15, 279–316. [Google Scholar] [CrossRef]
  28. Abhishek, V.; Jerath, K.; Zhang, Z.J. Agency selling or reselling? Channel structures in electronic retailing. Manag. Sci. 2016, 62, 2259–2280. [Google Scholar] [CrossRef]
  29. Shen, Y.; Willems, S.P.; Dai, Y. Channel selection and contracting in the presence of a retail platform. Prod. Oper. Manag. 2019, 28, 1173–1185. [Google Scholar] [CrossRef]
  30. Chen, C.; Zhuo, X.; Li, Y. Online channel introduction under contract negotiation: Reselling versus agency selling. Manag. Decis. Econ. 2022, 43, 146–158. [Google Scholar] [CrossRef]
  31. Yan, Y.; Zhao, R.; Liu, Z. Strategic introduction of the marketplace channel under spillovers from online to offline sales. Eur. J. Oper. Res. 2018, 267, 65–77. [Google Scholar] [CrossRef]
  32. Ryan, J.K.; Sun, D.; Zhao, X. Competition and coordination in online marketplaces. Prod. Oper. Manag. 2012, 21, 997–1014. [Google Scholar] [CrossRef]
  33. Wang, L.; Chen, J.; Song, H. Marketplace or reseller? Platform strategy in the presence of customer returns. Transp. Res. E Logist. 2021, 153, 102452. [Google Scholar] [CrossRef]
  34. Yi, Z.; Wang, Y.; Liu, Y.; Chen, Y.J. The impact of consumer fairness seeking on distribution channel selection: Direct selling vs. agent selling. Prod. Oper. Manag. 2018, 27, 1148–1167. [Google Scholar] [CrossRef]
  35. Ballerini, J.; Yahiaoui, D.; Giovando, G.; Ferraris, A. E-commerce channel management on the manufacturers’ side: Ongoing debates and future research pathways. Rev. Manag. Sci. 2024, 18, 413–447. [Google Scholar] [CrossRef]
  36. Zhang, C.; Li, Y.; Ma, Y. Direct selling, agent selling, or dual-format selling: Electronic channel configuration considering channel competition and platform service. Comput. Ind. Eng. 2021, 157, 107368. [Google Scholar] [CrossRef]
  37. Li, P.; Wu, B. The Interplay of Manufacturer’s Channel Selections and Online Retailing Platform’s Information-Sharing Strategies. IEEE Trans. Eng. Manag. 2023; early access. [Google Scholar]
  38. Ha, A.Y.; Luo, H.; Shang, W. Supplier encroachment, information sharing, and channel structure in online retail platforms. Prod. Oper. Manag. 2022, 31, 1235–1251. [Google Scholar] [CrossRef]
  39. Luo, H.; Zhong, L.; Nie, J. Quality and distribution channel selection on a hybrid platform. Transp. Res. E Logist. 2022, 163, 102750. [Google Scholar] [CrossRef]
  40. Lin, G.H.; Zhang, J.; Zhang, Q. Strategic analysis of manufacturer encroachment in dual-channel supply chains with platform service. Int. J. Ind. Eng. Comput. 2024, 15, 519–540. [Google Scholar] [CrossRef]
  41. Zhu, H. Dual-channel strategy selection in multinational supply chain in e-commerce. Highlights Sci. Eng. Technol. 2024, 107, 180–189. [Google Scholar] [CrossRef]
  42. Li, Q.; Li, H. Pricing Decisions and Online Channel Selection Strategies in Dual-Channel Supply Chains Considering Blockchain. Discrete Dyn. Nat. Soc. 2022, 2022, 3027249. [Google Scholar] [CrossRef]
  43. Huang, F.; Pan, Y.; Zhao, Z.; Song, H.; Liu, Y. Manufacturer Channel-Selection Strategy Considering Information Sharing Under Uncertain Demand. Systems 2025, 13, 108. [Google Scholar] [CrossRef]
  44. Tsunoda, Y.; Zennyo, Y. Platform information transparency and effects on third-party suppliers and offline retailers. Prod. Oper. Manag. 2021, 30, 4219–4235. [Google Scholar] [CrossRef]
  45. Zhang, Q.; Liu, H.; Cai, Z. Hybrid Channel Structure and Product Quality Distribution Strategy for Online Retail Platform. PLoS ONE 2023, 18, e0285860. [Google Scholar] [CrossRef]
  46. Zhang, X.; Li, Y.; Zhu, J.; Zhou, X. Pricing game models of hybrid channel supply chain: A strategic consumer behavior perspective. J. Theor. Appl. Electron. Commer. Res. 2023, 18, 1177–1195. [Google Scholar] [CrossRef]
  47. Qi, L.; Song, H.; Xiao, W. Coopetition in Platform-Based Retailing: On the Platform’s Entry. Manag. Sci. 2024, in press.
  48. Wang, P.; Yan, R. Analysis on the Cooperation Strategy between the Core Hospital and Member Hospitals in the Medical Alliance—Based on Game Theory and Incentive Compatibility Theory. Oper. Res. Fuzziology 2022, 12, 724–729. [Google Scholar] [CrossRef]
  49. Chu, M.S.; Li, Y.J. The Strategy of Private Brand Introduction and Product Category Selection of E-commerce Platforms Considering Competition. Syst. Eng. Theory Pract. 2025, 25, 1–19. [Google Scholar]
  50. Liu, H.; Xu, T.; Jing, S.; Liu, Z.; Wang, S. The Interplay Between Logistics Strategy and Platform’s Channel Structure Design in B2C Platform Market. Eur. J. Oper. Res. 2023, 310, 812–833. [Google Scholar] [CrossRef]
  51. Kahneman, D.; Tversky, A. Prospect theory: An analysis of decision under risk. Econometrica 1979, 47, 363–391. [Google Scholar] [CrossRef]
  52. Nascimento Junior, A.J.; Klotzle, M.C.; Brandão, L.E.T.; Pinto, A.C.F. Prospect theory and narrow framing bias: Evidence from emerging markets. Q. Rev. Econ. Financ. 2021, 80, 90–101. [Google Scholar] [CrossRef]
  53. Feng, Y.; Chen, S.Y.; Wei, M.; Zhang, Y.Z. Optimal gray market structure and pricing decisions considering reference price effect. Chin. J. Manag. Sci. 2024, 1–13. [Google Scholar] [CrossRef]
Figure 1. Three channel strategies for the manufacturer.
Systems 13 00416 g001
Figure 2. (ac) Demand analysis for the platforms under different consumer valuations (i.e., v 1 , v 2 and v ˜ ).
Systems 13 00416 g002
Figure 3. The effect of β and δ on equilibrium prices.
Systems 13 00416 g003
Figure 4. The effect of β and δ on θ j R .
Systems 13 00416 g004
Figure 5. Impact of β on the retail price p j i .
Systems 13 00416 g005
Figure 6. Impact of β on the wholesale price ω i .
Systems 13 00416 g006
Figure 7. Impact of β on the channel’s demand D j i .
Systems 13 00416 g007
Figure 8. Impact of β and δ on Δ π r L R .
Systems 13 00416 g008
Figure 9. Impact of β and δ on Δ π m L R .
Systems 13 00416 g009
Figure 10. Impact of β and δ on Δ π A L R .
Systems 13 00416 g010
Figure 11. Impact of β and δ on Δ π B L R .
Systems 13 00416 g011
Table 1. Comparison of literature reviews.
Relevant WorkProductPlatform EncroachmentChannel StrategyPlatform Service Differentiation
PricingMarketing
Encroachment
Platform CompetitionSynchronous Channel Reset Channel
Ha et al. [5]
Li and Li [7]
Zhang et al. [8]
Guan et al. [11]
Zhen and Xu [16]
Tang and Guo [17]
Wang and Yang [22]
Zhong et al. [23]
Chiang et al. [26]
Ballerini et al. [35]
Zhang et al. [36]
Li and Wu [37]
This study
Table 2. Abbreviation list.
AbbreviationDescription
Decision Variables
p j i The retail price of the product
w j i The wholesale price of the product
θ j i The unit commission rate charged by the platform j
Parameters
v The consumer valuation of the product on platform A
β The coefficient of the platform service differentiation
δ The unit channel setup cost for the manufacturer to establish a new channel on platform B in strategy R
D j i The platform’s demand under the channel strategy i
U j i The consumers’ utility for purchasing the product on the platform j
π k i The expected profit of the manufacturer (retailer) under the channel strategy i
π j i The expected profit of the platform j under the channel strategy i
Table 3. Equilibrium results in strategy N .
Strategy N
ω N * 1 4 p A N * 7 8
θ A N * 1 2 π r N * 1 32
π m N * 1 32 π A N * 1 16
Table 4. Equilibrium results in strategy L .
Strategy L
w L 3 β 8 2 β p A L 14 5 β 16 4 β
p B L β ( 13 4 β ) 16 4 β θ A L 2 ( 1 β ) 4 β
θ B L β ( 1 β ) 4 β π r L 20 7 β 2 + 5 β 16 ( 1 β ) ( 4 β ) 2
π m L 20 7 β 2 + 5 β 8 ( 1 β ) ( 4 β ) 2 π A L 5 β ( 4 β ) 2
π B L β ( 1 β ) 4 ( 4 β ) 2 --
Table 5. Equilibrium results in strategy R if β 1 < β < β 2 and 0 < δ < δ 1 .
Strategy R
w R β 6 + ( 3 δ ) β 5 + ( 2 δ 17 ) β 4 + ( 25 δ 66 ) β 3 ( 8 δ + 24 ) β 2 + ( 320 32 δ ) β 256 δ + 512 2 ( 4 β ) ( 2 + β ) ( 16 2 β 2 5 β ) ( 8 + β )
p A R β 6 + ( δ 1 ) β 5 + ( 57 + 4 δ ) β 4 + ( 42 15 δ ) β 3 ( 76 δ + 776 ) β 2 + ( 80 δ 384 ) β + 384 δ + 1792 2 ( 4 β ) ( 2 + β ) ( 16 2 β 2 5 β ) ( 8 + β )
p B R 2 β 6 + ( 30 + 4 δ ) β 5 + ( 15 δ 17 ) β 4 ( 47 δ + 590 ) β 3 ( 136 δ + 168 ) β 2 + ( 1472 + 192 δ ) β + 512 δ 2 ( 4 β ) ( 2 + β ) ( 16 2 β 2 5 β ) ( 8 + β )
θ A R β 5 + ( 3 δ ) β 4 + ( 22 δ ) β 3 56 β 2 96 + 8 δ β + 64 δ + 128 2 ( 4 β ) ( 2 + β ) ( 16 2 β 2 5 β )
θ B R β 5 + ( 2 δ ) β 4 + ( δ 21 ) β 3 + ( 21 δ 22 ) β 2 + ( 16 δ + 40 ) β 64 δ ( 4 β ) ( 2 + β ) ( 16 2 β 2 5 β )
π r R M 1 [ β 5 + ( δ 3 ) β 4 + ( δ 22 ) β 3 + 56 β 2 + ( 96 + 8 δ ) β 64 δ 128 ] 4 ( 4 β ) 2 ( 8 + β ) 2 ( 16 2 β 2 5 β ) 2 ( 1 β )
π m R M 2 + 262144 δ 2 8 β ( 4 β ) 2 ( 8 + β ) 2 ( 16 2 β 2 5 β ) 2 ( 2 + β ) 2 ( 1 β )
π A R [ β 5 + ( δ 3 ) β 4 + ( δ 22 ) β 3 + 56 β 2 + ( 96 + 8 δ ) β 64 δ 128 ] 2 8 ( 4 β ) 2 ( 1 β ) ( 16 2 β 2 5 β ) 2 ( 8 + β ) ( 2 + β )
π B R [ β 5 + ( δ 2 ) β 4 + ( 21 δ ) β 3 + ( 22 21 δ ) β 2 ( 40 + 16 δ ) β + 64 δ ] ( 8 β 2 β ) 4 β ( 4 β ) 2 ( 2 + β ) 2 ( 16 2 β 2 5 β ) 2 ( 8 + β ) ( 1 β )
Disclaimer/Publisher’s Note: The statements, opinions and data contained in all publications are solely those of the individual author(s) and contributor(s) and not of MDPI and/or the editor(s). MDPI and/or the editor(s) disclaim responsibility for any injury to people or property resulting from any ideas, methods, instructions or products referred to in the content.

