1. Introduction
China’s A-share market has witnessed remarkable growth with China’s economic expansion and continuous capital market reforms. By the end of 2023, there were 222.94 million individual investors [
1], accounting for 15.8% of the total population. With over 5181 listed companies and a total market capitalization of 77.31 trillion yuan [
2], equivalent to 61.3% of China’s GDP, it has become a key player in investment, capital pricing, and asset allocation. While global stock markets like the US market have demonstrated their significant influence on global economies, China’s A-share market, characterized by its unique investor structure dominated by retail investors and wide-ranging industrial coverage, has emerged as a critical component in China’s economic development. Given the remarkable scale and significance of the A-share market, accurately predicting stock prices has become a pivotal issue for both investment practice and academic research.
Stock price prediction remains a formidable challenge in financial markets due to the inherent complexity of stock data, which is characterized by nonlinear trends, high-frequency fluctuations, and significant noise. In recent years, machine learning techniques have become powerful tools to address these challenges by uncovering hidden patterns and dependencies in financial time series. An increasing number of studies have emphasized the integration of diverse data sources, such as investor sentiment from social media and news articles and technical indicators like candlestick charts, to enhance predictive accuracy. Sentiment analysis of textual data, including tweets and financial reports, has proven valuable in capturing market psychology and its impact on price movements. In parallel, deep learning architectures, particularly LSTM networks and their bidirectional variants, have demonstrated exceptional capability in modeling temporal dependencies and mitigating noise in stock price sequences [
3,
4,
5].
However, the existing research exhibits notable limitations across three crucial dimensions. First, the majority of sentiment indicators operate by aggregating daily comments, disregarding the temporal dynamics between intraday and post-market periods [
6,
7,
8]. Recent breakthroughs in behavioral finance [
9,
10,
11,
12,
13,
14,
15] have emphasized that intraday sentiment serves as a transient yet vital predictor of short-term returns. This is because the market is influenced by different mechanisms during trading hours and after the market closes. Regrettably, this significant temporal aspect has received scant attention in previous studies. Second, although deep learning models such as LSTM, convolutional neural network (CNN), and temporal convolutional network (TCN) have demonstrated superior performance over classical machine learning methods in capturing nonlinear patterns [
3,
4,
5,
7], their “black-box” characteristics pose challenges for practical implementation in regulated financial settings. In regulated financial environments, transparency and interpretability are of utmost importance, and the opaqueness of these models restricts their wide-scale adoption. Third, prevailing studies primarily rely on statistical accuracy metrics for model validation while mainly ignoring real-world trading strategy simulations with transaction cost constraints. In particular, there is a lack of back-testing in China’s T+1 stock market. As a result, it remains uncertain whether algorithmic trading can generate profits in this specific market context. Given the unique trading rules and market structure of China’s T+1 stock market, the applicability and profitability of existing models need to be further investigated.
To address these gaps, this study proposes three innovations.
Temporally segmented sentiment construction: Leveraging the ERNIE 3.0 model [
11], we develop separate intraday and post-market sentiment indices from 3,923,492 Eastmoney Guba stock forum comments. This approach captures the temporal sentiment asymmetry that has been neglected in previous studies. The ERNIE 3.0 model, with its advanced natural language processing capabilities, enables us to analyze the sentiment of comments during different time periods more accurately. By constructing distinct sentiment indices for intraday and post-market periods, we can better understand how investor sentiment evolves over time and its impact on stock prices.
Explanability analysis: Our interpretable hybrid architecture utilizes the SHAP tool to analyze the model’s interpretability. In contrast to traditional deep learning models, which are often regarded as “black-boxes”, our approach provides insights into how the model makes predictions. The SHAP tool allows us to quantify the contribution of each input feature to the model’s output, enabling investors and regulators to understand the underlying factors driving stock price predictions.
Quantitative trading backtesting under the T+1 trading mechanism: We present a cost-aware strategy validation framework tailored to the Chinese market. Most academic studies neglect real-world trading constraints, and our framework aims to bridge this gap. The T+1 trading mechanism, a fundamental characteristic of the Chinese stock market, restricts investors from selling stocks on the same day they are bought, adding a significant layer of complexity to trading strategies. By integrating this rule into our backtesting framework, we can more accurately simulate real-world trading scenarios and evaluate the profitability of trading strategies under practical conditions.
The remainder of this paper is organized as follows:
Section 2 conducts a systematic literature review, critically analyzing existing research on market efficiency, sentiment analysis methodologies, and temporal dynamics in investor behavior while identifying key research gaps.
Section 3 details our methodological framework, including (1) temporal segmentation of investor sentiment using ERNIE 3.0, (2) LSTM-based prediction model architecture, (3) SHAP interpretability analysis, and (4) T+1 compliant trading strategy design.
Section 4 presents empirical results across three dimensions: predictive accuracy validation through RMSE and R
2 metrics, temporal sentiment contribution analysis via SHAP values, and backtesting outcomes of quantitative strategies under Chinese market constraints.
Section 5 concludes with contributions to stock price prediction and future research directions (see
Appendix A Table A1 for technical indicator formulas).
2. Literature Review
The enduring debate surrounding market efficiency continues to shape scholarly inquiry into price predictability within emerging equity markets. While the efficient market hypothesis (EMH) posits that asset prices instantaneously incorporate all available information [
1], empirical evidence from China’s stock market persistently challenges this theoretical paradigm. Initial linear analyses tentatively supported weak-form efficiency in Shanghai/Shenzhen indices via unit root tests, yet subsequent cointegration analyses revealed bidirectional predictability between daily returns, directly contradicting joint weak-form efficiency assumptions [
2]. This paradox intensifies when nonlinear approaches are applied: multifractal detrended fluctuation analysis (MF-DFA) has identified persistent long-range correlations in Chinese equities during crisis periods [
3], while liquidity–technical hybrid strategies have generated statistically significant excess returns over two decades, even after accounting for transaction costs and regulatory reforms [
4].
These empirical observations align with behavioral finance frameworks demonstrating how noise trader dynamics [
5] and systematic overreaction to news distort price discovery—mechanisms particularly pronounced in retail investor-dominated markets like China. Barberis et al. [
6] modeled investor cognitive biases through conservatism (slow belief updating) and representativeness (overweighting salient/extreme information), explaining short-term underreaction (momentum effects) and long-term overreaction (reversal effects). Kariofyllas et al. [
7] extended this framework under market stress, revealing that stress conditions exacerbate conservative bias-induced momentum effects, particularly post-Quantitative Easing interventions. Yu et al. [
8] identified diverging momentum-reversal patterns in Chinese markets: low-turnover-ratio firms exhibit winner-minus-loser momentum, while high-turnover-ratio firms demonstrate return reversals—a dichotomy resonant with our hypothesis of distinct intraday (noise-driven) versus post-market (value-biased) sentiment mechanisms. Complementing this, Mugerman et al. [
9] empirically demonstrated retail investors’ heightened sensitivity to attention-grabbing signals (e.g., exclamation marks in financial product names), establishing direct neurocognitive linkages between sentiment indicators and trading behavior. Gao and Zhang [
10] advanced predictive methodologies through a composite investor sentiment index integrating five objective and one subjective indicator, with VMD-LSTM analysis confirming strong bidirectional interactions between sentiment and stock returns, thereby formalizing theoretical foundations for sentiment-driven price prediction.
Recent advancements in sentiment quantification have transformed our capacity to operationalize these behavioral insights. Conventional proxies, including survey-based indices [
11,
12], and composite metrics derived from the market, such as closed-end fund discounts [
13,
14] and IPO volumes [
10], exhibit temporal latency in signal transmission but also suffer from systematic conflation with macroeconomic confounders. Natural language processing (NLP) breakthroughs address these limitations through real-time analysis of unstructured textual data. Early lexicon-based approaches [
15,
16,
17], though interpretable, failed to capture contextual semantics and evolving financial vernacular. Machine learning classifiers, such as support vector machines (SVM) [
18,
19] and naïve Bayes classifiers [
20,
21], improved accuracy but required extensive labeled datasets [
22].
Several deep-learning models have advanced sentiment analysis. Word2Vec [
23] captures semantic relationships through distributed vector representations, while ELMo [
24] addresses polysemy via context-aware embeddings. BERT [
25], with its bidirectional transformers and masked language modeling, significantly enhances contextual understanding. In Chinese NLP tasks, the ERNIE model [
26] stands out by integrating external knowledge and phrase-level masking strategies, achieving superior performance in sentiment classification and named entity recognition. The integration of such advanced sentiment quantification techniques with sequential models like long short-term memory (LSTM) and temporal convolutional networks (TCN) presents novel opportunities. For instance, real-time sentiment signals extracted from unstructured textual data could be processed through LSTM networks to model temporal dependencies in investor sentiment-driven price movements, potentially enhancing short-term forecasting accuracy—a persistent challenge in emerging markets.
Architectural innovations in sequential modeling further complicate the prediction landscape, while recurrent neural networks (RNNs) and their variants have become central to modeling sequential financial data. Traditional RNNs capture temporal dependencies through recurrent connections but face gradient vanishing or explosion issues in long sequences [
27]. LSTM networks overcome these limitations via gating mechanisms (forget/input/output gates), enabling effective long-term dependency capture [
28]. Recent empirical studies [
29] have highlighted the superior performance of LSTMs in short-term stock price forecasting, achieving an average prediction accuracy of 89.7% in financial market predictions, outperforming baseline models significantly across heterogeneous datasets (technology/pharmaceutical sectors). However, model efficacy exhibits significant dependence on market dynamics and sector characteristics: convolutional neural networks (CNNs) excel at capturing localized volatility patterns in emerging markets like the National Stock Exchange (NSE) in India [
30], while temporal convolutional networks (TCN) dominate U.S. equity prediction through dilated causal convolutions, reducing errors across technology (INTC), finance (JPM), and retail (AMZN) sectors [
31]. Notably, LSTMs maintained competitive advantages in consumer goods (e.g., KO), suggesting sector-specific volatility regimes influence architectural suitability.
Contemporary research has established intraday sentiment as a transient predictor of short-term returns through distinct behavioral mechanisms. Renault [
32] shows that intraday sentiment derived from high-frequency social media data (StockTwits) can predict short-term returns, especially during market close intervals, with price pressures reversing after trading hours—highlighting divergent mechanisms between intraday noise trading (liquidity constraints) and post-market sentiment absorption. By constructing transparent and replicable investor sentiment indicators, the research provides direct empirical evidence of sentiment-driven intraday trading activities, particularly emphasizing the impact of sentiment fluctuations among novice traders on market dynamics. Broadstock and Zhang [
33] corroborate this using U.S. high-frequency data, showing that social media sentiment significantly influences intraday returns. Gillet and Renault [
34] corroborate these findings, emphasizing that algorithmic traders incorporate public information quickly during trading hours, while post-market periods experience delayed reactions due to reduced arbitrage. Seok et al. [
35] identify 30-minute persistence of sentiment-driven mispricing before correction, while subsequent work [
36] reveals asymmetric intraday sentiment responses to macroeconomic announcements (e.g., temporary sentiment suppression following GDP growth disclosures). Gao et al. [
37] emphasize the critical role of overnight information in driving intraday momentum, particularly following negative shocks, whereas Wang [
38] observes stronger trading-hour correlations between negative sentiment and returns, suggesting heightened behavioral biases among intraday traders. Yang [
39] extends this by showing that social media sentiment can induce persistent intraday mispricing, requiring several days for correction, pointing to unresolved interactions between intraday and post-market sentiment. Existing studies establish intraday sentiment as a transient predictor of short-term returns, driven by distinct behavioral mechanisms. However, no study systematically examines the potential for isolating intraday and post-market sentiment to improve price prediction accuracy. Our proposed temporally segmented sentiment construction, leveraging the ERNIE 3.0 model to develop separate intraday and post-market sentiment indices from Eastmoney Guba stock forum comments, aims to fill this gap by capturing the temporal sentiment asymmetry neglected in previous studies.
The “black-box” nature of machine learning models remains a persistent criticism in financial applications, which raises concerns about their lack of transparency in decision-making. Model-agnostic post hoc explanation methods—particularly local interpretable model-agnostic explanations (LIME) and Shapley additive explanations (SHAP)—have emerged as vital transparency tools. While LIME approximates complex models locally via linear surrogates, SHAP employs game-theoretic principles to quantify feature contributions through Shapley values. In financial contexts, SHAP has proven instrumental in demystifying deep learning frameworks: Deng et al. [
40] proposed an integrated XGBoost–NSGAII–SHAP framework to predict and explain stock price crashes in the Chinese market, revealing through SHAP analysis that critical financial indicators vary significantly across market capitalizations. For small-cap firms, total assets growth rate emerged as the most influential predictor, whereas large-cap companies exhibited greater dependence on long-term debt-to-asset ratios and liquidity exceeding total assets ratios. Tran et al. [
41] utilized SHAP to isolate long-term debt ratios as key predictors of Vietnamese financial distress, while Kumar et al. [
42] applied SHAP to interpret deep Q-network (DQN) allocation logic in Sensex/Dow Jones trading strategies. Our hybrid architecture integrates SHAP analysis to illuminate prediction logic, directly addressing the opacity critique prevalent in existing literature.
In conclusion, the literature review has identified several gaps in the existing research on price predictability in emerging equity markets. Our proposed method’s innovations directly address these gaps. The temporally segmented sentiment construction captures the previously neglected temporal sentiment asymmetry, providing a more accurate understanding of investor sentiment’s impact on stock prices. The explainability analysis using the SHAP tool demystifies the “black-box” nature of deep learning models, allowing investors and regulators to understand the underlying factors driving stock price predictions. The quantitative trading backtesting under the T+1 trading mechanism accounts for real-world trading constraints in the Chinese market, enabling more practical evaluation of trading strategies. These innovations have the potential to advance the field of stock price prediction in emerging markets.
3. Materials and Methods
The proposed predictive framework comprises four integrated components: (1) construction of technical factor indicators from historical market data, (2) development of intraday and post-market sentiment indicators, (3) deep learning-based price modeling, and (4) comprehensive prediction analysis. The architectural workflow is shown in
Figure 1.
Initially, historical trading data were acquired through the BaoStock system and processed to generate technical indicators. Subsequently, investor commentary data underwent rigorous text preprocessing followed by sentiment classification using ERNIE 3.0 to construct time-partitioned sentiment indices. Following this integrated feature engineering process, multiple deep learning architectures (LSTM, CNN, CNN-LSTM, and two-layer LSTM) were implemented to predict stock price. The final comparative analysis evaluated prediction accuracy through evaluation metrics, model interpretability via SHAP, and practical viability using a backtesting framework with a quantitative trading strategy.
3.1. Textual Data Collection and Preprocessing
Our stratified sampling methodology selected the largest market capitalization stock from each of the 11 CSI industry classifications (China Securities Index Co., Ltd., 2021) meeting dual criteria: (1) IPO date before 2015 ensuring decade-long data continuity; (2) liquidity threshold of CNY 500 million average daily trading volume (2015–2024). This approach achieved cross-sector representativeness while capturing natural cross-sectional volatility differences.
As detailed in
Table 1, the final sample encompasses market leaders ranging from financial behemoths (ICBC: CNY 2.47 trillion market cap) to mid-cap innovators (ZTE: CNY 193.3 billion), exhibiting annualized volatility spanning 19.7% (Yangtze Power) to 46.0% (ZTE). The selected constituents collectively represent 22.5% of CSI 300’s total market capitalization, ensuring statistical significance.
This study utilized web scraping techniques to collect all Eastmoney Guba forum discussions for the eleven selected A-share stocks spanning the research period (1 January 2015–31 December 2024). The raw dataset underwent cleaning protocols to eliminate noise and enhance analytical validity. Non-textual elements, duplicate reposts, and semantically irrelevant content (such as ‘repost’) were systematically removed through regular expression matching and semantic filtering. This purification process reduced the dataset by 2.10% while preserving linguistically meaningful investor expressions. A total of 3,923,492 posts were obtained, with metadata including timestamps, titles, view counts, and reply counts. As illustrated in
Table 2, these discussions predominantly reflect retail investor sentiment, characterized by emotionally charged language (e.g., speculative claims like “Fear Nothing! Institutions Keep Buying…” or pessimistic remarks such as “Run! Run Now!”). This feature makes the data highly suitable for assessing investor sentiment dynamics.
These sector-leading stocks have high liquidity and strong investor engagement, with their stock forums averaging over 900 monthly comments.
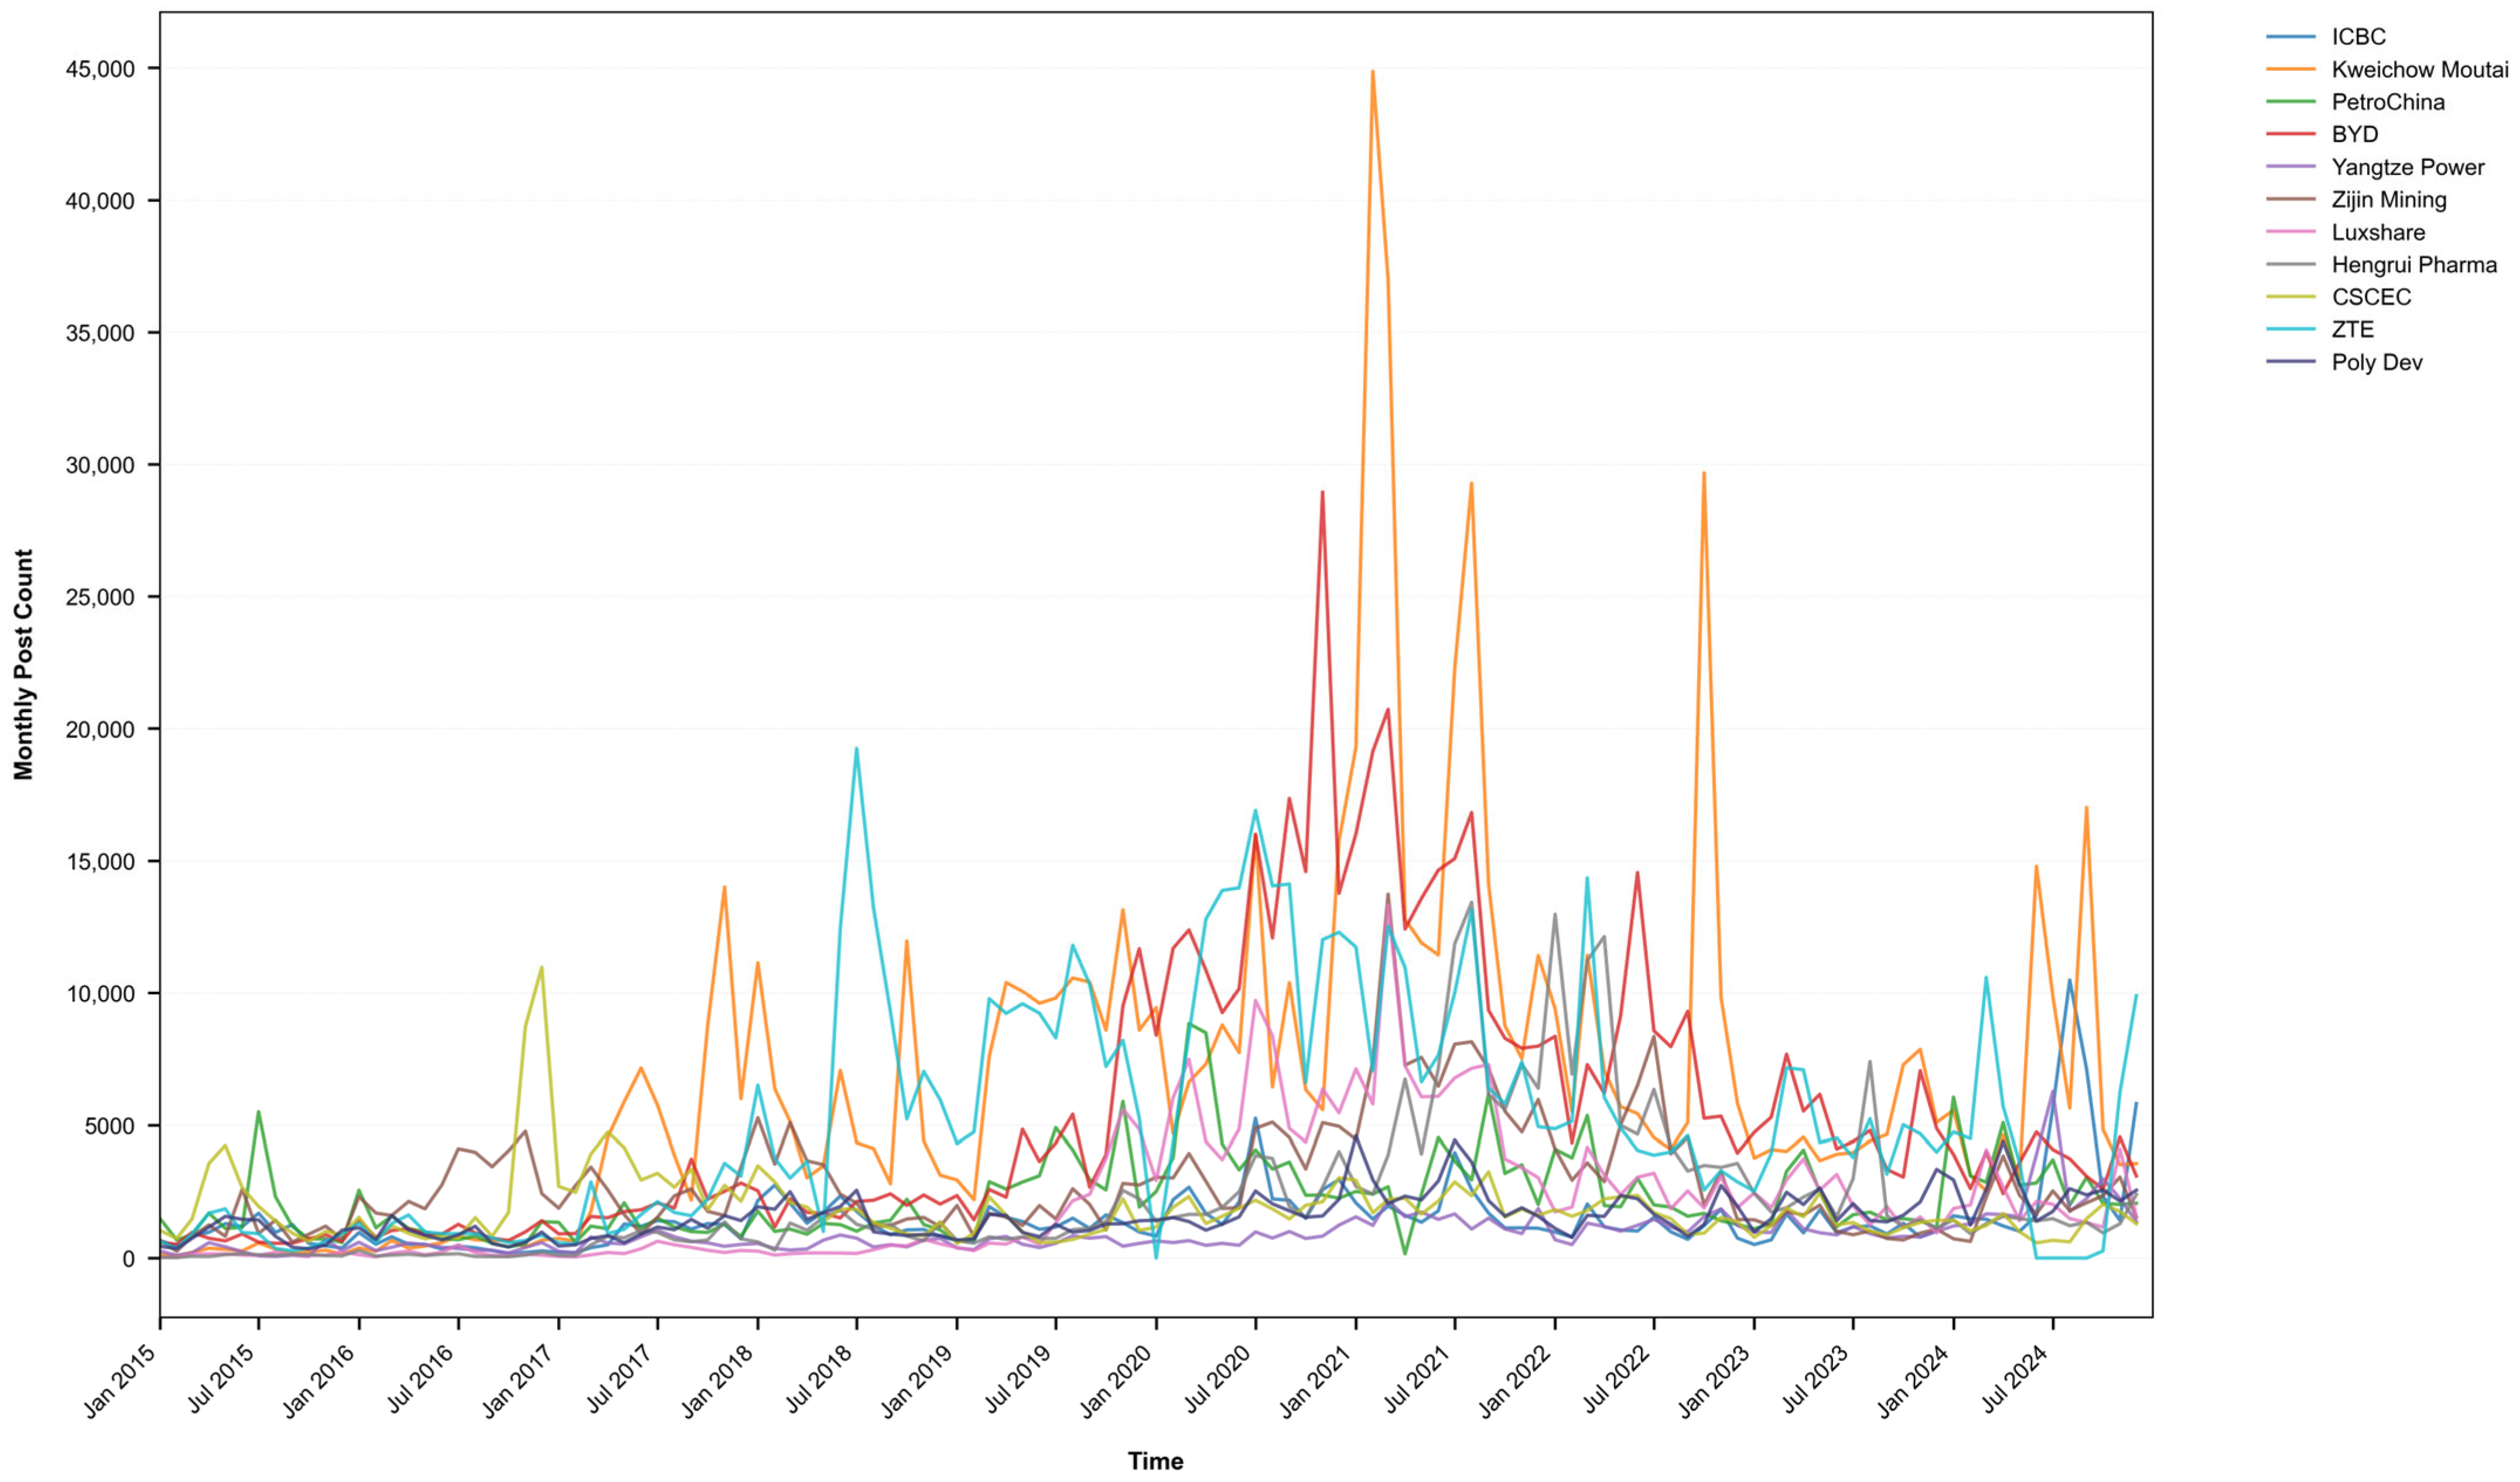
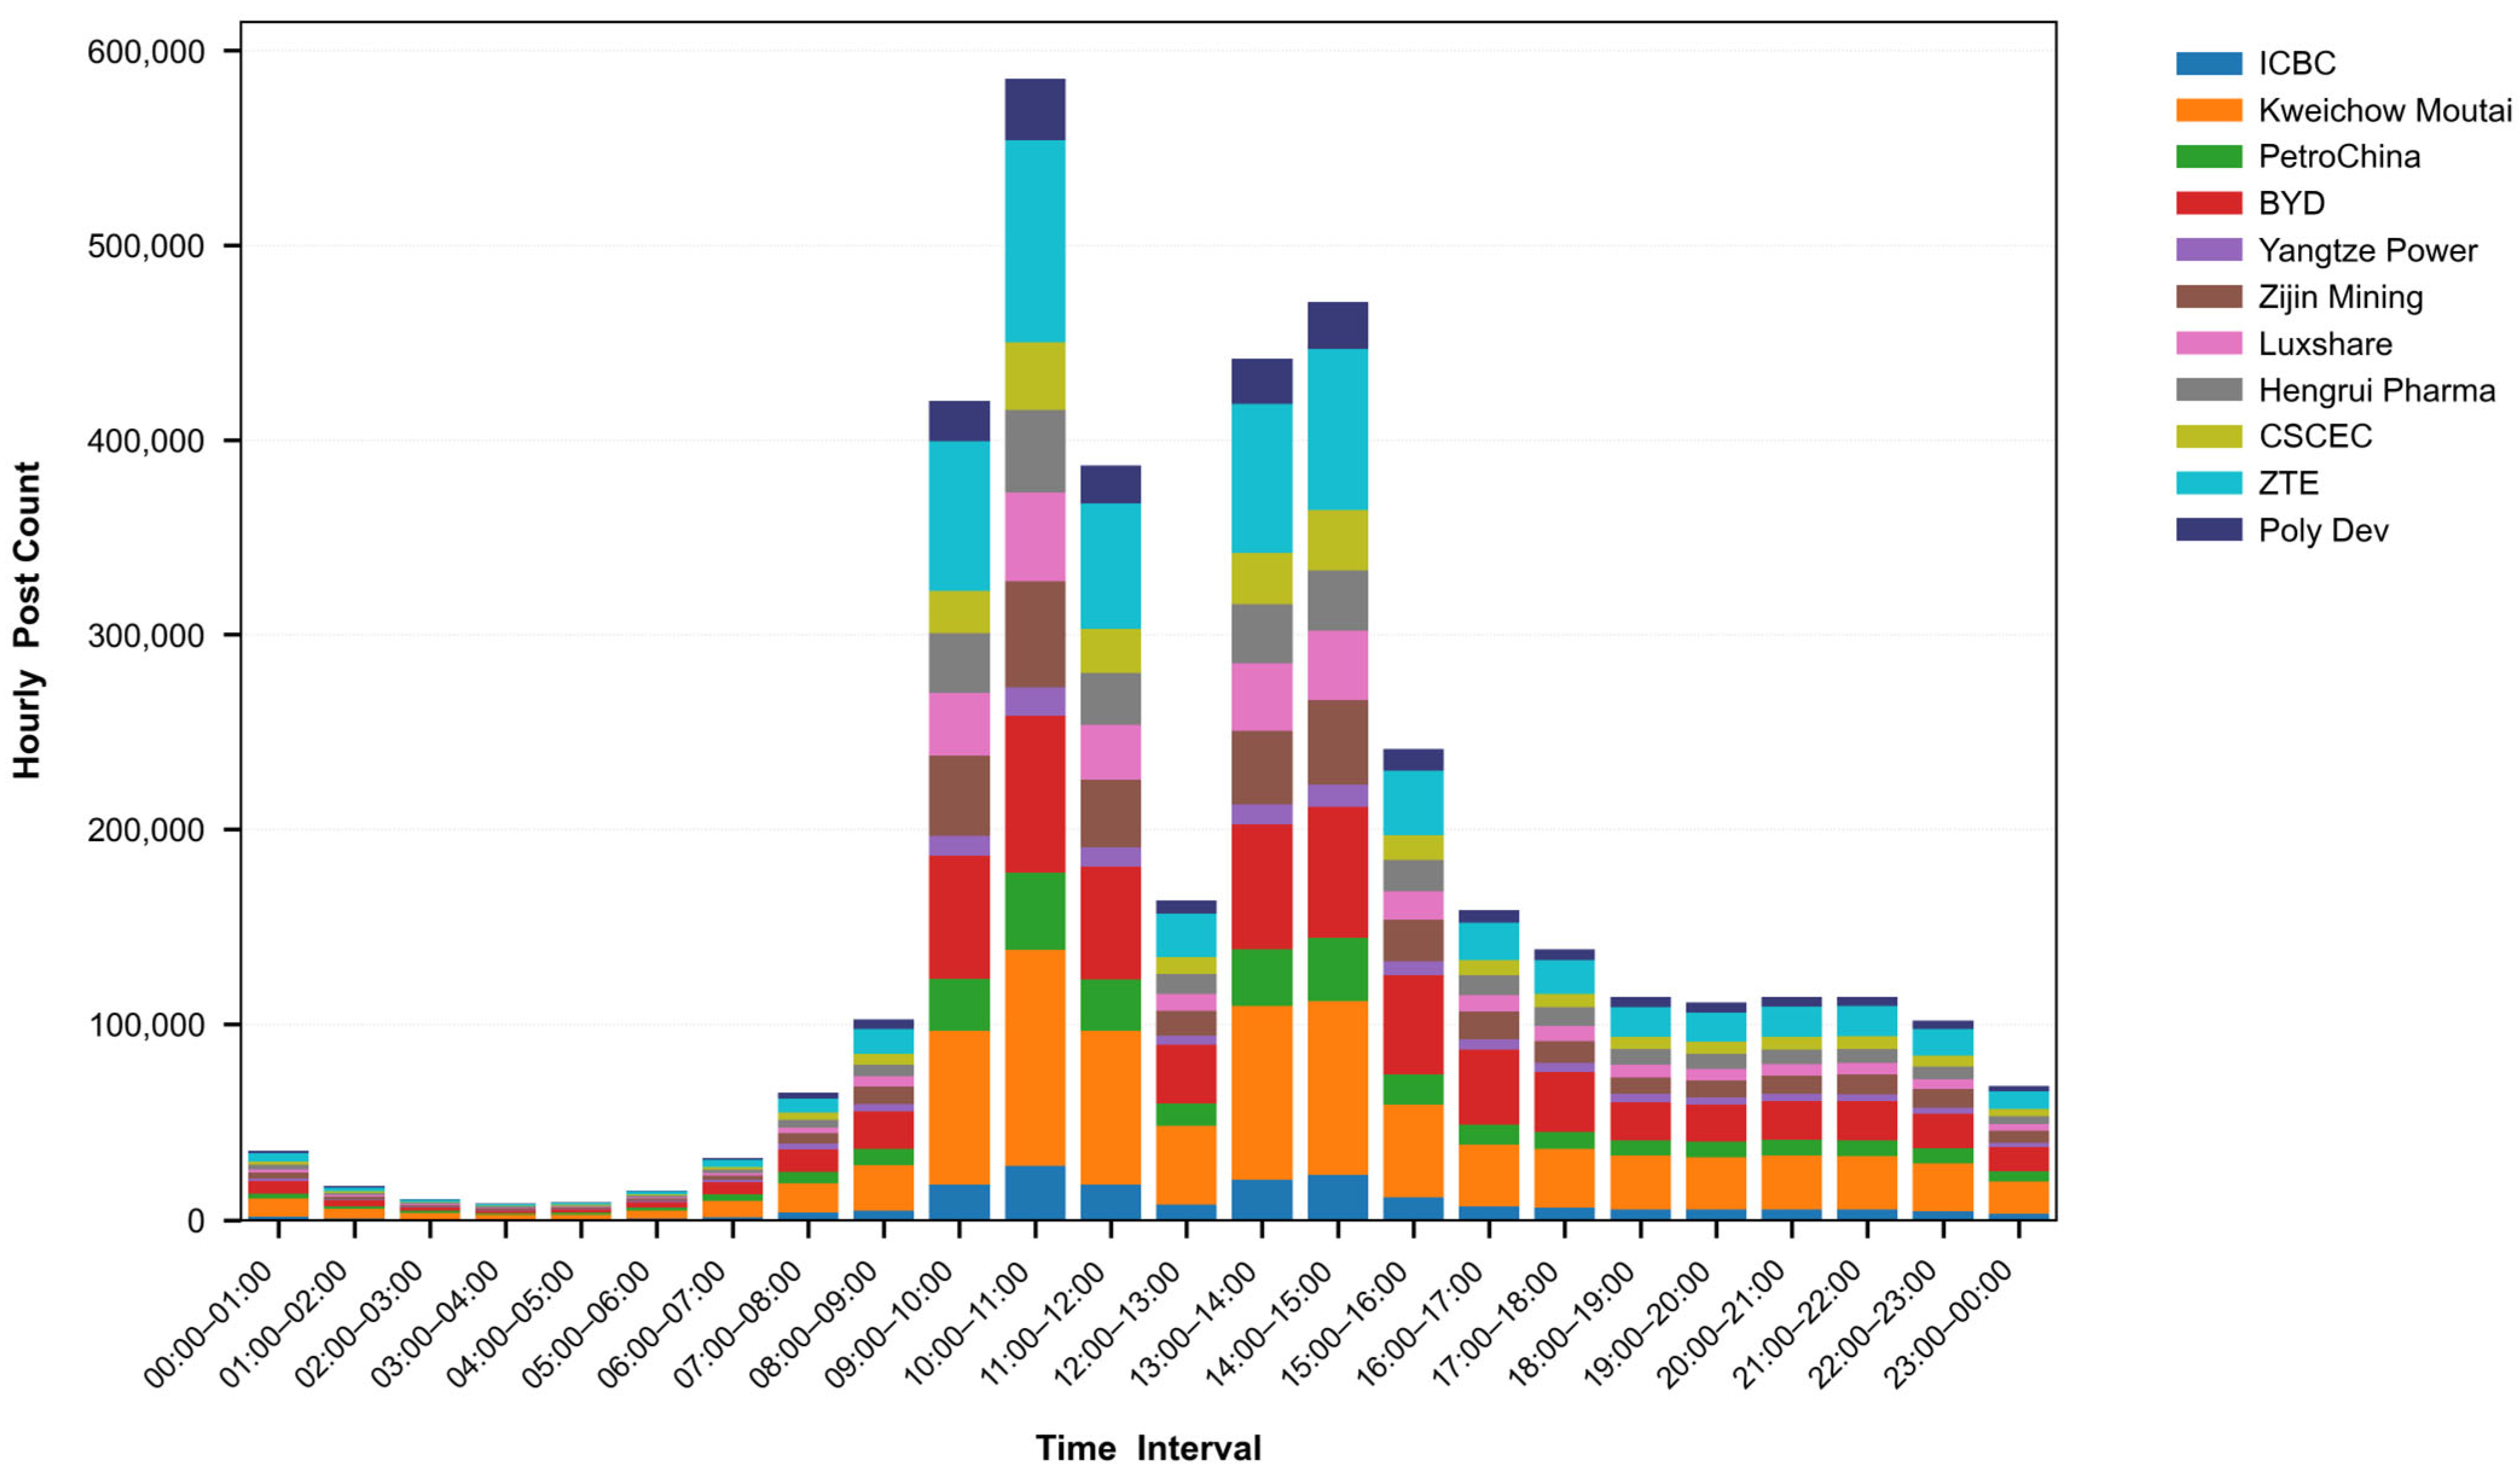
Figure 2 shows monthly post volumes with an overall upward trend due to internet penetration and retail participation growth but significant fluctuations driven by market and stock-specific events. For example, Kweichow Moutai reached 44,864 posts in February 2021, likely associated with its stock price hitting a historical high and market capitalization exceeding CNY 3.2 trillion. ZTE Corporation recorded 19,244 posts in July 2018, coinciding with the U.S. sanction-induced stock plunge in the preceding month and the subsequent lifting of the export ban on 2 July. The relatively low comment volume for Yangtze Power may correlate with its lower volatility. ICBC’s post volumes were stable except during systemic events like the 2020 liquidity crisis. To further dissect post engagement patterns, posts were categorized by hourly intervals (
Figure 3). This revealed that 62.92% of the posts occurred during trading hours (09:30–15:00), with 35.49% of posts being made during the morning session (09:30–11:30) and 23.26% during the afternoon session (13:00–15:00). Despite the concentration of activity during market hours, a significant proportion—25.26%—of posts were recorded after market close (15:00–22:00), indicating that investor sentiment continues to evolve beyond trading hours.
This temporal segmentation reveals critical differences in market dynamics. Intraday sentiment is closely linked to real-time market movements, with investors reacting immediately to stock price fluctuations and intraday developments. For instance, reactive comments like “High-Position Selling: The Peak Has Arrived” and panic-driven “Run! Run Now!” emerging during market volatility. Conversely, post-market dialogue transitions to fundamental analysis, exemplified by analyst assessments (“ZTE’s Valuation Gap Will Narrow in 2025”) and corporate announcements, which shape expectations for subsequent trading days. This dichotomy is exemplified by the contrast between intraday panic selling and post-market skepticism toward ubiquitous “buy” recommendations.
This temporal segmentation enhances predictive modeling through two distinct mechanisms: intraday sentiment correlates strongly with same-day price movements through immediate feedback loops, while post-market sentiment exhibits leading-indicator properties for next-day price loops by incorporating overnight information. The proposed segmentation of sentiment increases predictive resolution by isolating transient reactions from considered positioning, thereby enabling traders to differentiate between noise-driven volatility and expectation-driven trends. Such temporal granularity in sentiment analysis directly addresses the challenge of frequency mismatch in financial time series, offering methodological advantages for high-frequency market prediction.
3.2. Investor Sentiment Indicator Construction
While pretrained models like BERT and ERNIE 3.0 excel at capturing general linguistic patterns, their generic features lack alignment with the specialized lexicon and contextual nuances of investor sentiment analysis. To address domain adaptation challenges in financial sentiment analysis, we implemented a systematic fine-tuning protocol for the ERNIE 3.0-medium-zh model and curated a labeled financial corpus through stratified random sampling: 5000 posts were manually annotated from a raw dataset of 3,923,492 investor comments, yielding 1410 positive, 1830 neutral, and 1760 negative samples. Annotation criteria followed a three-tiered schema:
Positive (1): Explicit bullish signals (e.g., “bullish”, “buy”, and “rally”);
Negative (−1): Bearish expressions (e.g., “sell”, “plummet”, and “market manipulation”);
Neutral (0): Question-based phrasing (e.g., “When will dividends be paid?”), conditional statements (e.g., “buy if it drops”), or non-investment content.
The annotated dataset was partitioned into training (70%), validation (15%), and testing (15%) subsets using stratified random sampling to fine-tune both pretrained and fine-tuned versions of ERNIE 3.0 and BERT.
By leveraging this domain-specific fine-tuning, the models demonstrate enhanced capacity to decode critical sentiment cues such as speculative jargon (e.g., “limit-up”, “hyped”), irony, and context-dependent polarity shifts prevalent in market discussions.
Performance metrics for the three-class classification task (positive, neutral, and negative) were computed using macro-averaged accuracy, precision, recall, and F1-score, defined as
where
,
,
, and
denote true positives, true negatives, false positives, and false negatives for class
(positive, neutral, and negative). Macro-averaging mitigates class imbalance by assigning equal weight to all categories in order to enhance robustness and enable equitable evaluation of models’ per-class discriminative power.
To capture distinct temporal dynamics in investor sentiment, we segmented stock forum discussions into intraday (09:30–15:00) and post-market (15:00–next day 09:30) periods. Consistent with the logarithmic transformation methodology proposed by Antweiler [
43], we computed sentiment indices for each stock through the formula
where
P and
N, respectively, denote the counts of positive and negative comments during either intraday or post-market periods. This nonlinear transformation achieves two critical objectives: (1) maintaining sensitivity to absolute message quantities through log-ratio computation, and (2) implementing progressive discounting on polarized sentiment ratios, thus preventing overamplification of lopsided sentiment distributions.
3.3. Stock Price Prediction Model Design
The study utilized logarithmically transformed historical market data (open, close, high, low prices) to stabilize variance and normalize distribution and technical indicators including MA, EMA, MACD, ESI, WILLR, MOM, CMO, ULTOSC, OBV, and ADOSC, as detailed in
Appendix A Table A1. Input features were categorized into three distinct groups: technical indicators alone (tech), technical indicators combined with daily aggregated sentiment indicator (sent), and technical indicators integrated with intraday and post-market sentiment indicators (in-post). Data preprocessing encompassed three key procedures: (1) outlier detection and removal using interquartile range method, (2) min-max normalization for feature scaling, and (3) implementation of a rolling time window strategy where 10 consecutive trading days’ data were used to predict the subsequent day’s closing price. The dataset was temporally partitioned chronologically into training (70%), validation (20%), and test (10%) subsets.
Four deep learning architectures were implemented for comparative analysis: an LSTM network modeling temporal dependencies through gated memory cells; a CNN architecture extracting local volatility patterns via convolutional filters; a hybrid LSTM–CNN model fusing multi-scale temporal and spatial features through parallel pathways; and a stacked LSTM variant with two hidden layers to enhance nonlinear representation capacity. Optimization employed the Adam algorithm with mean squared error (MSE) as the training objective, while hyperparameter tuning relied on validation set performance, and final model evaluation was conducted on the held-out test set. Model evaluation synthesized five complementary metrics: MSE for training objective alignment, RMSE for dimensional interpretability, MAE for robustness against extreme values, MAPE for relative error quantification, and R2 for explained variance assessment. To isolate the contribution of sentiment features, ablation studies systematically compared prediction accuracy across the three input configurations. This comparative framework enabled rigorous evaluation of how temporal granularity in sentiment indicators—from daily aggregates to intraday/post-market signals—affected model performance when combined with traditional technical indicators.
3.4. Model Interpretability Analysis
To improve model interpretability, we utilized SHAP (Shapley additive explanations), a game theory-based framework for explaining machine learning outputs, to quantify feature-specific contributions. Global feature importance was evaluated by aggregating mean absolute SHAP values over all test samples for the 11 stocks, with results normalized to percentage contributions to facilitate cross-stock comparisons. This approach not only identified dominant predictors (e.g., WILLR and closing prices) but also revealed sector-specific heterogeneity. To capture directional impacts, SHAP summary plots were generated to visualize the polarity (positive/negative) and magnitude of feature influences on predicted values, enabling the detection of nonlinear relationships.
3.5. Empirical Validation Framework
The trading strategy’s economic viability was rigorously evaluated through a multi-dimensional backtesting protocol designed to replicate A-share market trading constraints. To ensure ecological validity, the analysis spanned a full market cycle (January 2015–December 2024), partitioned chronologically into three phases: 70% training set (2015–2021) with expanding window retraining, 20% validation set (2022–2023) for hyperparameter optimization, and 10% testing set (2024) for out-of-sample evaluation. Eleven representative A-share stocks stratified by sector and volatility profile were selected).
Transaction costs were meticulously modeled to reflect real-world execution friction, incorporating both explicit and implicit components. Explicit costs totaled 0.07% per round trip, including brokerage commissions (0.018%), settlement fees (0.002%), and stamp duty (0.05%). Implicit costs accounted for market impact, with 0.045% slippage calibrated. According to the Shanghai Stock Exchange Market Quality Report [
44], the price impact coefficient of stocks with a market capitalization of over 10 billion was 0.09% under the condition of a CNY 100,000 trading volume. These components collectively established a total transaction cost of 0.115%, which was integrated into the trading signal generation process.
The LSTM-based prediction model generated daily trading signals through a threshold-based decision rule, constrained by China’s T+1 trading mechanism requiring positions opened at day t’s opening price to be closed at day t+1’s opening price. To ensure realistic trade execution, all orders were assumed to fill at the open price.
Given the restrictive short-selling mechanisms in China’s A-share market (requiring margin trading qualifications and limited stock availability), the strategy operates under long-only conditions. A long position was initiated if
while exit was completely otherwise, where
was the predicted close,
was the opening price.
including slippage, was set at 0.115%.
Strategy performance was benchmarked against a buy-and-hold approach, enabling direct comparison of risk-adjusted returns while controlling for market beta exposure.
3.6. Computational Environment
The ERNIE 3.0-medium-zh architecture was fine-tuned using PaddlePaddle (v2.4.1) with an AdamW optimizer (learning rate = 2 × 10⁻⁵, weight_decay = 0.01) and cross-entropy loss. The training protocol employed 32-sample batches (determined via grid search as optimal) for 3 epochs (15 s/epoch) on NVIDIA Tesla V100 GPU, Santa Clara, CA, USA, using a maximum sequence length of 128 based on financial text analysis. The setup included a linear learning rate schedule with a 10% warmup ratio and a fixed random seed (42) for reproducibility, with validation-based early stopping triggered at <0.1% loss improvement threshold. The sentiment classification of 3,923,492 comments required 45 min of computational processing.
The experimental framework was implemented in a unified high-performance computing environment comprising an NVIDIA RTX 4090 GPU, Santa Clara, CA, USA (24 GB VRAM with CUDA 12.6 acceleration), 16-core AMD EPYC 9354 CPU @ 3.5 GHz, and 60 GB DDR5 RAM. This configuration supported three computational phases:
Model Training: Comparative testing across four deep learning architectures (LSTM/CNN/LSTM-CNN/two-layer LSTM) and three feature configurations (tech/sent/in-post) for eleven stocks completed in 130 min, demonstrating daily retraining feasibility.
Interpretability: SHAP analysis consumed 390 min for feature importance computation and visualization across all test samples.
Backtesting: The empirical validation cycle, including trading signal generation, transaction cost modeling, and benchmark comparison, required 109 min.
All components shared the same hardware cluster through containerized task scheduling, ensuring computational reproducibility.
4. Results and Discussion
4.1. Sentiment Classification
The experimental results in
Table 3 reveal significant differences in the performance of ERNIE 3.0 and BERT models before and after domain-specific fine-tuning. Both models exhibit substantial improvements across all metrics after the two-stage fine-tuning process, highlighting the critical role of task adaptation in financial sentiment analysis.
The experimental results demonstrate that the ERNIE 3.0 model, fine-tuned with annotated data, achieves superior performance in the three-class sentiment classification task, with a macro-averaged accuracy of 0.7680, significantly outperforming both the non-fine-tuned baseline models and the fine-tuned BERT model. This underscores the necessity of domain adaptation in financial text sentiment analysis. Generic pre-trained models (e.g., ERNIE 3.0 and BERT) exhibit poor classification performance (accuracy < 0.4) due to their inability to capture domain-specific terminology, sarcastic expressions, and hybrid sentiment structures prevalent in stock forum comments, highlighting the unique challenges of financial text analysis.
The annotated dataset exhibits pronounced class imbalance (negative: 44.54%, neutral: 31.62%, positive: 23.84%), reflecting stronger emotional articulation during market downturns. This asymmetry aligns with behavioral finance principles where loss aversion drives urgent negative expressions (e.g., panic-driven posts like “Run! Run Now!”), while positive sentiment remains subdued even during rallies—potentially due to profit-taking caution.
The performance improvement of fine-tuned models validates the efficacy of limited high-quality annotated data. Despite constituting only 0.13% of the total dataset, the annotated samples cover critical sentiment expression patterns (e.g., sarcastic phrases, industry jargon), enabling the model to identify non-explicit emotional signals.
However, the model still misclassifies certain ambiguous expressions.
Case 1: “Hengrui Pharmaceuticals will retrace its losses soon—with so many private equity funds backing it, what goes down must come up” was misclassified as negative, likely due to overemphasis on “losses” and “goes down” while neglecting the bullish implication of “come up”.
Case 2: “Shorting PetroChina = printing money!” was incorrectly labeled positive, potentially misinterpreting “printing money” without contextual understanding of short-selling mechanics.
Case 3: “BYD’s cars might be bad, but hype-driven investors keep pumping it. Even a pig can fly if it catches the right wind” was classified as negative, capturing “bad” and “pumping” while missing the bullish idiom “a pig can fly”.
Case 4: “Added positions today—4200 stocks fell, but those with bottom accumulation volume are my top picks” was mislabeled negative, focusing on “fell” and “bottom” while disregarding “added positions” and “top picks”.
Sentiment misclassification distorts price prediction accuracy, consequently generating unreliable signals in quantitative trading frameworks.
4.2. Empirical Validation of Predictive Performance
The empirical validation framework rigorously assessed the predictive efficacy of integrating intraday and post-market sentiment indicators with conventional technical factors across eleven representative stocks. Comprehensive preprocessing protocols were implemented to ensure data quality, including interquartile-range-based outlier correction, strategic handling of missing values through deletion during trading halts, and rigorous min-max normalization to mitigate feature scaling disparities. A sliding window approach (window size = 10 days) generated sequential input–output pairs while preventing data leakage through temporal partitioning (70% training, 20% validation, and 10% testing).
Comparative analysis of four deep learning architectures—LSTM, CNN, CNN-LSTM, and two-layer LSTM—revealed distinct performance hierarchies based on cross-stock-averaged metrics. The experimental results presented in
Table 4 reflect the averaged performance across eleven representative stocks, with each model’s performance metrics calculated through three-stage aggregation: individual prediction generation for each stock, metrics computation per stock, and final metrics averaging across the eleven stocks.
The results particularly highlight LSTM’s superior prediction accuracy, achieving an averaged test MSE of 0.00045 and R2 of 0.91707 integrating time-partitioned investor sentiment indicators. The 81.5% MSE reduction compared to CNN baseline (0.00243) demonstrates consistent outperformance across the eleven stocks. Notably, the cross-stock standard deviations for LSTM metrics remained below 0.00019 (MSE) and 0.049 (R2), confirming model robustness beyond input features selection.
Feature ablation studies highlighted the critical role of temporally stratified sentiment indicators. Models utilizing combined intraday–post-market sentiment (in-post) consistently surpassed those employing aggregated daily sentiment (sent) or technical factors alone (tech). For example, the LSTM’s MAE improved by 16.9% (0.00045 vs. 0.00066) when transitioning from “sent” to ”in-post” features, while the R2 gap between in-post and tech configurations widened to 1.5 percentage points (0.917 vs. 0.922). These results empirically validate the hypothesis that decoupling intraday and post-market sentiments provides superior informational granularity, enabling more precise quantification of investor sentiment across different periods.
Hyperparameter optimization via randomized search further enhanced model adaptability, yielding stock-specific configurations (
Table 5). By performing a randomized search for hyperparameter optimization, we can customize the model for each individual stock, enabling it to better adapt to the specific market conditions of each security. This not only improves the model’s ability to capture market trends but also enhances its reliability in financial forecasting, highlighting the crucial role of hyperparameter optimization in the field of finance.
The LSTM’s architectural superiority in modeling financial time series, coupled with optimized hyperparameter configurations, provides a robust framework for adaptive market forecasting. This methodology advances quantitative finance by systematically integrating behavioral signals with traditional market data, offering a replicable paradigm for developing sentiment-aware trading strategies.
4.3. Interpretability Analysis
To enhance the interpretability and generalizability of findings, we conducted SHAP (Shapley additive explanations) analysis across all 11 sample stocks. Feature importance rankings were systematically quantified using SHAP values, with SHAP summary plots visualizing the directional impacts of key predictors.
Table 6 presents the SHAP importance ratios (mean absolute SHAP values normalized to percentage contributions) for technical indicators and sentiment features across stocks.
Three key patterns emerge from the analysis.
The analysis reveals a pronounced divergence in market sensitivity to sentiment indicators across stocks, contingent on investor structure and behavioral dynamics. Institutional-dominated stocks (e.g., Kweichow Moutai, Yangtze Power) exhibit amplified sentiment effects, where intraday and post-market sentiment contribute 6.65–10.53% and 5.52–5.73% to predictive power, respectively, significantly exceeding sample averages (2.73% intraday, 3.57% post-market). This amplification stems from their ownership structure: over 76% institutional ownership (state-owned enterprises, mutual funds) as of December 2024, characterized by conservatism bias and delayed information assimilation. Institutional inertia prolongs sentiment signal incorporation into prices, extending predictive horizons. Conversely, retail-dominated technology stocks (e.g., BYD, ZTE) display attenuated sentiment importance (intraday: 1.75–0.69%), driven by higher retail participation (37.60–43.40% institutional ownership) and social media-driven herding. Salient news triggers immediate overreactions, causing sentiment to be rapidly priced within single sessions, followed by mean-reversion patterns that erode multi-period predictive value. This structural dichotomy underscores how market microstructure mediates sentiment dynamics: institutional rigidity amplifies sentiment persistence through delayed feedback loops, while retail hyperactivity accelerates sentiment decay via cognitive biases and short-termism. Such divergence highlights the critical role of investor heterogeneity in shaping sentiment–price interactions, necessitating differentiated modeling approaches for institutional versus retail-driven equities in quantitative strategies.
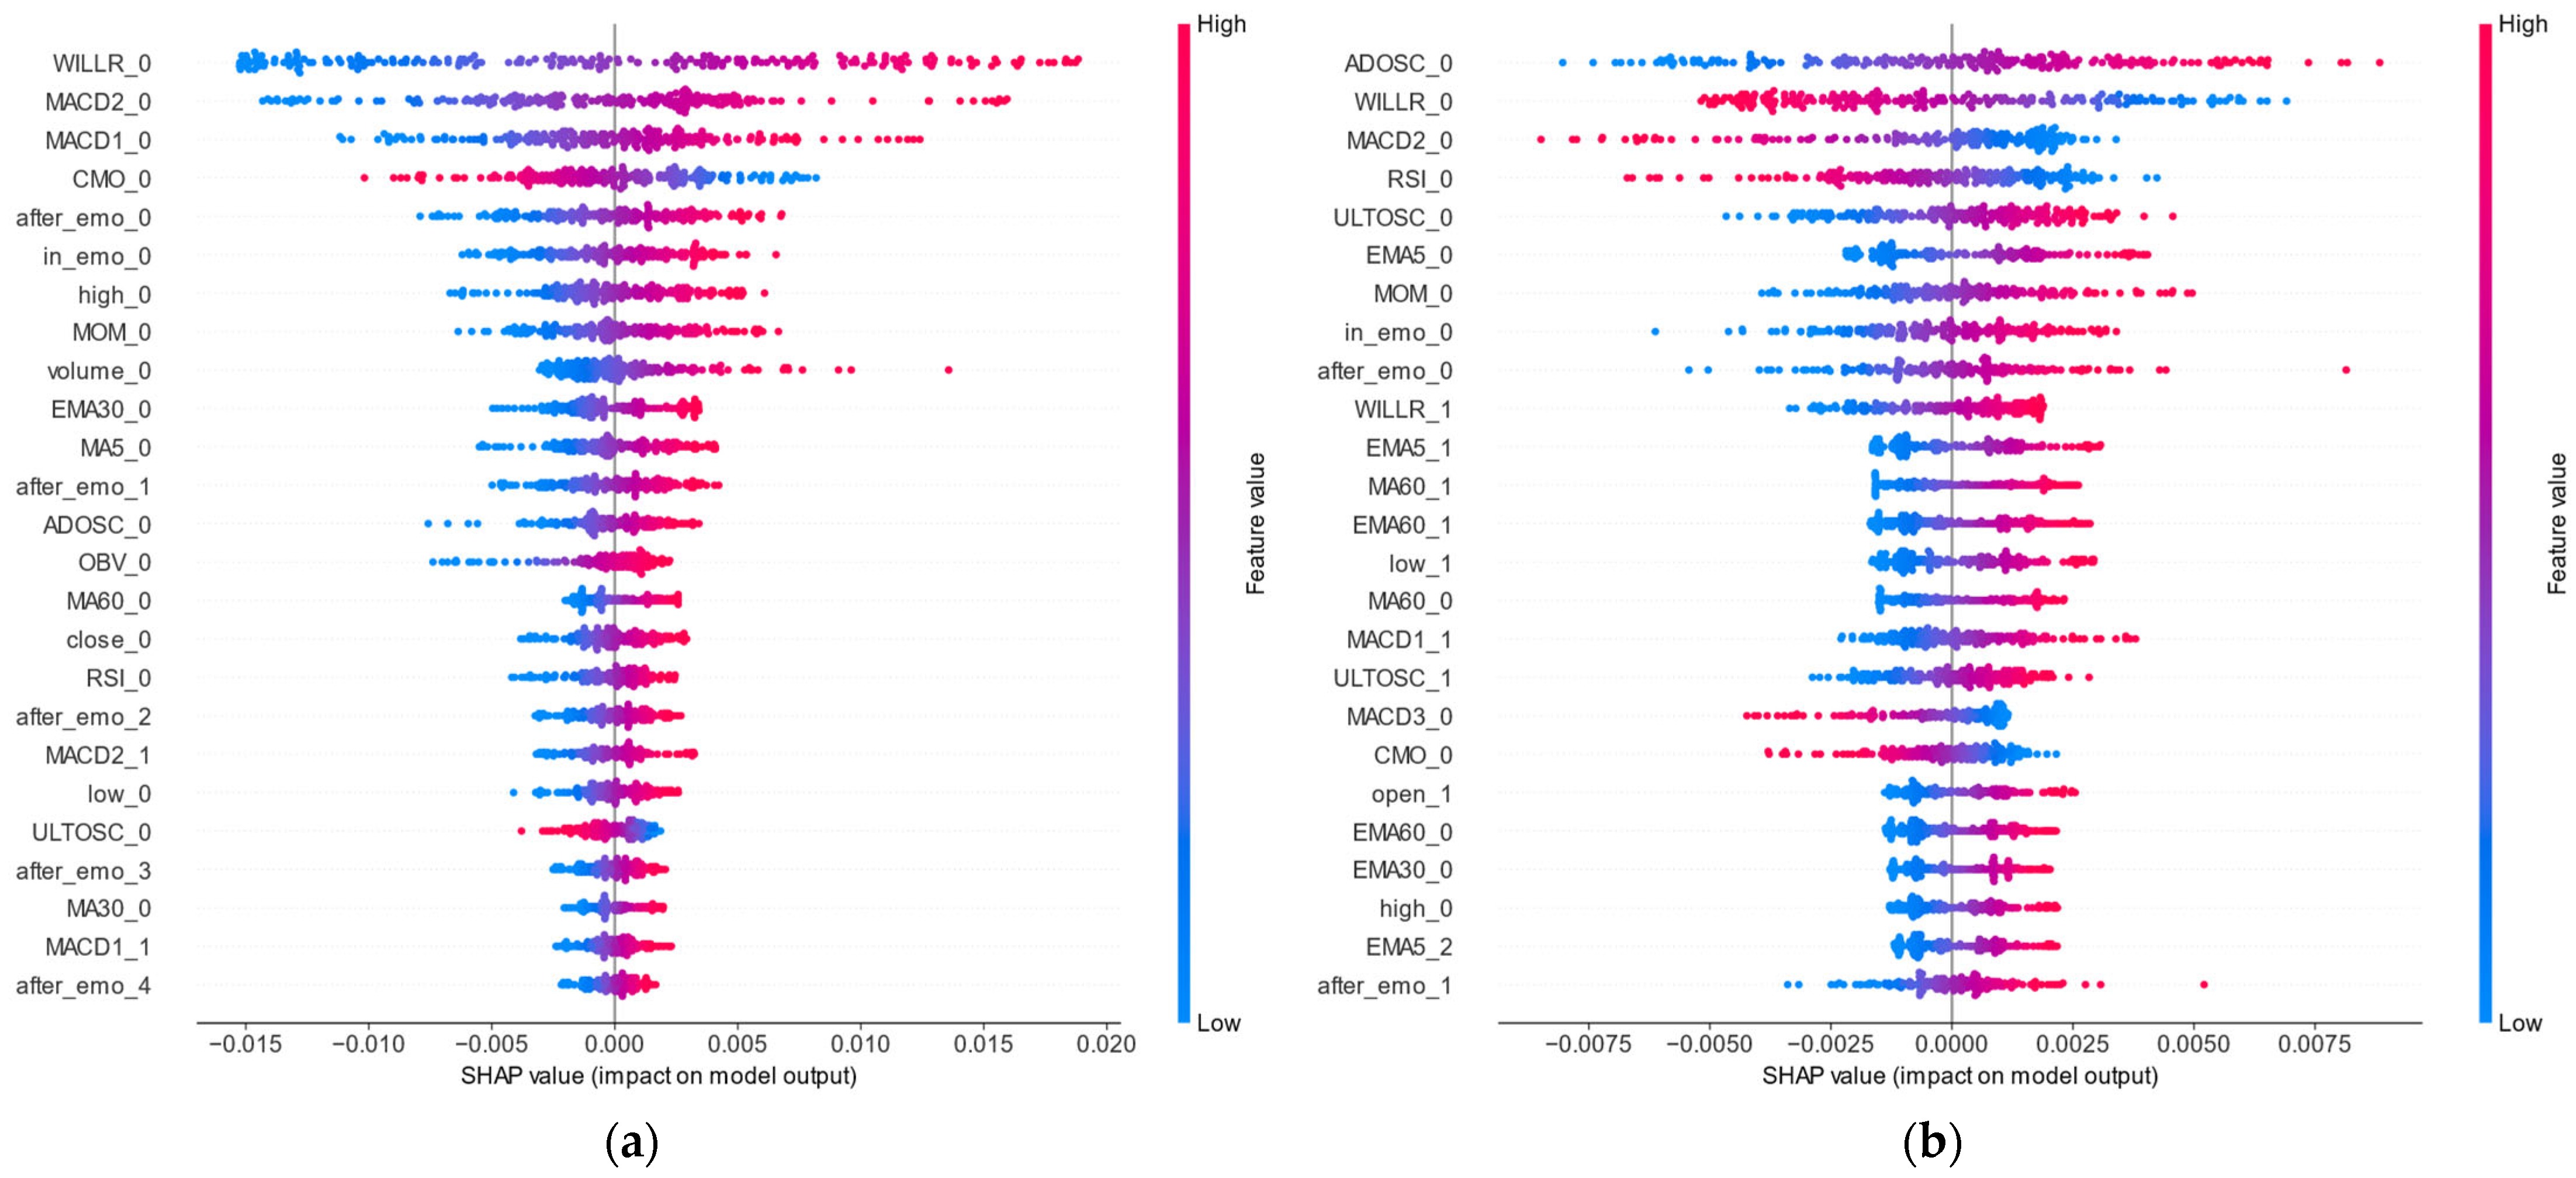
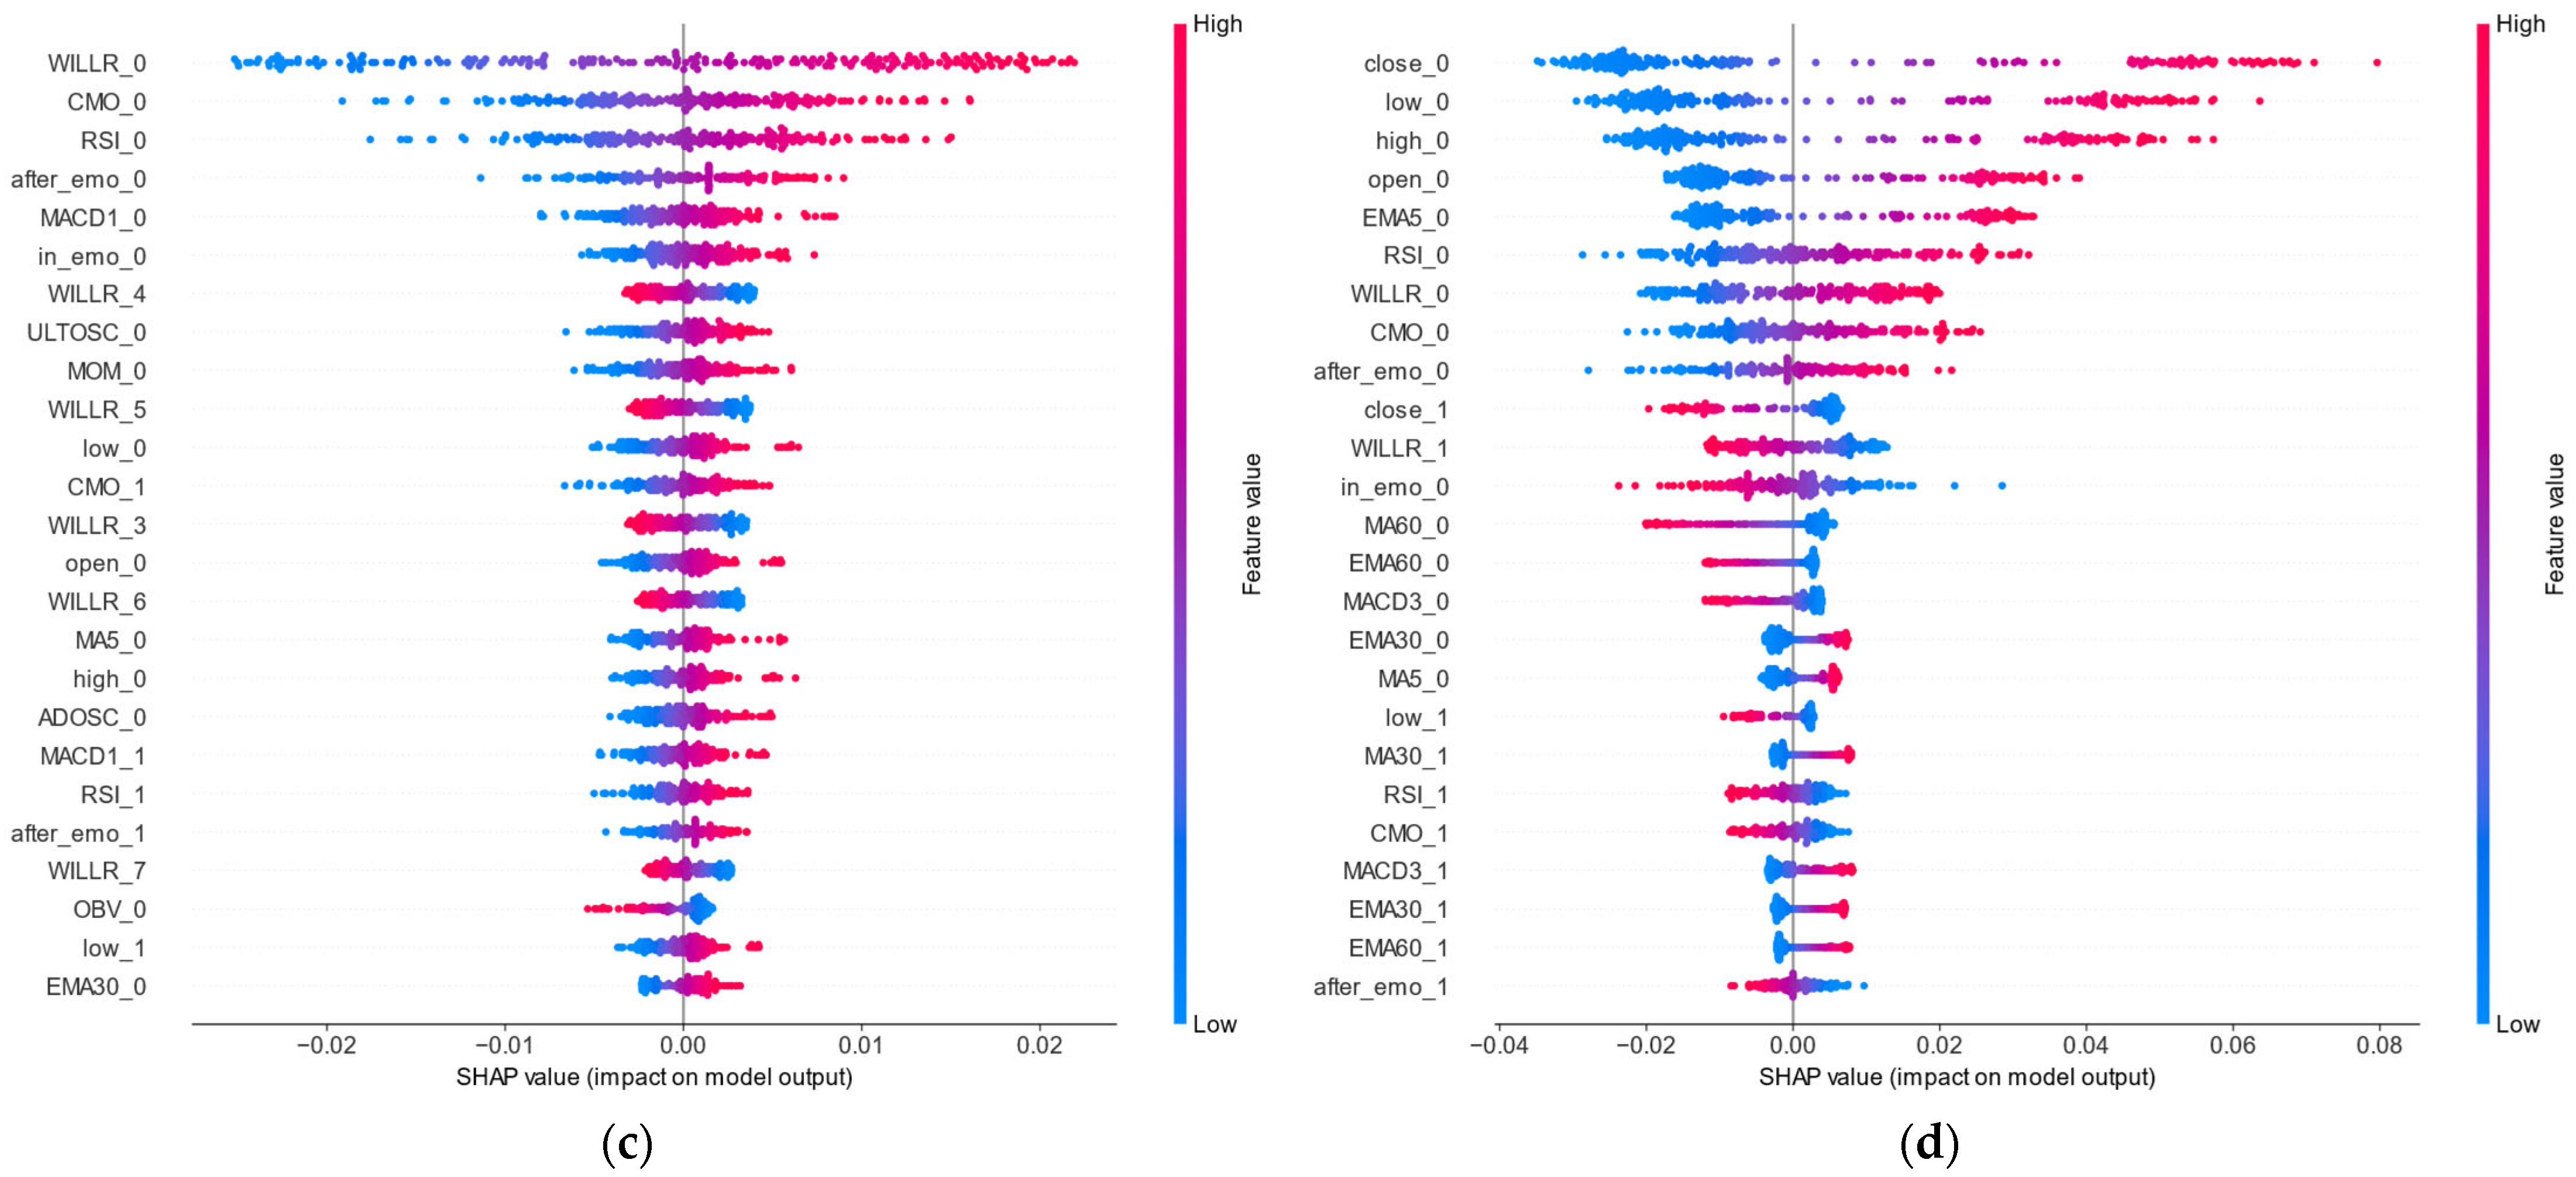
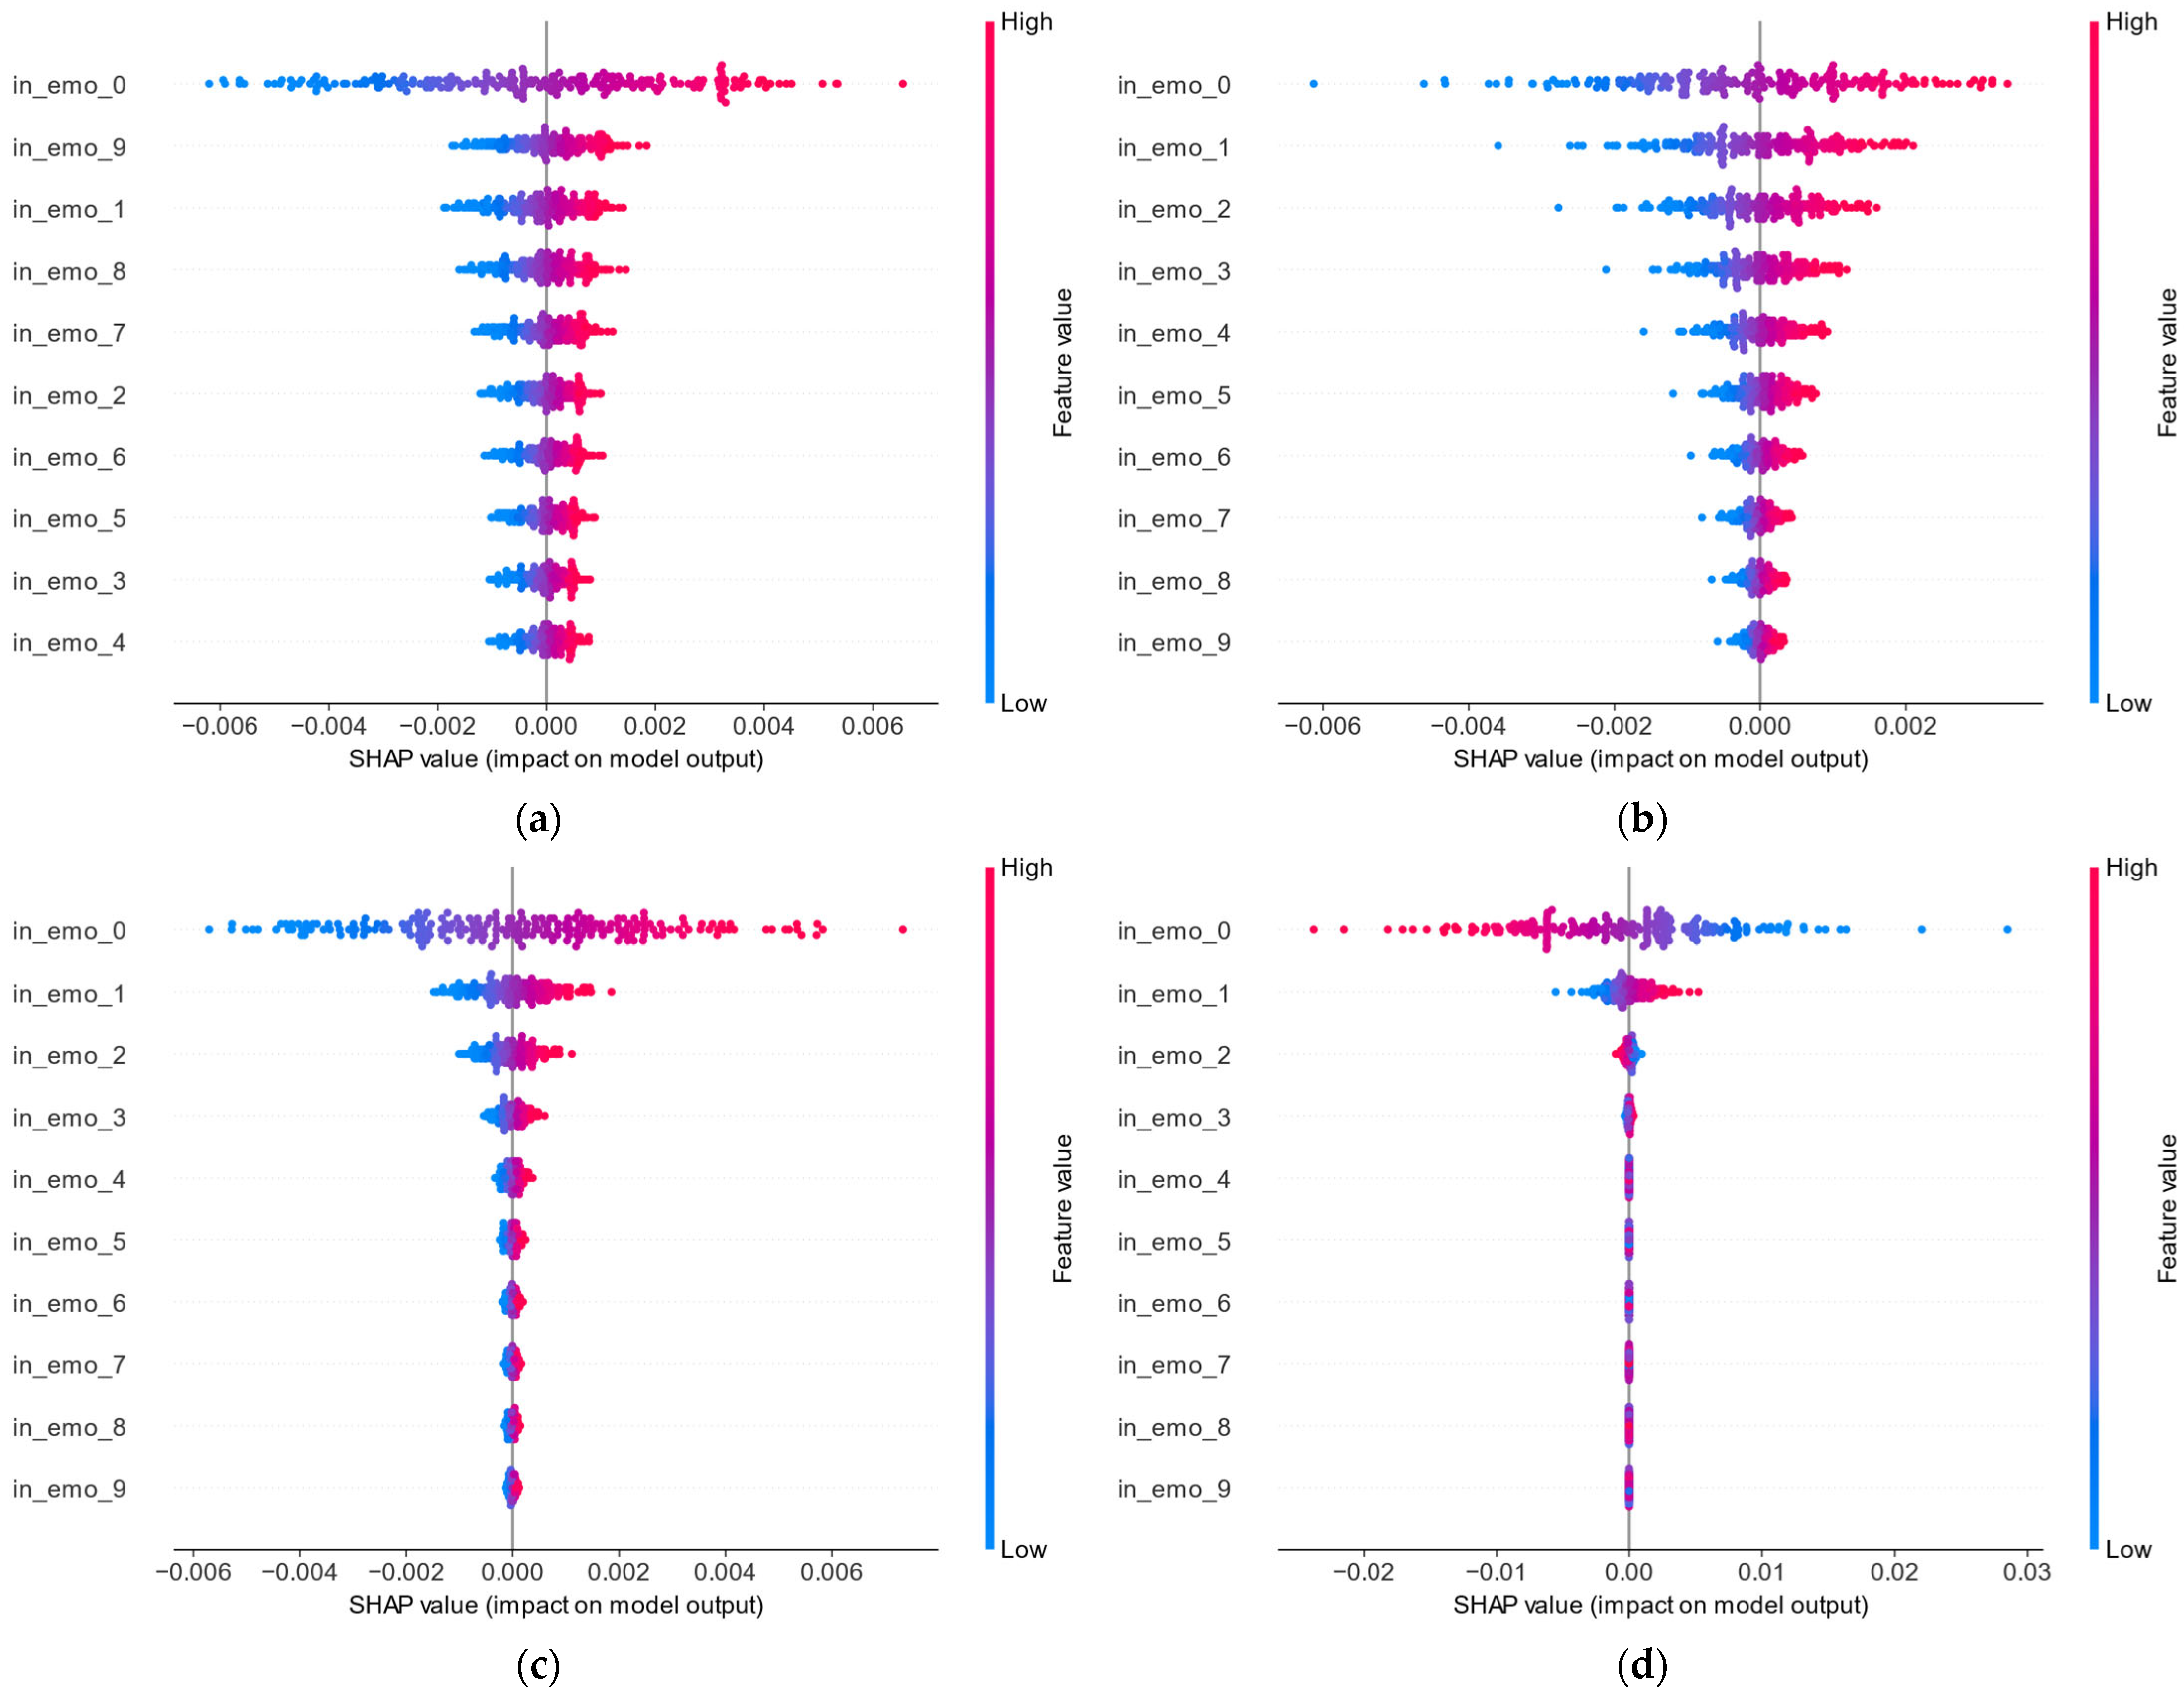
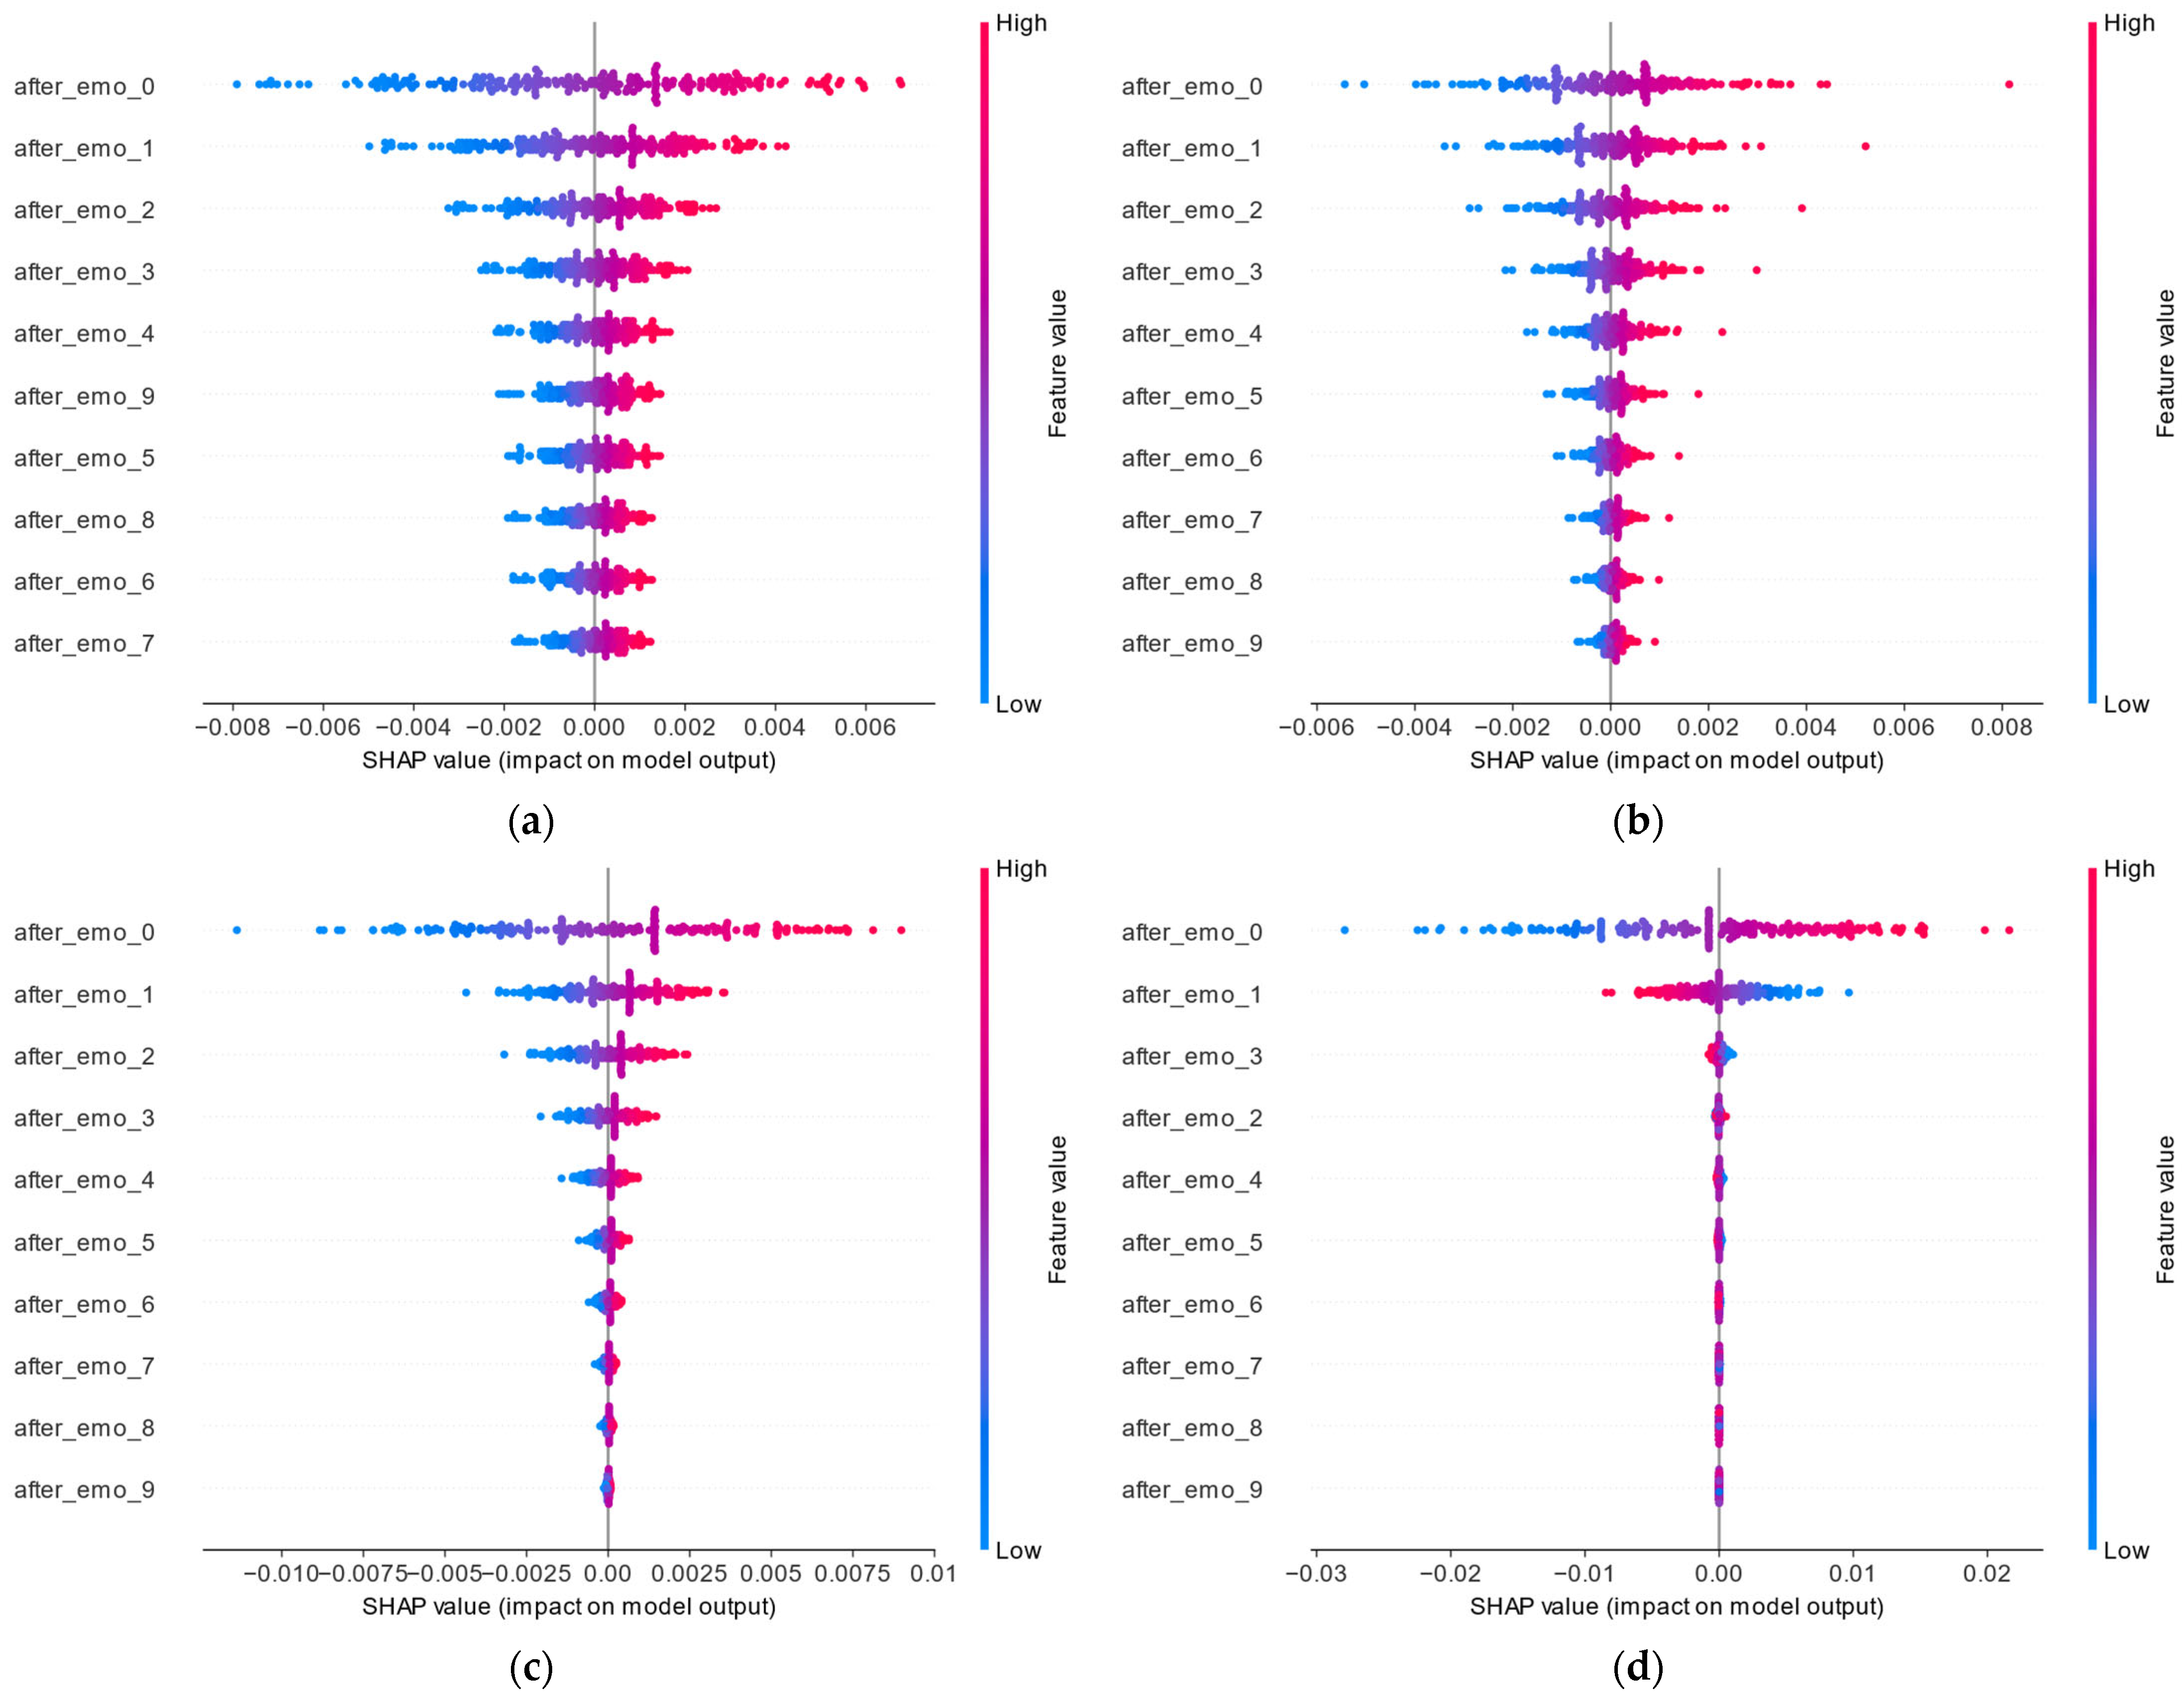
Besides, SHAP analysis reveals a consistent attenuation of sentiment impacts across time lags (
Figure 4,
Figure 5 and
Figure 6). For instance, in Kweichow Moutai (600519), the immediate post-market sentiment (lag 0) ranks 5th in feature importance, while its one-day (lag 1) and two-day (lag 2) lags drop to 12th and 18th positions, respectively. This rapid decay pattern persists across all 11 sample stocks, suggesting efficient market assimilation of sentiment signals—a finding consistent with weak-form efficiency assumptions.
While sentiment indicators generally exhibit positive predictive relationships, certain stocks demonstrate nuanced dynamics. For example, Zijin Mining (601899) shows negative correlations between immediate intraday sentiment (in_emo_0) and price movements, potentially reflecting correction mechanisms for overreactions in high-volatility contexts.
The SHAP framework elucidates how historical prices, technical indicators, and sentiment features jointly drive predictions across heterogeneous stocks. This multi-stock validation enhances the interpretability framework’s robustness while revealing sector-specific decision patterns crucial for developing adaptive quantitative strategies.
4.4. Quantitative Trading Strategy Evaluation
The proposed LSTM-based quantitative trading strategy, which integrates intraday (09:30–15:00) and post-market (15:00–09:30) sentiment indicators, was rigorously validated through backtesting on eleven heterogeneous stocks. As delineated in
Table 7, the hybrid strategy combining both intraday and post-market sentiment metrics achieved superior returns, with a mean logarithmic return of 0.37056, outperforming baseline (0.24410), aggregated-sentiment (0.32405), and sentiment-excluded (0.22699) strategies across all stocks except ZTE. This empirical evidence substantiates the critical role of temporal sentiment partitioning in enhancing price prediction accuracy and strategy profitability. Comprehensive specifications of cost calibration methodologies, temporal scope, stock selection, and conditional trading triggers are systematically documented in
Section 3.5.
Comprehensive risk metric analysis (
Table 8) demonstrates the strategy’s robust risk mitigation capabilities.
Value-at-Risk (5%): Average VaR improved from −0.02972 (baseline) to −0.02036, reflecting a 31.5% reduction in tail risk exposure.
Maximum Drawdown: Portfolio drawdowns decreased by 49.6%, from −0.24672 to −0.12442, indicating enhanced capital preservation during market downturns.
Risk-Adjusted Returns: The Sharpe ratio surged from 0.73823 to 1.64594, signifying a 122.9% improvement in risk-adjusted performance.
Real markets often exhibit variable fills and liquidity constraints, contributing to slippage volatility. Additional cost variations arise from temporal fluctuations in brokerage commissions, settlement fees, and stamp duties. To simulate such environments, we conducted a multi-dimensional sensitivity analysis on the quantitative trading strategy, parameterizing transaction costs across a spectrum of 0.001 to 0.005 (
Table 9). The analysis reveals three critical regimes:
Stability Range (0.001–0.0014): The strategy maintains consistent performance with ROI between 0.370 and 0.350 and Sharpe ratios of 1.642–1.569, demonstrating minimal sensitivity to cost variations.
Critical Threshold (0.0015): A pronounced performance deterioration occurs, with ROI decreasing by 11.4% (0.328 vs. peak) and Sharpe ratio declining by 10.7% (1.464 vs. peak).
Economic Viability Limit (0.004): Strategy effectiveness diminishes significantly as ROI approaches baseline levels (0.255 vs. 0.244) with Sharpe ratio reduction to 1.137.
These sensitivity thresholds have direct operational implications: (1) The stability range (0.10–0.14%) corresponds to China’s prevailing transaction cost structure, comprising 0.05% stamp duty, 0.002% transfer fee, and 0.045% estimated slippage, confirming strategic robustness under normative liquidity conditions. Empirical testing demonstrates transfer fee modifications (both reductions and twofold increases) have limited effects on performance metrics. (2) The critical 0.15% threshold signifies that reinstating historical stamp duty levels (0.1% effective September 2008–August 2023) or amplifying slippage costs—exemplified through either trade size escalation from CNY100k to CNY900k transactions or shifting executions to stocks with CNY2–3B market capitalization—would precipitate greater than 10% degradation in both ROI and Sharpe ratios. (3) At 0.4% aggregate cost (equivalent to 0.002% transfer fee, 0.1% stamp duty combined with 0.028% slippage for CNY3–5B market capitalization stocks under CNY900k trade executions), the strategy’s alpha converges statistically with baseline performance, necessitating the implementation of rigorous liquidity filtration criteria for security selection.
While these metrics validate the core proposition, three limitations warrant attention. First, our price impact assumptions tied solely to market capitalization and trade size fail to account for sector-specific liquidity variations (e.g., technology vs. utilities) and temporal turnover rate fluctuations that dynamically influence execution costs. Second, the strategy remains vulnerable to tail risk scenarios, including black swan events and acute liquidity contractions, where historical volatility patterns and linear slippage relationships become invalidated. Third, the assumed T+1 settlement mechanisms and China-specific transaction cost structures may constrain applicability to international markets employing distinct regulatory frameworks, particularly those with real-time settlement protocols.
In spite of these constraints, the findings collectively demonstrate that time-partitioned sentiment-aware LSTM architectures, when coupled with quantitative trading strategies, effectively translate predictive accuracy into economic value. By bridging the gap between investor sentiment extraction and actionable trading insights, this framework advances the development of transparent, sentiment-driven quantitative strategies in dynamic equity markets.
5. Conclusions and Future Research
This study bridges critical gaps between behavioral finance theory and algorithmic trading practice by developing a temporal sentiment partitioning framework that enhances predictive accuracy and model interpretability in China’s A-share market. Through the systematic integration of intraday (09:30–15:00) and post-market (15:00–next day 09:30) sentiment indicators with technical factors, we demonstrate that temporal granularity in sentiment analysis significantly reduces market uncertainty while improving the economic viability of quantitative strategies. Three pivotal contributions emerge from our findings:
First, partitioning investor sentiment into intraday (09:30–15:00) and post-market (15:00–next day 09:30) components captures distinct behavioral mechanisms. Intraday sentiment reflects immediate reactions to price fluctuations and noise-driven trading, while post-market sentiment incorporates fundamental analysis and overnight information, serving as a leading indicator for subsequent trading sessions. Utilizing a fine-tuned ERNIE 3.0 model for domain-specific sentiment extraction (F1-score: 0.77), the framework achieves robust three-class sentiment classification, enabling precise analysis of 3,923,492 investor discussions across intraday (09:30–15:00) and post-market (15:00–09:30) periods. Empirical results confirm that models integrating time-stratified sentiment indicators (LSTM with in-post features) achieve superior prediction accuracy, attaining an R2 of 0.917, reducing MSE by 31.8% compared to daily-aggregated sentiment models and 47.1% versus technical-only baselines.
Second, SHAP analysis demystifies the “black-box” nature of deep learning models, revealing cross-sector heterogeneity in sentiment contributions. SHAP interpretability analysis reveals that time-partitioned sentiment indicators collectively contribute 6.30% to model decisions, with post-market sentiment (3.57%) exhibiting marginally stronger predictive influence than intraday sentiment (2.73%). For institutional-dominated stocks like Kweichow Moutai, intraday and post-market sentiment contributes 6.65% and 10.53% to prediction logic, highlighting behavioral biases in price discovery. Conversely, retail-dominated technology stocks like BYD exhibit weaker sentiment dependencies, emphasizing sector-specific modeling necessities.
Third, backtesting under China’s trading constraints demonstrates that sentiment-aware strategies generate 51.8% higher annualized logarithmic returns (0.371 vs. 0.244 baseline) with 49.6% lower maximum drawdowns. The Sharpe ratio improvement (1.646 vs. 0.738) underscores enhanced risk-adjusted performance, validating the framework’s robustness. Transaction cost sensitivity analysis further identifies a viability threshold (0.4% per trade) beyond which profitability converges to benchmark levels.
The theoretical and practical implications of this research are multifaceted. Methodologically, temporal partitioning of unstructured text data advances financial NLP by aligning sentiment frequencies with market microstructures. The ERNIE 3.0 fine-tuning protocol provides a replicable pipeline for domain-specific sentiment extraction, addressing contextual nuances in investor forums. From a regulatory perspective, SHAP-driven transparency enables policymakers to identify sentiment-driven mispricing mechanisms, informing interventions to mitigate retail investor vulnerabilities during high-volatility periods. For practitioners, the validated T+1 strategy offers a systematic framework to exploit sentiment asymmetries while adhering to market constraints, bridging the gap between behavioral insights and executable trading logic.
Based on the established foundation, three promising research directions emerge. First, leveraging the Eastmoney Guba forum as a baseline, integrating multi-platform investor sentiment may improve the robustness of sentiment indicator construction. This approach would involve separate fine-tuning of the ERNIE 3.0 architecture on labeled datasets from specialized financial platforms (e.g., Xueqiu containing professional analytical content) and social media networks (e.g., Weibo featuring retail investor discussions). Such domain-adaptive training enables the model to capture platform-specific linguistic patterns and discourse characteristics for enhanced sentiment classification performance. To address platform-specific linguistic variations, the derived sentiment scores from heterogeneous sources could serve as distinct explanatory variables within ensemble machine learning frameworks, thereby preserving domain-specific informational value while mitigating cross-platform lexical interference.
Second, architecting hybrid neural systems that synergistically combine cross-platform sentiment dynamics with adaptive decision-making mechanisms, where attention-based neural modules could enhance stock price prediction accuracy, while reinforcement learning agents would optimize trading policy adjustments via sentiment-driven reward signals modulated by real-time market feedback. To counter potential overfitting in network training, adversarial regularization protocols could be implemented through gradient penalty constraints on value function approximators, complemented by synthetic crisis scenario generation using generative adversarial networks trained on historical market dislocation patterns, thereby enhancing model robustness against low-frequency extreme events.
Third, investigating temporal patterns of investor sentiment surrounding financial crises could provide critical insights into behavioral influences on market predictions. Future research could analyze how pre-crisis and post-crisis sentiment divergences affect predictive outcomes by establishing comparative frameworks that contrast sentiment-driven forecasts during stable periods versus crisis-adjacent intervals. For instance, examining whether panic-dominated sentiment preceding the 2015 market crash exhibited stronger predictive validity for subsequent price corrections compared to post-crisis stabilization phases. This approach could integrate sentiment dynamics with traditional financial models by augmenting factor regressions with temporal sentiment metrics (pre-crisis vs. post-crisis), enabling systematic comparison of machine learning outputs with behavioral finance hypotheses.
In conclusion, this research bridges critical gaps between behavioral finance theory and algorithmic trading practice. By demonstrating that temporal sentiment granularity, explainable AI, and market-aware strategy design collectively enhance price prediction frameworks, the findings provide actionable insights for investors, regulators, and researchers navigating sentiment-driven financial ecosystems. The integration of temporally stratified sentiment analysis with interpretable machine learning not only advances academic discourse but also equips market participants with tools to decode the complex interplay of psychology and pricing in modern equity markets.

