Article

Linking Manufacturing Smart Transformation to Regional Economic Development in China: The Crucial Mediation of Regional Innovation Capacity

Glorious Sun School of Business and Management, Donghua University, Shanghai 200051, China
*
Author to whom correspondence should be addressed.
Systems 2025, 13(5), 389; https://doi.org/10.3390/systems13050389
Submission received: 20 March 2025 / Revised: 12 May 2025 / Accepted: 14 May 2025 / Published: 18 May 2025
(This article belongs to the Section Systems Practice in Social Science)

Abstract

:
The manufacturing industry serves as critical carrier for the empowerment of digital technologies and is the cornerstone of digital innovation and development. Smart transformation (ST), propelled by technological advancements, has become a prominent area of academic research, but its role in fostering the co-development of manufacturing industries has been overlooked. This study employs an empirical approach to examine the causal mechanisms linking ST with regional economic development (RED), particularly emphasizing the mediating effects exerted by regional innovation capacity (RIC). Leveraging panel data from 29 Chinese provinces spanning the period from 2009 to 2023, we constructed an econometric model for analysis. The findings reveal that ST has a direct effect on RED, knowledge innovation capacity (KIC), and innovation infrastructure (II) partially mediated, while technology innovation capacity (TIC) completely mediated the relationship. Theoretical contributions manifest in three dimensions: First, drawing on the sociotechnical system theory and technology diffusion theory, this paper establishes a multidimensional framework of ST, deepening the theoretical underpinnings of smart technology application in the manufacturing industry from three aspects: smart base input, smart applications, and smart market benefits. Second, it extends regional innovation theory and endogenous growth theory by conceptualizing RIC in three sub-capabilities (KIC, TIC, and II). Third, it contributes to the RED literature by exploring the coupling effect between manufacturing industry clusters and the development of RIC and ultimately concludes with targeted policy recommendations for optimizing ST strategies to foster RED in different manufacturing industries.

1. Introduction

Digital technologies have triggered a paradigm shift, leading manufacturing enterprises to rapidly adopt smart technologies including big data, cyber–physical systems (CPSs), artificial intelligence (AI), cloud computing, Internet of Things (IoT), 5G, and ChatGPT(ChatGPT 4.0) into their digital production infrastructure to foster their engineering decision-making processes. Serving as a central pilar of national economy and the flag bearer of digital technology empowerment and innovation, the manufacturing industry plays a pivotal role in fostering the development and growth of digital economy [1]. Recently, various developed countries have formulated analogous industrial blueprints, including Germany “High Tech Strategy 2020” and “Industry 4.0”, Sweden “Smart Industry” and “Production 2030”, Japan and South Korea “Smart Factory”, and the United States “Smart Manufacturing” and “Industrial Internet of Things (IoT)” [2], significantly contributing to their national economy [3]. However, the semi-structured systems and traditional mindsets prevalent in developing countries pose substantial challenges to the implementation of smart manufacturing. Despite these obstacles, Indian enterprises are progressively embracing new technologies to enhance efficiency and competitiveness, as exemplified by initiatives like the “Smart Advanced Manufacturing and Rapid Transformation Center” (SAMARTH) [4]. These efforts drive advancements in the manufacturing industry by fostering innovative infrastructure development, industrial upgrading, and process optimization. China has established the most comprehensive and largest manufacturing sector globally. However, China remains positioned at the third level in the low-end manufacturing segment within the four-tier global manufacturing framework. As a leading manufacturing nation, the ST of the manufacturing industry is crucial to achieving high-quality economic development [5]. Consequently, the deep integration of advanced technology into the manufacturing sector constitutes an indispensable catalyst for driving economic transformation.
Despite the empowerment of novel information technologies and manufacturing innovation capabilities empowering domestic industries for rapid development, the significant potential of ST has been largely overlooked. The previous literature predominantly emphasizes digital transformation (DT) from the organizational perspective [6]. With the integration of smart technologies into manufacturing systems and industrial ecosystems to foster service-oriented frameworks, ST primarily focuses on promoting the ecological development of regional industries, thereby supporting the macro-level transformation of traditional enterprises [7]. ST referring to the convergence of technology and services is regarded as a key driver for the co-development of regional industries, therefore, laying a robust foundation for smart city transformation [8]. The adoption trajectory of ST within manufacturing ecosystems aligns with innovation diffusion theory [9], where technology assimilation progresses through distinct phases: from initial experimentation with IoT/CPS to the systemic integration of AI/5G networks. This technology diffusion process is simultaneously shaped by socio-technical dynamics, where enterprise-level ST adoption interacts with macro-level institutional landscapes to boost industrial change in manufacturing [10].
In light of sustainable development theory, existing studies have partially discussed the association of smart manufacturing with sustainable development [3]. Xu et al. [11] argue that smart manufacturing not only facilitates green economic development but also generates new services and economic value, thereby driving financial benefits and sustainable development. Zhao et al. [5] point out that smart manufacturing has facilitated the enhancement of enterprise production models, the reengineering of business processes, and the optimization of resource allocation, thereby significantly improving the level of green production. However, these studies do not explicitly specify how ST promotes economic development with the application of technology in different manufacturing industries.
There are significant regional economic disparities in China. That is to say, RED is also significantly influenced by the determinant factor of “location” [12]. To address these disparities, numerous research studies are committed to solve the problem of regional innovation differences, including structural innovation gaps and innovation efficiency disparities [13]. In particular, the research on the relationship between RIC and economic development primarily focuses on the following main areas. Firstly, regions with high innovation capacity tend to possesses more innovation factors, innovative talents, and stronger innovation culture, which helps mitigate the negative impact of geographical distance between enterprises and central cities on the social benefits [14,15]. Secondly, strong RIC actively encourages interactions among various enterprises [16]. Heterogeneous knowledge exchange and technology transfer through communication activities provide crucial resources for small-and-medium-sized enterprises (SMEs) to develop products or services while promoting long-term social value innovation [17]. Thirdly, innovation capabilities serve as the foundation of entrepreneurial activity, and digital economy achieves sustainable economic development by enhancing RIC to promote social entrepreneurship [18]. However, previous research has tended to identify factors or determinants that have a significant impact on innovation capability, but it still lacks the standardized definitions and measurement frameworks for RIC. This paper, therefore, links innovation capacity to innovation systems theory and endogenous growth theory, suggesting that the RIC evaluation system should be reconstructed by considering endogenous characteristics of the region, including innovation actors, innovation infrastructure, and industrial cluster environment [19,20,21]. This would allow for a more nuanced understanding of how different innovation systems impact regional resilience and competitiveness.
Considering the development of the manufacturing industry depends on innovative ecosystems and innovative activities that have the potential to affect RIC. It is not clear whether RIC plays an intermediary role between ST and RED. This study aims to investigate the relationship between ST and RED in the context of China’s manufacturing industry. China’s selection in the research context stems from its advantage for analyzing the interplay between different manufacturing industries, RIC, and RED. The nation’s implementation of the “Made in China 2025” strategy has cultivated spatially distributed innovation ecosystems centered around smart manufacturing, aiming to promote the transformation and upgradation of traditional manufacturing industries [22]. Moreover, the extensive geographical expanse of China provides a critical analytical vantage point for examining how regional disparities in innovation capacity shape variations in RED. The substantial disparities in digital infrastructure and innovation across different regions in China provide a valuable opportunity to examine the symbiotic relationships among innovation entities from the perspective of regional heterogeneity [23].
Using a panel dataset from 29 provinces of China from 2009 to 2023, we use the entropy weight method to measure the related index dimensions and established an econometric model for the empirical investigation. In addition to verifying the reliability of the results through an endogeneity and robustness test, the heterogeneity tests based on regions and manufacturing types are conducted to comprehensively understand the differentiated impact of ST in different industries of the regional economy.
The theoretical contributions of this research are threefold. Primarily, bridging technology diffusion theory with sociotechnical system theory, we propose a comprehensive evaluation index for ST and elucidate its impact on RED. Secondly, we elaborate on the association of endogenous growth principles with innovation systems, thereby discerning three critical components of RIC: knowledge innovation capability, technological innovation capability, and innovation infrastructure. Thirdly, we demonstrate that different dimensions of RIC play distinct mediating roles between ST and RED by innovatively integrating RIC into the analytical framework to better understand the relationship between manufacturing development and economic development from a macro-perspective.
This paper comprises seven parts. Section 2 reviews the existing literature on measuring ST through digital technology adoption and develops a comprehensive indicator for RIC. Section 3 presents the theoretical framework and hypotheses. In Section 4, we describe data sources, measurement methods, and analytical approaches. Proceeding to Section 5, it provides empirical results from econometric model validation. Section 6 discusses the summarized findings, providing theoretical and practical implications. Finally, Section 7 depicts the conclusions, limitations, and future research directions.

2. Literature Review

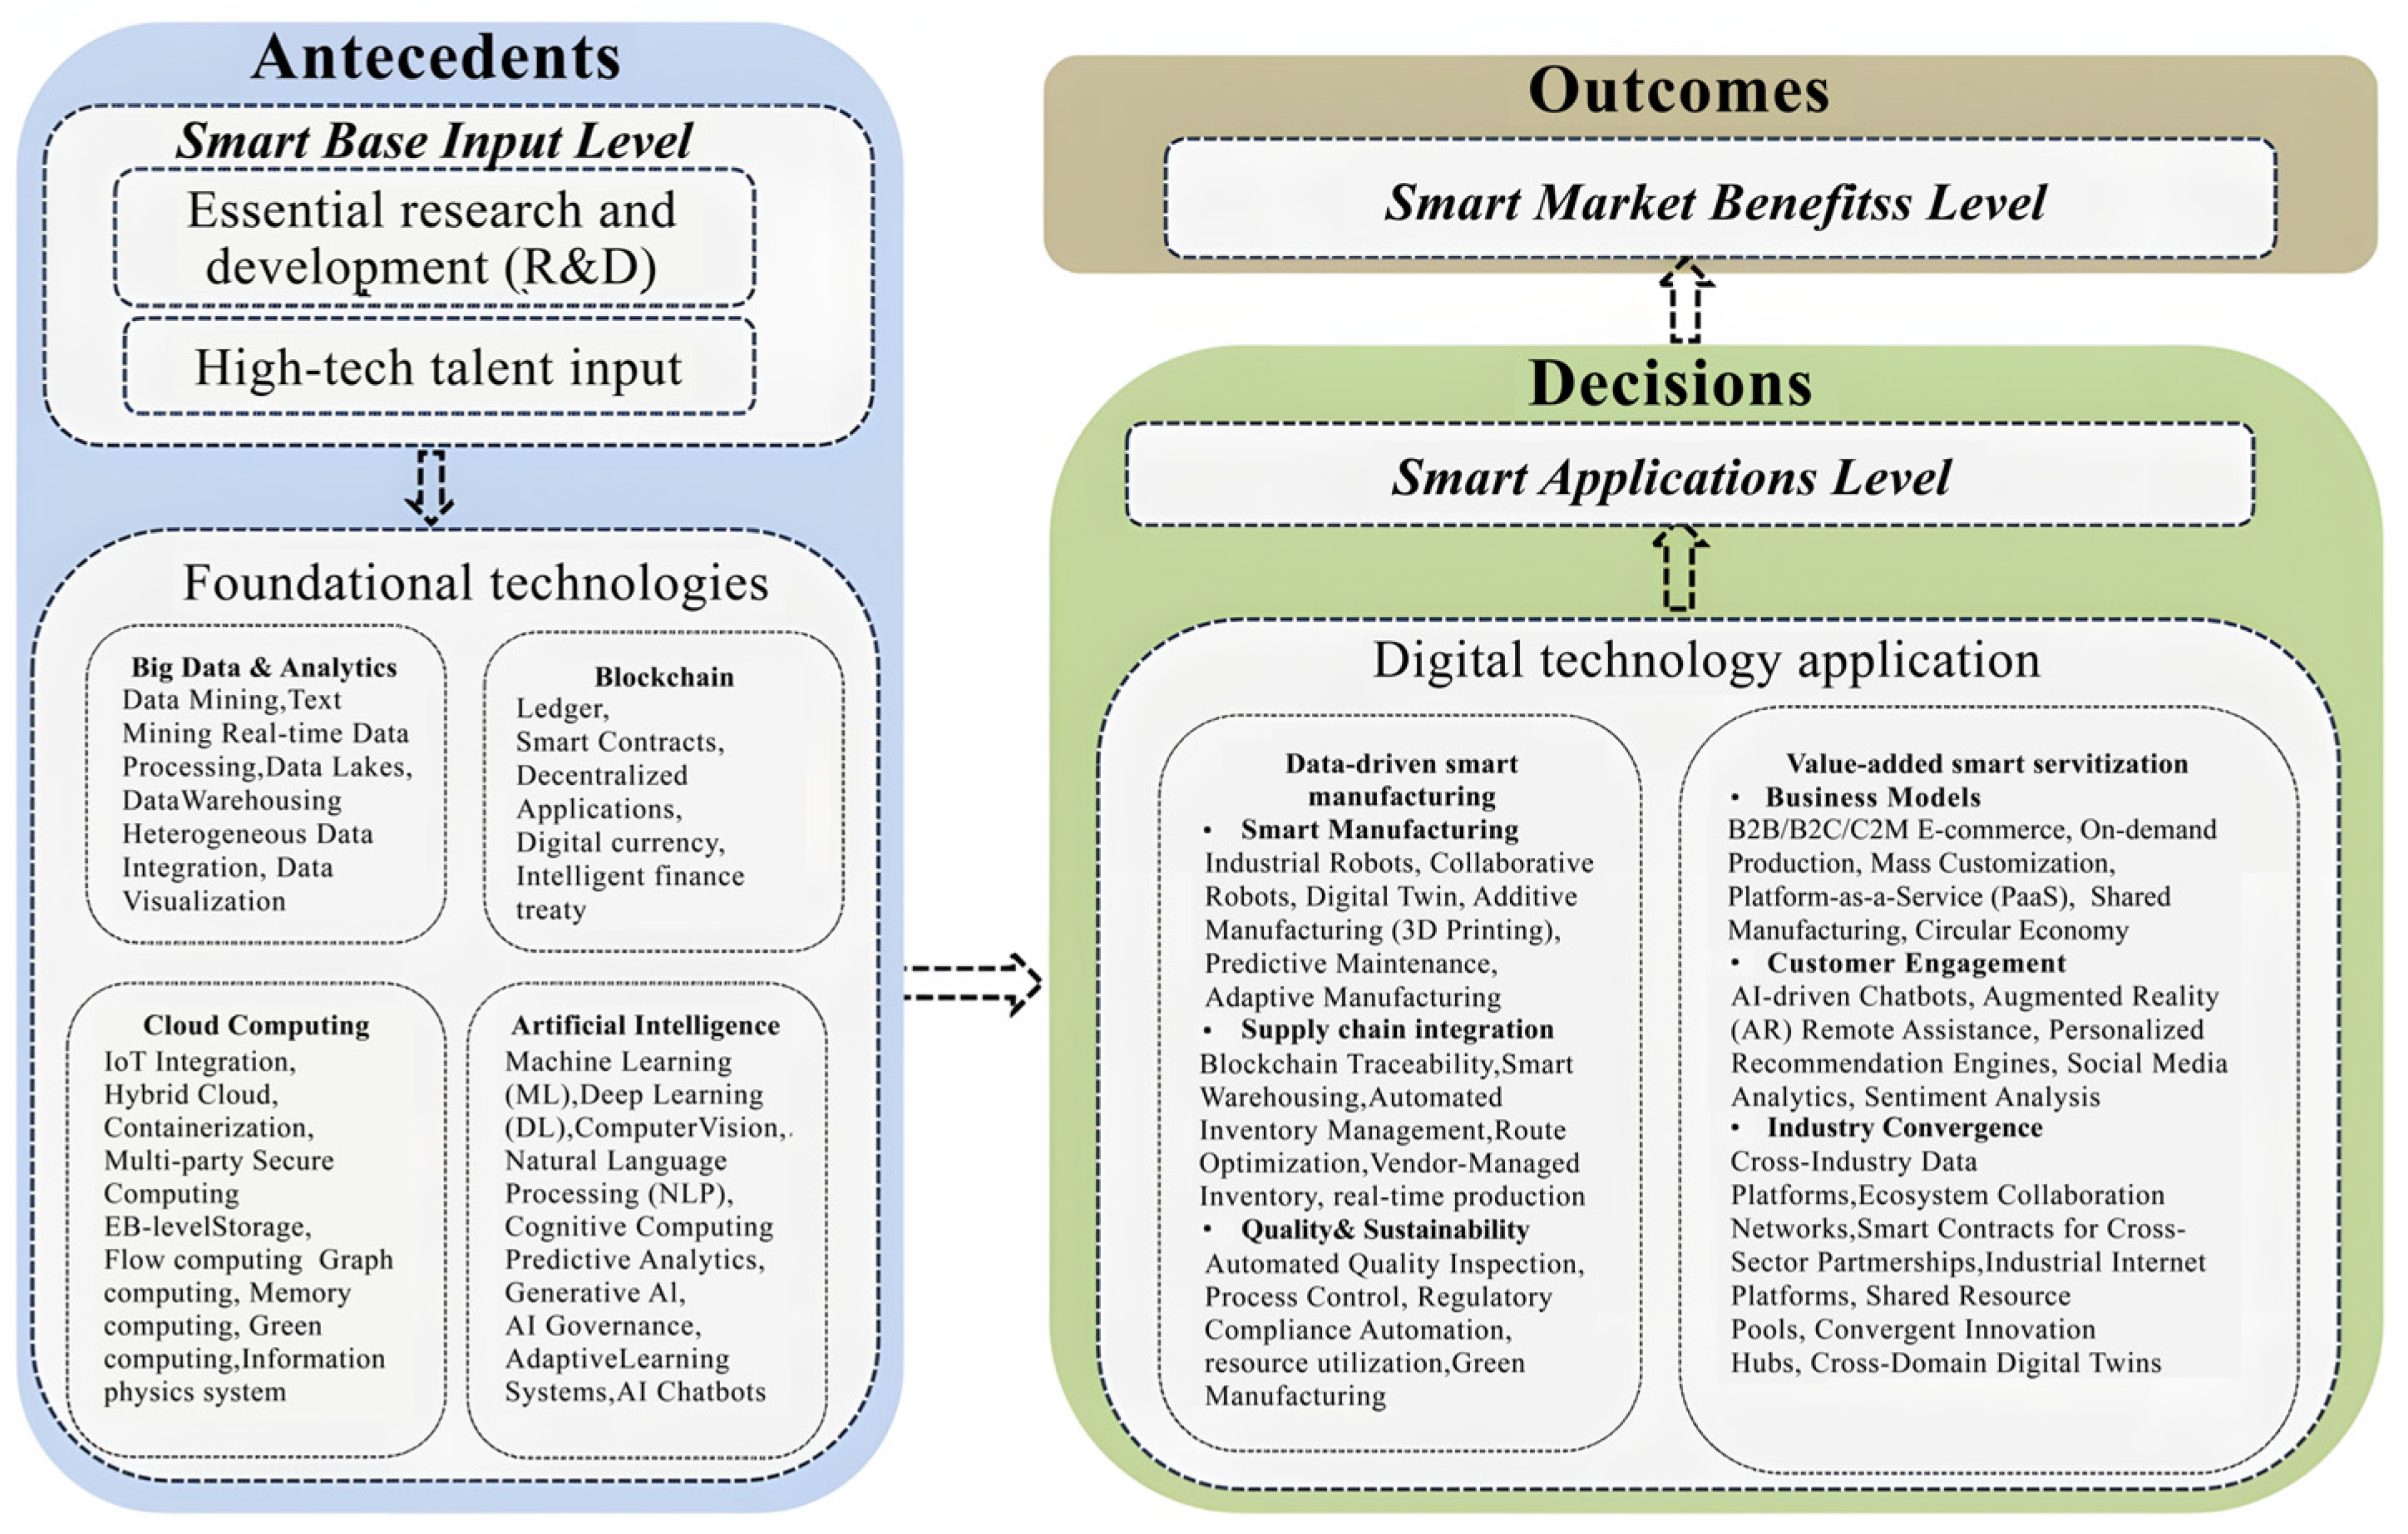
2.1. Smart Transformation

The emergence of disruptive technological innovation has profoundly impacted the manufacturing industry and has initiated academic discussions on DT and ST. DT seeks to fundamentally reshape enterprises by reconfiguring organizational structures, redesigning products, innovating business models, and reengineering value chains [24]. In contrast, grounded in technology diffusion theory, ST focuses on the integration of smart technologies within manufacturing systems, fostering the autonomous optimization and coordination of product–service innovation processes [25]. While prior research has yet to establish a standardized conceptualization of ST, the related research has been directed toward identifying critical success factors for manufacturing enterprises’ smart transition processes: smart manufacturing, resilient manufacturing, and service innovation [26]. First, smart manufacturing is the core of Industry 4.0 [27,28], which is related to the technical perspective of CPS and IoT integrated into manufacturing operations, reflected in smart factories, smart services, and extended value networks—encompassing vertical, horizontal, and end-to-end integration [29]. Second, resilient manufacturing refers to a system’s capacity to withstand adverse environmental impacts and to enable swift recovery through adaptive mitigation strategies, and it has been extensively discussed from ecological and sustainability perspectives with a focus on digital technology applications [26]. Third, service innovation in manufacturing necessitates the synergistic integration of technological absorption capacity with open innovation ecosystems, enabling cross-boundary knowledge orchestration for value co-creation through strategic partnerships with customers, suppliers, and research institutions [30].
ST has been interpreted and developed through two primary paradigms: data-driven smart manufacturing and value-added smart servitization. These perspectives represent distinct yet complementary approaches to integrating advanced technologies into industrial ecosystems. Data-driven smart manufacturing emphasizes the implementation of cutting-edge technologies within fully integrated and collaborative manufacturing systems [31]; it underscores enhancing multiple operational dimensions such as production efficiency, operational flexibility, and sustainability [25,32]. For instance, by implementing real-time monitoring systems, manufacturers can optimize energy consumption and reduce waste, contributing to more sustainable practices. Additionally, this approach promotes smart working practices, which involve leveraging automation and artificial intelligence to streamline workflows and improve decision-making processes. Value-added smart servitization represents a more advanced form of service-oriented transformation compared to traditional digital services. It not only incorporates connected, intelligent, and autonomous product–service systems but also involves adopting process–customer-oriented business models [33,34]. Such models typically leverage data analytics to understand customer preferences and tailor offerings accordingly, and enterprises can design their operations around delivering personalized experiences and supporting open-service value co-creation.
While both paradigms share a common foundation in technology adoption, their focus areas differ. Data-driven smart manufacturing prioritizes the manufacturing execution system to achieve high levels of operational determinism by optimizing internal manufacturing processes [35]. This includes deploying sophisticated algorithms for real-time production scheduling and ensuring optimal resource utilization. Conversely, value-added smart servitization is centered around a cognitive services architecture to optimize manufacturing system adaptability [30], enabling machines and systems to learn from data, adapt to changing conditions, and provide users with smarter, more integrated service solutions. These architectures often employ machine learning and natural language processing techniques to enhance interaction and understanding between humans and machines.
Similarly, Jaspert et al. [32] elaborate on several technological application associated with retrofitting industrial systems and propose a five-tier model for value generation in smart manufacturing. The model comprises the physical layer, sensor layer, connectivity layer, data layer, and application layer, accentuating the significance of technology application in smart retrofitting. Moreover, ST also revolutionizes the processes, capabilities, and business models of industrial enterprises within interconnected ecosystems, evolving from product innovation to innovative industries. Thus, ST catalyzes the ecological development of regional industries, supporting the transformation of traditional enterprises [7]. This paper aspires to construct a multi-dimensional ST level to represent the degree of technology in regional manufacturing industries, as shown in Figure 1, due to the limited direct quantification of ST levels in the manufacturing sector.
Smart Base Input Level
To achieve readiness for ST, manufacturing firms need to understand the main digital technologies. Big data optimizes the production process and promotes product and service innovation by analyzing massive data [36]. Cloud computing provides flexible computing resources enhancing data storage capabilities and reducing technology costs for enterprises. IoT facilitates equipment connectivity and optimizes supply chain management [37,38]. Furthermore, AI strengthens quality control and offers the potential replacement of human activities within a wide range of industrial, intellectual, and social applications [39,40].
The smart base input level encompasses essential research and development (R&D) in foundational technologies, enabling its applications. Moreover, future operators will work in increasingly intelligent environments, engaging in real-time information exchange with smart objects, innovative collaboration mechanisms, and social interactions that significantly influence the performance of entire industrial system [41]. The heterogeneity of labor skills plays a pivotal role in determining the alignment between departmental productivity and labor skills. This relationship stems from the fact that different industries demand varying levels of expertise to achieve optimal performance. For instance, high-tech manufacturing facilities may require advanced technical skills in robotics and automation [42]. Consequently, high-tech talent input will become increasingly important, necessitating a rethinking of manufacturing systems in human–technology integration amid the transition from Industry 4.0 to Industry 5.0 [43,44]. This transformation demands a shift away from traditional approaches toward new paradigms that emphasize adaptability, flexibility, and continuous learning. High-skilled professionals with expertise in areas like data science, machine learning, and robotics will play a crucial role in driving this evolution. Thus, organizations can invest in training programs and partnerships with educational institutions to cultivate the workforce needed for future smart factories.
Smart Applications Level
The smart applications level signifies the strategic implementation of advanced technologies, primarily manifested in data-driven smart manufacturing and value-added smart servitization as shown in Figure 1, optimizing decision-making processes in real-world scenarios. This section will provide a detailed elaboration on the technology-driven smart application framework. Specifically, in data-driven smart manufacturing, technologies such as industrial robots, digital twins, and predictive maintenance systems leverage real-time data analysis to enhance production workflows and extend equipment lifespan [45]. Supply chain integration significantly benefits from these technologies. For example, technologies like blockchain can enhance transparency and traceability in supply chains, ensuring timely delivery and reducing costs. Generative AI can analyze and interpret data based on the key capabilities of prediction and reasoning, thereby significantly enhancing its learning and perception capabilities. AI-driven supply chain management facilitates demand prediction, production scheduling, inventory and quality management, and risk management, thus enabling a comprehensive transformation in the synergy between humans and AI within the realm of smart manufacturing [46]. Similarly, the application of technology addresses quality and sustainability issues through automated quality inspection and optimized resource utilization, aligning with the principles of green manufacturing.
To establish a sustainable ST of manufacturing firms, emphasis should not only be placed on advanced technologies to enable interoperability, decentralization, and virtualization in smart supply chains but also on promoting industrial integration to develop service ecosystems while simultaneously meeting the demands of value co-creation and sustainable manufacturing [47,48]. Specifically, regarding value-added smart servitization, AI-powered chatbots and augmented reality (AR) tools enable personalized interactions and services for customers. Furthermore, industry convergence merging technologies, capabilities, and expertise from different sectors plays a crucial role in advancing servitization, and manufacturing enterprises can create innovative solutions that transcend the boundaries of traditional industries. This collaborative ecosystem encourages knowledge sharing and joint innovation, which is essential for developing sophisticated product–service systems.
Consequently, the smart application level is reflected by promoting advanced production methods and achieving value co-creation benefits through smart devices and technologies. Jaspert et al. [32] stated that smart manufacturing, equipped with hardware and software application and networking capabilities, is crucial in enabling new data-driven processes and innovative business models. The manufacturing sector synthesizes an array of core softwares, inclusive of cyber–physical production systems (CPPSs) and robotics/automation, to actualize a data-centric and synergistic supply network [49]. Moreover, the construction of advanced network infrastructure and the deployment of ubiquitous sensing terminals have facilitated smart manufacturing, which leverages sophisticated data analytics and information and communications technology (ICT) platforms to facilitate self-organization, execution, regulation, learning, and self-adaptation by exploiting diverse data from the manufacturing process [50]. Additionally, smart manufacturing also can realize intelligent services and customer management, thereby improving operational efficiency, management efficiency, and service capabilities [51].
Above, the smart application level serves as a crucial link for embedding intelligence technology into operational and strategic domains, promoting efficiency, sustainability, and cross-industry collaboration. Notably, the smart application level operates in coordination with other framework components. The smart base input (e.g., R&D investment, high-tech talents, and foundational technologies) provides the necessary support in adaptive systems and real-time data processing in achieving agility and sustainability.
Smart Market Benefits Level
The results of manufacturing change aim to ultimately achieve high-quality development of the manufacturing industry. According to the effectuation theory, the smart market benefits level reflects the responsiveness of manufacturing intelligence to market dynamics [52], indicating that ST can catalyze the development efficiency and overall benefits of the manufacturing industry [53]. Given that smart manufacturing facilitates industry frontrunners in fabricating a universal AI operating system and expedites the foundational architecture design within a cloud-based ecosystem [54], this delivers innovative resources that are more accessible, particularly benefiting SMEs. SMEs frequently encounter challenges such as limited capital, technology gaps, and insufficient expertise. By leveraging these resources, they can enhance their competitiveness and contribute more effectively to the overall development of the manufacturing industry. Thus, the market benefits can measure the co-development level of a region’s manufacturing industries.
Aligned with the Antecedents–Decisions–Outcomes (ADO) paradigm illustrated in Figure 1, this framework conceptualizes ST as a cyclical progression encompassing three interdependent tiers: antecedent conditions (smart base input level), emphasizing technology adoption and readiness in the manufacturing industry while fostering the human–digital collaboration essential for Industry 5.0 readiness; transformative decisions (smart applications level), which involves implementing technological infrastructure into self-optimizing manufacturing systems to realize intelligent services and industry convergence; socio-economic outcomes (smart market benefits level), which evaluates innovation diffusion, technology application, and their contributions to regional resilience and transformations in manufacturing, emphasizing the need to balance technological advancement with social considerations. Above, the ADO paradigm offers a systematic approach to understanding and implementing ST. By addressing preconditions, facilitating transformative smart application, and assessing socio-economic outcomes, this framework supports the continuous evolution of manufacturing systems toward smarter, more resilient, and socially responsible operations. Each level builds upon the foundation laid by the previous one, forming an integrated and iterative process adaptable to the evolving technological landscape and societal demands of manufacturing transformation.

2.2. Regional Innovation Capacity

The earliest research on “innovation capacity” at the micro-level primarily focused on enterprises [55]. Teece et al. [56] defined “innovative capability” as an organization’s capacity to perceive environmental changes and effectively utilize available resources to generate a competitive advantage in product development, marketing strategies, and business practices. The subsequent literature analyzed related ideas such as “innovation strategy”, “open innovation operations”, “innovation markets”, and “innovation communities” [57,58,59]. “Innovation system” has particularly gained attention and has been applied at national, sectoral, and regional levels [60,61]. Regional differences, especially in education, technological base, and innovation outputs, have led to various types of regional innovation systems (RISs). These include medium-high/low-tech industrial regions, non-science and technology regions, knowledge-intensive regions, and advanced services regions [62]. Pan et al. [61] evaluated the life-cycle stages of RISs through six key capabilities: environment, resource, network, efficiency, growth, and achievement capacity. These capabilities highlight the differences in creative and systematic efforts to boost regional competitiveness by allocating innovative resources, creating new technological ideas, and transforming them into new products or services [3].
The previous literature has explored the inequalities in RIC, focusing on spatial factors, aggregation effects, and cumulative advantages [21]. Due to spatial heterogeneity, disadvantaged regions, and deficient innovation-driven resources, RIC encounters systemic challenges in fostering effective and scalable intellectual capital accumulation. This deficiency in capability development perpetuates innovation asymmetries, thereby exacerbating spatial disparities in economic advancement [21]. Notably, amid the shift from industrial economy to knowledge economy, innovative and entrepreneurial activities are closely tied to the socio-economic systems characterized by knowledge application and exploitation, knowledge generation and diffusion, and knowledge transfer and spillover [63]. Knowledge innovation, emerging in territorially embedded RISs, exerts a positive radiation effect on surrounding areas, leading to a win–win situation in collaboration and synergy [61]. Key innovation actors including universities, research institutions, and the manufacturing industry represent the level of knowledge-based capital and are integral to sustaining innovation dynamics, thus determining a region’s innovation capacity [64].
Within the framework of an innovation system, innovation capacity indicates the level of productivity or the outcome of innovation activities. Knowledge innovation is one of the driving forces of innovation, while technology-oriented regional capabilities are also one of the necessary components [65]. Scholars have argued that RISs serve as effective carriers for technological innovation in the digital economy [66,67]. Technology-oriented RIC contributes to identifying the associations between technology categories and further spilling over industrial innovation network [68]. Technological innovation capability is enhanced by the development of cross-field, cross-industry, and interdisciplinary innovation platforms to develop applied technical efficiency and enable breakthroughs in core technologies [69], while technological innovation capability is largely dominated by influential high-tech industrial clusters [70]. The agglomeration of science and technology in the service industry contributes to transforming various types of “technology components” into new enabling technologies, thereby mitigating potential lock-in effects [71]. The inward-oriented knowledge absorption and outward-oriented technology radiation constitute a comprehensive process of regional innovation within RISs [72].
Comparative resource inputs for innovation activities across different regions may appear similar, and there are still significant gaps in innovation output due to disparities in innovation environment and efficiency [73]. Innovation infrastructure functions as external support for fostering innovation and providing favorable conditions for entrepreneurial activities [74]. It encompasses the public welfare infrastructure that underpins scientific research, technology development, and product innovation. This includes major scientific, technological, educational, and industrial innovation infrastructure [75]. Unlike information and integrated infrastructure, innovation infrastructure operates at the front end of the innovation chain, and its efficient layout is crucial for improving the quality and efficiency of new infrastructure supply. Thus, it is also a key capability of regional innovation [76].
Regarding RIC is conceptualized as the productive outputs of innovation activities within a spatial-economic system. Based on the innovation index of the Organization for Economic Cooperation and Development (OECD), this paper evaluates RIC from three dimensions: knowledge innovation capability, technological innovation capability, and innovation infrastructure [3].
There are several reasons, first, contemporary research on regional development has transitioned from growth-centric paradigms toward analyzing adaptive resilience in response to technological disruptions, market volatility, and exogenous economic shocks. This paradigm is predicated on knowledge production–diffusion mechanisms and interactive learning environments involving multi-stakeholder institutions (e.g., universities, R&D hubs, and enterprises). Second, drawing on endogenous growth theory, technological innovation serves as a critical driver of economic advancement and sustainable development, encompassing both enterprise-level initiatives (e.g., industrial clusters and learning regions) and macro-level institutional engagements (e.g., government) [21]. The degree of the coordinated development of regional actors drives the enhancement of knowledge recombination capacity and technological frontier-pushing capabilities, embodying the persistence and evolutionary nature of regional innovation systems. Third, RIC reflects a region’s latent potential to generate innovation through the synergistic mobilization of innovation infrastructure and institutional environments, contingent upon the interconnectivity between physical capital stock and regional networks [12]. The advancement of innovation infrastructure can transform the co-evolution dynamics within the innovation ecosystem and reduce the innovation gap. Consequently, innovation infrastructure has emerged as a novel driving force for the evolution of innovation ecosystem, thereby enriching the theoretical framework of the innovation ecosystem [23]. For example, urban road and broadband systems exemplify its dual role as a physical enabler and digital synergist: facilitating researcher mobility while accelerating data flows, thus optimizing the interaction between regional actors at the greatest level.
Thus, while institutional innovation and cultural factors constitute important contextual elements for regional innovation, our framework focuses on direct productive capacities based on regional innovation theory and endogenous growth theory rather than indirect enablers [12]. That is, the OECD’s tripartite structure (KIC, TIC, and II) can be utilized to assess how regional actors address the demands of sustainable development by translating exploratory learning and technology diffusion into regional capabilities.

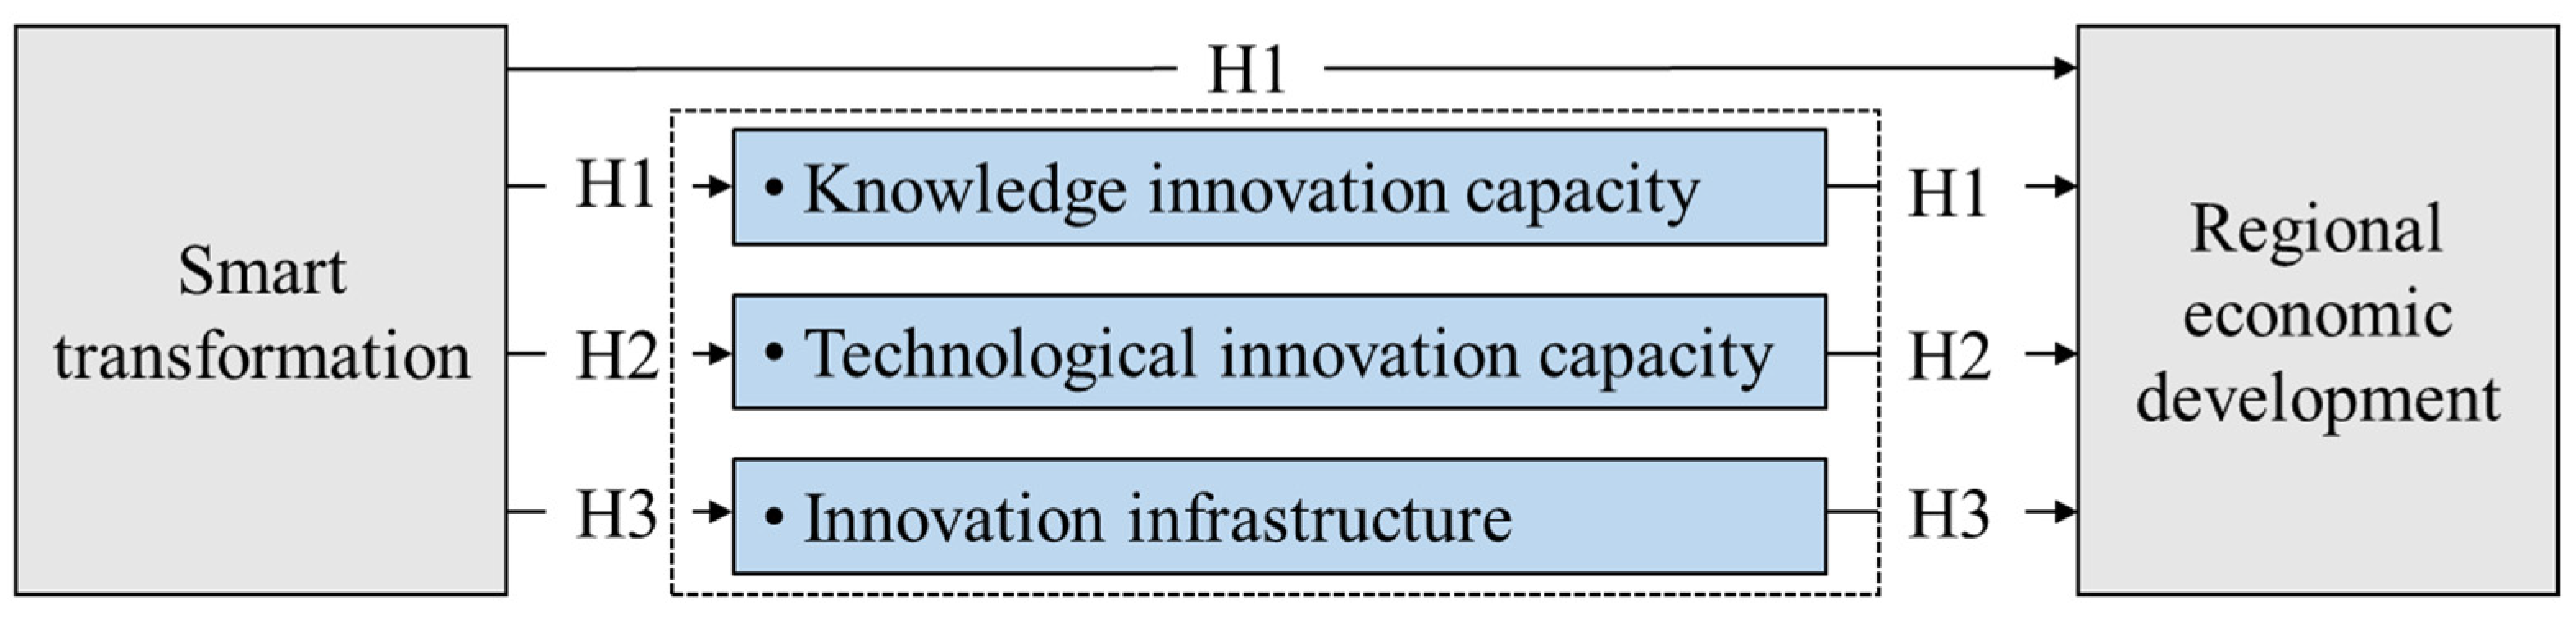
3. Theoretical Framework and Hypotheses

3.1. Smart Transformation and Regional Economic Development

ST is rooted in digital and technological progression as a driving force in manufacturing evolution, providing opportunities for achieving economy development from multiple perspectives.
Firstly, smart base input involves a variety of digital technologies and may impact future manufacturing changes, which in turn provide important support for the technological economic activities [10,77]. From an enterprise perspective, it means that manufacturing enterprises establish foundational technologies through strategic deployment in order to collectively reconfigure the production paradigm. Based on sociotechnical system theory, Geng and Evans [78] showed that management and technology work in synergy to reduce industrial energy waste and resource consumption and improve production energy performance. Lee et al. [79] acknowledged that digitalization has contributed to green innovation activities and has greatly improved green economy efficiency in the manufacturing industry. Thus, against the backdrop of rising constraints on factor costs, resource availability, and environmental protection in China, digital technology not only enhances productivity in the manufacturing sector but also effectively reduces material and energy consumption levels, thereby fostering green economy development [5]. In addition, high-tech talent into the manufacturing sector can significantly enhance overall economic output. High-tech talent refers to employees who not only possess technical competencies but also exhibit soft skills such as problem-solving, adaptability, and teamwork. These attributes enable employees to contribute effectively to innovation, process improvement, and quality control. It is evident that infusing high-quality human capital into the manufacturing sector can further bolster the overall economic output of the industry [42].
Second, smart applications are adopted in industrial contexts, with cyber–physical systems (CPSs) playing a crucial role in integrating the physical world with computational infrastructures. Moreover, blockchain enables a distributed environment for communication in CPSs; Software-Defined Networking (SDN) establishes protocols for data forwarding in the network [80]. Cloud servers store data collected from IoT sensors and devices, and deep-learning-based cloud computing addresses challenges such as regional resilience, communication delays, centralization, and scalability [81]. The interconnection of these application devices facilitates the integration of physical and digital elements in the regional environment, enabling cost-effective and high-performance computing resources for smart city applications [8]. Furthermore, smart applications break down the internal and external boundaries of manufacturing industries, creating conditions for pulling changes in industrial structure. Big data management platforms and technical service platforms have enabled integrated innovation across heterogeneous industries, dissolving traditional industrial boundaries and facilitating the transformation and upgradation of traditional sectors [82].
Furthermore, research has focused on the smart manufacturing domain, investigating its positive effects on production efficiency, operational efficiency, resource allocation, and labor productivity [83]. These advancements not only can significantly increase the marginal output of capital relative to labor but also offer potential solutions to the economic marketplace’s matching problems. In addition, smart servitization in the manufacturing industry has attracted a large amount of global investment and policy support for technology implementation and data utilization, especially in the financial and business service industries. With the convergence of industries, there is an increasing emphasis on sustainability and environmental responsibility. Value-added smart servitization enables companies to monitor resource usage more effectively, reduce waste, and promote eco-friendly practices. Through data-driven decision-making and automation, organizations can align their operations with global sustainability goals, benefiting society as a whole [84]. Furthermore, based on transaction cost theory, ST enables a reduction in organizational costs across all dimensions, bridges the gap between production and consumers, and diminishes information asymmetry, thus improving customer experience and increasing user retention. These mechanisms are pivotal in unlocking new potential for economic growth and facilitating a shift in growth momentum.
Smart market benefits encapsulate ST’s socioeconomic outcomes. This level positions ST as an economic accelerator that supports the industrial metaverse to transform technological complexity into measurable market benefits, actively shaping regional economic development trajectories. In other words, the measurement of market benefits extends beyond individual companies or sectors. It provides valuable insights into the co-development level of an entire region’s manufacturing industries. Simultaneously, this not only redefines the overall development of the manufacturing landscape but also establishes intelligent governance frameworks for the entire industry, thereby stabilizing regional economic development amid volatile market conditions. Moreover, the market advantages of smart manufacturing systems incentivize multinational enterprises to allocate strategic resources to regions equipped with advanced manufacturing infrastructure. By enhancing global capital attraction and economic openness, these systems facilitate the conversion of market advantages into tangible economic outcomes.
Amid the discussion above, we propose the hypothesis:
H1. 
Smart transformation has a direct relationship with regional economic development.

3.2. The Mediating Effect of Regional Innovation Capacity

Innovation has become the first driving force in economic development, while RIC is the foundation for a region to gain competitive advantage. Innovative capabilities are often constrained by the effectiveness of RISs. As ST accentuates the integration of digital technology into the manufacturing industry, we argue that ST strengthens the innovation linkage effect among strategic emerging industries and thus can effectively promote the overall high-end of the industry in the innovation network. The interaction between industrial clusters not only boosts the regional knowledge innovation capability and technological innovation capability [85] but also further achieves economic progress. For example, Yang and Liu [86] examined the impact of smart manufacturing on green innovation across different regions using micro-data from Chinese companies, highlighting the importance of regional cooperation, knowledge sharing, and technology transfer for promoting RED.
On the one hand, with the continuous progress of the new technological revolution, ST has emerged as a critical production factor, playing a significant role in shaping and participating within the innovation ecosystem. The foundation of this ecosystem’s technological framework lies in digital platform technology, which facilitates dynamic knowledge exchange among knowledge-intensive entities. Moreover, ST represents a comprehensive development that involves talent management, employee skills, and organizational culture. These changes reduce the costs associated with personnel mobility and information communication, thus improving the efficiency of knowledge and technological innovation diffusion [15]. In particular, based on sociotechnical system theory, high-quality human capital plays a crucial role in driving green technological innovation [5]. Clearly, the process of the ST of the manufacturing industry is inseparable from the interaction with the innovation entities of the innovation ecosystem, which results in significant changes of innovation capacity [10].
On the other hand, RIC mainly focuses on exploitative and exploratory learning in knowledge innovation [72], where knowledge flow among regions can effectively integrate current production factors and transform new knowledge into products. It provides the manufacturing industry the potential to create smart products and services to accomplish economic progress [1]. The effective dissemination of emerging technologies into traditional industries propels the technological advancement in energy saving and environment conservation to promote green economic development [87]. Du et al. [88] argues that the pilot policy for low-carbon cities aims to enhance ecological efficiency through the promotion of green technological innovation, thereby facilitating the construction of ecological civilization and promoting sustainable green development. Innovation infrastructure is a foundation and guarantee for the development of other regional industries; it enhances the service capabilities of traditional infrastructure and stimulates regional entrepreneurial activities [89]. In recent years, innovation infrastructure has evolved into a highly open and distinctive core-periphery nexus. This not only sustains the competitive edge of the entities involved but also fosters technological spillover effects [23]. When the level of innovation infrastructure falls below a certain threshold, the insufficient development of innovation infrastructure will impose a disadvantageous effect on subsequent progress. Once this threshold is surpassed, the role of innovation infrastructure transitions from exacerbating the digital divide to generating digital dividend, thereby amplifying the effects of industrial upgrading in manufacturing and yielding economic benefits [23].
Therefore, this paper attempts to discuss the mediating effect of RIC from three dimensions: knowledge innovation capacity, technology innovation capacity, and innovation infrastructure between ST and RED. Hence, this paper proposes the following hypotheses.
H2. 
Knowledge innovation capacity mediates the relationship between smart transformation and regional economic development.
H3. 
Technological innovation capacity mediates the relationship between smart transformation and regional economic development.
H4. 
Innovation infrastructure mediates the relationship between smart transformation and regional economic development.
Based on the above analysis, our research model is shown in Figure 2.

4. Methodology

The methodology follows three stages: First, key variables are identified and measured grounded in the prior literature to ensure conceptual validity. Second, the panel data are collected from authoritative sources followed by rigorous preprocessing to prepare the dataset for analysis. Third, the econometric model is developed to empirically examine the relationships between variables, incorporating an endogeneity check, heterogeneity check, and robustness checks to validate the reliability of the results.

4.1. Variable Measurement

4.1.1. Dependent Variable

RED is commonly measured using gross domestic product (GDP) per capita. Scholars focus on the process and outcomes of economic development, taking economic growth and economic stability into account by the GDP and employment rate across different provinces in China [90,91]. Lin et al. [92] argue that economic openness, measured by foreign trade and foreign direct investment (FDI), significantly influences economic development. Smart technology drives green and sustainable economic growth; Luukkanen et al. [93] quantified sustainability as environmental indicators and green economic development. This paper quantifies the four dimensions of economic development effectiveness, economic sustainability, economic openness, and regional green development to build the indicator system for comprehensively evaluating the RED, as shown in Table 1.

4.1.2. Independent Variable

This paper focuses on three dimensions of ST of smart base input, smart applications, and smart market benefits, as shown in Table 1. The smart base input index mainly involves various investment activities, referring to scientific research investment, smart device input, internet infrastructure input, and high-tech talent input. It guarantees smart retrofitting in the manufacturing industry. The smart applications index reflects software development, data processing, and operations in the process of manufacturing intelligence, ensuring that manufacturing activities are carried out in a more efficient way. The smart market benefits index is measured by the total profit of the high-tech manufacturing industry, providing a quantitative assessment of the economic returns resulting from the implementation of smart technologies.

4.1.3. Mediating Variables

RIC has been measured from a single aspect for dissection, while the patent licensing quantity, patent application quantity, and technology achievement index are the most effective evidence of a region’s capacity for technical innovation activities [12,21,65]. However, the challenge with using patents as a proxy for innovation capacity is that not all innovation activities are patentable [94]. As mentioned before, based on the innovation systems framework and endogenous growth theory, RIC is defined as the comprehensive output capacity of regional innovation activities supporting knowledge innovation capability, technological innovation capability, and innovation infrastructure. Referring to the triple helix model of university–industry–government relations for innovation studies [95], university and research institutes are the hubs of knowledge or technological innovation. R&D capital has been used as key indicators of a region’s capacity, i.e., the number of high-tech employees, research expenditures, and patent data (e.g., “triadic” patents) [12,57]. Based on these studies, knowledge innovation capability is gauged through the number of colleges and scientific research institutions as well as the number of related knowledge outcomes [85]. Technological innovation capability is evaluated from three aspects: input, process, and output. Technology expenditure accounts are used to measure the innovation input. Technological cooperation and technology transfer represent the process of innovation activities. The regional patent grant represents the innovation output. Additionally, innovative infrastructure, as a form of digital empowerment, is reflected in the maturity of innovation infrastructure. Zhou et al. [75] highlight the “Broadband China” policy (BCP) as a cornerstone of innovative infrastructure development. Hu et al. [89] incorporate multi-dimensional metrics such as mobile penetration rates and optical cable networks. Che et al. [96] evaluate digital infrastructure through operational cost, quality, and coverage scope, mainly including network usage and innovation density. Efficient public roads reduce the flow cost of innovation elements and increase innovation quality. Thus, this study measures innovative infrastructure based on previous studies using three pivotal indicators: the number of technology-driven industrial clusters, the number of internet broadband users, and the urban road area, as shown in Table 1, which collectively capture spatial agglomeration, digital connectivity, and digital efficiency.

4.1.4. Control Variables

This study identified several indicators to control the impact of the ST on RED including economic policy uncertainty (EPU), government subsidies (GSs), manufacturing size (MS), and social organization (SO). The ratio of the economic policy uncertainty index to industrial output value can be measured to present economic policy uncertainty. Government subsidies and manufacturing scale are chosen as key indicators at the industrial level. Government subsidies are determined by the total amount of government spending to the manufacturing industry, while manufacturing scale is determined by the total value of assets owned by manufacturing enterprises [3]. Social organizations are assessed based on the number of non-governmental organizations (NGOs) in each province, as shown in Table 1.

4.2. Data Sources and Processing

This paper uses panel data from 29 provinces in China spanning from 2009 to 2023 as the research sample. Hong Kong, Macao, Taiwan, Tibet, and Jilin are not included in the study because of data unavailability. The relevant data were obtained from the “China Science and Technology Statistical Yearbook”, “China Educational Statistics Yearbook”, “China Statistical Yearbook”, and the “China RIC Evaluation Report”. Regarding data processing, the entropy weight method was employed to measure the related index dimensions, especially for the above-mentioned structured data types in Table 1, avoiding the biases of subjective weighting methods such as the analytic hierarchy process and expert scoring method [61]. Furthermore, given the time-lagged effects of ST on economic development, we implemented a two-sided shrinking process at the 1% quantile level on the data [10]. This paper analyzes panel data empirically by using Stata 17 software due to its sophisticated statistical abilities, which enable the accurate processing of large datasets [10].
Specially, the entropy weight method, an objective weighting technique grounded in information theory, quantifies the relative significance of multiple indicators by evaluating their informational utility. The computational protocol unfolds through six methodical stages:
First, data standardization. To neutralize dimensional disparities, the raw data matrix X = [ x i j ] n × m undergoes min–max normalization to be normalized as value x i j . For positive-oriented indicators, follow Formula (1). For negative-oriented indicators, follow Formula (2), where x j denotes the j-th indicator vector, ensuring x i j [ 0,1 ] .
x i j = x i j min x j max x j min x j
x i j = max x j x i j max x j min x j
Second, calculate probability density p i j . Standardized values are converted to probabilistic measures through proportional allocation following Formula (3).
p i j = x i j + ϵ i = 1 n x i j + ϵ
Third, evaluate the entropy value. The informational entropy E j for each indicator is computed following Formula (4), where k = 1 / l n n normalizes entropy values to the interval [0, 1], with n representing sample size.
E j = k i = 1 n p i j ln p i j
Fourth, determine the difference coefficient. The discriminative power of indicators is evaluated through Formula (5). Higher D j values denote greater informational heterogeneity and indicator criticality.
D j = 1 E j
Fifth, weight assignment. Final weights w j are proportionally allocated based on difference coefficients through Formula (6). This formulation ensures j = 1 m w j = 1 , producing a normalized weight vector.
w j = D j j = 1 m D j
Sixth, synthesize weighted normalized indicators to derive composite scores through Formula (7). The overall score can be obtained through Formula (7).
S i = j = 1 m w j x i j

4.3. Model Building

This paper aims to examine the impact of ST on RED and to test the mediating effect of RIC. Based on the literature reviewed above, the econometric model for measuring the direct impact is constructed as follows:
R E D i t = α 0 + α 1 S T i t + α 2 Σ c o n i t + γ i + δ t + ε i t
Our empirical strategy employs a two-way fixed-effects model incorporating both region and year fixed effects. Province fixed effects control spatial heterogeneity as coastal–inland disparities in historical industrial legacies and terrain complexity inherently impede digital infrastructure deployment [86]. Year fixed effects mitigate temporal confounders, including policy shocks (e.g., the 14th Five-Year Plan for the Development of Intelligent Manufacturing in 2021) [86]. This model provides superior advantages in addressing endogeneity issues such as provincial heterogeneity and temporal shocks compared to alternative estimation methods [10]. In Formula (8), where subscript i and t represent the province and year, respectively. REDit is the economic development index of province i in year t. The core explanatory variable STit represents the level of ST in manufacturing. Conit denotes a series of control variables. γi and δt represent region fixed effects and year fixed effects, respectively, ε i t is the error term, and α 1 denotes the regression coefficient of the ST on RED.
To further validate the mediating effect, this study added three mediator variables to further explore the indirect impact of ST on RED. The following mediation-effect models are shown in Equations (9)–(14).
K I C i t = β 0 + β 1 S T i t + β 2 Σ c o n i t + γ i + δ t + ε i t
R E D i t = η 0 + η 1 S T i t + η 2 K I C i t + η 3 Σ c o n i t + γ i + δ t + ε i t
T I C i t = φ 0 + φ 1 S T i t + φ 2 Σ c o n i t + γ i + δ t + ε i t
R E D i t = ϖ 0 + ϖ 1 S T i t + ϖ 2 T I C i t + ϖ 3 Σ c o n i t + γ i + δ t + ε i t
Π i t = λ 0 + λ 1 S T i t + λ 2 Σ c o n i t + γ i + δ t + ε i t
R E D i t = θ 0 + θ 1 S T i t + θ 2 I I i t + θ 3 Σ c o n i t + γ i + δ t + ε i t
For Formulas (9) and (10), KICit represents the first mediating variable, β 1 indicates the direct impact of ST on knowledge innovation capacity, and η 2 represents the impact of knowledge innovation capacity on the RED. Referring to the bootstrapping method [97] to assess the mediator of KIC, we can calculate the range of indirect effects ( β 1 η 2 ) in the 95% CI. If the interval excludes zero, the mediation effect is deemed statistically significant at 10%. Furthermore, if the range of direct effects ( η 1 ) excludes zero in the 95% CI, there is a partial mediating impact; if it includes zero, there is a complete mediation effect [98]. For Formulas (11) and (12), TICit represents the second mediating variable of technology innovation capacity. For Formulas (13) and (14), IIit represents the third mediating variable of innovation infrastructure. The related analysis of the coefficient is similar to KIC.

5. Empirical Results and Analysis

5.1. Benchmark Regression

To assess the suitability of the model for our empirical analysis, the Hausman test was conducted using Stata 17, which offers statistical justification for selecting the fixed-effects (FE) model over random-effects (RE) alternatives in empirical analysis [99]. Based on the statistical evidence from this test, the fixed-effects model was selected over the random-effects model as it better aligned with the assumptions and structural requirements of our research design. In order to ensure unbiased estimation by controlling for unobserved heterogeneity across provinces and years, this paper employs a various fixed-effects model to examine the direct impact of ST on RED.
The results are presented in Table 2. Column (1) reports the baseline estimates without control variables while accounting for province and year fixed effects. In Column (2), the baseline model is extended by incorporating all control variables and province fixed effects. Column (3) further introduces year fixed effects following the inclusion of all control variables. Finally, Column (4) presents the comprehensive model that jointly controls for both the province and year fixed effects. Crucially, the models of two-way fixed cases exhibit a stronger explanatory capacity with adjusted R2 values exceeding 0.7, indicating a good fit for the models [100]. In particular, the coefficient of ST remains consistently positive and statistically significant at the 1% level across two-way fixed cases (0.710 *** in Column (1); 0.632 *** in Column (4)), which supports H1. The marginal attenuation in the ST coefficient magnitude in Column (4) suggests partial mediation by the control variables, yet the persistent significance shows the stability of ST’s explanatory power. These results collectively validate the empirical results and reinforce the conclusion that ST has a positive influence on RED.

5.2. Endogenous Test

The reverse causal and the endogeneity issue arising from the omission of explanatory variables are the primary factors influencing the benchmark regression results. To address this, we employ a two-stage least squares (2SLS) approach with instrumental variables (IVs) [101].
On the one hand, provinces with higher economic development levels might disproportionately foster manufacturing industries, thereby providing a stronger foundation for ST. To address the reverse causality, we follow previous studies to utilize the one-period lagged value of the independent variable as an instrument variable (VI1) [10,13]. This choice satisfies the exclusion restriction as lagged values are unlikely to directly affect current-period RED outcomes while remaining strongly correlated with contemporaneous ST levels. The analysis results are presented in Table 3. The first-stage demonstrates a statistically significant and positive relationship between the instrument variable (VI1) and the endogenous variable ST (0.650 *** in Column (1), t = 19.842), confirming the instrument’s relevance. The Kleibergen–Paaprk LM statistic (χ2 = 13.561 ***) rejects the null hypothesis of under identification, while the Cragg–Donald Wald F-statistic and Kleibergen–Paaprk Wald F-statistic far exceed conventional weak instrument thresholds (e.g., F > 10), ensuring robustness against weak instrument bias. In the second stage, the coefficient of instrumented ST remains positive and significant at the 1% level (0.573 *** in Column (2), t = 16.858), further supporting hypothesis H1.
On the other hand, we also introduce another instrumental variable (VI2) representing government intervention intensity from the policy perspective. Given that Chinese local governments have mainly used fiscal expenditure to drive industrial growth and economic development, we refer to previous research and construct this indictor of VI2 as the ratio of regional fiscal spending on manufacturing sector to local GDP [102]. Although manufacturing-directed fiscal allocations may enhance regional industrial development, no conclusive evidence exists in the literature confirming direct causal effects of such expenditures on overall economic growth. The analysis results are also presented in Table 3. Consistent with prior analyses, the first-stage demonstrated a statistically significant positive association between the instrumental variable (VI2) and the endogenous variable ST (0.219 ***, t = 2.900; Column (1)), thus validating the instrument’s relevance. In the second stage, the ST coefficient persisted in exhibiting statistical significance at the 5% level (0.401 **, t = 2.220; Column (2)), thereby reinforcing the robustness of the benchmark regression estimates.

5.3. Heterogeneity Test

5.3.1. Heterogenous Analysis Based on Regions

The spatial heterogeneity of China’s manufacturing development arises from entrenched disparities in resource endowment, population density, geographical proximity, market scale, and technological advantages. Both the degree of ST and the quality of economic development exhibit pronounced heterogeneity in their regional distribution. Some research studies suggest that urban construction can influence the level of digitalization [103]. The promoting effect of high-density urban areas is notably stronger than that of low-density urban areas. Urban agglomeration can accelerate industrial restructuring and technological innovation, thereby enhancing the intelligent development level of regional manufacturing [103]. This study categorizes the samples based on seven geographic regions—Northeast, North, East, Central, South, Southwest, and Northwest [86]—and objectively evaluates RED by comprehensively integrating the attributes of regional heterogeneity. Table 4 summarizes the regression estimates across these sub-samples.
As presented in Table 4, the ST coefficients for all regions are highly significant at the 1% level, indicating that ST has a positive and promotional impact on the economy of each region. However, there are notable spatial differences in the intensity of this effect. By comparing the coefficients, this study categorizes the influence of ST on RED into three types: high-efficiency-response regions (Northeast, Northwest, and Southwest), medium-effect regions (East and South), and low-effect regions (Central and North). First, high-efficiency-response regions (e.g., Northeast) typically possess a strong heavy industry foundation. The inclination of manufacturing regions dominated by heavy industry to embrace ST arises from the interplay between structural economic incentives and strategic repositioning within the context of national development. Heavy industry is marked by its capital intensity and asset specificity, while the state’s policy framework imposes mandatory and normative pressures for the adoption of intelligent technologies. This regulatory policy transforms ST from an optional enhancement into a prerequisite for the survival of heavy industrial enterprises. In contrast, low-effect regions (e.g., Central) are constrained by the dispersion of innovation resources and capital shortages, leading to a delayed transformation process. Second, as highlighted in various studies, high-density urban agglomerations (e.g., eastern coastal areas) have facilitated knowledge spillover and technology diffusion via agglomeration economies, thereby enhancing innovation efficiency [86]. However, excessively high market concentration may intensify competition, partially offsetting the transformation dividend (e.g., the ST coefficient in the east is lower than that in the northeast). Specifically, as enterprise density increases, technological complexity grows exponentially, potentially leading to challenges such as complexity traps and efficiency erosion. From this perspective, market saturation may result in innovation fatigue, thereby diminishing innovation performance. Moreover, the inherent complexity and multifaceted nature of the economic structure in the eastern region should be noted. Its reliance on a broader range of factors, including the density of high-tech enterprises, the dynamism of the service sector, and integration into global markets, tends to dilute the relative contribution of manufacturing transformation to overall innovation performance. Finally, influenced by industrial structure and policy support, the ST coefficient in the northwest region remains relatively high, reflecting the concentrated investment in digital infrastructure under the “Western Development” and “New Infrastructure” policies. Despite the vibrant private economy in South China, the dominance of SMEs in its industrial structure may prolong the return cycle of large-scale intelligent investments (e.g., the ST coefficient in the south is lower than that in the northeast).

5.3.2. Heterogenous Analysis Based on Manufacturing Sector

To comprehensively capture the diversity and complexity of the manufacturing sector, this paper aims to provide a more nuanced perspective on the impact of ST on RED. By categorizing the manufacturing industry into distinct types, the analysis focuses on three representative forms: textile manufacturing, mechanical equipment manufacturing, and resource-processing industries [10]. These sectors are chosen for their ability to encapsulate diverse production modes and operational system characteristics, thereby offering a holistic view of the smart transformative potential within the manufacturing domain. Specifically, the textile-manufacturing industry, as a paradigm of traditional labor-intensive sectors, illustrates the efficacy of digital technologies in enhancing labor productivity and refining production processes. The mechanical equipment manufacturing industry, representing technology-intensive and capital-intensive sectors, highlights the capacity of digital innovations to drive technological advancements and industrial integration. Lastly, the resource-processing industry, exemplifying resource-intensive sectors, underscores the potential of technological application in optimizing resource allocation and boosting operational efficiency.
This paper selects the regions represented by these three industries, respectively, as sub-samples for analysis. Table 5 depicts the results: the statistically significant coefficients of ST for the RED of the three distinct industries are 0.975, 0.643, and 0.499, respectively. Specifically, the textile-manufacturing industry has exerted the most significant positive influence on economic development. Despite its historical reliance on traditional production models and relatively low technological levels in process manufacturing, investments in smart base—such as automated systems and robotics—can markedly enhance labor productivity, reduce operational costs, improve product quality, and accelerate industrial upgrading. Collectively, these factors have had the most direct and constructive impact on regional economies. Moreover, the higher ST coefficient observed in the textile sector can be attributed to the historically lower baseline automation and a less advanced level of digital integration compared to capital-intensive industries such as machinery manufacturing. With growing emphasis on smart manufacturing and automation within the textile industry [10], this sector has experienced rapid advancements in recent years. ST investments effectively bridge the “digital readiness gap”. Given the relatively straightforward and standardized nature of textile production processes, the industry is more likely to swiftly adopt and benefit from digital technologies. In contrast, for the mechanical equipment manufacturing industry, ST enhances the technological sophistication of products and the added services value through the application of advanced manufacturing technologies and equipment. It also fosters synergy among related industrial chains, thereby driving high-quality RED. However, due to the high threshold of sunk costs in technology and heavy reliance on capital, the realization of benefits lags behind that of the textile industry. Lastly, in the resource-processing industry, the application of smart technologies, such as intelligent monitoring systems and automated control systems, improves resource utilization efficiency, reduces environmental pollution, and promotes sustainable green development. Nevertheless, compared to the other two industries, its transformation exerts a relatively weaker economic impact. This may be attributed to the complexity of its production processes and its strong dependence on resources, which render it more disposed to external factors.

5.4. Robustness Test

5.4.1. Replace the Independent Variable

Given the lack of a standard measure for assessing ST from a manufacturing perspective and examining the connection between digital technology and manufacturing transformation, Xie et al. [10] employed “statistics of digital technology patents in various industries and years” to assess the implementation of digital technology in manufacturing. This paper has gathered the digital technology patent application data (DT patent) of publicly listed manufacturing enterprises in different provinces from 2009 to 2023. The semi-structured data were obtained from the China Stock Market and Accounting Research (CSMAR) database [10]. DT patent (denoted as ST1) can be used as an indicator to evaluate the degree of ST in the manufacturing industry.
As shown in Column (1) of Table 6, the effect of ST1 (DT patent) on RED retains its statistical significance at the 1% level (0.264 *** in Column (1)). Thus, the benchmark results are again found to be robust.

5.4.2. Replace the Dependent Variable

This research also takes the approach of substituting the core dependent variable for robustness testing. Drawing on established methodologies in regional economics [66], we substitute the original regional economic development (RED) index with the natural logarithm of provincial GDP (lnGDP)—denoted as RED1—to mitigate potential scale bias and non-normality in the data [104,105].
As shown in Table 6, the coefficient of ST retains its statistical significance at the 10% level (0.109 * in Column (2)), albeit with reduced magnitude compared to the baseline estimate. This attenuation is consistent with the logarithmic transformation’s compression effect on variance, yet the persistent positive association supports the stability of H1.

5.5. Mediating Effect

To elucidate the mechanisms underlying the relationship between ST and RED, mediation analysis was employed within an empirical framework through the bootstrapping method. Table 7 below depicts three distinct pathways mediated by KIC, TIC, and II.
Firstly, in contrast to KIC and II, the confidence interval of the direct effect of TIC ([−0.411 and 0.856]) includes zero, indicating that TIC plays a complete mediating role. This underscores the irreplaceability of TIC, particularly at the theoretical level, providing robust empirical support for the “technology-driven” hypothesis [30].
Further analysis reveals that the partial mediating role of II is characterized by a significantly higher proportion of its indirect mediating effect (94.64%) compared to other variables. This highlights that the promotion of ST on RED remains highly dependent on the level of II. Compared to the complete mediation of TIC, the strong mediating effect of II is more evident in terms of the absolute dominance of its indirect effect. It is clear that II serves as a fundamental pillar in the process of ST and drives regional economic digitalization.
In contrast, while KIC is categorized as a partial mediator, its indirect effect accounts for only 14.55%, with the direct effect predominating at 85.45%. This suggests that the mediating role of KIC is relatively weak and functions primarily as an auxiliary explanatory factor in the relationship between ST and RED. The empirical results support H2, H3, and H4.

6. Discussion

6.1. Summary of Key Findings

This study systematically investigates the mechanisms through which ST in manufacturing impacts RED by employing an integrated analytical framework encompassing benchmark regression, endogeneity tests, heterogeneity analysis, and robustness checks. The findings not only confirm the pivotal role of digital technologies (e.g., AI and big data analytics) in restructuring manufacturing value chains but also reaffirm their status as critical drivers of industrial transformation [10]. Furthermore, the findings highlight how ST can contribute to the development of manufacturing systems that drive productivity leaps and resource optimization, thereby providing inclusive and resilient systemic solutions for sustainable RED.
Furthermore, regarding H1, the heterogeneity test based on regions provides a more detailed analysis regarding regional disparities. This study posits that the influence of ST on RED follows a gradually distributed pattern: the high-efficiency response zone (Northeast, Northwest, and Southwest), the medium-effect zone (East and South), and the low-effect zone (Central and North). Different from the previous research findings, the spatial spillover effect of industrial digitalization shows a decreasing trend from the eastern to the central and western regions [106]. We argue that certain economically underdeveloped regions have demonstrated unexpectedly high responsiveness to digital transformation activities [86]. For instance, despite the lack of abundant innovation resources, regions in the northeast have successfully leveraged ST to achieve economic growth due to their robust heavy industry foundation. Although heavy industries typically exhibit slower rates of innovation adoption, targeted government incentives and investment policies can effectively enhance the advantages of ST. Moreover, while well-developed digital infrastructure and a strong digital industry in the southern region provide external support for enterprises pursuing ST, SMEs must still integrate effectively into regional innovation practices by utilizing digital technologies.
When it comes to the heterogeneity test based on manufacturing industry types, similar to previous studies [10], the effectiveness of ST in the textile-manufacturing industry surpasses the mechanical manufacturing and resource-processing industries. This disparity highlights the necessity of addressing industry heterogeneity in the development of digitally driven industries. Consequently, enterprises and regulatory authorities should develop customized transformation strategies tailored to industry-specific operational models, technological maturity, and value chain structures. It is essential for optimizing the synergy between digital innovation and industry upgrading.
Regarding H2, H3, and H4, consistent with prior studies on geographic heterogeneity in regional development, our findings reveal that the effectiveness of ST in enhancing RED is critically mediated by innovation capacities [15,72]. However, diverging from prior studies focusing on singular innovation pathways (e.g., technological capacity) [67], our mediation analysis identifies multi-dimensional mechanisms: partial mediation by KIC and II and complete mediation by TIC. The finding of partial mediation by KIC has expanded our understanding of how university–enterprise collaboration enhances the social impact of emerging economies. Systematic interactions among regional innovation actors, as well as the knowledge exchange among these participants, represent critical components of regional development. In contrast, TIC typically refers to the ability of an enterprise or region to successfully convert new technologies into marketable applications. Its complete mediating role underscores the central importance of technology’s practical application in driving economic growth. As such, enhancing TIC (e.g., green patents) is key to bridging the regional innovation gap [107]. The relationship between these two capabilities can be characterized as complementary. Technology commercialization (measured by TIC) serves as a pivotal mechanism for transforming intangible knowledge (represented by KIC) into economic value. Given the innovation activities center on technological innovation, TIC (by enhancing R&D and facilitating technology diffusion) not only emphasizes patents but also prioritizes scientific and technological collaboration. Strengthening TIC aids in overcoming innovation barriers caused by technology lock-in. Consequently, TIC functions as an essential pathway for ST to achieve regional competitiveness and sustainable development. This evidence of partial mediation by II not only underscores the imperative for policymakers to design spatially differentiated strategies that align local ST adoption with local endowments (e.g., innovation infrastructure maturity) to optimize its role in fostering sustainable industrial upgrading and RED but also advances the theoretical understanding of regional development [23].

6.2. Theoretical Implications

The study contributes to theory in three ways. Firstly, drawing on sociotechnical system theory and technology diffusion theory, this study provides a more nuanced explanation of the deep application of smart technologies in manufacturing at the macro-level [32,108]. Referring to the classification system of the CSMAR database, which divides digital technology keywords into five main areas (artificial intelligence, blockchain, cloud computing, big data, and digital technology applications), it provides a structured but potentially incomplete framework for evaluating ST. This paper constructs ST’s comprehensive metrics system: smart base input, smart applications, and smart market benefits, and our analysis highlights that the continued integration of new technologies into manufacturing has contributed to the substantial development of traditional manufacturing systems and the digital economy.
Secondly, although many studies support the crucial role of technological capabilities in the economic growth literature [65,66,69,87], regional innovation activity differences lead to varied trajectories of RIC. This paper extends innovation systems theory and endogenous growth theory by demonstrating that RIC is connected with geographic characteristics, encompassing the variations in innovation actors, technology diffusion, and innovation infrastructure [73]. These aspects potentially represent three dimensions of RIC: “knowledge innovation capability”, “technological innovation capability”, and “innovation infrastructure”, respectively [3], which offer important insights for further quantitative research.
Thirdly, the study contributes to the empirical literature by better identifying the antecedents of RED and its intrinsic logical mechanism. We have creatively incorporated innovation capabilities into the framework of ST and economic development research. Initially, it deepens the theoretical underpinnings by upgrading the pathways of ST based on new technological paradigms in manufacturing enterprises [108]. Then, examining how ST affects innovation activities among manufacturing enterprises within the ecological innovation system contributes to systematically understanding how technological progress shapes different RICs to narrow the regional innovation gap. Finally, though the mediating role of the three key innovation capabilities, it is discussed that TIC is the necessary conditions to support RED compared with the KIC and II [109]. This provides a more comprehensive analysis of how leveraging applications associated with digital technology enhance the digital infrastructure, digital literacy, and regional innovation environment and further foster sustainability-oriented regional development.

6.3. Practical Implications

The manufacturing industry is progressively advancing from digital manufacturing to new-generation smart manufacturing [108]. Based on the findings, smart manufacturing transformation undergoes significant changes supported by smart base input and smart applications. These changes fundamentally enhance RIC and ultimately lead to the leapfrog development of the regional economy. Given the multiple roles of governments as promoters of economic creativity and designers of public infrastructure, this study provides practical guidance for policymakers and manufacturing enterprises. It highlights the importance of ST, knowledge sharing, technology transfer, and well-established innovation infrastructure to promote sustainable economic development.
Efforts should be made to improve the support system for the manufacturing industry and encourage the transformation of traditional manufacturing sectors. This includes providing resources for adopting new technologies, especially in less-developed regions, thereby fully achieving economic potential [86]. Promoting the deep integration of digital technology and the green economy by continuously funding R&D activities for smart manufacturing is crucial. The manufacturing industry should utilize new technologies to develop new industries like energy-saving and environmental protection, new materials, and new energy while phasing out highly polluting and energy-consuming sectors [3]. Governments should also actively advocate the cross-departmental cooperation frameworks among manufacturing enterprises and encourage the manufacturing industry to build network-information-sharing platforms, data system application platforms, and cloud ecosystem application platforms. These measures are conducive to building an advanced and stable industrial mutual assistance system, promoting a virtuous cycle of technology spillover and value chain upgrading, and supporting the deep integration of different industries [51,110].
Different types of manufacturing industries encounter distinct challenges and opportunities during the process of ST. This paper provides specific guidance for enterprise-level ST through a classified analytical approach. For instance, labor-intensive textile-manufacturing industries can prioritize the adoption of automated equipment alongside enhancing workforce skills, thereby promoting the automation and intelligence of production processes while improving both efficiency and product quality. Resource-processing enterprises may focus on refining resource management and environmental monitoring systems to increase resource utilization efficiency and enhance their capacity for sustainable development. Mechanical equipment manufacturing enterprises should emphasize strengthening technological research and innovation to elevate the intelligence level and market competitiveness of their products.
Upgrading RIC is urgently needed. Strengthening collaboration between industry stakeholders, academia, and the government is key to increasing knowledge sharing and technology development. Thus, equally important are policies aimed at redistributing scientific, technological, and educational resources towards underdeveloped areas. Governments should actively enhance domestic independent scientific research departments, strengthen the construction of school education, and encourage the close combination of teaching and research, with the main purpose being the promotion of industry–university–research cooperation [111]. Governments should increase opportunities for linking universities with manufacturing enterprises, improve communication mechanisms between enterprises and research institutes, and strengthen technological property protection so that scientific research achievements can be transformed into substantive productive forces.
The findings also emphasize the importance of investments in innovation infrastructure and supportive ecosystems, which are critical for improving regional competitiveness or facilitating technology innovation clusters. Compared with traditional infrastructure, innovation infrastructure is at the forefront of the innovation chain. It is necessary to build and improve several professional innovation and entrepreneurship service facilities, including mass innovation spaces, technology transfer centers, science and technology business incubators, and intellectual property operation service platforms. These facilities fully promote resource sharing, resource integration, and creative resources flow. Moreover, it is essential to create national demonstration zones for new industrialization and foster advanced manufacturing clusters [86].

7. Conclusions, Limitations, and Future Research

This study conducted a thorough examination of the impact of ST and RIC on the RED of 29 Chinese provinces from 2009 to 2023. We firstly emphasize ST compared with the DT, which prioritizes the integration of technology in the manufacturing industry from the ecological perspective, and conduct a variety of empirical tests to evaluate its impact on RED. Secondly, we have delved into the essence of RIC through three key innovation capabilities. Thirdly, drawing on the coupling effect of manufacturing industrial clusters and the development of RIC, this study discusses the relative importance of the three key innovation capabilities in the relationship between ST and RED. Thus, our research findings provide valuable insights for policymakers or the manufacturing industry sector seeking to embark upon economic development.
There are certain limitations to the research. Firstly, the measurement indicators for the ST and RIC constructed in this paper are derived from previous limited empirical research. Future research can continue to build a more comprehensive evaluation index system. Secondly, this study solely examines innovation capability as an intermediary variable between ST and RED. There are multiple factors affecting the development of economic development, exploring other factors that influence economic development (e.g., government policies, innovation efficiency, and regional cultural differences) can generate new insights. Thirdly, during the process of manufacturing transformation, research that investigates the roles of organizational culture and leadership in facilitating successful ST can offer more valuable insights to practitioners. Fourth, when conducting robustness tests, there are certain limitations to the substitution of independent variables with technology patent application data (DT patent) because they may not fully capture all dimensions of intelligent transformation activities. Fifth, this paper validates the theoretical mechanism by constructing an econometric model. Future studies could further enrich the exploration through diverse approaches, such as case analysis and qualitative methods.

Author Contributions

Conceptualization, L.S.; methodology, Y.L.; software, Y.L.; validation, F.U.; formal analysis, Y.L.; data curation, Y.L.; writing—original draft preparation, Y.L.; writing—review and editing, L.S. and F.U. All authors have read and agreed to the published version of the manuscript.

Funding

This research received no external funding.

Data Availability Statement

The data is accessible by contacting the corresponding author.

Conflicts of Interest

The authors declare no conflicts of interest.

References

  1. Huang, Y.; Li, S.; Xiang, X.; Bu, Y.; Guo, Y. How Can the Combination of Entrepreneurship Policies Activate Regional Innovation Capability? A Comparative Study of Chinese Provinces Based on fsQCA. J. Innov. Knowl. 2022, 7, 100227. [Google Scholar] [CrossRef]
  2. Fromhold-Eisebith, M.; Marschall, P.; Peters, R.; Thomes, P. Torn between Digitized Future and Context Dependent Past—How Implementing ‘Industry 4.0’ Production Technologies Could Transform the German Textile Industry. Technol. Forecast. Soc. Change 2021, 166, 120620. [Google Scholar] [CrossRef]
  3. Fu, Y.; Supriyadi, A.; Wang, T.; Wang, L.; Cirella, G.T. Effects of Regional Innovation Capability on the Green Technology Efficiency of China’s Manufacturing Industry: Evidence from Listed Companies. Energies 2020, 13, 5467. [Google Scholar] [CrossRef]
  4. Shukla, M.; Shankar, R. Modeling of Critical Success Factors for Adoption of Smart Manufacturing System in Indian SMEs: An Integrated Approach. Opsearch 2022, 59, 1271–1303. [Google Scholar] [CrossRef]
  5. Zhao, S.; Zhang, L.; Peng, L.; Zhou, H.; Hu, F. Enterprise Pollution Reduction through Digital Transformation? Evidence from Chinese Manufacturing Enterprises. Technol. Soc. 2024, 77, 102520. [Google Scholar] [CrossRef]
  6. Coronado-Medina, A.; Arias-Pérez, J.; Perdomo-Charry, G. Fostering Product Innovation Through Digital Transformation and Absorptive Capacity. Int. J. Innov. Technol. Manag. 2020, 17, 2050040. [Google Scholar] [CrossRef]
  7. Benitez, G.B.; Ayala, N.F.; Frank, A.G. Industry 4.0 Innovation Ecosystems: An Evolutionary Perspective on Value Cocreation. Int. J. Prod. Econ. 2020, 228, 107735. [Google Scholar] [CrossRef]
  8. Dai, Y.; Hasanefendic, S.; Bossink, B. A Systematic Literature Review of the Smart City Transformation Process: The Role and Interaction of Stakeholders and Technology. Sustain. Cities Soc. 2024, 101, 105112. [Google Scholar] [CrossRef]
  9. Rogers, E.M.; Singhal, A.; Quinlan, M.M. Diffusion of Innovations. In An integrated Approach to Communication Theory and Research; Routledge: London, UK, 2008. [Google Scholar]
  10. Xie, W.; Zheng, D.; Li, Z.; Wang, Y.; Wang, L. Digital Technology and Manufacturing Industrial Change: Evidence from the Chinese Manufacturing Industry. Comput. Ind. Eng. 2024, 187, 109825. [Google Scholar] [CrossRef]
  11. Xu, A.; Wang, W.; Zhu, Y. Does Smart City Pilot Policy Reduce CO2 Emissions from Industrial Firms? Insights from China. J. Innov. Knowl. 2023, 8, 100367. [Google Scholar] [CrossRef]
  12. Hamidi, S.; Zandiatashbar, A.; Bonakdar, A. The Relationship between Regional Compactness and Regional Innovation Capacity (RIC): Empirical Evidence from a National Study. Technol. Forecast. Soc. Change 2019, 142, 394–402. [Google Scholar] [CrossRef]
  13. Zhao, X.; Shen, L.; Jiang, Z. The Impact of the Digital Economy on Creative Industries Development: Empirical Evidence Based on the China. PLoS ONE 2024, 19, e0299232. [Google Scholar] [CrossRef]
  14. Ruan, R.; Chen, W. Research on the Impact of Geographic Distance on Corporate Technology for Social Good: From the Perspective of Institutional Environment and Regional Innovation Capability. J. Clean. Prod. 2024, 457, 142391. [Google Scholar] [CrossRef]
  15. Chen, J.; Wang, L.; Li, Y. Natural Resources, Urbanization and Regional Innovation Capabilities. Resour. Policy 2020, 66, 101643. [Google Scholar] [CrossRef]
  16. Ganau, R.; Grandinetti, R. Disentangling Regional Innovation Capability: What Really Matters? Ind. Innov. 2021, 28, 749–772. [Google Scholar] [CrossRef]
  17. Audretsch, D.B.; Belitski, M. Knowledge Complexity and Firm Performance: Evidence from the European SMEs. J. Knowl. Manag. 2021, 25, 693–713. [Google Scholar] [CrossRef]
  18. Calderini, M.; Fia, M.; Gerli, F. Organizing for Transformative Innovation Policies: The Role of Social Enterprises. Theoretical Insights and Evidence from Italy. Res. Policy 2023, 52, 104818. [Google Scholar] [CrossRef]
  19. Furman, J.L.; Porter, M.E.; Stern, S. The Determinants of National Innovative Capacity. Res. Policy 2002, 31, 899–933. [Google Scholar] [CrossRef]
  20. Medase, S.K.; Abdul-Basit, S. External Knowledge Modes and Firm-Level Innovation Performance: Empirical Evidence from Sub-Saharan Africa. J. Innov. Knowl. 2020, 5, 81–95. [Google Scholar] [CrossRef]
  21. Xu, A.; Qiu, K.; Jin, C.; Cheng, C.; Zhu, Y. Regional Innovation Ability and Its Inequality: Measurements and Dynamic Decomposition. Technol. Forecast. Soc. Change 2022, 180, 121713. [Google Scholar] [CrossRef]
  22. Ying, L.; Li, M.; Yang, J. Agglomeration and Driving Factors of Regional Innovation Space Based on Intelligent Manufacturing and Green Economy. Environ. Technol. Innov. 2021, 22, 101398. [Google Scholar] [CrossRef]
  23. Du, Z.-Y.; Wang, Q. Digital Infrastructure and Innovation: Digital Divide or Digital Dividend? J. Innov. Knowl. 2024, 9, 100542. [Google Scholar] [CrossRef]
  24. Zhu, C.; Li, N.; Ma, J.; Qi, X. Digital Technology Backgrounds and Enterprise Digital Transformation: The Mediating Effect of R&D Investment and Corporate Social Responsibility. Corp. Soc. Responsib. Environ. Manag. 2023, 31, 2557–2573. [Google Scholar] [CrossRef]
  25. Meindl, B.; Ayala, N.F.; Mendonça, J.; Frank, A.G. The Four Smarts of Industry 4.0: Evolution of Ten Years of Research and Future Perspectives. Technol. Forecast. Soc. Change 2021, 168, 120784. [Google Scholar] [CrossRef]
  26. Sofic, A.; Rakic, S.; Pezzotta, G.; Markoski, B.; Arioli, V.; Marjanovic, U. Smart and Resilient Transformation of Manufacturing Firms. Processes 2022, 10, 2674. [Google Scholar] [CrossRef]
  27. Bueno, A.; Godinho Filho, M.; Frank, A.G. Smart Production Planning and Control in the Industry 4.0 Context: A Systematic Literature Review. Comput. Ind. Eng. 2020, 149, 106774. [Google Scholar] [CrossRef]
  28. Kipper, L.M.; Furstenau, L.B.; Hoppe, D.; Frozza, R.; Iepsen, S. Scopus Scientific Mapping Production in Industry 4.0 (2011–2018): A Bibliometric Analysis. Int. J. Prod. Res. 2020, 58, 1605–1627. [Google Scholar] [CrossRef]
  29. Frank, A.G.; Dalenogare, L.S.; Ayala, N.F. Industry 4.0 Technologies: Implementation Patterns in Manufacturing Companies. Int. J. Prod. Econ. 2019, 210, 15–26. [Google Scholar] [CrossRef]
  30. Kim, M.; Lim, C.; Hsuan, J. From Technology Enablers to Circular Economy: Data-Driven Understanding of the Overview of Servitization and Product–Service Systems in Industry 4.0. Comput. Ind. 2023, 148, 103908. [Google Scholar] [CrossRef]
  31. Ambrogio, G.; Filice, L.; Longo, F.; Padovano, A. Workforce and Supply Chain Disruption as a Digital and Technological Innovation Opportunity for Resilient Manufacturing Systems in the COVID-19 Pandemic. Comput. Ind. Eng. 2022, 169, 108158. [Google Scholar] [CrossRef]
  32. Jaspert, D.; Ebel, M.; Eckhardt, A.; Poeppelbuss, J. Smart Retrofitting in Manufacturing: A Systematic Review. J. Clean. Prod. 2021, 312, 127555. [Google Scholar] [CrossRef]
  33. Frank, A.G.; Mendes, G.H.S.; Ayala, N.F.; Ghezzi, A. Servitization and Industry 4.0 Convergence in the Digital Transformation of Product Firms: A Business Model Innovation Perspective. Technol. Forecast. Soc. Change 2019, 141, 341–351. [Google Scholar] [CrossRef]
  34. Tian, J.; Coreynen, W.; Matthyssens, P.; Shen, L. Platform-Based Servitization and Business Model Adaptation by Established Manufacturers. Technovation 2022, 118, 102222. [Google Scholar] [CrossRef]
  35. Tariq, A.; Khan, S.A.; But, W.H.; Javaid, A.; Shehryar, T. An IoT-Enabled Real-Time Dynamic Scheduler for Flexible Job Shop Scheduling (FJSS) in an Industry 4.0-Based Manufacturing Execution System (MES 4.0). IEEE Access 2024, 12, 49653–49666. [Google Scholar] [CrossRef]
  36. Eriksson, T.; Heikkilä, M. Capabilities for Data-Driven Innovation in B2B Industrial Companies. Ind. Mark. Manag. 2023, 111, 158–172. [Google Scholar] [CrossRef]
  37. Nasiri, M.; Ukko, J.; Saunila, M.; Rantala, T. Managing the Digital Supply Chain: The Role of Smart Technologies. Technovation 2020, 96–97, 102121. [Google Scholar] [CrossRef]
  38. Wang, J.; Lim, M.K.; Wang, C.; Tseng, M.-L. The Evolution of the Internet of Things (IoT) over the Past 20 Years. Comput. Ind. Eng. 2021, 155, 107174. [Google Scholar] [CrossRef]
  39. Dwivedi, Y.K.; Hughes, L.; Ismagilova, E.; Aarts, G.; Coombs, C.; Crick, T.; Duan, Y.; Dwivedi, R.; Edwards, J.; Eirug, A.; et al. Artificial Intelligence (AI): Multidisciplinary Perspectives on Emerging Challenges, Opportunities, and Agenda for Research, Practice and Policy. Int. J. Inf. Manag. 2021, 57, 101994. [Google Scholar] [CrossRef]
  40. Weber, M.; Beutter, M.; Weking, J.; Böhm, M.; Krcmar, H. AI Startup Business Models Key Characteristics and Directions for Entrepreneurship Research. Bus. Inf. Syst. Eng. 2022, 64, 91–109. [Google Scholar] [CrossRef]
  41. Cimini, C.; Lagorio, A.; Cavalieri, S.; Riedel, O.; Pereira, C.E.; Wang, J. Human-Technology Integration in Smart Manufacturing and Logistics: Current Trends and Future Research Directions. Comput. Ind. Eng. 2022, 169, 108261. [Google Scholar] [CrossRef]
  42. Zhang, S.; Li, X.; Zhang, C.; Luo, J.; Cheng, C.; Ge, W. Measurement of Factor Mismatch in Industrial Enterprises with Labor Skills Heterogeneity. J. Bus. Res. 2023, 158, 113643. [Google Scholar] [CrossRef]
  43. Maddikunta, P.K.R.; Pham, Q.-V.; Prabadevi, B.; Deepa, N.; Dev, K.; Gadekallu, T.R.; Ruby, R.; Liyanage, M. Industry 5.0: A Survey on Enabling Technologies and Potential Applications. J. Ind. Inf. Integr. 2022, 26, 100257. [Google Scholar] [CrossRef]
  44. Wang, B.; Zheng, P.; Yin, Y.; Shih, A.; Wang, L. Toward Human-Centric Smart Manufacturing: A Human-Cyber-Physical Systems (HCPS) Perspective. J. Manuf. Syst. 2022, 63, 471–490. [Google Scholar] [CrossRef]
  45. Ding, C.; Li, C.; Xiong, Z.; Li, Z. Computer Big Data Technology in Additive Manufacturing and Product Design in Sustainable Manufacturing. Int. J. Adv. Manuf. Technol. 2024, 135, 4855–4863. [Google Scholar] [CrossRef]
  46. Jackson, I.; Ivanov, D.; Dolgui, A.; Namdar, J. Generative Artificial Intelligence in Supply Chain and Operations Management: A Capability-Based Framework for Analysis and Implementation. Int. J. Prod. Res. 2024, 62, 6120–6145. [Google Scholar] [CrossRef]
  47. Kamalaldin, A.; Linde, L.; Sjödin, D.; Parida, V. Transforming Provider-Customer Relationships in Digital Servitization: A Relational View on Digitalization. Ind. Mark. Manag. 2020, 89, 306–325. [Google Scholar] [CrossRef]
  48. Machado, C.G.; Winroth, M.P.; Ribeiro Da Silva, E.H.D. Sustainable Manufacturing in Industry 4.0: An Emerging Research Agenda. Int. J. Prod. Res. 2020, 58, 1462–1484. [Google Scholar] [CrossRef]
  49. Zayat, W.; Kilic, H.S.; Yalcin, A.S.; Zaim, S.; Delen, D. Application of MADM Methods in Industry 4.0: A Literature Review. Comput. Ind. Eng. 2023, 177, 109075. [Google Scholar] [CrossRef]
  50. Tao, F.; Qi, Q.; Liu, A.; Kusiak, A. Data-Driven Smart Manufacturing. J. Manuf. Syst. 2018, 48, 157–169. [Google Scholar] [CrossRef]
  51. Schiavone, F.; Paolone, F.; Mancini, D. Business Model Innovation for Urban Smartization. Technol. Forecast. Soc. Change 2019, 142, 210–219. [Google Scholar] [CrossRef]
  52. Raneri, S.; Lecron, F.; Hermans, J.; Fouss, F. Predictions through Lean Startup? Harnessing AI-Based Predictions under Uncertainty. Int. J. Entrep. Behav. Res. 2023, 29, 886–912. [Google Scholar] [CrossRef]
  53. Ghobakhloo, M. Industry 4.0, Digitization, and Opportunities for Sustainability. J. Clean. Prod. 2020, 252, 119869. [Google Scholar] [CrossRef]
  54. Ko, M.; Lee, C.; Cho, Y. Design and Implementation of Cloud-Based Collaborative Manufacturing Execution System in the Korean Fashion Industry. Appl. Sci. 2022, 12, 9381. [Google Scholar] [CrossRef]
  55. Tödtling, F.; Trippl, M. One Size Fits All?: Towards a Differentiated Regional Innovation Policy Approach. Res. Policy 2005, 34, 1203–1219. [Google Scholar] [CrossRef]
  56. Teece, D.J.; Pisano, G.; Shuen, A. Dynamic Capabilities and Strategic Management. Strateg. Manag. J. 1997, 18, 509–533. [Google Scholar] [CrossRef]
  57. Clark, J.; Huang, H.-I.; Walsh, J.P. A Typology of “Innovation Districts”: What It Means for Regional Resilience. Camb. J. Reg. Econ. Soc. 2010, 3, 121–137. [Google Scholar] [CrossRef]
  58. Adamides, E.; Karacapilidis, N. Information Technology for Supporting the Development and Maintenance of Open Innovation Capabilities. J. Innov. Knowl. 2020, 5, 29–38. [Google Scholar] [CrossRef]
  59. Latan, H.; Chiappetta Jabbour, C.J.; Lopes de Sousa Jabbour, A.B.; de Camargo Fiorini, P.; Foropon, C. Innovative Efforts of ISO 9001-Certified Manufacturing Firms: Evidence of Links between Determinants of Innovation, Continuous Innovation and Firm Performance. Int. J. Prod. Econ. 2020, 223, 107526. [Google Scholar] [CrossRef]
  60. Lundvall, B.-Å.; Johnson, B.; Andersen, E.S.; Dalum, B. National Systems of Production, Innovation and Competence Building. Res. Policy 2002, 31, 213–231. [Google Scholar] [CrossRef]
  61. Pan, X.; Li, J.; Shen, Z.; Song, M. Life Cycle Identification of China’s Regional Innovation Systems Based on Entropy Weight Disturbing Attribute Model. Habitat Int. 2023, 131, 102725. [Google Scholar] [CrossRef]
  62. Huggins, R.; Thompson, P. Entrepreneurship, Innovation and Regional Growth: A Network Theory. Small Bus. Econ. 2015, 45, 103–128. [Google Scholar] [CrossRef]
  63. Jiao, H.; Zhou, J.; Gao, T.; Liu, X. The More Interactions the Better? The Moderating Effect of the Interaction between Local Producers and Users of Knowledge on the Relationship between R&D Investment and Regional Innovation Systems. Technol. Forecast. Soc. Change 2016, 110, 13–20. [Google Scholar] [CrossRef]
  64. Schiuma, G.; Lerro, A. Knowledge-based Capital in Building Regional Innovation Capacity. J. Knowl. Manag. 2008, 12, 121–136. [Google Scholar] [CrossRef]
  65. Park, H.; Anderson, T.R.; Seo, W. Regional Innovation Capability from a Technology-Oriented Perspective: An Analysis at Industry Level. Comput. Ind. 2021, 129, 103441. [Google Scholar] [CrossRef]
  66. Yi, S.; Xiao-li, A. Application of Threshold Regression Analysis to Study the Impact of Regional Technological Innovation Level on Sustainable Development. Renew. Sustain. Energy Rev. 2018, 89, 27–32. [Google Scholar] [CrossRef]
  67. Zhou, Q.; Cheng, C.; Fang, Z.; Zhang, H.; Xu, Y. How Does the Development of the Digital Economy Affect Innovation Output? Exploring Mechanisms from the Perspective of Regional Innovation Systems. Struct. Change Econ. Dyn. 2024, 70, 1–17. [Google Scholar] [CrossRef]
  68. Miao, Z. Industry 4.0: Technology Spillover Impact on Digital Manufacturing Industry. J. Enterp. Inf. Manag. 2022, 35, 1251–1266. [Google Scholar] [CrossRef]
  69. Zhou, X.; Song, M.; Cui, L. Driving Force for China’s Economic Development under Industry 4.0 and Circular Economy: Technological Innovation or Structural Change? J. Clean. Prod. 2020, 271, 122680. [Google Scholar] [CrossRef]
  70. Chung, D.; Jung, H.; Lee, Y. Investigating the Relationship of High-Tech Entrepreneurship and Innovation Efficacy: The Moderating Role of Absorptive Capacity. Technovation 2022, 111, 102393. [Google Scholar] [CrossRef]
  71. Culot, G.; Nassimbeni, G.; Orzes, G.; Sartor, M. Behind the Definition of Industry 4.0: Analysis and Open Questions. Int. J. Prod. Econ. 2020, 226, 107617. [Google Scholar] [CrossRef]
  72. Lu, H.; Du, D.; Qin, X. Assessing the Dual Innovation Capability of National Innovation System: Empirical Evidence from 65 Countries. Systems 2022, 10, 23. [Google Scholar] [CrossRef]
  73. Wang, Y.; Sutherland, D.; Ning, L.; Pan, X. The Evolving Nature of China’s Regional Innovation Systems: Insights from an Exploration–Exploitation Approach. Technol. Forecast. Soc. Change 2015, 100, 140–152. [Google Scholar] [CrossRef]
  74. Nambisan, S.; Wright, M.; Feldman, M. The Digital Transformation of Innovation and Entrepreneurship: Progress, Challenges and Key Themes. Res. Policy 2019, 48, 103773. [Google Scholar] [CrossRef]
  75. Zhou, X.; Hu, Q.; Luo, H.; Hu, Z.; Wen, C. The Impact of Digital Infrastructure on Industrial Ecology: Evidence from Broadband China Strategy. J. Clean. Prod. 2024, 447, 141589. [Google Scholar] [CrossRef]
  76. Skantsev, V.M.; Lovkova, E.S.; Kashitsina, T.N. The Impact of Innovation Infrastructure on the Economic Development of Regions. In Smart Technologies and Innovations in Design for Control of Technological Processes and Objects: Economy and Production; Solovev, D.B., Ed.; Springer International Publishing: Cham, Switzerland, 2019; pp. 380–387. [Google Scholar] [CrossRef]
  77. Cheng, C.; Wang, L. How Companies Configure Digital Innovation Attributes for Business Model Innovation? A Configurational View. Technovation 2022, 112, 102398. [Google Scholar] [CrossRef]
  78. Geng, D.; Evans, S. A Literature Review of Energy Waste in the Manufacturing Industry. Comput. Ind. Eng. 2022, 173, 108713. [Google Scholar] [CrossRef]
  79. Lee, B.; Kim, B.; Ivan, U.V. Enhancing the Competitiveness of AI Technology-Based Startups in the Digital Era. Adm. Sci. 2024, 14, 6. [Google Scholar] [CrossRef]
  80. Singh, S.K.; Jeong, Y.-S.; Park, J.H. A Deep Learning-Based IoT-Oriented Infrastructure for Secure Smart City. Sustain. Cities Soc. 2020, 60, 102252. [Google Scholar] [CrossRef]
  81. Okonta, D.E.; Vukovic, V. Smart Cities Software Applications for Sustainability and Resilience. Heliyon 2024, 10, e32654. [Google Scholar] [CrossRef]
  82. Li, H.; Yang, Z.; Jin, C.; Wang, J. How an Industrial Internet Platform Empowers the Digital Transformation of SMEs: Theoretical Mechanism and Business Model. J. Knowl. Manag. 2022, 27, 105–120. [Google Scholar] [CrossRef]
  83. Huang, Q.; Xu, C.; Xue, X.; Zhu, H. Can Digital Innovation Improve Firm Performance: Evidence from Digital Patents of Chinese Listed Firms. Int. Rev. Financ. Anal. 2023, 89, 102810. [Google Scholar] [CrossRef]
  84. Lu, Y.; Ning, X. A Vision of 6G–5G’s Successor. J. Manag. Anal. 2020, 7, 301–320. [Google Scholar] [CrossRef]
  85. Zhao, S.L.; Cacciolatti, L.; Lee, S.H.; Song, W. Regional Collaborations and Indigenous Innovation Capabilities in China: A Multivariate Method for the Analysis of Regional Innovation Systems. Technol. Forecast. Soc. Change 2015, 94, 202–220. [Google Scholar] [CrossRef]
  86. Yang, C.; Liu, Q. Driving Green Innovation Through Digital Transformation: Empirical Insights on Regional Variations. Sustainability 2024, 16, 10716. [Google Scholar] [CrossRef]
  87. Zhou, X.; Cai, Z.; Tan, K.H.; Zhang, L.; Du, J.; Song, M. Technological Innovation and Structural Change for Economic Development in China as an Emerging Market. Technol. Forecast. Soc. Change 2021, 167, 120671. [Google Scholar] [CrossRef]
  88. Du, M.; Antunes, J.; Wanke, P.; Chen, Z. Ecological Efficiency Assessment under the Construction of Low-Carbon City: A Perspective of Green Technology Innovation. J. Environ. Plan. Manag. 2022, 65, 1727–1752. [Google Scholar] [CrossRef]
  89. Hu, J.; Chen, H.; Fan, J.; He, Z. The Impact of Digital Infrastructure on Provincial Green Innovation Efficiency—Empirical Evidence from China. Environ. Sci. Pollut. Res. 2024, 31, 9795–9810. [Google Scholar] [CrossRef]
  90. Shen, L.; Sun, C.; Ali, M. Role of Servitization, Digitalization, and Innovation Performance in Manufacturing Enterprises. Sustainability 2021, 13, 9878. [Google Scholar] [CrossRef]
  91. Mijiyawa, A.G. Drivers of Structural Transformation: The Case of the Manufacturing Sector in Africa. World Dev. 2017, 99, 141–159. [Google Scholar] [CrossRef]
  92. Lin, S.; Cai, S.; Sun, J.; Wang, S.; Zhao, D. Influencing Mechanism and Achievement of Manufacturing Transformation and Upgrading Empirical Analysis Based on PLS-SEM Model. J. Manuf. Technol. Manag. 2019, 30, 213–232. [Google Scholar] [CrossRef]
  93. Luukkanen, J.; Kaivo-oja, J.; Vähäkari, N.; O’Mahony, T.; Korkeakoski, M.; Panula-Ontto, J.; Phonhalath, K.; Nanthavong, K.; Reincke, K.; Vehmas, J.; et al. Green Economic Development in Lao PDR: A Sustainability Window Analysis of Green Growth Productivity and the Efficiency Gap. J. Clean. Prod. 2019, 211, 818–829. [Google Scholar] [CrossRef]
  94. Taques, F.H.; López, M.G.; Basso, L.F.; Areal, N. Indicators Used to Measure Service Innovation and Manufacturing Innovation. J. Innov. Knowl. 2021, 6, 11–26. [Google Scholar] [CrossRef]
  95. Etzkowitz, H.; Leydesdorff, L. The Dynamics of Innovation: From National Systems and “Mode 2” to a Triple Helix of University–Industry–Government Relations. Res. Policy 2000, 29, 109–123. [Google Scholar] [CrossRef]
  96. Che, S.; Wen, L.; Wang, J. Global Insights on the Impact of Digital Infrastructure on Carbon Emissions: A Multidimensional Analysis. J. Environ. Manag. 2024, 368, 122144. [Google Scholar] [CrossRef]
  97. Wang, W.; Yu, P.; Zhou, Y.; Tong, T.; Liu, Z. Equivalence of Two Least-Squares Estimators for Indirect Effects. Curr. Psychol. 2023, 42, 7364–7375. [Google Scholar] [CrossRef]
  98. Coutts, J.J.; Hayes, A.F. Questions of Value, Questions of Magnitude: An Exploration and Application of Methods for Comparing Indirect Effects in Multiple Mediator Models. Behav. Res. 2023, 55, 3772–3785. [Google Scholar] [CrossRef]
  99. Hausman, J.A. Specification Tests in Econometrics. J. Econom. Soc. 1978, 46, 1251–1271. [Google Scholar] [CrossRef]
  100. Montgomer, D.C.; Peck, E.A.; Vining, G.G. Introduction to Linear Regression Analysis; John Wiley & Sons: Hoboken, NJ, USA, 2021. [Google Scholar]
  101. Wooldridge, J.M. Introductory Econometrics: A Modern Approach, 6th ed., student edition; Cengage Learning: Boston, MA, USA, 2016. [Google Scholar]
  102. Bao, J.; Li, Y. Has High-Tech Cluster Improved Regional Innovation Capacity? Evidence from Wuhan Metropolitan Area in China. Front. Environ. Sci. 2023, 11, 1180781. [Google Scholar] [CrossRef]
  103. Ma, D.; Zhu, Q. Innovation in Emerging Economies: Research on the Digital Economy Driving High-Quality Green Development. J. Bus. Res. 2022, 145, 801–813. [Google Scholar] [CrossRef]
  104. Cui, Y.; Tian, H.; An, D.; Jia, Y. Quality of Life and Regional Economic Development: Evidence from China. PLoS ONE 2024, 19, e0298389. [Google Scholar] [CrossRef]
  105. Bian, J.; Qin, Q.; Chen, X.; Wu, X. Stock Markets, Local Governments Leverage, and Regional Economic Development: Evidence from China. Pac.-Basin Financ. J. 2024, 85, 102326. [Google Scholar] [CrossRef]
  106. Guo, X.; Xu, D.; Zhu, K. Measuring Digitalization Effects in China: A Global Value Chain Perspective. China Econ. Rev. 2023, 81, 102021. [Google Scholar] [CrossRef]
  107. Tang, M.; Liu, Y.; Hu, F.; Wu, B. Effect of Digital Transformation on Enterprises’ Green Innovation: Empirical Evidence from Listed Companies in China. Energy Econ. 2023, 128, 107135. [Google Scholar] [CrossRef]
  108. Zhou, Y.; Zang, J.; Miao, Z.; Minshall, T. Upgrading Pathways of Intelligent Manufacturing in China: Transitioning across Technological Paradigms. Engineering 2019, 5, 691–701. [Google Scholar] [CrossRef]
  109. Wei, Z.; Sun, L. How to Leverage Manufacturing Digitalization for Green Process Innovation: An Information Processing Perspective. Ind. Manag. Data Syst. 2021, 121, 1026–1044. [Google Scholar] [CrossRef]
  110. Aboelmaged, M.G. Predicting E-Readiness at Firm-Level: An Analysis of Technological, Organizational and Environmental (TOE) Effects on e-Maintenance Readiness in Manufacturing Firms. Int. J. Inf. Manag. 2014, 34, 639–651. [Google Scholar] [CrossRef]
  111. Wu, S.R.; Shirkey, G.; Celik, I.; Shao, C.; Chen, J. A Review on the Adoption of AI, BC, and IoT in Sustainability Research. Sustainability 2022, 14, 7851. [Google Scholar] [CrossRef]
Figure 1. Smart transformation levels.
Systems 13 00389 g001
Figure 2. Research model.
Systems 13 00389 g002
Table 1. Variable list.
DimensionsMeasurement Methods
Independent Variable: Smart Transformation (ST)
Smart base inputHigh-tech manufacturing
R&D funding
Telecommunications
Fixed asset investment
Fiber-optic cable line length/provincial area
Number of personnel in information transmission and information technology services
Smart applicationsSoftware business revenue
Data processing and operational services revenue
Effective invention patents for high technology manufacturing industry
Smart market benefitsTotal profit of high technology manufacturing industry
High-tech manufacturing industry main business income/number of employees
Mediating Variable: Regional Innovation Capacity (RIC)
Knowledge innovation capability (KIC)The total number of ordinary universities and colleges
The total number of full-time teachers
Number of scientific research papers
Technological innovation capability (TIC)Science and technology expenditure
Regional scientific and technological cooperation
Technology transfer
Number of total patent grants
Innovative infrastructure (II)Number of technology-driven industrial clusters
Number of internet broadband users
Urban road area
Dependent Variable: Regional Economic Development (RED)
Economic development effectivenessTotal fixed assets investment/regional GDP
Labor force employment/regional GDP
Economic sustainabilityConsumer price index (CPI)
Industrial producer price index (IPPI)
Economic opennessNet FDI inflows
Total amount of merchandise trade
Green developmentGreening coverage in built-up areas
Total wastewater, sulfur dioxide, general industrial solid waste/regional GDP
Total energy consumption/regional GDP
Control Variables
Economic policy uncertainty (EPU)Economic policy uncertainty index/industrial output value
Government subsidies (GSs)Total spending/government spending to manufacturing industry
Manufacturing scale (MS)The total assets of manufacturing enterprises
Social organizations (SOs)Number of NGOs per capita in each province/region
Table 2. Benchmark regression results.
VariablesRED
(1)(2)(3)(4)
ST0.710 ***0.435 ***0.478 ***0.632 ***
(24.956)(4.799)(4.810)(20.861)
EPU 0.211 ***0.235 ***0.392 ***
(3.800)(3.760)(6.893)
GS 0.019 *−0.114 *−0.042
(1.942)(1.823)(−0.242)
MS 0.012−0.016−0.043 *
(0.531)(−0.381)(−1.916)
SO 0.012−0.006−0.004
(0.646)(−0.334)(−1.098)
Constant0.103 ***0.028 ***0.031 ***0.034 **
(31.650)(7.576)(3.661)(2.545)
N419419419419
R-squared0.7160.6050.6850.765
Province FEYESYESNOYES
Year FEYESNOYESYES
Notes: *** p < 0.01, ** p < 0.05, and * p < 0.10. FE: fixed effects. The numbers in parentheses are robust t-statistics.
Table 3. Instrumental variable regression results.
Variables(1)(2)(3)(4)
First-StageSecond-StageFirst-StageSecond-Stage
STREDSTRED
L.ST(IV1)0.650 ***
(19.842)
ST 0.573 ***
(16.858)
IV2 0.219 ***
(2.900)
ST 0.401 **
(2.220)
Constant0.120 ***0.035 **0.346 ***0.093 ***
(34.586)(2.350)(16.931)(4.532)
N387387419419
R-squared0.5240.5960.9470.524
Province FEYESYESYESYES
Year FEYESYESYESYES
Kleibergen–Paaprk LM statistic13.561 ***9.276 ***
Cragg–Donald Wald F-statistic103.97116.380
Kleibergen–Paaprk Wald F statistic393.68819.750
Notes: *** p < 0.01 and ** p < 0.05. FE: fixed effects. The numbers in parentheses are robust t-statistics.
Table 4. Results of heterogeneity tests based on regions.
RED
(1)(2)
Northeast
(3)
North
(4)
East
(5)
Central
(6)
South
(7)
Southwest
(8)
Northwest
ST0.632 ***1.084 ***0.501 ***0.694 ***0.355 ***0.513 ***0.776 ***0.863 ***
(20.861)(3.917)(3.331)(14.699)(2.739)(5.629)(13.387)(13.104)
ERU0.392 ***−0.0400.620 ***1.317 ***1.221 ***0.983 ***0.261 ***0.021
(6.893)(−0.193)(3.180)(8.859)(7.719)(2.966)(4.284)(0.779)
GS−0.042−3.471 ***−0.3280.367 **−1.056 ***−7.291 ***−0.9390.849 **
(−0.242)(−3.873)(−0.429)(2.198)(−2.916)(−3.345)(−0.874)(2.007)
MS−0.043 *−0.1010.0010.188 ***0.088 *−0.0110.0230.028 *
(−1.916)(−1.592)(0.006)(3.773)(1.926)(−0.091)(0.574)(1.975)
SO−0.004−0.039 **−0.0020.0120.009−0.060 **0.004−0.007 ***
(−1.098)(−2.655)(−0.106)(0.888)(0.587)(−2.068)(0.547)(−5.244)
Constant0.034 **0.185 ***0.011−0.072 **−0.070 ***0.116 *−0.020−0.001
(2.545)(4.417)(0.250)(−2.421)(−3.336)(1.697)(−0.776)(−0.111)
N419447410445414565
R-squared0.6650.6470.5860.8820.9130.7890.8990.905
Province FEYESYESYESYESYESYESYESYES
Year FEYESYESYESYESYESYESYESYES
Notes: *** p < 0.01, ** p < 0.05, and * p < 0.10. FE: fixed effects. The numbers in parentheses are robust t-statistics.
Table 5. Results of heterogeneity tests based on manufacturing sector.
RED
(1)Textile-Manufacturing
Industry
Machinery and Equipment
Manufacturing Industry
Resource-Processing Industry
ST0.632 ***0.975 ***0.643 ***0.499 ***
(20.861)(9.067)(10.624)(11.939)
ERU0.392 ***−0.0150.874 ***0.893 ***
(6.893)(−0.259)(5.966)(8.119)
GS−0.042−2.258 ***0.443 *−0.453
(−0.242)(−5.232)(1.743)(−1.580)
MS−0.043 *−0.044 *0.059−0.032
(−1.916)(−1.874)(1.150)(−0.629)
SO−0.004−0.007 **−0.008−0.002
(−1.098)(−2.296)(−0.413)(−0.265)
Constant0.034 **0.096 ***−0.0340.003
(2.545)(5.720)(−1.150)(0.161)
Observations419139119161
R−squared0.6650.5890.7320.785
Province FEYESYESYESYES
Year FEYESYESYESYES
Notes: *** p < 0.01, ** p < 0.05, and * p < 0.10. FE: fixed effects. The numbers in parentheses are robust t-statistics.
Table 6. Results of robustness test.
Variables(1)(2)
REDRED1
ST10.264 ***
(9.513)
ST 0.109 ***
(7.408)
ERU0.245 ***0.357 ***
(7.704)(12.963)
GS0.1150.077
(1.435)(0.920)
MS0.020 *−0.002
(1.917)(−0.149)
SO−0.004 **−0.005 ***
(−2.368)(−2.889)
Constant0.295 ***0.155 ***
(17.324)(24.257)
N419419
R-squared0.5470.510
Province FEYESYES
Year FEYESYES
Notes: *** p < 0.01, ** p < 0.05, and * p < 0.10. FE: fixed effects. The numbers in parentheses are robust t-statistics.
Table 7. Results of mediation-effect model.
MediatorEffectObserved
Coef.
95% CIProportion of Relative EffectMediation ResultsResult
KICDirect effect0.539 [0.885, 1.183]85.45%Partial mediationH2 supported
Indirect effect0.092 [0.067, 0.144]14.55%
TICDirect effect0.350 [−0.411, 0.856]55.53%Complete mediationH3 supported
Indirect effect0.281 [0.254, 0.760]44.47%
IIDirect effect0.034[0.001, 0.122]5.36%Partial mediationH4 supported
Indirect effect0.597 [0.932, 1.244]94.64%
Notes: CI:95% confidence interval.
Disclaimer/Publisher’s Note: The statements, opinions and data contained in all publications are solely those of the individual author(s) and contributor(s) and not of MDPI and/or the editor(s). MDPI and/or the editor(s) disclaim responsibility for any injury to people or property resulting from any ideas, methods, instructions or products referred to in the content.

