Article

Green Supply Chain Integration and Sustainable Performance in Pharmaceutical Industry of China: A Moderated Mediation Model

by
Huahui Li
1 and
Ramayah Thurasamy
1,2,3,4,5,6,7,8,9,*
1
School of Management, Universiti Sains Malaysia, Minden 11800, Penang, Malaysia
2
Department of Management, Sunway Business School (SBS), Petaling Jaya 47500, Selangor, Malaysia
3
Department of Information Technology & Management, Daffodil International University, Birulia 1216, Bangladesh
4
University Center for Research & Development (UCRD), Chandigarh University, Ludhiana 140413, Punjab, India
5
Faculty of Economics and Business, Universitas Indonesia (UI), West Java 16424, Indonesia
6
Faculty of Business, Sohar University, Sohar P.C 311, Oman
7
School of Business, The University of Jordan (UJ), Amman 11942, Jordan
8
Strategic Research Institute, Asia Pacific University of Technology & Innovation (APU), Kuala Lumpur 57000, Malaysia
9
College of Administrative and Financial Sciences, University of Technology Bahrain, Salmabad 1213-712, Bahrain
*
Author to whom correspondence should be addressed.
Systems 2025, 13(5), 388; https://doi.org/10.3390/systems13050388
Submission received: 24 March 2025 / Revised: 12 May 2025 / Accepted: 13 May 2025 / Published: 17 May 2025
(This article belongs to the Section Supply Chain Management)

Abstract

:
Green supply chain integration (GSCI) has emerged as a significant technique for improving sustainable performance by promoting collaboration with supply chain partners and breaking down organizational barriers to utilize complementary resources. This study investigates the relationships among GSCI, supply chain agility (SCA), digital orientation (DO), and sustainable performance, grounded in the Natural Resource-Based View (NRBV) and Contingency Theory (CT), based on survey data from 288 Chinese pharmaceutical manufacturing enterprises. Using mediation, moderation, and moderated mediation analyses, the findings indicate that SCA serves as a mediator between GSCI and sustainable performance. Significantly, DO strengthens both the direct effect of SCA on sustainable performance and the overall mediating pathway; nevertheless, it does not substantially boost the association between GSCI and SCA. This study’s innovation lies in elucidating the significance of GSCI as a resource for sustainable performance within the pharmaceutical enterprises, while further delineating the pathways and contingent elements for achieving sustainable performance in a digital context. This study offers valuable implications for both academic research and managerial practice.

1. Introduction

The pharmaceutical industry is widely recognized as a “rapidly expanding” sunrise sector with clear prospects for future development. Demographic aging, rapid urbanization, rising health awareness, and the expansion of disease profiles collectively drive a continuous rise in pharmaceutical demand [1]. The expansion of China’s pharmaceutical industry is intricately linked to the national economic growth, making it as a vital component of the healthcare system. It is a distinctive sector that blends traditional and modern practices and integrates both secondary and tertiary industries. This dual-role is vital for promoting public welfare and maintaining social stability [2]. The pharmaceutical sector is essential to public health and has a distinct competitive advantage owing to its significant technological barriers. Its indispensable contribution in protecting and enhancing public health, elevating quality of life, stimulating economic growth, and promoting social advancement is substantial [3].
Since the reform era, China’s pharmaceutical industry has expanded swiftly, markedly enhancing economic output and emerging as a new growth catalyst. However, recent data suggest emerging headwinds. The Economic Operation Report of the pharmaceutical industry for the first half of 2024 indicates a decline in overall revenues and profits, with approximately one-third of firms reporting growth and about two-thirds experiencing declines. In addition to economic pressures, the pharmaceutical manufacturing sector faces growing environmental and social challenges, including significant pollution and waste that can harm the environment and public health if not properly managed, as well as ongoing concerns over product safety due to the risks posed by counterfeit and substandard medications [4]. As a result, the pharmaceutical manufacturing bears heightened responsibilities—not only to ensure the continuous supply of essential medicines but also to optimize resource use, enhance customer satisfaction, and mitigate the environmental impact of pharmaceutical waste [5].
In general, While the long-term outlook for sustainable development in China’s pharmaceutical industry remains promising, its risk-averse nature has resulted in slower advancement compared to other industries [6,7]. This lag highlights the urgent need to explore the key drivers of sustainable performance to support the industry’s ecological transformation and long-term growth. Although the pharmaceutical industry faces significant sustainability challenges [8], its sustainable performance remain largely underexplored in current research [9,10,11,12].
The pharmaceutical supply chain in China is fragmented, characterized by systemic obstacles in strategy formulation, planning coordination, and demand response among decision-makers, which constrains overall operational efficiency [13]. The China’s pharmaceutical industry confronts three critical challenges [14]: (1) overly simplistic business models, (2) lagging online regulatory systems, and (3) insufficient supply chain management capabilities. These deficiencies frequently lead to production disruptions and drug shortages, resulting in economic losses amounting to tens of billions of dollars annually and may threatening the stability of the pharmaceutical industry itself [15]. Addressing these inefficiencies requires urgent and comprehensive supply chain integration, targeting improvements in strategic coordination, environmental compliance, demand forecasting, and logistics agility. Strengthening these functions will enable pharmaceutical enterprises to build a high-standard, agile, and environmentally sustainable supply platforms [14].
As the competitive perspective shifts from firm-level to a supply chain-level [9], enterprises must fully coordinate with their supply chain partners and leverage complementary resources to achieve sustainable development [8]. This trend is particularly evident in the pharmaceutical industry, where the supply chain is highly complex due to product perishability, stringent regulatory requirements, and the critical importance of accurate demand forecasting [8,16]. To efficiently control costs while guaranteeing environmental, economic, and social sustainability, pharmaceutical supply chains are becoming increasingly intricate [17]. The intricate nature of pharmaceutical supply chains demands more than just internal optimization; it calls for robust collaboration between upstream suppliers and downstream retailers to improve risk resistance and resilience in the face of growing uncertainty [16,18]. NRBV addresses this challenge by emphasizing the importance of accessing and integrating external resources that lie beyond a firm’s direct control [19]. According to NRBV, the diverse resources and unique capabilities that enterprises develop in response to environmental challenges play a critical role in enhancing sustainability. By promoting the synchronization of eco-friendly practices across all supply chain partners, NRBV emphasizes the importance of collective efforts in driving long-term organizational sustainability [20,21]. Consequently, overcoming organizational boundaries and proactively pursuing collaboration with supply chain partners to acquire complementary resources has emerged as the principal method for enhancing sustainable performance.
This recognition has drawn increasing attention to collaborative mechanisms in the supply chain, among which GSCI has emerged as a critical strategic response [22]. GSCI refers to a firm’s ability to coordinate and integrate green practices across internal functions, suppliers, and customers, ensuring the alignment of sustainability goals and promoting efficient resource utilization [23]. It fosters information sharing, joint problem-solving, and synchronized environmental strategies among supply chain partners, thereby contributing to reduced environmental impacts and improved operational effectiveness. GSCI encompasses a wide array of green practices, including green procurement, green manufacturing, green marketing, and reverse logistics. By improving real-time information sharing and enhancing responsiveness to environmental changes [24].
Importantly, GSCI entails working with environmentally responsible suppliers and exchanging sustainability-related information to identify environmental hotspots [25]. In this context, the implementation of GSCI in the pharmaceutical manufacturing enterprises is both essential and urgent [8,26]. Nonetheless, research on GSCI within the pharmaceutical industry remain limited, with current studies predominantly addressing the potential risks of green supply chain management and the identification of environmentally sustainable suppliers [27]. Consequently, it is essential to investigate the extent and mechanisms through which the GSCI influences the sustainable performance of the pharmaceutical industry.
Throughout the years, scholars have widely advocated for the use of GSCI to enhance performance [27,28,29,30,31,32]. GSCI allows enterprises to acquire substantial resources [29], however, a pile of resources is insufficient for achieving sustainable development in turbulent environments [33,34]. To remain competitive requires firms to possess dynamic capability that flexibly reconfigure and redeploy both internal and external resources [35]. In resource-based theory, capabilities are described as “the capacity to deploy resources” and play a central role in transforming resources into strategic advantage [36,37,38]. Dynamic capabilities represent a critical component of the NRBV. They enable firms to support environmental strategies by guiding the evolution and transformation of existing resources in response to environmental pressures [39,40,41]. These capabilities emphasize organizational agility—the ability to identify and shape emerging opportunities and threats, reconfigure strategic assets, and build competitive resilience [42].
Among various dynamic capabilities, SCA plays a pivotal role. SCA enhances a firm’s ability to respond quickly and efficiently to market volatility by dynamically coordinating resources and adapting to shifting demand and supply conditions [43,44]. It is considered a “seizing” capability that enables firms to rapidly align their operational competencies with dynamic market conditions and environmental objectives [42,45]. The competitive advantage that integrates dynamic capabilities is more sustainable than that achieved solely through resource possession [46,47].
Thus, when GSCI is successfully transformed into SCA, firms can leverage their foundational supply chain resources to attain superior sustainable performance outcomes. Despite ample evidence indicating a correlation among GSCI, SCA, and sustainable performance [8,31,48,49,50], the specific mechanisms through SCA mediates the relationship between GSCI and sustainable performance remain insufficiently explored.
Incorporating both mediating and moderating variables inside the same model can yield a more thorough and robust explanation of the interactions present in the model [51,52,53]. Moderated mediation analysis elucidates how independent variables’ direct and indirect effects on dependent variables (mediation) depend on the moderating variables [54]. CT suggests that organizational outcomes depend on external contingencies that influence how resources and capabilities translate into performance [55]. Although extensive research has indicated a positive relationship between GSCI and SCA, the strength of this relationship varies significantly across different contexts [31,35,56,57,58]. Similarly, the relationship between SCA and sustainable performance is not consistently significant [59,60,61]. Thus, from both theoretical and empirical perspectives, the relationships between GSCI and SCA, as well as between SCA and sustainable performance, appear to be unstable and are shaped by contextual moderating factors.
DO, as a strategic posture, reflects an organization’s recognition of the value of digital technologies and its overarching commitment to digital transformation. It governs which digital activities are pursued, how these activities are integrated, and how digital resources are allocated across the organization [62]. Over time, DO shapes how firms deploy resources, thereby contributing to the development of digital capabilities [63]. Digital technologies enhances information processing by enabling real-time connectivity and seamless data exchange within organizations and across supply chain partners [12]. This improves information processing capacity and promotes coordination and responsiveness. Moreover, DO helps overcome information silos by enabling firms to accumulate and integrate green knowledge and technology resources. It facilitates the real-time coordination of operations, allowing firms to make timely decisions and reconfigure resources efficiently—key components of SCA [64]. Firms with strong DO streamline operations and boost process efficiency through digital technologies, enabling faster and more adaptive responses to market changes, boosting agility [49,65]. Leveraging diverse data sources further improves resource efficiency and accelerates the achievement of sustainable growth [66]. Despite the critical role of DO, limited research has explored its moderating effect on the pathway from GSCI to sustainable performance.
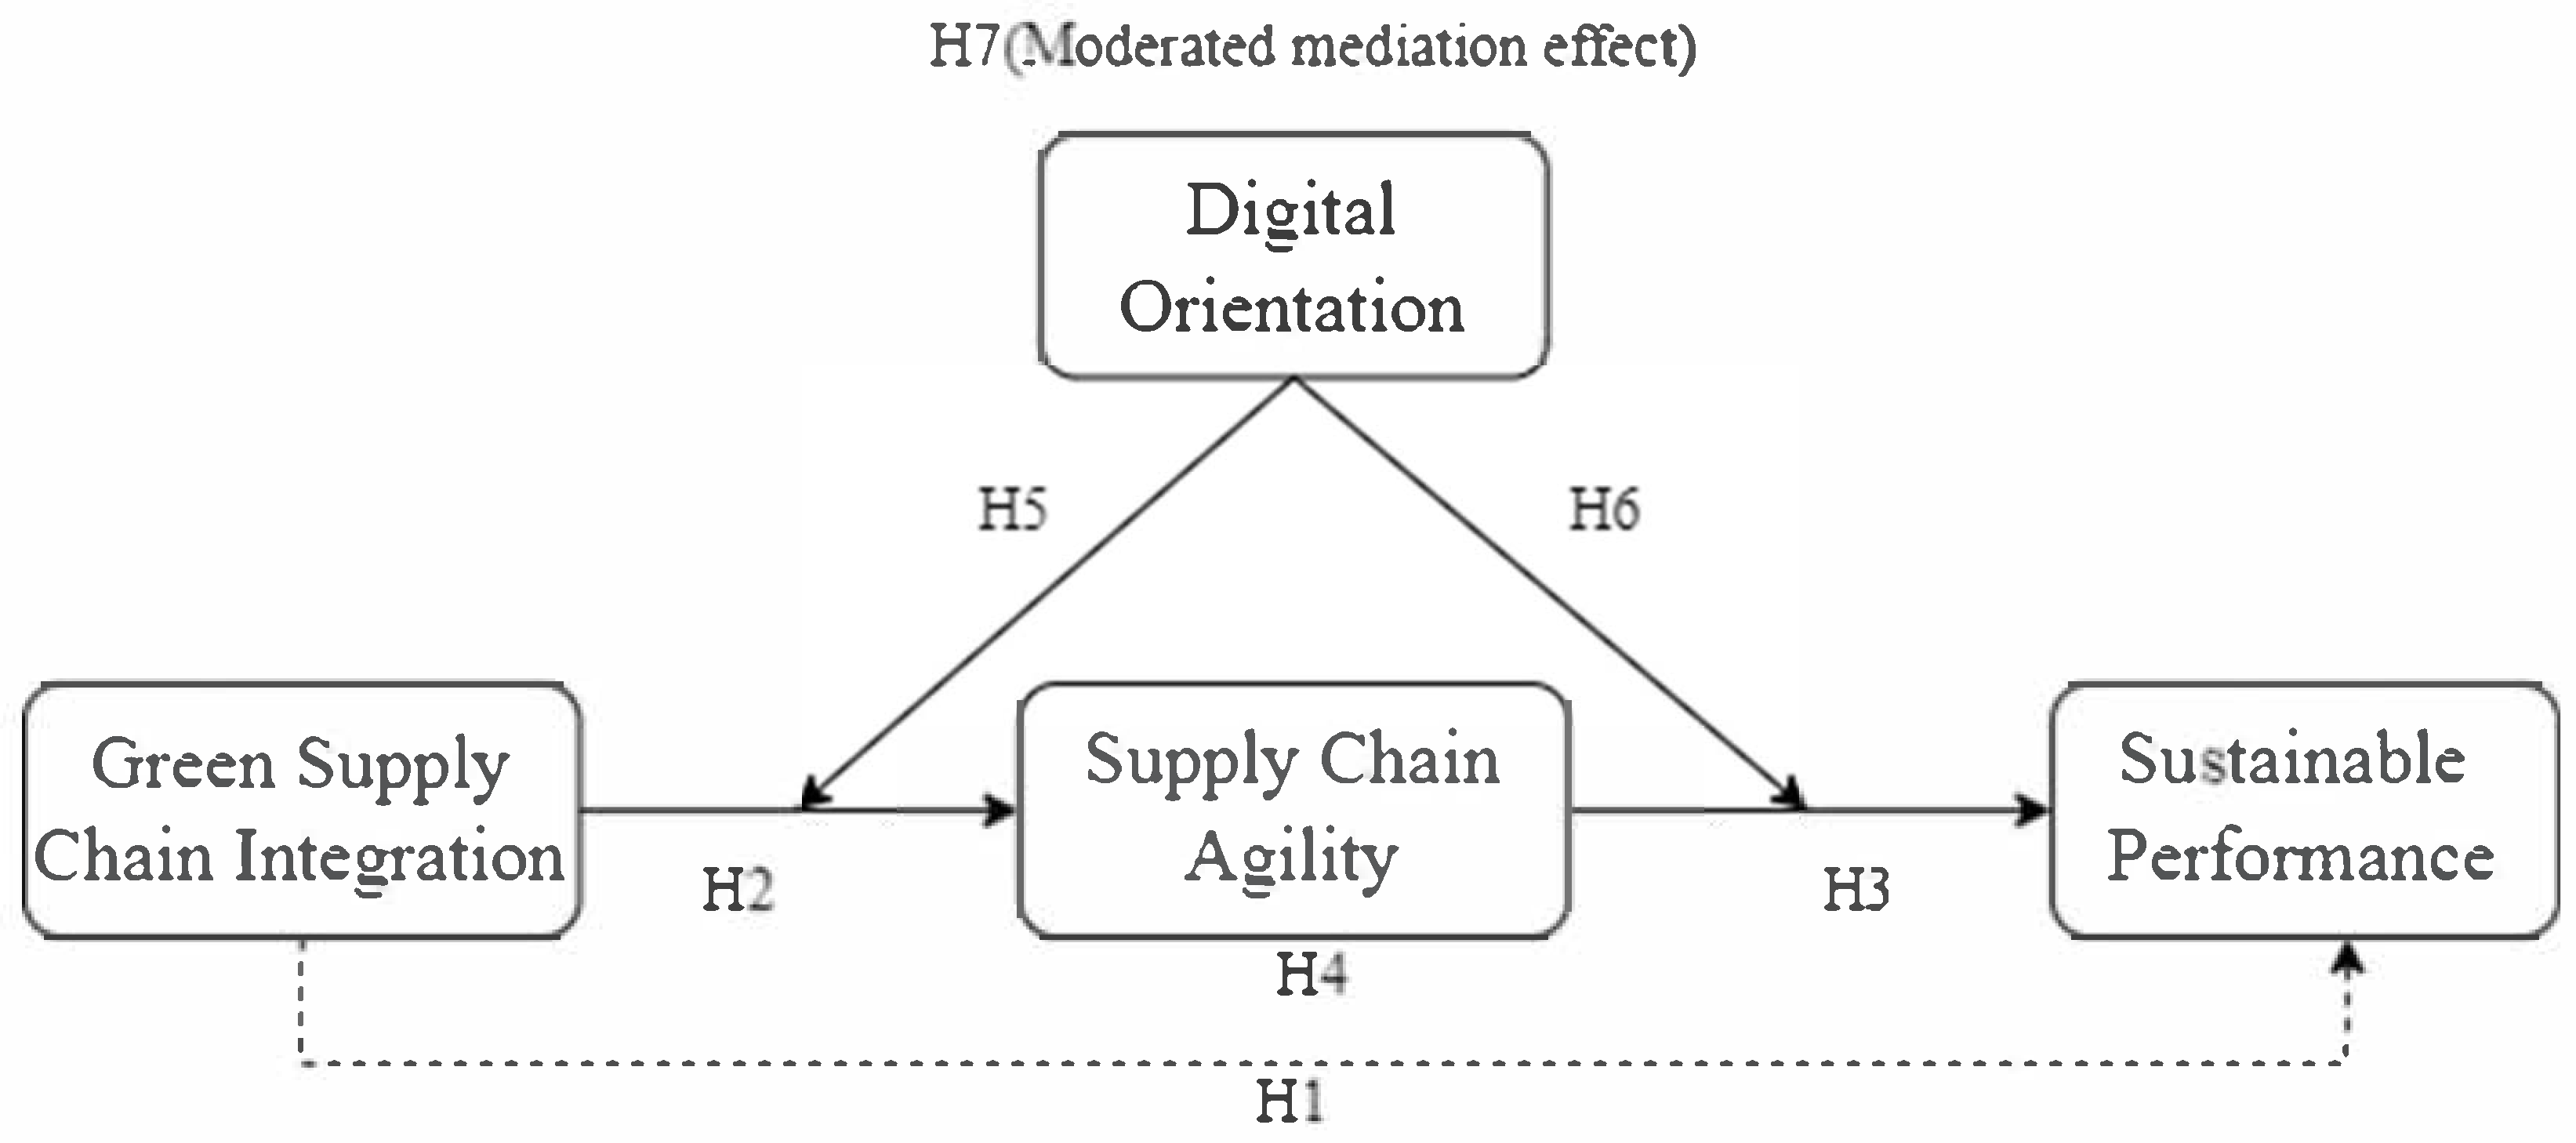
This study, based on NRBV and CT, investigates the mechanisms through which GSCI affects sustainable performance, and how DO shapes this relationship to fill the existing research gap. Specifically, the study has three objectives: (1) Evaluate whether SCA mediates the relationship between GSCI and sustainable performance; (2) Examine whether DO moderates the relationship between GSCI and SCA, as well as between SCA and sustainable performance; and (3) Assess whether DO moderates the mediating effect of SCA. This study elucidates the influence of GSCI on sustainable performance and its implementation trajectory, while also highlighting DO as a contingent factor in the digitalization context.

2. Hypothesis Development

2.1. Green Supply Chain Integration and Sustainable Performance

GSCI refers to the strategic coordination of environmental practices and resources across internal functions and external partners, such as suppliers and customers, to achieve sustainability objectives [31,66]. Grounded in the NRBV, firms that effectively integrate green resources are better positioned to access and leverage environmentally valuable assets, reduce ecological impact, and enhance operational efficiency [19]. Prior research has demonstrated that GSCI facilitates improved resource utilization, fosters innovation, and enhances stakeholder satisfaction, all of which contribute to achieving long-term sustainable performance [67,68]. Therefore, this study proposes the following hypothesis:
H1: 
Green supply chain integrationhas a positive effect on sustainable performance.

2.2. Green Supply Chain Integration and Supply Chain Agility

GSCI assists enterprises in acquiring and integrating supply chain resources by establishing a robust cooperative network, enabling rapid responses to market fluctuations [31] GSCI can improve interdepartmental communication and collaboration, dismantle departmental walls, minimize delays in information transmission and reduce comprehension biases, hence enabling organizations to respond to market disruptions more effectively and dynamically [69]. Simultaneously, GSCI enhances the exchange of explicit and implicit knowledge among supply chain partners, which is essential for augmenting agility [70]. GSCI fosters a climate of mutual trust among firms, allowing them to share risks and rewards with supply chain partners, thus creating a stable cooperative network [71]. This relational network mitigates the risk of resource depletion and opportunistic behavior, while simultaneously fostering interaction and knowledge exchange among supply chain participants, and promptly acquiring and disseminating market information. Thus, it enhances organizations’ capacity to swiftly adapt to dynamic environmental changes [72], thereby strengthening SCA. We propose the subsequent hypothesis:
H2: 
Green supply chain integration has a positive effect on supply chain agility.

2.3. Supply Chain Agility and Sustainable Performance

As a high-level dynamic capability, SCA enables enterprises to swiftly identify potential market opportunities and threats through resource synergy, therefore facilitating the dynamic alignment of resources [31]. SCA allows enterprises to be sufficiently responsive to both internal organizational changes and external market shifts. It also enhances the company’s environmental awareness and risk resilience, enabling it to swiftly manage crises and mitigate the negative impacts of supply chain disruptions [73]. SCA assists enterprises in recognizing market opportunities, reducing response time, expediting resource optimization, fostering product and process innovation, and accelerating new product development [45]. These improvements contribute to enhanced market and financial performance, thereby attracting additional external resource support. Moreover, SCA markedly enhances the organization’s cost efficiency, customer service, and social performance while fostering asset utilization and customer loyalty [45,59]. SCA can enhance a company’s revenues, market share, and consumer happiness [74], therefore augmenting the company’s sustainable performance. The subsequent hypothesis is put forth:
H3: 
Supply chain agility has a positive effect on sustainable performance.

2.4. Mediating Roles of Supply Chain Agility

GSCI facilitates enterprises in the efficient acquisition and utilization of resources through the encouragement of resource sharing and collaboration with internal and external stakeholders [31,75], whereas SCA empowers enterprises to swiftly adapt and align resources in response to market fluctuations [76]. GSCI optimizes information flow among departments to mitigate the negative impacts of information asymmetry [24], while SCA further increases enterprises’ responsiveness to external market changes, allowing for the timely acquisition and application of information to enhance decision-making. With GSCI’s support, SCA can assist firms in more effectively identifying and addressing possible market risks and opportunities [44]. GSCI fosters strong collaboration with suppliers and consumers, hence augmenting trust and partnership [32]. SCA enhances this partnership and assists firms in fulfilling market needs and environmental requirements more effectively. Furthermore, GSCI fosters information dissemination and knowledge sharing, establishing the foundation for organizational innovation [22]. SCA allows enterprises to swiftly identify and leverage innovations, facilitating rapid responses to shifts in environmental policies and market needs [42], thereby enhancing sustainable performance. Therefore, this study posits that:
H4: 
Supply chain agility positively mediates the relationship between green supply chain integration and sustainable performance.

2.5. Moderating Role of Digital Orientation

Organizations with a high DO are typically more inclined to facilitate decision-making using data analysis and technological instruments [77]. Through the collection, analysis, and dissemination of real-time supply chain data via digital technology, enterprises may swiftly and effectively comprehend market fluctuations, supply circumstances, and other dynamic information, thus facilitating more responsive actions. Digital technology enhances supply chain processes and automates redundant tasks [78]. This mitigates the risk of human mistake and decreases response time, allowing organizations to adapt and optimize supply chain resource allocation with greater flexibility. Enterprises with high DO leverage digital technology to enhance information exchange among supply chain participants, mitigate information asymmetry, and improve the velocity and precision of information dissemination [79]. This renders firms and their supply chain partners more responsive to fluctuations in market demand, hence facilitating prompt adjustments to supply chain strategy. DO also promotes firms to actively implement and innovate with new technology [77]. This technology-driven adaptability allows organizations to adjust to environmental changes more rapidly and further improve SCA. Consequently, we propose the following hypothesis:
H5: 
The positive relationship between green supply chain integration and supply chain agility will be stronger when digital orientation is higher.
Enterprises with high DO typically possess significant data collecting and analytical capabilities, enabling them to monitor market fluctuations, supply chain dynamics, and consumer requirements in real time [12]. This enables firms to swiftly modify their strategy and enhance the supply chain’s responsiveness. Enterprises with a strong DO can manage and allocate resources more precisely using data analysis and optimization algorithms [79]. Enhanced resource management also fortifies SCA and prevents overproduction and resource wastage. Moreover, digitally focused firms typically implement sophisticated digital technologies like cloud computing and the Internet of Things [63], facilitating uninterrupted communication and collaboration throughout upstream and downstream supply chains. Effective collaboration enhances SCA and adaptability in addressing market demand. DO facilitates firms in leveraging digital technology to swiftly acquire market insights, assess industry trends, and foster innovation [63]. Facilitated by digitalization, SCA may rapidly modify strategies and procedures to fulfill the demands of sustainable development. Improved innovation skills further enhance the beneficial impact of agility on sustainable performance. High DO facilitates firms in promptly addressing customer needs, including the provision of eco-friendly products, reduction of delivery times, and implementation of sustainable packaging [80], so contributing to the attainment of sustainable development goals. Consequently, the correlation between SCA and sustainable performance is more pronounced when DO is elevated. We propose the subsequent hypothesis:
H6: 
The positive relationship between supply chain agility and sustainable performance will be stronger when digital orientation is higher.
Enterprises with a high DO typically excel in leveraging digital tools to enhance GSCI. Resource integration via digital technology enhances the flow of information both internally and externally, diminishes information asymmetry among supply chain participants [75,81], and increases the agility of resource integration. Consequently, firms can enhance sustainable performance via SCA by swiftly adapting to environmental changes and optimizing resource allocation. High DO enables organizations to leverage real-time data and analytical tools to swiftly identify external variables, such as fluctuations in market demand and regulatory changes [62], thereby enhancing their efficiency in advancing sustainable performance via SCA. Specifically, GSCI resources enhanced by digital technology augment the supply chain’s responsiveness and adaptability. Digitally oriented firms typically implement developing technology and innovative techniques in GSCI [65]. These technologies enhance the adaptability of organizations, allowing for the rapid optimization of strategies and resources in response to changes in environmental regulations or market sustainability demands. Furthermore, DO facilitates firms in creating more effective communication channels with supply chain partners and attaining efficient information dissemination using technological methods [82]. This boosts the enterprise’s agility and facilitates the effective transmission of GSCI benefits to SCA, hence boosting the enterprise’s sustainable performance. Consequently, we propose a moderated mediation hypothesis:
H7: 
The indirect relationship between green supply chain integration and sustainable performance via supply chain agility is moderated by digital orientation, such that the relationship is stronger with increasing levels of digital orientation.
Figure 1 depicts the research framework for this study, while Table 1 provides definitions for all the constructs.

3. Methodology

3.1. Study Context

The pharmaceutical industry in China plays a significant role in the global market [27]. This study primarily examines the pharmaceutical manufacturing enterprise, categorized under GB/T 4754-2017 (2019 Edition) [88]. The pharmaceutical manufacturing enterprise is a strategic focus in China’s development initiatives, including “Made in China 2025” and the “14th Five-Year Plan for the Development of the Pharmaceutical Industry”. The industry is crucial for public health, economic growth, and social development, facilitated by China’s economic stability and healthcare reforms. Notwithstanding its expansion, the pharmaceutical industry remains more conservative than other sectors in terms of digitalization and sustainability [6,7]. Industry integration and collaboration are emerging as essential trends, with synchronized development expected to drive further growth [89]. This study investigates the correlation between GSCI and sustainable performance in this context.

3.2. Measurement

The model was assessed via a survey employing measuring scales based on prior research (Table 1). The 14 items utilized to assess GSCI were adapted from Wu [23]. The GSCI is defined as a second-order reflective construct including three first-order reflective constructs: green internal integration (6 items), green supplier integration (5 items), and green customer integration (3 items).
Sustainable performance guarantees that organizations comprehensively equilibrate their economic, environmental, and social outcomes [20]. Sustainable performance was measured using a 16-item scale developed by Afum et al. [20] which is a second-order reflective construct comprising three first-order reflective constructs: environmental performance (6 items), economic performance (5 items), and social performance (5 items). According to Hair et al. [90], investigations of discriminant validity concerning the links between higher-order and lower-order components, as well as among the lower-order constructs, may be exempted. Four items were employed to assess SCA, adapted from Altay et al. [84]. The DO scales were adapted from Chavez et al. [91], which evaluate an organization’s commitment to employing digital technology. Given that the data was obtained from a single source, we employed a 3-item marker variable termed Cognitive Rigidity from Lin et al. [92] to address potential issues related to CMV.
GSCI items were assessed using a five-point Likert scale (1 = ‘Strongly Disagree’, 5 = ‘Strongly Agree’), as this scale offers dependable evaluations [93]. A seven-point Likert scale (1 = ‘Strongly Disagree’, 7 = ‘Strongly Agree’) was employed for assessing sustained performance and the marker variable (cognitive rigidity), as it more precisely reflects emotional responses [94]. A six-point Likert scale (1 = ‘Strongly Disagree’, 6 = ‘Strongly Agree’) was utilized for the mediating variable (SCA) and the moderator variable (DO) to mitigate central tendency bias [95,96]. Using different scales in the survey helps mitigate covariation bias [86], and greater reliability and validity are observed when the scale moving from 5 to 7 points [97,98].
We pre-tested the questionnaire following the guidelines of Hair et al. [99], who recommended involving academics, industry experts, and potential respondents. Four academics from Chinese universities and industry experts reviewed the survey, leading to slight modifications. The lead researcher, a native Chinese speaker proficient in English, translated the original questionnaire into Chinese. To guarantee accuracy, two translators participated independently performed in a back-translation.

3.3. Sample and Data Collection

This study employed an F-test for regression through G*Power to determine the necessary minimum sample size for multiple regression with three predictors, setting an alpha level of 0.05, a power of 0.80, and a medium effect size (f2 = 0.15). Given that 80% power is deemed the minimum for social science study [100], the requisite minimum sample size was 77. The survey was conducted using three methods: (1) through various pharmaceutical industry conference venues, (2) with the assistance of acquaintances, and (3) via email. Considering the research objectives, only respondents holding positions such as supply chain managers, procurement managers, marketing managers, vice presidents, or CEOs/presidents were selected. 288 completed surveys were collected between March and July 2024, yielding a response rate of 62.7%, which exceeds the recommended threshold. Respondents’ demographics are summarized in Table 2.

3.4. Common Method Variance (CMV)

To address potential CMV, both procedural and statistical remedies were employed in this study. As a statistical remedy, Harman’s single-factor test was first conducted using unrotated principal component analysis on all measurement items. The analysis extracted multiple factors, with the first factor accounting for only 32.036% of the total variance—well below the 50% threshold recommended by Podsakoff et al. [86]. This result suggests that no single general factor emerged, indicating CMV is unlikely to pose a serious threat in this study.
In addition, the marker variable technique was applied following the approach of Podsakoff et al. [86] to further assess CMV. A theoretically unrelated marker variable was introduced before conducting PLS-SEM. As shown in Table 3, no significant changes were observed in the path coefficients or R2 values before and after inclusion of the marker [87], supporting the conclusion that CMV has a negligible impact on the study’s results.

4. Results

PLS-SEM analysis was conducted using SmartPLS 4.0. Data normality was verified by assessing multivariate skewness and kurtosis using the web application proposed by Cain et al. [101] (http://psychstat.org/kurtosis accessed on 20 January 2025). The skewness (β = 3.36 > 3) and kurtosis (β = 25.78 > 20) indicate that the data is not normally distributed, confirming that the normality assumption is violated, which requires the use of non-parametric analysis tool such as Smart PLS [90]. Subsequently, we evaluated the measurement model for validity and reliability and analyzed the structural model to test the hypotheses [90,102].

4.1. Measurement Model

In PLS-SEM, the evaluation of the measurement model requires the assessment of convergent validity, construct reliability, and discriminant validity. Both GSCI and sustainable performance were conceptualized as second-order constructs. This study employed a hierarchical component model (reflective–reflective) using the disjoint two-stage approach [103,104].
In the first stage, only the lower-order components (LOCs) of the higher-order constructs were included in the model estimation. Specifically, GSCI was modeled through GII, GSI, and GCI, while Sustainable Performance was modeled through EP, FP, and SP. All other constructs in the model were connected directly to these LOCs. In the second stage, the latent variable scores of the LOCs were used as indicators for their corresponding higher-order constructs (HOCs)—GSCI and Sustainable Performance—allowing for the assessment of the full structural model. Figure 2 presents a side-by-side comparison of the model using first-order constructs (left) and the hierarchical model with second-order constructs (right), illustrating the disjoint two-stage approach adopted in this study.
Table 4 presents the results. All items met indicator reliability (0.707–0.908) (≥0.5), with AVE scores above 0.5, so no items were dropped. Composite reliability for all constructs exceeded 0.7 (0.816–0.915) [90,102], signifying satisfactory reliability for the measurement approach.
Subsequently, we assessed the discriminant validity using the HTMT criterion proposed by Henseler et al. [105]. The stringent criterion for HTMT values is <0.85, while the more moderate criterion is ≤0.90 [102]. Table 5 illustrates that the HTMT values were all below the lenient threshold of ≤0.90; furthermore, bootstrapping confirmed that the upper limit of the HTMT confidence interval did not exceed 1.00; hence, indicating that the respondents recognized the four constructs as distinct. Taken together both these validity test has shown that the measurement items are both valid and reliable.

4.2. Structural Model

In accordance with the recommendations of Becker et al. [106], a bootstrapping approach involving 10,000 resamples was employed to calculate the path coefficients, t-values, p-values, standard errors, confidence intervals (CIs), and effect sizes for hypothesis significance testing (Table 6).
The model accounts for 50.4% of the variance in sustainable performance, as reflected by an R2 of 0.504 and an adjusted R2 of 0.497. Specifically, GSCI significantly influences sustainable performance directly (β = 0.487, p < 0.01), confirming H1. The influence of GSCI on SCA, with an R2 of 0.434 and an adjusted R2 of 0.428, signifies that GSCI explains 43.4% of the variance in SCA. The small difference between the two values suggests a robust model with no indication of overfitting, as adjusted R2 accounts for model complexity and avoids overestimation [90]. The relationship between GSCI and SCA (β = 0.407, p < 0.01) supports H2. SCA positively affects sustainable performance (β = 0.220, p < 0.01), hence confirming H3.
We adhered to the guidance of Ramayah et al. [102] and employed the bootstrapping technique to evaluate the mediation hypothesis. A significant mediation effect is indicated when the confidence intervals (CIs) do not include zero. As shown in Table 6, the mediation effect from GSCI to sustainable performance (β = 0.089, p < 0.01) was significant. The bias-corrected 95% CIs did not encompass 0, hence supporting H4. Regarding the proposed moderating role of DO between GSCI and SCA, bootstrap CIs were positive and negative; indicating that H5 was not supported. the interaction term DO × SCA demonstrated a significant effect on sustainable performance (β = 0.149, p= 0.001), with both bounds of the bootstrap CIs being positive, thereby supporting H6.
To visually illustrate the moderating effect of DO on the relationship between SCA and sustainable performance, we created Figure 3, where the dashed and solid lines represent the relationships between SCA and sustainable performance under high and low DO levels, respectively. The difference in slopes reflects the positive moderating effect of DO on SCA → sustainable performance relationship.
PLS-Predict is a holdout-based prediction technique that generates case-level predictions for latent variables [107]. Given the sample size exceeds 200 [108], this study applied 10-fold cross-validation (k = 10). RMSE was used to quantify prediction errors [109]. Following the procedure recommended by Shmueli et al. [109], the first step is to verify if all Q2 predict values are greater than zero. In this study, all Q2 predict values were positive (Table 7), indicating that the model has predictive relevance. Furthermore, Shmueli et al. [109] suggested that if all the item differences (PLS-LM and PLS-IA) were lower than there is strong predictive power, if all are higher than predictive relevance is not confirmed while if the majority is lower than there is moderate predictive power and if minority then there is low predictive power. Based on Table 7, all of the errors of the PLS model were lower than the 2 benchmark models of LM model and the IA model thus we can conclude that our model has a strong predictive power.
The root mean square residual (RMRS), defined as the average discrepancy between the observed and model-implied correlation matrices, serves as an absolute measure of model fit. RMRS values below 0.08 indicate a good fit [110]. In this study, the SRMR values for the saturated and estimated models are 0.059 and 0.060 (Table 7), respectively, suggesting an acceptable model fit.

4.3. Assessing the Moderated Mediation Effect

Conditional Process Analysis integrates moderation and mediation in a single model to test indirect effects across different moderator levels [52]. Preliminary analyses checked normality, homoscedasticity, and linearity, and Pearson correlations were computed. To assess how DO moderates the mediating effects, we employed ‘Model 58’ from Hayes’ [52] PROCESS macro with 10,000 bootstrap resamples with bias-corrected 95% CIs (Figure 4). Moderated mediation is indicated if any CI excludes 0, showing a moderation effect at some level of mediation.
DO was categorized as low or high based on one standard deviation above or below the mean. The conditional indirect effect of GSCI on sustainable performance through SCA is significant at high levels of DO (95% CI: [0.085 to 0.234]) but not at low levels (95% CI: [−0.36 to 0.093]) (Table 8). Although no ‘index of moderated mediation’ was produced, all pairwise contrasts of the indirect effects were significant, as bootstrap CIs for differences between pairs did not include zero [52]. This indicates that the indirect effects are conditional on the moderator level, supporting H7.

5. Discussion

This study explores the relationships between GSCI, SCA, DO, and sustainable performance. The results of hypothesis testing yield several key findings that offer both theoretical insights and practical implications for enterprises seeking to enhance sustainable performance in a digitalized environment.
In alignment with prior research findings, both hypothesis H1, H2 and hypothesis H3 were supported [31,59]. These findings indicate that the supply chain collaboration network built by GSCI enable firms to access critical resources and strengthen communication among supply chain partners and augmenting SCA. SCA is a crucial prerequisite for organizations to effectively adopt sustainable performance. Hypothesis H4 was also supported, which further verifies NRBV; that is, the combination of valuable resources and dynamic capabilities helps to build competitive advantages and thus improve sustainable performance.
However, hypothesis H5 was not supported, which means that DO does not enhance the effect of GSCI on SCA. There may be the following reasons: (1) DO may require supportive infrastructure and an enabling organizational culture to be effectively implemented; (2) The implementation of GSCI may already rely on standardized protocols and relational trust with partners, which may not necessarily require digital capabilities to improve agility [67,
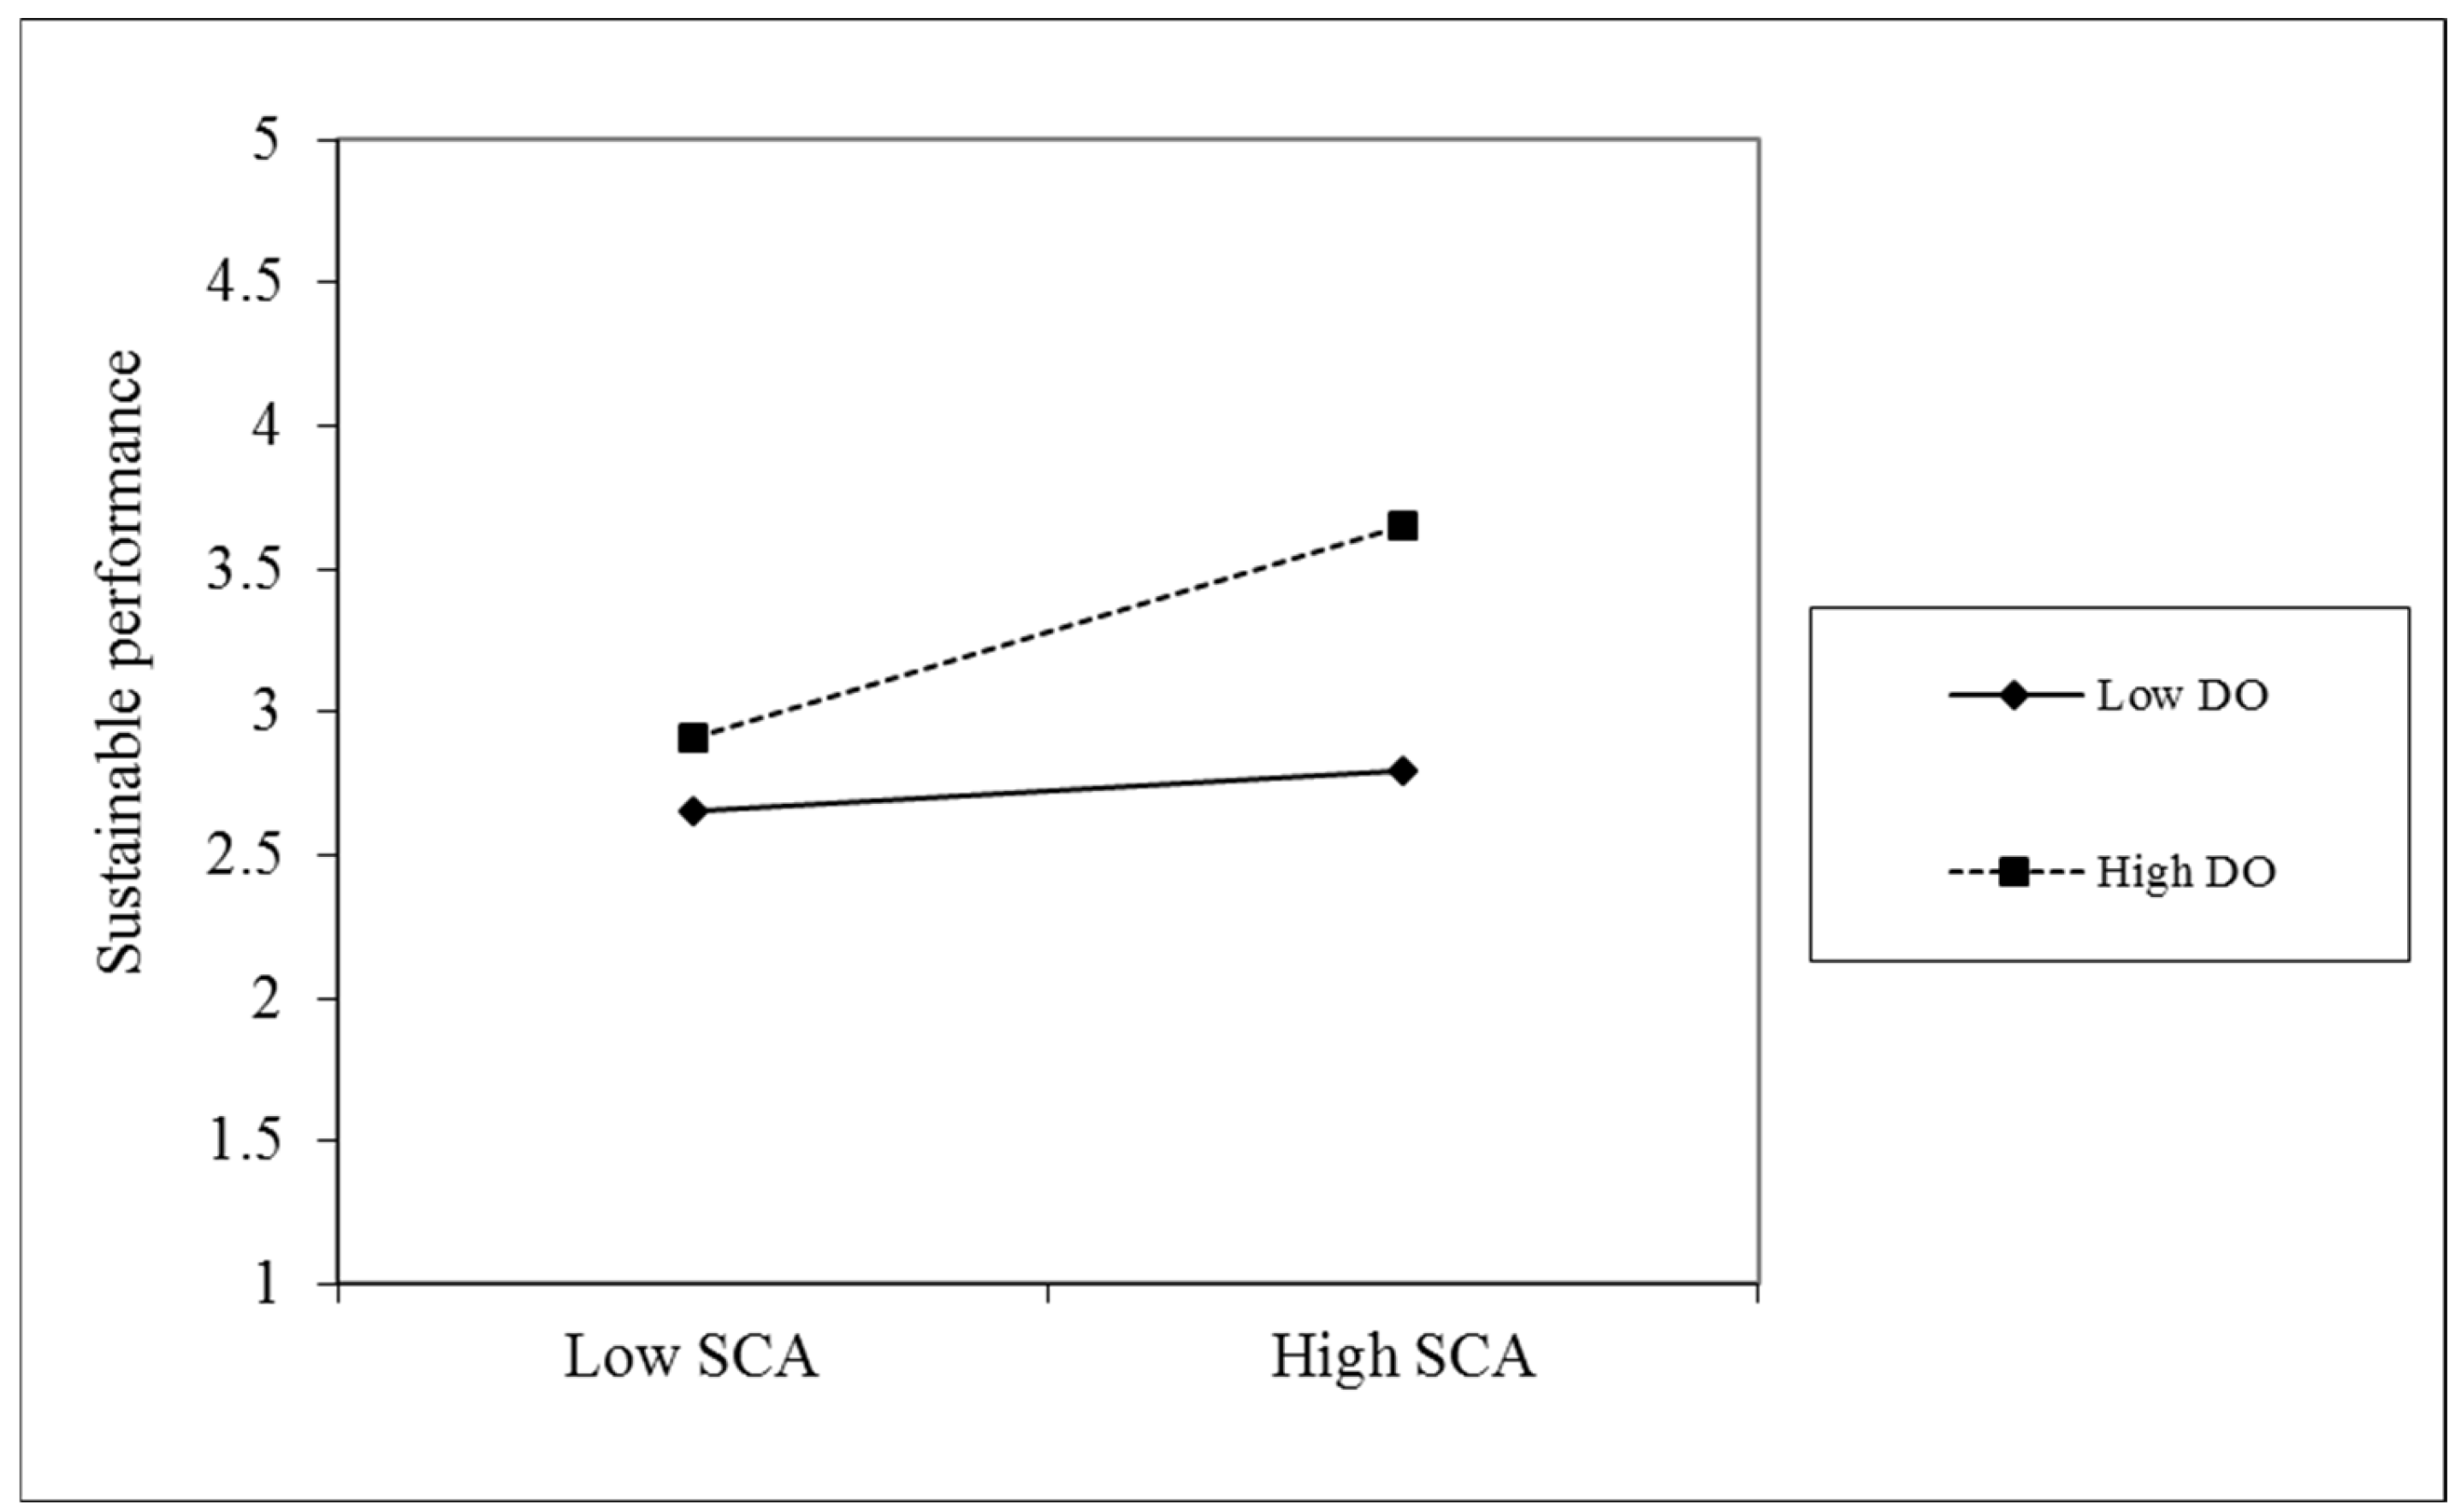
68]; (3) The integration of GSCI with digitalization might lead to a high degree of interdependence among supply chain partners, potentially diminishing their individual autonomy and reducing their agility in responding to market dynamics and unforeseen disruptions. Finally, hypotheses H6 and H7 were supported, indicating that enterprises can significantly improve their sustainable performance when DO is combined with SCA.
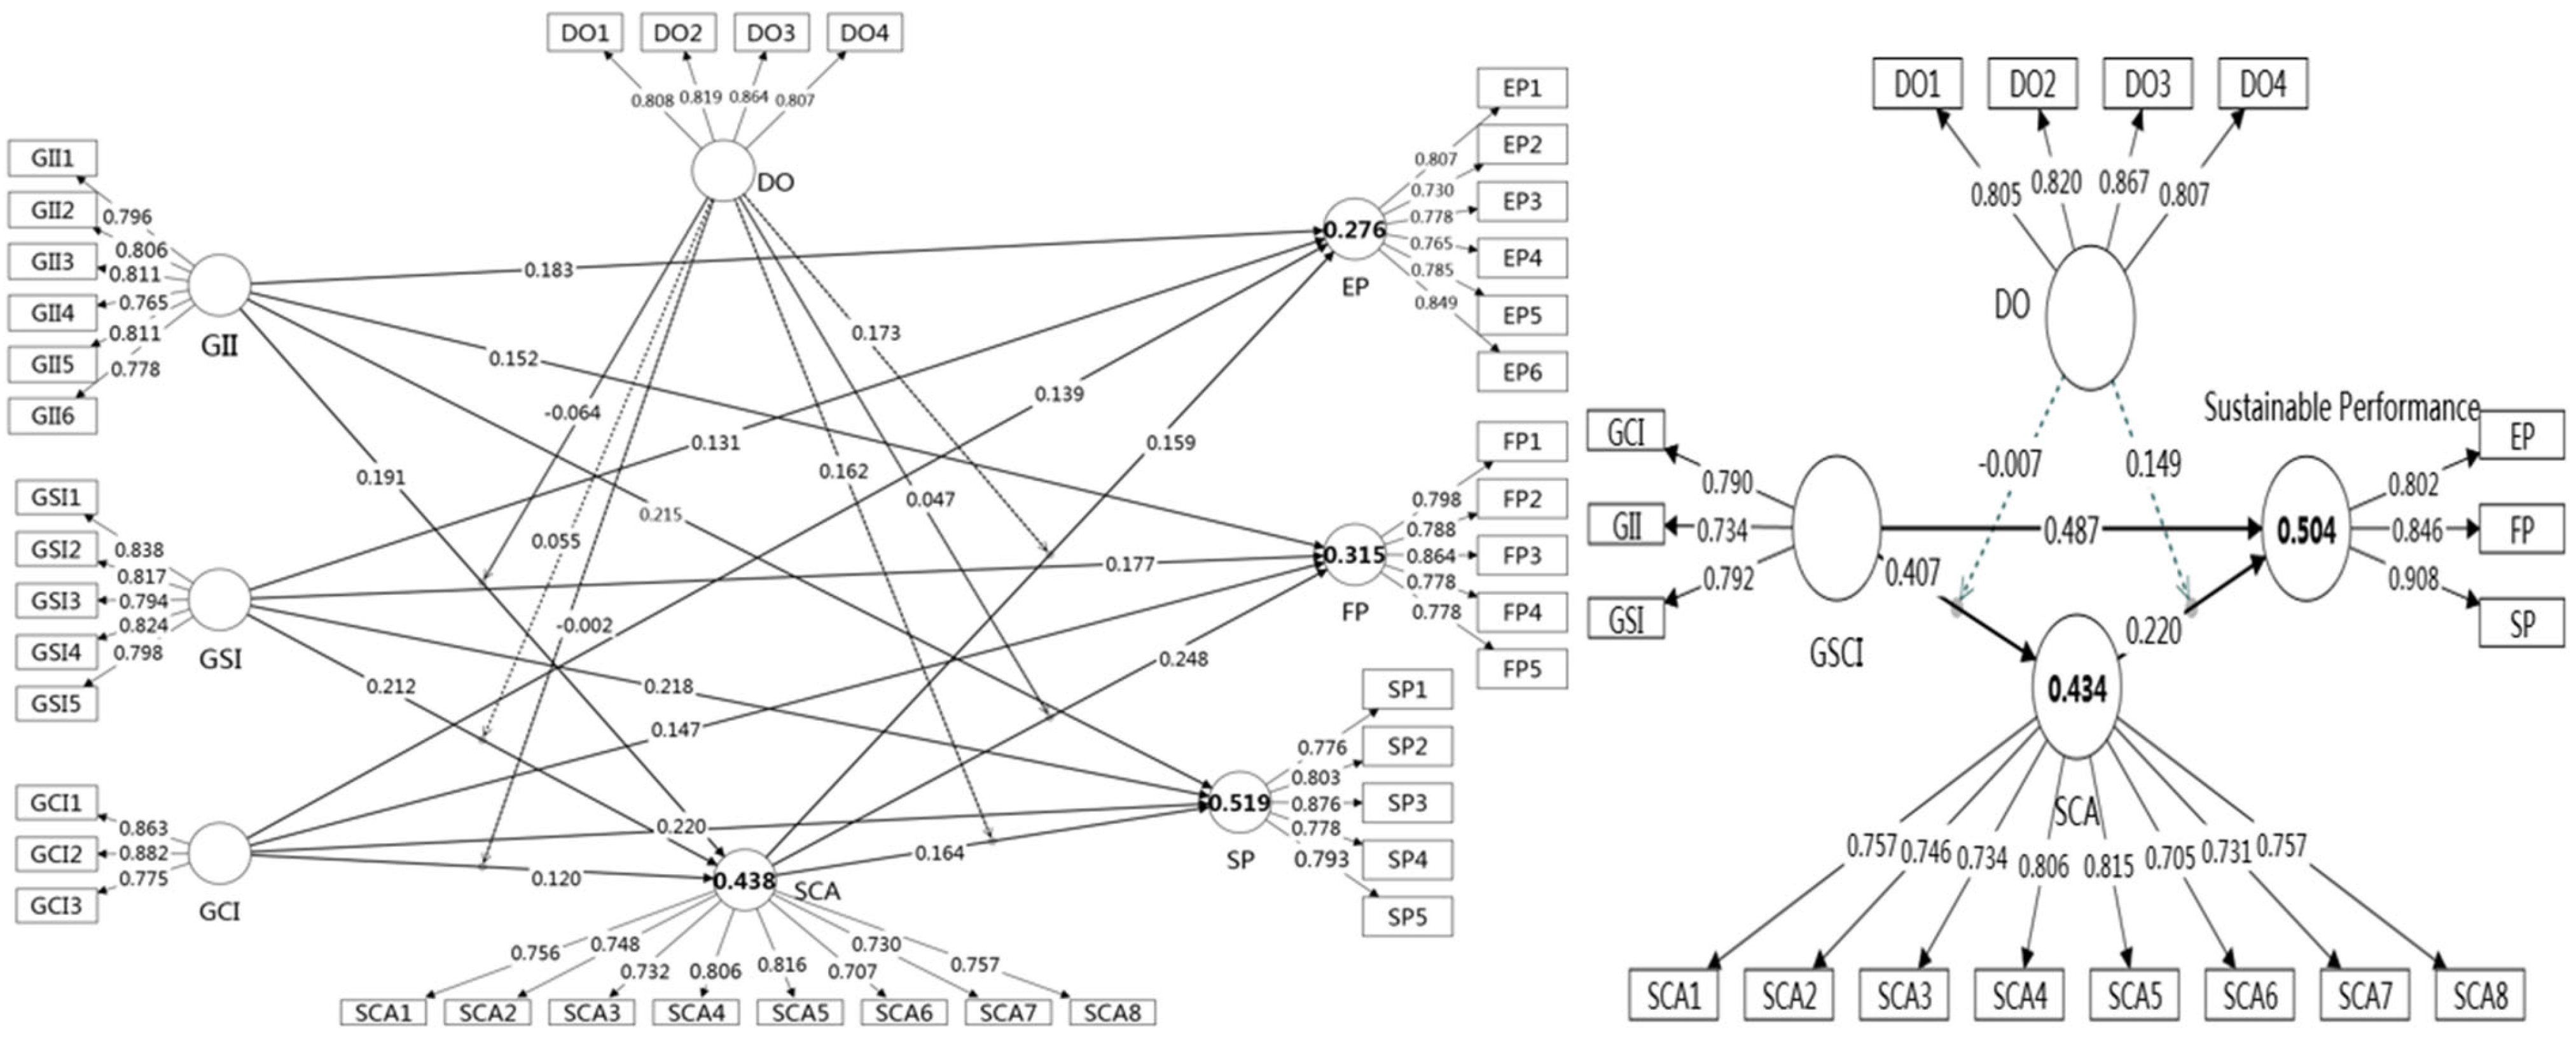
Furthermore, the PLSpredict results indicate that the model demonstrates strong predictive power. This is further supported by the Q2 values and lower RMSE, confirming the model’s high predictive relevance and empirical applicability. The strong predictive performance not only highlights the model’s practical utility but also suggests the robustness and contextual validity of the theoretical relationships among constructs. These findings enhance the model’s credibility and reinforce its value for both theoretical exploration and real-world application.

5.1. Theoretical Implications

Firstly, the study extends NRBV by demonstrating that GSCI, while representing a valuable and rare organizational practice, must be complemented by dynamic capabilities such as SCA to achieve sustainable performance. This finding responds to recent calls to move beyond the static treatment of resources in NRBV, emphasizing the critical role of resource reconfiguration and dynamic capabilities in realizing the value of green resources for achieving competitive advantage. By empirically validating the mediating role of SCA between GSCI and sustainable performance, this research refines the resource–capability–performance logic and enriches our processual understanding of NRBV.
Secondly, this study advances CT by introducing DO as a critical boundary condition. The moderated and moderated mediation findings demonstrate that the effectiveness of GSCI and SCA depends not only on internal alignment but also on contextual fit with digital strategies. This reflects CT’s principle that organizational success is contingent upon the match between internal systems and external environmental conditions. DO is not merely a technological variable, but a strategic and cultural orientation that shapes how resources and capabilities interact to produce sustainable performance. Finally, this study employed the PLSpredict procedure to systematically assess the model’s predictive performance, offering a valuable perspective that bridges theoretical explanation and practical application in structural equation modeling. From a theoretical perspective, the strong predictive power observed confirms the robustness, stability, and internal consistency of the proposed structural model in explaining the relationships between GSCI, SCA, DO, and sustainable performance. Moreover, the high level of predictive accuracy reinforces the theoretical validity of the resource–capability–performance logic, while also suggesting potential avenues for future research—such as integrating additional constructs or refining measurement dimensions to further enhance generalizability. These findings provide a solid foundation for future research on the synergy between GSCI and dynamic capabilities and support the continued development of the resource–capability–performance logic under the NRBV and CT frameworks.

5.2. Managerial Implications

First, pharmaceutical industry leaders should recognize the strategic value of GSCI. Pharmaceutical manufacturers should dismantle interdepartmental barriers, enhance internal integration, and optimize products and processes through information sharing and collaborative decision-making. As the core of supply chain, pharmaceutical enterprises should integrate supplier and customer resources to boost production planning accuracy, accelerate delivery, and reduce costs. Customer integration enables rapid responses to market demand and enhances service quality. Additionally, supply chain partners serve as valuable sources of innovation knowledge. Leveraging such knowledge can shorten product development cycles, boost responsiveness, and contribute to sustainable development.
Second, the study indicates that GSCI fosters SCA and can drive sustainable performance through SCA. Enterprises must strengthen their ability to respond and adapt to environmental changes, market volatility, and unexpected disruptions. To support agility, enterprises must reinforce information-sharing and collaboration with supply chain partners, especially within GSCI framework. Enterprises should encourage cross-organizational information transparency to reduce resource waste from information delays. Agility also depends on rapid decision-making and internal collaboration capabilities. Enterprises should establish flexible processes and cross-functional collaboration to support SCA. For instance, embedding green supply chain sustainability goals into departmental assessments can promote coordinated efforts in eco-friendly production across departments.
Third, since DO can enhance both the impact of SCA on sustainable performance and the mediating role of SCA, pharmaceutical enterprises should establish a clear digital strategy that defines digitalization’s role in future development with long-term goals and key outcomes. This strategy should be embedded across the entire value chain—from R&D and production to supply chain management and marketing. For instance, integrating b enterprise-wide data systems can eliminate data silos and improve data utilization. Enterprises should also build professional digital teams by training and recruiting talents with expertise in digital technology and data analytics.
Finally, while implementing GSCI through digital technologies, enterprises need to be mindful of potential dependency risks. Over-reliance on or improper use of a certain technology or platform may limit the flexibility of supply chain partners and weaken their ability to respond quickly to market demand. Enterprises can use distributed systems and blockchain technologies for managing and storing supply chain data, enhancing both transparency and data security. Enterprises can also help supply chain partners improve their digital capabilities through training and technical support to independently manage digital systems and reduce t reliance on core enterprises. Enterprises can further formulate standardization of digital systems in the supply chain to ensure compatibility, allowing partners to flexibly adopt compliant technologies without being locked into a specific vendor or platform.
To support managerial application of the study’s findings, a concise roadmap (Figure 5) is proposed to guide pharmaceutical firms in enhancing GSCI, SCA, and DO for sustainable performance.

6. Limitations and Future Studies

First, since this study focuses solely on a single industry within China, the generalizability of the findings may be limited. Future studies can test the model across different industries and countries to enhance its external validity. Second, a more granular examination of the three dimensions of GSCI—green supplier integration, green customer integration, and green internal integration—particularly in relation to DO, would help uncover their distinct roles and contributions to sustainable performance. Third, future research could investigate the antecedents of GSCI, such as green intellectual capital, top management’s cognitive attitudes, and organizational beliefs, to provide deeper insights and practical guidance for enhancing green integration practices. Fourth, although this study employed cross-sectional data, which limits the ability to make strong causal inferences, future research could adopt longitudinal or time-lagged designs to better capture causal relationships and the dynamic evolution of constructs over time. Finally, it would be valuable to examine additional moderating factors, such as digital leadership and inter-organizational trust, to better understand how they shape the relationship GSCI and SCA in various organizational contexts.

Author Contributions

Conceptualization, H.L.; methodology, H.L. and R.T.; software, H.L.; validation, H.L.; formal analysis, H.L.; investigation, H.L.; resources, H.L.; data curation, H.L.; writing—original draft preparation, H.L.; writing—review and editing, H.L. and R.T.; visualization, H.L.; supervision, R.T. All authors have read and agreed to the published version of the manuscript.

Funding

This research received no external funding.

Data Availability Statement

The data presented in this study are available on request from the first author.

Conflicts of Interest

The authors declare no conflicts of interest.

References

  1. Guo, P. 2024–2028 China Pharmaceutical Industry Development Forecast and Investment Analysis Report; 2024. Available online: https://www.sohu.com/a/772368009_121795128 (accessed on 16 February 2025).
  2. Chyxx. 2025–2031 China Pharmaceutical Industry Market Panorama Research and Development Trend Research Report; 2024. Available online: https://www.chyxx.com/research/1169634.html (accessed on 20 February 2025).
  3. Insight and Info. In-Depth Analysis of the Current Situation and Investment Prospects of China’s Pharmaceutical Industry Forecast Report (2022–2029); 2022. Available online: https://www.chinabaogao.com/detail/608153.html (accessed on 10 February 2025).
  4. Lianhe Credit Rating Co., Ltd. Credit 2023 ESG Rating Analysis Report for the Pharmaceutical Industry; 2023. Available online: https://www.lhratings.com/file/f7e454f8773.pdf (accessed on 16 February 2025).
  5. Sun, J.; Sarfraz, M.; Khawaja, K.F.; Abdullah, M.I. Sustainable Supply Chain Strategy and Sustainable Competitive Advantage: A Mediated and Moderated Model. Front. Public Health 2022, 10, 895482. [Google Scholar] [CrossRef] [PubMed]
  6. Chen, Y.; Sampat, C.; Huang, Y.-S.; Ganesh, S.; Singh, R.; Ramachandran, R.; Reklaitis, G.V.; Ierapetritou, M. An Integrated Data Management and Informatics Framework for Continuous Drug Product Manufacturing Processes: A Case Study on Two Pilot Plants. Int. J. Pharm. 2023, 642, 123086. [Google Scholar] [CrossRef] [PubMed]
  7. Ma, J.-Y.; Shi, L.; Kang, T.-W. The Effect of Digital Transformation on the Pharmaceutical Sustainable Supply Chain Performance: The Mediating Role of Information Sharing and Traceability Using Structural Equation Modeling. Sustainability 2023, 15, 649. [Google Scholar] [CrossRef]
  8. Mohaghegh, M.; Blasi, S.; Russo, I.; Baldi, B. Digital Transformation and Sustainable Performance: The Mediating Role of Triple-A Supply Chain Capabilities. J. Bus. Ind. Mark. 2024, 16, 896–910. [Google Scholar] [CrossRef]
  9. Jum’a, L.; Zimon, D.; Madzik, P. Impact of Big Data Technological and Personal Capabilities on Sustainable Performance on Jordanian Manufacturing Companies: The Mediating Role of Innovation. J. Enterp. Inf. Manag. 2024, 37, 329–354. [Google Scholar] [CrossRef]
  10. Khan, A.N.; Mehmood, K.; Kwan, H.K. Green Knowledge Management: A Key Driver of Green Technology Innovation and Sustainable Performance in the Construction Organizations. J. Innov. Knowl. 2024, 9, 100455. [Google Scholar] [CrossRef]
  11. Mahmood, F.; Nasir, N. Impact of Green Human Resource Management Practises on Sustainable Performance: Serial Mediation of Green Intellectual Capital and Green Behaviour. Environ. Sci. Pollut. Res. 2023, 30, 90875–90891. [Google Scholar] [CrossRef]
  12. Yadav, S.; Samadhiya, A.; Kumar, A.; Luthra, S.; Kumar, V.; Garza-Reyes, J.A.; Upadhyay, A. The Interplay Effects of Digital Technologies, Green Integration, and Green Innovation on Food Supply Chain Sustainable Performance: An Organizational Information Processing Theory Perspective. Technol. Soc. 2024, 77, 102585. [Google Scholar] [CrossRef]
  13. Shushangyun Seize the Opportunities for Development in the Digital Era, and a Collaborative Supply Chain System Will Drive Biomedical Companies to Accelerate Their Digital Transformation and Upgrading. 2022. Available online: https://www.shushangyun.com/article-6776.html (accessed on 15 January 2025).
  14. iResearch. Internet White Paper on China’s Pharmaceutical Industry; 2020. Available online: https://pdf.dfcfw.com/pdf/H3_AP202012161440695496_1.pdf (accessed on 15 January 2025).
  15. Bilodeau, A.; Vazhenina, L.; Rosenorn, P.; Siebert, A. How to Formulate a Supply Chain Strategy for Biopharmaceutical Companies. 2023. Available online: https://www.lek.com/zh-hant/insights/hea/us/ei/creating-opportunities-and-avoiding-missteps-biopharma-supply-chain-strategy (accessed on 15 January 2025).
  16. Wang, Y.; Wang, L.; Huang, K.; Hu, Y.; Lu, Q.; Hou, W.; Zhang, J. Research on Pharmaceutical Supply Chain Decision-Making Model Considering Output and Demand Fluctuations. IEEE Access 2024, 12, 61629–61641. [Google Scholar] [CrossRef]
  17. Kar, K.; Chowdhury, S.; Chakraborty, P.; Saha, A. Sustainable Practices in the Pharmaceutical Industry: Development and Adoption. In Preserving Health, Preserving Earth: The Path to Sustainable Healthcare; Springer: Berlin/Heidelberg, Germany, 2024; pp. 11–33. [Google Scholar]
  18. Vanbrabant, L.; Verdonck, L.; Mertens, S.; Caris, A. Improving Hospital Material Supply Chain Performance by Integrating Decision Problems: A Literature Review and Future Research Directions. Comput. Ind. Eng. 2023, 180, 109235. [Google Scholar] [CrossRef]
  19. Andersén, J.; Jansson, C.; Ljungkvist, T. Can Environmentally Oriented CEOs and Environmentally Friendly Suppliers Boost the Growth of Small Firms? Bus. Strategy Environ. 2020, 29, 325–334. [Google Scholar] [CrossRef]
  20. Afum, E.; Agyabeng-Mensah, Y.; Sun, Z.; Frimpong, B.; Kusi, L.Y.; Acquah, I.S.K. Exploring the Link between Green Manufacturing, Operational Competitiveness, Firm Reputation and Sustainable Performance Dimensions: A Mediated Approach. J. Manuf. Technol. Manag. 2020, 31, 1417–1438. [Google Scholar] [CrossRef]
  21. Junaid, M.; Zhang, Q.; Syed, M.W. Effects of Sustainable Supply Chain Integration on Green Innovation and Firm Performance. Sustain. Prod. Consum. 2022, 30, 145–157. [Google Scholar] [CrossRef]
  22. Anin, E.K.; Etse, D.; Okyere, G.A.; Adanfo, D.B.Y. Green Entrepreneurial Orientation and Firm Performance: Do Green Purchasing and Supply Chain Integration Matter? Cogent Bus. Manag. 2024, 11, 2377762. [Google Scholar] [CrossRef]
  23. Wu, G. The Influence of Green Supply Chain Integration and Environmental Uncertainty on Green Innovation in Taiwan’s IT Industry. Supply Chain Manag. Int. J. 2013, 18, 539–552. [Google Scholar] [CrossRef]
  24. Alkhatib, A.W. Fostering Green Innovation: The Roles of Big Data Analytics Capabilities and Green Supply Chain Integration. Eur. J. Innov. Manag. 2023, 27, 2818–2840. [Google Scholar] [CrossRef]
  25. Singh, K.; Chaudhuri, R.; Chatterjee, S. Assessing the Impact of Digital Transformation on Green Supply Chain for Achieving Carbon Neutrality and Accelerating Circular Economy Initiatives. Comput. Ind. Eng. 2025, 201, 110943. [Google Scholar] [CrossRef]
  26. Mondal, C.; Giri, B.C. Investigating Strategies of a Green Closed-Loop Supply Chain for Substitutable Products under Government Subsidy. J. Ind. Prod. Eng. 2022, 39, 253–276. [Google Scholar] [CrossRef]
  27. Yang, G.; Liu, F.; Singhdong, P. Exploring the Impacts of Green Supply Chain Integration and Ambidextrous Green Innovation on the Financial Performance of China’s Pharmaceutical Manufacturing Enterprises. Sustainability 2024, 16, 6501. [Google Scholar] [CrossRef]
  28. Hejazi, M.T.; Habani, M.A. Impact of Green Supply Chain Integration Management on Business Performance: A Mediating Role of Supply Chain Resilience and Innovation the Case of Saudi Arabian Manufacturing Sector. Cogent Bus. Manag. 2024, 11, 2392256. [Google Scholar] [CrossRef]
  29. Long, Y.; Yang, Y.; Feng, T.; Cheng, Y.; Farooq, S. Green Supply Chain Integration, Lean Management, and Manufacturers’ Performance: Role of Supply Chain Risk Management. Total Qual. Manag. Bus. Excell. 2025, 36, 369–394. [Google Scholar] [CrossRef]
  30. Yang, G.; Singhdong, P. A Conceptual Framework of Green Supply Chain Integration toward Enterprise Performance through Ambidextrous Green Innovation: An Organizational Capability Perspective. J. Int. Logist. Trade 2024, 22, 93–106. [Google Scholar] [CrossRef]
  31. Zhang, B.; Zhao, S.; Fan, X.; Wang, S.; Shao, D. Green Supply Chain Integration, Supply Chain Agility and Green Innovation Performance: Evidence from Chinese Manufacturing Enterprises. Front. Environ. Sci. 2022, 10, 1045414. [Google Scholar] [CrossRef]
  32. Zhou, H.; Zhao, S. Green Supply Chain Integration on Firm’s Green Innovation: The Moderating Role of Resource Orchestration Capability. Oper. Manag. Res. 2024, 17, 1380–1396. [Google Scholar] [CrossRef]
  33. Teece, D.J.; Pisano, G.; Shuen, A. Dynamic Capabilities and Strategic Management. Strateg. Manag. J. 1997, 18, 509–533. [Google Scholar] [CrossRef]
  34. Wu, L.-Y. Applicability of the Resource-Based and Dynamic-Capability Views under Environmental Volatility. J. Bus. Res. 2010, 63, 27–31. [Google Scholar] [CrossRef]
  35. Shukor, A.A.A.; Newaz, M.S.; Rahman, M.K.; Taha, A.Z. Supply Chain Integration and Its Impact on Supply Chain Agility and Organizational Flexibility in Manufacturing Firms. Int. J. Emerg. Mark. 2020, 16, 1721–1744. [Google Scholar] [CrossRef]
  36. Christmann, P. Effects of “Best Practices” of Environmental Management on Cost Advantage: The Role of Complementary Assets. Acad. Manag. J. 2000, 43, 663–680. [Google Scholar] [CrossRef]
  37. Johnsen, T.; Howard, M.; Miemczyk, J. Purchasing and Supply Chain Management: A Sustainability Perspective; Routledge: London, UK, 2018. [Google Scholar]
  38. McDougall, N.; Wagner, B.; MacBryde, J. Leveraging Competitiveness from Sustainable Operations: Frameworks to Understand the Dynamic Capabilities Needed to Realise NRBV Supply Chain Strategies. Supply Chain Manag. Int. J. 2022, 27, 12–29. [Google Scholar] [CrossRef]
  39. Coppola, C.; Vollero, A.; Siano, A. Developing Dynamic Capabilities for the Circular Economy in the Textile and Clothing Industry in Italy: A Natural-Resource-Based View. Bus. Strategy Environ. 2023, 32, 4798–4820. [Google Scholar] [CrossRef]
  40. Hart, S.L.; Dowell, G. Invited Editorial: A Natural-Resource-Based View of the Firm: Fifteen Years After. J. Manag. 2011, 37, 1464–1479. [Google Scholar] [CrossRef]
  41. Strauss, K.; Lepoutre, J.; Wood, G. Fifty Shades of Green: How Microfoundations of Sustainability Dynamic Capabilities Vary across Organizational Contexts. J. Organ. Behav. 2017, 38, 1338–1355. [Google Scholar] [CrossRef]
  42. Rashid, A.; Rasheed, R.; Ngah, A.H.; Marjerison, R.K. A Nexus of Multiple Integrations and Business Performance through Supply Chain Agility and Supply Flexibility: A Dynamic Capability View. J. Sci. Technol. Policy Manag. 2024. ahead-of-print. [Google Scholar] [CrossRef]
  43. Aslam, H.; Blome, C.; Roscoe, S.; Azhar, T.M. Dynamic Supply Chain Capabilities: How Market Sensing, Supply Chain Agility and Adaptability Affect Supply Chain Ambidexterity. Int. J. Oper. Prod. Manag. 2018, 38, 2266–2285. [Google Scholar] [CrossRef]
  44. Eslami, M.H.; Jafari, H.; Achtenhagen, L.; Carlbäck, J.; Wong, A. Financial Performance and Supply Chain Dynamic Capabilities: The Moderating Role of Industry 4.0 Technologies. Int. J. Prod. Res. 2021, 62, 8092–8109. [Google Scholar] [CrossRef]
  45. Aslam, H.; Blome, C.; Schleper, M.C.; Ramish, A.; Bajwa, S.U. Investigating the Supply Chain Agility–Innovation Link: The Role of Organizational Context. Eur. Manag. J. 2024, 43, 246–256. [Google Scholar] [CrossRef]
  46. Cheng, J.; Bi, G.; Shahzad, U. Influence of Dynamic Capabilities and Supply Chain Finance on Supply Chain Effectiveness in Environmental Dynamism: A Conditional Process Analysis. Oper. Manag. Res. 2024, 17, 307–323. [Google Scholar] [CrossRef]
  47. Patnaik, S.; Munjal, S.; Varma, A.; Sinha, S. Extending the Resource-Based View through the Lens of the Institution-Based View: A Longitudinal Case Study of an Indian Higher Educational Institution. J. Bus. Res. 2022, 147, 124–141. [Google Scholar] [CrossRef]
  48. Cui, L.; Wang, Z.; Liu, Y.; Cao, G. How Does Data-Driven Supply Chain Analytics Capability Enhance Supply Chain Agility in the Digital Era? Int. J. Prod. Econ. 2024, 277, 109404. [Google Scholar] [CrossRef]
  49. Jum’a, L.; Zighan, S.; Alkalha, Z. Influence of Supply Chain Digitalization on Supply Chain Agility, Resilience and Performance: Environmental Dynamism as a Moderator. J. Manuf. Technol. Manag. 2025, 36, 798–819. [Google Scholar] [CrossRef]
  50. Muafi, M.; Sulistio, J. A Nexus between Green Intellectual Capital, Supply Chain Integration, Digital Supply Chain, Supply Chain Agility, and Business Performance. J. Ind. Eng. Manag. 2022, 15, 275–295. [Google Scholar]
  51. Ferreira, J.J.; Fernandes, C.I.; Veiga, P.M. The Effects of Knowledge Spillovers, Digital Capabilities, and Innovation on Firm Performance: A Moderated Mediation Model. Technol. Forecast. Soc. Chang. 2024, 200, 123086. [Google Scholar] [CrossRef]
  52. Hayes, A.F. Introduction to Mediation, Moderation, and Conditional Process Analysis: A Regression-Based Approach; Guilford Publications: New York, NY, USA, 2017. [Google Scholar]
  53. Wang, J.; Feng, T. Supply Chain Ethical Leadership and Green Supply Chain Integration: A Moderated Mediation Analysis. Int. J. Logist. Res. Appl. 2022, 26, 1145–1171. [Google Scholar] [CrossRef]
  54. Calantone, R.; Whipple, J.M.; Wang, J.; Sardashti, H.; Miller, J.W. A Primer on Moderated Mediation Analysis: Exploring Logistics Involvement in New Product Development. J. Bus. Logist. 2017, 38, 151–169. [Google Scholar] [CrossRef]
  55. Aragón-Correa, J.A.; Sharma, S. A Contingent Resource-Based View of Proactive Corporate Environmental Strategy. AMR 2003, 28, 71–88. [Google Scholar] [CrossRef]
  56. Koç, E.; Delibaş, M.B.; Anadol, Y. Environmental Uncertainties and Competitive Advantage: A Sequential Mediation Model of Supply Chain Integration and Supply Chain Agility. Sustainability 2022, 14, 8928. [Google Scholar] [CrossRef]
  57. Tukamuhabwa, B.R.; Mutebi, H.; Mbatsi, A. Supply Chain Agility in Humanitarian Organisations: Examining the Role of Self-Organisation, Information Integration and Adaptability in South Sudan. J. Syst. Inf. Technol. 2024, 26, 528–561. [Google Scholar] [CrossRef]
  58. Zhu, Z.; Tang, X. Effect of Integration Capabilities with Channel Distributors on Supply Chain Agility in Emerging Markets: An Institution-Based View Perspective. J. Enterp. Inf. Manag. 2023, 36, 381–408. [Google Scholar] [CrossRef]
  59. Cantele, S.; Russo, I.; Kirchoff, J.F.; Valcozzena, S. Supply Chain Agility and Sustainability Performance: A Configurational Approach to Sustainable Supply Chain Management Practices. J. Clean. Prod. 2023, 414, 137493. [Google Scholar] [CrossRef]
  60. Hsieh, C.-C.; Chen, S.-L.; Huang, C.-C. Investigating the Role of Supply Chain Environmental Risk in Shaping the Nexus of Supply Chain Agility, Resilience, and Performance. Sustainability 2023, 15, 15003. [Google Scholar] [CrossRef]
  61. Meng, J.; Hao, Z.; Yang, J.; Hong, Y. How Does Digital Transformation Affect Organisational Sustainable Performance: The Mediating Roles of Supply Chain Agility and Integration. Int. J. Logist. Res. Appl. 2023, 1–26. [Google Scholar] [CrossRef]
  62. Liu, Y.; Guo, M.; Han, Z.; Gavurova, B.; Bresciani, S.; Wang, T. Effects of Digital Orientation on Organizational Resilience: A Dynamic Capabilities Perspective. J. Manuf. Technol. Manag. 2024, 35, 268–290. [Google Scholar] [CrossRef]
  63. Wang, X.; Liu, Z.; Lei, X. How Digital Orientation Promotes Digital Process Innovation from the Perspectives of Knowledge and Capability: Evidence from China. J. Knowl. Manag. 2024, 29, 259–280. [Google Scholar] [CrossRef]
  64. Elmouhib, S.; Idrissi, Z.Y. Agility in the Digital Era: Bridging Transformation and Innovation in Supply Chains. Sustainability 2025, 17, 3462. [Google Scholar] [CrossRef]
  65. Aloulou, W.J.; Alsadi, A.K.; Ayadi, F.M.; Alaskar, T.H. Exploring the Effects of Entrepreneurial and Digital Orientations on the Competitive Advantage of Saudi Firms: Is Strategic Agility the Missing Link? Adm. Sci. 2024, 14, 306. [Google Scholar] [CrossRef]
  66. Li, X.; Wang, R.; Nan, M.; Shi, Y. Research on the Impact of Green Supply Chain Integration on Enterprises’ Green Innovation. Sustainability 2025, 17, 2859. [Google Scholar] [CrossRef]
  67. Abbas, A.; Luo, X.; Shahzad, F.; Wattoo, M.U. Optimizing Organizational Performance in Manufacturing: The Role of IT Capability, Green Supply Chain Integration, and Green Innovation. J. Clean. Prod. 2023, 423, 138848. [Google Scholar] [CrossRef]
  68. Akhtar, F.; Wang, Q.; Huo, B. The Effect of Human Resource Strategy on Green Supply Chain Integration: The Moderating Role of Information Systems and Mutual Trust. Ind. Manag. Data Syst. 2023, 123, 2194–2215. [Google Scholar] [CrossRef]
  69. Khanuja, A.; Jain, R.K. The Mediating Effect of Supply Chain Flexibility on the Relationship between Supply Chain Integration and Supply Chain Performance. J. Enterp. Inf. Manag. 2022, 35, 1548–1569. [Google Scholar] [CrossRef]
  70. Parente, R.; Murray, J.Y.; Zhao, Y.; Kotabe, M.; Dias, R. Relational Resources, Tacit Knowledge Integration Capability, and Business Performance. J. Knowl. Manag. 2020, 26, 805–823. [Google Scholar] [CrossRef]
  71. Guo, X.; Xia, W.; Feng, T.; Sheng, H. Sustainable Supply Chain Finance Adoption and Firm Performance: Is Green Supply Chain Integration a Missing Link? Sustain. Dev. 2022, 30, 1135–1154. [Google Scholar] [CrossRef]
  72. Ramos, E.; Patrucco, A.S.; Chavez, M. Dynamic Capabilities in the “New Normal”: A Study of Organizational Flexibility, Integration and Agility in the Peruvian Coffee Supply Chain. Supply Chain Manag. Int. J. 2023, 28, 55–73. [Google Scholar] [CrossRef]
  73. Khan, S.A.R.; Razzaq, A.; Yu, Z.; Shah, A.; Sharif, A.; Janjua, L. Disruption in Food Supply Chain and Undernourishment Challenges: An Empirical Study in the Context of Asian Countries. Socio-Econ. Plan. Sci. 2022, 82, 101033. [Google Scholar] [CrossRef]
  74. Du, Y.; Hu, X.; Vakil, K. Systematic Literature Review on the Supply Chain Agility for Manufacturer and Consumer. Int. J. Consum. Stud. 2021, 45, 581–616. [Google Scholar] [CrossRef]
  75. Yang, Q.; Geng, R.; Jiang, Y.; Feng, T. Governance Mechanisms and Green Customer Integration in China: The Joint Effect of Power and Environmental Uncertainty. Transp. Res. Part E Logist. Transp. Rev. 2021, 149, 102307. [Google Scholar] [CrossRef]
  76. Rabal-Conesa, J.; Jiménez-Jiménez, D.; Martínez-Costa, M. Organisational Agility, Environmental Knowledge and Green Product Success. J. Knowl. Manag. 2021, 26, 2440–2462. [Google Scholar] [CrossRef]
  77. Kindermann, B.; Beutel, S.; de Lomana, G.G.; Strese, S.; Bendig, D.; Brettel, M. Digital Orientation: Conceptualization and Operationalization of a New Strategic Orientation. Eur. Manag. J. 2021, 39, 645–657. [Google Scholar] [CrossRef]
  78. Paramesha, M.; Rane, N.L.; Rane, J. Big Data Analytics, Artificial Intelligence, Machine Learning, Internet of Things, and Blockchain for Enhanced Business Intelligence. Partn. Univers. Multidiscip. Res. J. 2024, 1, 110–133. [Google Scholar] [CrossRef]
  79. Rupeika-Apoga, R.; Petrovska, K.; Bule, L. The Effect of Digital Orientation and Digital Capability on Digital Transformation of SMEs during the COVID-19 Pandemic. J. Theor. Appl. Electron. Commer. Res. 2022, 17, 669–685. [Google Scholar] [CrossRef]
  80. Bendig, D.; Schulz, C.; Theis, L.; Raff, S. Digital Orientation and Environmental Performance in Times of Technological Change. Technol. Forecast. Soc. Change 2023, 188, 122272. [Google Scholar] [CrossRef]
  81. Yang, Y.; Jiang, Y.; Chen, X. Does Buyers’ Financial Slack Promote or Inhibit Suppliers’ Circular Economy Performance? Ind. Mark. Manag. 2021, 99, 111–122. [Google Scholar] [CrossRef]
  82. Nayal, K.; Kumar, S.; Raut, R.D.; Queiroz, M.M.; Priyadarshinee, P.; Narkhede, B.E. Supply Chain Firm Performance in Circular Economy and Digital Era to Achieve Sustainable Development Goals. Bus. Strategy Environ. 2022, 31, 1058–1073. [Google Scholar] [CrossRef]
  83. ISO 14001; Environmental Management Systems-Requirements with Guidance for Use. ISO: Geneva, Switzerland, 2015.
  84. Altay, N.; Gunasekaran, A.; Dubey, R.; Childe, S.J. Agility and Resilience as Antecedents of Supply Chain Performance under Moderating Effects of Organizational Culture within the Humanitarian Setting: A Dynamic Capability View. Prod. Plan. Control 2018, 29, 1158–1174. [Google Scholar] [CrossRef]
  85. Khin, S.; Ho, T.C. Digital Technology, Digital Capability and Organizational Performance: A Mediating Role of Digital Innovation. Int. J. Innov. Sci. 2018, 11, 177–195. [Google Scholar] [CrossRef]
  86. Podsakoff, P.M.; MacKenzie, S.B.; Lee, J.-Y.; Podsakoff, N.P. Common Method Biases in Behavioral Research: A Critical Review of the Literature and Recommended Remedies. J. Appl. Psychol. 2003, 88, 879. [Google Scholar] [CrossRef]
  87. Lindell, M.K.; Whitney, D.J. Accounting for Common Method Variance in Cross-Sectional Research Designs. J. Appl. Psychol. 2001, 86, 114. [Google Scholar] [CrossRef]
  88. China, N. Statistical Communiqué of the People’s Republic of China on the 2014 National Economic and Social Development 2019. Available online: https://www.stats.gov.cn/english/PressRelease/201502/t20150228_687439.html (accessed on 16 February 2025).
  89. Huaon Industrial Research Institute. 2023–2028 Pharmaceutical Manufacturing Industry Market In-Depth Analysis and Development Strategy Research Report; 2023. Available online: https://www.huaon.com//channel/jingpin/841087.html#report_data (accessed on 16 February 2025).
  90. Hair, J.F., Jr.; Hult, G.T.M.; Ringle, C.M.; Sarstedt, M. A Primer on Partial Least Squares Structural Equation Modeling (PLS-SEM), 3rd ed.; Sage Publications: Thousand Oaks, CA, USA, 2023. [Google Scholar]
  91. Chavez, R.; Malik, M.; Ghaderi, H.; Yu, W. Environmental Collaboration with Suppliers and Cost Performance: Exploring the Contingency Role of Digital Orientation from a Circular Economy Perspective. Int. J. Oper. Prod. Manag. 2022, 43, 651–675. [Google Scholar] [CrossRef]
  92. Lin, T.-C.; Huang, S.-L.; Hsu, C.-J. A Dual-Factor Model of Loyalty to IT Product–The Case of Smartphones. Int. J. Inf. Manag. 2015, 35, 215–228. [Google Scholar] [CrossRef]
  93. Bougie, R.; Sekaran, U. Research Methods for Business: A Skill Building Approach; John Wiley & Sons: New York, NY, USA, 2019. [Google Scholar]
  94. Ziółkowska, M.J. Digital Transformation and Marketing Activities in Small and Medium-Sized Enterprises. Sustainability 2021, 13, 2512. [Google Scholar] [CrossRef]
  95. Cooper, D.; Schindler, P. Business Research Methods; The McGraw-Hill Companies: New York, NY, USA, 2014; p. 89. [Google Scholar]
  96. Wong, K.Y.; Aspinwall, E. An Empirical Study of the Important Factors for Knowledge-Management Adoption in the SME Sector. J. Knowl. Manag. 2005, 9, 64–82. [Google Scholar] [CrossRef]
  97. Lozano, L.M.; García-Cueto, E.; Muñiz, J. Effect of the Number of Response Categories on the Reliability and Validity of Rating Scales. Methodology 2008, 4, 73–79. [Google Scholar] [CrossRef]
  98. Xu, M.L.; Leung, S.O. Effects of Varying Numbers of Likert Scale Points on Factor Structure of the Rosenberg Self-Esteem Scale. Asian J. Soc. Psychol. 2018, 21, 119–128. [Google Scholar] [CrossRef]
  99. Hair, J.F.; Hult, G.T.M.; Ringle, C.M.; Sarstedt, M.; Castillo Apraiz, J.; Cepeda Carrión, G.; Roldán, J.L. Manual de Partial Least Squares Structural Equation Modeling (Pls-Sem); OmniaScience Scholar: Barcelona, Spain, 2019. [Google Scholar]
  100. Gergen, K.J. Psychological Science in a Postmodern Context. Am. Psychol. 2001, 56, 803. [Google Scholar] [CrossRef]
  101. Cain, M.K.; Zhang, Z.; Yuan, K.-H. Univariate and Multivariate Skewness and Kurtosis for Measuring Nonnormality: Prevalence, Influence and Estimation. Behav. Res. Methods 2017, 49, 1716–1735. [Google Scholar] [CrossRef]
  102. Ramayah, T.; Cheah, J.; Chuah, F.; Ting, H.; Memon, M.A. Partial Least Squares Structural Equation Modeling (PLS-SEM) Using smartPLS 3.0. An Updated Guide and Practical Guide to Statistical Analysis. 2018. Available online: https://www.researchgate.net/profile/Hiram-Ting/publication/341357609_PLS-SEM_using_SmartPLS_30_Chapter_13_Assessment_of_Moderation_Analysis/links/5ebc2be6a6fdcc90d674eb9c/PLS-SEM-using-SmartPLS-30-Chapter-13-Assessment-of-Moderation-Analysis.pdf (accessed on 15 January 2025).
  103. Sarstedt, M.; Hair, J.F., Jr.; Cheah, J.-H.; Becker, J.-M.; Ringle, C.M. How to Specify, Estimate, and Validate Higher-Order Constructs in PLS-SEM. Australas. Mark. J. 2019, 27, 197–211. [Google Scholar] [CrossRef]
  104. Sarstedt, M.; Ringle, C.M.; Hair, J.F. Partial Least Squares Structural Equation Modeling. In Handbook of Market Research; Springer: Berlin/Heidelberg, Germany, 2021; pp. 587–632. [Google Scholar]
  105. Henseler, J.; Ringle, C.M.; Sarstedt, M. A New Criterion for Assessing Discriminant Validity in Variance-Based Structural Equation Modeling. J. Acad. Mark. Sci. 2015, 43, 115–135. [Google Scholar] [CrossRef]
  106. Becker, J.-M.; Cheah, J.-H.; Gholamzade, R.; Ringle, C.M.; Sarstedt, M. PLS-SEM’s Most Wanted Guidance. Int. J. Contemp. Hosp. Manag. 2023, 35, 321–346. [Google Scholar] [CrossRef]
  107. Shmueli, G.; Ray, S.; Estrada, J.M.V.; Chatla, S.B. The Elephant in the Room: Predictive Performance of PLS Models. J. Bus. Res. 2016, 69, 4552–4564. [Google Scholar] [CrossRef]
  108. Ringle, C.M.; Wende, S.; Becker, J.-M. SmartPLS 4. Bönningstedt: SmartPLS. 2024. Available online: https://www.smartpls.com (accessed on 15 January 2025).
  109. Shmueli, G.; Sarstedt, M.; Hair, J.F.; Cheah, J.-H.; Ting, H.; Vaithilingam, S.; Ringle, C.M. Predictive Model Assessment in PLS-SEM: Guidelines for Using PLSpredict. Eur. J. Mark. 2019, 53, 2322–2347. [Google Scholar] [CrossRef]
  110. Henseler, J.; Dijkstra, T.K.; Sarstedt, M.; Ringle, C.M.; Diamantopoulos, A.; Straub, D.W.; Ketchen, D.J., Jr.; Hair, J.F.; Hult, G.T.M.; Calantone, R.J. Common Beliefs and Reality about PLS: Comments on Rönkkö and Evermann (2013). Organ. Res. Methods 2014, 17, 182–209. [Google Scholar] [CrossRef]
Figure 1. Proposed research framework.
Systems 13 00388 g001
Figure 2. Disjoint two-stage approach.
Systems 13 00388 g002
Figure 3. Moderating effect of DO on SCA → sustainable performance relationship.
Systems 13 00388 g003
Figure 4. Process model 58.
Systems 13 00388 g004
Figure 5. Managerial Roadmap.
Systems 13 00388 g005
Table 1. Constructs/Items used in the research questionnaire.
ConstructDefinitionItem
Green Internal IntegrationGreen Internal Integration enhances cross-departmental cooperation, facilitates employee involvement in environmental initiatives, and advances environmental capabilities [23].GII1Senior and middle managers of our enterprise are committed to green supply chain management.
GII2Cross-functional cooperation in our enterprise for environmental improvements
GII3Environmental issues are well communicated among departments in our enterprise.
GII4Environmental compliance and auditing programs are implemented in our enterprise.
GII5Environmental knowledge is accumulated and shared across departments in our enterprise.
GII6An environmental management system exists in our enterprise
Green Supplier IntegrationGreen Supplier Integration means that during upstream procurement and operations, firms assist suppliers in complying with environmental protection requirements [23].GSI1Our enterprise collaborates with suppliers to set up environmental goals.
GSI2Our enterprise implements environmental audits for suppliers’ internal management.
GSI3Our enterprise provides suppliers with environmental design requirements related to design specifications and cleaner production technology.
GSI4Our enterprise requires suppliers to implement environmental management or obtain third-party certification for the environmental management system (e.g., ISO 14001 [83])
GSI5Our enterprise selects suppliers according to environmental criteria
Green Customer IntegrationGreen Customer Integration refers to maintaining positive relationships and cooperating with downstream customers to ensure that manufacturing, distribution, and marketing conform to environmental regulations [23].GCI1Our enterprise achieves environmental goals through joint planning with customers.
GCI2Our enterprise cooperates with customers to reduce the environmental impact of our products.
GCI3Our enterprise cooperates with customers for cleaner production, green packaging, and other environmental activities.
Environmental PerformanceEnvironmental performance is about reducing environmental damage and protecting resources from exploitation [20].EP1Our enterprise has reduced air emissions/wastewater/solid waste
EP2Our enterprise has reduced the consumption of hazardous/harmful/toxic materials
EP3Our enterprise has decreased the frequency of environmental accidents
EP4Our enterprise has improved compliance with environmental standards
EP5Our enterprise has minimized the environmental impact of its activities
EP6Our enterprise has conducted regular environmental audits
Economic PerformanceEconomic performance (EP) is defined by finance-based indicators such as profits, sales growth, return on assets, equity, and investment return [20].FP1Our enterprise’s profits have improved
FP2Our enterprise’s sales have grown
FP3Our enterprise’s return on investment has increased
FP4Our enterprise’s return on equity has grown
FP5Our enterprise’s return on assets has increased
Social PerformanceSocial performance is about firms’ corporate social responsibility awareness [20].SP1Our enterprise has improved the living quality of the surrounding community
SP2Our enterprise has improved the workers’ occupational health and safety
SP3Our enterprise has improved the job satisfaction levels of employees
SP4Our enterprise has improved the relationship with the community and stakeholders
SP5Our enterprise has encouraged skills development for employees
Supply Chain AgilitySupply chain agility is the ability of the firm to sense short-term, temporary changes in the supply chain and external environment and to rapidly respond to those changes with the existing supply chain [84].SCA1Our enterprise can quickly detect changes in our environment
SCA2Our enterprise can quickly identify opportunities in its environment
SCA3Our enterprise can quickly sense threats in its environment
SCA4Our enterprise continuously collects information from suppliers
SCA5Our enterprise makes quick decisions to deal with changes in the environment
SCA6Our enterprise can adjust our supply chain operations to the extent necessary to execute our decisions.
SCA7Our enterprise can increase its short-term capacity as needed
SCA8Our enterprise can adjust the specification of orders as requested by our partners
Digital OrientationDigital orientation refers to a company’s strategic positioning in applying digital technologies to provide innovative products, services, and solutions. It is also the key for traditional manufacturing enterprises to overcome cognitive biases and move towards a digital system [85].DO1Our enterprise is committed to using digital technologies (e.g., IoT, artificial intelligence, advanced robotics, machine learning, and big data) in developing our new products and services
DO2The products and services of our enterprise benefit from advanced digital technologies
DO3New digital technologies are readily accepted in our enterprise
DO4Our enterprise continuously searches for opportunities to use digital technology to remain innovative
Marker Variable (Cognitive Rigidity)A marker variable is a technique in statistical analysis that assumes the source of method variance as a covariate [86]. The marker variable can be selected from the variables in the study by choosing the one with the lowest correlation; however, it is also recommended to include a scale that is theoretically unrelated to the study [87].MV1Once our enterprise comes to a conclusion, we are not likely to change our mind
MV2Our enterprise doesn’t change our mind easily
MV3Our enterprise views are very consistent over time
Table 2. Demographic Profile.
CharacteristicFrequencyPercentage
No. of employees
Less than or equal to 1003811.4
101–50010832.5
501–100010331.0
Above 10003911.7
Work Tenure
Less than or equal to 3 years144.9
3–5 years9432.6
6–10 years8930.9
Above ten years9131.6
Education level
College226.6
Undergraduate22969.0
Postgraduate3711.1
Ownership type
Nationalized business5115.4
Foreign-funded enterprises13841.6
Sino-Foreign Joint Ventures5817.5
Private enterprise4112.3
Enterprise Tenure
Less than or equal to 5 years82.7
6–10 years8529.6
11–15 years11740.6
Above 15 years7827.1
Current Department
Administration Department257.5
Finance Department144.2
Personnel Department4513.6
Marketing Department9027.1
Logistics Department278.1
Procurement Department288.4
Sales Department5917.8
Current Position
Chairman of the Board82.4
CEO82.4
General Manager4313.0
Deputy General Manager9729.2
Director9829.5
Manager3410.2
Table 3. Common method variance testing using marker variable (MV).
Baseline Model (Without Marker Variable)Method Factor Model (with Marker Variable)
RelationshipPath Coefficientp-ValuesRemarksPath Coefficientp-ValuesRemarks
GSCI -> Sustainable performance0.487p < 0.001Supported0.483p < 0.001Supported
GSCI -> SCA0.407p < 0.001Supported0.400p < 0.001Supported
SCA -> Sustainable performance0.220p < 0.001Supported0.211p < 0.001Supported
GSCI -> SCA -> Sustainable performance0.089p < 0.001Supported0.0840.001Supported
DO x GSCI -> SCA−0.0070.866Not Supported−0.0120.764Not Supported
DO x SCA -> Sustainable performance0.1490.001Supported0.1480.001Supported
R2R2
SCA0.4340.438
Sustainable performance0.5040.511
Table 4. Results Summary for Reflective Measurement Models.
ConstructItemsLoadingsAVECR
1st-Order2nd-Order
Green Internal Integration GII10.7960.6320.911
GII20.806
GII30.811
GII40.765
GII50.811
GII60.778
Green Supplier Integration GSI10.8380.6630.908
GSI20.817
GSI30.794
GSI40.824
GSI50.863
Green Customer Integration GCI10.8630.7070.878
GCI20.882
GCI30.775
Green Supply Chain IntegrationGreen Internal Integration0.7900.5970.816
Green Supplier Integration0.734
Green Customer Integration0.792
Environmental Performance EP10.8070.6180.907
EP20.730
EP30.778
EP40.765
EP50.785
EP60.849
Economic Performance FP10.7980.6430.900
FP20.788
FP30.864
FP40.778
FP50.778
Social Performance SP10.7760.6490.902
SP20.803
SP30.876
SP40.778
SP50.793
Sustainable PerformanceEnvironmental Performance0.8020.7270.889
Economic Performance0.846
Social Performance0.908
Supply Chain Agility SCA10.7560.5730.915
SCA20.748
SCA30.732
SCA40.806
SCA50.816
SCA60.707
SCA70.730
SCA80.757
Digital Orientation DO10.8080.6810.895
DO20.819
DO30.864
DO40.807
Table 5. Discriminant Validity (HTMT).
Constructs1234
1. DO
2. GSCI0.469
3. SCA0.6130.707
4. Sustainable Performance0.4840.8750.619
Table 6. Hypotheses Testing.
HypothesisRelationshipStd. BetaStd. Devt-Valuep-ValuePCI LLPCI ULSupported
H1GSCI → Sustainable performance0.4870.04910.006p < 0.0010.3870.578Yes
H2GSCI → SCA 0.4070.0459.116p < 0.0010.3150.490Yes
H3SCA → Sustainable performance0.2200.0573.888p < 0.0010.1110.331Yes
H4GSCI → SCA → Sustainable performance0.0890.0253.566p < 0.0010.0440.143Yes
H5DO x GSCI → SCA−0.0070.0390.1690.866−0.0800.073No
H6DO x SCA → Sustainable performance0.1490.0453.3530.0010.0620.236Yes
Table 7. PLS-Predict.
Measurement VariableQ2 predictPLS-SEM_RMSELM_RMSEIA_RMSEPLS-LM_RMSEPLS-IA_RMSE
EP0.2320.8800.8981.004−0.018−0.124
FP0.2580.8650.8721.004−0.007−0.139
SP0.4760.7270.7401.004−0.013−0.277
Model fit (SRMR) Std. Beta
Saturated Model0.059
Estimated Model0.060
Table 8. Moderated Mediation.
Conditional indirect effect
Conditional MediationEffectSE.Boot 95% CI
LLUL
GSCI → SCA → sustainable performance DO at +1 SD0.1550.0400.0830.239
GSCI → SCA → sustainable performance DO at Mean0.0980.0280.0460.158
GSCI → SCA → sustainable performance DO at −1 SD0.0290.033−0.0380.093
Pairwise contrasts between conditional indirect effects (Effect1 minus Effect2)
Effect1Effect2ContrastBootSEBootLLCIBootULCI
GSCI → SCA → sustainable performance (Moderated by DO)0.0980.0290.0690.0230.0270.116
0.1550.0290.1250.0440.0450.218
0.1550.0980.0560.0230.0160.105
Disclaimer/Publisher’s Note: The statements, opinions and data contained in all publications are solely those of the individual author(s) and contributor(s) and not of MDPI and/or the editor(s). MDPI and/or the editor(s) disclaim responsibility for any injury to people or property resulting from any ideas, methods, instructions or products referred to in the content.

