1. Introduction
The relationship between industrial development and innovation has long been a central focus for policymakers and economists. How do industrial policies affect innovation activities? The majority of papers focus on Research and Development (R&D) activities in private firms [
1,
2,
3,
4], but limited attention has been paid to the role of public research sectors [
5]. As a critical component of the national innovation system, universities significantly contribute to industrial innovation and economic growth [
6,
7,
8]. Akcigit et al. [
9] demonstrate that universities contribute to policy effectiveness via public knowledge spillovers. However, this contribution requires alignment between academic research agendas, industrial needs, and policy priorities.
However, there is a disjunction between the universities’ research output and industrial development in China [
10,
11]. On the one hand, public R&D resources remain heavily skewed toward public research sectors; in 2022, they received 80.07% of government R&D funding, compared to 10.47% for private sectors. On the other hand, the “Ivory Tower” nature of academic research makes it difficult to commercialize [
12]. Therefore, the extent to which universities align with industrial initiatives and market demands is critical for industrial development. However, this issue remains underexplored in the literature. In this article, we aim to fill this gap by studying the causal relationship between industrial initiatives and university innovation. This paper identifies regionally preferred and non-preferred industries based on provincial Five-Year Plans (FYPs): the most comprehensive and high-level economic interventions in China. As these industries are selected according to industrial development needs rather than targeting specific universities, they can be regarded as an exogenous shock to academic innovation. FYPs serve as key policy signals, guiding government R&D funding allocations and industry–academia collaboration, thereby influencing universities’ innovation outcomes. Using university–industry patent data, we construct a difference-in-differences (DiD) model to examine the impact of provincial FYPs on university innovation.
Empirical results show that industrial initiatives significantly increase university patent outputs. Public R&D funding and industrial Science and Technology (S&T) demand are key mechanisms driving this effect. The effect is more salient among central universities, high-R&D-capacity universities, and high-tech industries. Furthermore, regional industrial comparative advantage and university technology transfer capability can amplify the innovation-enhancing effects. Finally, we find that university innovation outputs strengthen policy effectiveness in promoting industrial development, further underscoring the significance of our study. The contributions of this study are threefold:
- (1)
Theoretical contributions. We bridge industrial policy and university innovation by integrating China’s decentralized policymaking and universities’ administrative embeddedness. We identify market-pull effects and government-push effects as key transmission channels.
- (2)
Empirical innovations. Leveraging regional variations in industrial preferences, we provide the first micro-level empirical evidence on how localized industrial policies reshape academic innovation. Our findings reveal a “triple-helix” synergy that drives regional competitiveness.
- (3)
Policy implications. Grounded in public R&D knowledge spillovers, we identify determinants of policy efficacy. These findings advocate the synergy between localized industrial policy and academic strengths.
The rest of the paper is organized as follows.
Section 2 presents a literature review and theoretical analysis.
Section 3 provides an overview of China’s FYPs and government stewardship of Chinese universities.
Section 4 introduces the identification strategy and data.
Section 5 presents the empirical results.
Section 6 and
Section 7 show the mechanisms and heterogeneity test.
Section 8 presents further analysis.
Section 9 concludes.
2. Literature Review and Theoretical Analysis
2.1. Literature Review
2.1.1. The Impact of Industrial Policy on Innovation
The relationship between industrial policy and innovation remains debated. Proponents justify R&D subsidies by emphasizing the externalities in private-sector innovation [
3,
4,
13]. Given these externalities, market investment often falls below the socially optimal level [
14,
15,
16], justifying government intervention through industrial policy. Myers and Lanahan [
4] find that R&D subsidies can boost innovation outputs across spatial and industrial boundaries through spillover effects.
Critics, however, emphasize that information asymmetry complicates governments’ ability to identify high-efficiency firms, potentially inducing strategic innovation behavior and rent-seeking [
2,
9]. Acemoglu et al. [
1] demonstrate that misallocated subsidies to low-efficiency firms reduce social welfare. Chen et al. [
2] find that firms may relabel non-R&D expenses as R&D to obtain subsidies, leading to misallocation of R&D resources.
Existing studies predominantly focus on firms. However, in China’s context—where many enterprises lack basic research capacities—universities serve as critical hubs for breakthrough technologies [
17]. As the primary contributors to basic research, universities’ role in industrial innovation remains underexplored. This paper addresses this gap by investigating how industrial policy shapes university-driven innovation, thereby enriching our understanding of policy mechanisms in fostering innovation ecosystems.
2.1.2. Determinants of University Innovation
Differences in goals lead to distinct innovation incentive mechanisms between universities and enterprises. Existing studies identify three primary drivers of university innovation: First, research funding. Hu [
18] exploits a quasi-natural experiment from China’s 2011 National Natural Science Foundation funding expansion, demonstrating that increased basic research grants stimulate researcher productivity and collaboration. Babina et al. [
19,
20] distinguish funding sources in the U.S.: federal grants enhance high-tech entrepreneurship and academic publications but discourage patenting and commercialization, whereas industry funding shows the opposite effects. Second, incentive structures. Performance-linked reward systems significantly boost university innovation outputs [
21,
22,
23]. Evaluation policies also matter; Xu [
24] and Liang et al. [
25] find that emphasizing internationalization versus local relevance in assessment criteria differentially shapes publication patterns. Third, industry–university collaboration. University partnerships with firms provide funding, equipment, engineering expertise, and applied research insights [
26,
27], enabling specialization in upstream R&D activities [
28] that elevate academic innovation productivity.
Prior work focuses on internal academia policies and market mechanisms, overlooking industrial policy’s role. Under China’s hierarchical university governance structure, research agendas are influenced by economic objectives. This paper examines how industrial policy shapes university innovation through industrial priority, offering novel insights into policy-driven academic ecosystems.
2.2. Theoretical Analysis
A central objective of FYPs is to establish an advanced modern industrial system and upgrade the industrial structure, with innovation serving as the primary driver of progress. However, due to the externality of innovation, private-sector R&D investments often fall below the socially optimal level [
14]. Additionally, Chinese private firms exhibit limited internal R&D capabilities [
17]. These limitations render private actors inadequate for achieving rapid technological breakthroughs independently, necessitating enhanced university–industry (UI) collaboration, which is a strategy extensively used in developing economies [
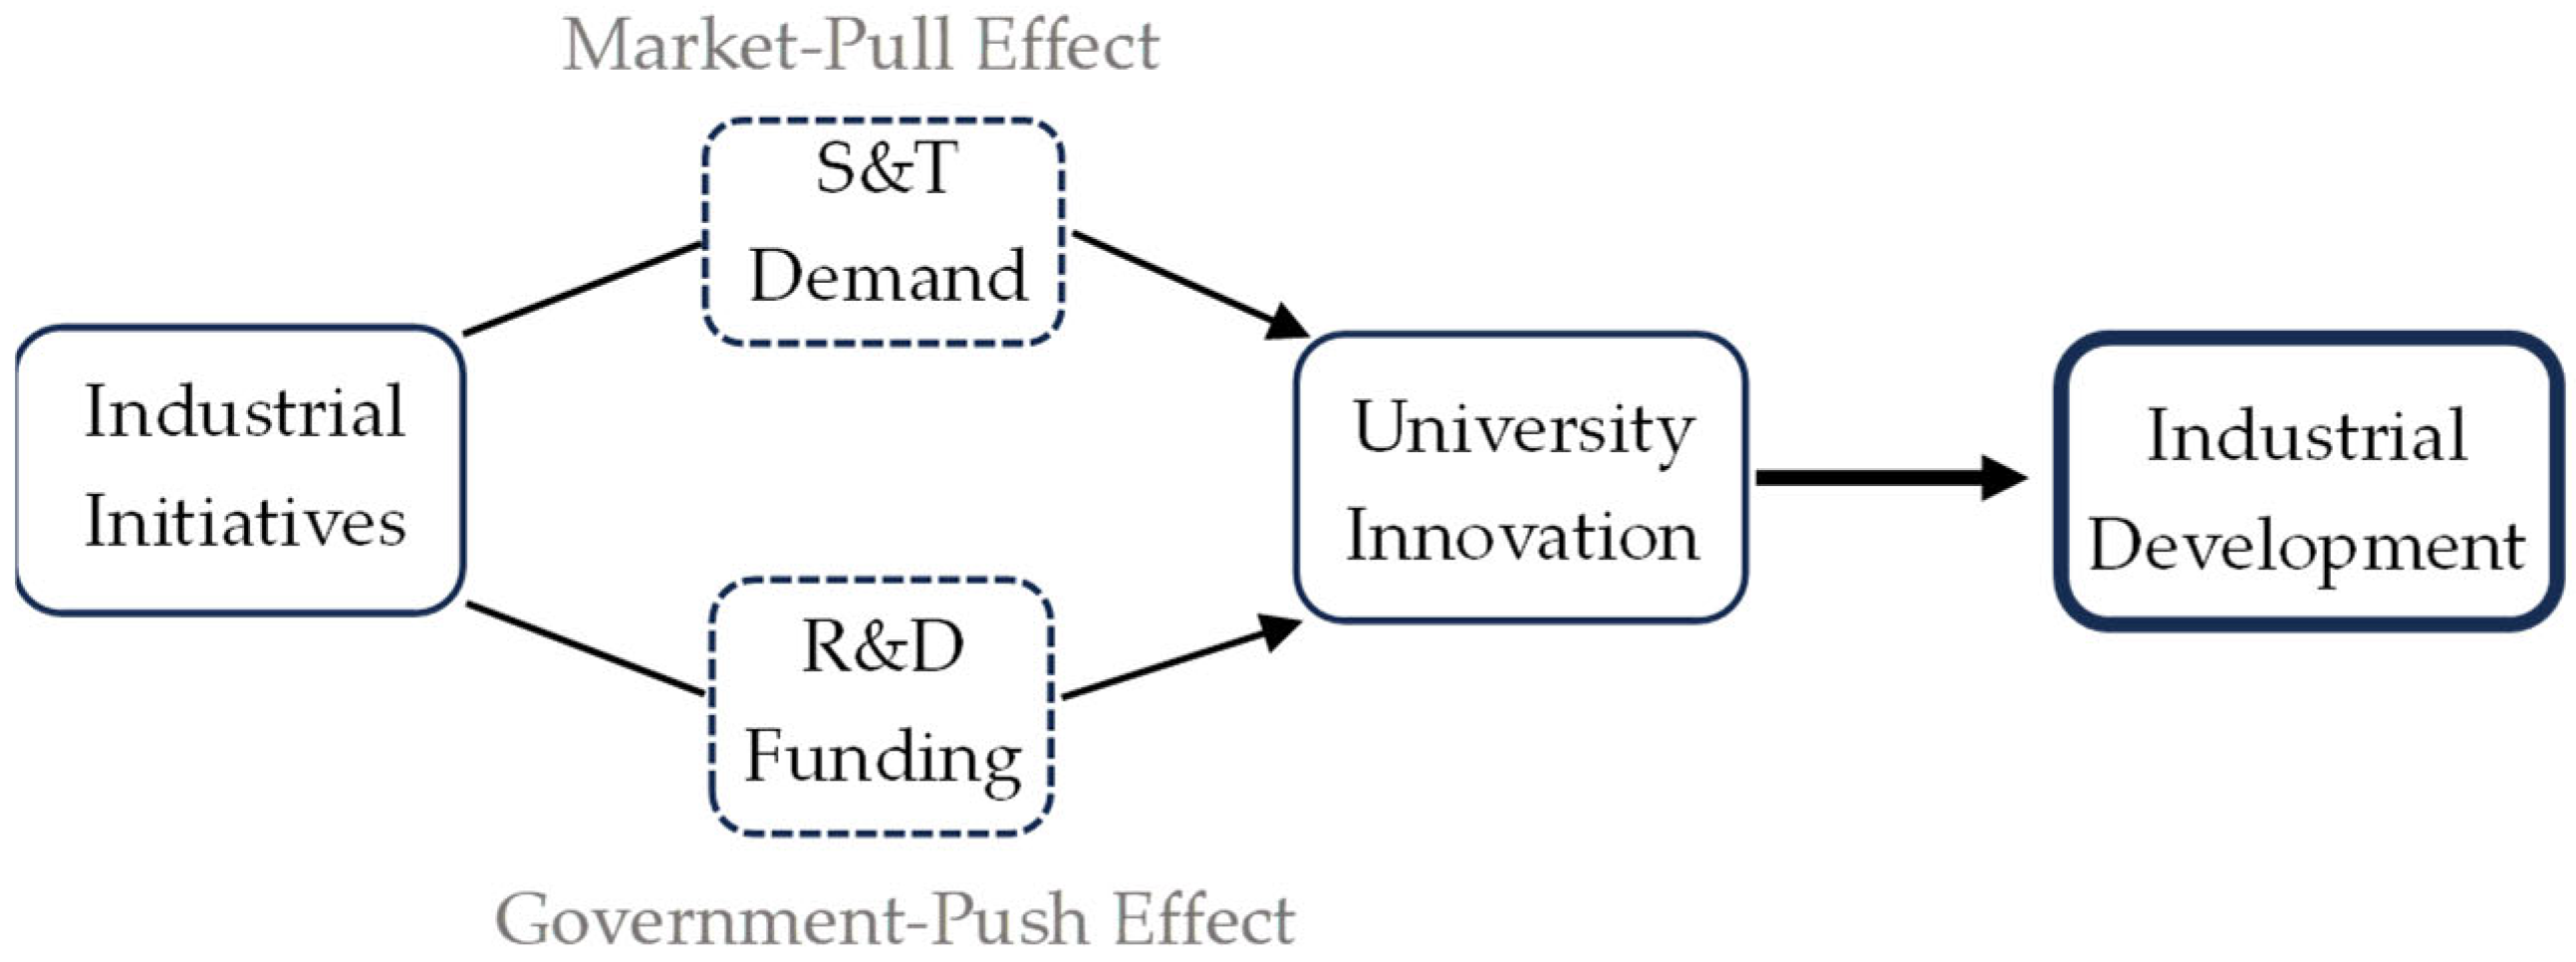
29]. Chinese universities are institutionally mandated to serve national strategic priorities and foster regional economic development. The FYPs emphasize that universities should advance scientific technology and cultivate talent to support industrial innovation. As a strategic policy signal, FYPs influence both government R&D funding priorities and firms’ industry–university research collaboration decisions, thereby affecting universities’ innovation output.
Hypothesis 1 (H1). Industrial initiatives enhance innovation output at universities in related fields.
Industrial policies stimulate social innovation demand by enhancing firms’ incentives through R&D subsidies, tax incentives and market demand expansion [
3,
4]. This policy-induced demand includes both firms’ internal R&D and public-sector innovation services, particularly those provided by universities. Universities produce basic research characterized by frontier exploration, novelty, and public good attributes, serving as critical inputs for firms’ technology development and commercialization [
9,
30]. Specifically, firms’ demand for academic innovation services manifests in two dimensions.
First, technology transfer. University-to-industry technology transfer creates direct financial incentives for researchers. This not only alleviates academic funding constraints but also stimulates research commercialization efforts [
19]. Second, UI collaboration. These partnerships grant universities access to essential innovation resources: capital, specialized equipment, technical expertise, and talent [
26,
27]. Such collaborations facilitate functional specialization, enabling universities to concentrate on basic research breakthroughs, and thereby enhance research productivity [
28].
Hypothesis 2 (H2). Market-Pull Effect: Industrial initiatives increase enterprises’ demand for university S&T services, thereby enhancing innovation output at universities in related fields.
University research output has quasi-public good characteristics, leading to heavy public funding reliance [
4]. China’s institutional framework reinforces this reliance: the government is both the primary administrative body and dominant research funder for most universities, imbuing them with a distinct public ownership orientation. Therefore, government priorities influence university innovation by leveraging academic institutions as policy instruments for industrial upgrading [
31]. Specifically, cross-regional heterogeneity in industrial initiatives contributes to geographical variations in universities’ R&D focuses.
FYPs guide government R&D investments in priority fields via institutions like the NSFC. For example, the NSFC aligns its funding cycles with FYPs to target specific industries and operationalize policy goals. For instance, the NSFC formulates its five-year cycles in accordance with FYPs, specifying funding priorities and implementation frameworks. This targeted funding influences universities’ research outcomes [
5]. Consequently, the industrial initiatives can enhance innovation outputs in relevant fields at universities through public R&D funding.
Hypothesis 3 (H3). Government-Push Effect: Industrial initiatives increase government R&D funding, thereby enhancing innovation output at universities in related fields.
The mechanism analysis diagram is shown below (
Figure 1).
3. Background
3.1. Systemic Coordination of FYPs in Industrial Development
Industrial policies are commonly implemented in both developing and developed economies. Economic development remains the ultimate goal for policymakers, with innovation serving as the indispensable path to this end, such as the U.S. “CHIPS and Science Act” and Germany’s “Industry 4.0”. In China, the central and provincial governments release Five-Year Plans for Social and Economic Development (FYPs) every five years. These plans place a strong emphasis on industrial development and technological innovation, serving as the highest-level policy framework for economic governance [
32,
33,
34].
The FYPs’ industrial initiatives emphasize innovation-driven development. While selecting key industries, the FYPs specify corresponding technological roadmaps. For example, the 12th FYP emphasized strategic emerging industries (SEIs) as focal points for industrial advancement and S&T breakthrough (see
Appendix A1 for details). This synergy between industry and S&T, a key feature of China’s industrial policy [
35], is embedded in the FYP system. By designating key industries for the next five years, FYPs systematically guide public resource allocation and private investments [
5,
36].
The national FYP’s implementation operates through a systemic governance framework. Vertically, local governments play a critical role in policy implementation. Provincial governments retain some leeway to adjust industrial plans within the national FYP framework. Horizontally, inter-ministerial coordination is essential. In line with the national FYP, ministries such as the Ministry of Science and Technology and the Ministry of Education formulate sector-specific FYPs (see
Appendix A1 for details).
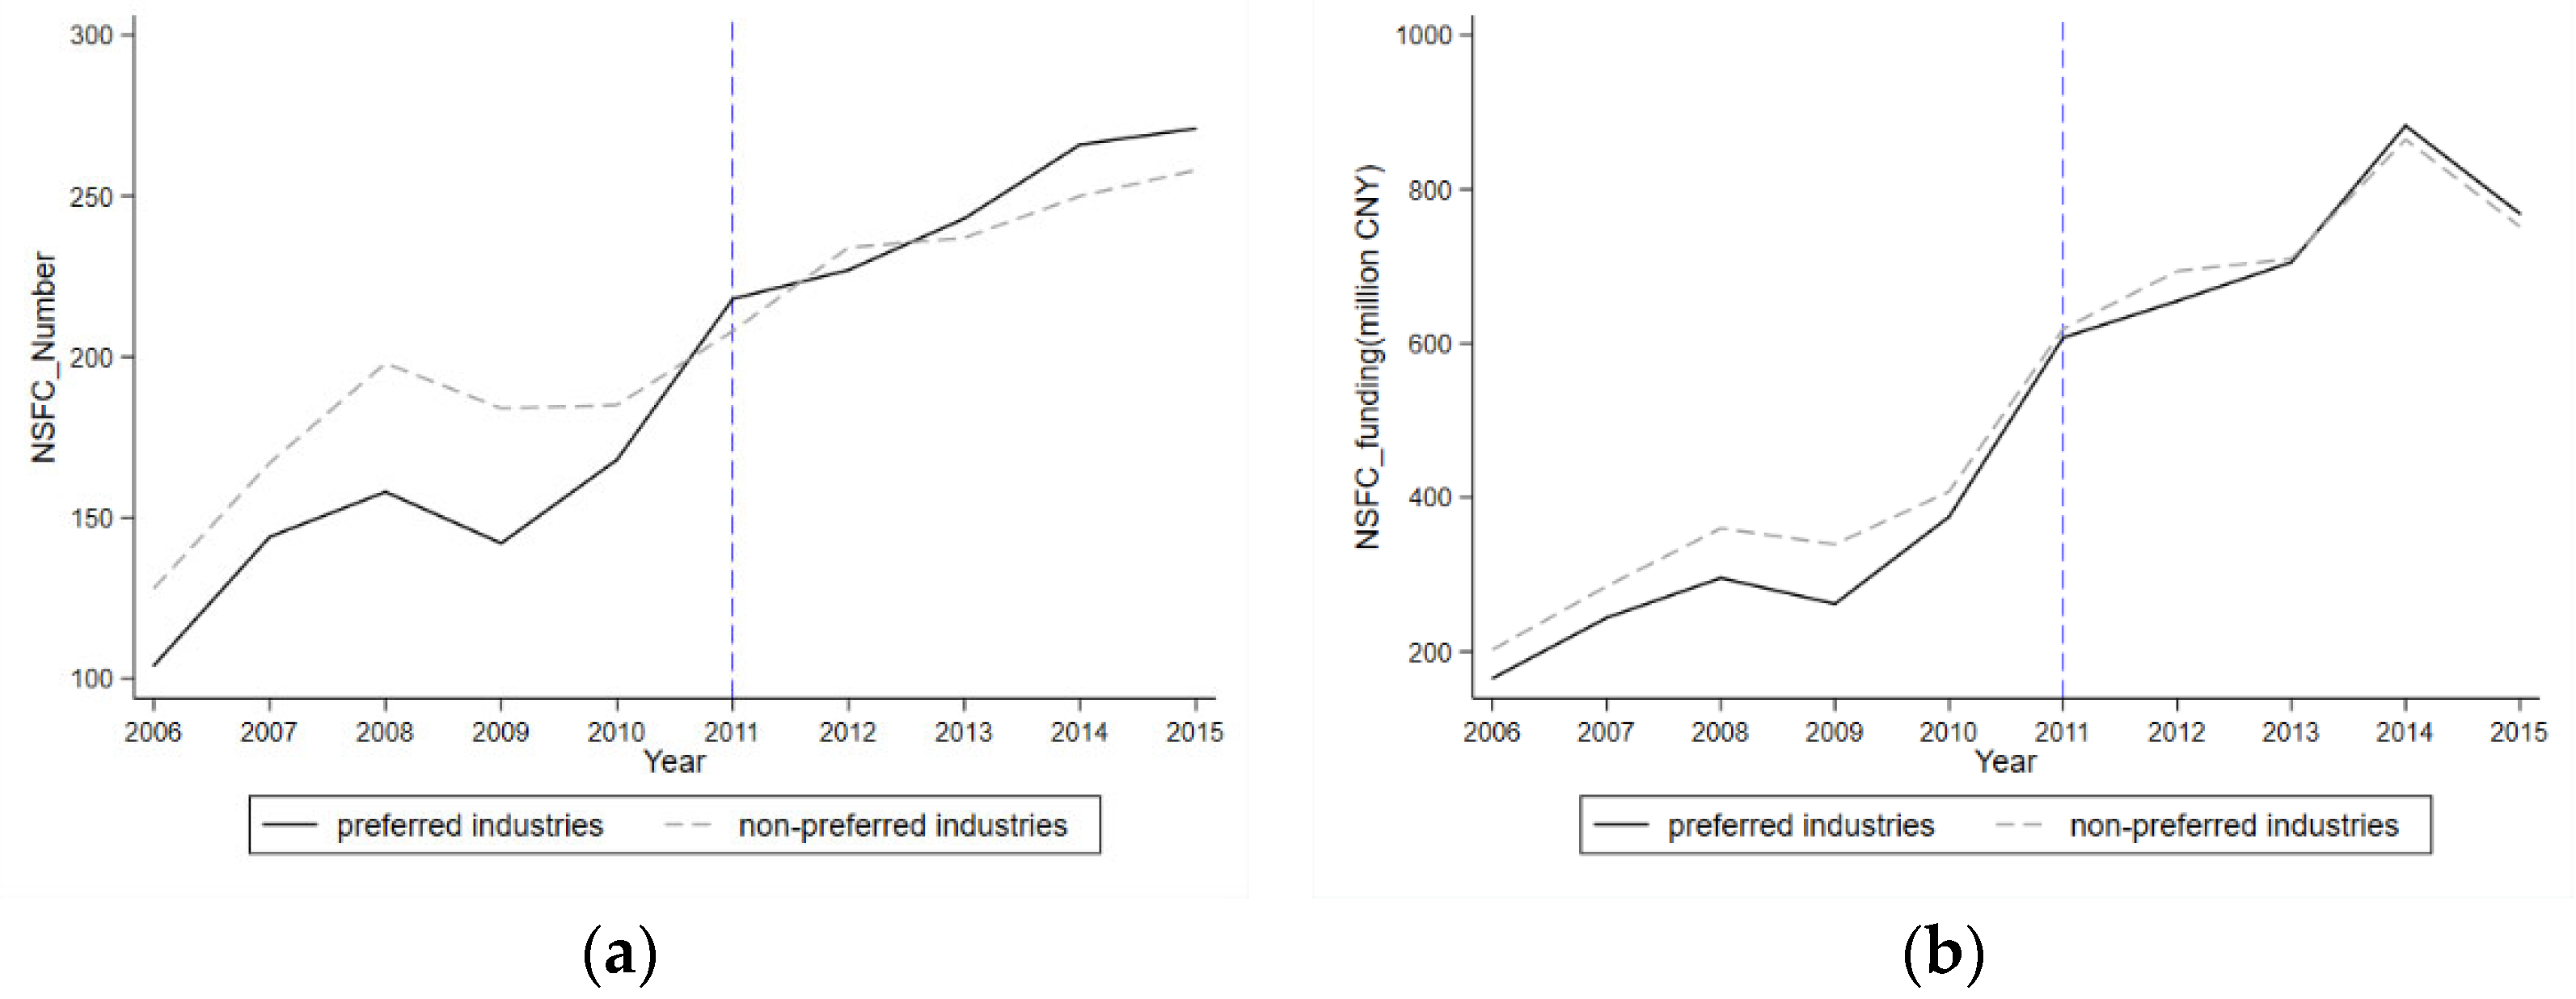
We examined research grants allocated by the National Natural Science Foundation of China (NSFC) during the 11th and 12th FYP periods. Focusing on policy-driven resource allocation, we compare preferred industries (preferred in the 12th FYP but not the 11th) with non-preferred industries (excluded from both FYPs).
Figure 2 demonstrates a significant rise in scientific funding for preferred industries during the 12th FYP period. This evidence underlines the complexity of industrial policymaking in China, which may generate unintended spillover effects on public basic research.
3.2. Government Stewardship of Chinese Universities
The administrative system of Chinese public universities is part of the national administrative system [
37], with their institutional mission being embedded within national economic development. Serving industrial development has always been one of Chinese universities’ missions, dating back to the industry-administered pattern under the planned economy era. For example, Beijing Jiaotong University was operated under the Ministry of Railways, and the University of Science and Technology Beijing was governed by the Ministry of Metallurgical Industry. Their core mandate was to cultivate specialized personnel and develop technologies tailored to these sectors. During this period, industry–academia collaboration remained deeply embedded within the administrative system, with state-owned firms playing substantial roles in shaping academic programs and R&D activities.
Since the educational reform of the 1980s, Chinese universities have operated independently, while the government still retains influence. As the administrative authority for 68.52% of undergraduate institutions (public sector share, including central and local government departments, Ministry of Education of China (MOE) 2023), the government retains control over leadership appointments and funding allocations (59.65% of R&D funding from government sources, MOE 2023). As the primary force of basic research, universities function as strategic instruments for government to foster industrial innovation competitiveness. Consequently, the government’s priorities may influence universities’ innovation activities.
4. Empirical Strategy
4.1. Estimating Equation
This paper is based on the preferred industries of the 11th FYP (covering 2006 to 2010) and the 12th FYP (covering 2011 to 2015), issued by each province as an entry point to estimate the effect of preferred industrial initiatives on university innovation. This study focuses on local FYPs for two reasons. First, local governments act as primary implementers of industrial policies, where regional variations in industrial preferences generate multidimensional analytical dimensions. Second, local governments serve as the main governing bodies (approximately 95.63%, MOE 2023) and funders of Chinese higher education institutions (approximately 52.68%, MOE 2023). Our empirical strategy leverages variation in province-specific policies. The multi-dimensional fixed-effects model is as follows:
where
i,
j,
p, and
t represent university, industry, province, and year, respectively; the dependent variable
Y features patent output at the university–industry-year level (in natural logarithms);
prefer is a dummy variable to indicate whether industry
j in province
p and year
t is a preferred industry. We focus on
β1, the estimated coefficient capturing the causal effect of industrial initiatives on university innovation, as posited in Hypothesis 1.
To address potential confounders, we incorporate two sets of fixed effects. First, university–year fixed effects (
μit) absorb university–level heterogeneity, including time-invariant characteristics (e.g., historical legacy and administrative affiliation) and time-varying features (e.g., technology transfer policies and higher education reforms). Notably, given that the city of a university’s main campus remains unchanged during the sample period, these fixed effects also absorb regional heterogeneity, such as local higher education policy, innovation policy, and local economic development levels. Second, industry–year fixed effects (
θjt) absorb national industrial policy shocks, including central government’s preferences in national FYPs, which act as an important determinant of the provincial FYPs [
34]. We cluster standard errors at the province–industry level.
Equation (1) can be considered as a generalized DiD model. However, this approach may result in the control groups being affected by FYPs during the sample period, raising identification issues. To further address endogeneity concerns, we employ the standard DiD approach as a robustness check. The DiD regression takes the form
The treatment and control groups are defined as follows: if an industry is not preferred in either the provincial 11th FYP or the 12th FYP, it is assigned to the control group with Treat = 0. If an industry is preferred only in the 12th FYP, it is assigned to the treatment group with Treat = 1. Post is a dummy variable equal to 1 in 12th FYP implementation period (2011 or later) and zero otherwise. Fixed effects and other specifications remain consistent with those in Equation (1). Note that university–year fixed effects absorb Post term.
4.2. Variables
Dependent variable: We measure university innovation using invention patent applications. First, each patent is mapped to its corresponding three-digit industry using the Chinese Industrial Classification–International Patent Classification (CIC–IPC) concordance table published by the China National Intellectual Property Administration (CNIPA). We then aggregate patent counts by industry–university–year and take the logarithm after plus one (i.e., ln (number of invention patents + 1)). Our analysis covers all innovations within the manufacturing sector, spanning a broad range of technical fields, including biology, chemistry, metallurgy, transportation, textiles, papermaking, physics, construction, electronics, etc.
Core explanatory variable: The dummy variable is whether the industry is identified as preferred for a certain provincial FYP. In the formal documents of the FYPs, the Chinese government uses some keywords to express preferences regarding favored industries. The keywords include “mainly develop”, “vigorously develop”, “prioritize”, “enlarge and strengthen”, “pillar industries”, “priority industries” [
34,
36]. Only those industries to which any of these keywords explicitly referred are identified as preferred industries. A three-digit industry code is assigned 1 if identified as a preferred industry during the planning period, and 0 otherwise.
It is noteworthy that SEIs, such as new materials, highlighted in the 12th FYP, often lack direct alignment with preexisting three-digit categories under the CIC system. To resolve this ambiguity, we establish a mapping between SEIs and the CIC system using the Strategic Emerging Industry Classification published by the National Bureau of Statistics. Furthermore, patents associated with SEIs are classified using the Strategic Emerging Industry Classification–International Patent Classification Concordance Table, ensuring alignment between industrial policy priorities and innovation metrics.
4.3. Data
Data on the preferred industries are extracted from the central and provincial FYPs (from the 11th to the 12th, covering the period 2006 to 2015) published on the official websites of the Development and Reform Commission. We restrict the sample to manufacturing industries, as they are the primary focus of industrial incentives in China’s FYPs. Our sample includes 177 three-digit manufacturing sectors.
We focus on academic higher education institutions rather than higher vocational colleges, as the former place greater emphasis on research activities rather than teaching. Detailed patent information is obtained from the CNIPA. Firm-level data is from the Chinese industrial enterprises database, which records the input and output data of manufacturing enterprises above scale from 1998–2015. Industry codes are adjusted in accordance with the 2002 edition of the CIC to standardize industry classification criteria.
During the sample period, instances of university renaming and mergers are identified. To ensure consistency, data are cross-verified against official announcements from the MOE and supplemented by manual verification. Institutions with discontinuous operation across the entire observation period are excluded, resulting in a final sample of 743 universities.
Table 1 shows the main variables and descriptive statistics.
5. Effects of Industrial Initiatives on Patent Output
5.1. Main Results
The baseline results are presented in
Table 2. Columns (1) and (3) report estimates from Equation (1), while columns (2) and (4) present results from the standard DiD specification in Equation (2). Columns (1) and (2) include university, year, and industry fixed effects, whereas columns (3) and (4) additionally control for university–year and industry–year multidimensional fixed effects. Columns (3) and (4) show that the initiatives increased university patents by three percent, indicating a statistically significant increase in patent output compared to non-preferred industries. These results validate Hypothesis 1, suggesting that local industrial initiatives enhance university innovation and guide university research priorities toward policy-targeted sectors. The conclusions of this study are consistent with the conclusions of Leng and Zhang [
5], namely that industrial policy can influence university innovation.
5.2. Robustness Check
5.2.1. Parallel Trends Test
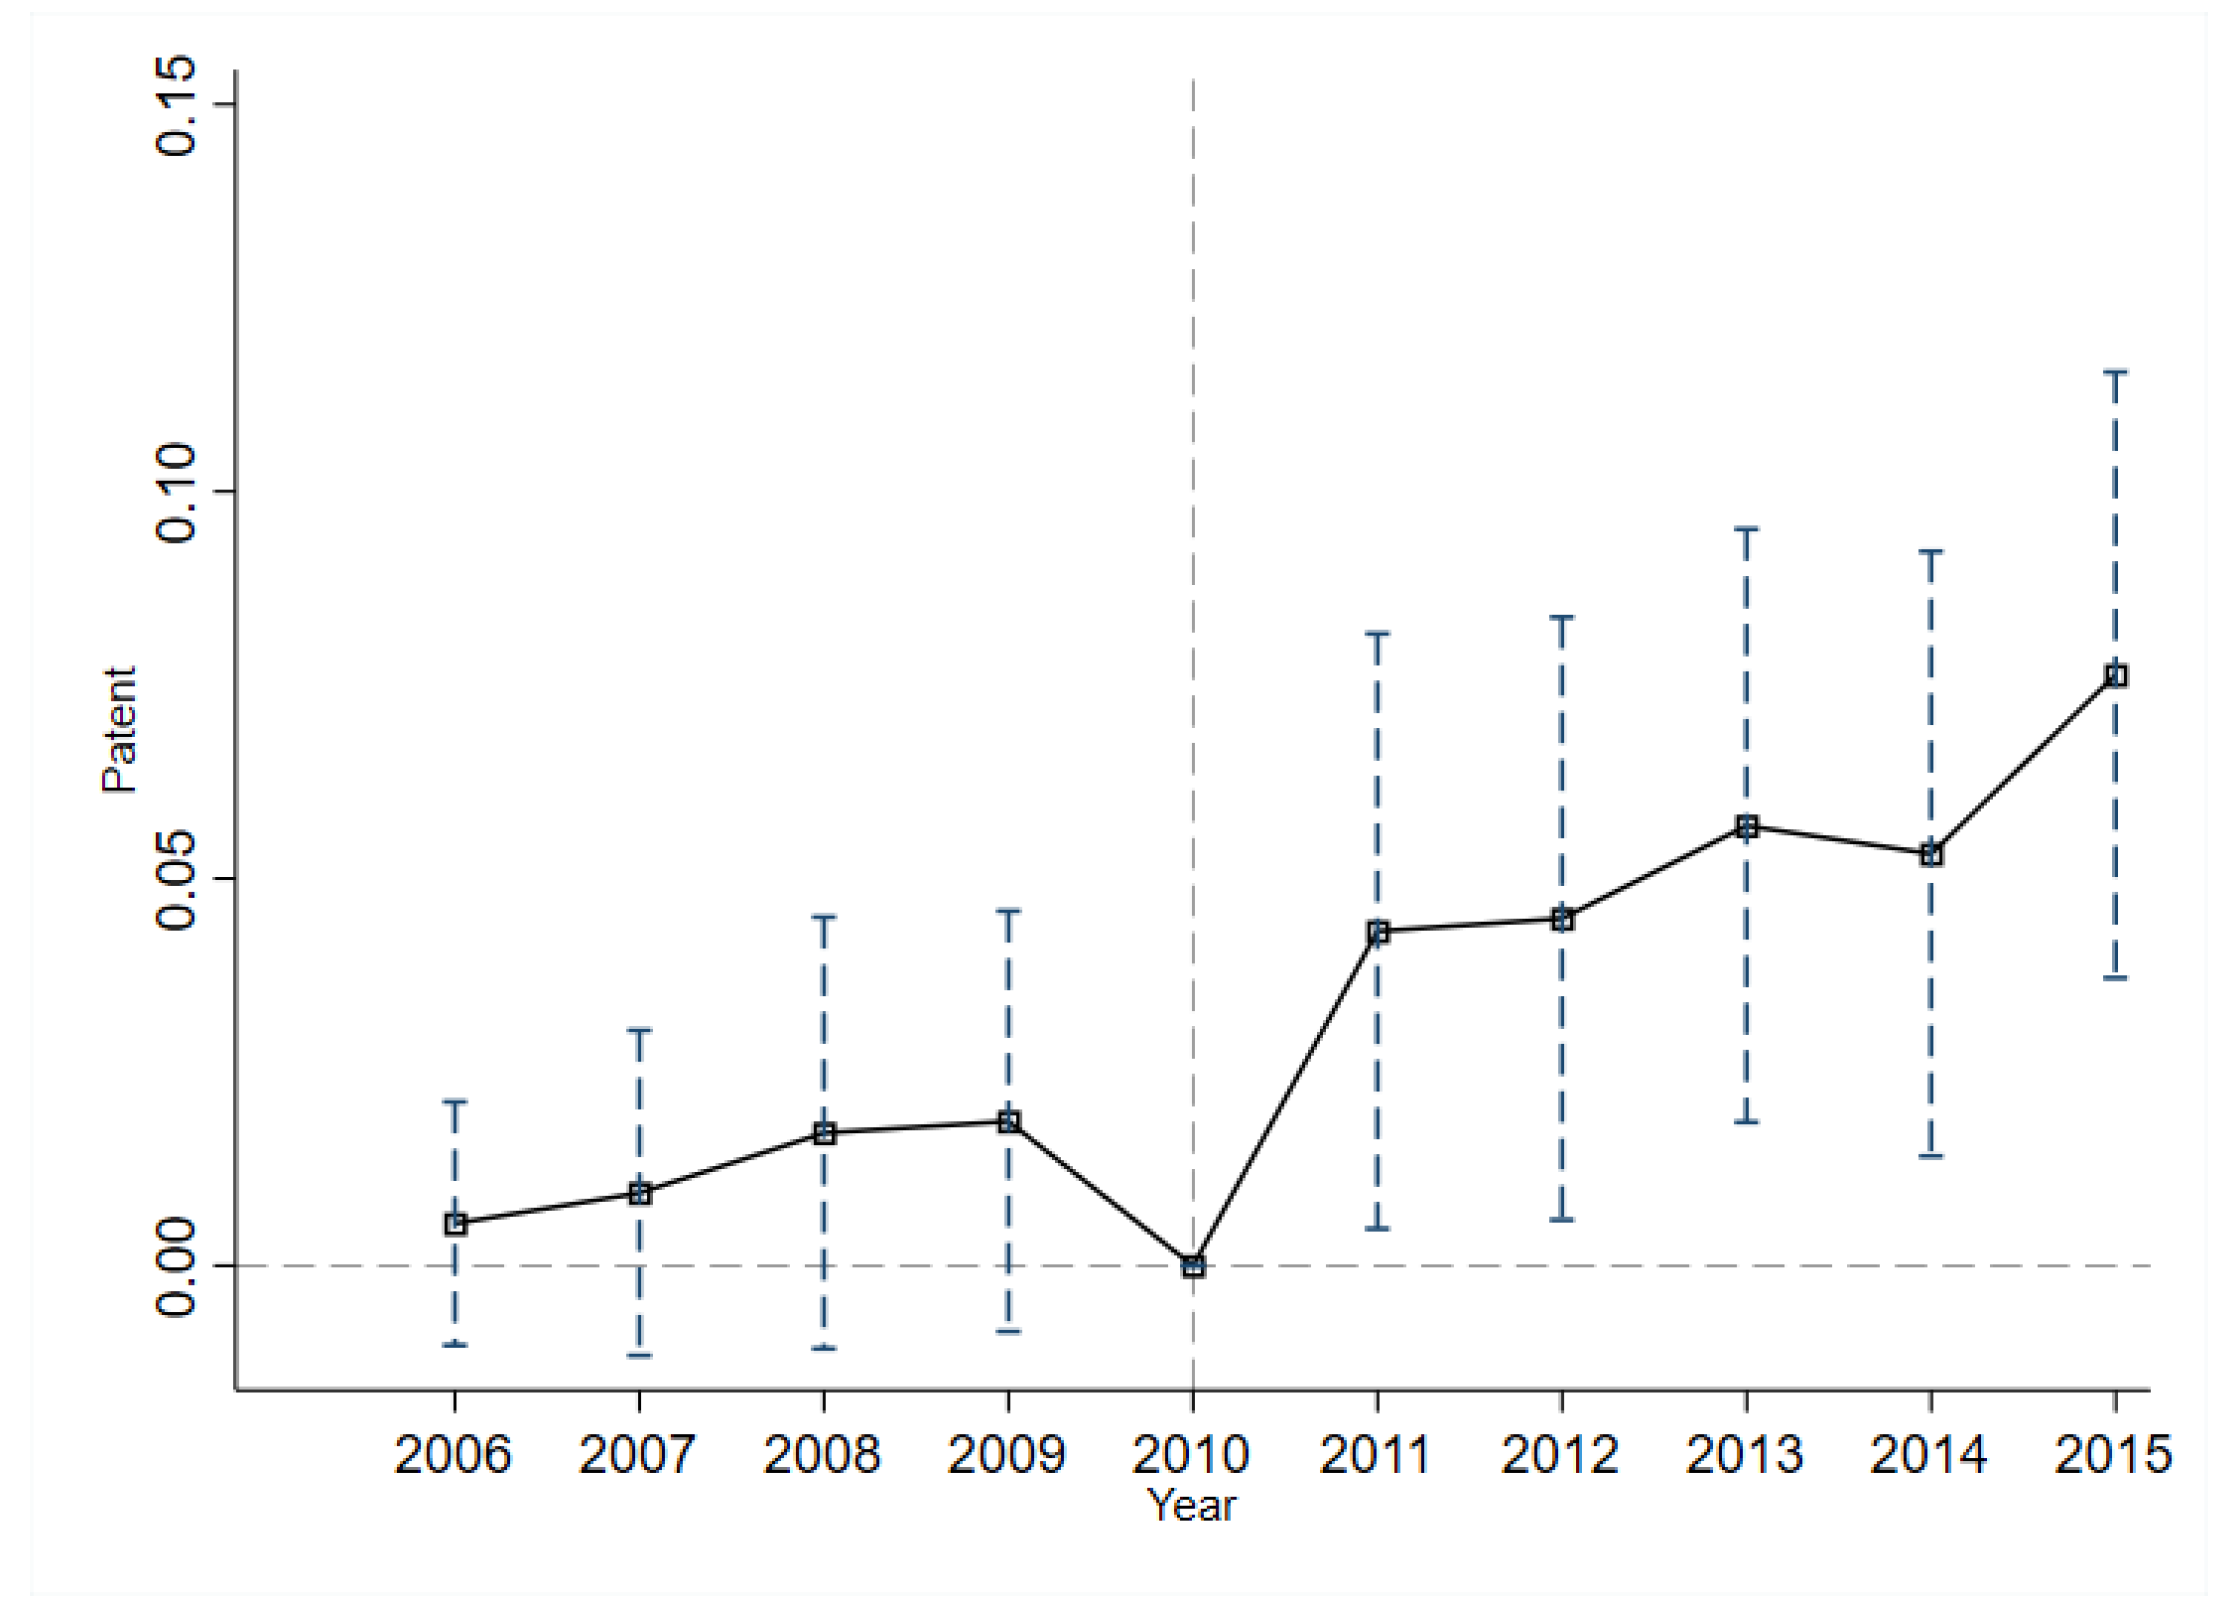
The key assumption for causal identification using a DiD approach is the parallel trends assumption, which asserts that the treatment and control groups do not differ significantly in innovation prior to the change. We expand Equation (2) to the following setup with key terms interacted with year dummies around
Treat:
Specifically, we interact
Treati with a full set of year dummies (i.e.,
Tτ).
βτ indicates the dynamic effects.
Figure 3 visually summarizes the results by plotting the estimated coefficients from these interactions. The base year is set to 2010, the year preceding the implementation of the 12th FYP. Crucially, the estimated coefficients for the pre-treatment period (11th FYP) are close to zero and statistically insignificant, indicating no preexisting trends and thus supporting the identification assumption. Subsequently, during the 12th FYP period, the coefficients display a statistically significant upward trajectory in innovation activity during the 12th FYP period.
5.2.2. Omitted Variable Bias Mitigation
Our baseline regression model does not account for initial industrial advantages, which may potentially introduce omitted variable bias in the estimation. Regions with industry-specific specialization are more likely to exhibit closer UI research collaboration, while industries with advantages tend to be preferred in local industrial plans [
38]. To address potential omitted variable bias, we control for the industrial advantages in the baseline model. Following the view of Cinelli et al. [
39], we interact the three-year pre-sample average of industrial strength with time fixed effects to mitigate the bad control problem. Industrial advantages are measured by a location quotient (LQ), constructed using firm-level data:
As shown in Equation (4), denotes the annual industrial output of industry j in region p during year t, constructed by aggregating firm-level output data. The LQ thus represents the ratio of the output share of industry j in region p in year t to the share of industry j in the total national output.
Meanwhile, universities’ initial research capacity in specific fields may confound the regression results. Institutions with stronger foundational research in particular domains tend to maintain developmental inertia in those areas. To address this, we incorporate interaction terms between the three-year pre-sample average patent output at the university–industry level and time fixed effects.
The regression results in
Table 3 indicate that neither regional–industrial characteristics nor university–industry level attributes significantly affect our core findings.
5.2.3. Standard Error Assumptions
In the benchmark regression, standard errors are clustered at the province–industry level. To assess robustness, we re-estimated the models by clustering standard errors at the province level (columns 1 and 2) and the industry level (columns 3 and 4). As shown in
Table 4, the results remained robust.
5.2.4. Zero-Inflation Correction
The “log(1+Y)” transformation is commonly used for dependent variables with zeros. However, this approach risks distorting data distributions and introducing scale dependence, which can bias coefficient estimates [
40,
41]. To address these issues, this study employs the Poisson Pseudo-Maximum Likelihood (PPML) method to model raw values directly. PPML avoids log-like transformation of the dependent variable and effectively addresses zero-inflation, heteroskedasticity, overdispersion, and high-dimensional fixed effects. The results in
Table 5 show that the coefficient remains statistically significant and positive, confirming the robustness of our findings.
5.2.5. Patent Quality Adjustment
The baseline regression uses the number of patent applications as a measure of innovation output. However, universities may prioritize quantity over quality in patenting activities, leading to low-value patent output. To mitigate this concern, we perform robustness checks that account for patent quality. First, we replace raw application counts with the number of granted patents to reflect substantive innovation outcomes. Second, we construct quality-adjusted patent measures using two proxies: (1) citations received within five years following patent grant and (2) knowledge breadth [
42]. Our regression results in
Table 6 demonstrate that our core findings remain unchanged after controlling for patent quality.
5.2.6. Reverse Causality Mitigation
To mitigate potential reverse causality between universities’ innovation and regional industrial plans, we exclude top-tier institutions that may dominate local academic research. Specifically, 985 and 211 universities (China’s higher education institutions selected under Project 985 in 1998 and Project 211 in 1995)—influential actors in academic innovation systems—whose researchers may engage in the process of industrial policy formulation. Columns (1) and (2) exclude 985 universities; columns (3) and (4) further exclude 211 universities. The findings in
Table 7 demonstrate that industrial policy effects persist among non-top-tier institutions.
5.2.7. Restricted Sample Analysis
This paper examines the impact of provincial industrial plans on university innovation. Notably, China’s administrative structure includes five cities specifically designated in the state plan, which hold provincial-level economic autonomy and can independently formulate local development plans. To isolate the effect of provincial plans from these city-level initiatives, we exclude these cities from the baseline sample and re-estimate the model. As shown in
Table 8, the coefficients remain statistically significant at the 1% level, confirming that the core findings are robust to potential confounding from separately designated cities.
Additionally, China’s higher education system is predominantly public (accounts for 82.58% in our sample). Given that private universities primarily focus on teaching with minimal research output (contributing less than 1% of total patents), we excluded them from the main analysis. Regression results for public universities are shown in columns (3) and (4) of panel A.
Furthermore, given that the industrial initiatives target manufacturing sectors, we refine the sample to universities of S&T and comprehensive universities
1. Results for this subsample are presented in columns (1) and (2) of panel B. The results still remain robust.
Finally, we exclude universities operating campuses across provincial boundaries, such as Harbin Institute of Technology with campuses in Heilongjiang, Shandong, and Guangdong. Such cross-provincial operations risk conflating exposure to heterogeneous regional policies, potentially biasing estimators. This exclusion does not materially affect the primary estimates.
5.2.8. Treatment Definition Broadening
China’s FYPs use various terms to signal industrial support intensity. Our baseline specification limits the treatment group to industries designated as high-priority industries in FYPs. For robustness, we broaden the treatment definition to encompass all industries described as “develop”. The coefficient estimates in
Table 9, though slightly reduced compared to the baseline results, remain statistically significant.
6. Mechanisms
6.1. Examining the Market-Pull Effect: Industrial S&T Demand
We investigate the mechanisms of market-driven S&T demand by analyzing UI collaboration and technology transfer channels. First, university–firm co-patents serve as output-based indicators of corporate demand for collaborative innovation with academic institutions. Using the number of university–firm collaborative patents as the dependent variable, the regression results in column (1) of
Table 10 show a statistically significant positive effect at the 1% level. This finding validates Hypothesis 2. Industrial initiatives increase enterprises’ demand for university S&T services. Building on theory of university–industry collaboration proposed by Bikard et al. [
28], we discovered that FYPs amplify market-driven demand for academic research. Our findings also reveal how China’s localized industrial initiatives foster geographic proximity between universities and firms [
43].
Furthermore, given the provincial-level implementation of industrial initiatives, we categorize university–firm co-patents into intra-provincial and inter-provincial types based on geographic co-location. The results suggest a significant dominance of intra-provincial collaborations in UI partnerships. Geographic proximity reduces communication costs and facilitates iterative knowledge exchange [
44,
45], which may explain the predominance of intra-provincial collaborations. The results provide support for the spatial decay effect of knowledge spillovers.
To assess the breadth of UI collaboration, we measure firm participation intensity by the count of unique firms (after deduplication) listed as co-applicants in patents. Regression results show a rising number of participating firms, revealing an expansion of the UI collaboration network.
Finally, we investigate market-driven innovation demand through technology transfer channels. Patent transfers and licensing from universities to firms reflect industries’ demand for S&T resources from public academic institutions. Regression results reveal statistically significant growth in both the quantity and proportion of transferred patents, indicating industries’ pull for research commercialization.
These findings demonstrate how industrial initiatives strengthen UI collaboration, enabling researchers to address industrial challenges through applied research innovations. This conclusion aligns with prior studies emphasizing the critical role of academic-industry partnerships. Such collaborations facilitate the complementarity of resources in knowledge, equipment, talent, and funding, which in turn stimulates innovation productivity [
28,
46].
6.2. Examining the Government-Push Effect: Public R&D Funding
This study further investigates the mechanisms of public R&D funding. A body of studies has confirmed the impact of public R&D funding on university innovation [
18,
20]. Due to limited transparency in subnational government expenditure disclosures, we use grants from NSFC—an important funder of natural science research in academia— to approximate public research investments. Building on Ye et al. [
47], we estimate NSFC grant funding across industries by leveraging technological linkages between academic disciplines and industries. Our methodology proceeds in three stages.
First, we calculate university–division–level funding allocations from NSFC, denoted as , where i indexes universities and k corresponds to NSFC division codes. Second, the total patent count is computed by aggregating patent amounts across each three-digit industry j using the CIC-IPC concordance table. Third, these industry-level patents are categorized according to their corresponding division through IPC-to-division mapping, obtaining to denote the count of patents in industry j linked to division k. Finally, industry-specific research funding for each university i is operationalized through weighted aggregation: .
The number of NSFC grants is constructed using the same method. We substitute the dependent variable in the baseline model with
, while keeping other settings unchanged. The regression results in
Table 11 indicate significant increases in public R&D funding for preferred industries. These findings validate Hypothesis 3. Consistent with findings of Myers and Lanahan [
4] on R&D subsidies enhancing corporate innovation, our results confirm that policy-driven resource allocation (via FYPs) stimulates university innovation.
We further categorize local preferred industries into two groups: (a) those jointly supported by central and local industrial policies (joint) and (b) those exclusively backed by local initiatives (local). Our analysis reveals that NSFC funding exerts significant positive effects on industries with central–local joint policy support, while showing null impacts on region-specific initiatives. The analysis reveals strategic alignment between R&D funding priorities and industrial initiative preferences, indicating coordinated prioritization by policymakers.
7. Heterogeneity in Patent Effects
7.1. Multi-Level Governance and Innovation Heterogeneity
The Chinese higher education system is predominantly composed of public institutions, which are administratively categorized into central ministry-affiliated universities and locally governed universities. University presidents are appointed by their respective supervisory authorities, and institutional funding primarily derives from fiscal allocations by these authorities. Central ministry-affiliated universities receive dual financial support from both central and local governments, resulting in greater research funding. In terms of industrial preference, the central government targets strategic emerging industries, while local governments prioritize regionally competitive industries [
48]. Such differences in focus lead to distinct funding priorities.
Industrial initiatives exert stronger effects on ministry-affiliated universities compared to local institutions as shown in
Table 12. Specifically, centrally–local joint industrial initiatives exert a significantly stronger impact on ministry-affiliated universities compared to their local counterparts. For locally-only industrial policies, the effects are statistically significant only for local universities. Conversely, centrally-only industrial policies exhibit significant effects solely in ministry-affiliated universities.
This disparity stems from two main factors: First, central universities receive dual fiscal support, endowing them with more abundant research funding. Second, influenced by the funding preferences of supervisory authorities, central universities tend to prioritize national strategic projects, while local universities concentrate on region-specific research agendas. These patterns reflect divergent innovation resource allocation under multi-level governance objectives. This heterogeneity aligns with the argument proposed by Jia et al. [
37] that administrative hierarchies shape research priorities in Chinese universities. Central universities, with dual funding sources and national mandates, are better positioned to respond to central–local joint initiatives.
Note: * p < 0.1, ** p < 0.05, *** p < 0.01. Only core explanatory variables are reported here. Standard errors clustered at the industry–province level are reported in parentheses. Columns (1)–(4) report estimates for the central university sample. Columns (5)–(8) correspond to the local university sample.
7.2. Research Capacity and Innovation Heterogeneity
We investigate how university research capacity moderates the innovation effects of industrial initiatives. First, academic research capacity serves as a critical signal for governments and firms to evaluate R&D returns, influencing their funding allocation decisions. Second, universities with strong research foundations and specialized talent can rapidly address complex industrial challenges [
49].
To explore heterogeneity, we split the sample into 985/211 universities and non-985/211 institutions. The 985/211 universities command greater research resources and academic influence, while the non-985/211 institutions exhibit weaker research capacity and research-industry linkages as shown in
Table 13. We also divide the sample into high- and low-research-capacity groups based on pre-sample-period NSFC grants. Regression estimates indicate statistically significant stronger innovation-enhancing effects of industrial initiatives among 985/211 and high-research-capacity universities. This suggests that academic strengths amplify initiative efficacy.
7.3. Industrial Technology Intensity and Innovation Heterogeneity
A key objective of China’s FYPs is to accelerate the modernization of the industrial system, particularly in strategic emerging industries. These high-tech industries rely more heavily on basic research. Universities function as primary hubs for both basic research and frontier technology development, with their knowledge outputs serving as critical inputs for high-tech firms. We thus investigate whether industrial technological intensity drives heterogeneity in the innovation-enhancing effects of industrial initiatives.
Drawing on the High-Technology Industry (Manufacturing) Classification (2017) from China’s National Bureau of Statistics, we categorize industries into high- and low-technology groups. Regression results in
Table 14 show significantly stronger effects of industrial initiatives on innovation in high-technology industries compared to low-technology industries, with the difference robust to industry-level heterogeneity tests. This underscores technological intensity as a critical factor of industrial initiatives’ efficacy in spurring university innovation.
8. Further Analysis
8.1. Industrial Comparative Advantages and Innovation Effects
We further investigate how regional comparative advantages influence innovation-enhancing effects. Drawing on Balassa’s [
50] theory of revealed comparative advantage, we construct the location quotient (LQ) metric defined in Equation (4). A region–industry pair is classified as having comparative advantage if
, with the
; and
otherwise. To mitigate endogeneity concerns, we calculate RCA using the three-year pre-sample average.
We extend the baseline specification by incorporating the RCA and its interaction term with
prefer. The estimates in
Table 15 show a statistically significant positive coefficient for the interaction term, indicating that industrial comparative advantages amplify innovation-enhancing effects. This finding holds robust across alternative RCA measures using the year preceding the sample period.
To further explore market-driven mechanisms, we analyze UI co-patents and patent transfers. Positive interaction terms confirm that regionally advantaged industries strengthen UI collaboration, thereby increasing patent production. Our findings validate Balassa’s [
50] theory of revealed comparative advantage in a policy context. However, we advance this literature by showing that industrial initiatives synergize with regional specialization to enhance university innovation. This is a novel mechanism absent in prior studies focused on firms.
8.2. University Technology Transfer Capacity and Innovation Effects
Industrial initiatives improve alignment between the outputs of the industry sector and public R&D sector. However, if university research remains confined to the ivory tower, the commercialization of its outputs will be impeded. We therefore examine whether university technology transfer capacity—proxied by Technology Transfer Offices (TTOs)—amplify innovation-enhancing effects.
In recent years, Chinese universities have increasingly established TTOs to serve local economic development. These offices function as policy instruments for industrial innovation, facilitating UI collaboration to enhance local industrial competitiveness. TTOs bridge academia and industry through two primary functions: First, they serve as information intermediation between research supply and industrial demand, enabling market-driven R&D alignment [
51]. Second, they provide specialized transfer services: identification and exploitation of high-value patents and management of intellectual property [
49,
52].
We compiled the
TTO variable using three online data sources: university official websites, public information from provincial science and technology departments, and TTO-related news reports. A binary variable is created, coded 1 from the establishment year of the TTO onward and 0 otherwise. Regression results in
Table 16 demonstrate that innovation effects rely on universities’ technology transfer capacity. This finding highlights the role of TTOs in translating academic research into industrial applications.
8.3. Public Research Capacity and Industrial Development
This paper investigates the impact of industrial initiatives on university innovation. However, the ultimate objective of industrial initiatives is industrial development. A central question arises: What role does university innovation play in the effectiveness of industrial policies and industrial development? The answer is critical for the significance of our paper. Building on research of Akcigit et al. [
9], who posit that public research strengthens policy effectiveness through knowledge spillovers, we empirically examine whether regional strengths in public research capacity enhance the performance of industrial initiatives. To address this, we construct a city-level panel model as follows:
The dependent variable IND captures regional industrial development. We measure it using city–industry–level outputs in logarithmic form (lnoutput) and the location quotient (LQ) defined in Equation (5). Data are obtained from the China Industrial Enterprises Database. The variable prefer, as defined in the baseline model, reflects regional industrial priority. Drawing on the concept of revealed comparative advantage, we quantify regional public research capacity PRC using pre-sample-period university innovation data. Specifically, PRC is measured by two dimensions: applied research (ln(invention patents + 1)) and basic research (ln(NSFC grants + 1)). We incorporate city–year fixed effects (μct) and industry–year fixed effects (θjt).
Regression estimates in
Table 17 reveal positive and significant coefficients on the interaction term between public research capacity and industrial initiatives, suggesting that public research capacity amplifies the effectiveness of such initiatives in promoting industrial growth and competitiveness. While prior research mainly focus on industrial comparative advantage [
53], we extend the industrial policy literature by introducing a new perspective: public technological comparative advantage. This is crucial for improving the resource allocation efficiency of industrial policy.
9. Conclusions and Policy Implications
A growing body of literature acknowledges the significant role universities played in industrial development. This study leverages provincial FYPs to quantify how university innovation responds to local industrial initiatives and explores the underlying mechanisms. Additionally, we investigate how industrial comparative advantages and university technology transfer capabilities moderate innovation-enhancing effects. Finally, we demonstrate how the synergy between public research and industrial policy affects industrial development.
Our empirical findings are as follows: (1) Local industry initiatives significantly promote university innovation outputs. (2) This effect operates through dual mechanisms: the market-pull effect and the government-push effect. (3) The effects show heterogeneity across administrative affiliations, university research capacity, and industry technology intensity. (4) Regional industrial comparative advantages and university technology transfer capabilities strengthen the innovation effect. (5) The synergy between public research and industrial policy facilitates industrial development.
These results suggest that universities can serve as a strategic instrument of innovation-oriented industrial policy, providing essential technology for private innovation ecosystems.
We therefore suggest the following policy recommendations. First, local governments should strategically leverage universities’ disciplinary strengths to cultivate regional industrial competitiveness. Specifically, governments could direct R&D funding toward core technologies in key fields by enhancing policy coordination between industry and science and technology departments. Additionally, provincial innovation funds should be established to subsidize university–industry joint labs in these fields, promoting the commercialization of basic research outcomes.
Second, universities should dynamically adjust discipline construction and research programs in response to market demands and facilitate technology transfer to bolster regional development, aligning with the 101 Project to adjust curricula and teaching materials meet industrial demands. They should also establish university–enterprise education programs to accelerate talent cultivation and discipline development in strategic emerging industries. Additionally, universities should strengthen technology transfer offices and science parks, enhancing their capabilities in technical services, technology commercialization, and entrepreneurship incubation.
Third, firms should strengthen UI collaboration to absorb academic innovation resources and accelerate technology commercialization. They could actively engage in university research projects and co-establish joint labs or R&D centers with universities. Meanwhile, they should set up dedicated innovation management teams to coordinate UI collaboration and track project progress, ensuring that collaborative achievements are swiftly translated into product and service advantages.
While universities are key to industrial growth, our findings do not advocate for arbitrary adjustments to academic research directions. On one hand, efforts should avoid regional governments’ blind adherence to central planning, which risks misallocating innovation resources. On the other hand, university innovation must maintain long-term vision by prioritizing original and pioneering basic research.
This study has several limitations. First, restricted by data access constraints, our analysis relies on the Chinese Industrial Enterprises Database (up to 2015), limiting insights into recent industrial dynamics. Second, we focus on government-push and market-pull mechanisms, omitting nuanced pathways like discipline-specific faculty recruitment or curricular reforms due to data scarcity. Future studies could integrate multi-source data to address these gaps.
Author Contributions
Conceptualization, H.S. and M.Y.; methodology, H.S. and M.Y.; software, M.Y.; validation, M.Y.; formal analysis, M.Y.; investigation, M.Y.; data curation, M.Y.; writing—original draft preparation, M.Y.; writing—review and editing, H.S. and M.Y.; visualization, M.Y.; supervision, H.S.; project administration, H.S.; and funding acquisition, H.S. All authors have read and agreed to the published version of the manuscript.
Funding
This research was funded by the Ministry of Education of China (22JD790074) and Zhejiang Provincial Natural Science Foundation of China (LZ23G020001).
Data Availability Statement
The data that support the findings of this study are available from the corresponding author (Mengxia Yang) upon reasonable request.
Conflicts of Interest
The authors declare no conflicts of interest.
Appendix A
Appendix A.1. Interdepartmental Plan Alignment in Chinese Industrial Development
The Chinese government emphasizes macro-coordination in policy formulation and implementation. A case in point is the 12th FYP, which is the first government initiative to promote SEIs. Chapter 10 of this plan outlines the launch of industrial innovation projects alongside the cultivation of SEIs. These efforts are aimed at mastering core SEI-related technologies and accelerating the scaling-up of these industries.
Within this FYP framework, sector-specific FYPs explicitly incorporate supportive plans for SEIs. The Ministry of Science and Technology developed the 12th FYP for National Science and Technology Development. Chapter 4, “Cultivating Strategic Emerging Industries,” of this plan emphasizes prioritizing breakthroughs in key generic technologies of SEIs and mobilizing resources in seven SEI sectors to enhance their technological competitiveness.
Similarly, the Ministry of Education’s 12th Five-Year Plan for National Education Development emphasizes the alignment between education objectives and SEI goals. The contents are outlined in Chapter 5(1) of the plan:
Accelerate talent cultivation in SEI-related fields;
Incentivize universities to establish SEI-related new disciplines;
Develop innovation hubs and talent training bases focused on these industries;
Increase basic research funding for foundational, frontier, and interdisciplinary areas within SEI-related fields.
The NSFC’s 12th FYP prioritizes funding for strategic emerging industries (SEIs) to drive technological breakthroughs. Specifically, the NSFC emphasizes mobilizing the resources nationwide to achieve breakthroughs in core SEI-related technologies, thereby supporting SEI advancement (Chapter 2(7), 2(15)).
Collectively, this evidence suggests a synergy system between the industrial, S&T, and education sectors in China. While advancing industrial objectives, such institutional coordination, may inadvertently shape academic research agendas.
Appendix A.2. Public R&D Funding Allocation and Policy Preferences
The allocation of public R&D funding reflects policymaker’ preferences. We further classify industrial initiatives into three types: central-only, local-only, and central–local joint initiatives. The results in
Table A1 indicate that NSFC funding is significantly allocated to central-only and central–local initiatives, but shows no statistical increase in local-only initiatives. This pattern demonstrates policymakers’ consistent preferences in aligning industrial priorities with scientific resource allocation.
Table A1.
Policy tiering and R&D allocation.
Table A1.
Policy tiering and R&D allocation.
| Variables | (1) | (2) | (3) | (4) | (5) | (6) |
|---|
| Amount | Amount | Amount | Number | Number | Number |
|---|
| center | 0.015 ** | | | 0.006 ** | | |
| | (0.006) | | | (0.003) | | |
| joint | | 0.035 *** | | | 0.024 *** | |
| | | (0.011) | | | (0.006) | |
| local | | | 0.004 | | | 0.001 |
| | | | (0.006) | | | (0.003) |
| Constant | 2.294 *** | 2.289*** | 2.294 *** | 0.694 *** | 0.692 *** | 0.695 *** |
| | (0.002) | (0.002) | (0.002) | (0.001) | (0.001) | (0.001) |
| Observations | 1,315,110 | 1,315,110 | 1,315,110 | 1,315,110 | 1,315,110 | 1,315,110 |
| R-squared | 0.903 | 0.900 | 0.900 | 0.871 | 0.868 | 0.868 |
| University–year | YES | YES | YES | YES | YES | YES |
| Industry–year | YES | YES | YES | YES | YES | YES |
Notes
| 1 | In China, “comprehensive universities” (综合性大学) are defined as offering a wide range of disciplines across STEM, liberal arts, medicine, and so on (e.g., Peking University, Zhejiang University). |
References
- Acemoglu, D.; Akcigit, U.; Alp, H.; Bloom, N.; Kerr, W. Innovation, Reallocation, and Growth. Am. Econ. Rev. 2018, 108, 3450–3491. [Google Scholar] [CrossRef]
- Chen, Z.; Liu, Z.; Suárez Serrato, J.C.; Xu, D.Y. Notching R&D Investment with Corporate Income Tax Cuts in China. Am. Econ. Rev. 2021, 111, 2065–2100. [Google Scholar]
- Howell, S.T. Financing Innovation: Evidence from R&D Grants. Am. Econ. Rev. 2017, 107, 1136–1164. [Google Scholar]
- Myers, K.R.; Lanahan, L. Estimating Spillovers from Publicly Funded R&D: Evidence from the US Department of Energy. Am. Econ. Rev. 2022, 112, 2393–2423. [Google Scholar]
- Leng, X.; Zhang, Y. The Frontiers in Manufacturing Technologies Initiative and University Innovation. China World Econ. 2024, 32, 197–225. [Google Scholar] [CrossRef]
- Andrews, M.J. How Do Institutions of Higher Education Affect Local Invention? Evidence from the Establishment of US Colleges. Am. Econ. J. Econ. Policy 2023, 15, 1–41. [Google Scholar] [CrossRef]
- Arora, A.; Belenzon, S.; Cioaca, L.C.; Sheer, L.; Zhang, H. The Effect of Public Science on Corporate R&D; NBER Working Paper; NBER: Cambridge, MA, USA, 2023. [Google Scholar]
- Hausman, N. University Innovation and Local Economic Growth. Rev. Econ. Stat. 2022, 104, 718–735. [Google Scholar] [CrossRef]
- Akcigit, U.; Hanley, D.; Serrano-Velarde, N. Back to Basics: Basic Research Spillovers, Innovation Policy, and Growth. Rev. Econ. Stud. 2021, 88, 1–43. [Google Scholar] [CrossRef]
- Eesley, C.; Li, J.B.; Yang, D. Does Institutional Change in Universities Influence High-Tech Entrepreneurship? Evidence from China’s Project 985. Organ. Sci. 2016, 27, 446–461. [Google Scholar] [CrossRef]
- Zhang, J.; Bai, K. Basic Research in Chinese Universities and Firm Innovation. Econ. Res. J. 2022, 57, 124–142. [Google Scholar]
- Aghion, P.; Dewatripont, M.; Stein, J.C. Academic Freedom, Private-Sector Focus, and the Process of Innovation. RAND J. Econ. 2008, 39, 617–635. [Google Scholar] [CrossRef]
- Wen, H.; Zhao, Z. How Does China’s Industrial Policy Affect Firms’ R&D Investment? Evidence from ‘Made in China 2025’. Appl. Econ. 2021, 53, 6333–6347. [Google Scholar]
- Arrow, K.J. Economic Welfare and the Allocation of Resources for Invention; Springer: Berlin, Germany, 1972. [Google Scholar]
- Greenwald, B.C.; Stiglitz, J.E. Externalities in Economies with Imperfect Information and Incomplete Markets. Q. J. Econ. 1986, 101, 229–264. [Google Scholar] [CrossRef]
- Arora, A.; Belenzon, S.; Sheer, L. Knowledge Spillovers and Corporate Investment in Scientific Research. Am. Econ. Rev. 2021, 111, 871–898. [Google Scholar] [CrossRef]
- Shi, X.; Wu, Y.; Fu, D. Does University-Industry Collaboration Improve Innovation Efficiency? Evidence from Chinese Firms. Econ. Model. 2020, 86, 39–53. [Google Scholar] [CrossRef]
- Hu, A.G. Public Funding and the Ascent of Chinese Science: Evidence from the National Natural Science Foundation of China. Res. Policy 2020, 49, 103983. [Google Scholar] [CrossRef]
- Babina, T.; He, A.X.; Howell, S.T.; Perlman, E.R.; Staudt, J. The Color of Money: Federal vs. Industry Funding of University Research; NBER Working Paper; NBER: Cambridge, MA, USA, 2020. [Google Scholar]
- Babina, T.; He, A.X.; Howell, S.T.; Perlman, E.R.; Staudt, J. Cutting the Innovation Engine: How Federal Funding Shocks Affect University Patenting, Entrepreneurship, and Publications. Q. J. Econ. 2023, 138, 895–954. [Google Scholar] [CrossRef]
- Cozzi, G.; Galli, S. Should the Government Protect Its Basic Research? Econ. Lett. 2017, 157, 122–124. [Google Scholar] [CrossRef]
- Hvide, H.K.; Jones, B.F. University Innovation and the Professor’s Privilege. Am. Econ. Rev. 2018, 108, 1860–1898. [Google Scholar] [CrossRef]
- Fong, P.S.; Chang, X.; Chen, Q. Faculty Patent Assignment in the Chinese Mainland: Evidence from the Top 35 Patent Application Universities. J. Technol. Transf. 2018, 43, 69–95. [Google Scholar] [CrossRef]
- Xu, X. China ‘Goes Out’ in a Centre–Periphery World: Incentivizing International Publications in the Humanities and Social Sciences. High. Educ. 2020, 80, 157–172. [Google Scholar] [CrossRef]
- Liang, W.; Gu, J.; Nyland, C. China’s New Research Evaluation Policy: Evidence from Economics Faculty of Elite Chinese Universities. Res. Policy 2022, 51, 104407. [Google Scholar] [CrossRef]
- Mansfield, E. Academic Research Underlying Industrial Innovations: Sources, Characteristics, and Financing. Rev. Econ. Stat. 1995, 77, 55–65. [Google Scholar] [CrossRef]
- Daniel, A.D.; Alves, L. University-Industry Technology Transfer: The Commercialization of University’s Patents. Knowl. Manag. Res. Pract. 2020, 18, 276–296. [Google Scholar] [CrossRef]
- Bikard, M.; Vakili, K.; Teodoridis, F. When Collaboration Bridges Institutions: The Impact of University–Industry Collaboration on Academic Productivity. Organ. Sci. 2019, 30, 426–445. [Google Scholar] [CrossRef]
- Kafouros, M.; Wang, C.; Piperopoulos, P.; Zhang, M. Academic Collaborations and Firm Innovation Performance in China: The Role of Region-Specific Institutions. Res. Policy 2015, 44, 803–817. [Google Scholar] [CrossRef]
- Koch, L.; Simmler, M. How Important Are Local Knowledge Spillovers of Public R&D and What Drives Them? Res. Policy 2020, 49, 104009. [Google Scholar]
- Xia, Q.; Cao, Q.; Tan, M. Basic Research Intensity and Diversified Performance: The Moderating Role of Government Support Intensity. Scientometrics 2020, 125, 577–605. [Google Scholar] [CrossRef]
- Heilmann, S.; Melton, O. The Reinvention of Development Planning in China, 1993–2012. Mod. China 2013, 39, 580–628. [Google Scholar] [CrossRef]
- Hu, A. The Distinctive Transition of China’s Five-Year Plans. Mod. China 2013, 39, 629–639. [Google Scholar] [CrossRef]
- Wu, Y.; Zhu, X.; Groenewold, N. The Determinants and Effectiveness of Industrial Policy in China: A Study Based on Five-Year Plans. China Econ. Rev. 2019, 53, 225–242. [Google Scholar] [CrossRef]
- Mao, J.; Tang, S.; Xiao, Z.; Zhi, Q. Industrial Policy Intensity, Technological Change, and Productivity Growth: Evidence from China. Res. Policy 2021, 50, 104287. [Google Scholar] [CrossRef]
- Yu, Z.; Dong, J.; Feng, Y. The Impacts of the Government Industrial Plans on China’s Exports and Trade Balance. J. Contemp. China 2020, 29, 141–158. [Google Scholar] [CrossRef]
- Jia, R.; Nie, H.; Xiao, W. Power and Publications in Chinese Academia. J. Comp. Econ. 2019, 47, 792–805. [Google Scholar] [CrossRef]
- Zhao, T.; Chen, Z. Comparative Advantage and Central, Local Industrial Policies in China. J. World Econ. 2019, 10, 98–119. [Google Scholar]
- Cinelli, C.; Hazlett, C. Making Sense of Sensitivity: Extending Omitted Variable Bias. J. R. Stat. Soc. B 2020, 82, 39–67. [Google Scholar] [CrossRef]
- Campbell, D.L.; Mau, K. On “Trade Induced Technical Change: The Impact of Chinese Imports on Innovation, IT, and Productivity”. Rev. Econ. Stud. 2021, 88, 2555–2559. [Google Scholar] [CrossRef]
- Chen, J.; Roth, J. Logs with Zeros? Some Problems and Solutions. Q. J. Econ. 2024, 139, 891–936. [Google Scholar] [CrossRef]
- Trajtenberg, M. A Penny for Your Quotes: Patent Citations and the Value of Innovations. RAND J. Econ. 1990, 21, 172–187. [Google Scholar] [CrossRef]
- Mowery, D.C.; Ziedonis, A.A. Markets versus spillovers in outflows of university research. Res. Policy 2015, 44, 50–66. [Google Scholar] [CrossRef]
- Jaffe, A.B.; Trajtenberg, M.; Henderson, R. Geographic Localization of Knowledge Spillovers as Evidenced by Patent Citations. Q. J. Econ. 1993, 108, 577–598. [Google Scholar] [CrossRef]
- Bikard, M.; Marx, M. Bridging Academia and Industry: How Geographic Hubs Connect University Science and Corporate Technology. Manag. Sci. 2020, 66, 3425–3443. [Google Scholar] [CrossRef]
- Jung, H.J. The Impacts of Science and Technology Policy Interventions on University Research: Evidence from the US National Nanotechnology Initiative. Res. Policy 2014, 43, 74–91. [Google Scholar] [CrossRef]
- Ye, J.; Zhou, X.; Chen, S. Innovation Transformation of Basic Research Investment—Evidence from National Natural Science Foundation of China. China Econ. Q. 2021, 21, 1883–1902. [Google Scholar]
- Prud’homme, D. Dynamics of China’s Provincial-Level Specialization in Strategic Emerging Industries. Res. Policy 2016, 45, 1586–1603. [Google Scholar] [CrossRef]
- Lee, K.; Jung, H.J. Does TTO Capability Matter in Commercializing University Technology? Evidence from Longitudinal Data in South Korea. Res. Policy 2021, 50, 104133. [Google Scholar] [CrossRef]
- Balassa, B. Trade Liberalisation and “Revealed” Comparative Advantage. Manch. Sch. 1965, 33, 99–123. [Google Scholar] [CrossRef]
- Macho-Stadler, I.; Pérez-Castrillo, D.; Veugelers, R. Licensing of University Inventions: The Role of a Technology Transfer Office. Int. J. Ind. Organ. 2007, 25, 483–510. [Google Scholar] [CrossRef]
- Modic, D.; Suklan, J. Multidimensional Experience and Performance of Highly Skilled Administrative Staff: Evidence from a Technology Transfer Office. Res. Policy 2022, 51, 104562. [Google Scholar] [CrossRef]
- Rodriguez-Clare, A. Clusters and Comparative Advantage: Implications for Industrial Policy. J. Dev. Econ. 2007, 82, 43–57. [Google Scholar] [CrossRef]
Figure 1.
The mechanism analysis diagram.
Figure 1.
The mechanism analysis diagram.
Figure 2.
NSFC grants between preferred industries and non-preferred industries. (a,b) The number and amount of NSFC funding received by universities in preferred versus non-preferred industries. Here, “preferred industries” refer to those prioritized exclusively in the 12th Five-Year Plan (FYP), while “non-preferred industries” denote industries excluded from both the 12th and 11th FYPs.
Figure 3.
Parallel trend. This figure plots coefficients with 95% confidence intervals derived from regressions specified in Equation (3).
Figure 3.
Parallel trend. This figure plots coefficients with 95% confidence intervals derived from regressions specified in Equation (3).
Table 1.
Summary statistics.
Table 1.
Summary statistics.
| Variables | Obs | Mean | Std | Min | Max |
|---|
| patent | 1,315,110 | 2.084 | 19.981 | 0 | 3017 |
| prefer | 1,315,110 | 0.216 | 0.411 | 0 | 1 |
| Treat×Post | 1,221,460 | 0.071 | 0.257 | 0 | 1 |
| NSFC_funding | 1,315,110 | 181.493 | 712.900 | 0 | 22,080.810 |
| NSFC_num | 1,315,110 | 0.695 | 1.007 | 0 | 6 |
| co_patent | 1,315,110 | 0.142 | 2.322 | 0 | 683 |
| output | 230,137 | 2284.876 | 9699.456 | 0 | 505,873.000 |
| LQ | 230,137 | 1.7 | 3.045 | 0 | 16.797 |
Table 2.
Baseline result.
Table 2.
Baseline result.
| Variables | (1)
lnpatent | (2)
lnpatent | (3)
lnpatent | (4)
lnpatent |
|---|
| prefer | 0.068 *** | | 0.035 *** | |
| | (0.007) | | (0.006) | |
| Treat × Post | | 0.194 *** | | 0.033 *** |
| | | (0.013) | | (0.008) |
| Treat | | −0.058 *** | | 0.022 |
| | | (0.019) | | (0.018) |
| Constant | 0.279 *** | 0.271 *** | 0.286 *** | 0.271 *** |
| | (0.003) | (0.003) | (0.002) | (0.003) |
| Observations | 1,315,110 | 1,221,460 | 1,315,110 | 1,221,460 |
| R-squared | 0.458 | 0.454 | 0.509 | 0.505 |
| University FE | YES | YES | YES | YES |
| Year FE | YES | YES | YES | YES |
| Industry FE | YES | YES | YES | YES |
| University–year FE | NO | NO | YES | YES |
| Industry–year FE | NO | NO | YES | YES |
Table 3.
Robustness to omitted variables.
Table 3.
Robustness to omitted variables.
| Variables | Industrial Advantage | University Research Capacity |
|---|
| (1) | (2) | (3) | (4) |
|---|
| lnpatent | lnpatent | lnpatent | lnpatent |
|---|
| prefer | 0.033 *** | | 0.034 *** | |
| | (0.006) | | (0.005) | |
| Treat × Post | | 0.054 ** | | 0.059 *** |
| | | (0.020) | | (0.017) |
| Constant | 0.282 *** | 0.268 *** | 0.271 *** | 0.259 *** |
| | (0.002) | (0.003) | (0.004) | (0.004) |
| Observations | 1,315,110 | 1,221,460 | 1,315,110 | 1,221,460 |
| R-squared | 0.509 | 0.505 | 0.547 | 0.541 |
| University–year FE | YES | YES | YES | YES |
| Industry–year FE | YES | YES | YES | YES |
Table 4.
Robustness to clustering.
Table 4.
Robustness to clustering.
| Variables | Province Level | Industry Level |
|---|
| (1) | (2) | (3) | (4) |
|---|
| lnpatent | lnpatent | lnpatent | lnpatent |
|---|
| prefer | 0.035 *** | | 0.035 *** | |
| | (0.009) | | (0.009) | |
| Treat × Post | | 0.033 ** | | 0.033 *** |
| | | (0.012) | | (0.010) |
| Constant | 0.286 *** | 0.271 *** | 0.286 *** | 0.271 *** |
| | (0.002) | (0.005) | (0.002) | (0.003) |
| Observations | 1,315,110 | 1,221,460 | 1,315,110 | 1,221,460 |
| R-squared | 0.509 | 0.505 | 0.509 | 0.505 |
| University–year FE | YES | YES | YES | YES |
| Industry–year FE | YES | YES | YES | YES |
Table 5.
Robustness to zero-inflation.
Table 5.
Robustness to zero-inflation.
| Variables | (1) | (2) |
|---|
| Patent | Patent |
|---|
| prefer | 0.048 *** | |
| | (0.018) | |
| Treat × Post | | 0.002 |
| | | (0.015) |
| Constant | 3.480 *** | 3.507 *** |
| | (0.011) | (0.013) |
| Observations | 1,315,110 | 1,221,460 |
| Pseudo R2 | 0.818 | 0.828 |
| University–year FE | YES | YES |
| Industry–year FE | YES | YES |
Table 6.
Robustness to patent quality adjustment.
Table 6.
Robustness to patent quality adjustment.
| Variables | (1) | (2) | (3) | (4) | (5) | (6) |
|---|
Granted
Patent | Granted
Patent | Citation-Weighted
Patent | Citation-Weighted
Patent | Knowledge-Breadth-Weighted Patent | Knowledge-Breadth-Weighted Patent |
|---|
| prefer | 0.031 *** | | 0.063 *** | | 0.035 *** | |
| | (0.006) | | (0.011) | | (0.006) | |
| Treat × Post | | 0.032 *** | | 0.050 *** | | 0.033 *** |
| | | (0.007) | | (0.014) | | (0.008) |
| Constant | 0.221 *** | 0.209 *** | 0.558 *** | 0.530 *** | 0.288 *** | 0.273 *** |
| | (0.002) | (0.003) | (0.004) | (0.006) | (0.002) | (0.003) |
| Observations | 1,315,110 | 1,221,460 | 1,315,110 | 1,221,460 | 1,315,110 | 1,221,460 |
| R-squared | 0.474 | 0.470 | 0.464 | 0.453 | 0.509 | 0.505 |
| University–year FE | YES | YES | YES | YES | YES | YES |
| Industry–year FE | YES | YES | YES | YES | YES | YES |
Table 7.
Robustness to reverse causality.
Table 7.
Robustness to reverse causality.
| Variables | Remove 985 Project | Remove 985/211 Project |
|---|
| (1) | (2) | (3) | (4) |
|---|
| lnpatent | lnpatent | lnpatent | lnpatent |
|---|
| prefer | 0.028 *** | | 0.022 *** | |
| | (0.005) | | (0.004) | |
| Treat × Post | | 0.030 *** | | 0.028 *** |
| | | (0.007) | | (0.007) |
| Constant | 0.234 *** | 0.222 *** | 0.188 *** | 0.179 *** |
| | (0.002) | (0.003) | (0.002) | (0.002) |
| Observations | 1,247,850 | 1,159,080 | 1,134,570 | 1,053,840 |
| R-squared | 0.474 | 0.473 | 0.450 | 0.450 |
| University–year FE | YES | YES | YES | YES |
| Industry–year FE | YES | YES | YES | YES |
Table 8.
Robustness to sample exclusions.
Table 8.
Robustness to sample exclusions.
| Variables | (1) | (2) | (3) | (4) |
|---|
| lnpatent | lnpatent | lnpatent | lnpatent |
|---|
| | Exclusion of Separately-Planned Cities | Public University |
| prefer | 0.035 *** | | 0.048 *** | |
| | (0.007) | | (0.007) | |
| Treat × Post | | 0.032 *** | | 0.043 *** |
| | | (0.008) | | (0.009) |
| Constant | 0.281 *** | 0.267 *** | 0.325 *** | 0.307 *** |
| | (0.003) | (0.004) | (0.003) | (0.004) |
| Observations | 1,251,390 | 1,162,840 | 1,141,650 | 1,062,210 |
| R-squared | 0.508 | 0.504 | 0.526 | 0.522 |
| | S&T and Comprehensive Universities | Exclusion of Cross-Provincial Sample |
| Prefer | 0.035 *** | | 0.034 *** | |
| | (0.007) | | (0.006) | |
| Treat × Post | | 0.034*** | | 0.031 ** |
| | | (0.008) | | (0.007) |
| Constant | 0.314 *** | 0.297 *** | 0.280 *** | 0.265 *** |
| | (0.003) | (0.004) | (0.002) | (0.003) |
| Observations | 1,109,790 | 1,029,910 | 1,292,100 | 1,200,300 |
| R-squared | 0.515 | 0.512 | 0.506 | 0.502 |
| University–year FE | YES | YES | YES | YES |
| Industry–year FE | YES | YES | YES | YES |
Table 9.
Robustness to definition broadening.
Table 9.
Robustness to definition broadening.
| Variables | (1) | (2) |
|---|
| lnpatent | lnpatent |
|---|
| prefer_wide | 0.028 *** | |
| | (0.005) | |
| Treat_wide × Post | | 0.008 ** |
| | | (0.004) |
| Constant | 0.285 *** | 0.275 *** |
| | (0.003) | (0.003) |
| Observations | 1,315,110 | 1,064,620 |
| R-squared | 0.509 | 0.496 |
| University–year FE | YES | YES |
| Industry–year FE | YES | YES |
Table 10.
UI collaboration.
Table 10.
UI collaboration.
| Variables | (1) | (2) | (3) | (4) | (5) | (6) |
|---|
| Co-Patent | Co-Patent | Intra-Provincial Co-Patent | Intra-Provincial Co-Patent | Inter-Provincial Co-Patent | Inter-Provincial Co-Patent |
|---|
| prefer | 0.009 *** | | 0.006 *** | | 0.002 | |
| | (0.003) | | (0.002) | | (0.001) | |
| Treat × Post | | 0.008 * | | 0.006 * | | 0.003 |
| | | (0.004) | | (0.004) | | (0.003) |
| Constant | 0.041 *** | 0.039 *** | 0.034 *** | 0.032 *** | 0.018 *** | 0.017 *** |
| | (0.001) | (0.002) | (0.001) | (0.001) | (0.001) | (0.001) |
| Observations | 1,315,110 | 1,221,460 | 1,315,110 | 1,221,460 | 1,315,110 | 1,221,460 |
| R-squared | 0.266 | 0.262 | 0.243 | 0.239 | 0.194 | 0.191 |
| | Number of firms | Number of firms | Transfer -patent | Transfer -patent | Transfer -ratio | Transfer -ratio |
| prefer | 0.007 *** | | 0.013 *** | | 0.002 *** | |
| | (0.003) | | (0.003) | | (0.000) | |
| Treat × Post | | 0.010 ** | | 0.016 *** | | 0.001 |
| | | (0.004) | | (0.005) | | (0.001) |
| Constant | 0.040 *** | 0.038 *** | 0.059 *** | 0.055 *** | 0.016 *** | 0.015 *** |
| | (0.001) | (0.002) | (0.001) | (0.002) | (0.000) | (0.000) |
| Observations | 1,315,110 | 1,221,460 | 1,315,110 | 1,221,460 | 1,315,110 | 1,221,460 |
| R-squared | 0.268 | 0.264 | 0.310 | 0.307 | 0.122 | 0.120 |
| University–year FE | YES | YES | YES | YES | YES | YES |
| Industry–year FE | YES | YES | YES | YES | YES | YES |
Table 11.
NSFC grants.
| Variables | (1) | (2) | (3) | (4) | (5) | (6) |
|---|
| Amount | Amount | Amount | Number | Number | Number |
|---|
| prefer | 0.016 *** | | | 0.009 *** | | |
| | (0.006) | | | (0.003) | | |
| Treat × Post | | 0.016 ** | | | 0.010 *** | |
| | | (0.008) | | | (0.003) | |
| joint | | | 0.035 *** | | | 0.024 *** |
| | | | (0.011) | | | (0.006) |
| local | | | 0.004 | | | 0.001 |
| | | | (0.006) | | | (0.003) |
| Constant | 2.290 *** | 2.273 *** | 2.289 *** | 0.693 *** | 0.684 *** | 0.692 *** |
| | (0.002) | (0.003) | (0.002) | (0.001) | (0.001) | (0.001) |
| Observations | 1,315,110 | 1,221,460 | 1,315,110 | 1,315,110 | 1,221,460 | 1,315,110 |
| R-squared | 0.900 | 0.904 | 0.900 | 0.868 | 0.877 | 0.868 |
| University–year FE | YES | YES | YES | YES | YES | YES |
| Industry–year FE | YES | YES | YES | YES | YES | YES |
Table 12.
Heterogeneous effects by administrative authorities.
Table 12.
Heterogeneous effects by administrative authorities.
| Variables | Central University | Local University |
|---|
| (1) | (2) | (3) | (4) | (5) | (6) | (7) | (8) |
|---|
| lnpatent | lnpatent | lnpatent | lnpatent | lnpatent | lnpatent | lnpatent | lnpatent |
|---|
| prefer | 0.053 *** | | | | 0.034 *** | | | |
| | (0.020) | | | | (0.005) | | | |
| center | | 0.024 * | | | | 0.008 | | |
| | | (0.013) | | | | (0.005) | | |
| joint | | | 0.100 *** | | | | 0.058 *** | |
| | | | (0.035) | | | | (0.010) | |
| local | | | | 0.014 | | | | 0.018 *** |
| | | | | (0.019) | | | | (0.005) |
| Constant | 0.918 *** | 0.894 *** | 0.915 *** | 0.927 *** | 0.238 *** | 0.234 *** | 0.238 *** | 0.244 *** |
| | (0.007) | (0.006) | (0.008) | (0.006) | (0.002) | (0.002) | (0.002) | (0.002) |
| Observations | 150,450 | 150,450 | 150,450 | 150,450 | 991,200 | 991,200 | 991,200 | 991,200 |
| R-squared | 0.661 | 0.663 | 0.661 | 0.661 | 0.486 | 0.485 | 0.486 | 0.486 |
| University–year | YES | YES | YES | YES | YES | YES | YES | YES |
| Industry–year | YES | YES | YES | YES | YES | YES | YES | YES |
Table 13.
Heterogeneous effects by R&D capacity.
Table 13.
Heterogeneous effects by R&D capacity.
| Variables | 211/985 | Non 211/985 | High R&D Capacity | Low R&D Capacity |
|---|
| (1) | (2) | (3) | (4) | (5) | (6) | (7) | (8) |
|---|
| lnpatent | lnpatent | lnpatent | lnpatent | lnpatent | lnpatent | lnpatent | lnpatent |
|---|
| prefer | 0.108 *** | | 0.022 *** | | 0.068 *** | | 0.006 ** | |
| | (0.017) | | (0.004) | | (0.010) | | (0.003) | |
| Treat × Post | | 0.054 *** | | 0.028 *** | | 0.059 *** | | 0.012 |
| | | (0.020) | | (0.007) | | (0.011) | | (0.007) |
| Constant | 0.903 *** | 0.837 *** | 0.188 *** | 0.179 *** | 0.494 *** | 0.464 *** | 0.074 *** | 0.070 *** |
| | (0.006) | (0.008) | (0.002) | (0.002) | (0.004) | (0.005) | (0.001) | (0.001) |
| Observations | 180,540 | 167,620 | 1,134,570 | 1,053,840 | 661,980 | 614,810 | 653,130 | 606,650 |
| R-squared | 0.669 | 0.666 | 0.450 | 0.450 | 0.580 | 0.578 | 0.371 | 0.372 |
| University–year FE | YES | YES | YES | YES | YES | YES | YES | YES |
| Industry–year FE | YES | YES | YES | YES | YES | YES | YES | YES |
Table 14.
Heterogeneous effects by industrial technological intensity.
Table 14.
Heterogeneous effects by industrial technological intensity.
| Variables | High-Tech Industries | Low-Tech Industries |
|---|
| (1) | (2) | (3) | (4) |
|---|
| lnpatent | lnpatent | lnpatent | lnpatent |
|---|
| prefer | 0.034 *** | | 0.016 ** | |
| | (0.013) | | (0.007) | |
| Treat × Post | | 0.036 ** | | 0.026 *** |
| | | (0.015) | | (0.009) |
| Constant | 0.554 *** | 0.529 *** | 0.239 *** | 0.235 *** |
| | (0.008) | (0.010) | (0.002) | (0.004) |
| Observations | 208,040 | 151,800 | 1,107,070 | 1,069,660 |
| R-squared | 0.670 | 0.685 | 0.494 | 0.492 |
| University–year FE | YES | YES | YES | YES |
| Industry–year FE | YES | YES | YES | YES |
Table 15.
Industrial comparative advantage and innovation effects.
Table 15.
Industrial comparative advantage and innovation effects.
| Variables | (1) | (2) | (3) | (4) | (5) | (6) |
|---|
| lnpatent | lnpatent | Co-Patent | Co-Patent | Transfer-Patent | Transfer-Patent |
|---|
| prefer * RCA | 0.092 *** | | 0.028 *** | | 0.026 *** | |
| | (0.014) | | (0.005) | | (0.006) | |
| prefer | 0.010 | | 0.001 | | 0.006 * | |
| | (0.007) | | (0.003) | | (0.003) | |
| RCA | 0.040 *** | 0.045 *** | 0.007 *** | 0.008 *** | 0.011 *** | 0.012 *** |
| | (0.006) | (0.005) | (0.002) | (0.002) | (0.002) | (0.002) |
| Treat × Post * RCA | | 0.202 *** | | 0.065 *** | | 0.062 *** |
| | | (0.037) | | (0.018) | | (0.015) |
| Treat × Post | | 0.002 | | 0.003 | | 0.005 |
| | | (0.009) | | (0.004) | | (0.005) |
| Constant | 0.278 *** | 0.262 *** | 0.040 *** | 0.037 *** | 0.057 *** | 0.053 *** |
| | (0.003) | (0.004) | (0.001) | (0.002) | (0.001) | (0.002) |
| Observations | 1,315,110 | 1,221,460 | 1,315,110 | 1,221,460 | 1,315,110 | 1,221,460 |
| R-squared | 0.510 | 0.506 | 0.267 | 0.263 | 0.311 | 0.307 |
| University–year FE | YES | YES | YES | YES | YES | YES |
| Industry–year FE | YES | YES | YES | YES | YES | YES |
Table 16.
TTO and innovation effects.
Table 16.
TTO and innovation effects.
| Variables | (1) | (2) | (3) | (4) | (5) | (6) |
|---|
| lnpatent | lnpatent | Transfer-Patent | Transfer-
Patent | Transfer-Ratio | Transfer-
Ratio |
|---|
| prefer * TTO | 0.903 *** | | 0.406 *** | | 0.008 *** | |
| | (0.049) | | (0.029) | | (0.002) | |
| prefer | 0.022 *** | | 0.007 *** | | 0.002 *** | |
| | (0.006) | | (0.003) | | (0.000) | |
| Treat × Post * TTO | | 1.014 *** | | 0.468 *** | | 0.013 *** |
| | | (0.063) | | (0.042) | | (0.003) |
| Treat × Post | | 0.001 | | 0.001 | | −0.000 |
| | | (0.007) | | (0.005) | | (0.001) |
| Constant | 0.285 *** | 0.271 *** | 0.058 *** | 0.055 *** | 0.016 *** | 0.015 *** |
| | (0.002) | (0.003) | (0.001) | (0.002) | (0.000) | (0.000) |
| Observations | 1,315,110 | 1,221,460 | 1,315,110 | 1,221,460 | 1,315,110 | 1,221,460 |
| R-squared | 0.513 | 0.508 | 0.316 | 0.311 | 0.122 | 0.120 |
| University–year FE | YES | YES | YES | YES | YES | YES |
| Industry–year FE | YES | YES | YES | YES | YES | YES |
Table 17.
Effect of public research capacity on policy effectiveness.
Table 17.
Effect of public research capacity on policy effectiveness.
| Variables | (1) | (2) | (3) | (4) |
|---|
| lnoutput | lnoutput | LQ | LQ |
|---|
| Panel A. Applied Research Capacity |
| prefer * PRCa | 0.240 *** | | 0.275 ** | |
| | (0.072) | | (0.131) | |
| prefer | 0.223 *** | | 0.355 *** | |
| | (0.037) | | (0.074) | |
| PRCa | 0.309 *** | 0.334 *** | 0.438 *** | 0.474 *** |
| | (0.040) | (0.039) | (0.060) | (0.061) |
| Treat × Post* PRCa | | 0.291 ** | | 0.310 * |
| | | (0.116) | | (0.185) |
| Treat × Post | | 0.014 | | 0.102 |
| | | (0.050) | | (0.073) |
| Constant | 5.792 *** | 5.833 *** | 1.584 *** | 1.664 *** |
| | (0.016) | (0.016) | (0.026) | (0.026) |
| Observations | 230,137 | 214,191 | 230,137 | 214,191 |
| R-squared | 0.447 | 0.446 | 0.198 | 0.196 |
| Panel B. Basic Research Capacity |
| prefer * PRCb | 0.255 *** | | 0.298 *** | |
| | (0.054) | | (0.101) | |
| prefer | 0.207 *** | | 0.337 *** | |
| | (0.037) | | (0.074) | |
| PRCb | −0.018 | 0.014 | 0.053 | 0.090 * |
| | (0.032) | (0.031) | (0.049) | (0.049) |
| Treat × Post * PRCb | | 0.252 *** | | 0.294 * |
| | | (0.095) | | (0.150) |
| Treat × Post | | 0.023 | | 0.116 |
| | | (0.051) | | (0.075) |
| Constant | 5.822 *** | 5.858 *** | 1.612 *** | 1.688 *** |
| | (0.017) | (0.016) | (0.027) | (0.027) |
| Observations | 230,137 | 214,191 | 230,137 | 214,191 |
| R-squared | 0.445 | 0.444 | 0.196 | 0.194 |
| City–year FE | YES | YES | YES | YES |
| Industry–year FE | YES | YES | YES | YES |
| Disclaimer/Publisher’s Note: The statements, opinions and data contained in all publications are solely those of the individual author(s) and contributor(s) and not of MDPI and/or the editor(s). MDPI and/or the editor(s) disclaim responsibility for any injury to people or property resulting from any ideas, methods, instructions or products referred to in the content. |
© 2025 by the authors. Licensee MDPI, Basel, Switzerland. This article is an open access article distributed under the terms and conditions of the Creative Commons Attribution (CC BY) license (https://creativecommons.org/licenses/by/4.0/).


