Article

Modeling the Growth Dynamics of Logistics Performance: Industrialization, Environmental Technology, and Economic Transformation in Manufacturing Economies

School of Economics and Management, Department of Logistics Engineering and Management, Chang’an University, Xi’an 710064, China
*
Author to whom correspondence should be addressed.
Systems 2025, 13(5), 375; https://doi.org/10.3390/systems13050375
Submission received: 2 April 2025 / Revised: 30 April 2025 / Accepted: 7 May 2025 / Published: 13 May 2025

Abstract

:
Global manufacturing economies have faced logistics performance challenges in recent decades. This study investigates the influence of industrialization, environmental technology, trade openness, foreign direct investment, and economic growth on the logistics performance index in the top 20 manufacturing economies from 2007 to 2023. This study used an advanced panel approach to obtain robust results, cross-section dependency, a unit root test and a panel cointegration test. The panel quantile regression (PQL) and panel quantile estimates based on income methods were employed to analyze long-run and short-run estimations. The empirical results show that industrialization accelerated across all the quantiles except at the 10th quantile, while environmental technology had a significantly positive impact on logistics performance across all quantiles (10th–90th). Moreover, our baseline model was further supported by the fact that we used Driscoll–Kraay and Prais–Winsten’s estimates and a panel causality test. Our findings reveal that in manufacturing countries, industrialization, environmental technology, and economic growth have a positive impact on logistics performance. This study proposes several recommendations to improve industrialization and environmental technology in manufacturing countries to promote logistics performance. At the same time, more resources should be allocated for industrialization as well as environmental technologies to promote logistics performance.

1. Introduction and Background

In the context of global manufacturing economies, the role of logistics performance has become critically important. Logistics entails the systematic planning, execution, and management of the movement of goods and services from their point of origin to their final destination. This process encompasses the coordination of various activities to ensure the efficient and timely delivery of products to end consumers. It encompasses essential activities such as transportation, storage, inventory management, and distribution. Moreover, logistics plays a vital role in international trade by facilitating market expansion and enabling businesses to access new growth opportunities [1,2]. According to an OECD report on international trade among its member countries, the logistics sector contributes, on average, approximately 10% of GDP in OECD economies, underscoring its economic importance. Forecasts suggest that this contribution will continue to grow in the coming years, further emphasizing the sector’s expanding role in global economic development [1,2].
Advancements in logistics have been among the most significant social and economic developments in recent decades, often described as a transformative shift in production, storage, distribution, and transportation processes [3]. This transformation has reshaped the efficiency and scope of supply chains, allowing for more agile and responsive business models. The vital role of logistics in economic development is evident in its ability to reduce costs, improve service delivery, and enhance overall market efficiency [4]. Furthermore, advancements in logistics facilitate the seamless operation of global supply chains, promoting greater economic interdependence and resilience [5]. Evaluating the impact of logistics on the growth of global manufacturing economies is a subject of significant academic and practical interest. However, despite its crucial role in the modern economy, logistics has been relatively underexplored as a key factor in global production within the existing literature. This study seeks to bridge this gap by demonstrating that integrating logistics into the analytical framework of global manufacturing economies improves the accuracy of empirical estimates compared to conventional models [6]. Moreover, by analyzing logistics through its distinct components, this study offers a more nuanced understanding of its strengths and limitations, enabling more precise economic interpretations.
Environmental technology includes many advancements designed to mitigate environmental effects and enhance sustainability in manufacturing processes, along with supply chains. Sustainable transportation methods, waste minimization techniques, and renewable energy solutions exemplify environmental technology that can markedly enhance logistics performance [7]. More logistics firms are now taking environmental management as their fundamental principle. Environmental management encompasses the implementation of principles, eco-friendly practices and technologies, waste reduction initiatives, and enhancement of corporate social responsibility, which might also provide a competitive advantage for these firms [8,9]. Environmental management must be approached systemically, thereby integrating environmental practices throughout all organizational levels. In the realm of ecological modernization, it is asserted that environmental law, innovations in environmental technology, and enhancements in corporate environmental performance may evolve together [10]. An assessment of a company’s dedication to environmental sustainability should also be conducted. This demonstrates the company’s commitment to environmental management. The degree of commitment is often referred to as the evolutionary phase or competency level of environmental management [11]. The influence of globalization on environmental technologies and environmental impacts has received insufficient attention in current research, despite evidence indicating its effect on several indices [12]. Global commerce and investment have become progressively interrelated and interdependent as national economies have diminished in self-sufficiency and isolation, leading to a reduction in trade and investment barriers, regulations, and cultural disparities [13]. There is an urgent need to enhance manufacturing and productivity for economic growth. Environmental technology innovation has played a crucial role in enhancing productivity. Environmental technologies are defined as manufacturing equipment, processes, practices, and the creation of new products, and delivery systems that limit or alleviate the adverse environmental impacts of products and services [14]. Historically, it has been customary for environmental enhancements to concentrate on technologies that capture and manage pollutants at the moment of their generation, before they are discharged into the environment. Pollution control is a significant factor in this category of environmental technology. Although technology for pollution control has been the central concern for environmentalists, recent studies advocate for prioritizing mitigation, reduction of sources, or clean technologies to diminish the initial generation of pollution [15]. As a result of these forms of technology, resources can be utilized more efficiently, products include fewer hazardous elements, and environmental deterioration is mitigated. Intensifying energy use, heightened waste generation, water scarcity, and increasing ecological footprints are all contributors to environmental degradation [16]. The rapid pace of technological progress presents potential for economic growth; however, it also creates a substantial challenge for humanity when it comes to preserving the general quality of the environment. Humans are expected to gain from environmentally specialized technology to achieve the dual objectives of economic prosperity and a sustainable environment [17]. Green growth has become essential for countries in achieving the sustainable development objectives of an unpolluted environment. The role of technological innovation and clean energy in facilitating the cleaner production of products and services is crucial for achieving green development [18].
This study is novel because it focuses on the top 20 manufacturing economies’ logistic performances and how they are influenced by environmental technologies targeting environmental factors. Existing literature has focused on how environmental policies are efficient in environmental protection, particularly through logistics networks [19]. This study further investigates how trade openness, industrialization, and economic growth as control variables influence logistic performance in the presence of environmental technologies. Furthermore, selected countries belong to different regions and have varied logistics networks and environmental policies. Due to long-run heterogeneity, we divided the whole sample and investigated these effects based on income level. Moreover, this study uses panel quantile regression estimates, as this technique measures effects at various levels rather than average effects. A series of robust estimates is applied to confirm the validity of baseline model estimates.
The remainder of the study is organized as follows: Section 2 provides a summary of the relevant theoretical and empirical literature. Section 3 outlines the methodology and data collection procedures. Section 4 presents the results, key findings, and discussion. Finally, Section 5 offers concluding remarks and policy recommendations.

2. Literature Review

In consideration of the research goals of our study, the literature review is separated into two categories:
(1)
Environment-related technology and logistics performance.
(2)
Industrialization and logistics performance.

2.1. Environment-Related Technology and Logistics Performance

The term “environmental technology” possesses a broad definition and has a deep connection with logistics performance, as indicated by various research studies [20]. One such study investigated the impact of environment-related technology on the pursuit of carbon neutrality by 2050 among the world’s leading industrial nations (China, US, UK, Brazil, India, Indonesia, Mexico, Russia, and Turkey) from 1992 to 2018. The study utilized pertinent panel econometric methods and discovered that environment-related technologies reduce carbon emissions in both the short and long term, with elasticities of 0.33 and 0.17, respectively [21]. The findings also indicated that ecologically relevant technologies served a moderating function by mitigating the detrimental effects of primary energy consumption in the analyzed countries [22]. Previous research indicates that environmental rules improve environmental quality. It is asserted that environmental rules reduce greenhouse gas emissions in BRICS countries [23].
Furthermore, it has been established that enhancing environment-related technology mitigates environmental risk and enhances environmental conditions. The authors of [24] determined that environmental technology serves as a mediating variable between globalization and environmental risk in the context of countries of the BRI. The authors of [25] investigated the degree to which advances in technology enhance environmental standards in the USA, and the results corroborated that technological improvements safeguard the environment. The authors of [26] contended that globalization and excessive utilization of non-renewable energy resources are the primary contributors to escalating environmental risk. The authors of [27] argued that green technology mitigates the detrimental impacts of increasing energy use and globalization on the environment. In [28], research on 117 countries indicated that environmental rules adversely impact the quality of the environment in low- and middle-income nations. But they positively influence environmental quality in high-income countries [29]. This article asserts that the utilization of environmental technologies in the top 20 manufacturing economies enhances the performance of logistical operations.

2.2. Industrialization and Logistics Performance

Several studies within the logistics sector have concentrated on evaluating competitiveness using efficiency analysis. Globalization has evolved as an international phenomenon due to the rapid expansion of the global economy, driven by escalating economic and social transactions [30]. As the scope of the supply chain and logistics has improved internationally, the logistics business is progressively evolving due to the transformations linked to globalization [22,31] and the reliance on physical logistics support for the delivery of products or services, including material handling, loading/unloading, packing, labeling, warehousing, and transport [32].
Other fields within modern literature examine the impact of industrialization on enhancing logistics performance from the standpoint of leading manufacturing economies. Notwithstanding the evident linkages, attaining elevated degrees of industrialization continues to be a pivotal objective of governmental endeavors. The industrialization plans of numerous countries, particularly China, have resulted in substantial enhancements in the logistics industry [33]. Despite this link, it was shown that robust industrial expansion in certain developing countries can, in the long term, impact logistics performance [34].
It is an essential, crucial, and pivotal industry that supports the advancement of the national economy. In recent years, technological advancements, economic globalization, and the swift progression of the logistics sector have prompted substantial research by local and international experts on the correlation between the logistics sector and economic growth [35].
Grounded in ecological modernization theory (EMT), this investigation examines how environmental innovation and industrial transformation collectively shape logistics performance in manufacturing economies. EMT’s fundamental premise that technological and institutional advancements can harmonize economic and environmental objectives finds particular relevance in logistics systems [36]. The adoption of green technologies (e.g., intelligent transportation systems, renewable energy-powered warehouses) illustrates EMT’s operationalization, where ecological improvements drive logistical efficiency gains. Industrial expansion simultaneously necessitates and enables sustainable logistics development, creating virtuous cycles of performance enhancement. This theoretical alignment confirms that environmental technology serves as both a catalyst and enabler of sustainable logistics modernization in industrial contexts.

2.3. Research Gap and Contribution of the Study

This study makes a significant contribution by exploring how environmental technology and industrialization together influence logistics performance in the world’s top 20 manufacturing economies. This area has received limited attention in previous research, unlike earlier studies that typically focused on transportation, energy efficiency, or emissions in isolation [7]. This research adopts an integrated approach to examine the interplay between environmental innovation and industrial advancement. The analysis covers the top 20 manufacturing countries-representing over 85% of global manufacturing output, classified by income level to provide a nuanced cross-country comparison. Although the limited number of lower–middle-income countries in the sample, due to data constraints, calls for cautious interpretation of findings for this group, the use of robust panel quantile regression methods enhances the reliability of the results. Overall, the study offers valuable empirical insights for aligning industrial growth with sustainable logistics practices across diverse manufacturing economies.

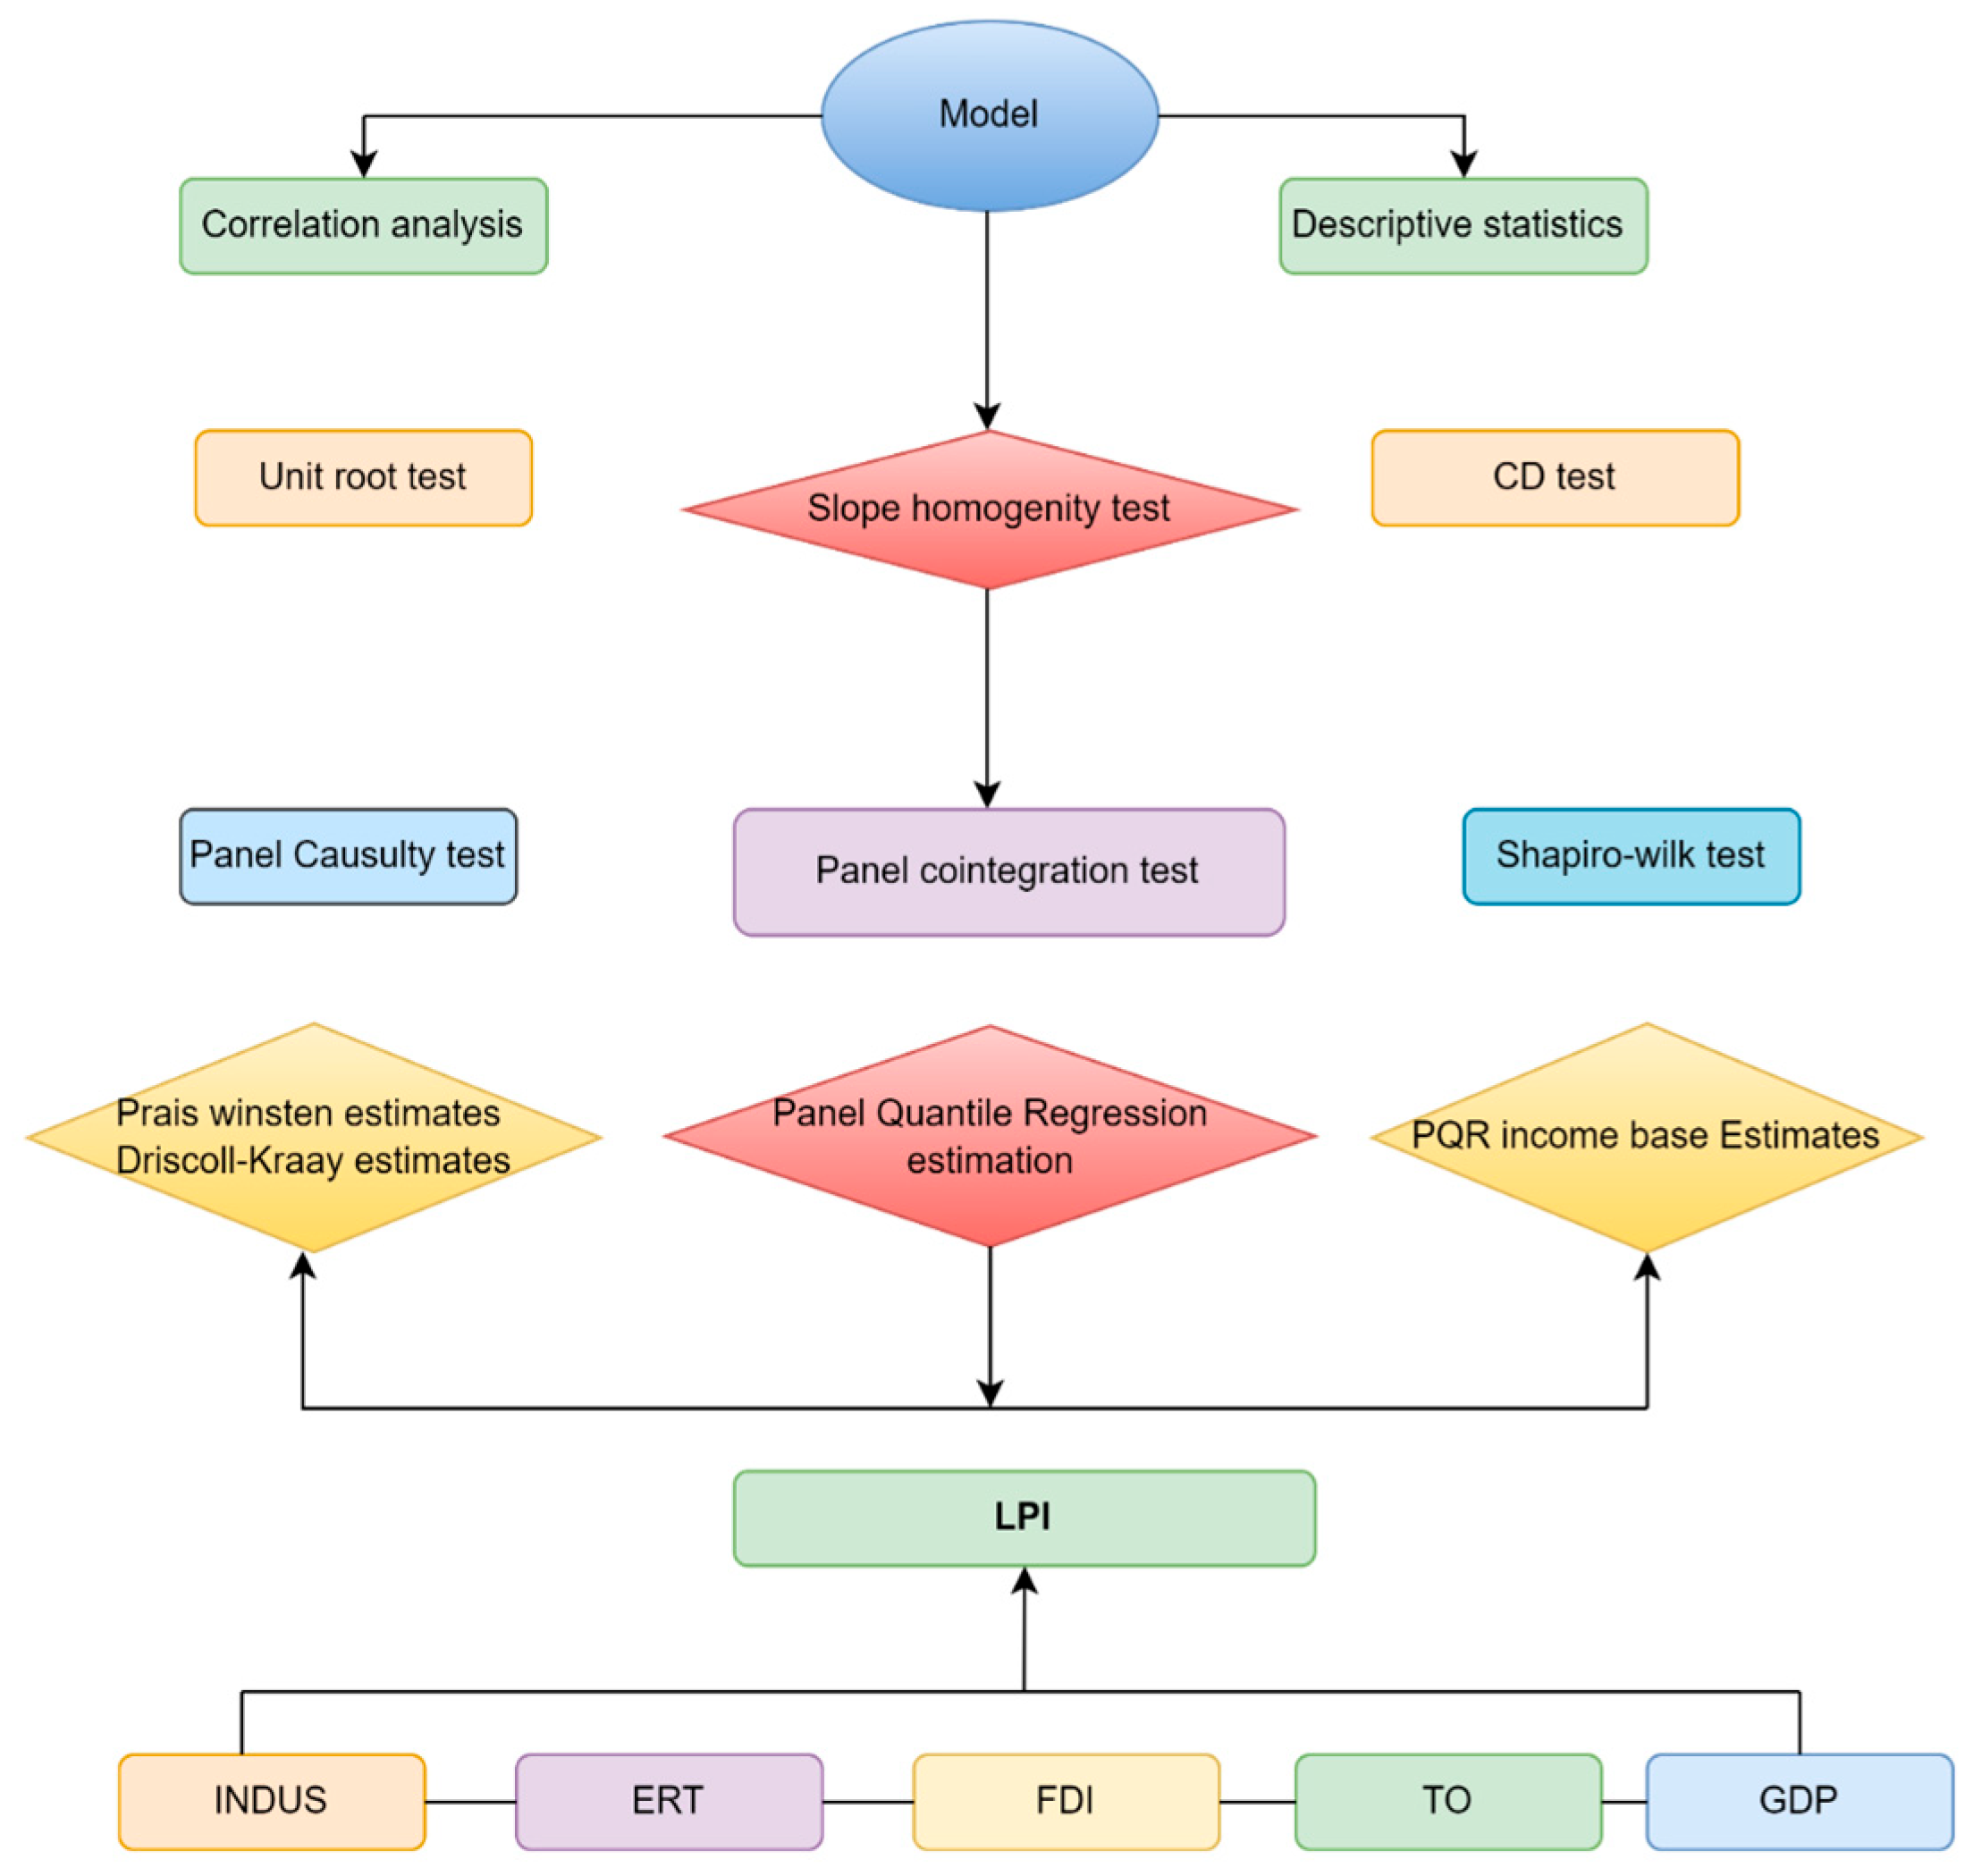
3. Conceptual Framework, Methodology, and Model Selection

3.1. Conceptual Framework

This research investigates the interconnections between environmentally relevant technologies, industrialization, trade openness, foreign direct investment, and gross domestic product, aiming to improve logistical performance efficiency. The analysis panel data pertained to the top 20 selected global manufacturing economies between 2007 and 2023 (Appendix A). The existing research has established that the integration of environmentally oriented technology enhances logistical performance [37]. Moreover, various studies have validated the concept that environment-related technology enhances logistical performance [38,39,40]. Considering these substantial findings as a foundational basis, a theoretical framework is developed to clarify the direct and indirect relationships among the selected variables. The subsequent figure illustrates this relationship in the following manner.

3.2. Specification of the Empirical Models

This study investigates the intricate relationship between enhancements in environmental technology and industrialization, aiming to improve logistical efficiency and operational capacities in prominent manufacturing countries globally (Figure 1). The relationship between advancements in environmental technology and industrial development significantly impacts logistics performance. The figure below illustrates the correlation between the variables.

3.3. Variable Selection and Data

3.3.1. Dependent Variable

This study examines the logistics performance index (LPI) as the dependent variable, consisting of six essential dimensions that jointly measure the efficiency and effectiveness of logistics services in a particular country. The six parameters are as follows: logistical proficiency and excellence (LP), which evaluates the competence and quality of logistics services, measuring the ability of service providers to deliver exceptional standards; infrastructure quality (LQT), which highlights the robustness of trade and transport infrastructure that supports logistics operations, encompassing ports, highways, and information systems; facilitation of organizing competitively priced shipments (LPSs), which assesses the ease of arranging shipments at competitive rates, which is crucial for cost-effective logistics operations; tracking and tracing consignments (LTCs), which allows us to evaluate the capacity to monitor and trace shipments, an essential factor for maintaining visibility and reliability in supply chains (Table 1); timeliness of shipments (LFS), which assesses the consistency with which shipments reach their intended destination within the expected timeframe, indicating the reliability of logistics services; and efficiency of customs clearance (LCC), which evaluates the efficiency of the customs clearance process, an essential element in ensuring seamless and prompt international exports. The six dimensions are utilized to calculate the overall logistics performance index (LPI), graded on a scale from 1 to 5, with 1 indicating inadequate logistics performance and 5 representing exceptional, world-class logistics. We adopted the same approach as outlined in a recent study by [41] during an examination of European countries. A recent study used indicators similar to those used for measuring the logistics performance index [42,43]. The details and data sources of logistics index indicators are given below.

3.3.2. Independent Variable

Research studies have evaluated environmental technologies using many variables [44]. Environment-related technology has been applied as a percentage of the overall technologies as a proxy measure, whereas [21] employed per capita environmental technology inventions, together with the global invention percentage, to measure environmentally connected technologies. Additionally, [22], along with [45], have employed advancements in environmental technology and carbon emission reduction technology as proxies to evaluate environment-related technology. Environmental-related patent technologies are considered an important tool with regard to environmental concerns [46]. Further, the addition of green innovation from the WIPO database is an important indicator of environmental performance, particularly when used to control emissions levels and maintain environmental quality [47]. To construct the environmental technology index (Table 2), using principal component analysis (PCA) in STATA 17, first, we standardized these variables to (0 and 1) using the following formula:
V A R i t = X i t m i n ( X i ) m a x ( X i ) m i n ( X i )
where V A R i t is the standardized value of the variable X country i at time t, X i t is the original value, and m i n ( X i ) and m a x ( X i ) are the minimum and maximum values of X across all countries and years (2007–2023). The index i ranges from 1 to 20 (representing the top 20 manufacturing economies), and t ranges from 2007 to 2023. This procedure is followed based on recent studies [48].

3.3.3. Control Variables

  • ▪ GDP growth
The economic advancement of a country is fundamentally linked to the effectiveness of its logistics performance. Countries with a significant gross domestic product (GDP) often invest more resources in infrastructure development, including ports, trains, and roadways, which are critical components of an efficient logistics system. Increased economic productivity is associated with enhanced customs and border management, logistics service proficiency, and the ability to monitor and trace shipments, which are essential components of the logistics performance index (LPI) [49]. Furthermore, [50] states that countries with superior economic resources generally succeed in reducing transportation costs and enhancing logistics, therefore facilitating more efficient trade and distribution systems.
  • ▪ Industrialization
Industrialization fulfills a dual role in improving logistics performance. The authors of [51] emphasize the necessity for enterprises to adopt more sustainable practices by integrating environmental technologies. They claim that effective logistics systems, supported by sustainable technologies, are crucial for countries attempting to balance industrial progress with environmental sustainability.
  • ▪ Trade openness
Trade openness positively influences the gross domestic product (GDP) of manufacturing nations by enhancing productivity and enabling enterprises to focus on their comparative advantages. The authors of [52] assert that nations engaged in manufacturing and adopting open trade policies typically witness rapid economic growth, as improved market access increases the demand for goods and services, leading to a higher GDP. This economic expansion creates the financial capital essential for additional investments in logistics infrastructure, creating a reciprocal connection in which enhanced logistics promote trade and drive economic growth.

3.4. Econometric Model

This research examined the impact of environment-related technology and industrialization on logistics performance in the top 20 manufacturing economies from 2007 to 2023. The following econometric model was constructed to conduct an empirical investigation.
L P I i = β 0 + β 1 I N D U S i + β 2 E R T i + γ 1 F D I i + γ 2 G D P i + γ 3 T O i + ϵ i
Within the context of the input variables, the logistics performance index (LPI) functions as the dependent variable in the analytical framework (Table 3). The logistics performance index (LPI) consists of six essential dimensions that evaluate logistics performance: competence and quality of logistics services (LP), quality of trade and transport-related infrastructure (LQT), ease of arranging competitively priced shipments (LPS), ability to track and trace consignments (LTC), frequency of shipments arriving at the consignee within the expected timeframe (LFS), and efficiency of the customs clearance process (LCC). The LPI is assessed on a scale from 1 (substandard) to 5 (outstanding), indicating the logistics performance of a certain nation. The independent variables include industrialization (INDUS), reflecting the degree of industrial growth in a country, and environment-related technology (ERT), assessing advancements in technologies aimed at reducing environmental effects, particularly in the logistics industry. The controlled variables comprise foreign direct investment (FDI), measured as net inflows (% of GDP), which represents external investments that affect logistics infrastructure and efficiency. Gross domestic product (GDP) signifies a nation’s economic production and its subsequent impact on logistics capabilities. Trade openness (TO) is evaluated as the proportion of trade (exports and imports) relative to GDP.

3.5. Econometric Methodology

3.5.1. Cross-Sectional Dependence

This study identifies 20 top global manufacturing economies based on data availability. The establishment of cross-sectional dependence (CD) may pose a considerable issue, given the common characteristics linked to logistics efficacy. Therefore, it is essential to examine CSD to prevent the possibility of obtaining conflicting estimations. We utilized the Pesaran CD test to evaluate the cross-sectional dependence among the variables selected [53]. This specific test is generally carried out in panel data systems to investigate CSD and has been chosen due to the fact that alternative and commonly used panel unit root evaluations could produce biased and unreliable results in the context of CSD [24]. We executed the Pesaran CD test as delineated by [54] to detect CSD. The econometric equation for the CD test is given as follows:
L M C D = T i = 1 N 1 . j = i + 1 N α ^ 2 i j ~ N 0 , 1
The Pesarans CD test for our baseline model is expressed as follows:
2 T N N 1 i = 1 N j = i + 1 N α ^ i j
In Equation (2), the residual correlation across cross-sections is given as αij. T indicates time and N indicates countries. Rejection of the Null hypothesis (Ho) shows the existence of CSD among cross-sections: Ho: Cov. (µit, µij) = 0.
The relationship between the variables was evaluated utilizing the Cross-sectionally Augmented (CIPS) test and the Cross-sectionally Augmented Dickey–Fuller (CADF) test, both of which consider cross-sectional dependence in panel data. Researchers must consider the issue of endogeneity in regression estimates, since neglecting it may result in biased outcomes and compromise the validity of the findings. Implementing appropriate econometric methods to address endogeneity is crucial for dependable regression analysis [55]. Therefore, this study has applied the test to check the stationarity for CADF, as has been explained in the Equation.
Δ Y i , t = γ i + γ i Y i , t 1 + γ i X t 1 ¯ + l = 0 p γ i l Δ Y t l ¯ + l = 1 p γ i l Δ Y i , t l + ϵ i t
The lagged parameter is denoted as Y t l ¯ while the first difference of Y t l   ¯ is represented as Δ Y t l ¯ . The CIPS statistics are computed as the average of CADF, as elucidated in Equation (5) below:
CIPS ^ = 1 N i = 1 n CADF i

3.5.2. Slope of Homonymity Test

When analyzing panel data with multiple cross-sectional units, empirical testing for homogeneity in slope coefficients becomes methodologically crucial. The null hypothesis formally states that regression parameters remain constant across all cross-sectional and temporal dimensions (indexed as i and t), while the alternative hypothesis maintains that these coefficients demonstrate significant heterogeneity, varying systematically between observational units or periods. This statistical assessment ensures model specification adequacy in longitudinal analyses. The authors of [56,57] introduced a novel homogeneity test that evaluates the assumptions of homoscedasticity in instances where T surpasses N. Within the scope of our research, we employed the test proposed by [54] to investigate the homogeneity of the coefficients. which utilize the Δ and Δ a d j statistics. These test statistics are defined as follows:
Δ = N N 1 S ~ k 2 k , Δ a d j = N N 1 S ~ E z ~ i t V a r z ~ i t
where S ~ represents the standardized sum of square residuals, k denotes the number of regressors, and E ( z ~ i t ) and V a r ( z ~ i t ) are the mean and variance of the individual slope estimates, respectively.

3.5.3. Panel Cointegration Test

This test is performed to determine the existence of lasting links between principal independent and dependent variables. Before proceeding to the estimation, it is essential to confirm the long-run relationship; if long-run cointegration among the variables is absent, we may consider an alternate model that includes short-run effects. In this study, we utilized the Wester Lund panel cointegration test [58] and the Padroni test [59]. These tests are favored due to the limitations [60]. We performed a residual-based test of the null hypothesis of cointegration in panel data and tests described in [61], which are incapable of detecting cross-sectional dependence (CSD) and heteroskedasticity.

3.5.4. Shapiro–Wilk Test

This test was developed by Samuel Sanford Shapiro in 1965 to assess normality. The null hypothesis for this evaluation asserts that a sample,   x 1 . . . . . . . . x n is extracted from a population that conforms to a normal distribution, with the statistical test result given as follows:
W = ( i = 1 n a i x i ) ^ 2 i = 1 n ( x x ¯ ) ^ 2
where x i represents the order statistics that signify the minimum value within a given sample, and x x ¯ indicates the mean value.
The coefficient a i is specified as follows:
a 1 a n = k t W 1 C
where C is a vector indicating normal distribution given as follows:
C = ( W 1 k = k t W 1 W 1 k ) ^ 2
And vector
k = ( k 1 k n ) t
The Shapiro–Wilk (SW) test’s null hypothesis H 0 suggests that the variable conforms to a normal distribution. Consequently, if the p-value exceeds 0.05, the null hypothesis is rejected, indicating that the data deviate from normality. Our findings suggest that all variables have a non-normal distribution except for environment-related technology (ERT). Thus, the panel quantile regression technique has been employed to address these econometric challenges [62].

3.5.5. Panel Quantile Estimates (Baseline Estimates)

Traditional data analysis methods ignore heterogeneous effects; however, the panel quantile regression technique achieves a better performance than many other techniques [63]. This technique was initially presented by [64]. This technique assesses the established averages of the dependent variable in relation to the independent variables, which previous econometric methods have not addressed. Panel quantile regression is favored for this study due to the non-normal distribution of the dependent variable (logistics performance index) and the independent variables (environment-related technology and industrialization). Before performing panel quantile regression, we employed the Shapiro–Wilk test on individual variables to evaluate their normality.
The results demonstrate that our variables of interest do not have a normal distribution, specifically lacking a mean of zero and constant variance. The PQL technique is advantageous, as it is less affected by outliers or extreme values in the dataset. This test is appropriate when the variables exhibit a disorganized conditional mechanism [65]. Traditional regression assesses significant coefficients by analyzing average effects, which may lead to underestimation or overestimation. Moreover, significant relevant implications are neglected [66,67]. In environmental and logistics studies, the PQL technique is frequently used, as it efficiently solves the problem of average effects and provides more reliable and efficient estimates [62,68,69,70].
Trend analysis of the logistics performance index (LPI) and environment-related technologies (ERTs) adoption rates (2007–2023) among the top 20 manufacturing economies demonstrates a persistent divergence: while LPI scores remain consistently elevated, ERT integration lags significantly (Figure 2). This misalignment highlights a fundamental disconnect in sustainable supply chain systems, wherein logistical efficiency fails to translate into eco-innovation uptake systematically. To bridge this gap, policy interventions should prioritize holistic strategies that align logistical advancements with ERT deployment, positioning environmental technologies as central, rather than supplementary, components in fostering resilient and sustainable global supply chains.

3.6. Robust Estimates (Driscoll–Kraay and Prais–Winsten Estimates)

To enhance the reliability of our baseline estimates, we conducted additional validation using Driscoll–Kraay and Prais–Winsten estimation methods, which were specifically designed to address the issues of cross-sectional dependence and heteroskedasticity identified in our model. Cross-sectional dependence can arise in panel data when observations from different units are correlated, which may lead to biased and inconsistent standard errors if not well managed. Similarly, heteroskedasticity, characterized by the non-constant variance of error terms, can result in inefficient parameter estimates. Driscoll–Kraay standard errors are suitable in this instance, as they yield robust standard errors that are invariant to cross-sectional dependency and heteroskedasticity. This methodology considers spatial and temporal correlations within the panel data. The Prais–Winston estimator is designed to mitigate serial correlation in panel data.

3.7. Panel Quantile Estimates Based on Income

Analyzing the panel quantile estimates based on income classifications—high-income, upper-middle-income, and lower-middle-income countries—reveals that a unique policy recommendation would be inappropriate. Our sample includes the twenty foremost manufacturing countries, each making substantial contributions to global production. The differences in their income classifications reveal significant inequalities in their economic structures, institutional capacities, and developmental strategies. Consequently, although all these nations rank among the top twenty manufacturing countries, their differing levels of wealth require specialized policy recommendations. A global plan would be ineffective, as it would be unable to adequately handle the unique difficulties and opportunities faced by each nation. Policy frameworks should be customized according to income levels, highlighting the unique developmental needs and capacities of high-income, upper-middle-income, and lower-middle-income countries to improve logistics performance sustainably and efficiently.
The analysis shows that upper-middle-income manufacturing countries consistently achieved high logistics performance index (LPI) scores from 2007 to 2023 (Table 4). Nevertheless, the adoption of environmental technologies in these economies remained only moderate, despite their significant potential to improve logistics efficiency (Figure 3). This gap suggests that, although these countries have attained strong logistics performance, they have not fully leveraged sustainable technological solutions. The results highlight the importance of placing greater emphasis on eco-friendly innovations within logistics operations. Effectively integrating environmental technologies could enhance both logistics performance and sustainable development in these economies (Figure 4).

4. Results and Discussions

4.1. Descriptive Statistics

The descriptive statistics show that the mean logistics performance index (LPI) is 1.987, indicating a moderate level of logistics efficiency among the chosen countries, with a minimum of 1.308 and a maximum of 2.395. The environment-related technologies (ERT) variable has a mean value of 0.164, with a minimum of 0.1 and a maximum of 1.1, indicating a relatively low adoption rate and significant differences in implementation across countries. The industrialization (INDUS) average is 0.431, with a minimum of 0.247 and a maximum of 1, indicating moderate industrial activity among the selected countries (Table 5). The results indicate that logistical performance is generally moderate, although there is significant variability in environmental technology adoption and industrial development within the selected countries. The results of these statistics are shown below.
  • ▪ Correlation analysis
Correlation analysis is essential for assessing the issue of multicollinearity among the selected variables (Table 6). Severe multicollinearity among independent variables hinders the discernment of their impacts on the dependent variable. The correlation results suggest that the selected variables exhibit negligible individual collinearity, indicating that multicollinearity is not a significant concern in our model. Additionally, a vital indicator for detecting multicollinearity is the variance inflation factor (VIF). To confirm that a model is free from multicollinearity issues, the variance inflation factor (VIF) for the overall model and each variable should generally remain below 10. Our research demonstrates that the variance inflation factor (VIF) for the entire model is 1.68, far below the minimum value, hence confirming the lack of multicollinearity. Therefore, the model is suitable for additional study. The results are given below.
In the context of many cross-sections, linked economies and globalization may enable the transmission of effects between economies, allowing improvements in any macroeconomic parameter to benefit neighboring countries through adaptive strategies (Table 7). The null hypothesis posits the nonexistence of CSD, while the alternative hypothesis indicates its existence. In our analysis, the null hypothesis is dismissed for all variables. This signifies that our model suffers from CSD, necessitating the implementation of appropriate econometric tools to resolve this issue. The results are presented below.
  • ▪ Unit root test
The issue of CSD is present in our model, and conventional tests such as the Pesaran, Fisher, and ADF tests yield unreliable estimates. Recent investigations by [71,72] employed an enhanced variant of the standard ADF regression, referred to as the “cross-sectionally augmented ADF (CADF)” and “cross-sectionally augmented IPS (CIPS)” tests, which were created by [55]. For unit root analysis in the second generation of methodologies (Table 8). The research presented indicates that the null hypothesis, Ho, for unit root analysis asserts that the presence of a unit root with cross-sectional dependence (CSD) is identical for both the CADF test and the CIPS test.

4.2. Slope Homogeneity

This test is performed to see whether the slope coefficients vary in the long run (Table 9). Our findings demonstrate the rejection of the null hypothesis at the 1% significance level, indicating that the long-run coefficients are heterogeneous. Despite the existence of autocorrelation and heteroscedasticity, the findings remain stable, indicating long-term heterogeneous variables.
  • ▪ Panel cointegration test
This test evaluates the presence of a long-term relationship among the selected variables. Before proceeding to long-run estimates, it is crucial to validate the relevance of approaches that produce short-run estimates without a long-run relationship (Table 10). In this investigation, we applied the Wester Lund panel cointegration test as proposed by [58] using the methodology of [60]. The rejection of the null hypothesis in both tests at the one percent level signifies a long-term association among the variables included in our model.
  • ▪ Shapiro–Wilk test
This test was developed by Samuel Sanford Shapiro in 1965 for the assessment of normality (Table 11). The null hypothesis for this evaluation asserts that a sample, X 1 …… X n , is extracted from a population that conforms to a normal distribution, with the statistical test result given as follows:
  • ▪ Panel Quantile estimates for baseline model
The panel quantile estimates results indicate that environmentally related technology continuously has positive impacts on logistics performance, with a more significant impact at lower quantiles and an even greater influence at higher quantiles. This indicates that environmentally related technology can function as a potent instrument for improving logistics efficiency, especially in prominent global industrialized and manufacturing countries (Table 12). The results at quantile 0.1 (0.046) indicate that although the influence is diminished at this end of the distribution, it remains significantly positive. The findings suggest that industrial nations with underdeveloped infrastructure might significantly enhance logistics and supply chain performance through investments in environmental technologies. Our results support recent findings by [73] related to green innovation in logistics service supply chains, examining how environmentally sustainable approaches might enhance logistics performance. This research underscores the vital importance of robust stakeholder connections in facilitating the uptake of green technologies. Furthermore, innovations in environmentally related technology significantly improve logistical efficiency in industrial nations. Our study corroborates the conclusions of other prior studies, which have indicated that environmental technology enhances environmental quality while simultaneously decreasing logistics operational costs [22,25]. The findings from our quantile regression study for the second independent variable, industrialization (INDUS), indicate a non-linear effect on logistics performance in leading manufacturing economies, exhibiting considerable heterogeneity throughout the distribution. At the lowest quantile (0.1), industrialization exerts a negative effect (−0.27), showing that logistics performance is impeded in these countries due to issues of infrastructure.
At the median quantile, industrialization significantly enhances logistics, suggesting that these nations are initiating advancements in industrialization through the incorporation of technology and automation, hence improving logistics performance. The results at the 90th percentile demonstrate a markedly positive impact of industrialization on logistics performance (0.435). In these countries, a more sophisticated industrial system and enhanced infrastructure significantly improve trade, facilitating both imports and exports. Our results support the recent findings by [35] which indicate that industrialization significantly influences logistics performance by enhancing operational efficiency and scalability. As businesses expand, the demand for logistics services increases, necessitating improved infrastructure and sophisticated technologies. Innovations like automation and data analytics enhance logistical operations and facilitate cost reduction. Furthermore, industrialization facilitates the establishment of global supply chains, which depend on the effective coordination and administration of logistics operations. Nevertheless, it presents obstacles such as heightened energy consumption and environmental issues, emphasizing the necessity of implementing sustainable practices in logistics operations. In summary, industrialization offers both opportunities and problems that impact the development of the logistics sector.
  • ▪ Robustness Check (Driscoll–Kraay and Prais–Winsten Estimates
We identified cross-sectional dependence and heteroskedasticity in our model and utilized a panel quantile regression approach, which is robust to extreme data values. To improve the validation of our baseline estimates, we employed Driscoll–Kraay and Prais–Winsten estimation methods, which effectively tackle cross-sectional dependence and heteroskedasticity (Table 13). The results from both methods confirmed our earlier findings, demonstrating that environment-related technology and industrialization have a positive and significant impact on logistical performance. The influence of environment-related technologies was shown to be more substantial than that of industrialization. The Driscoll–Kraay standard errors and the heteroskedasticity-adjusted standard errors from the Prais–Winsten estimations confirmed the robustness of these results. The results of these two robust estimating approaches are provided below.
The instrumental variable (IV) regression results demonstrate that environmental technology adoption (ERT) exerts a statistically significant and economically meaningful positive impact on logistics performance (LPI), with a coefficient of 3.578 (p < 0.01) after accounting for endogeneity (Table 14). The first-stage results confirm the validity of the lagged LPI instrument (coefficient = 0.269, p < 0.01), with strong identification (Cragg-Donald F = 33.62 exceeding the 10% Stock–Yogo critical value of 16.38) and no evidence of under-identification (Anderson LM χ2 = 30.79, p = 0.000). While industrial activity negatively affects LPI (−1.669, p < 0.01) and trade openness has positive effects (1.501, p < 0.01), the robust IV estimates suggest that promoting environmental technologies could substantially enhance logistics efficiency in upper-middle-income economies, with the instrument passing all relevant diagnostic tests for strength and validity.

4.3. Panel Quantile Estimates Based on Income

Our baseline model produces significant results that are consistent with previous studies, especially in light of the selection of top global manufacturing countries from various areas. These countries exhibit varying degrees of development, with some being extremely advanced and others less so, which can be attributed to differences in infrastructure, trade policy, and technical progress in logistics performance. A uniform policy cannot be implemented across all countries due to their unique economic and logistical circumstances. In this context, we have analyzed our foundational model predicated on income levels. The model’s findings illustrate the influence of independent and control factors on the dependent variable across various income categories (Table 15). In high-income countries, the independent variable industrialization (INDUS) has a coefficient of 0.1012 (standard error: 0.1564), suggesting that its impact on logistics performance is quite minimal. This is likely due to these countries having established infrastructure and effective supply chains, hence diminishing the marginal effect of additional industrialization. The second independent variable, environmental technology (ERT), exhibits a substantial positive effect (0.7729 ***), signifying that environmentally connected technologies improve logistics performance. High-income countries dedicate significant expenditures to green logistics technologies to enhance logistical efficiency. In upper-middle-income nations, the coefficient for industrialization (INDUS) is negative and statistically significant (−0.3524 **), indicating insufficient emphasis on logistics infrastructure development, which constrains the beneficial effects of industrialization on logistics performance. Environmental technology (ERT) exerts a positive and significant influence (0.3864 ***), indicating that these economies are progressively investing in environmental technologies to reduce operational expenses and conserve energy resources, consequently enhancing logistics performance. Our results support the recent findings by [74,75]. Strategies for countries that have different income levels to attain global objectives must include the substantial variations among areas. High-income countries frequently impose standardized economic and social reforms, anticipating that other countries will adopt similar infrastructural models. Upon examining the impact of several variables on nations with varying income levels, it is clear that a universal strategy is impractical for policymakers. The manufacturing countries that dominate a substantial share of global production exhibit considerable disparities in infrastructure, logistics capacity, and economic development. Consequently, establishing customized policies that represent these differences is crucial. The results of the panel quantile estimates based on income are presented below.
  • ▪ Dumitrescu and Hurlin Panel causality
This study employed the Dumitrescu–Hurlin heterogeneous panel causality test to examine the nature of causal relationships [76]. The results of this test are presented in the table below. A bidirectional causal relationship exists between the logistics performance index and environment-related technologies; advancements in environment-related technologies enhance logistics infrastructure, thereby decreasing operational costs and promoting the adoption of green technologies to foster a sustainable environment in manufacturing countries (Table 16). These findings are in line with a recent study by [77]. The danger of energy security and environment-related technology has a bidirectional causal relationship. Environmentally focused technology enhances the equilibrium between energy consumption and output ratio. Increased energy-related hazards compel stakeholders to improve ecologically efficient technology for risk mitigation and environmental conservation. Similarly, the greater the efficiency of environmental technology, the lower the energy-related dangers, and conversely, a unidirectional causal relationship exists between logistical performance and industrialization. These findings demonstrate a need for improved logistical infrastructure, optimized supply chain networks, and decreased operational expenses to foster industrial growth substantially. A recent study by [35] described the significance of advanced development in the logistics sector for realizing high-quality economic growth, promoting the adoption of diverse strategies at different stages of industrial structural evolution to enhance the logistics industry’s superior development and achieve high-quality economic progress.

5. Conclusions and Policy Implications

This study investigates how advancements in environmental technology and the process of industrialization have influenced logistics performance across the world’s top 20 manufacturing economies during the period from 2007 to 2023. Utilizing advanced empirical techniques, including panel quantile regression, Driscoll–Kraay standard errors, and Prais–Winsten estimators adjusted for heteroskedasticity, the results reveal that both factors significantly improve logistics performance. Importantly, environmental technology exhibits a more pronounced and consistent influence compared to industrialization, especially in countries with greater technological capabilities and institutional preparedness. The findings remain consistent across different income groups, with the most significant advantages observed in high- and upper-middle-income countries. Furthermore, control variables such as GDP, trade openness, and foreign direct investment (FDI) also show positive and significant effects, underscoring the importance of macroeconomic and trade-related factors in enhancing national logistics performance.
Acknowledging the varied impacts across different income groups, the study recommends tailored, income-specific policy approaches. For high-income nations such as Germany and Japan, policies should focus on implementing cutting-edge logistics technologies, including AI-powered supply chain platforms and zero-emission freight systems, supported by tax incentives for research and development. In upper-middle-income countries like China and Brazil, priority should be given to expanding eco-industrial zones and integrating circular economy practices into logistics through public–private collaborations. Conversely, lower-middle-income countries such as India and Indonesia should concentrate on building institutional capacity, increasing access to climate finance, and promoting international technology transfer to advance sustainable logistics development. These recommendations are designed to align with the distinct infrastructural and institutional capabilities of each group while supporting broader sustainable industrial transformation goals.
A key limitation of this study is the uneven representation of countries across income groups, with 12 classified as high-income, 6 as upper-middle-income, and only 2 as lower-middle-income economies. This disparity arises due to the availability of data on essential indicators during the 2007–2023 period. As a result, the findings related to lower-middle-income countries should be interpreted cautiously, since they may not fully reflect the heterogeneity within this category. Nonetheless, the use of rigorous estimation methods, particularly panel quantile regression, enhances the internal validity of the results. Future research should prioritize expanding the sample to encompass a wider range of lower-income countries, thereby enhancing the robustness of comparative analyses and improving the external validity and generalizability of the results in diverse economic contexts.
The study period includes two significant structural shocks: the 2008 global financial crisis and the COVID-19 pandemic, both of which profoundly impacted global trade patterns, industrial production, and logistics operations. While our estimation methods address heteroskedasticity and cross-sectional dependence, they do not explicitly incorporate structural breaks. Therefore, we recognize this as a methodological constraint and suggest that future research should employ structural break tests, such as the Bai–Perron procedure, or regime-switching models to more effectively capture the distinct impacts of these major global disruptions.
Emerging geopolitical risks, with notable examples including the escalation of trade tensions and the imposition of tariffs in early 2025—especially between the United States and China—introduce significant challenges for global supply chains. These developments threaten to compromise logistics efficiency and hinder the spread of environmental technologies, particularly in countries that depend heavily on imported green innovations and international collaboration. In response, governments should implement resilient logistics strategies that focus on enhancing regional supply chain integration, diversifying trade partnerships, and fostering domestic innovation in green logistics to mitigate the negative impacts of policy uncertainty and economic instability.
Despite the valuable contributions of this research, several limitations should be acknowledged. First, the focus on the top 20 manufacturing economies may restrict the applicability of the findings to smaller or less-industrialized countries, which often face unique challenges in technological adoption and infrastructure development. Second, the use of a composite logistics performance index limits the ability to analyze its components, such as customs efficiency and infrastructure quality, which can have distinct effects on logistics outcomes. Future studies would benefit from disaggregating logistics performance measures to gain more detailed and nuanced insights. Finally, incorporating crisis-period dummy variables or firm-level data could provide a more granular understanding of how environmental technology and industrialization respond to macroeconomic shocks. In conclusion, this study offers strong evidence that environmental technology plays a critical role in enhancing logistics performance within manufacturing economies. By designing policies tailored to the specific income levels of countries and strengthening resilience against global disruptions, governments can facilitate a more rapid transition toward sustainable, efficient, and future-oriented logistics systems.

Author Contributions

Conceptualization, U.H. and L.Q.; methodology, U.H. and L.Q.; software, U.H.; validation, M.S. and W.N.; formal analysis, L.Q.; investigation, W.N.; resources, U.H.; data curation, U.H.; writing—original draft preparation, U.H.; writing—review and editing, M.S.; visualization, U.H.; supervision, L.Q.; funding acquisition, U.H. All authors have read and agreed to the published version of the manuscript.

Funding

This research received no external funding.

Data Availability Statement

The original data presented in the study are openly available in [repository mention in Table 1, Table 2 and Table 3. Data source].

Conflicts of Interest

The authors declare that they have no known competing financial interests or personal relationships that could have appeared to influence the work reported in this paper.

Appendix A

Table A1. List of countries.
ChinaSouth KoreaUnited KingdomCanada
United statesMexicoIndonesiaSpain
JapanItalyBrazilSaudi Arabia
GermanyRussian FederationIrelandSwitzerland
IndiaFranceTurkeyThailand
Figure A1. Plots of selected variables.
Systems 13 00375 g0a1

Notes

1
2
3

References

  1. Jomthanachai, S.; Wong, W.P.; Khaw, K.W. An application of machine learning to logistics performance prediction: An economics attribute-based of collective instance. Comput. Econ. 2024, 63, 741–792. [Google Scholar] [CrossRef]
  2. Kinra, A.; Hald, K.S.; Mukkamala, R.R.; Vatrapu, R. An unstructured big data approach for country logistics performance assessment in global supply chains. Int. J. Oper. Prod. Manag. 2020, 40, 439–458. [Google Scholar] [CrossRef]
  3. Göçer, A.; Özpeynirci, Ö.; Semiz, M. Logistics performance index-driven policy development: An application to Turkey. Transp. Policy 2022, 124, 20–32. [Google Scholar] [CrossRef]
  4. Beysenbaev, R.; Dus, Y. Proposals for improving the logistics performance index. Asian J. Shipp. Logist. 2020, 36, 34–42. [Google Scholar] [CrossRef]
  5. Giuffrida, M.; Jiang, H.; Mangiaracina, R. Investigating the relationships between uncertainty types and risk management strategies in cross-border e-commerce logistics. Int. J. Logist. Manag. 2021, 32, 1406–1433. [Google Scholar] [CrossRef]
  6. Del Rosal, I.; Moura, T.G.Z. The effect of shipping connectivity on seaborne containerised export flows. Transp. Policy 2022, 118, 143–151. [Google Scholar] [CrossRef]
  7. Wei, S.; Jiandong, W.; Saleem, H. The impact of renewable energy transition, green growth, green trade and green innovation on environmental quality: Evidence from top 10 green future countries. Front. Environ. Sci. 2023, 10, 1076859. [Google Scholar] [CrossRef]
  8. Haden, S.S.P.; Oyler, J.D.; Humphreys, J.H. Historical, practical, and theoretical perspectives on green management: An exploratory analysis. Manag. Decis. 2009, 47, 1041–1055. [Google Scholar] [CrossRef]
  9. Jabbour, C.J.C. Tecnologias ambientais: Em busca de um significado. Rev. Adm. Pública 2010, 44, 591–611. [Google Scholar] [CrossRef]
  10. Sarkis, J.; Zhu, Q.; Lai, K.-h. An organizational theoretic review of green supply chain management literature. Int. J. Prod. Econ. 2011, 130, 1–15. [Google Scholar] [CrossRef]
  11. Jabbour, C.J.C.; Neto, A.S.; Gobbo, J.A., Jr.; de Souza Ribeiro, M.; de Sousa Jabbour, A.B.L. Eco-innovations in more sustainable supply chains for a low-carbon economy: A multiple case study of human critical success factors in Brazilian leading companies. Int. J. Prod. Econ. 2015, 164, 245–257. [Google Scholar] [CrossRef]
  12. Cheng, Y.; Sinha, A.; Ghosh, V.; Sengupta, T.; Luo, H. Carbon tax and energy innovation at crossroads of carbon neutrality: Designing a sustainable decarbonization policy. J. Environ. Manag. 2021, 294, 112957. [Google Scholar] [CrossRef] [PubMed]
  13. Shehzad, K.; Liu, X.; Rauf, A.; Arif, M.; Mazhar, S.; Sohail, N.; Amin, W. Revolutionising tourism development in China: An effective role of ICT and Western Silk Road project. Asia Pac. J. Tour. Res. 2019, 24, 965–977. [Google Scholar] [CrossRef]
  14. Klassen, R.D.; Whybark, D.C. Environmental management in operations: The selection of environmental technologies. Decis. Sci. 1999, 30, 601–631. [Google Scholar] [CrossRef]
  15. Freeman, H.; Harten, T.; Springer, J.; Randall, P.; Curran, M.A.; Stone, K. Industrial pollution prevention! A critical review. J. Air Waste Manag. Assoc. 1992, 42, 618–656. [Google Scholar] [CrossRef]
  16. Agyekum, E.B.; Adebayo, T.S.; Bekun, F.V.; Kumar, N.M.; Panjwani, M.K. Effect of two different heat transfer fluids on the performance of solar tower CSP by comparing recompression supercritical CO2 and rankine power cycles, China. Energies 2021, 14, 3426. [Google Scholar] [CrossRef]
  17. Chu, L.K. Determinants of ecological footprint in OCED countries: Do environmental-related technologies reduce environmental degradation? Environ. Sci. Pollut. Res. 2022, 29, 23779–23793. [Google Scholar] [CrossRef]
  18. Wiebe, K.S.; Yamano, N. Estimating CO2 Emissions Embodied in Final Demand and Trade Using the OECD ICIO 2015: Methodology and Results. 2016. Available online: https://www.oecd.org/content/dam/oecd/en/publications/reports/2016/09/estimating-co2-emissions-embodied-in-final-demand-and-trade-using-the-oecd-icio-2015_g17a286b/5jlrcm216xkl-en.pdf (accessed on 5 October 2024).
  19. Wang, D.; Tarasov, A.; Zhang, H. Environmental regulation, innovation capability, and green total factor productivity of the logistics industry. Kybernetes 2023, 52, 688–707. [Google Scholar] [CrossRef]
  20. Vachon, S.; Klassen, R.D. Supply chain management and environmental technologies: The role of integration. Int. J. Prod. Res. 2007, 45, 401–423. [Google Scholar] [CrossRef]
  21. Onifade, S.T.; Alola, A.A. Energy transition and environmental quality prospects in leading emerging economies: The role of environmental-related technological innovation. Sustain. Dev. 2022, 30, 1766–1778. [Google Scholar] [CrossRef]
  22. Ahmad, M.; Zheng, J. Do innovation in environmental-related technologies cyclically and asymmetrically affect environmental sustainability in BRICS nations? Technol. Soc. 2021, 67, 101746. [Google Scholar] [CrossRef]
  23. Ulucak, R.; Kassouri, Y.; İlkay, S.Ç.; Altıntaş, H.; Garang, A.P.M. Does convergence contribute to reshaping sustainable development policies? Insights from Sub-Saharan Africa. Ecol. Indic. 2020, 112, 106140. [Google Scholar] [CrossRef]
  24. Ahmad, M.; Shabir, M.; Naheed, R.; Shehzad, K. How do environmental innovations and energy productivity affect the environment? Analyzing the role of economic globalization. Int. J. Environ. Sci. Technol. 2022, 19, 7527–7538. [Google Scholar] [CrossRef]
  25. Saud, S.; Chen, S.; Haseeb, A. The role of financial development and globalization in the environment: Accounting ecological footprint indicators for selected one-belt-one-road initiative countries. J. Clean. Prod. 2020, 250, 119518. [Google Scholar] [CrossRef]
  26. Pata, U.K.; Samour, A. Do renewable and nuclear energy enhance environmental quality in France? A new EKC approach with the load capacity factor. Prog. Nucl. Energy 2022, 149, 104249. [Google Scholar] [CrossRef]
  27. Shehzad, K.; Zeraibi, A.; Zaman, U. Testing the N-shaped environmental Kuznets Curve in Algeria: An imperious role of natural resources and economic globalization. Resour. Policy 2022, 77, 102700. [Google Scholar] [CrossRef]
  28. Sharif, A.; Saqib, N.; Dong, K.; Khan, S.A.R. Nexus between green technology innovation, green financing, and CO2 emissions in the G7 countries: The moderating role of social globalisation. Sustain. Dev. 2022, 30, 1934–1946. [Google Scholar] [CrossRef]
  29. Hashmi, R.; Alam, K. Dynamic relationship among environmental regulation, innovation, CO2 emissions, population, and economic growth in OECD countries: A panel investigation. J. Clean. Prod. 2019, 231, 1100–1109. [Google Scholar] [CrossRef]
  30. Shahbaz, M.; Mallick, H.; Mahalik, M.K.; Loganathan, N. Does globalization impede environmental quality in India? Ecol. Indic. 2015, 52, 379–393. [Google Scholar] [CrossRef]
  31. Deng, T. Impacts of transport infrastructure on productivity and economic growth: Recent advances and research challenges. Transp. Rev. 2013, 33, 686–699. [Google Scholar] [CrossRef]
  32. Martel, A.; Klibi, W.; Martel, A.; Klibi, W. Supply chains: Issues and opportunities. Des. Value-Creat. Supply Chain Netw. 2016, 1–43. [Google Scholar]
  33. Tang, C.F.; Abosedra, S. Logistics performance, exports, and growth: Evidence from Asian economies. Res. Transp. Econ. 2019, 78, 100743. [Google Scholar] [CrossRef]
  34. Raheem, I.D.; Ogebe, J.O. CO2 emissions, urbanization and industrialization: Evidence from a direct and indirect heterogeneous panel analysis. Manag. Environ. Qual. Int. J. 2017, 28, 851–867. [Google Scholar] [CrossRef]
  35. Yan, B.; Yao, B.; Zhang, C. Industrial structure, high-quality development of logistics industry and the economy. PLoS ONE 2023, 18, e0285229. [Google Scholar] [CrossRef]
  36. Provensi, T.; Marcon, M.L.; Schmidt, J.L.; Rodrigues, C.d.O.; Sehnem, S. Sustainability and innovation in the pet industry: An analysis from the perspective of Ecological Modernization Theory. Rev. Adm. Empresas 2024, 64, e2023-0247. [Google Scholar] [CrossRef]
  37. Siqi, D.; Baocheng, D. The Impact of Green Technology Innovation and Digital Transformation on the Environmental Performance of Logistics Enterprises. In Proceedings of the International Conference on Intelligent Transportation and Logistics with Big Data & International Forum on Decision Sciences, Harbin, China, 2–3 July 2023; pp. 51–64. [Google Scholar]
  38. Ahmed, N.; Areche, F.O.; Nieto, D.D.C.; Borda, R.F.C.; Gonzales, B.C.; Senkus, P.; Siemiński, P.; Skrzypek, A. Nexus between cyclical innovation in green technologies and CO2 emissions in nordic countries: Consent toward environmental sustainability. Sustainability 2022, 14, 11768. [Google Scholar] [CrossRef]
  39. Huo, W.; Zaman, B.U.; Zulfiqar, M.; Kocak, E.; Shehzad, K. How do environmental technologies affect environmental degradation? Analyzing the direct and indirect impact of financial innovations and economic globalization. Environ. Technol. Innov. 2023, 29, 102973. [Google Scholar] [CrossRef]
  40. Hussain, M.; Dogan, E. The role of institutional quality and environment-related technologies in environmental degradation for BRICS. J. Clean. Prod. 2021, 304, 127059. [Google Scholar] [CrossRef]
  41. Ju, M.; Mirović, I.; Petrović, V.; Erceg, Ž.; Stević, Ž. A Novel Approach for the Assessment of Logistics Performance Index of EU Countries. Economics 2024, 18, 20220074. [Google Scholar] [CrossRef]
  42. Wan, B.; Wan, W.; Hanif, N.; Ahmed, Z. Logistics performance and environmental sustainability: Do green innovation, renewable energy, and economic globalization matter? Front. Environ. Sci. 2022, 10, 996341. [Google Scholar] [CrossRef]
  43. Sikder, M.; Wang, C.; Yao, X.; Huai, X.; Wu, L.; KwameYeboah, F.; Wood, J.; Zhao, Y.; Dou, X. The integrated impact of GDP growth, industrialization, energy use, and urbanization on CO2 emissions in developing countries: Evidence from the panel ARDL approach. Sci. Total Environ. 2022, 837, 155795. [Google Scholar] [CrossRef] [PubMed]
  44. Alola, A.A.; Adebayo, T.S. Are green resource productivity and environmental technologies the face of environmental sustainability in the Nordic region? Sustain. Dev. 2023, 31, 760–772. [Google Scholar] [CrossRef]
  45. Usman, M.; Kousar, R.; Makhdum, M.S.A.; Yaseen, M.R.; Nadeem, A.M. Do financial development, economic growth, energy consumption, and trade openness contribute to increase carbon emission in Pakistan? An insight based on ARDL bound testing approach. Environ. Dev. Sustain. 2022, 25, 444–473. [Google Scholar] [CrossRef]
  46. Baz, K.; Zhu, Z. Life cycle analysis of green technologies: Assessing the impact of environmental policies on carbon emissions and energy efficiency. Geosci. Front. 2025, 16, 102004. [Google Scholar] [CrossRef]
  47. Salihi, A.A.; Ibrahim, H.; Baharudin, D.M. Environmental governance as a driver of green innovation capacity and firm value creation. Innov. Green Dev. 2024, 3, 100110. [Google Scholar] [CrossRef]
  48. Jima, M.D.; Makoni, P.L. Causality between financial inclusion, financial stability and economic growth in sub-Saharan Africa. Sustainability 2023, 15, 1152. [Google Scholar] [CrossRef]
  49. Barakat, M.; Haikal, G.; Ali, A.; Eid, A. Enhancing exports through managing logistics performance: Evidence from Middle East and African Countries. J. Res. Bus. Econ. Manag. 2018, 11, 2131–2140. [Google Scholar]
  50. Gani, A. The logistics performance effect in international trade. Asian J. Shipp. Logist. 2017, 33, 279–288. [Google Scholar] [CrossRef]
  51. Ma, R.; Zhang, Z.J.; Lin, B. Evaluating the synergistic effect of digitalization and industrialization on total factor carbon emission performance. J. Environ. Manag. 2023, 348, 119281. [Google Scholar] [CrossRef]
  52. Nam, H.-J.; Ryu, D. Does trade openness promote economic growth in developing countries? J. Int. Financ. Mark. Inst. Money 2024, 93, 101985. [Google Scholar] [CrossRef]
  53. Aslam, N.; Yang, W.; Saeed, R.; Ullah, F. Energy transition as a solution for energy security risk: Empirical evidence from BRI countries. Energy 2024, 290, 130090. [Google Scholar] [CrossRef]
  54. Pesaran, M.H.; Yamagata, T. Testing slope homogeneity in large panels. J. Econom. 2008, 142, 50–93. [Google Scholar] [CrossRef]
  55. Pesaran, M.H. A simple panel unit root test in the presence of cross-section dependence. J. Appl. Econom. 2007, 22, 265–312. [Google Scholar] [CrossRef]
  56. Swamy, P.A. Efficient inference in a random coefficient regression model. Econom. J. Econom. Soc. 1970, 38, 311–323. [Google Scholar] [CrossRef]
  57. Mutascu, M. A bootstrap panel Granger causality analysis of energy consumption and economic growth in the G7 countries. Renew. Sustain. Energy Rev. 2016, 63, 166–171. [Google Scholar] [CrossRef]
  58. Westerlund, J.; Thuraisamy, K.; Sharma, S. On the use of panel cointegration tests in energy economics. Energy Econ. 2015, 50, 359–363. [Google Scholar] [CrossRef]
  59. Pedroni, P. Panel cointegration: Asymptotic and finite sample properties of pooled time series tests with an application to the PPP hypothesis. Econom. Theory 2004, 20, 597–625. [Google Scholar] [CrossRef]
  60. McCoskey, S.; Kao, C. A residual-based test of the null of cointegration in panel data. Econom. Rev. 1998, 17, 57–84. [Google Scholar] [CrossRef]
  61. Larsson, R.; Lyhagen, J.; Löthgren, M. Likelihood-based cointegration tests in heterogeneous panels. Econom. J. 2001, 4, 109–142. [Google Scholar] [CrossRef]
  62. Banday, U.J.; Kocoglu, M. Modelling simultaneous relationships between human development, energy, and environment: Fresh evidence from panel quantile regression. J. Knowl. Econ. 2023, 14, 1559–1581. [Google Scholar] [CrossRef]
  63. Sarkodie, S.A.; Strezov, V. Effect of foreign direct investments, economic development and energy consumption on greenhouse gas emissions in developing countries. Sci. Total Environ. 2019, 646, 862–871. [Google Scholar] [CrossRef] [PubMed]
  64. Koenker, R.; Bassett, G., Jr. Regression quantiles. Econom. J. Econom. Soc. 1978, 46, 33–50. [Google Scholar] [CrossRef]
  65. Aziz, N.; Mihardjo, L.W.; Sharif, A.; Jermsittiparsert, K. The role of tourism and renewable energy in testing the environmental Kuznets curve in the BRICS countries: Fresh evidence from methods of moments quantile regression. Environ. Sci. Pollut. Res. 2020, 27, 39427–39441. [Google Scholar] [CrossRef] [PubMed]
  66. Abrevaya, J.; Dahl, C.M. The effects of birth inputs on birthweight: Evidence from quantile estimation on panel data. J. Bus. Econ. Stat. 2008, 26, 379–397. [Google Scholar] [CrossRef]
  67. Binder, M.; Coad, A. From Average Joe’s happiness to Miserable Jane and Cheerful John: Using quantile regressions to analyze the full subjective well-being distribution. J. Econ. Behav. Organ. 2011, 79, 275–290. [Google Scholar] [CrossRef]
  68. Amin, A.; Dogan, E.; Khan, Z. The impacts of different proxies for financialization on carbon emissions in top-ten emitter countries. Sci. Total Environ. 2020, 740, 140127. [Google Scholar] [CrossRef]
  69. Huang, Y.; Zhu, H.; Zhang, Z. The heterogeneous effect of driving factors on carbon emission intensity in the Chinese transport sector: Evidence from dynamic panel quantile regression. Sci. Total Environ. 2020, 727, 138578. [Google Scholar] [CrossRef]
  70. Payne, J.E.; Truong, H.H.D.; Chu, L.K.; Doğan, B.; Ghosh, S. The effect of economic complexity and energy security on measures of energy efficiency: Evidence from panel quantile analysis. Energy Policy 2023, 177, 113547. [Google Scholar] [CrossRef]
  71. Çetin, M.; Sarıgül, S.S.; Işık, C.; Avcı, P.; Ahmad, M.; Alvarado, R. The impact of natural resources, economic growth, savings, and current account balance on financial sector development: Theory and empirical evidence. Resour. Policy 2023, 81, 103300. [Google Scholar] [CrossRef]
  72. Ahmad, M.; Kuldasheva, Z.; Nasriddinov, F.; Balbaa, M.E.; Fahlevi, M. Is achieving environmental sustainability dependent on information communication technology and globalization? Evidence from selected OECD countries. Environ. Technol. Innov. 2023, 31, 103178. [Google Scholar] [CrossRef]
  73. Wang, D.; Liu, W.; Liang, Y. Green innovation in logistics service supply chain: The impacts of relationship strength and overconfidence. Ann. Oper. Res. 2022, 343, 949–979. [Google Scholar] [CrossRef]
  74. Grinin, L.; Malkov, S.; Korotayev, A. High-income and low-income countries. Toward a common goal at different speeds. In Reconsidering the Limits to Growth: A Report to the Russian Association of the Club of Rome; Springer: Berlin/Heidelberg, Germany, 2023; pp. 207–224. [Google Scholar]
  75. Marques, A.C.; Caetano, R. The impact of foreign direct investment on emission reduction targets: Evidence from high-and middle-income countries. Struct. Change Econ. Dyn. 2020, 55, 107–118. [Google Scholar] [CrossRef] [PubMed]
  76. Dumitrescu, E.-I.; Hurlin, C. Testing for Granger non-causality in heterogeneous panels. Econ. Model. 2012, 29, 1450–1460. [Google Scholar] [CrossRef]
  77. Gakuru, E.; Yang, S.; Namahoro, J.; Nie, P.; Bunje, M.Y.; Aslam, N. Energy-focused green climate policies and trade nexus: Do heterogeneous effects on clean energy poverty matter? Energy 2024, 294, 130836. [Google Scholar] [CrossRef]
Figure 1. Empirical methodology.
Systems 13 00375 g001
Figure 2. High-income countries.
Systems 13 00375 g002
Figure 3. Upper-middle-income countries.
Systems 13 00375 g003
Figure 4. Manufacturing economies’ income base.
Systems 13 00375 g004
Table 1. Logistics performance index (LPI).
DimensionIndicators and MeasurementReferenceSource
LTCAbility to track and trace consignment[41]WDI
LPCompetence and quality of logistics services[42]WDI
LPSEase of arranging competitively priced shipments[43]WDI
LCCEfficiency of the customs clearance process[7]WDI
LFSFrequency of shipments reaching the consignee on time[1]WDI
LQTQuality of trade- and transport-related infrastructure [21]WDI
Note: WDI stands for World Bank database.
Table 2. Environment-related technology index.
VariablesMeasurement Sources
CMTClimate change mitigation technology in the transportation sectorWDI1
ETDEnvironment-related technological development % of all technologyOECD2
ETRRelative advantage in environmental technology (ratio)OECD
ERTIDevelopment of ERT inventions worldwide % ageOECD
ERTPCInventions in environment-related technologies worldwide per capita OECD
ERPEnvironment-related patent technologiesOECD
EIEnvironmental Innovation ScoreWIPO3
Table 3. Description of variables and data sources.
VariablesIndicators and MeasurementSource
LPILogistics performance indexWDI
INDUSIndustrialization (share% % of GDP)WDI
ERTEnvironment-related technologyOECD, WDI, WIPO
FDIFDI net inflows (% of GDP)WDI
GDPGDP per capita (current US$)WDI
TOExport and Import BOP current US$ $WDI
Note: WDI stands for World Bank database; WIPO stands for the database for innovative green technologies.
Table 4. World Bank’s income-based manufacturing economies.
Income-Based ClassificationSelected Countries
High-income countries South Korea, United Kingdom, Canada, United States, Spain, Japan, Italy, Saudi Arabia, Germany, Ireland, Switzerland, and France
Upper-middle income countries Mexico, China, Brazil, Turkey, Thailand, Russian Federation
Lower-middle income countries India, Indonesia
Table 5. Descriptive statistics.
VariablesMeanSDMaxMinNo. Ob.
LPI1.9870.2492.3951.308320
ERT0.1640.1461.10.1320
INDUS0.4310.14110.247320
FDI0.0450.07810.00320
GDP0.3030.2310.01320
TO0.1990.18110320
Table 6. Correlation matrix.
VariablesLPIERTINDUSFDIGDPTO
LPI1
ERT0.18471
INDUS−0.4680.11861
FDI0.1099−0.10610.04231
GDP0.73490.0024−0.38950.28891
TO0.1551−0.28660.18910.58900.39881
VIF = 1.68.
Table 7. CSD test.
Table 7. CSD test.
VariablesCD Testp-ValuesAverage JointMean (P)Mean Abs (P)
LPI8.7230.00016.000.160.35
ERT5.0180.00016.000.090.42
INDUS14.5410.00016.000.260.54
FDI6.0020.00016.000.110.27
GDP15.7710.00016.000.290.44
TO10.6130.00016.000.190.48
Table 8. Unit root test.
Variable NameI (0)I (1)I (0)I (1)
LPI−1.166−1.631−1.894−2.628 *
ERT−2.239 **3.207 ***−1.82−2.401
INDUS−1.9683.328 ***−2.608 *−2.620 *
FDI3.541 ***4.912 ***−3.891 ***−4.289 ***
GDP−1.2743.061 ***−2.017−2.712 **
TO−1.4023.074 ***−1.89−2.668 **
Note: *, **, and *** denote the significance level at 1, 5, and 10 percent, respectively.
Table 9. Slope homogeneity.
Testp-ValueStatistics
Δ0.0005.59
Δ Adj.0.0007.454
Table 10. Panel cointegration test.
Panel Cointegration Test
Test 1.Wester Lund Cointegration Test
Variance ratioStatistics: 4.47259 (0.000)
Test 2.Pedroni Test
Modified Phillips–Perron testStatistics: 4.1034 (0.000)
Phillips–Perron testStatistics: 1.396 (0.000)
Augmented Dickey–Fuller testStatistics: 1.991 (0.000)
Test 3.Kao test
Modified Phillips–Perron testStatistics: 2.9913 (0.000)
Phillips–Perron testStatistics: 2.0722 (0.000)
Augmented Dickey–Fuller testStatistics: 4.7836 (0.000)
Table 11. Shapiro–Wilk test.
Variables Obs.WVZp-Value
LPI3200.937414.1186.2340.000
INDUS3200.894923.7017.4540.000
FDI3200.3782140.26411.640.000
TO3200.7751.8789.2980.000
ERT3200.4635121.01811.2930.000
GDP3200.920217.996.8040.000
Table 12. Panel quantile model.
Variable0.100.200.300.400.500.600.700.800.90
INDUS−0.271−0.336 **0.445 ***0.546 ***0.487 ***0.485 ***−0.449 ***−0.461 ***−0.435 ***
(0.316)(0.188)(0.097)(0.112)(0.086)(−0.0806)(−0.046)(0.080)(−0.165)
FDI−0.209−0.222−0.369−0.405−0.664 *−0.5−0.402−0.22−0.342
(0.519)(0.536)(0.480)(0.048)(0.379)(0.349)(−0.367)(−0.364)(−0.254)
TO−0.147−0.003080.08510.1890.309 **0.278 **0.2130.2030.316 ***
(0.154)(0.167)(0.189)(0.153)(0.123)(−0.131)(−0.139)(−0.157)(−0.115)
ERT0.407 ***0.364 ***0.340 ***0.326 ***0.293 ***0.291 **0.392 ***0.608 ***0.753 ***
(0.097)(0.035)(0.014)(0.026)(0.032)(−0.115)(0.131)(0.170)(−0.256)
GDP0.795 ***0.678 ***0.658 ***0.660 ***0.678 ***0.677 ***0.701 ***0.774 ***0.790 ***
(0.058)(0.07)(0.052)(0.102)(0.113)(−0.098)(−0.114)(0.106)(−0.111)
Constant1.643 ***1.766 ***1.861 ***1.938 ***1.933 ***1.959 ***1.962 ***1.954 ***1.942 ***
(0.090)(0.0956)(0.053)(0.072)(0.067)(0.062)(0.06)(0.061)(0.062)
Pseudo R20.31650.37900.43650.46090.46130.43500.39340.36090.3535
N. obs320320320320320320320320320
Note: Asterisks *, **, and *** indicate the level of significance at 1, 5, and 10 percent, respectively.
Table 13. Robustness for the baseline model.
Prais–Winsten Estimates: Driscoll–Kraay Estimates:
VariablesCoefficientHet.co. Std Errorp-ValueCoefficientD/k Std. Errorp-Value
ERT0.24480.0530.0000.37940.0690.000
INDUS−0.37830.0830.000−0.4510.0850.000
FDI0.0910.0640.1560.1340.110.11
GDP0.40890.06020.0000.68590.0680.000
TO0.13950.0910.1270.07870.0730.21
CONS.1.9520.0450.0001.90620.060.000
Table 14. Two-stage least squares instrumental variable estimates (solving endogeneity).
Variables 1st Stage (ERT)2nd Stage (LPI)
Endogenous Variable
ERT 3.578 *** (0.618)
Instruments
L1.LPI0.269 *** (0.046)
INDUS0.465 *** (0.065)−1.669 *** (0.323)
FDI0.254 ** (0.116)−0.898 ** (0.434)
GDP0.002 (0.054)0.008 (0.193)
TO−0.424 *** (0.057)1.501 *** (0.342)
Diagnostics
Observations300300
F-test.33.62 ***
Underid. test (p-value)0.0000.000
Weak ID test (Cragg-Donald)33.62 > 16.38 (10% max IV size)
AR Wald test (p-value)-0.000
Note: ***, and ** denote the significance level at 1 and 5 percent, respectively.
Table 15. Panel quantile estimates based on income.
Variable High-Income Countries Upper-Middle-Income Countries Lower-Middle-Income Countries
INDUS0.1012(−0.1564)−0.3524 **(−0.1617)0.7945 ***(−0.2241)
FDI−0.0511(−0.1358)−0.2446(−0.7576)0.2522(−0.1514)
TO0.6845 ***(−0.244)0.4595(−0.4845)0.407(−0.3433)
ERT0.7729 ***(0.223)0.3864 ***(0.096)−3.661(0.721)
GDP0.2634 **(0.105)0.8353 ***(−0.278)0.4267 **(−0.1837)
CONS.2.1393 ***(−0.0417)1.7923 ***(−0.0473)2.4514 ***(−0.2807)
No.obs144 144 32
Note: Asterisks ***, and ** indicate the level of significance at 1 and 5 percent, respectively.
Table 16. Panel causality test.
Null HypothesisW-StatisticsZ-Bar Statisticsp-Value
Logistics performance index does not cause ERT          Systems 13 00375 i001
ERT does not cause LPI          Systems 13 00375 i002
1.7164 ***2.26550.02
3.60670.000
LPI does not cause INDUS          Systems 13 00375 i003
INDUS does not cause LPI
2.1174 ***3.53370.000
−0.86710.38
LPI does not cause FDI          Systems 13 00375 i004
FDI does not cause LPI          Systems 13 00375 i005
1.3681 ***1.16400.02
4.28740.000
GDP does not cause LPI
LPI does not cause GDP          Systems 13 00375 i006
1.3639 ***1.15090.24
3.47430.000
LPI does not cause TO          Systems 13 00375 i007
TO does not cause LPI
3.5332 ***8.01070.000
0.08650.9311
Note: Asterisks*** indicate the level of significance at 1 percent, respectively.
Disclaimer/Publisher’s Note: The statements, opinions and data contained in all publications are solely those of the individual author(s) and contributor(s) and not of MDPI and/or the editor(s). MDPI and/or the editor(s) disclaim responsibility for any injury to people or property resulting from any ideas, methods, instructions or products referred to in the content.

