Article

Analysis of the Features of Capacity Correlation Network and Its Impact on Shipping Freight Rate

1
School of Maritime Economics and Management, Dalian Maritime University, Dalian 116000, China
2
Collaborative Innovation Center for Transport Studies, Dalian Maritime University, Dalian 116000, China
*
Author to whom correspondence should be addressed.
Systems 2025, 13(5), 371; https://doi.org/10.3390/systems13050371
Submission received: 27 March 2025 / Revised: 2 May 2025 / Accepted: 9 May 2025 / Published: 12 May 2025
(This article belongs to the Section Systems Practice in Social Science)

Abstract

:
This paper utilizes AIS (Automatic Identification System) data to study the micro-level features of the international container capacity correlation network and their impact on shipping freight rates. It proposes, for the first time, constructing a capacity correlation network based on the correlation of operational capacity between different shipping routes. This approach captures micro changes in the shipping market by observing the “synchronized increase and decrease” in operational capacity across all routes, whereby “one decreases while the other increases” between routes. Secondly, a continuous synchronization method is introduced to construct a capacity correlation network feature index, reflecting trends in the structural changes in the capacity correlation network. This method establishes the capacity correlation network’s features without causing information loss, while capturing all detailed characteristics of the network and assigning “weights” based on the continuity of all features. Finally, the impact of the capacity correlation network feature index on shipping freight rates is examined. Experimental results indicate that the capacity correlation network feature index has a significant impact on shipping freight rates, which cannot be explained by factors such as supply, demand, or costs. This study is beneficial for revealing the price formation mechanism in the shipping market from a micro perspective.

1. Introduction

In recent years, the international container shipping market has experienced significant freight rate volatility, exerting substantial impacts on global logistics and trade [1,2]. In 2020, COVID-19 pandemic-induced port congestion stranded massive volumes of containers at terminals, triggering a swift reversal in market supply–demand dynamics. Particularly on the Asia–US and Asia–Europe routes, container liner freight rates surged dramatically [3,4,5]. The 2021 Red Sea incident redirected substantial cargo volumes to Middle East routes, driving up freight rates in that corridor [6]. Furthermore, booming South American trade flows and severe congestion at Brazilian ports impeded the return of empty containers, exacerbating equipment shortages and intensifying market tensions across shipping networks. Consequently, analyzing structural changes in micro-level capacity correlation networks holds critical significance for elucidating the formation mechanisms behind container freight pricing.
This study overcomes traditional data limitations by leveraging Automatic Identification System (AIS) data to construct an operational capacity correlation network among shipping routes. It investigates the evolutionary patterns of micro-level capacity correlation network structures in the shipping market, extracts key features of container capacity correlation networks, and examines the impact mechanisms of capacity correlation network characteristic indices on shipping freight rates.
The first contribution of this study involves the following methodological framework. This study constructs a capacity correlation network to investigate the evolutionary trends in the structure of the shipping market and capture the dynamics of capacity fluctuations therein. First, we adopt the approach proposed by Sui et al. [7] to calculate the operational capacity across different routes of China’s export container shipping network. Second, building innovatively upon this foundation, we introduce a novel methodology to construct capacity correlation networks based on inter-route operational capacity correlations. When positive correlations between routes’ operational capacities are significant, the topological structure of the positive correlation network becomes more densely connected, reflecting synchronous capacity fluctuations (“simultaneous increase and decrease”) across routes. Conversely, when negative correlations between routes’ operational capacities are pronounced, the negative correlation network exhibits a denser topology, indicating inverse capacity adjustments (“offsetting increases and decreases”) resulting from the use of capacity reallocation strategies.
The second component of this study involves the development of capacity correlation network feature indices using persistent homology methods, enabling the characterization of microstructural evolution in capacity correlation networks. The international container trade network represents a complex dynamic system, where trade flow patterns exhibit continuous temporal variations, consequently inducing corresponding transformations in its topological architecture. This study advances beyond the limitations of previous research based on data by developing capacity correlation network invariants based on persistent homology [8]. This methodology demonstrates unique advantages in extracting topologically stable patterns from high-dimensional network data, effectively capturing both global structural characteristics and localized connectivity features. By revealing persistent topological invariants embedded within the network, the method overcomes the limitations of conventional analytical approaches in characterizing hierarchical relationships and latent dependencies, thereby providing a more comprehensive and precise perspective for deciphering the impact mechanisms of shipping freight rates. These invariants quantify the persistence (stability or phase transitions) of network structural features, capturing the full spectrum of topological details in capacity correlation networks. To benchmark the performance of these homology-based invariants, we further construct nine additional network feature indices derived from connectivity and clustering coefficients, providing a comprehensive comparative framework for capacity correlation analysis.
The third component of this study investigates the impact of capacity correlation network characteristics on shipping freight rates, revealing how microstructural changes in these networks influence pricing dynamics. The analysis is conducted through two sequential methodological steps. First, we examine the threshold sensitivity of nine capacity correlation network indices. Since the computation of these indices requires appropriate threshold selection, we systematically evaluate their explanatory power across varying threshold levels. Empirical results demonstrate that while all nine indices exhibit significant freight rate predictability, their performance is highly sensitive to threshold calibration, with optimal thresholds differing across network metrics. Second, we employ an Auto Regressive with eXogenous inputs (ARX) model to quantify the causal relationships between capacity correlation network indices and shipping freight rates. The empirical results indicate that the capacity correlation network characteristic indices have statistically significant explanatory power for shipping freight rates. Furthermore, by incorporating additional factors such as supply, demand, and cost [9,10,11], the capacity correlation network indices continue to exhibit significant explanatory power for shipping freight rates. This suggests that the network indices used in this study capture unique structural information that cannot be fully explained by these traditional economic variables. Finally, we conducted robustness checks on the capacity correlation network indices by disaggregating the analysis across nine distinct shipping routes and considering two aspects. The findings demonstrate that the characteristic network indices devised using persistent homology methods have a more robust explanatory power for shipping freight rates, whereas other capacity correlation network indices are more sensitive to threshold effects.
This study innovatively constructs a capacity correlation network between shipping routes using Automatic Identification System (AIS) data, overcoming the limitations of traditional data sources. By capturing both the “synchronized increase/decrease” in operational capacity across all routes and the “offsetting changes” in capacity between routes through the capacity correlation network, we comprehensively reveal the micro-level dynamics of the shipping market, addressing the shortcomings of traditional methods in analyzing dynamic capacity interactions. Furthermore, we introduce persistent homology methods to shipping market analysis for the first time, establishing a capacity correlation network characteristic index. This method accurately identifies key topological features in the data while effectively filtering out noise interference, ensuring the integrity and robustness of information. Additionally, the proposed capacity correlation network characteristic index not only reflects micro-level structural changes in the network but also demonstrates high responsiveness to major events (e.g., the U.S.–China trade war, the COVID-19 pandemic), providing a novel theoretical framework for understanding the dynamic evolution mechanisms of the shipping market. Finally, by elucidating the changing characteristics of the capacity correlation network and the mechanisms of its impact on freight rates, this study offers market participants a new analytical tool to precisely track market dynamics. The research outcomes provide scientific evidence for addressing monopolistic practices and information asymmetry in container pricing markets, holding significant theoretical and practical implications for both academic research and industrial applications.
The structure of the remaining sections of this paper is as follows. Section 2 provides a literature review. Section 3 introduces the operational capacity index and the methodology used for constructing the capacity correlation network. Section 4 employs persistent homology methods to develop topological invariants in order to characterize the structural evolution of the capacity correlation network, analyzing its dynamic patterns. Section 5 investigates the explanatory power of these network characteristic indices over maritime freight rates. Section 6 conducts robustness checks to validate the stability and reliability of the proposed framework. Finally, Section 7 summarizes the key findings and outlines future research directions in maritime network analysis and freight rate forecasting.

2. Literature Review

The high volatility of the shipping market has made the freight rate formation mechanism and risk management key focal points for both academia and industry practitioners [12]. The accumulation of Automatic Identification System (AIS) data has enabled research on microstructural changes in the shipping market, providing new analytical support for understanding market dynamics. Shipping capacity, as a core element, is critical for analyzing market supply–demand relationships, freight rate fluctuations, and resource allocation efficiency. Concurrently, research on shipping networks occupies a pivotal position in elucidating the structural characteristics, functional properties, and evolutionary patterns of the shipping system. However, studies exploring the freight rate formation mechanism from a micro-level shipping network perspective remain extremely scarce, necessitating theoretical innovation and empirical exploration to address this gap. This paper conducts a literature review based on the aforementioned dimensions, systematically synthesizing relevant research advancements to establish a theoretical foundation for this study.
The heightened volatility in shipping markets necessitates urgent research into and the resolution of both freight rate formation mechanisms and risk management challenges. Gavriilidis et al. [13] incorporated oil prices as an exogenous variable into the GARCH-X model, leveraging oil price shocks to enhance the forecasting of freight rate volatility in maritime markets. Lim et al. [14] investigated the driving factors of Forward Freight Agreement (FFA) markets and their volatility characteristics. Bai et al. [15] analyzed the dynamic relationship between uncertainty regarding economic policy and tanker freight rates, revealing significant variations in dependence structures between economic policy uncertainty indices and tanker freight rate indices across different time scales. Monge et al. [16] examined the impacts of geopolitical risks on oil prices and freight rates, demonstrating the persistent effects of geopolitical risks on dry bulk shipping markets. However, traditional supply–demand frameworks face technical constraints in explaining freight market price formation mechanisms due to the insufficient availability of micro-level operational data.
The accumulation of AIS data has enabled research into microstructural changes in shipping markets. The International Maritime Organization (IMO) proposed the mandatory installation of the AIS for vessels in 2000. By 2008, all operational vessels worldwide had been equipped with AIS. This technological advancement led to the progressive refinement of maritime big data systems, thereby facilitating the extraction of more granular micro-level insights regarding shipping market dynamics. In the application of AIS data to maritime transportation efficiency research, Regli and Nomikos [17] developed an active vessel ratio, using shipping big data to explain freight rate evolution. Sugrue et al. [18] constructed maritime transport efficiency metrics based on AIS data to analyze bulk carrier operational performance.
Shipping capacity holds significant theoretical and practical value in shipping market research, serving as a core element in the analysis of market supply–demand relationships, freight rate fluctuations, and resource allocation efficiency. Wang et al. [19] addressed the container freight rate optimization problem by considering uncertainties in spot market demand volume and available vessel capacity. Jin et al. [20] demonstrated that the COVID-19 pandemic severely affected the freight market, with port congestion leading to severe shipping capacity shortages and soaring freight rates. Competitive alliances and capacity constraints significantly influence the operational performance of shipping enterprises under different alliance structures [21]. Sui et al. [7] pioneered the development of an operational capacity index based on Automatic Identification System (AIS) data and investigated its mechanisms of influence on freight rates.
Research on shipping networks plays a pivotal role in the field of maritime studies, serving as a critical tool for in-depth analysis of the structure, functionality, and dynamic evolution of shipping systems. Brouer et al. [22] utilized maritime big data to optimize liner shipping networks through vessel routing and speed adjustments. Yu et al. [23] examined global maritime network dynamics from multi-layer (bulk, container, and tanker sectors) and multi-dimensional (node, link, and network) structural perspectives. Structural modifications in shipping networks have been shown to induce micro-level variations in traffic flow patterns, thereby influencing bunker price volatility [24]. Tsiotas et al. [25] investigated the impact of spatial distance on network topology using empirical data from the Global Container Shipping Network (GCSN). Tan et al. [26] explored the impact mechanism of shore power (SP) capacity allocation in multi-port shipping networks on carbon emissions, revealing the correlation between service congestion and strategic vessel choices. However, research that leverages shipping networks to uncover price formation mechanisms in the shipping market from a micro-level perspective remains highly scarce, urgently requiring in-depth exploration and theoretical breakthroughs.
The structural characteristics of networks can capture and reflect specific market signals, which thereby exert profound impacts on the price formation mechanism of the market. Smith and White [27] pioneered the construction of longitudinal international trade networks across temporal nodes, further examining the dynamic evolutionary characteristics of trade network structures. Newman [28] proposed fundamental topological metrics—including the node degree and clustering coefficient—to quantify the network architecture. Hu et al. [29] adopted advanced network indices such as node betweenness centrality, degree distribution, and the clustering coefficient to analyze agricultural trade network dynamics along the Belt and Road Initiative. While conventional network approaches typically focus on primary topological attributes, the persistent homology framework introduced by Bubenik et al. [30] provides superior analytical capabilities in terms of uncovering latent topological patterns and multiscale structural invariants. Notably, this methodology has been successfully applied to financial network analysis, demonstrating efficacy in identifying critical transitions in market correlation structures. Gidea et al. [31] pioneered the application of persistence landscapes to analyze the 2000 dot-com bubble and the 2007–2009 financial crisis. Building upon this, Ismail et al. [32] constructed time-varying correlation networks with topological structures from multiple stock price time series, employing persistent homology to identify early warning signals of financial crises. Their findings demonstrate that persistent homology provides robust topological invariants for analyzing complex, high-dimensional, and noisy datasets.

3. Operational Capacity and Capacity Correlation Network

3.1. Operational Capacity

This study adopts the methodology established by Sui et al. (2024) [4] to calculate operational capacity across nine major Chinese export container routes. The implementation comprises three steps.
First step: clean the AIS data of 5451 container ships globally from 2011 to 2023. Second step: Select the operational capacity of nine out of twelve major shipping routes for China’s exported containers, namely the Europe route, the Japan route, the South Korea route, the South Africa route, the Southeast Asia route, the South America route, the East Coast of the United States route, the West Coast of the United States route, and the Australia and New Zealand route, to construct the capacity correlation network. According to data from China’s General Administration of Customs in 2023, the countries and regions covered by these nine routes account for 77% of China’s total container trade volume. Table 1 shows the nine shipping routes for China’s exported containers, as well as the countries and ports each route reaches. Third step: Calculate the total TEU (Twenty-Foot Equivalent Unit) carried by ships departing from China along a certain route in the past N days as the operational capacity index. In this paper, N is set to 7 days.
Figure 1 illustrates the quarterly operational capacity trends of nine China export container shipping routes from 2011 to 2023, with the horizontal axis representing time and the vertical axis indicating the quarterly TEU (Twenty-Foot Equivalent Unit) volume of operational capacity. Key findings are as follows.
First, over the past decade, the operational capacity of the US West Coast route consistently surpassed that of the Europe route. However, post-2021, influenced by Sino-US trade frictions, the operational capacity of the Europe route demonstrated a notable upward trajectory, eventually exceeding that of the US West Coast route.
Second, seasonal patterns reveal that the operational capacity of most routes during the first quarter of each year is lower than in the other three quarters; this is particularly pronounced regarding the US West Coast and Europe routes. Specifically, the US West Coast route reached its peak capacity in the third quarter of 2020, followed by a significant quarterly decline thereafter.
Third, China’s export containers to Europe and the US typically transit through multiple Southeast Asian hub countries, including Malaysia, Singapore, Thailand, and Indonesia. Consequently, the Southeast Asia route exhibits the highest operational capacity for China’s export containers, reflecting its critical role as a regional transshipment corridor.

3.2. Capacity Correlation Network

This paper proposes the construction of a capacity correlation network by leveraging the correlation coefficients among the operational capacities of the nine major Chinese export container shipping routes. By selecting operational capacity data over six periods, the Pearson correlation coefficients between the operational capacities of each pair of routes are calculated, resulting in a correlation coefficient matrix W , which serves as the capacity correlation network. Capacity scheduling exhibits inherent lag effects, implying that the impact of operational capacity on the shipping market, as well as the influence of the shipping market on operational capacity, typically manifests with a certain time delay. In this study, the baseline model adopts a 6-period framework, with each period spanning 7 days, for a total of 6 weeks. Subsequently, robustness checks are conducted for 4-period and 8-period scenarios to ensure the reliability and validity of the findings.
W = 1 ρ 12 ρ 1 n ρ 21 1 ρ 2 n ρ n 1 ρ n 2 1 ,
where ρ i j represents the correlation coefficient between the operational capacities of Chinese export container shipping routes i and j at a certain time. Further, this paper adopts a rolling window method to calculate the correlation coefficient matrix of the operational capacities between routes at different time nodes.
In global trade, the total trade demand may experience overall increases or decreases due to macro-level factors (e.g., seasonal fluctuations). As shipping routes are carriers of trade transportation, operational capacity across these lanes tends to exhibit a “synchronized increase and decrease” pattern, reflecting positive correlations. Conversely, localized events (e.g., emergencies, policy changes) may trigger trade demand shifts between routes, causing operational capacity changes to display an “one decreases while the other increases” pattern characterized by negative correlations. Global trade demand fluctuations drive synchronized adjustments in capacity supply–demand relationships, thereby influencing freight rates. When localized capacity changes occur in opposing directions, resource reallocation between routes alters the supply–demand dynamics of specific routes, leading to differentiated impacts on freight rates. The capacity correlation network captures these patterns to dynamically reveal freight rate formation mechanisms: positive correlations indicate that freight rates may fluctuate collectively due to synchronized supply–demand changes, while negative correlations suggest regional divergence in freight rates, driven by resource redistribution.
Formula (1) is used in this paper to construct a capacity correlation network based on the correlation coefficient matrix. Therefore, the capacity correlation network can reflect situations of “synchronized increase and decrease” and “one decreases while the other increases” exhibited by the operational capacities of routes. In order to distinguish between the positive correlation and negative correlation capacity correlation networks, that is, the situations of “synchronized increase and decrease” and “one decreases while the other increases”, this paper proposes three types of capacity correlation networks by selecting thresholds, namely positive correlation, negative correlation, and absolute value capacity correlation networks.
In the negative correlation capacity network, when the correlation coefficient ρ i j is less than the threshold θ , the value of e i j is set to 1; when it is greater than the threshold θ , the value of e i j is set to 0, as shown in Formula (2). A denser negative correlation capacity network indicates a higher prevalence of negative correlations in the operational capacities between shipping routes.
H N = e i j N , e i j N = 1 ρ i < θ 0 ρ i θ ,
In the positive correlation capacity network, when the correlation coefficient ρ i j exceeds the threshold θ , the value of e i j is set to 1; when the coefficient falls below the threshold θ , the value of e i j is set to 0, as illustrated in Formula (3). A denser positive correlation capacity network indicates a higher prevalence of positive correlations in the operational capacities between shipping routes.
H P = e i j P H N = e i j N , e i j P = 1 ρ i θ 0 ρ i < θ ,
In the absolute value correlation capacity network, when the absolute value of the correlation coefficient ρ i j exceeds the threshold θ , the value of e i j is set to 1; when it falls below the threshold θ , the value of e i j is set to 0, as depicted in Formula (4). A denser absolute value correlation capacity network indicates that the correlations in operational capacities between shipping routes are generally stronger.
H A B S = e i j A B S ,   e i j A B S = 1 ρ i j θ 0 ρ i j < θ ,
Table 2 presents the names and classifications of the capacity correlation networks constructed in this study.
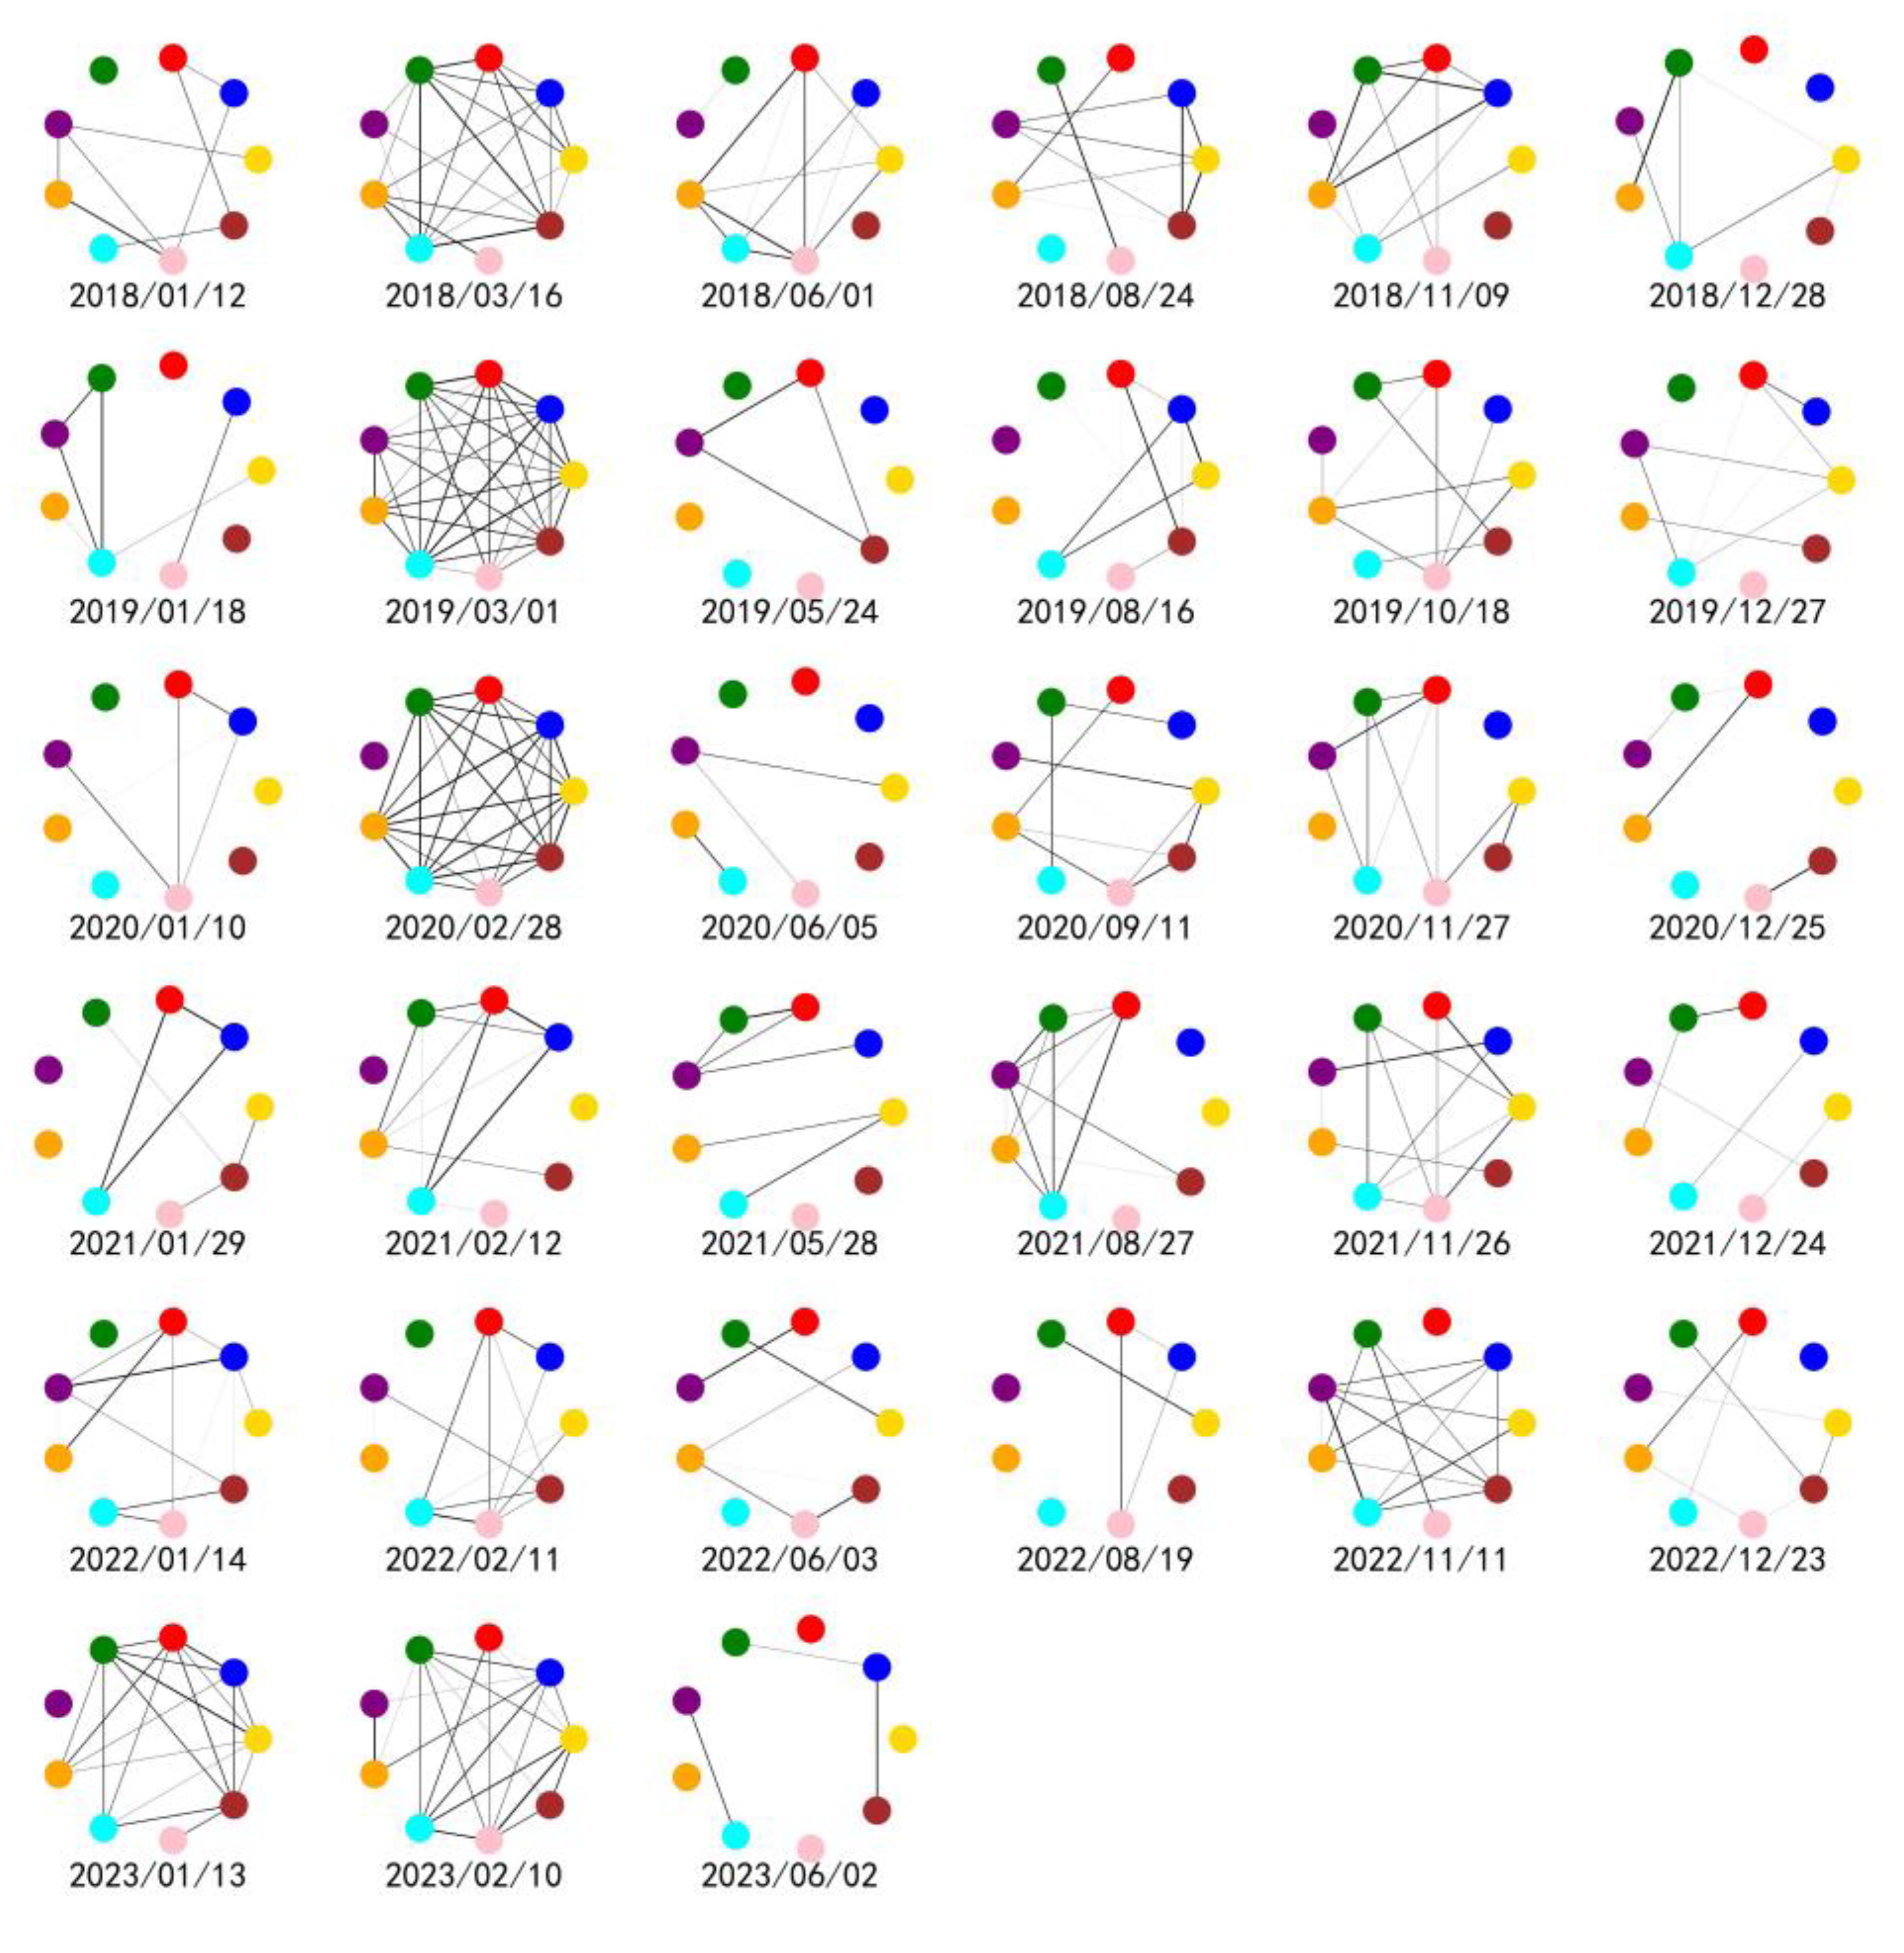
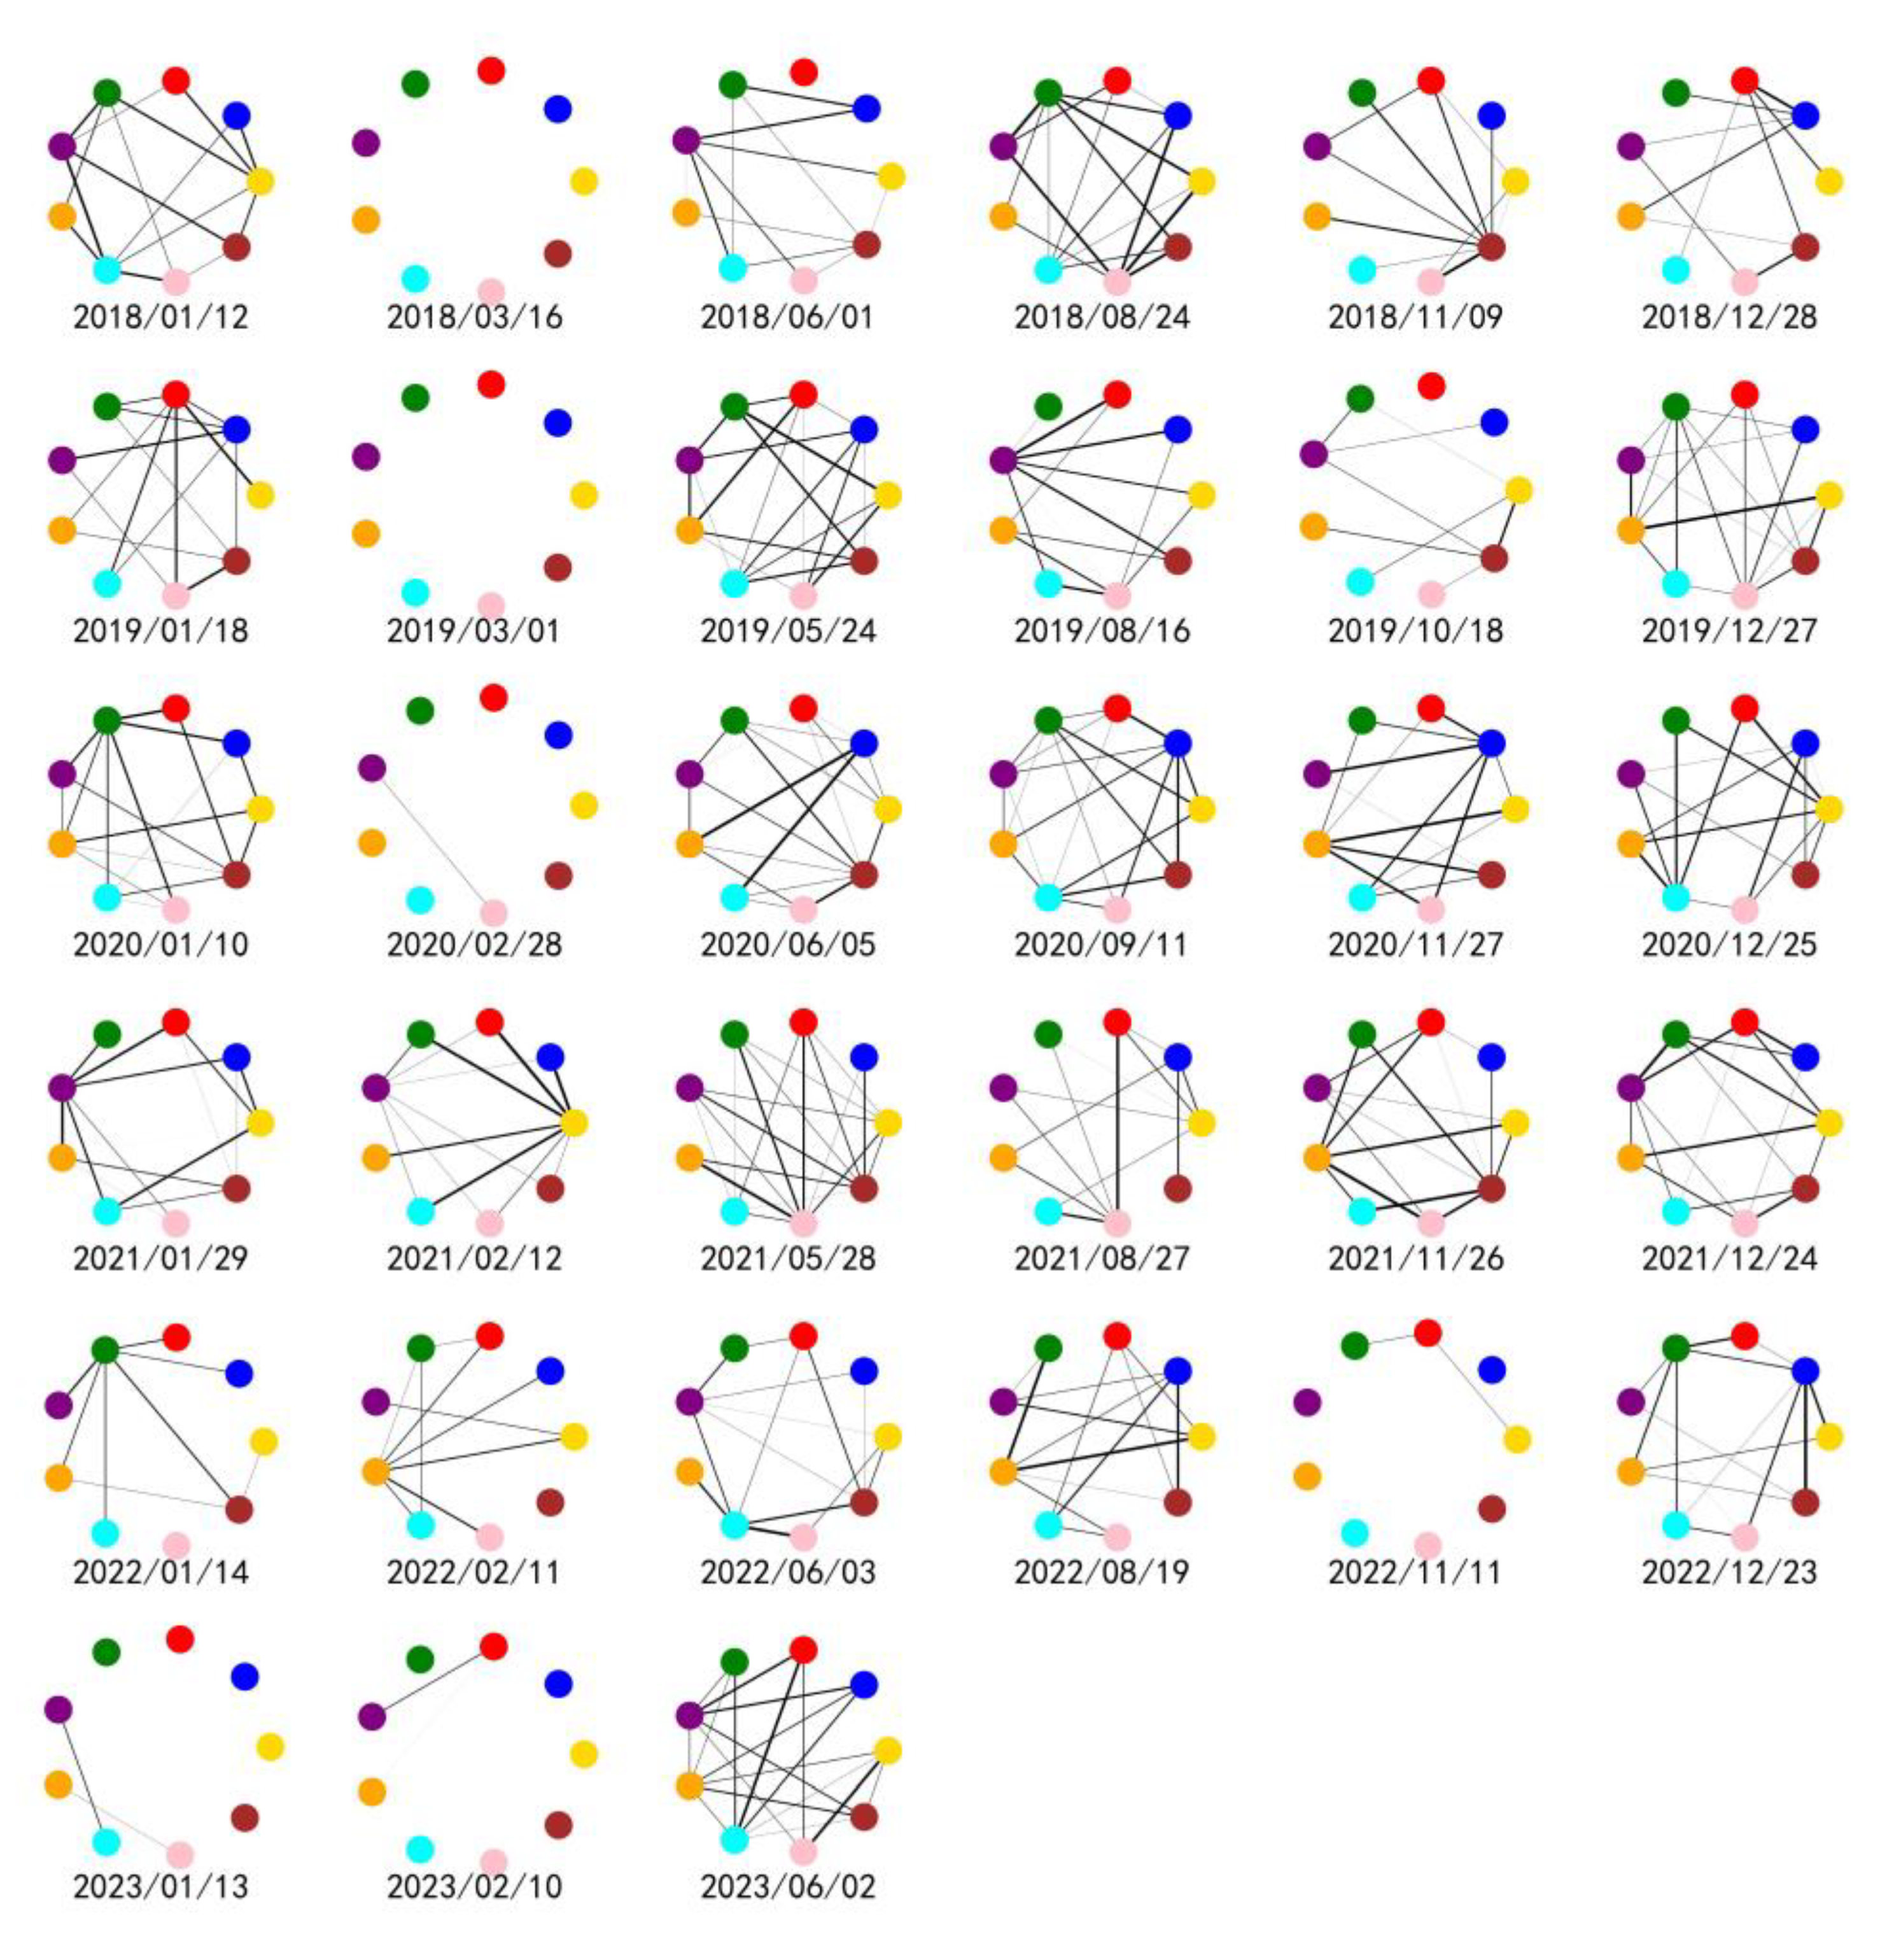
This paper illustrates the structural changes in the positive and negative capacity correlation networks from 2018 to 2023. We selected capacity correlation networks at six key time points each year: before and after the Spring Festival, at the end of May, at the end of August, before Christmas, and at the end of December. Figure 2 depicts the positive capacity correlation network, while Figure 3 shows the negative capacity correlation network. Both Figure 2 and Figure 3 consist of subplots arranged in five rows and six columns, with each row representing a year and each column corresponding to a specific time point. The subplots in Figure 2 and Figure 3 are temporally aligned. In each subplot, the red node at the 12 o’clock position represents the Japan route, followed clockwise by the Europe route, Australia–New Zealand route, U.S. West Coast route, U.S. East Coast route, Southeast Asia route, South America route, South Africa route, and Korea route. In Figure 2, a threshold of θ = 0.5 is applied, where a correlation greater than 0.5 results in a connection between routes, with thicker lines indicating stronger correlations. In Figure 3, a threshold of θ = 0.1 is used, where a correlation less than −0.1 results in a connection between routes, with thicker lines indicating stronger negative correlations.
Figure 2 shows that the shipping capacity correlation network was relatively sparse prior to the Spring Festival. However, it became significantly denser after the Spring Festival. In early June and late August, the shipping capacity correlation network appeared to be sparse again. In November, the network became denser, and it only returned to normal at the end of December. However, during the Spring Festival periods of 2021 and 2022, the shipping capacity correlation network did not show significant changes. Moreover, from the end of 2022 to the beginning of 2023, the shipping capacity correlation network became even denser compared to previous years.
Based on the patterns observed, we identified that the freight capacity correlation network effectively captures the micro-level dynamics of the shipping market. Firstly, the network structure exhibits distinct seasonal variations, being primarily influenced by China’s Spring Festival and the holiday periods and commercial expectations in Western countries. Secondly, from 2021 to 2022, the COVID-19 pandemic led to a decline in cargo demand and an imbalance between supply and demand in the shipping market, resulting in the freight capacity correlation network failing to demonstrate the typical seasonal fluctuations observed in previous years. Following the lifting of pandemic control measures in China at the end of 2022 and the full resumption of production and work activities in early 2023, there was a significant increase in export container trade, accompanied by synchronized growth in operational capacity across various shipping routes. Consequently, the corresponding freight capacity correlation network became notably denser.
Comparative analysis of Figure 2 and Figure 3 reveals the existence of an inverse relationship between positive and negative freight capacity correlation networks: intensified density in positive correlation networks coincides with diminished activity in negative correlation networks. However, this pattern is attenuated at the critical temporal nodes of early June and late August annually. The operational dynamics observed indicate that predominant synchronous capacity adjustments (“synchronized increase and decrease”) correlate with reduced compensatory capacity reallocation (“one decreases while the other increases”). While negative and positive correlation networks demonstrate structural complementarity in freight capacity allocation mechanisms, they maintain functional differentiation, which is particularly evident in their distinct responses to seasonal demand fluctuations and capacity deployment strategies.

4. Characteristics of Freight Capacity Correlation Networks

4.1. Feature Extraction of Freight Capacity Correlation Networks Based on Persistent Homology

Persistent homology serves as the core methodology used in topological data analysis. The traditional outputs of persistent homology—Betti numbers, persistence barcodes, persistence diagrams, and persistence landscapes—are tools designed to quantify the topological features of simplicial complexes formed from point cloud data. Let us imagine a set of point clouds, representing the operational capacities of different shipping routes. As a threshold (similar to gradually increasing ε ) is increased, some points begin to connect, forming connected components. These connected components are like “islands” that appear at smaller thresholds and may disappear or merge with other “islands” at larger thresholds. Persistent barcodes are tools that record the times when these “islands” appear and disappear, while persistence diagrams graphically display this information. Finally, persistence landscapes and their L p norms help us to quantify the overall importance and variation patterns of these “islands”. The specific steps are as follows:
First, when constructing nested complexes, the correlation coefficient matrix W is mapped into n points within an n -dimensional space, and a sequence of nested Vietoris–Rips complexes V R K , ε is constructed. This process forms the simplicial complex K ε , where x i and x j represent any two points in the n -dimensional space, and ρ x i , x j denotes the correlation between points x i and x j .
K ε = x 1 , x 2 , , x n K ρ x i , x j < ε , 0 i , j n ,
As ε varies, the sequence of complexes K ε constitutes a filtered simplicial complex. The specific implementation procedure adopts the methodology provided by Gidea et al. [28].
Next, it is necessary to transform the persistence diagram into a piecewise function. Based on the methodology of persistent homology, persistence barcodes are employed to characterize the complexes and quantify the evolution of topological metrics as the parameter ε increases. A persistence barcode is a graphical representation of a collection of horizontal line segments (intervals) I j : j J in the plane, where each interval corresponds to the “lifetime” of a topological hole. The length of the interval reflects the “persistence weight” of the topological feature. Each interval I j a j , b j corresponds to a connected component in the associated complex: the component emerges when ε = a j and disappears when ε = b j .
Thirdly, the left and right endpoint values of the barcode intervals are transformed into coordinate values, yielding a persistence diagram denoted as a j , b j : j J . In the persistence diagram, each point a j , b j corresponds to a piecewise function as described below.
f a j , b j x = x a j ,   a j < x a j + b j 2 x + b j ,   a j + b j 2 < x b j 0 ,   0 x a j   o r   x > b j
Definition 1.
λ n x = n m a x f a j , b j x : j J , where n m a x denotes the n t h largest element for n N + .
Finally, following the methodology of Bubenik and Dlotko [5], persistence landscapes and their L p -norms are introduced based on the persistence diagram. Let λ = , , λ n T , where T denotes the persistence landscapes. For 1 p < , the L p -norm of the persistence landscapes λ = λ n n N + is defined as shown in Formula (7).
S N I P H = λ p = n = 1 λ n p p 1 p
where S N I P H represents the capacity correlation network index constructed in this study based on the persistent homology method, and λ k p denotes the L p norm of λ k .
Compared to other norms with p > 1 , the L 1 norm is less sensitive to noise and outliers in the data, providing more stable results; simultaneously, it offers a simple and intuitive measure of the overall strength of topological features; additionally, our data demonstrates that operational capacity correlations between routes exhibit a non-Gaussian distribution, and the L 1 norm outperforms others in capturing such non-Gaussian characteristics. Finally, the L 1 norm is computationally more efficient, particularly when processing large-scale datasets, significantly reducing computation time and resource consumption. In summary, to achieve an optimal balance among stability, comprehensive strength measurement, non-Gaussian data adaptability, and computational efficiency, this study selects the L P norm ( p = 1 ) as the characteristic index for the capacity correlation network.
S N I P H captures all the detailed features of the capacity correlation network, reflecting the persistence (or stability and abruptness) of its structural characteristics, and assigns “weights” based on the persistence of all these features. When the S N I P H value is high, it indicates a stable shipping market structure with a balanced supply–demand relationship, and freight rates typically remain stable or elevated. Conversely, when the S N I P H value is low, it reflects a fragile market structure that relies heavily on a few critical routes, making freight rates prone to sharp declines due to sudden disruptions or crises.
To compare the capacity correlation network characteristic index constructed based on the persistent homology method, this study also develops nine capacity correlation network characteristic indices using three approaches—simplex counts, degree values, and clustering coefficients—that are applied to the three types of networks.
(1)
The topological features of the capacity correlation network are described based on the number of simplices. The total number of simplices of all dimensions in the simplicial complex K ε is calculated to construct the capacity correlation network characteristic index, reflecting the connectivity of the capacity correlation network. Using the threshold matrix H P to construct the positive capacity correlation network, the capacity correlation network index based on the total number of simplices is denoted as S N I N S . Using the threshold matrix H N to construct the negative capacity correlation network, the capacity correlation network index based on the total number of simplices is denoted as S N I P S . Using the threshold matrix H A B S to construct the absolute value capacity correlation network, the capacity correlation network index based on the total number of simplices is denoted as S N I S .
(2)
The topological features of the capacity correlation network are described based on the degree value. Here, a i represents the number of nodes directly connected to node i, which describes the importance of node i in the network. In this paper, we select the total number of edges D in the operational capacity correlation network to define the operational capacity correlation network feature index.
S N I = D = 1 2 i = 1 N a i
The degree value D reflects the connectivity of the capacity correlation network. A higher degree value D indicates a stronger operational capacity linkage between shipping routes. Using the threshold matrix H P to construct the positive capacity correlation network, the degree value of the capacity correlation network is calculated, and the characteristic index S N I P D is established. Similarly, using the threshold matrix H N to construct the negative capacity correlation network, the degree value is computed to define the characteristic index S N I N D . For the absolute value capacity correlation network constructed with the threshold matrix H A B S , the degree value is calculated to derive the characteristic index S N I D . These indices quantify the centrality and connectivity of nodes within their respective networks, providing insights into the hierarchical structure and operational interdependencies of shipping routes.
(3)
The topological features of the capacity correlation network are described based on the clustering coefficient. The clustering coefficient quantifies the degree of clustering within the entire network, reflecting the tightness of operational capacity linkages between shipping routes. Using the threshold matrix H P to construct the positive capacity correlation network, the clustering coefficient of the capacity correlation network is calculated, and the characteristic index S N I P C is established. Similarly, using the threshold matrix H N to construct the negative capacity correlation network, the clustering coefficient is computed to define the characteristic index S N I N C . For the absolute value capacity correlation network constructed with the threshold matrix H A B S , the clustering coefficient is calculated to derive the characteristic index S N I C .
This study constructs ten capacity correlation network characteristic indices, listed in column 5 of Table 2. Among these, the capacity correlation network characteristic index S N I P H is constructed using persistent homology and serves as a persistence metric for the capacity correlation network outlined in Table 2. The indices S N I N S , S N I P S , and S N I S are connectivity-based indices derived from simplex counts; S N I N D , S N I P D , and S N I D are degree-based connectivity indices derived from degree values; S N I N D , S N I P D , and S N I D are clustering-based indices derived from clustering coefficients. Notably, while S N I P H does not require threshold selection due to its foundation in persistent homology, the other nine indices all require threshold selection to define network edges and quantify structural features.

4.2. Analysis of Freight Capacity Correlation Network Feature Indices

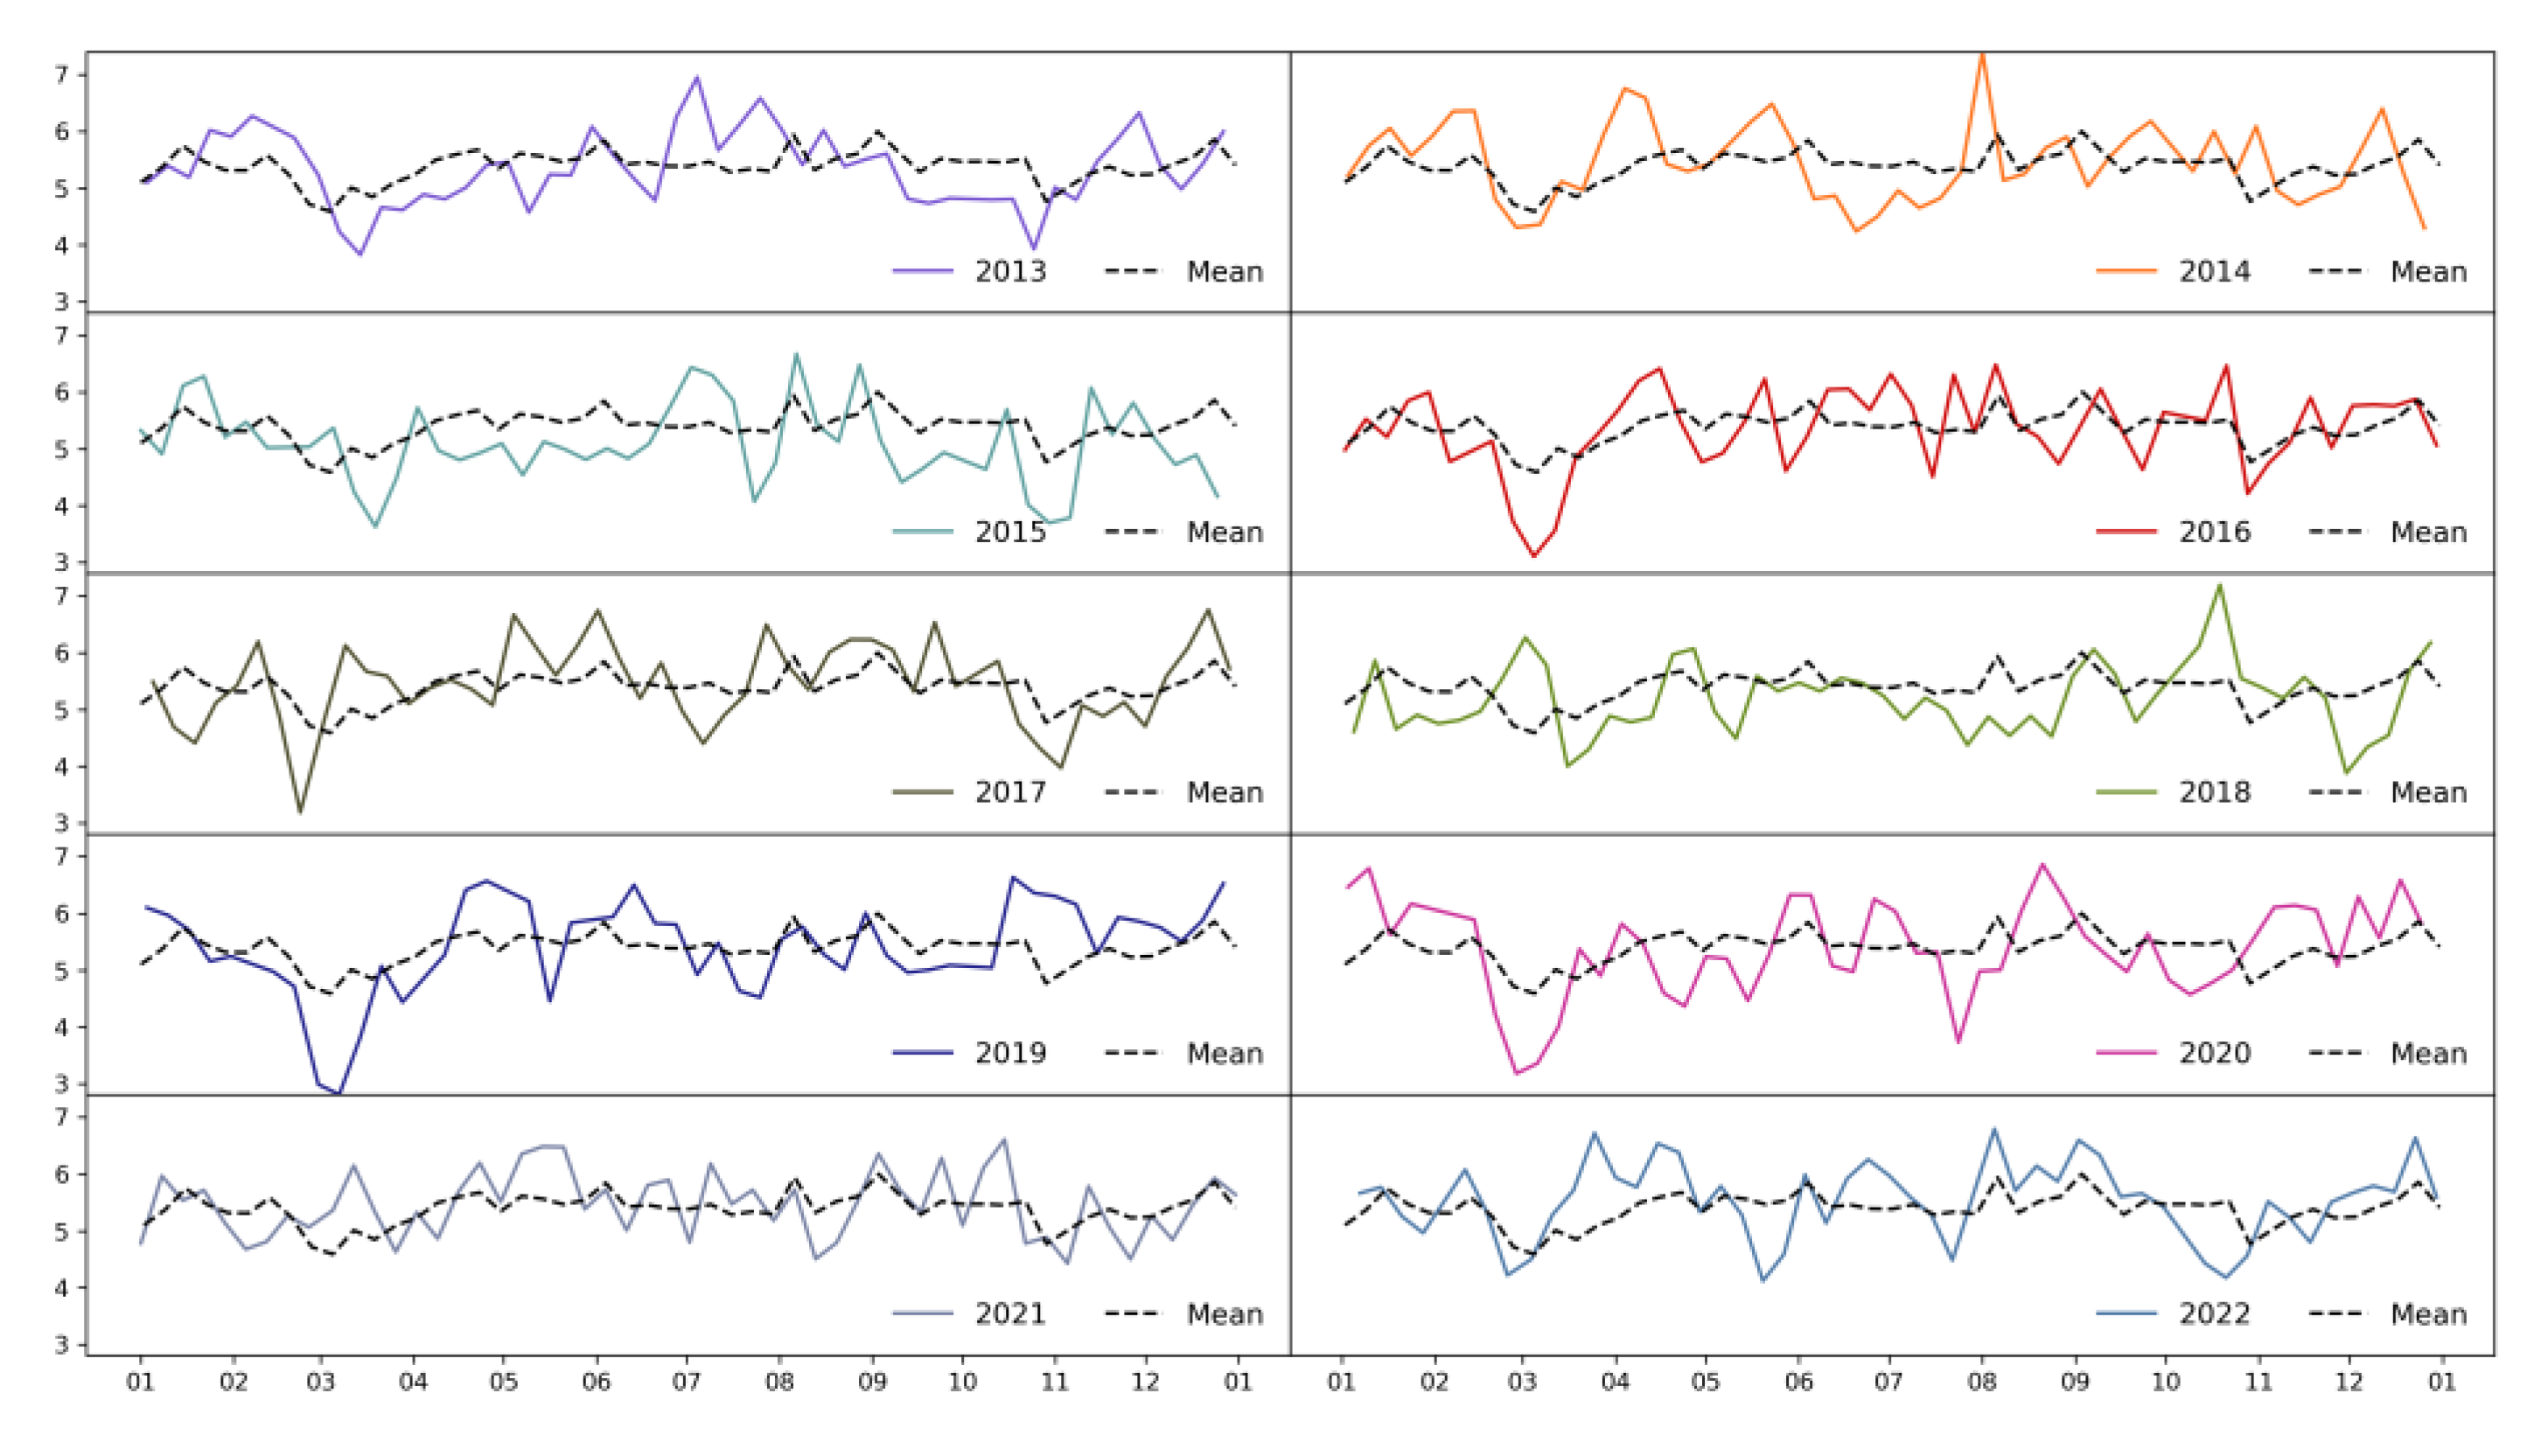
This study calculates the monthly capacity correlation network characteristic index, S N I P H , over the decade from 2013 to 2022 and illustrates its temporal trends in Figure 4, arranged by year (from top to bottom and left to right). In Figure 4, the horizontal axis represents the months, while the vertical axis denotes the values of the capacity correlation network characteristic index. Solid lines depict the annual trajectories of the index for each year, and the dashed line represents the average value of the index across the entire ten-year period.
Figure 4 shows that the capacity correlation network characteristic index exhibits strong seasonality. During the Spring Festival period, as enterprise production slows down or halts, the volume of export container goods significantly decreases, typically making January and February the annual low points for China’s export container shipping. The capacity correlation network characteristic index S N I P H declines rapidly in January and February, reaching its trough in March. Since the timing of the Spring Festival varies each year, the low point of the index after the Spring Festival also shifts accordingly. Subsequently, the index rebounds quickly in March and April, returning to normal levels by May and June. The seasonality of China’s export container shipping is primarily influenced by holidays and commercial expectations in Western countries. Before Christmas and New Year, particularly in October and November, China exports large quantities of toys and clothing to Western markets. The capacity correlation network characteristic index S N I P H gradually declines from September, reaching its trough in October and November, and slowly recovers in December.
Second, the capacity correlation network characteristic index ( S N I P H ) effectively captures the occurrence of major events. For instance, in the subplot located in the third row and second column (2018), a minor peak emerged in the index during the post-Spring Festival period, deviating from historical trends. This anomaly corresponds to March 2018, when U.S. President Donald Trump signed tariff measures targeting China, announcing a 25% tariff on $50 billion worth of Chinese imports. This policy triggered uncertainty in the demand for Chinese export goods, disrupting maritime shipping demand. Similarly, in the subplot of the fifth row and first column (2021), an unexpected peak in the index emerges after the Spring Festival, contrasting with typical seasonal patterns. This deviation reflects the prolonged and global spread of the COVID-19 pandemic by March 2021, which caused turbulence in international shipping markets and pessimistic outlooks for China’s export container shipping sector, leading to abrupt reversals in market supply–demand dynamics.

5. Characteristics of Freight Capacity Correlation Networks and Shipping Freight Rates

5.1. Data

This study selects the weekly data of the China Containerized Freight Index (CCFI) as the dependent variable.
The China Containerized Freight Index (CCFI) is a critical index that objectively reflects the container shipping market between China and major trading nations, and it serves as a globally recognized benchmark for assessing the state of the container shipping market [33]. The CCFI is widely recognized as a “barometer” of global container freight rates. With its broad coverage and high data representativeness, the CCFI not only reflects changes in China’s export container freight rates but also profoundly influences the dynamics of the global container freight market. Therefore, this study selects the weekly data of the CCFI as the dependent variable. The capacity correlation network characteristic indices constructed in this study are employed as key explanatory variables. The original AIS data used to derive these indices are sourced from Elane, a leading maritime big data provider.
This study also incorporates fleet size, China’s export container trade volume, fuel oil prices, total operating shipping capacity for Chinese exports, and the Global Economic Surprise Index (GESI) as control variables. Given the significant cross-market risk linkages between financial markets and shipping markets [34], the Global Economic Surprise Index is included in the analysis to account for macroeconomic shocks. Furthermore, to verify whether the capacity correlation network characteristic index operates independently of total operating shipping capacity, we control for the impact of total operating shipping capacity on freight rates. The Total Operating Shipping Capacity Index (OSC) for Chinese exports is calculated based on the aggregate operating capacity across nine major shipping routes. All variables in this study utilize weekly data spanning from July 2011 to June 2023. Detailed definitions and sources of these variables are provided in Table 3.
Table 4 presents the descriptive statistical results of all variables in this study. Among them, the variables CFI, FS, ECTV, and FO were subjected to logarithmic first-order differencing, where Δ denotes the application of logarithmic first-order differencing to the data. The remaining indicators retain their original series. The last column of Table 4 displays the results of the Augmented Dickey–Fuller (ADF) tests, confirming the stationarity of the variables.
Table 5 presents the correlations between the capacity correlation network characteristic indices and other variables. Panel A displays correlations among the capacity correlation network characteristic indices, while Panel B shows correlations between these indices and external variables.
From Panel A, we observe that the network characteristic index S N I P H is positively correlated with the first category of capacity correlation network indices and negatively correlated with the second and third categories. Notably, the characteristic indices constructed using simplex counts and degree values both reflect network connectivity, leading to extremely high correlations between these two sets of indices.
In Panel B, the capacity correlation network characteristic index S N I P H exhibits a positive correlation with freight rates, as does the first category of capacity correlation network indices. In contrast, the second and third categories of capacity correlation network indices demonstrate negative correlations with freight rates.

5.2. Empirical Analysis

This study employs the A R X ( 1 ) model as the baseline framework, utilizing the capacity correlation network characteristic index ( S N I P H ) as the explanatory variable and the China Containerized Freight Index (CCFI) as the dependent variable.
C C F I t = β n e t S N I t + α C C F I t 1 + ε t
where S N I t represents the capacity correlation network characteristic index, and β n e t is the regression parameter for this index.
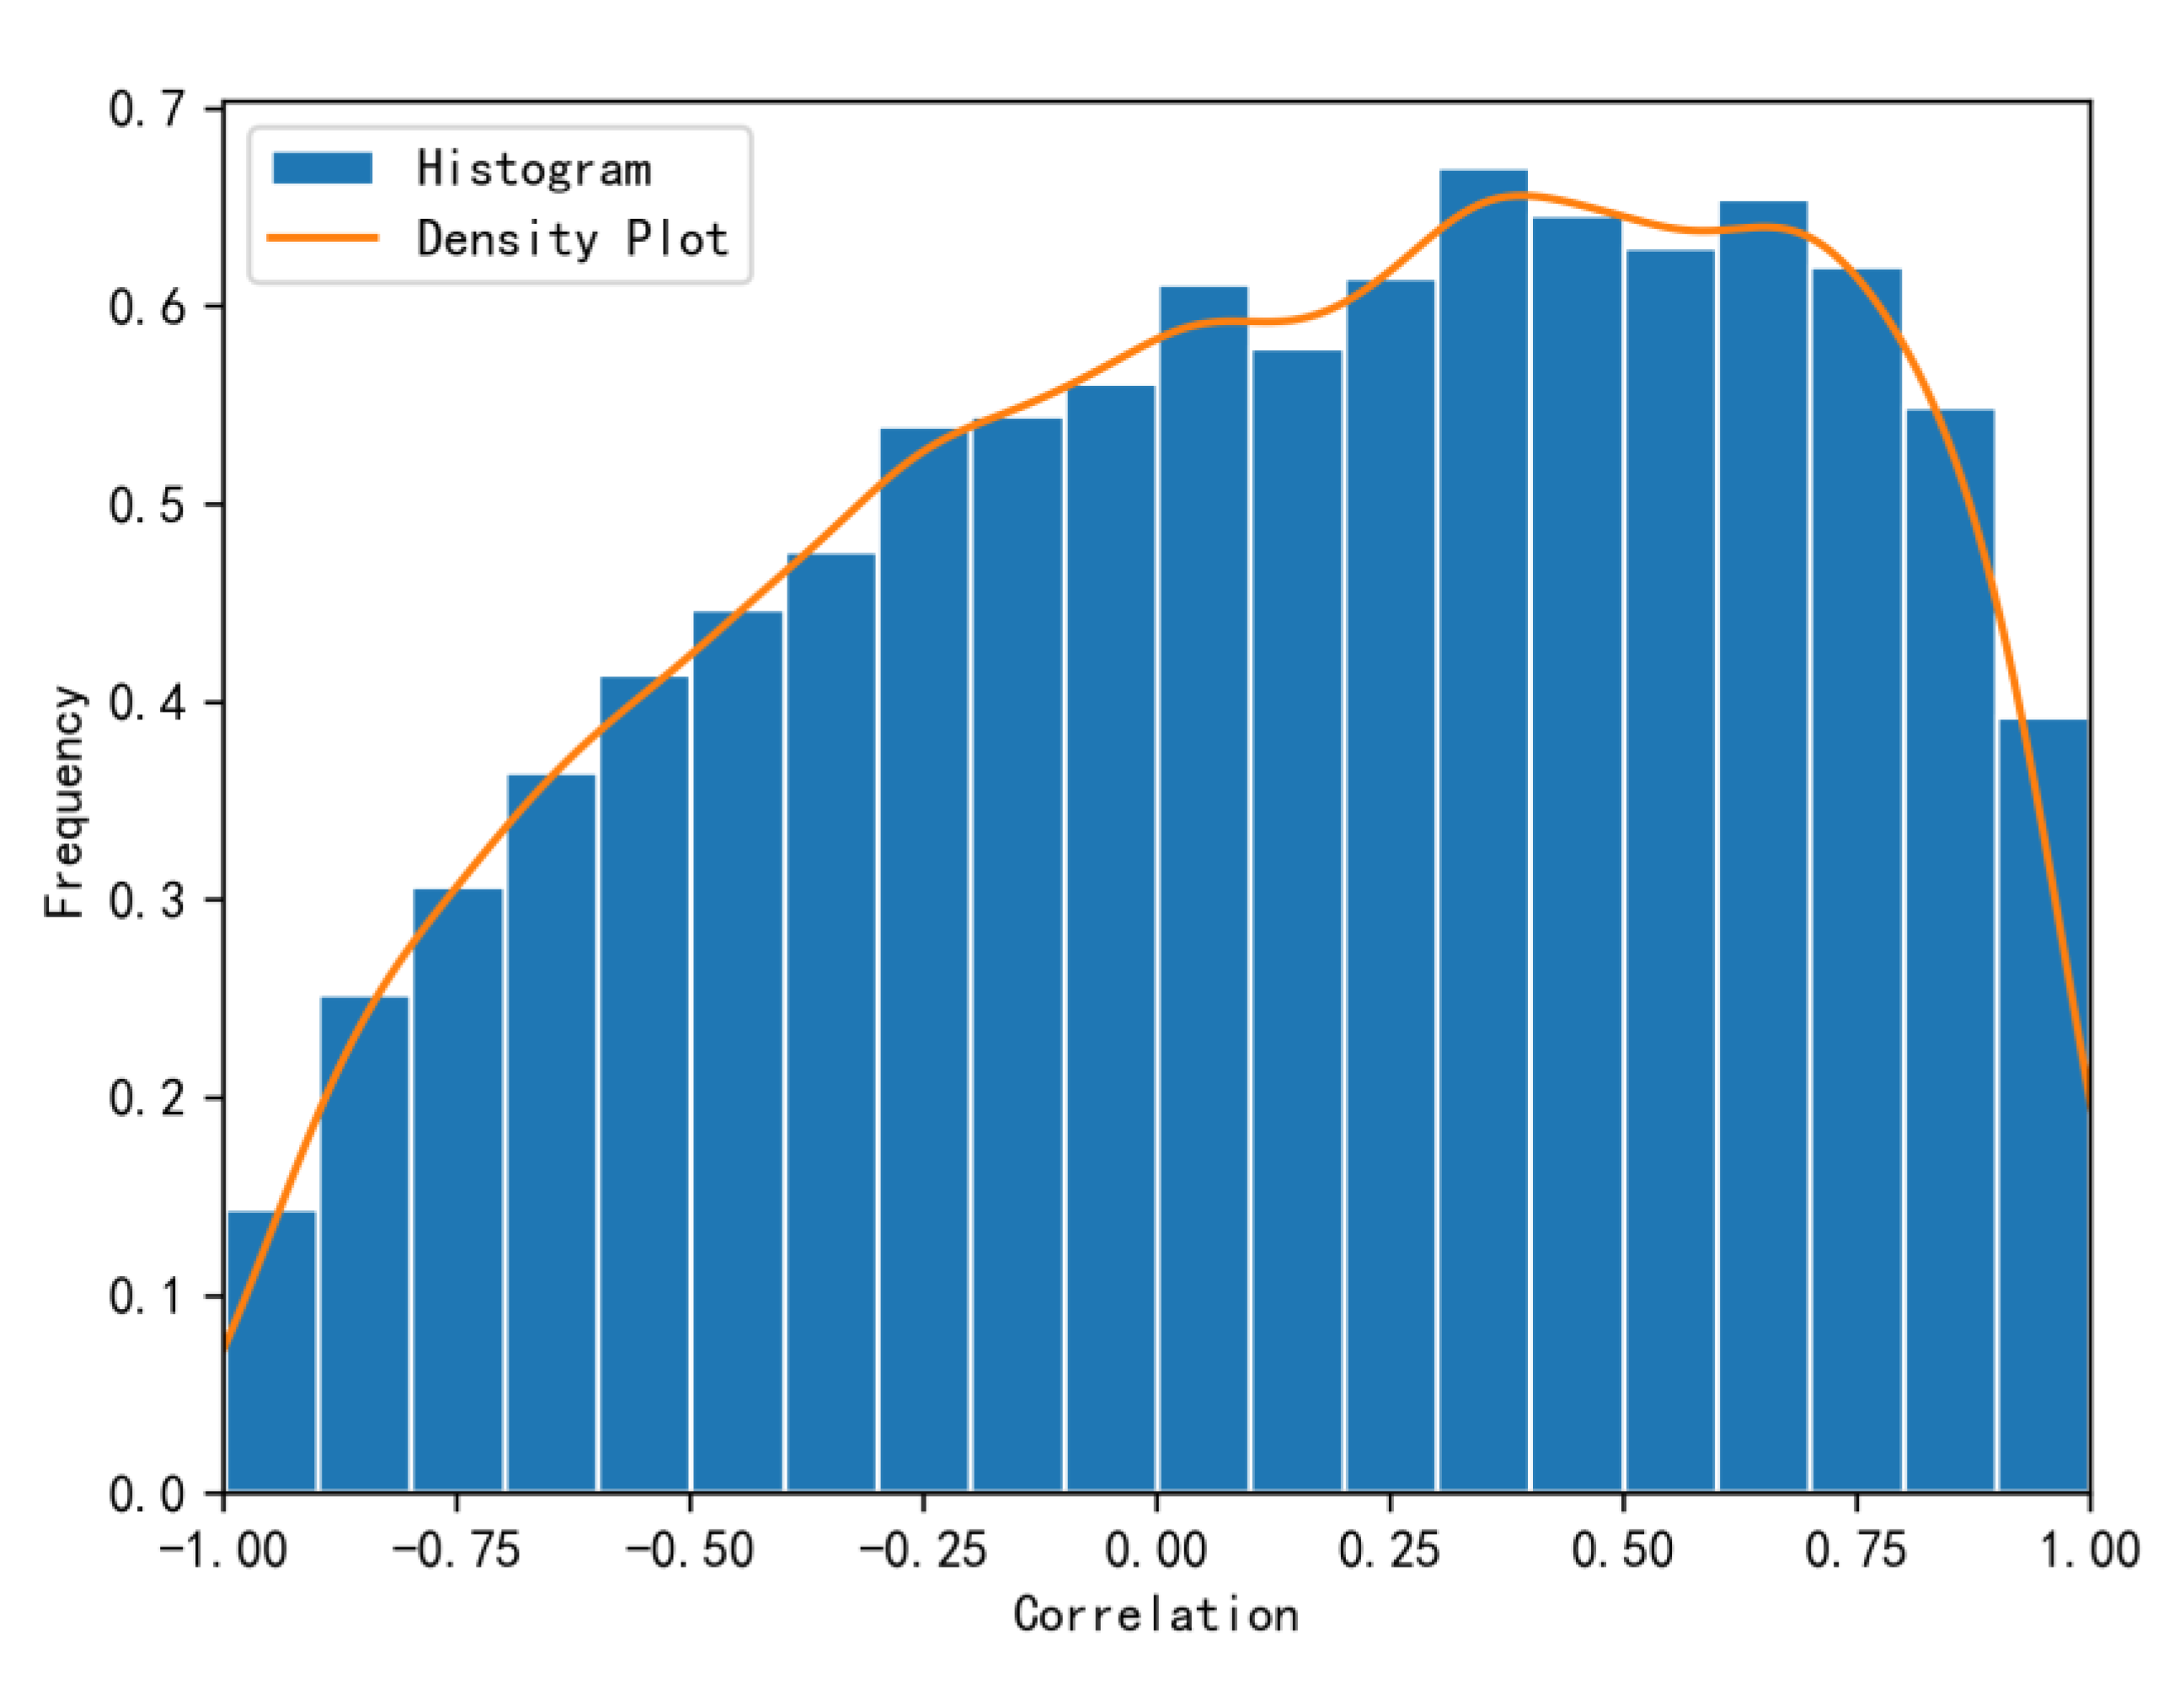
First, except for the capacity correlation network characteristic index S N I P H , the other nine indices require the selection of a threshold θ . Therefore, we first analyze the distribution of operational capacity correlations across shipping routes. We statistically evaluate all pairwise correlations among the nine routes during the period from July 2011 to June 2023, with their frequency histogram presented in Figure 5. From Figure 5, the frequency histogram exhibits a right-skewed distribution with flat kurtosis, where correlations are predominantly concentrated between 0.25 and 0.75. This pattern show that “synchronous increases and decreases” in operational capacities across routes occur more frequently than a pattern where “one decreases while the other increases”.
Second, we determine the optimal thresholds for the nine capacity correlation network characteristic indices across three network categories and three methodological approaches by analyzing regression results under varying thresholds. For thresholds ranging from 0.1 to 0.9 in increments of 0.1, we conduct 81 regressions (9 indices × 9 thresholds) using the baseline model specified in Equation (9). The regression outcomes are summarized in Table 6, where each column displays the results of a specific capacity correlation network characteristic index across nine thresholds.
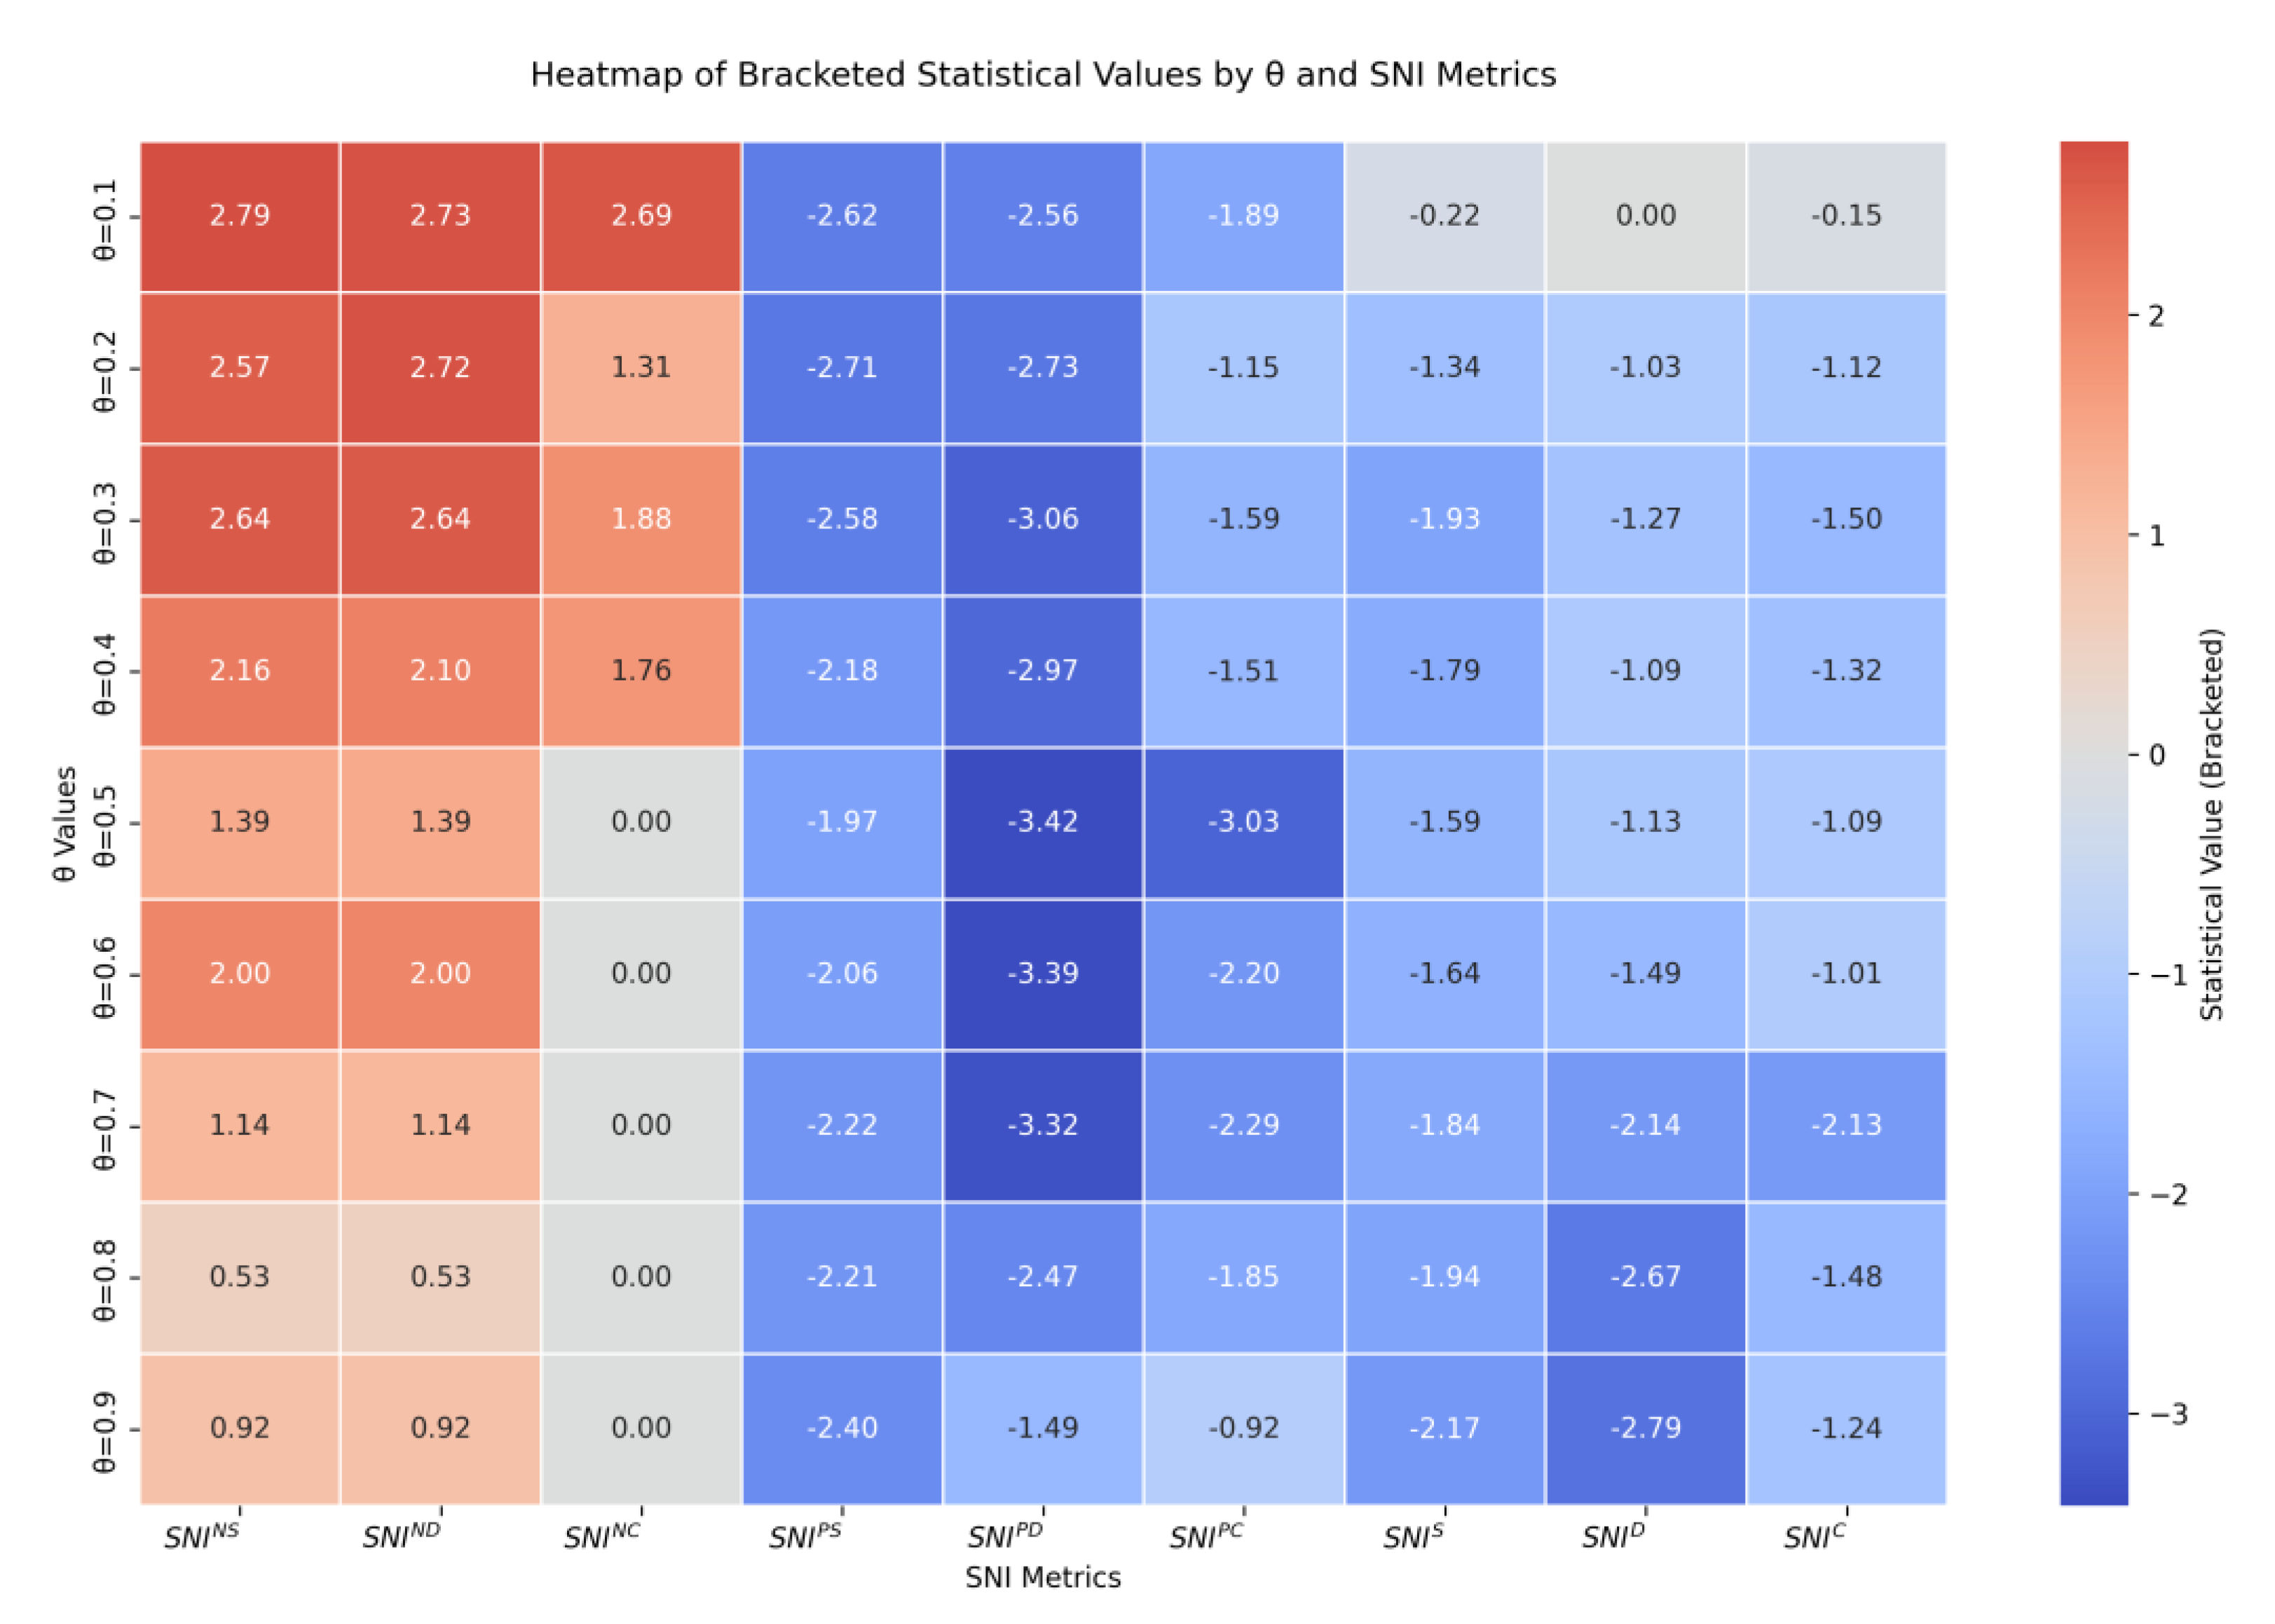
From Table 6 (To present the key information in Table 6 more intuitively, we have visualized the data and created a heatmap, as detailed in Figure A1.), it is evident that the three categories of nine capacity correlation network characteristic indices exhibit significant explanatory power for shipping freight rates, though their performance is heavily influenced by threshold selection. The optimal thresholds differ across the three categories of capacity correlation network indices. For the first category of capacity correlation network indices, the explanatory power for freight rates is more pronounced within the threshold range of 0.1 to 0.5, with the optimal threshold identified at 0.1 based on empirical results. For the second category, the indices demonstrate stronger explanatory power within the threshold range of 0.5 to 0.8, achieving optimal empirical performance at a threshold of 0.5. For the third category, the indices show heightened explanatory power within the threshold range of 0.7 to 0.9, with the optimal threshold empirically determined as 0.7. Second, all three categories of capacity correlation network characteristic indices significantly influence shipping freight rates, but with distinct directional effects. The first category of indices exhibits a positive and statistically significant explanatory effect for freight rates. The second category of indices demonstrates a negative and statistically significant explanatory effect for freight rates.
The first category of capacity correlation network characteristic indices reflects the inverse relationship in capacity changes between routes and demonstrates a positive and statistically significant explanatory effect for shipping freight rates. This occurs because, when capacity decreases for certain routes while increasing for others, resource reallocation drives rate increases on specific routes, thereby exerting an overall positive impact on freight rates.
The second category of capacity correlation network characteristic indices captures the synchronized capacity changes across routes. When global trade demand fluctuates holistically, the simultaneous increase or decrease in capacity across all routes leads to collective freight rate volatility, driven by synchronized supply–demand dynamics. For instance, during periods of capacity oversupply or insufficient demand, this synchronization may amplify downward pressure on freight rates. Consequently, the second category of indices exhibits a negative and statistically significant explanatory effect for shipping freight rates, as positive correlation networks magnify adverse market fluctuations in pricing during supply–demand imbalances.
The third category of capacity correlation network characteristic indices integrates both positive and negative correlation effects, demonstrating a positive and statistically significant explanatory effect for shipping freight rates. These indices reflect the overall strength and complexity of the capacity correlation network, providing a more comprehensive perspective on freight rate formation mechanisms.
Finally, we investigate the mechanistic impact of micro-level capacity correlation network characteristics on shipping freight rates. The threshold selections for the three categories of capacity correlation network characteristic indices are as follows: 0.1 for the first category, 0.5 for the second category, and 0.7 for the third category. Building on Equation (9), Equation (10) further introduces control variables including supply-side factors (fleet size), demand-side factors (China’s export container trade volume), cost factors (fuel oil prices), total operating shipping capacity (OSC), and the Global Economic Surprise Index (GESI). The regression results for the capacity correlation network characteristic indices under Equation (10) are presented in Table 7.
C C F I t = β n e t S N I t + β D D t + β S S t + β C C t + β O O C S t + β G G E S I t + α C C F I t 1 + ε t
From Table 7, it is evident that the capacity correlation network characteristic index S N I P H , constructed using the persistent homology method, retains a positive and statistically significant explanatory power for shipping freight rates. The first category of capacity correlation network indices continues to exhibit positive explanatory power for freight rates; however, the index S N I P H shows no statistically significant explanatory effect. The second and third categories of capacity correlation network indices still demonstrate negative explanatory effects on freight rates, though the third category lacks statistical significance. Notably, the first category of negative capacity correlation network indices incorporates richer information and exerts a more pronounced impact on freight rates compared to other categories. A critical limitation arises when selecting thresholds for both positive and negative correlation networks: threshold-based filtering inevitably leads to information loss. In contrast, the persistent homology-based correlation network avoids such information loss by inherently preserving the full spectrum of topological relationships.
The capacity correlation network characteristic index S N I P H , constructed using the persistent homology method, reflects the persistence of structural features in the capacity correlation network. When the shipping market is subjected to risk shocks, abrupt changes in network structural features occur, leading to a decrease in the index S N I P H and a corresponding decline in freight rates. Furthermore, even after controlling for variables such as supply (fleet size), demand (China’s export container trade volume), cost (fuel oil prices), operating shipping capacity (OSC), and the Global Economic Surprise Index (GESI), the capacity correlation network characteristic index retains significant explanatory power over freight rates. The experimental results demonstrate that the capacity correlation network characteristic index exerts a significant influence on freight rates, an effect that cannot be explained by traditional factors like supply, demand, or cost.
The impact of the S N I P H index on freight rates is not only driven by changes in the supply of the shipping market but is also fundamentally shaped by the stability of market structures and the dynamic interactions of participant behaviors. When the S N I P H value is high, shipping freight rates remain stable or elevated. The capacity correlation network exhibits a high degree of topological stability, characterized by long-term equilibrium in supply–demand relationships and the presence of redundant pathways. This stability manifests across multiple scales: for example, mature trade route networks (such as the Asia–Europe route) often form closed-loop structures. Additionally, the “behavioral stickiness” (path dependence) of market participants further reinforces network stability—carriers and shippers tend to maintain existing capacity allocations, and even when faced with short-term cost increases, such rational decision-making prevents disorderly adjustments to capacity. For instance, if the Asia–Europe route faces pressure due to rising fuel costs, carriers will still prioritize maintaining capacity on this route to avoid price collapses caused by cutthroat competition. Therefore, when S N I P H is high, the risk resilience and resource allocation efficiency of the capacity correlation network support the stability of freight rates and may even cause rates to remain high due to flexible adjustments (such as emergency service premiums).
When the S N I P H value is low, freight rates are prone to decline, indicating that the shipping market relies on a few critical routes, making the structure singular and fragile. For example, if the Red Sea route serves as the sole corridor for Asia–Europe trade, an interruption due to geopolitical conflict would force ships to detour via the Cape of Good Hope. While the distance and costs would increase significantly, the actual available capacity would sharply decrease due to detour-related losses (e.g., vessel shortages and time delays), leading to short-term supply–demand imbalances. A low S N I P H capacity correlation network amplifies the destructive effects of irrational behavior—sudden events (such as policy changes or panic rerouting) may trigger disorderly decisions by market participants, further disrupting the network structure. For instance, during the 2021 Suez Canal blockage, some carriers hastily diverted to other routes, causing congestion on detour routes and stagnation on original routes, leading to a collapse in freight rates due to short-term supply–demand disruptions. Moreover, the single-path nature of a low S N I P H capacity correlation network concentrates risk transmission, causing localized shocks (such as the paralysis of a hub port) to rapidly escalate into systemic crises. Therefore, the fragility and behavioral disorder of a low S N I P H capacity correlation network jointly contribute to declines in freight rates due to capacity losses, resource mismatches, or panic selling.
6. Robustness Test

6.1. Change the Lag Order

This section examines the robustness of the explanatory power of the capacity correlation network index for shipping freight rates by varying the number of lag periods. Table 8 presents the regression results of the capacity correlation network characteristic index S N I P H , constructed under three rolling windows ( w i n d o w = 4 , 6 , 8 ) using both Equations (9) and (10).
Table 8 shows evident that the capacity correlation network characteristic index S N I P H , constructed using the persistent homology method, consistently exhibits a positive explanatory effect for shipping freight rates across different rolling windows, aligning with the results in Table 7. Even for the w i n d o w = 8 , where the index’s impact on freight rates is not statistically significant, the correlation coefficient remains positive.

6.2. Change the Course

This section examines the robustness of the explanatory power of the capacity correlation network indices for shipping freight rates by varying the number of routes. Based on China’s total export trade volume to various countries from 2011 to 2023, as reported by the General Administration of Customs, and integrating data on the number of days with container ship arrivals at destination ports (recording 1 day if a container ship arrived and 0 days if none arrived on a given day), we rank the top 40 countries in China’s export container trade and present them in Table 9.
To test the robustness of the capacity correlation network characteristic index under varying numbers of shipping routes, we construct the index S N I P H using operational capacity data from China’s export container trade to the top 25, 30, 35, and 40 countries, ranked in Table 9. The regression results under Equations (9) and (10) are presented in Table 10. Table 10 demonstrates that the capacity correlation network characteristic index S N I P H exhibits a positive and statistically significant explanatory power for shipping freight rates across different country-specific route configurations. Furthermore, even after incorporating control variables, the index retains its positive and significant explanatory effect for freight rates.
Table 11 presents the regression results of the other nine capacity correlation network characteristic indices constructed from the operational capacities of 35 countries under Equation (9). The results show that the indices constructed from the first category of capacity correlation networks exhibit a positive explanatory effect for shipping freight rates. The indices from the second category demonstrate a negative explanatory effect for freight rates. The indices from the third category also display a negative explanatory effect for freight rates. With the exception of S N I N C , S N I S , S N I D and S N I C , all other capacity correlation network characteristic indices retain statistically significant effects on freight rates.
A comparison of Table 7 and Table 11 reveals that the first category of capacity correlation network characteristic indices incorporates richer information when analyzing nine shipping routes, while the second category demonstrates richer information when applied to thirty-five country-specific routes. However, the capacity correlation network characteristic index S N I P H , constructed using the persistent homology method, consistently exhibits a positive and statistically significant influence on shipping freight rates across both scenarios. This underscores that the persistent homology approach adopted in this study minimizes information loss compared to alternative methods, exhibits strong noise resistance, and performs robustly in analyzing high-dimensional, complex, and noisy data.
In addition, Table A1, based on Table 11, controlled for factors such as supply, demand, and cost; Table A2 demonstrates the impact of capacity correlation networks selected from different time periods on shipping freight rates.

7. Conclusions and Prospects

This study investigates the microstructural dynamics of international container capacity correlation networks and their impact on shipping freight rates using AIS data. First, we calculate the operational capacities of Chinese export container shipping routes and construct capacity correlation networks based on the pairwise correlations of operational capacities across routes. Second, leveraging the persistent homology method, we develop a capacity correlation network characteristic index ( S N I P H ). To assess this approach, we also construct nine additional capacity correlation network characteristic indices based on network connectivity and clustering properties. Finally, we analyze the explanatory power of these nine indices for freight rates under varying thresholds, identify optimal thresholds, and further investigate the influence of all ten indices on shipping freight rates.
Firstly, this study breaks through the limitations of traditional data sources by innovatively using AIS data to construct a capacity correlation network between routes. This method not only enables us to more accurately capture the changing patterns of the micro-level capacity correlation network structure in the shipping market but also successfully extracts key features of the container capacity correlation network. Through this network, we observe that the positive correlation network reflects the “simultaneous increase or decrease” in operational capacity across all routes when the shipping market is impacted by global shocks, while the negative correlation network reveals the “offsetting” changes in operational capacity between routes caused by international events. This finding provides a new perspective for comprehensively understanding the micro-level dynamics of the shipping market.
Secondly, this study is the first to introduce the persistent homology method into shipping market analysis, constructing a capacity correlation network characteristic index. This innovative method can accurately capture key topological features in the data while effectively avoiding noise interference, ensuring the integrity and robustness of information. Through comparative experiments based on the persistent homology method, we find that the capacity correlation network characteristic index has a significant impact on shipping freight rates, and this impact cannot be explained by other factors such as supply, demand, and cost. This discovery not only provides a new analytical tool for shipping market participants but also enriches the methodological system of complex network analysis in management science.
Furthermore, this study delves into the impact mechanisms of the capacity correlation network characteristic index on shipping freight rates. The research finds that this index not only reflects changes in micro-level network structures but also effectively responds to major events. This characteristic makes the capacity correlation network characteristic index an important theoretical framework for understanding the dynamic evolution mechanisms of the shipping market.
Finally, by revealing the changing characteristics of the capacity correlation network and its impact mechanisms on freight rates, this study provides a new analytical perspective and tool for shipping market participants. These tools not only help participants more accurately capture market dynamics but also provide scientific support for addressing monopolistic practices and information asymmetry in the container price market.
The research outcomes of this study have both theoretical value and significant practical implications. In the future, efforts can be made to actively promote the transformation and application of these research findings, providing shipping market participants with more scientific, precise, and practical decision-making tools and methods. For example, a shipping market forecasting system based on the capacity correlation network characteristic index can be developed to offer real-time market analysis and forecasting services to shipping enterprises. Additionally, empirical research can be conducted in collaboration with shipping enterprises to validate the effectiveness and feasibility of the research outcomes, promoting the healthy development of the shipping market.
Although this study has achieved significant results in the research of capacity correlation networks in the shipping market, there are still many directions worth exploring in the future. The current research primarily constructs the capacity correlation network based on AIS data. In the future, more data sources can be integrated, such as port operation data, ship leasing data, and international trade data, to more comprehensively reflect the complexity and dynamics of the shipping market. By integrating multi-source data, a more refined and accurate capacity correlation network model can be constructed, further revealing the micro-level dynamics and price formation mechanisms of the shipping market. By continuously expanding data sources, deepening the application of the persistent homology method, strengthening interdisciplinary collaboration, focusing on the integration of emerging technologies and the shipping market, and promoting the transformation and application of research outcomes, we can provide more scientific, precise, and practical theoretical support and practical guidance for the healthy development of the shipping market.

Author Contributions

Conceptualization, W.Z. and C.S.; methodology, W.Z.; software, W.Z.; validation, W.Z. and C.S.; formal analysis, W.Z. and C.S.; investigation, W.Z.; resources, W.Z.; data curation, W.Z. and S.W.; writing—original draft preparation, W.Z.; writing—review and editing, W.Z. and C.S.; visualization, W.Z.; supervision, W.Z. and C.S.; project administration, W.Z. and C.S.; funding acquisition, W.Z. and C.S. All authors have read and agreed to the published version of the manuscript.

Funding

This work is financially supported by the National Natural Science Foundation of China under Grants No. 72371045.

Informed Consent Statement

Informed consent was obtained from all subjects involved in the study.

Data Availability Statement

Data will be made available on request.

Conflicts of Interest

The authors declare no conflicts of interest.

Abbreviations

The following abbreviations are used in this manuscript:
AISAutomatic Identification System
FFAForward Freight Agreement
IMOInternational Maritime Organization
GCSNGlobal Container Shipping Network
CCFIChina Containerized Freight Index
GESIEconomic Surprise Index
OSCOperating Shipping Capacity Index
ADFAugmented Dickey–Fuller

Appendix A

Appendix A.1

Table A1 presents the regression results of the capacity correlation network feature index constructed using the operating capacity of 35 major export container countries of China under the following formula C C F I t = β n e t S N I t + β D D t + β S S t + β C C t + β O O C S t + β G G E S I t + α C C F I t 1 + ε t .
Table A1. Explanation of freight rates by the capacity correlation network feature index for national routes after including control variables.
(1)(2)(4)(6)(3)(5)(7)(8)(9)
S N I N S 0.483 *
(1.75)
S N I N D 1.667 *
(1.81)
S N I N C 0.140
(−0.44)
S N I P S −0.452 **
(−2.40)
S N I P D −2.430 **
(−2.39)
S N I P C −1.499 **
(−2.34)
S N I S −0.317
(−1.01)
S N I D −0.771
(−0.72)
S N I C −0.398
(−1.37)
F S 0.3070.2900.3000.2890.3000.2970.3060.3080.306
(1.16)(1.09)(1.13)(1.09)(1.13)(1.12)(1.15)(1.16)(1.15)
E C T V 0.078 ***0.081 ***0.083 ***0.077 ***0.077 ***0.076 ***0.080 ***0.082 ***0.082 ***
(3.07)(3.18)(3.25)(3.02)(3.04)(3.00)(3.12)(3.22)(3.24)
F O 0.0510.0440.0520.04730.0560.0570.0500.0540.056
(1.21)(1.03)(1.24)(1.13)(1.33)(1.37)(1.19)(1.28)(1.33)
O C S 0.0030.0030.0020.0030.0030.0030.0020.0020.002
(0.38)(0.36)(0.27)(0.41)(0.44)(0.40)(0.24)(0.28)(0.27)
G E S I 0.357 ***0.367 ***0.359 ***0.370 ***0.360 ***0.361 ***0.363 ***0.357 ***0.354 ***
(3.54)(3.63)(3.54)(3.67)(3.57)(3.58)(3.58)(3.54)(3.51)
C C F I t 1 0.571 ***0.571 ***0.579 ***0.564 ***0.566 ***0.568 ***0.578 ***0.579 ***0.577 ***
(17.09)(17.06)(17.43)(16.77)(16.89)(16.99)(17.41)(17.45)(17.42)
_ c o n s −0.003 **−0.005 **−0.0010.0010.006 **0.009 **0.0010.0010.002
(−2.12)(−2.08)(−0.28)(0.78)(2.09)(2.15)(0.23)(0.17)(0.88)
N 600600600600600600600600600
R 2 0.4270.4280.4250.4300.4300.4300.4250.4250.426
Note: values in parentheses are t-statistics, where * indicates p < 0.1, ** indicates p < 0.05, and *** indicates p < 0.01.

Appendix A.2

Table A2 presents the regression results of the capacity correlation network characteristic index constructed using the operational capacity of the nine major export container routes of China from 2016 to 2023 under the following formula:   C C F I t = β n e t S N I t + α C C F I t 1 + ε t .
Table A2. The explanatory power of the capacity correlation network characteristic index for the nine routes on freight rates (2016–2023).
(1)(2)(3)(4)(5)(6)(7)(8)(9)(10)
S N I P H 2.394 ***
(3.47)
S N I N S 1.521 ***
(2.85)
S N I N D 2.128 ***
(2.69)
S N I N C 0.677 ***
(3.09)
S N I P S −0.285
(−1.50)
S N I P D −2.179 ***
(−2.80)
S N I P C −0.362 **
(−2.20)
S N I S −0.062
(−0.56)
S N I D −0.771
(−0.70)
S N I C −0.157
(−0.87)
C C F I t 1 0.681 ***0.661 ***0.661 ***0.669 ***0.677 ***0.660 ***0.675 ***0.687 ***0.685 ***0.686 ***
(17.93)(17.19)(17.06)(17.79)(17.60)(17.10)(17.85)(18.08)(17.97)(18.20)
_ c o n s −0.013 ***−0.004 ***−0.003 **−0.001 **0.0010.002 **0.001 **0.0010.0010.004
(−3.38)(−2.71)(−2.49)(−2.22)(1.29)(2.58)(1.97)(0.50)(0.68)(0.76)
N 378378378378378378378378378378
R 2 0.03110.4870.4850.4890.4790.4860.4820.4760.4760.477
Note: values in parentheses are t-statistics, where ** indicates p < 0.05, and *** indicates p < 0.01.

Appendix A.3

To present the key information in the paper in a more intuitive and clear manner for reader comprehension, we have created a coefficient heatmap, shown in Table 6.
Figure A1. Heatmap of explanatory power of capacity correlation network characteristic index for freight rates under different thresholds.
Systems 13 00371 g0a1

References

  1. Choi, T.M.; Chung, S.H.; Zhuo, X. Pricing with Risk Sensitive Competing Container Shipping Lines: Will Risk Seeking Do More Good than Harm? Transp. Res. Part B Methodol. 2020, 133, 210–229. [Google Scholar] [CrossRef]
  2. Tang, X.; Kuang, H.B.; Guo, Y.Y.; Diao, S.J.; Zhang, P.F. Analysis and combined forecasting of China containerized freight index based on VMD. Syst. Eng.-Theory Pract. 2021, 41, 176–187. [Google Scholar] [CrossRef]
  3. Guerrero, D.; Letrouit, L.; Montes, C.P. The container transport system during Covid-19: An analysis through the prism of complex networks. Transp. Policy 2022, 115, 113–125. [Google Scholar] [CrossRef]
  4. Khan, K.; Su, C.W.; Khurshid, A.; Umar, M. The dynamic interaction between COVID-19 and shipping freight rates: A quantile on quantile analysis. Eur. Transp. Res. Rev. 2022, 14, 43. [Google Scholar] [CrossRef]
  5. Notteboom, T.; Pallis, T.; Rodrigue, J.-P. Disruptions and resilience in global container shipping and ports: The COVID-19 pandemic versus the 2008–2009 financial crisis. Marit. Econ. Logist. 2021, 23, 179–210. [Google Scholar] [CrossRef]
  6. Yap, W.Y.; Yang, D. Geopolitical tension and shipping network disruption: Analysis of the Red Sea crisis on container port calls. J. Transp. Geogr. 2024, 121, 104004. [Google Scholar] [CrossRef]
  7. Sui, C.; Wang, S.; Liang, J.M.; Nikos, K.N. The Supply-Elasticity-Based Influence of Operating Capacity on Freight Rates in the Container Shipping Market. SSRN 2024, 4910365. Available online: https://ssrn.com/abstract=4910365 (accessed on 8 May 2025).
  8. Bubenik, P.; Dłotko, P. A persistence landscapes toolbox for topological statistics. J. Symb. Comput. 2017, 78, 91–114. [Google Scholar] [CrossRef]
  9. Chen, S.; Meersman, H.; van de Voorde, E. Forecasting spot rates at main routes in the dry bulk market. Marit. Econ. Logist. 2012, 14, 498–537. [Google Scholar] [CrossRef]
  10. Bai, X.W. Tanker freight rates and economic policy uncertainty: A wavelet-based copula approach. Energy 2021, 235, 121383. [Google Scholar] [CrossRef]
  11. Sui, C.; Zhao, Y.; Sun, X.Q.; Kuang, H.B. Cross-market impacts of shipping and bulk commodities: The evidence from iron ore and its routes. Syst. Eng. Theory Pract. 2022, 42, 713–723. [Google Scholar] [CrossRef]
  12. Sui, C.; Wang, S.H.; Zheng, W. Sentiment as a shipping market predictor: Testing market-speciffc language models. Transp. Res. Part E Logist. Transp. Rev. 2024, 189, 103651. [Google Scholar] [CrossRef]
  13. Gavriilidis, K.; Kambouroudis, D.S.; Tsakou, K.; Tsouknidis, D.A. Volatility forecasting across tanker freight rates: The role of oil price shocks. Transp. Res. Part E Logist. Transp. Rev. 2018, 118, 376–391. [Google Scholar] [CrossRef]
  14. Lim, K.G.; Nomikos, N.K.; Yap, N. Understanding the fundamentals of freight markets volatility. Transp. Res. Part E Logist. Transp. Rev. 2019, 130, 1–15. [Google Scholar] [CrossRef]
  15. Bai, X.; Lam, J.S.L.; Jakher, A. Shipping sentiment and the dry bulk shipping freight market: New evidence from newspaper coverage. Transp. Res. Part E Logist. Transp. Rev. 2021, 155, 102490. [Google Scholar] [CrossRef]
  16. Monge, M.; Rojo, M.F.R.; Gil-Alana, L.A. The impact of geopolitical risk on the behavior of oil prices and freight rates. Energy 2023, 269, 126779. [Google Scholar] [CrossRef]
  17. Regli, F.; Nomikos, N.K. The eye in the sky–Freight rate effects of tanker supply. Transp. Res. Part E Logist. Transp. Rev. 2019, 125, 402–424. [Google Scholar] [CrossRef]
  18. Sugrue, D.; Adriaens, P. A data fusion approach to predict shipping efficiency for bulk carriers. Transp. Res. Part E Logist. Transp. Rev. 2021, 149, 102326. [Google Scholar] [CrossRef]
  19. Wang, Y.D.; Meng, Q. Optimizing freight rate of spot market containers with uncertainties in shipping demand and available ship capacity. Transp. Res. Part B Methodol. 2021, 146, 314–332. [Google Scholar] [CrossRef]
  20. Jin, L.; Chen, J.; Chen, Z.; Sun, X.; Yu, B. Impact of COVID-19 on China’s international liner shipping network based on AIS data. Transp. Policy. 2022, 121, 90–99. [Google Scholar] [CrossRef]
  21. Wang, J.; Xu, S.; Wu, L.; Wu, S.; Liu, Y. Multidimensional container shipping alliance decisions among competitors: Impact of capacity constraints and market competition. Transp. Res. Part E Logist. Transp. Rev. 2024, 190, 103694. [Google Scholar] [CrossRef]
  22. Brouer, B.D.; Karsten, C.V.; Pisinger, D. Optimization in liner shipping. Ann. Oper. Res. 2018, 271, 205–236. [Google Scholar] [CrossRef]
  23. Yu, H.; Fang, Z.; Lu, F.; Murray, A.T.; Zhao, Z.; Xu, Y.; Yang, X. Massive automatic identification system sensor trajectory data-based multi-layer linkage network dynamics of maritime transport along 21st-century maritime silk road. Sensors 2019, 19, 4197. [Google Scholar] [CrossRef] [PubMed]
  24. Yu, H.; Fang, Z.; Lu, F.; Murray, A.T.; Zhang, H.; Peng, P.; Mei, Q.; Chen, J. Impact of oil price fluctuations on tanker maritime network structure and traffic flow changes. Appl. Energy. 2019, 237, 390–403. [Google Scholar] [CrossRef]
  25. Tsiotas, D.; Ducruet, C. Measuring the effect of distance on the network topology of the Global Container Shipping Network. Sci. Rep. 2021, 11, 21250. [Google Scholar] [CrossRef]
  26. Tan, Z.; Sheng, D.; Yin, Y. Shore-power capacity allocation in a container shipping network under ships’ strategic behaviors. Transp. Res. Part B. 2025, 192, 103151. [Google Scholar] [CrossRef]
  27. Smith, D.A.; White, D.R. Structure and Dynamics of the Global Economy: Network Analysis of International Trade 1965–1980. Soc. Forces. 1992, 70, 857–893. [Google Scholar] [CrossRef]
  28. Newman, M.E.J. The structure and function of complex networks. SIAM Rev. 2003, 45, 167–256. [Google Scholar] [CrossRef]
  29. Hu, X.; Sun, B.; Wang, C.; Lim, M.K.; Wang, P.; Geng, X.; Yao, C.; Chen, W.-Q. Impacts of China’s exports decline in rare earth primary materials from a trade network-based perspective. Resour. Policy. 2023, 81, 103321. [Google Scholar] [CrossRef]
  30. Bubenik, P. Statistical topology data analysis using persistence landscapes. J. Mach. Learn. Res. 2015, 16, 77–102. [Google Scholar] [CrossRef]
  31. Gidea, M.; Katz, Y. Topological data analysis of financial time series: Landscapes of crashes. Phys. A Stat. Mech. Its Appl. 2018, 491, 820–834. [Google Scholar] [CrossRef]
  32. Ismail, M.S.; Noorani, M.S.M.; Ismail, M.; Razak, F.A.; Alias, M.A. Early warning signals of financial crises using persistent homology. Phys. A Stat. Mech. Its Appl. 2022, 586, 126459. [Google Scholar] [CrossRef]
  33. Tu, X.; Yang, Y.; Lin, Y.; Ma, S. Analysis of influencing factors and prediction of China’s Containerized Freight Index. Front. Mar. Sci. 2023, 10, 1245542. [Google Scholar] [CrossRef]
  34. Meng, B.; Lin, X.Q.; Kuang, H.B. Research on the long memory linkage effect of economic policy uncertainty on shipping market and financial market. Syst. Eng.-Theory Pract. 2023, 43, 1927–1945. [Google Scholar] [CrossRef]
Figure 1. Trends in the operational capacities of nine Chinese export container shipping routes.
Systems 13 00371 g001
Figure 2. Topological structure variation of the positive capacity correlation network.
Systems 13 00371 g002
Figure 3. Topological structure variation of the negative capacity correlation network.
Systems 13 00371 g003
Figure 4. Temporal trends of the capacity correlation network characteristic index S N I P H (2012–2022).
Systems 13 00371 g004
Figure 5. Histogram of frequency distribution of operational capacity correlations between shipping routes.
Systems 13 00371 g005
Table 1. Nine major Chinese export container shipping routes and destination countries.
No.Shipping RoutesAbbreviationCountries
1Australia and New Zealand routeAuNeAustralia (Sydney), New Zealand (Auckland)
2Europe routeEuropeGermany (Hamburg), Netherlands (Rotterdam), Belgium(Antwerp), United Kingdom (London, Southampton), France (Le Havre)
3Japan routeJapanJapan (Tokyo, Kobe, Yokohama)
4Korea routeKoreaSouth Korea (Busan, Incheon)
5South Africa routeSouth AfricaSouth Africa (Durban, Cape Town), Mozambique (Maputo)
6South America routeSouth AmericaBrazil (Santos, Rio de Janeiro, Paranaguá, Porto do Açu), Argentina (Buenos Aires), Uruguay (Montevideo), French Guiana (Cayenne), Peru (Lima, Tambopata), Chile (Valparaíso, Santiago), Colombia (Cali, Cartagena), Ecuador (Guayaquil)
7Southeast Asia routeSoutheast AsiaBrunei (Sri Baga Bay), Cambodia (Sihanoukville), Indonesia (Jakarta, Tanjung Priok, Surabaya), Malaysia (Port Klang, Penang Port), Myanmar (Yangon, Mandalay), Philippines (Manila, Cebu), Singapore (Singapore), Thailand (Bangkok, Laem Chabang), Vietnam (Ho Chi Minh City, Hai Phong)
8East Coast of the United States routeUSAEUnited States (New York, Miami, Tampa, Boston, Charleston, Houston, Philadelphia, Miami, Port Everglades, Savannah, New Orleans, Baltimore)
9West Coast of the United States routeUSAWUnited States (Los Angeles, San Francisco, Long Beach, Honolulu, Oakland, Seattle, Benicia, Tacoma, Portland)
Table 2. Capacity correlation network.
Network MatrixMatrixThresholdCategoryCategoryMethodMethod
Capacity correlation network W NO/ S N I P H Persistent homologyNetwork persistence
Negative capacity negative correlation network H N YESCategory I S N I N S Simplex countNetwork connectivity
S N I N D Degree valueNetwork connectivity
S N I N C Clustering coefficientNetwork clustering
Positive capacity correlation network H P YESCategory II S N I P S Simplex countNetwork persistence
S N I P D Degree valueNetwork connectivity
S N I P C Clustering coefficientNetwork connectivity
Capacity absolute correlation network H A B S YESCategory III S N I S Simplex countNetwork persistence
S N I D Degree valueNetwork connectivity
S N I C Clustering coefficientNetwork connectivity
Table 3. Variable definitions and data sources.
Variable TypeVariableVariable DefinitionVariable Definition
Dependent variable C C F I Logarithmic return rate of the China Containerized Freight Index i F i n d
Explanatory variables S N I P H Persistence of capacity correlation network calculated via persistent homologyConstructed from AIS data
S N I N S Simplex count in the capacity negative correlation network
S N I N D Degree value in the capacity negative correlation network
S N I N C Clustering coefficient in the capacity negative correlation network
S N I P S Simplex count in the capacity positive correlation network
S N I P D Degree value in the capacity positive correlation network
S N I P C Clustering coefficient in the capacity positive correlation network
S N I S Simplex count in the absolute value based capacity correlation network
S N I D Degree value in the absolute value based capacity correlation network
S N I C Clustering coefficient in the absolute value based capacity correlation network
Control variables F S Fleet size C l a r k s o n s
E C T V Export container trade volume of China i F i n d
F O Fuel oil price i F i n d
O S C Total operational capacity of China’s export container shippingConstructed from AIS data
G E S I Global Economic Surprise Index i F i n d
Table 4. Descriptive statistics.
VariablesNumber of ObservationsMeanStandard DeviationKurtosisSkewnessMinMaxADF
C C F I t 6000.0000.0094.298−0.185−0.0600.0430.000
S N I P H 6005.3480.7200.246−0.2682.8127.3940.000
S N I N S C 6000.0050.0010.246−0.2680.0030.0070.000
S N I N D D 6000.0010.0003.2031.5950.0000.0030.000
S N I N C C 6000.0090.003−0.0140.2280.0010.0200.000
S N I P S C 6000.0030.00217.9753.7690.0010.0170.000
S N I P D D 6000.0020.002−0.1830.6850.0000.0070.000
S N I P C C 6000.0010.0000.198−0.8130.0000.0020.000
S N I S C 6000.0020.00131.7284.6070.0010.0130.000
S N I D D 6000.0110.003−0.0190.2930.0020.0230.000
S N I C C 6000.0010.0004.2191.4530.0000.0030.000
F S 6000.0020.0010.2490.357−0.0010.0050.038
E C T V 600−0.0010.1142.076−0.433−0.4930.4100.003
F O 6000.0000.00719.3091.809−0.0400.0580.000
O S C 600−0.0010.03714.364−1.594−0.3450.1510.000
G E S I 6006.08529.8651.3511.027−75.700115.9000.043
Table 5. Pearson correlations between shipping freight rates, capacity correlation network characteristic indices, and other variables.
Panel A: Correlation Between Capacity Correlation Network Feature Indices
S N I P H S N I N S S N I N D S N I N C S N I P S S N I P D S N I P C S N I S S N I D S N I C
S N I P H 1.000
S N I N S 0.2701.000
S N I N D 0.2940.9551.000
S N I N C 0.1890.7290.5491.000
S N I P S −0.611−0.505−0.563−0.3021.000
S N I P D −0.412−0.728−0.790−0.4200.6461.000
S N I P C −0.383−0.508−0.544−0.3030.4500.7611.000
S N I S −0.684−0.312−0.355−0.1950.8230.5210.3801.000
S N I D −0.828−0.303−0.338−0.1990.7550.4920.3970.9021.000
S N I C −0.689−0.185−0.211−0.1100.4990.3110.2890.6550.7571.000
Panel B: Correlation Between Capacity Correlation Network Feature Indices and Freight Rates as well as Other Control Variables
S N I P H S N I N S S N I N D S N I N C S N I P S S N I P D S N I P C S N I S S N I D S N I C
C C F I t 0.1880.2390.2520.181−0.206−0.270−0.209−0.160−0.189−0.150
F S −0.0270.0280.0300.0190.0170.021−0.0170.0340.0440.047
E C T V 0.2180.1540.1840.107−0.252−0.233−0.208−0.206−0.224−0.203
F O 0.013−0.012−0.0250.003−0.0100.0160.024−0.014−0.014−0.045
O S C −0.0680.0730.0800.0070.146−0.059−0.0340.1190.0810.050
G E S I 0.0800.0440.0380.048−0.103−0.104−0.120−0.109−0.134−0.113
Table 6. Explanatory power of capacity correlation network characteristic indices on freight rates across different thresholds.
Category ⅠCategory ⅡCategory Ⅲ
S N I N S S N I N D S N I N C S N I P S S N I P D S N I P C S N I S S N I D S N I C
θ = 0.1 1.228 ***1.772 ***0.465 ***−0.200 ***−1.517 **−0.373 *−0.016−0.006−0.070
(2.79)(2.73)(2.69)(−2.62)(−2.56)(−1.89)(−0.22)(0.00)(−0.15)
θ = 0.2 1.426 **1.890 ***0.298−0.228 ***−1.567 ***−0.196−0.113−1.049−0.369
(2.57)(2.72)(1.31)(−2.71)(−2.73)(−1.15)(−1.34)(−1.03)(−1.12)
θ = 0.3 1.835 ***2.006 ***0.696 *−0.249 **−1.733 ***−0.240−0.182 *−1.082−0.361
(2.64)(2.64)(1.88)(−2.58)(−3.06)(−1.59)(−1.93)(−1.27)(−1.50)
θ = 0.4 1.835 **1.815 **1.388 *−0.259 **−1.724 ***−0.212−0.215 *−0.865−0.267
(2.16)(2.10)(1.76)(−2.18)(−2.97)(−1.51)(−1.79)(−1.09)(−1.32)
θ = 0.5 1.3781.3780.00−0.296 **−2.120 ***−0.397 ***−0.241−0.872−0.186
(1.39)(1.39)(0.00)(−1.97)(−3.42)(−3.03)(−1.59)(−1.13)(−1.09)
θ = 0.6 2.439 **2.439 **0.00−0.422 **−2.333 ***−0.284 **−0.333−1.180−0.151
(2.00)(2.00)(0.00)(−2.06)(−3.39)(−2.20)(−1.64)(−1.49)(−1.01)
θ = 0.7 1.7471.7470.00−0.632 **−2.693 ***−0.316 **−0.517 *−1.841 **−0.290 **
(1.14)(1.14)(0.00)(−2.22)(−3.32)(−2.29)(−1.84)(−2.14)(−2.13)
θ = 0.8 1.1191.1190.00−1.044 **−2.638 **−0.323 *−0.887 *−2.792 ***−0.228
(0.53)(0.53)(0.00)(−2.21)(−2.47)(−1.85)(−1.94)(−2.67)(−1.48)
θ = 0.9 3.4873.4870.00−2.940 **−2.927−0.327−2.506 **−4.943 ***−0.339
(0.92)(0.92)(0.00)(−2.40)(−1.49)(−0.92)(−2.17)(−2.79)(−1.24)
C C F I t 1 YESYESYESYESYESYESYESYESYES
_ c o n s YESYESYESYESYESYESYESYESYES
N 600600600600600600600600600
Note: Values in parentheses are t-statistics, where * denotes p < 0.1, ** denotes p < 0.05, and *** denotes p < 0.01. The capacity correlation network characteristic indices S N I N S and S N I N D , both representing network connectivity features, exhibit extremely high correlation. For thresholds of 0.5 and above, the difference between simplex counts and degree values in the negative correlation network becomes constant, resulting in identical regression outcomes.
Table 7. Explanation of freight rates by capacity correlation network feature indices after including control variables.
(1)(2)(3)(4)(5)(6)(7)(8)(9)(10)
S N I P H 0.859 **
(2.12)
S N I N S 1.118 **
(2.55)
S N I N D 1.605 **
(2.47)
S N I N C 0.416 **
(2.44)
S N I P S −0.191
(−1.25)
S N I P D −1.760 ***
(−2.82)
S N I P C −0.300 **
(−2.27)
S N I S −0.102
(−1.18)
S N I D −1.165
(−1.34)
S N I C −0.182
(−1.33)
F S 0.3180.2900.2920.2920.3110.3170.2850.3090.3160.315
(1.20)(1.10)(1.11)(1.11)(1.17)(1.21)(1.08)(1.17)(1.20)(1.19)
E C T V 0.072 ***0.076 ***0.074 ***0.078 ***0.0757 ***0.069 ***0.072 ***0.077 ***0.076 ***0.076 ***
(2.81)(2.98)(2.91)(3.08)(2.92)(2.68)(2.81)(3.01)(2.94)(2.97)
F O 0.0510.0540.0550.0520.05120.0560.0550.0520.0510.049
(1.22)(1.29)(1.32)(1.23)(1.22)(1.33)(1.30)(1.23)(1.22)(1.17)
O C S 0.0030.0010.0010.0020.003630.0010.0020.0030.0030.003
(0.43)(0.09)(0.08)(0.27)(0.47)(0.11)(0.20)(0.34)(0.40)(0.35)
G E S I 0.349 ***0.359 ***0.362 ***0.353 ***0.351 ***0.345 ***0.336 ***0.347 ***0.346 ***0.347 ***
(3.47)(3.58)(3.61)(3.52)(3.48)(3.44)(3.33)(3.43)(3.42)(3.43)
C C F I t 1 0.571 ***0.560 ***0.559 ***0.569 ***0.572 ***0.559 ***0.570 ***0.574 ***0.573 ***0.576 ***
(17.18)(16.59)(16.46)(17.09)(16.99)(16.60)(17.14)(17.20)(17.16)(17.35)
_ c o n s −0.005 **−0.003 ***−0.003 ***−0.002 ***0.0010.001 ***0.001−0.002 *−0.001−0.001
(−2.40)(−2.91)(−2.84)(−2.40)(0.39)(1.16)(0.60)(−1.74)(−0.15)(−0.39)
N 600600600600600600600600600600
R 2 0.4280.4300.4300.4300.4260.4320.4290.4250.4260.426
Note: values in parentheses are t-statistics, where * indicates p < 0.1, ** indicates p < 0.05, and *** indicates p < 0.01.
Table 8. Explanation of freight rates by the capacity correlation network feature index across different rolling windows.
(1)(2)(3)(4)(5)(6)
S N I w i n d o w = 4 P H 1.224 * 1.269 **
(1.93) (2.02)
S N I w i n d o w = 6 P H 1.108 *** 0.859 **
(2.76) (2.12)
S N I w i n d o w = 8 P H 0.485 0.149
(1.31) (0.40)
F S 0.2910.3180.302
(1.10)(1.20)(1.14)
E C T V 0.080 ***0.072 ***0.081 ***
(3.16)(2.81)(3.12)
F O 0.0520.0510.051
(1.25)(1.22)(1.22)
O C S 0.0030.0030.002
(0.39)(0.43)(0.32)
G E S I 0.369 ***0.349 ***0.353 ***
(3.66)(3.47)(3.48)
C C F I t 1 0.631 ***0.619 ***0.626 ***0.576 ***0.571 ***0.577 ***
(19.94)(19.39)(19.43)(17.41)(17.18)(17.30)
_ c o n s −0.003 *−0.006 ***−0.003−0.004 **−0.005 **−0.002
(−1.92)(−2.75)(−1.32)(−2.39)(−2.40)(−0.70)
N 600600600600600600
R 2 0.4040.4080.4020.4280.4280.424
Note: S N I w i n d o w = i P H is the capacity correlation network feature index S N I P H constructed based on the operating capacity of the nine routes of CCFI under the rolling w i n d o w = i . Values in parentheses are t-statistics, where * indicates p < 0.1, ** indicates p < 0.05, and *** indicates p < 0.01.
Table 9. Ranking of host countries for China’s export container trade.
NumberCountryDays to PortExport Trade
Volume (Billion USD)
NumberCountryDays to PortExport Trade
Volume (Billion USD)
1United States4476612.321France72846.7
2Japan4540210.422Spain101137.3
3Korea4540157.723Saudi Arabia277734.0
4Vietnam4161117.424Belgium60629.5
5Germany1288117.125South Africa223624.0
6Netherlands1716105.426Chile166521.9
7India3376101.927Nigeria49120.8
8United Kingdom97587.528Egypt442416.6
9Russian285076.829Panama388314.5
10Malaysia453775.730Israel131214.1
11Singapore453875.731Colombia160412.7
12Australia426868.932Argentina203212.3
13Thailand443365.133Peru175011.4
14Mexico347262.334Greece19829.4
15Indonesia420261.435New Zealand14928.0
16Brazil262254.036Morocco8685.7
17United Arab Emirates287351.837Portugal5875.5
18Canada263250.438Sri Lanka28965.5
19Philippines451448.639Malta11763.0
20Italy131548.340Jamaica11871.0
Table 10. Explanation of freight rates by the capacity correlation network feature index S N I P H for routes in different countries.
(1)(2)(3)(4)(5)(6)(7)(8)
S N I l i n e = 25 P H 1.319 ** 1.238 **
(2.19) (2.08)
S N I l i n e = 30 P H 1.104 ** 1.097 **
(2.55) (2.53)
S N I l i n e = 35 P H 1.022 *** 0.935 ***
(2.94) (2.71)
S N I l i n e = 40 P H 0.651 ** 0.553 *
(2.21) (1.90)
F S 0.2550.1940.2500.298
(0.96)(0.73)(0.95)(1.13)
E C T V 0.081 ***0.084 ***0.0810 ***0.081 ***
(3.20)(3.35)(3.21)(3.22)
F O 0.0500.0530.0530.050
(1.18)(1.26)(1.27)(1.19)
O C S 0.0030.0040.0030.003
(0.38)(0.48)(0.41)(0.40)
G E S I 0.356 ***0.343 ***0.340 ***0.343 ***
(3.54)(3.41)(3.38)(3.40)
C C F I t 1 0.617 ***0.618 ***0.615 ***0.622 ***0.564 ***0.564 ***0.564 ***0.571 ***
(19.02)(19.19)(19.16)(19.45)(16.70)(16.80)(16.87)(17.13)
_ c o n s −0.003 **−0.003 **−0.004 ***−0.003 **−0.003 **−0.004 ***−0.004 ***−0.003 **
(−2.17)(−2.52)(−2.90)(−2.19)(−2.47)(−2.88)(−3.04)(−2.28)
N 600600600600600600600600
R 2 0.4050.4070.4090.4050.4280.4300.4310.428
Note: values in parentheses are t-statistics, where * indicates p < 0.1, ** indicates p < 0.05, and *** indicates p < 0.01.
Table 11. Explanation of freight rates by the capacity correlation network feature index for national routes.
(1)(2)(3)(4)(5)(6)(7)(8)(9)
S N I N S 0.574 **
(2.06)
S N I N D 1.764 *
(1.90)
S N I N C 0.154
(0.47)
S N I P S −0.482 **
(−2.54)
S N I P D −2.616 **
(−2.55)
S N I P C −1.621 **
(−2.52)
S N I S −0.406
(−1.29)
S N I D −0.866
(−0.80)
S N I C −0.408
(−1.39)
C C F I t 1 0.623 ***0.624 ***0.634 ***0.617 ***0.619 ***0.620 ***0.632 ***0.633 ***0.632 ***
(19.41)(19.48)(19.94)(19.10)(19.23)(19.34)(19.88)(19.96)(19.92)
_ c o n s −0.003 **−0.005 *−0.0010.001 **0.008 **0.011 **0.0010.0010.002
(−2.05)(−1.90)(−0.42)(2.22)(2.53)(2.51)(1.21)(0.76)(1.35)
N 600600600600600600598600600
R 2 0.4050.4040.4010.4070.4070.4070.4020.4010.403
Note: values in parentheses are t-statistics, where * indicates p < 0.1, ** indicates p < 0.05, and *** indicates p < 0.01.
Disclaimer/Publisher’s Note: The statements, opinions and data contained in all publications are solely those of the individual author(s) and contributor(s) and not of MDPI and/or the editor(s). MDPI and/or the editor(s) disclaim responsibility for any injury to people or property resulting from any ideas, methods, instructions or products referred to in the content.