5.1. Data
This study selects the weekly data of the China Containerized Freight Index (CCFI) as the dependent variable.
The China Containerized Freight Index (CCFI) is a critical index that objectively reflects the container shipping market between China and major trading nations, and it serves as a globally recognized benchmark for assessing the state of the container shipping market [
33]. The CCFI is widely recognized as a “barometer” of global container freight rates. With its broad coverage and high data representativeness, the CCFI not only reflects changes in China’s export container freight rates but also profoundly influences the dynamics of the global container freight market. Therefore, this study selects the weekly data of the CCFI as the dependent variable. The capacity correlation network characteristic indices constructed in this study are employed as key explanatory variables. The original AIS data used to derive these indices are sourced from Elane, a leading maritime big data provider.
This study also incorporates fleet size, China’s export container trade volume, fuel oil prices, total operating shipping capacity for Chinese exports, and the Global Economic Surprise Index (GESI) as control variables. Given the significant cross-market risk linkages between financial markets and shipping markets [
34], the Global Economic Surprise Index is included in the analysis to account for macroeconomic shocks. Furthermore, to verify whether the capacity correlation network characteristic index operates independently of total operating shipping capacity, we control for the impact of total operating shipping capacity on freight rates. The Total Operating Shipping Capacity Index (OSC) for Chinese exports is calculated based on the aggregate operating capacity across nine major shipping routes. All variables in this study utilize weekly data spanning from July 2011 to June 2023. Detailed definitions and sources of these variables are provided in
Table 3.
Table 4 presents the descriptive statistical results of all variables in this study. Among them, the variables CFI, FS, ECTV, and FO were subjected to logarithmic first-order differencing, where
denotes the application of logarithmic first-order differencing to the data. The remaining indicators retain their original series. The last column of
Table 4 displays the results of the Augmented Dickey–Fuller (ADF) tests, confirming the stationarity of the variables.
Table 5 presents the correlations between the capacity correlation network characteristic indices and other variables. Panel A displays correlations among the capacity correlation network characteristic indices, while Panel B shows correlations between these indices and external variables.
From Panel A, we observe that the network characteristic index is positively correlated with the first category of capacity correlation network indices and negatively correlated with the second and third categories. Notably, the characteristic indices constructed using simplex counts and degree values both reflect network connectivity, leading to extremely high correlations between these two sets of indices.
In Panel B, the capacity correlation network characteristic index exhibits a positive correlation with freight rates, as does the first category of capacity correlation network indices. In contrast, the second and third categories of capacity correlation network indices demonstrate negative correlations with freight rates.
5.2. Empirical Analysis
This study employs the
model as the baseline framework, utilizing the capacity correlation network characteristic index (
) as the explanatory variable and the China Containerized Freight Index (CCFI) as the dependent variable.
where
represents the capacity correlation network characteristic index, and
is the regression parameter for this index.
First, except for the capacity correlation network characteristic index
, the other nine indices require the selection of a threshold
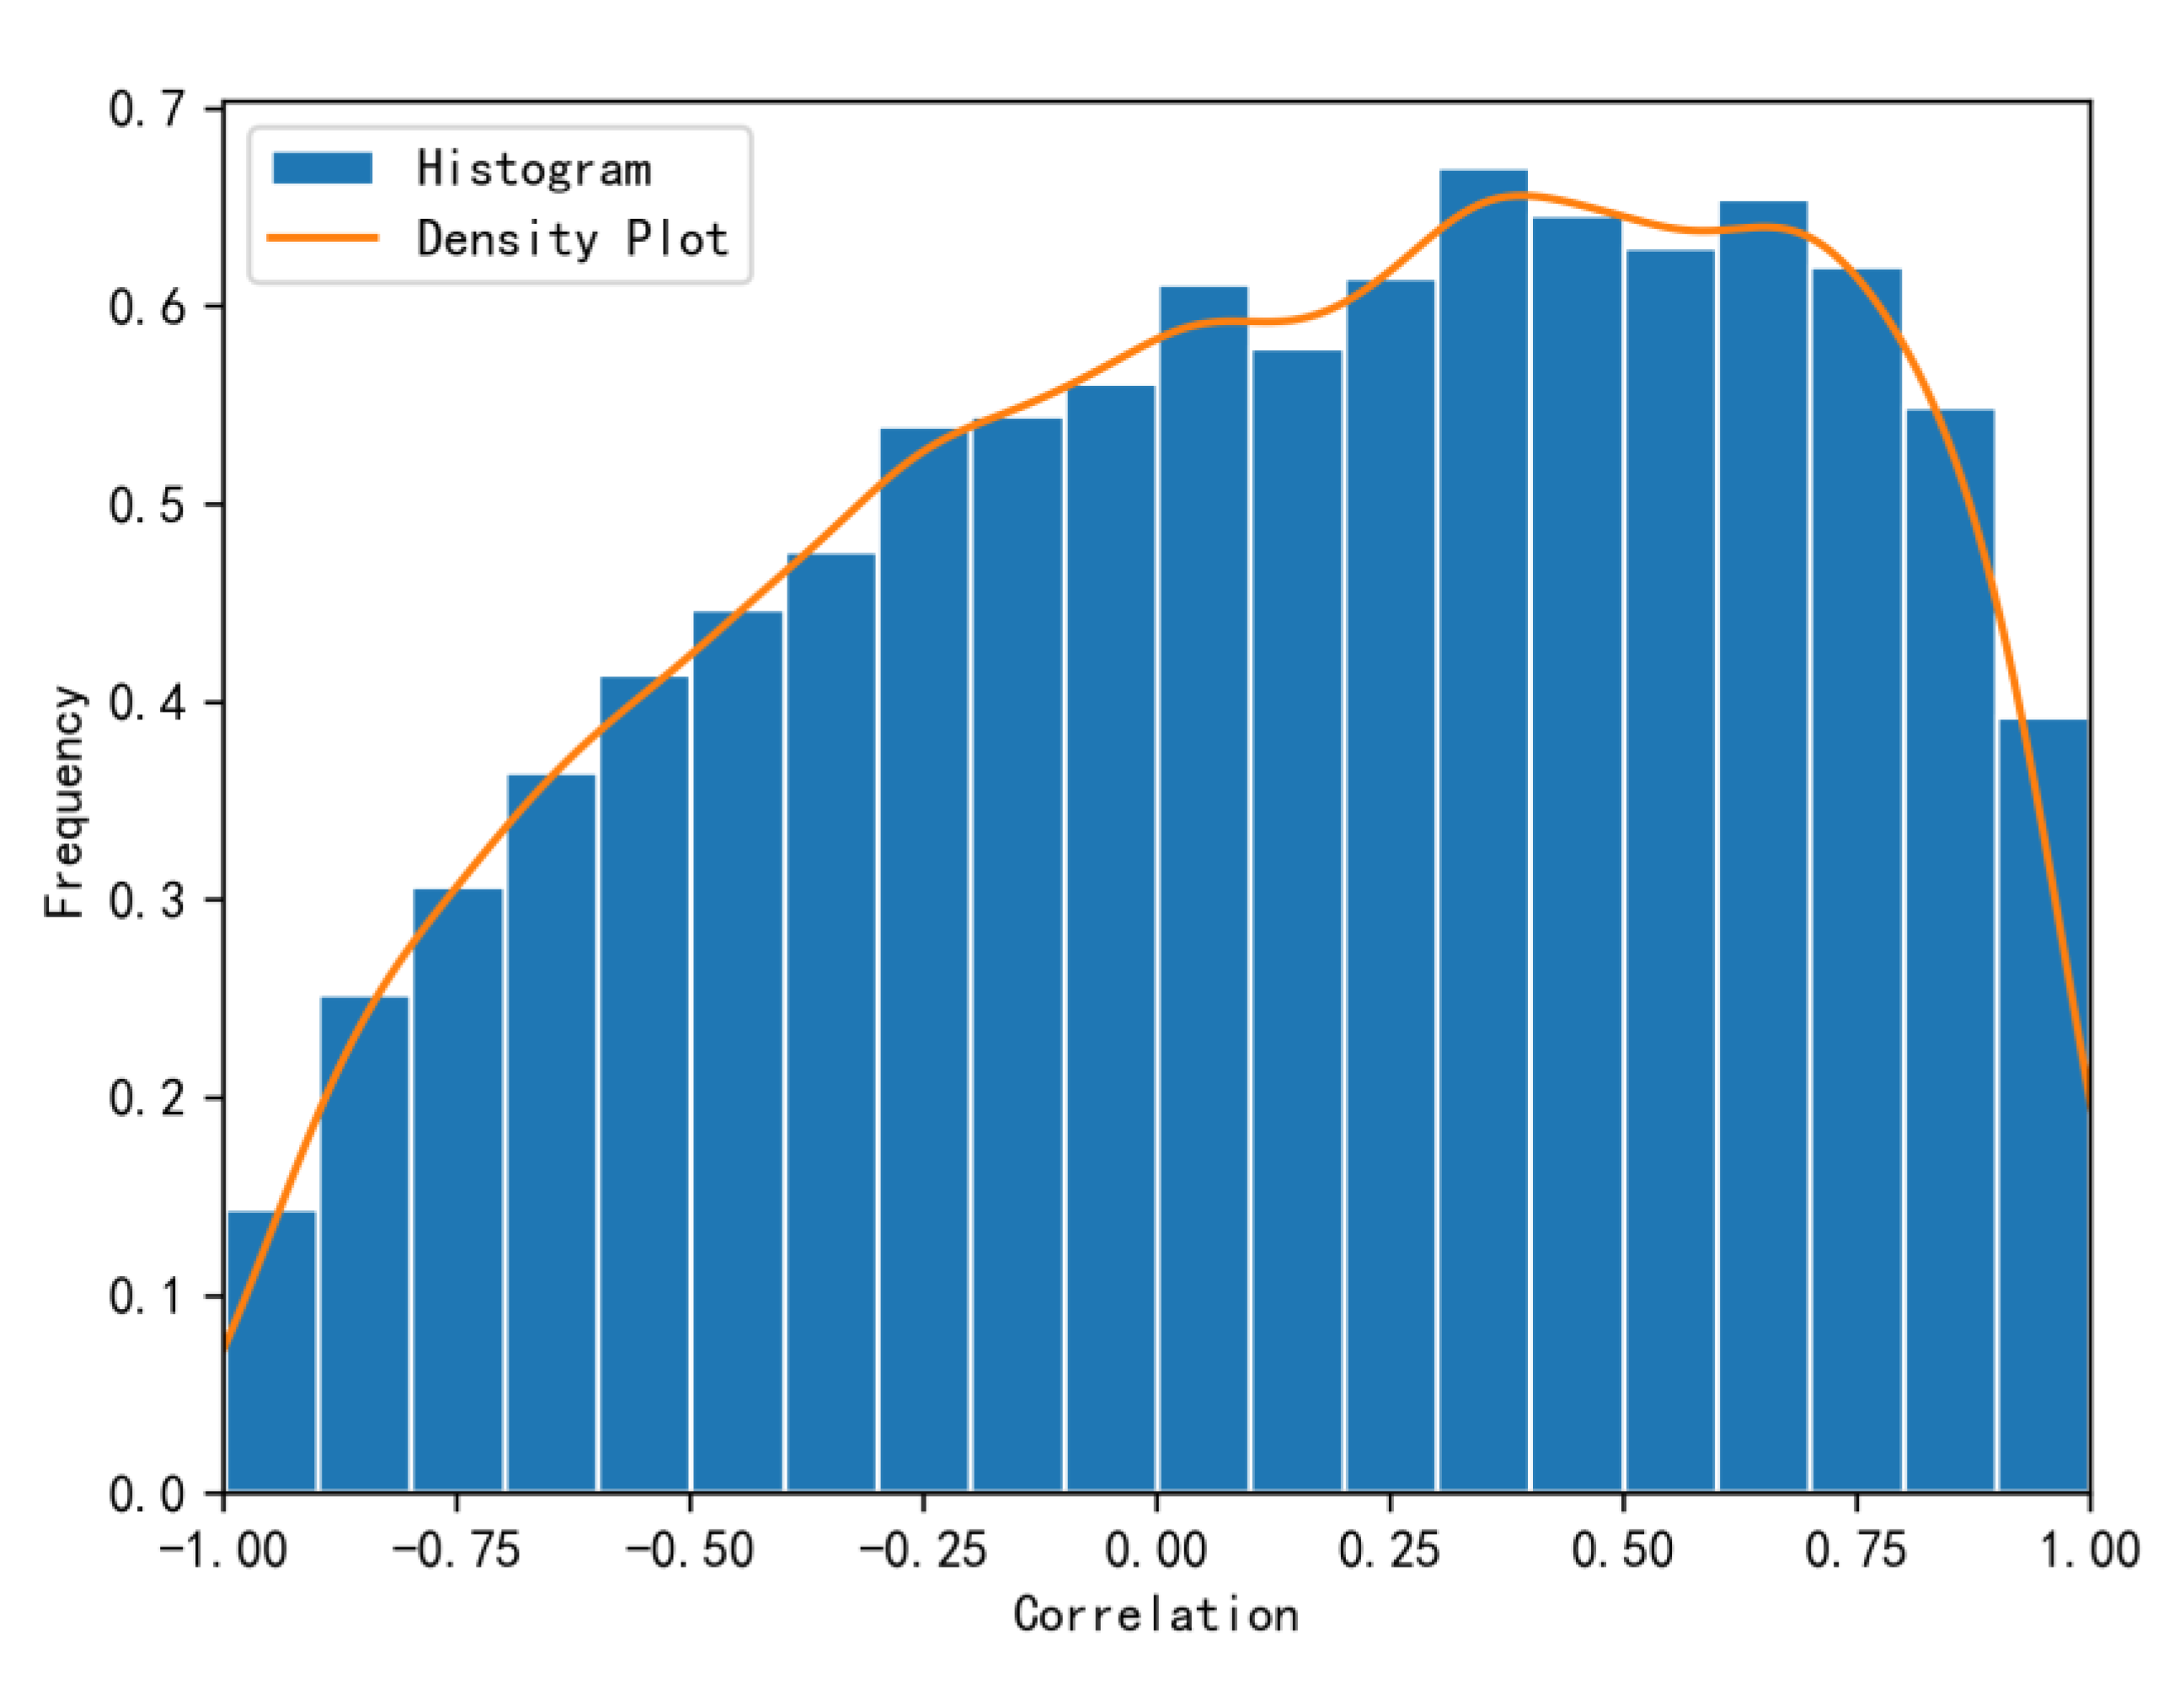
. Therefore, we first analyze the distribution of operational capacity correlations across shipping routes. We statistically evaluate all pairwise correlations among the nine routes during the period from July 2011 to June 2023, with their frequency histogram presented in
Figure 5. From
Figure 5, the frequency histogram exhibits a right-skewed distribution with flat kurtosis, where correlations are predominantly concentrated between 0.25 and 0.75. This pattern show that “synchronous increases and decreases” in operational capacities across routes occur more frequently than a pattern where “one decreases while the other increases”.
Second, we determine the optimal thresholds for the nine capacity correlation network characteristic indices across three network categories and three methodological approaches by analyzing regression results under varying thresholds. For thresholds ranging from 0.1 to 0.9 in increments of 0.1, we conduct 81 regressions (9 indices × 9 thresholds) using the baseline model specified in Equation (9). The regression outcomes are summarized in
Table 6, where each column displays the results of a specific capacity correlation network characteristic index across nine thresholds.
From
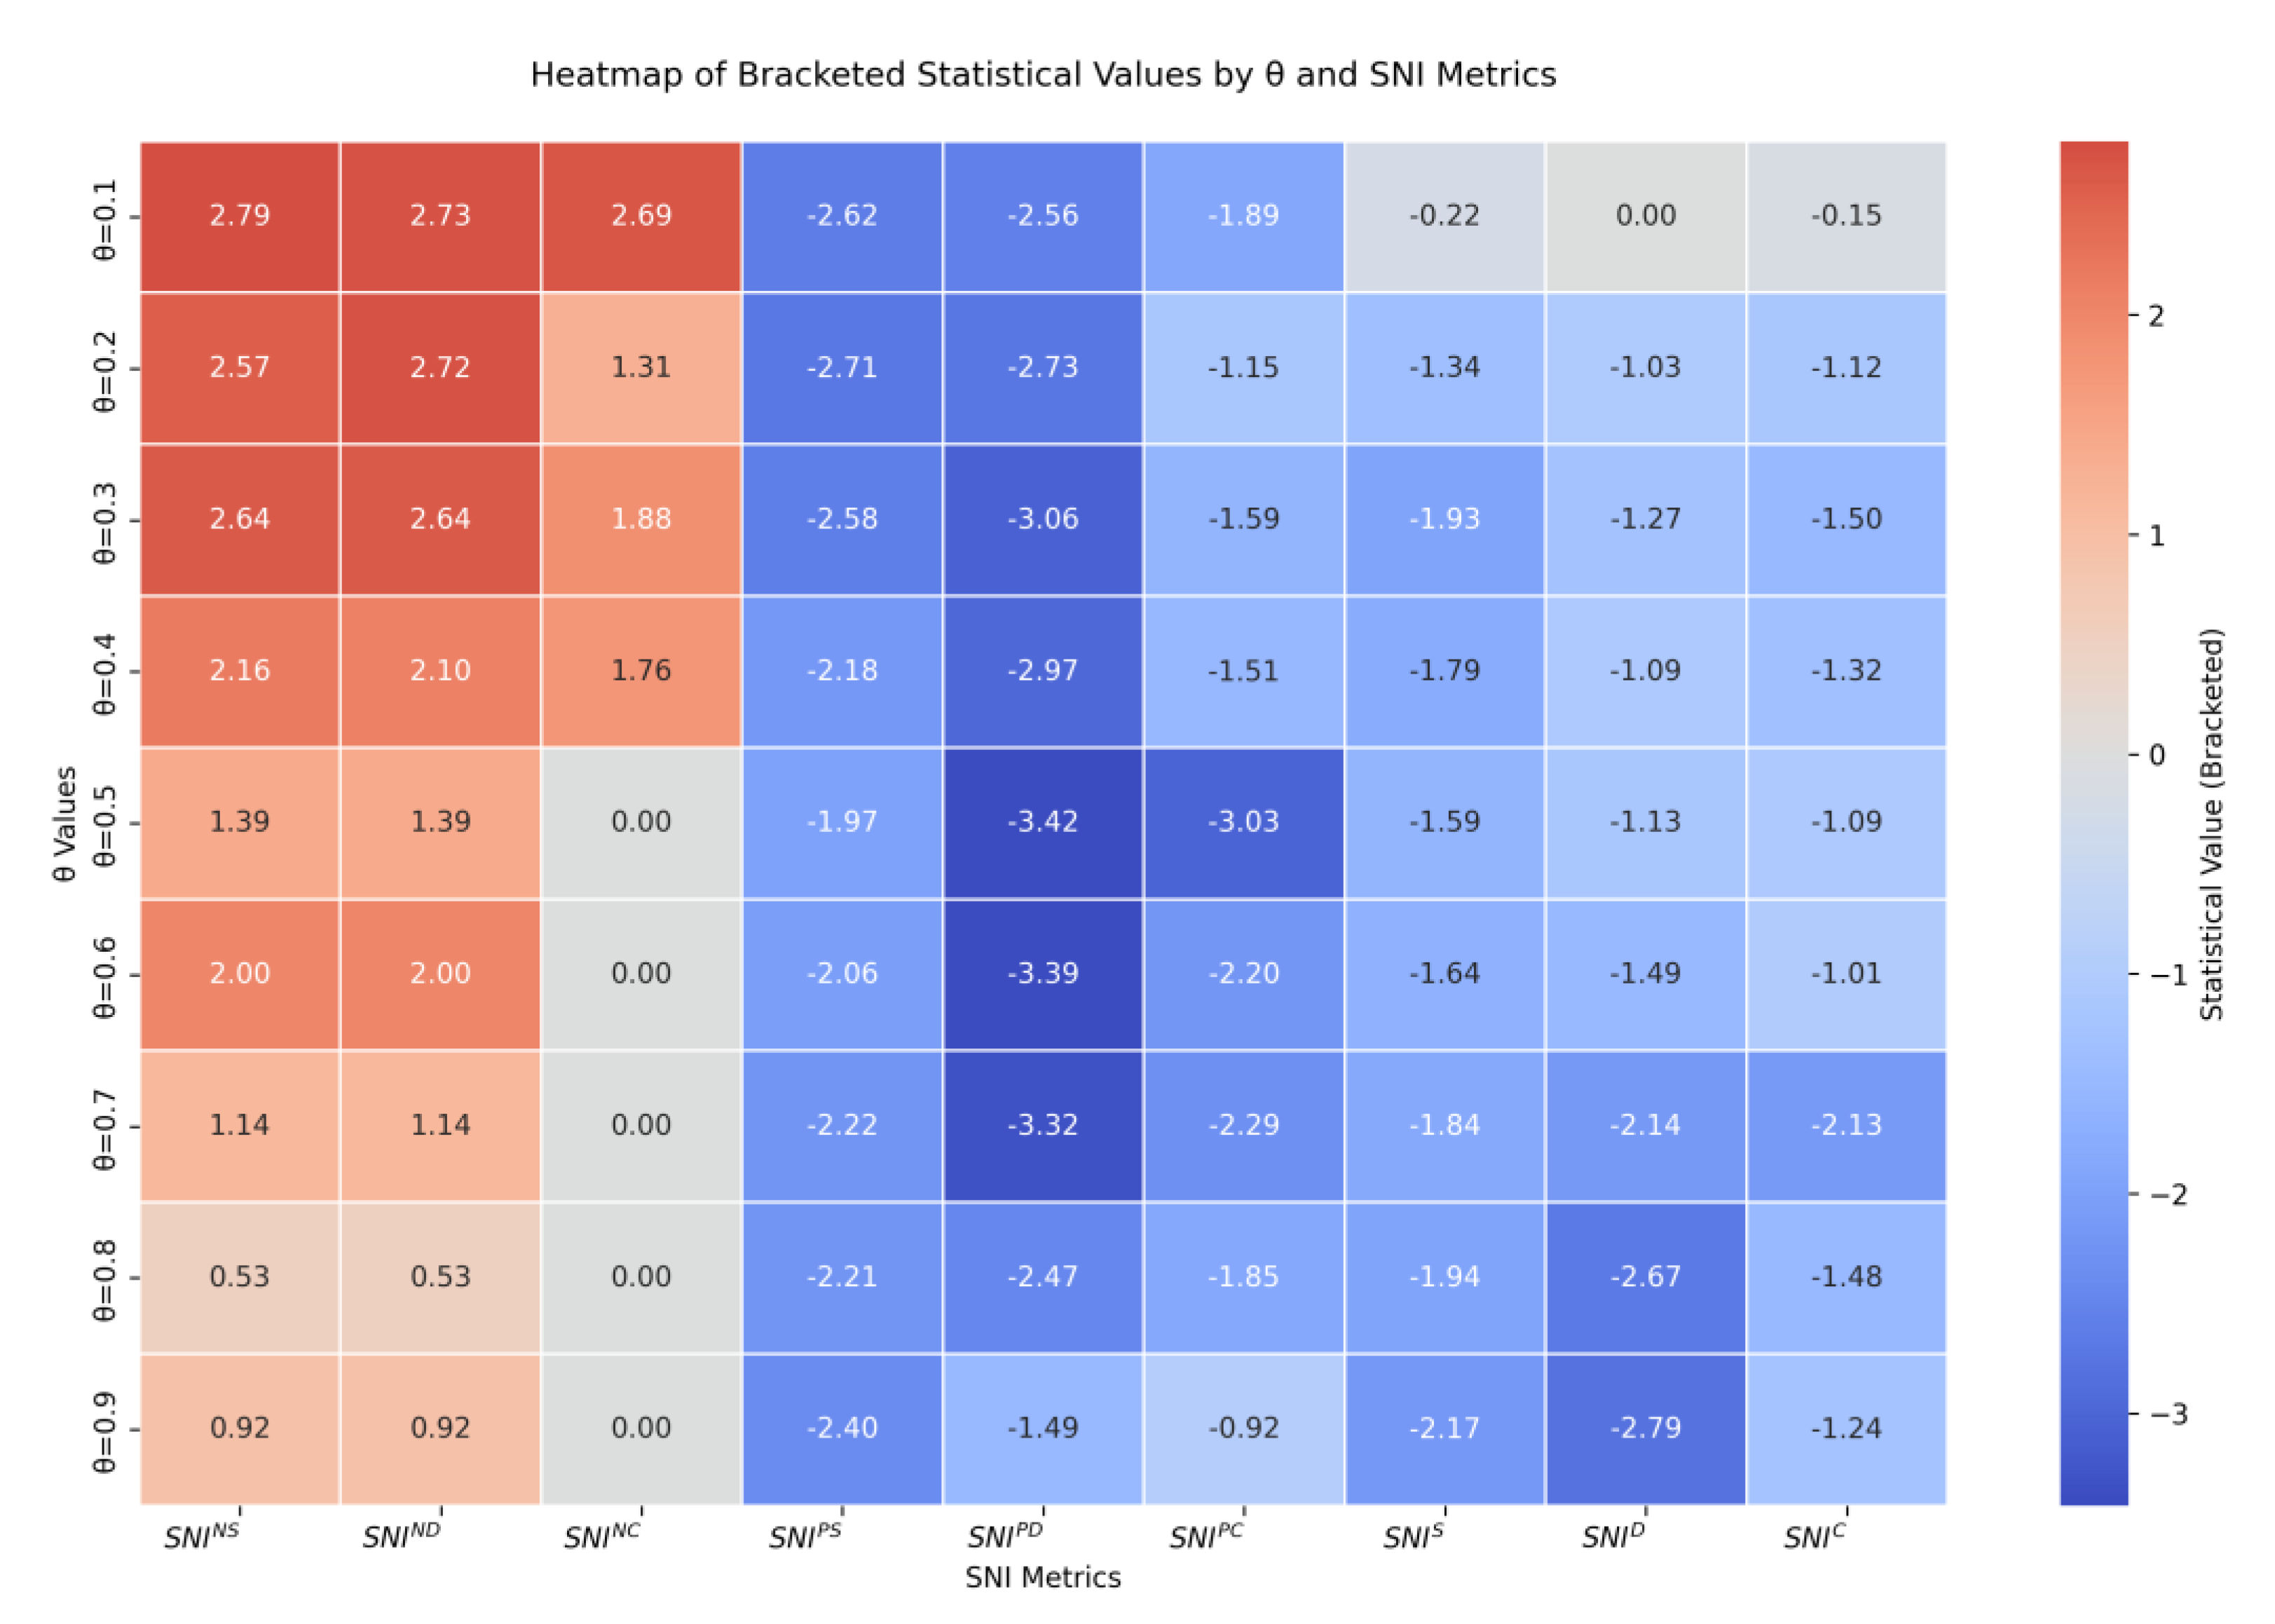
Table 6 (To present the key information in
Table 6 more intuitively, we have visualized the data and created a heatmap, as detailed in
Figure A1.), it is evident that the three categories of nine capacity correlation network characteristic indices exhibit significant explanatory power for shipping freight rates, though their performance is heavily influenced by threshold selection. The optimal thresholds differ across the three categories of capacity correlation network indices. For the first category of capacity correlation network indices, the explanatory power for freight rates is more pronounced within the threshold range of 0.1 to 0.5, with the optimal threshold identified at 0.1 based on empirical results. For the second category, the indices demonstrate stronger explanatory power within the threshold range of 0.5 to 0.8, achieving optimal empirical performance at a threshold of 0.5. For the third category, the indices show heightened explanatory power within the threshold range of 0.7 to 0.9, with the optimal threshold empirically determined as 0.7. Second, all three categories of capacity correlation network characteristic indices significantly influence shipping freight rates, but with distinct directional effects. The first category of indices exhibits a positive and statistically significant explanatory effect for freight rates. The second category of indices demonstrates a negative and statistically significant explanatory effect for freight rates.
The first category of capacity correlation network characteristic indices reflects the inverse relationship in capacity changes between routes and demonstrates a positive and statistically significant explanatory effect for shipping freight rates. This occurs because, when capacity decreases for certain routes while increasing for others, resource reallocation drives rate increases on specific routes, thereby exerting an overall positive impact on freight rates.
The second category of capacity correlation network characteristic indices captures the synchronized capacity changes across routes. When global trade demand fluctuates holistically, the simultaneous increase or decrease in capacity across all routes leads to collective freight rate volatility, driven by synchronized supply–demand dynamics. For instance, during periods of capacity oversupply or insufficient demand, this synchronization may amplify downward pressure on freight rates. Consequently, the second category of indices exhibits a negative and statistically significant explanatory effect for shipping freight rates, as positive correlation networks magnify adverse market fluctuations in pricing during supply–demand imbalances.
The third category of capacity correlation network characteristic indices integrates both positive and negative correlation effects, demonstrating a positive and statistically significant explanatory effect for shipping freight rates. These indices reflect the overall strength and complexity of the capacity correlation network, providing a more comprehensive perspective on freight rate formation mechanisms.
Finally, we investigate the mechanistic impact of micro-level capacity correlation network characteristics on shipping freight rates. The threshold selections for the three categories of capacity correlation network characteristic indices are as follows: 0.1 for the first category, 0.5 for the second category, and 0.7 for the third category. Building on Equation (9), Equation (10) further introduces control variables including supply-side factors (fleet size), demand-side factors (China’s export container trade volume), cost factors (fuel oil prices), total operating shipping capacity (OSC), and the Global Economic Surprise Index (GESI). The regression results for the capacity correlation network characteristic indices under Equation (10) are presented in
Table 7.
From
Table 7, it is evident that the capacity correlation network characteristic index
, constructed using the persistent homology method, retains a positive and statistically significant explanatory power for shipping freight rates. The first category of capacity correlation network indices continues to exhibit positive explanatory power for freight rates; however, the index
shows no statistically significant explanatory effect. The second and third categories of capacity correlation network indices still demonstrate negative explanatory effects on freight rates, though the third category lacks statistical significance. Notably, the first category of negative capacity correlation network indices incorporates richer information and exerts a more pronounced impact on freight rates compared to other categories. A critical limitation arises when selecting thresholds for both positive and negative correlation networks: threshold-based filtering inevitably leads to information loss. In contrast, the persistent homology-based correlation network avoids such information loss by inherently preserving the full spectrum of topological relationships.
The capacity correlation network characteristic index , constructed using the persistent homology method, reflects the persistence of structural features in the capacity correlation network. When the shipping market is subjected to risk shocks, abrupt changes in network structural features occur, leading to a decrease in the index and a corresponding decline in freight rates. Furthermore, even after controlling for variables such as supply (fleet size), demand (China’s export container trade volume), cost (fuel oil prices), operating shipping capacity (OSC), and the Global Economic Surprise Index (GESI), the capacity correlation network characteristic index retains significant explanatory power over freight rates. The experimental results demonstrate that the capacity correlation network characteristic index exerts a significant influence on freight rates, an effect that cannot be explained by traditional factors like supply, demand, or cost.
The impact of the index on freight rates is not only driven by changes in the supply of the shipping market but is also fundamentally shaped by the stability of market structures and the dynamic interactions of participant behaviors. When the value is high, shipping freight rates remain stable or elevated. The capacity correlation network exhibits a high degree of topological stability, characterized by long-term equilibrium in supply–demand relationships and the presence of redundant pathways. This stability manifests across multiple scales: for example, mature trade route networks (such as the Asia–Europe route) often form closed-loop structures. Additionally, the “behavioral stickiness” (path dependence) of market participants further reinforces network stability—carriers and shippers tend to maintain existing capacity allocations, and even when faced with short-term cost increases, such rational decision-making prevents disorderly adjustments to capacity. For instance, if the Asia–Europe route faces pressure due to rising fuel costs, carriers will still prioritize maintaining capacity on this route to avoid price collapses caused by cutthroat competition. Therefore, when is high, the risk resilience and resource allocation efficiency of the capacity correlation network support the stability of freight rates and may even cause rates to remain high due to flexible adjustments (such as emergency service premiums).
When the value is low, freight rates are prone to decline, indicating that the shipping market relies on a few critical routes, making the structure singular and fragile. For example, if the Red Sea route serves as the sole corridor for Asia–Europe trade, an interruption due to geopolitical conflict would force ships to detour via the Cape of Good Hope. While the distance and costs would increase significantly, the actual available capacity would sharply decrease due to detour-related losses (e.g., vessel shortages and time delays), leading to short-term supply–demand imbalances. A low capacity correlation network amplifies the destructive effects of irrational behavior—sudden events (such as policy changes or panic rerouting) may trigger disorderly decisions by market participants, further disrupting the network structure. For instance, during the 2021 Suez Canal blockage, some carriers hastily diverted to other routes, causing congestion on detour routes and stagnation on original routes, leading to a collapse in freight rates due to short-term supply–demand disruptions. Moreover, the single-path nature of a low capacity correlation network concentrates risk transmission, causing localized shocks (such as the paralysis of a hub port) to rapidly escalate into systemic crises. Therefore, the fragility and behavioral disorder of a low capacity correlation network jointly contribute to declines in freight rates due to capacity losses, resource mismatches, or panic selling.


