1. Introduction
With breakthroughs in artificial intelligence and the rise of the second digital wave, industrial robots have been given new definitions and functions, inspiring a new wave of academic research. Much research shows that robots have significant impacts on productivity, employment, international trade, environmental protection, etc. [
1,
2,
3,
4]. Some are supported by several empirical studies [
5,
6]. Industrial robots offer solutions to some global challenges, in the context of global energy constraints and an ageing population, helping industries and enterprises realize green transformation [
7,
8,
9,
10]. It also has a significant positive effect on the probability of exports, export sales, and the export market share [
11]. Regardless, the development of industrial robots has become an irreversible trend, and both developed and developing countries need to respond cautiously to the opportunities and challenges that industrial robots present.
Is there a Cambrian explosion happening in industrial robotics?
1 According to the International Federation of Robotics (IFR) Industrial Robotics Report 2024, the global operational stock of industrial robots exceeded 4 million units in 2023, an increase of more than 10% compared with the previous year. China’s industrial robot stock has reached 1.76 million units, accounting for approximately 41% of the global industrial robot stock. Since 2018, the growth rate of China’s industrial robot stock has averaged 22%.
2 China’s rapid growth largely depends on policy support [
12]. In 2016, the Chinese government issued its first Robotics Industry Development Plan (2016–2020) and a second stage in 2021. The South Korean government has also given strong support to the development of the robot industry, listing intelligent robots as the nine major engines of development in the 2006 IT–839 strategy.
3 However, our follow-up research reveals that China is not a primary exporter of industrial robots. Recently, the development of robot-related industries in China has been remarkable. The emergence of companies such as Estun, SIASUN Robot, and Topstar shows that China’s export ability is on the rise.
National competitive advantage posits that intense domestic competition and a demanding local market can enhance national competitiveness [
13]. Such competition drives firms to innovate and operate efficiently, while a sophisticated local market encourages the development of products better suited for international competition. Exploring whether industrial development can enhance China’s international market competitiveness is one of this paper’s objectives.
Complex network analysis is now mature and applied in fields like biology and physics [
14]. It involves creating a dynamic network of nodes and edges, and analyzing its structure, properties, and dynamics. In economics, Håkansson and Snehota first used network analysis to examine firm relationships in a global business context [
15]. Rose later explored how corporate networks drive value creation [
16]. Serrano and Boguñá conducted the first empirical study of the global trade network [
17], and Garlaschelli and Loffredo proposed a methodology for constructing a directed weighted trade network, providing a new direction for subsequent research [
18]. Recently, scholars have combined global trade networks with industries such as natural gas, cobalt, nickel, and soybeans, exploring aspects like industry resilience, evolutionary mechanisms, trade patterns, and trade competitiveness [
19,
20,
21]. The significance of employing network analysis in trade is attributed to the fact that participating in trade networks entails inherent risks that coexist with potential economic advantages [
22,
23]. This dichotomy arises due to the potential for trade networks either to amplify the propagation of exogenous economic shocks or, conversely, to foster a stable commercial environment [
24].
However, research on the use of complex network theory to analyze the global trade in industrial robots is still limited. Li et al. systematically described the evolution of GIRTN in terms of overall density, degree centrality, and “core–edge” structure based on trade data from 1998 to 2017 [
25]. Li et al. further focused their study on 66 countries along China’s Belt and Road and analyzed the structural characteristics and influencing factors of the Belt and Road industrial robot trade network [
26]. The study showed that the trade network has a significant core–edge structure, with a few countries, such as China and Turkey, occupying the core position, while technical distance, economic distance, and geographical distance are the main factors affecting the evolution of the network. These provide theoretical support and a practical foundation for this paper, but the analysis of the GIRTN is still not sufficiently thorough, remaining at the levels of basic analysis and regional analysis. Additionally, existing articles do not use the latest industrial robot trade data, and the latest trade network changes cannot be described. These gaps raise new research questions that remain to be clarified: Has the GIRTN given rise to new patterns in trade? Which nations presently possess export profiles that are akin to one another? Is China positioned as a front-runner within the GIRTN? What are the competitive edges that China holds in the global industrial robot market?
2. Data Sources and Research Methodology
2.1. Data Sources
In this work, we obtained industrial robot country export data from 2000 to 2023 from the International Trade Research and Decision Support System of DRCNET.
4 These data represent the trade relationships between countries, and we use the export value between countries as the trade weight between countries. In this work, we refer to Acemoglu and Restrepo’s definition of industrial robots and the International Federation of Robotics (IFR)’s method of filtering industrial robotics data when producing industry reports [
27], and we limit the study to multifunctional robots, other multifunctional robots, and robotic end-of-arm manipulation devices (HS847950). To simplify the network structure and reduce the number of computations, we remove relatively unimportant weights and nodes in the trade network, an approach that was also applied by Jiang et al. [
28]. By screening the countries with total exports below 0.001%, this paper retains 77 countries, which account for more than 99.99% of total exports, which is sufficient to show the current status and pattern of the global trade in industrial robots. Notably, trade data for the Hong Kong Special Administrative Region and Macao Special Administrative Region exist separately in regional form and are included in the analysis, which helps to show China’s position in the GIRTN more objectively.
2.2. Research Methods
2.2.1. Complex Network Theory
This paper focuses on the analysis of global trade in industrial robots using complex network theory. Complex network theory is a mathematical tool used to study the interactions and connections between complex systems. The global industrial robot trade is constructed as a weighted trade network
containing nodes
and edges, where
represents the year. Nodes and weighted edges represent countries and export values, respectively. The network metrics in
Table 1 demonstrate certain trade characteristics, such as the degree, clustering coefficient, and average shortest path. The network analysis is broken down into three parts: trade spatio-temporal flow analysis, network topology analysis, and network community analysis. Through the spatiotemporal dynamic analysis, we can address the following questions: Has the GIRTN given rise to new patterns in trade? Which nations presently possess export profiles that are akin to one another?
2.2.2. Description of China’s Trade Competitiveness Indicators
This section examines China’s competitiveness and position in the global industrial robotics market using four indicators in
Table 2, namely, the reciprocity index, the export industry concentration index, the HHI, and the betweenness centrality degree, which are used to examine a country’s trade symmetry, export competitiveness, export diversification, and intermediary control ability, respectively. Through the analysis of trade competitiveness indicators, we can answer the following questions: Is China positioned as a front-runner within the GIRTN? What is the competitiveness that China holds in the global industrial robot market?
3. Overview of Global Industrial Robot Exports
3.1. Change in the Total Trade Volume
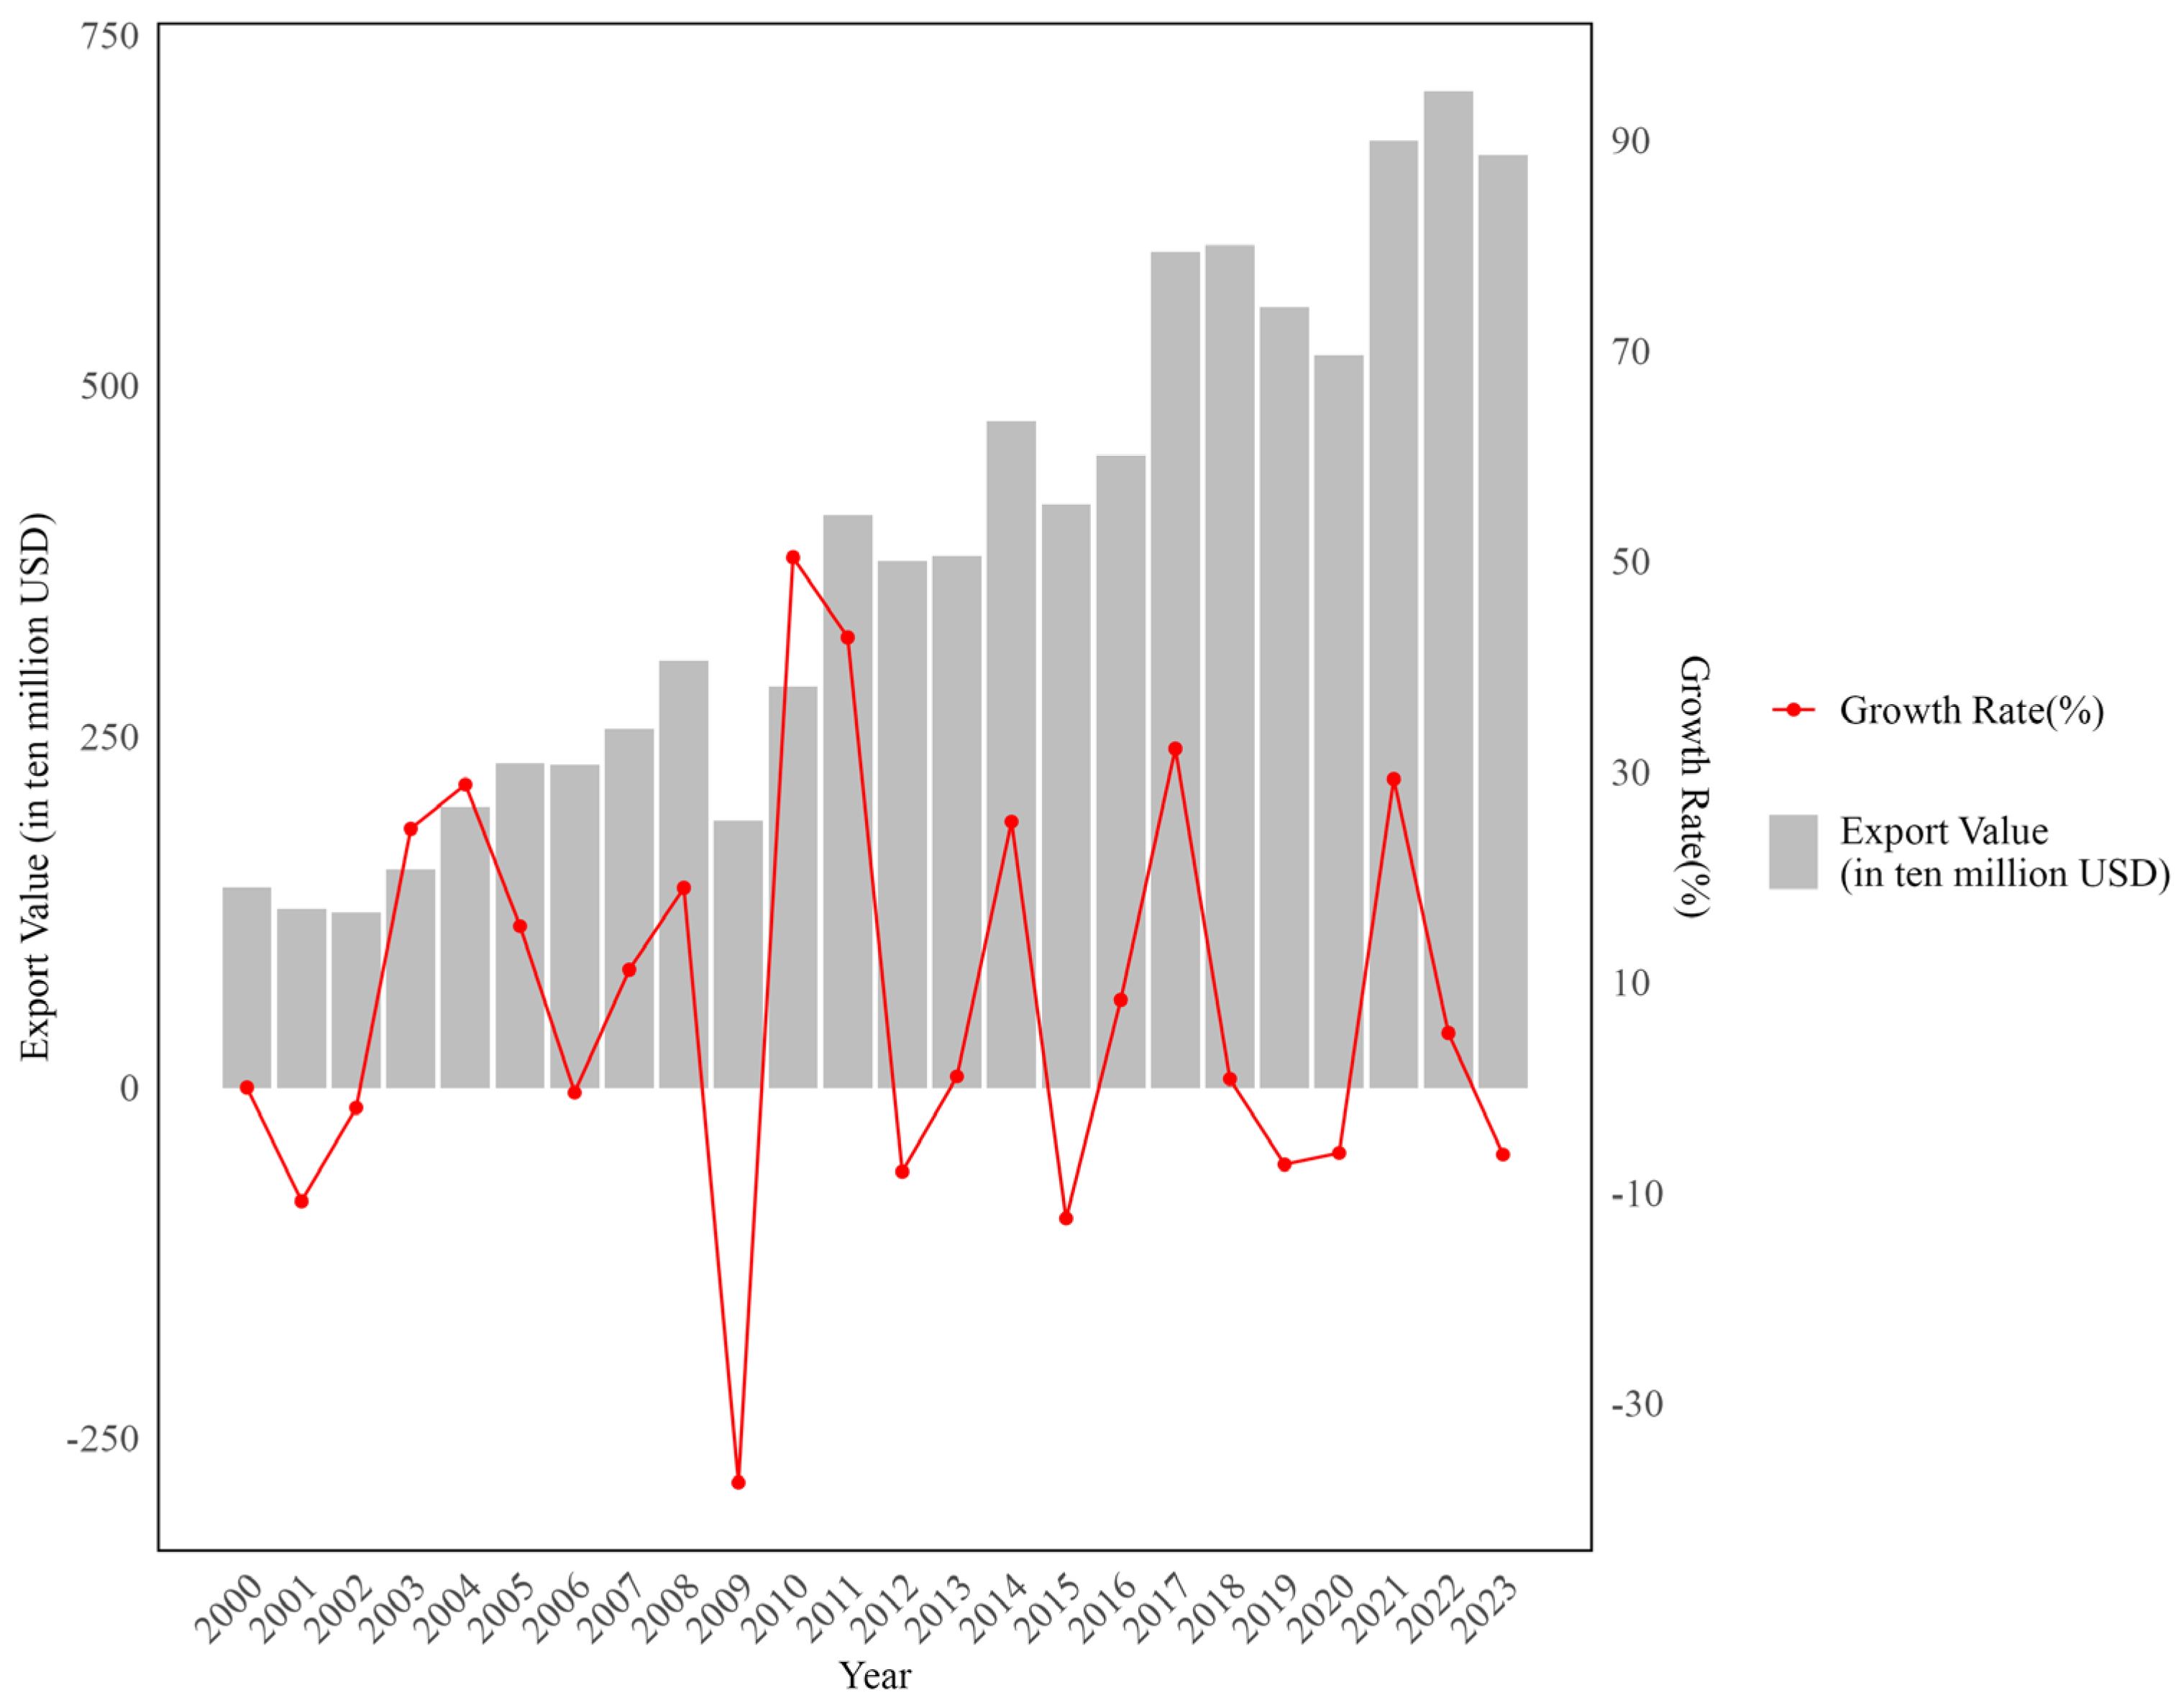
From 2000 to 2023, the total global exports of industrial robots showed a fluctuating growth trend from USD 1.4 billion to USD 6.6 billion, as illustrated in
Figure 1. This finding shows the expanding global market for industrial robots as well as a significant increase in the global demand for industrial robots. Despite the overall trend of growth, in some years, there were sharp declines in total exports. The most significant drop occurred in 2009, when exports totaled just USD 1.8 billion, a 40 percent decrease from 2008’s total. This large fluctuation was largely due to the impact of the global financial crisis in 2008, which led to a significant drop in demand and trade in industrial robots. Another period of significant decrease in total exports occurred from 2018 to 2020, mainly due to the outbreak of the COVID-19 pandemic, during which the global economy suffered a major shock and the import and export business of many economies halted, which in turn affected the global trade in industrial robots.
3.2. Ranking of the Top Ten Countries in Terms of Total Exports and Changes in the Total Amount
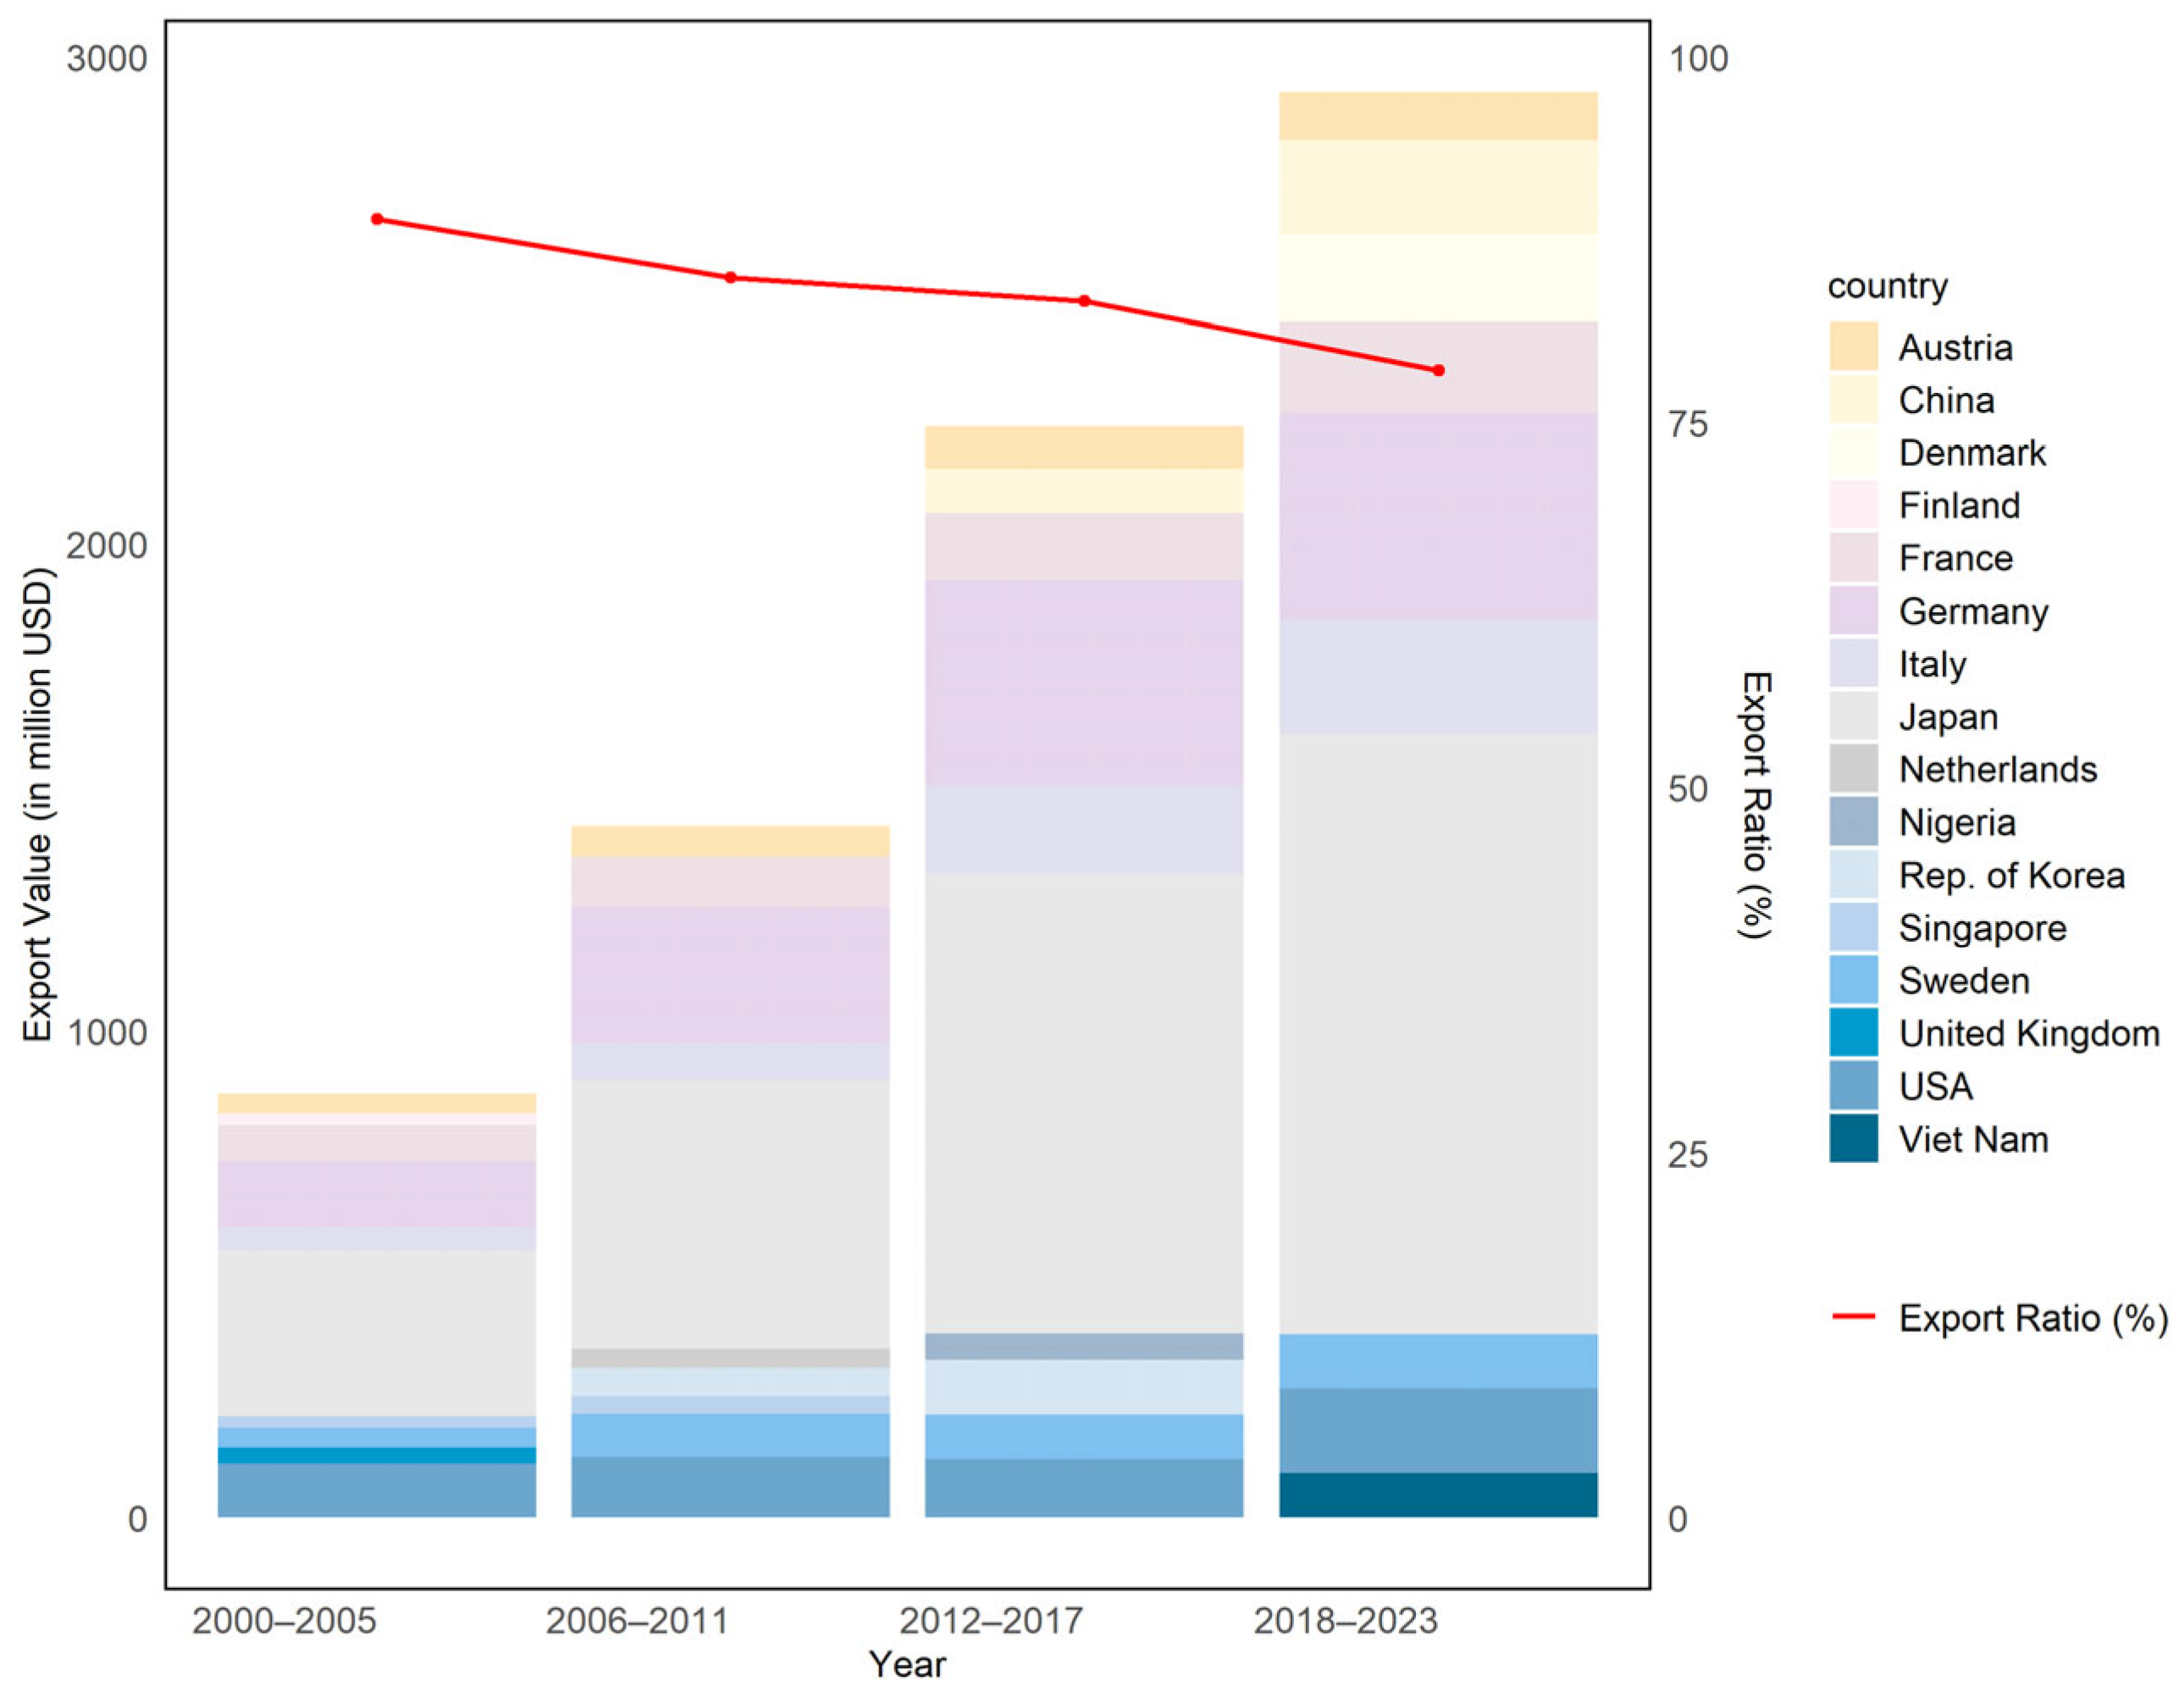
Figure 2 summarizes the trends in the global industrial robot export trade. First, in the four stages, Japan, Germany, France, Italy, Sweden, and Austria are located in the top ten, and the export amount is increasing annually. These countries are traditionally developed industrial countries, which shows that a good industrial base and level of economic development have important impacts on the development of a country’s industrial robotics industry. As another finding, China, Vietnam, South Korea, and other countries enter the top ten in the subsequent stage. This finding shows that in some emerging economies, the importance of the global industrial robot market is gradually increasing, developed countries are no longer monopolizing the industrial robot market, and Asia is gradually becoming an important region for global industrial robot exports.
In addition, the global industrial robot trade has an imbalance, as shown in
Table 3 and
Table 4. A total of 13% of countries account for more than 80% of the global industrial robot market share, indicating that some countries are in a dominant position in the market, which is consistent with the judgement of Wang et al. on the layout of emerging industries [
29]. However, the total export share of these countries is decreasing, from 88.9% to 78.6%. This finding indicates that the global industrial robot market is experiencing a trend of decentralization and that the imbalanced market status quo has been alleviated. Nevertheless, exports of industrial robots are still concentrated in individual countries, such as Japan, Germany, and Italy, and the export share of these countries has exceeded 50% of the global market. Therefore, it is still difficult for emerging countries to seize market share in terms of industrial robots.
4. Spatial and Temporal Flow Analysis of the GIRTN
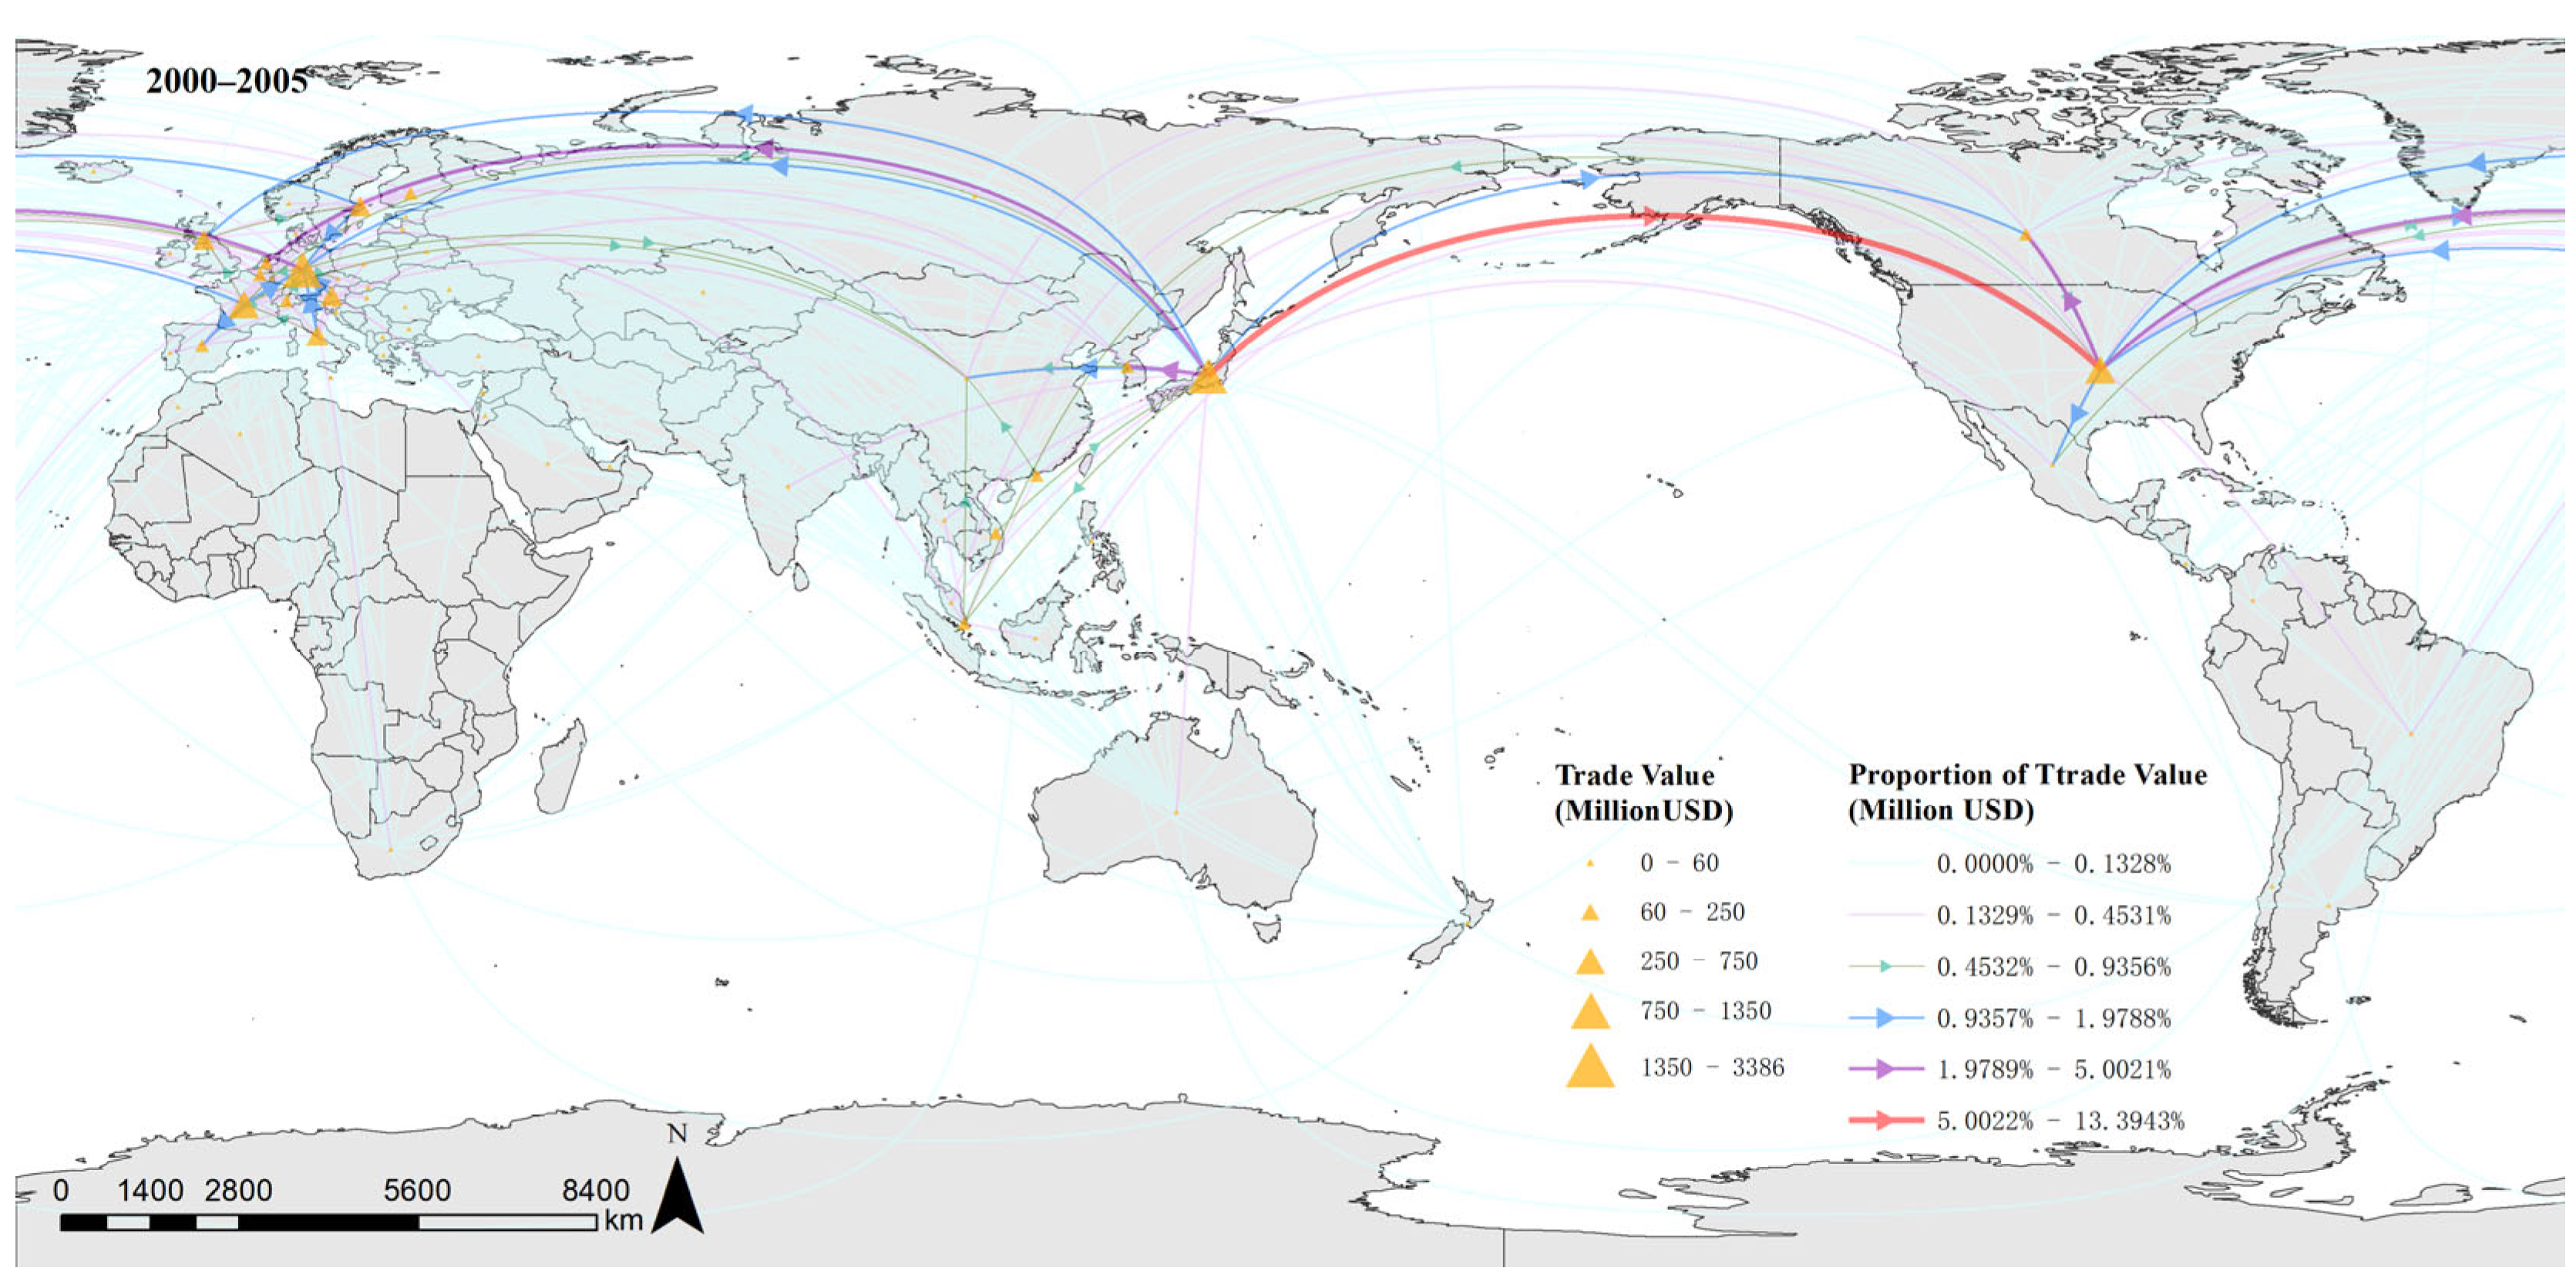
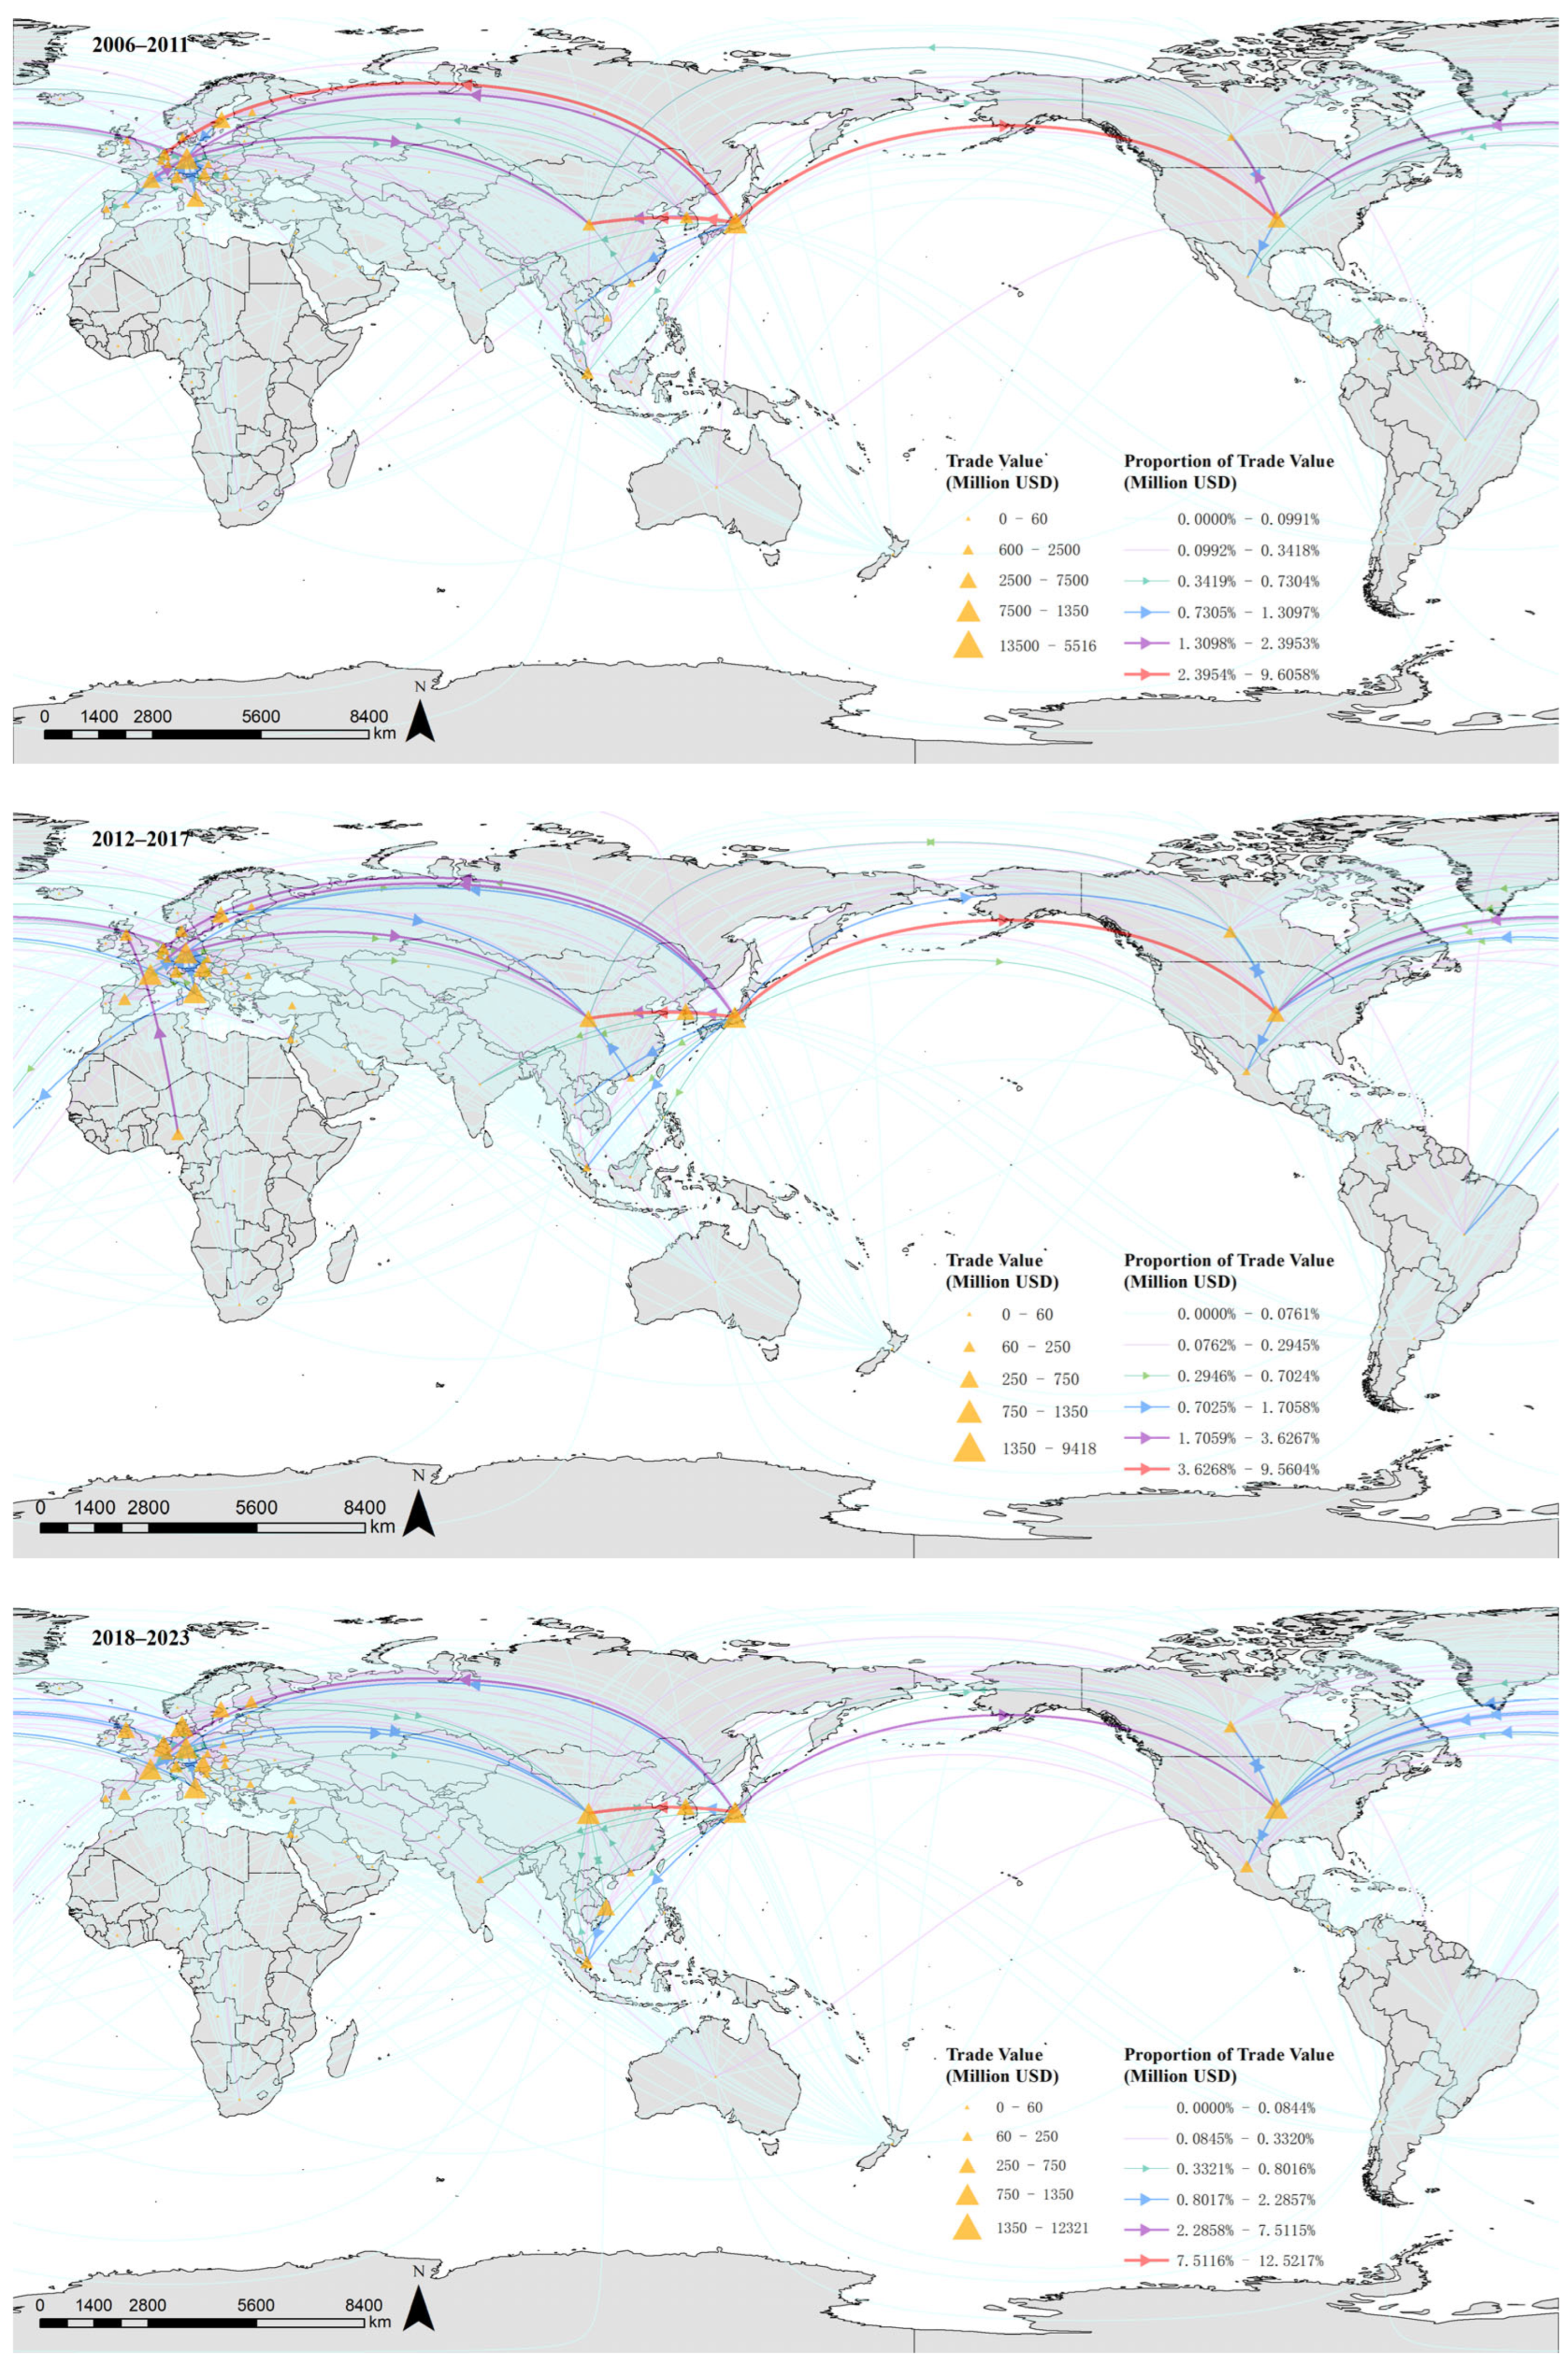
In this study, the natural breakpoint method is used to grade the export value shares of GIRTN countries at each stage to eliminate the interference of exchange rate fluctuations in the comparability of cross-country trade values.
Figure 3 shows that the overall trade linkage of the GIRTN continues to strengthen and that the total export value increases steadily, but the number of lines with large export trade shares decreases. The number of lines with medium-sized and small export trade shares increases significantly. This phenomenon confirms the gradual modulation of the global industrial robot trade imbalance. Notably, the rise of Asian countries (such as China, South Korea, Singapore, India, and Vietnam) is gradually breaking the traditional “three-polar pattern” consisting of Western Europe, East Asia, and North America, further promoting the development of trade networks in the direction of equalization.
From the regional distribution perspective, European countries accounted for more than 50% of the top 10 countries in export value. Japan has an absolute advantage in global industrial robot exports, with its single-country export value share reaching 34.4%, 32.96%, 34.98%, and 33.1% in the four stages. According to the line flow chart, Japan’s main export market has significantly shifted: in the first two stages, the United States accounted for the absolute largest proportion of Japan’s total exports (36.33% and 27.55%, respectively). However, in the third stage, exports to the USA declined to 26.99%, while the proportion of exports to China increased to 26.34%, and the two tended to be balanced. In the fourth stage, China accounted for a 36.3% share, surpassing the United States to become Japan’s largest export market. In addition, intra-regional inter-country trade activity is significantly greater in Asia and Europe than in other regions, which may be closely related to factors such as geographic proximity, institutional convergence, and cultural similarity [
24,
30].
From the network reciprocity perspective, an increase in the number of two-way trade relationships indicates a significant increase in network reciprocity, which enhances both the overall stability of the trade network and its resilience to external shocks [
31]. Notably, large two-way trade relationships were first formed between developed countries, particularly within Europe (e.g., Germany–France, Germany–Italy) and in transatlantic trade (e.g., USA–Japan, USA–Germany). In addition to the level of economic development, geographic proximity contributes significantly to the formation of high-value, two-way trade relationships, such as the trade links between the USA and Canada, between Germany and Italy, and between China and South Korea. This spatial agglomeration effect may stem from similar types of economic development, regional organization, trade cost advantages, and positive externalities from technology spillovers [
32,
33,
34]. In contrast, Africa (except Antarctica) has the lowest trade linkage intensity in the GIRTN, which is highly correlated with its level of industrial development, and the region lacks both core technology R&D capabilities and large-scale demand for industrial robots.
The GIRTN is undergoing a structural shift from centralization to decentralization and from homogeneity to diversification. With the deep participation of emerging economies (e.g., China, Vietnam, India), the market monopoly of traditional industrial powers has gradually broken, and the activity of the global market has increased significantly. This structural change has provided an important opportunity for late-developing countries to catch up in terms of technology.
5. The GIRTN Topology Analysis
5.1. Overall Network Structure Characteristics
This section measures the overall network structure characteristics of the GIRTN through UCINET. The number of edges (
Table 5) in the GIRTN in the four stages increases significantly, which implies an increase in industrial robot trade activities globally. Network density also shows an upward trend, which is coordinated with the increase in the number of edges, indicating that the trade links in the network are closer. However, the value of network density is small since exports of industrial robots are concentrated mainly in some economically developed countries. Many developing countries rely mainly on imports because the industrial robot industry is not perfect, and industry development is limited. Therefore, most of them have one-way trade relationships. The average degree increases from 16.961 to 30.909, which reflects the increase in the average number of connections of the countries in the GIRTN, proving that the trade network is more interconnected and that the average participation of countries is increasing.
The average path length (
Figure 4) increased from 1.225 to 1.409, which is not a large increase but nevertheless indicates that as the size of the network increases, an increasing number of marginalized countries join the trade network. This finding reflects the fact that an increasing number of countries are joining the queue of industrial robot applications. Nonetheless, this growth is relatively slow compared with the expansion of network size, suggesting that the propagation efficiency of the network is still high, in line with the shorter average path lengths in
Figure 4 that characterize “small-world” networks [
35].
The average clustering coefficient increases from 0.611 to 0.655, suggesting an increase in the number of countries trading in the same trade group or community and stronger local ties in the network. This finding can also be seen in the flow diagram of the GIRTN, which shows closer trade links between neighbouring countries, as exemplified by Southeast Asian countries. This localized connectivity is another important feature of “small-world” networks. Stronger local connections increase the robustness of the network, and the GIRTN is more resilient to shocks.
The GIRTN also has weak reciprocity, as shown in
Figure 5. Two-way trade relationships in the GIRTN increase from 31.52% to 46.22%, which increases the stability of the GIRTN because, after a shock, countries will eventually return to their previous level of cooperation based on reciprocity. Additionally, more reciprocity will increase the resilience of the GIRTN [
31,
36].
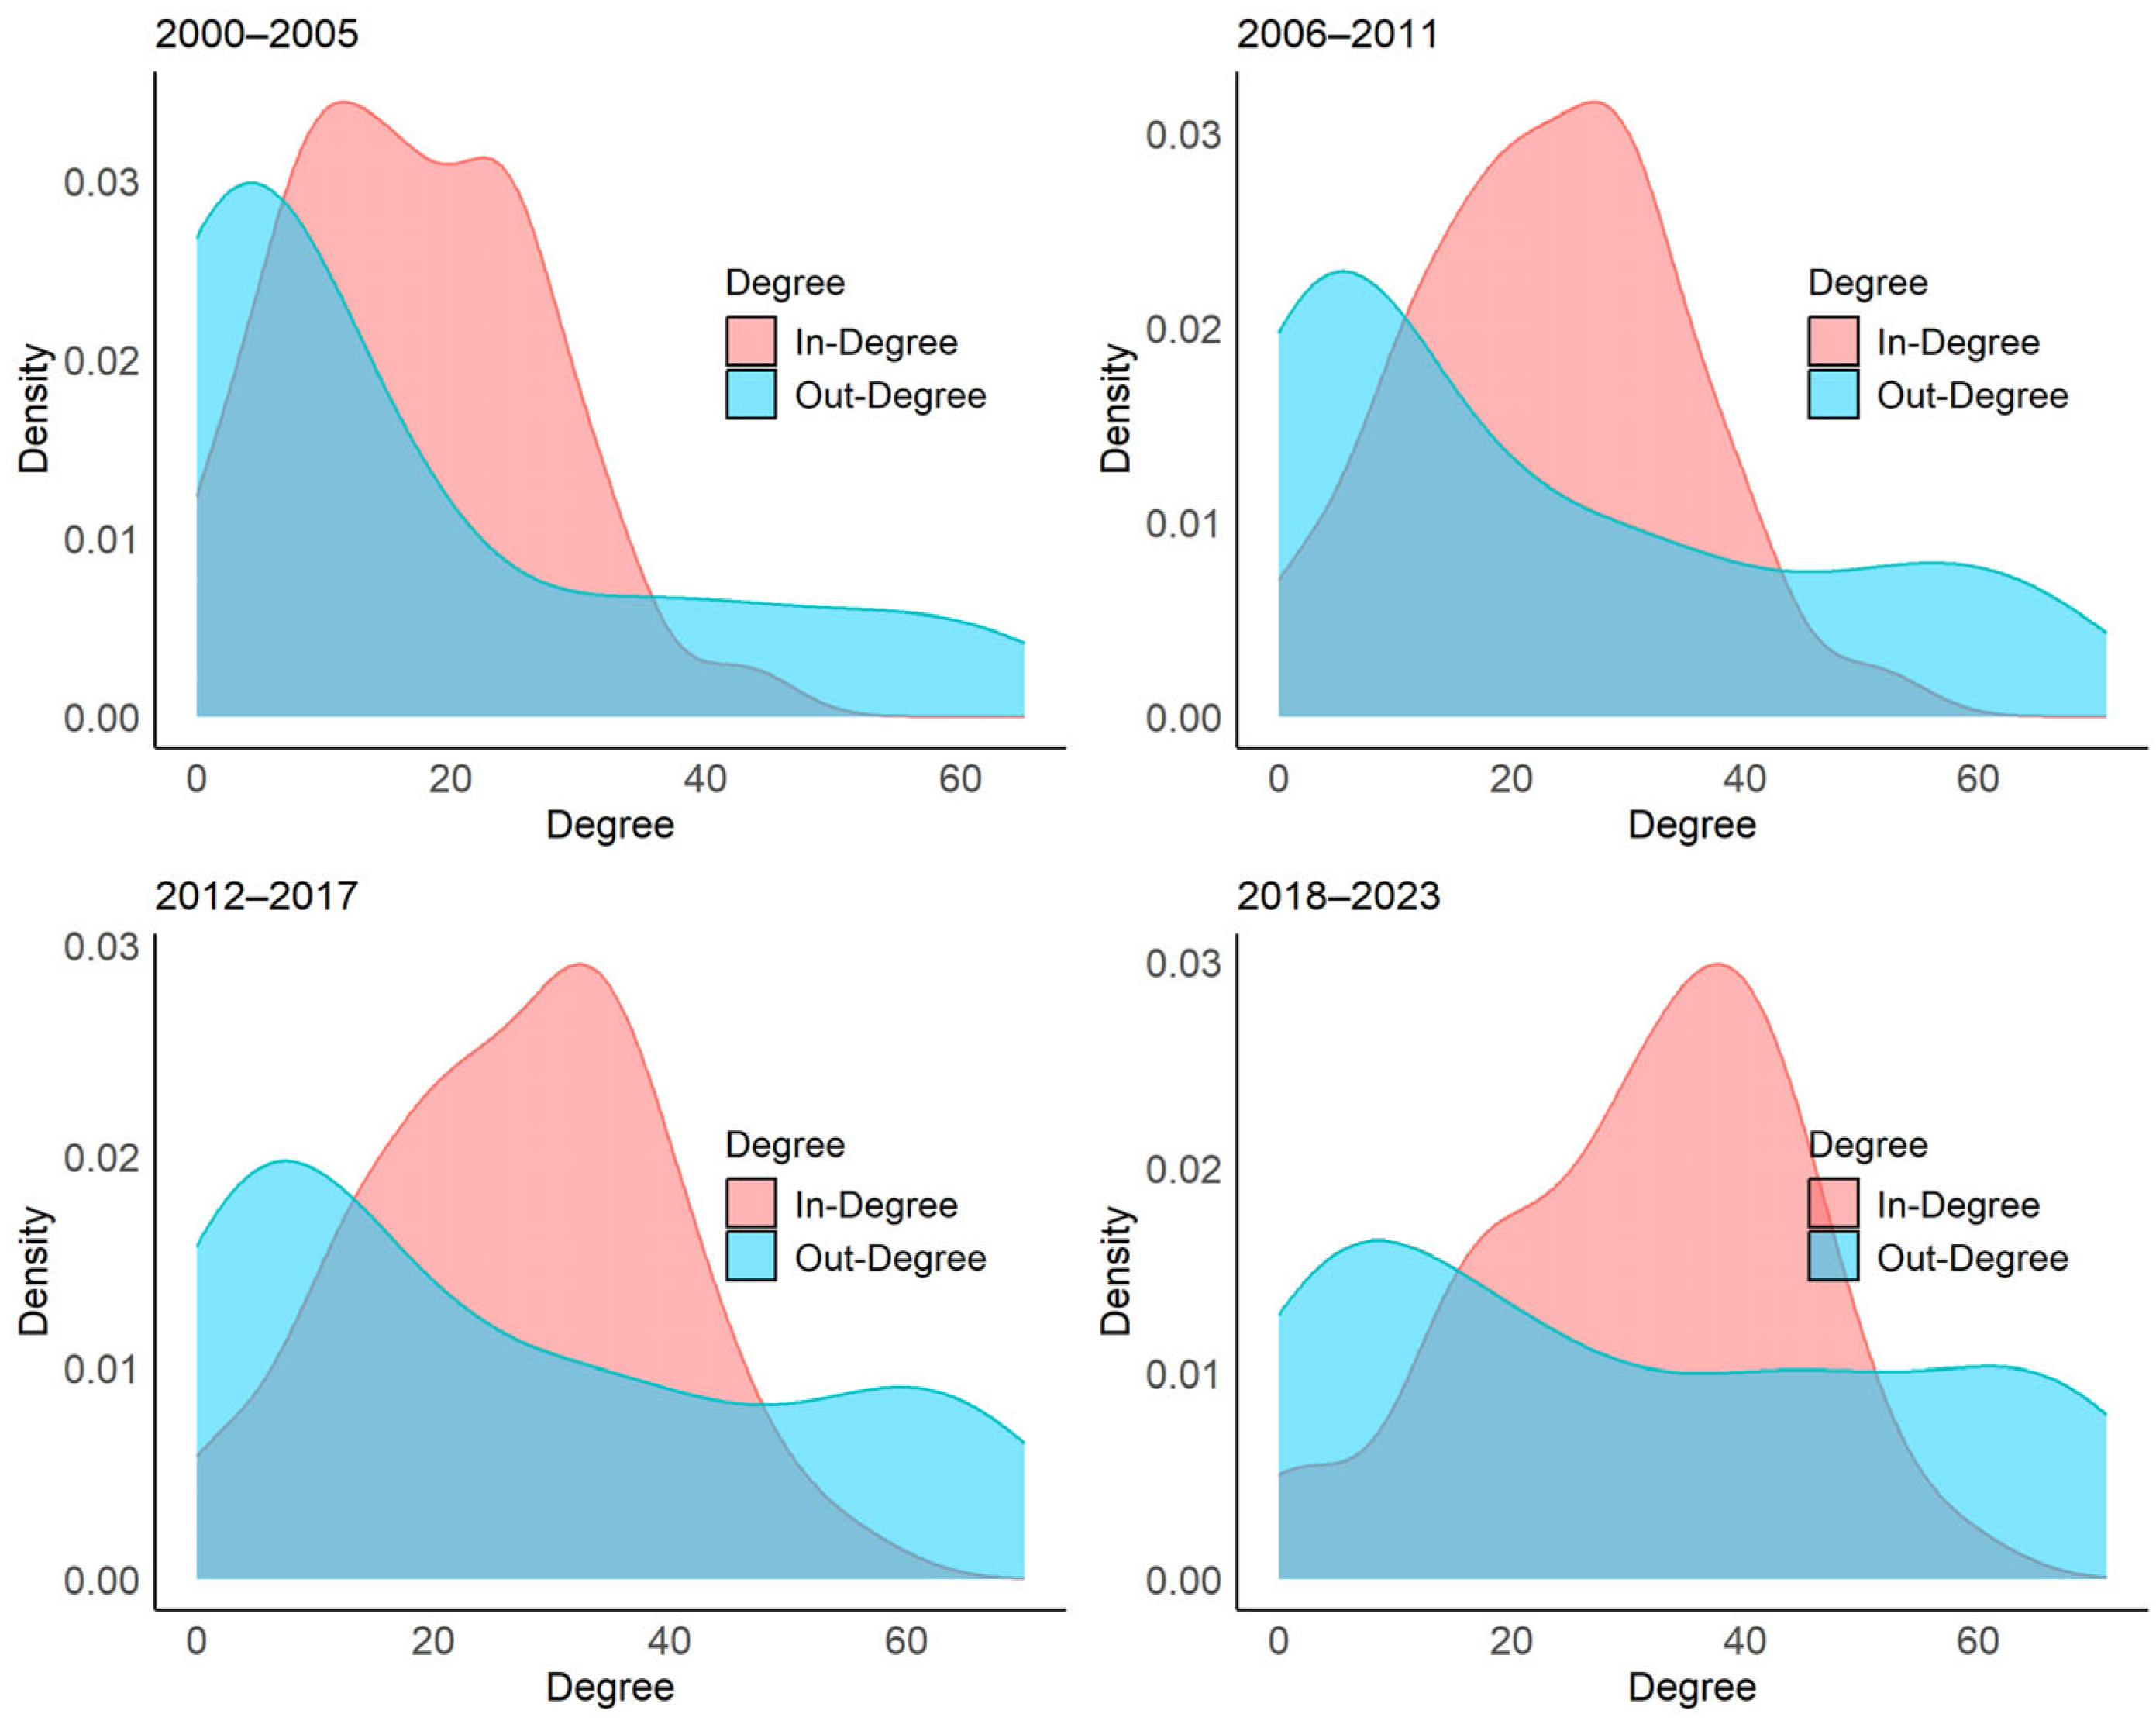
The density plots (
Figure 5) of the out-degree and in-degree show a clear evolutionary difference between the in-degree and out-degree curves. The peak of the in-degree curve is clearly to the right of the peak of the out-degree curve, which is more in line with a normal distribution, and the peak of the in-degree curve increases from 10 to more than 30 and tends to move continuously to the right. The data show that most countries started with approximately 20 sources of imports, and in the last period, most countries increased to approximately 40 sources of imports. This finding suggests that the choice of imported industrial robots has expanded and become more diverse over time. The peaks of the out-degree curve have not changed significantly, but the density of the peaks has decreased, and the fluctuations of the curve have become smoother, indicating that an increasing number of countries are showing a higher export status. Combined with the in-degree curve, it can be judged that a small number of nodes tend to export, and most nodes tend to import. Compared with the analysis of Liu et al. on the global coal trade network, owing to the difference in the method of data cleaning in the early stage, the power law distribution characteristics of the density plot of the out-degree and in-degree are not significant [
37]. However, it is still possible to observe that the number of nodes with a high out-degree is small and that the number of nodes with a low out-degree is large.
5.2. Network Node Characterization
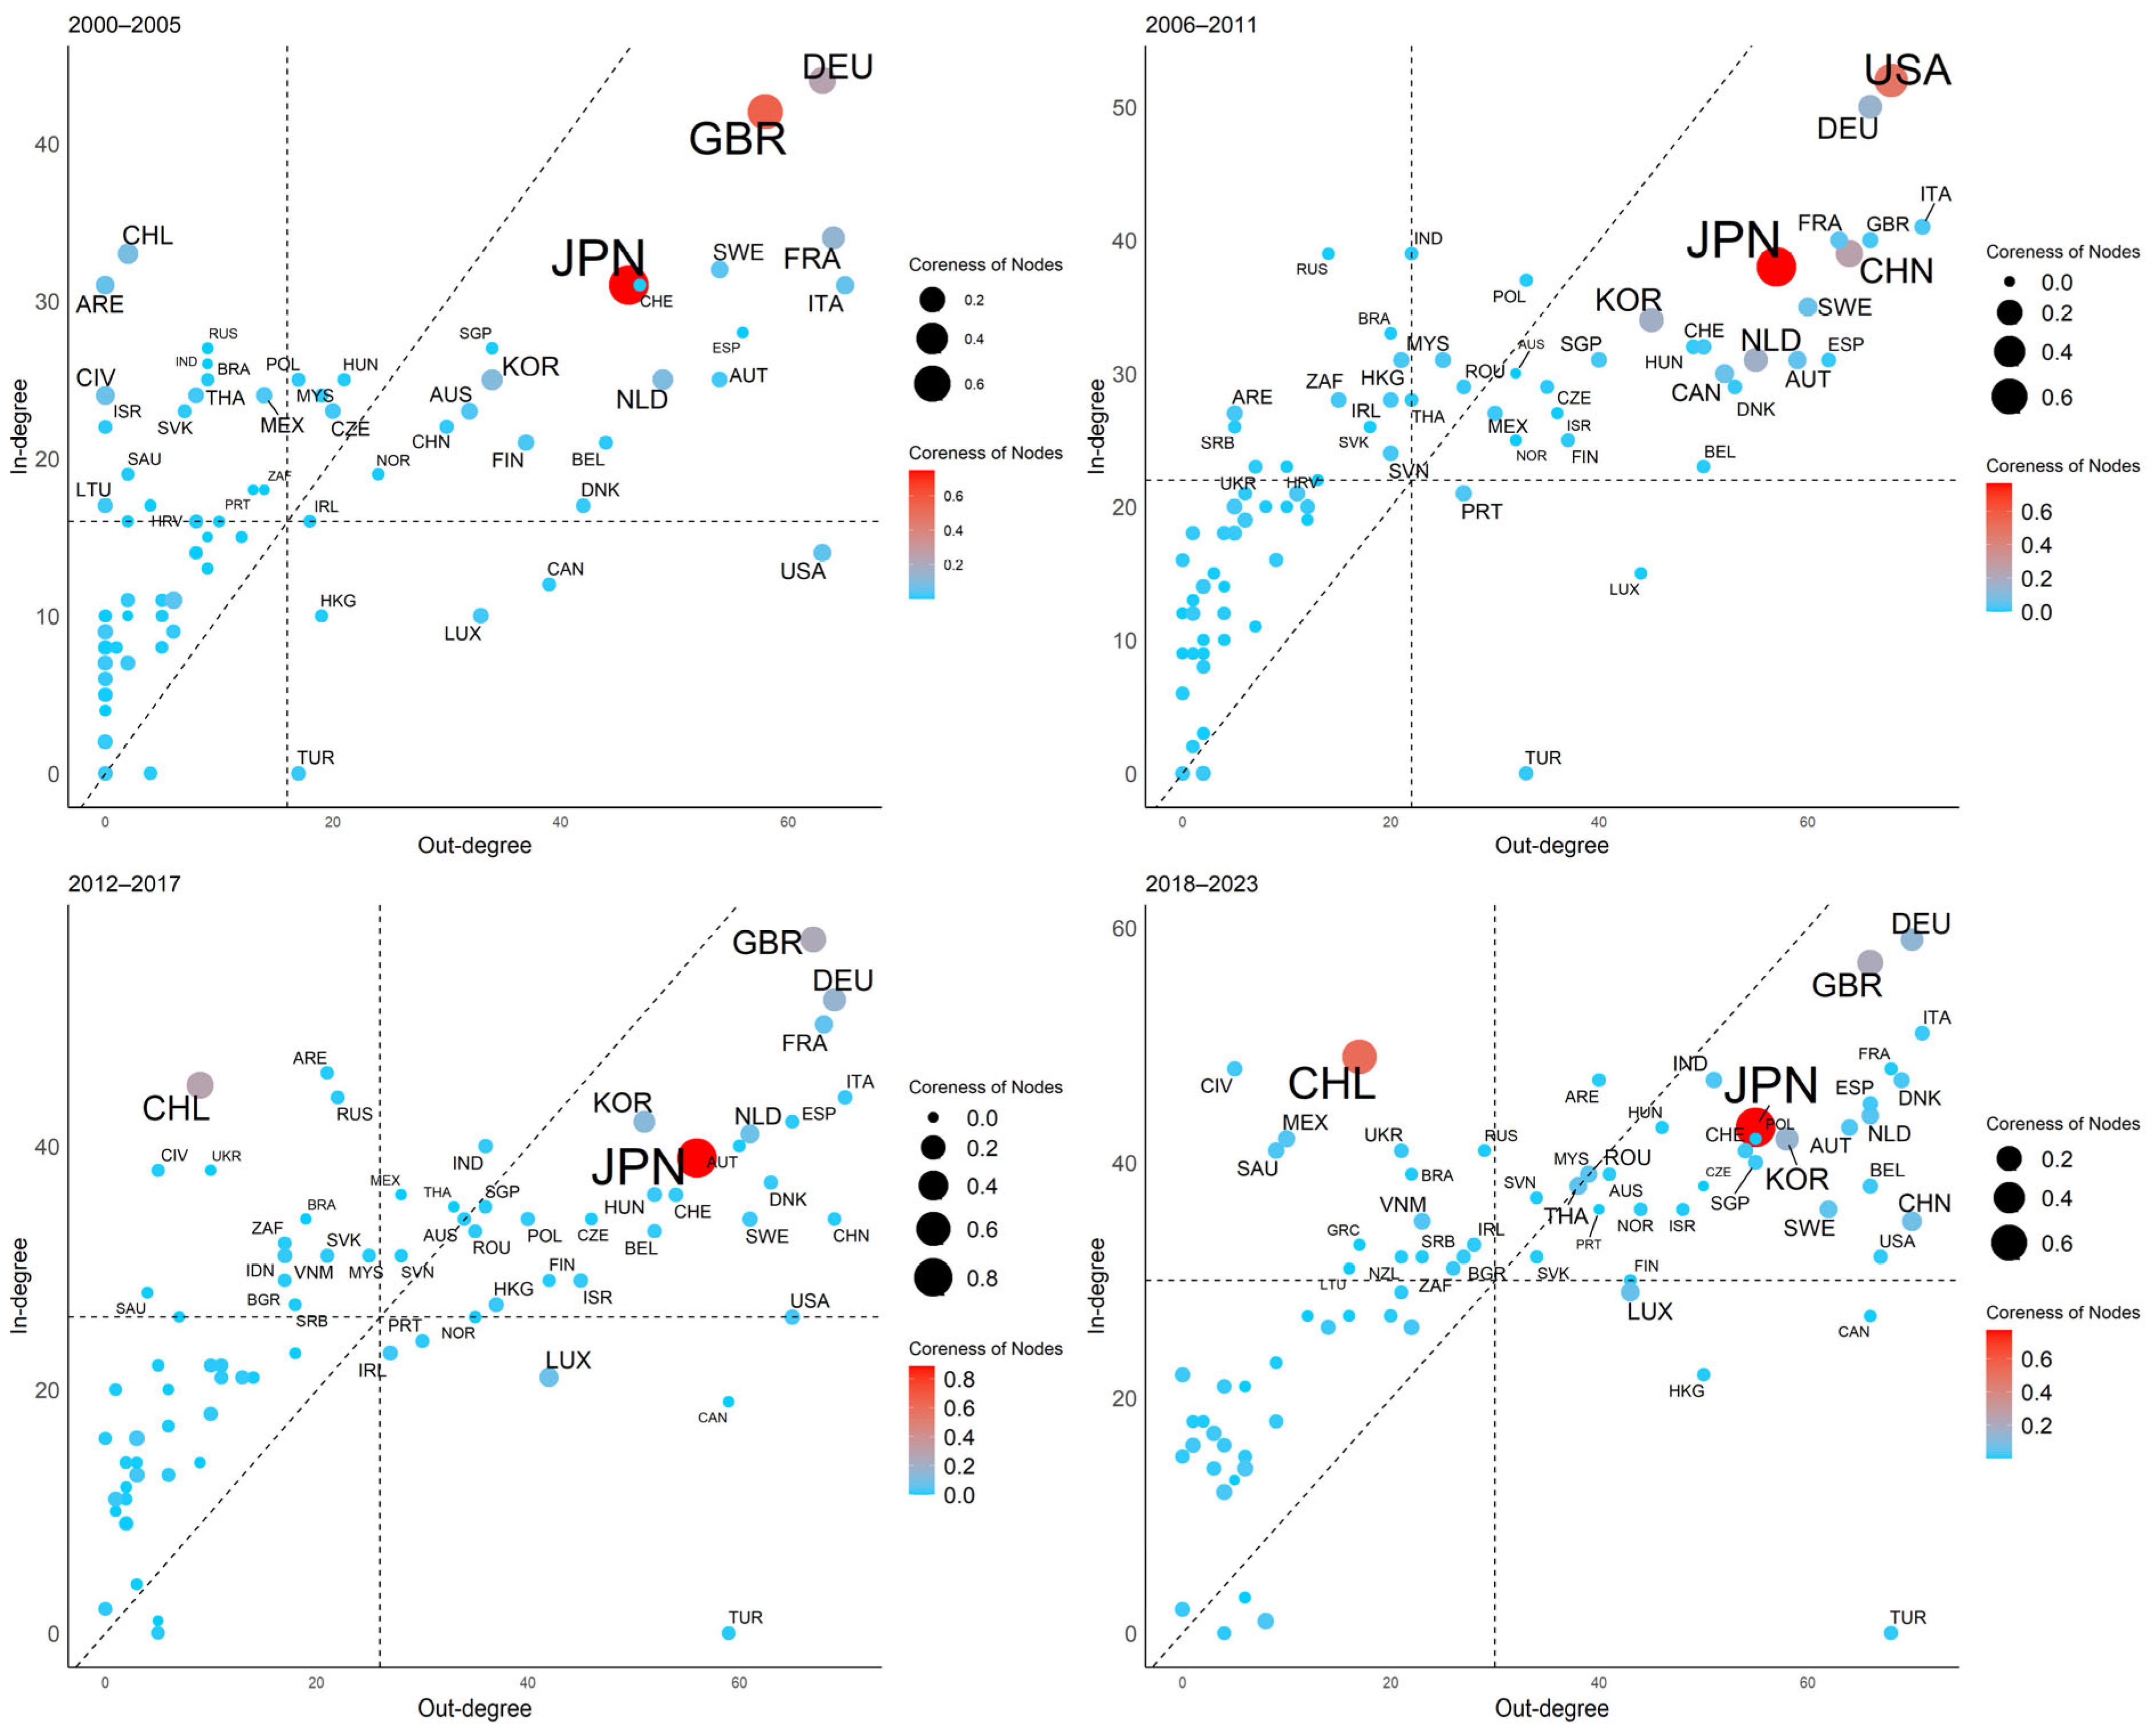
This section shows each country’s foreign trade activity, import attractiveness, and network control through the out-degree, in-degree, and core-degree coordinate systems (
Figure 6). The axes of each of these systems are divided according to the average degree of the network.
Quadrant 1: Hub Nodes
This quadrant is characterized by a high in-degree and out-degree, and the nodes in this quadrant are key hubs in the network. In the first stage, for example, they not only export industrial robots to at least 16 countries but also import industrial robots to at least 16 countries, indicating that these countries are very active in importing and exporting industrial robots. Among them, most of the nodes with high core degrees are also located in this quadrant, and these nodes have high influence and control in the network, which is crucial for the stability of the trade network and the dissemination of information. Most of the nodes are located under the 45° line, indicating that the out-degree centrality of most of the nodes in this quadrant is stronger than the in-degree centrality, which is related to the high concentration of global industrial robotics technology. Although China has consistently been positioned within this quadrant, its relative location has been continuously moving away from the 45° line. This indicates a gradual strengthening of China’s export capabilities. South Korea, India, and Poland also shown similar movement trends.
Quadrant 2: Convergence Nodes
This quadrant is characterized by a high in-degree and a low out-degree, with countries in the quadrant exporting industrial robots to very few countries but importing industrial robots from many. This finding indicates that these countries are important demanders of industrial robots and have been able to establish trade relationships with many exporting countries. Israel moves to quadrant 1 in the second stage, indicating that the country’s industrial robots have become more attractive as products and that it has exported industrial robots to more countries. All nodes in this quadrant are located on the 45° line, indicating that all countries have a stronger in-degree centrality than out-degree centrality.
Quadrant 3: Marginalization Nodes
This quadrant is characterized by nodes with a low in-degree and out-degree. They have fewer connections in the trade network, are less involved in the network, and play a secondary role in the network. A very large portion of the nodes are located above the 45° line, which corresponds to the distribution of the first quadrant. This finding indicates that these countries are highly dependent on imports of industrial robots and have weak independent R&D and production capabilities. The representative nodes of this quadrant are Costa Rica, Kuwait, and North Macedonia.
Quadrant 4: Propagation Nodes
This quadrant is characterized by a high out-degree and a low in-degree. The nodes in this quadrant are exporters to many countries but rarely import industrial robots from other countries, which may be related to the industrial structure of these countries. The countries and regions represented in this quadrant are Canada and Luxembourg, which have in common the fact that they are among the world’s leading countries in high-end manufacturing and are thus prone to establish trade links with other countries in terms of export competitiveness [
38]. All nodes in this quadrant are located below the 45° line, suggesting that all countries have a stronger out-degree centrality than in-degree centrality.
5.3. Analysis of the Structure of Online Communities
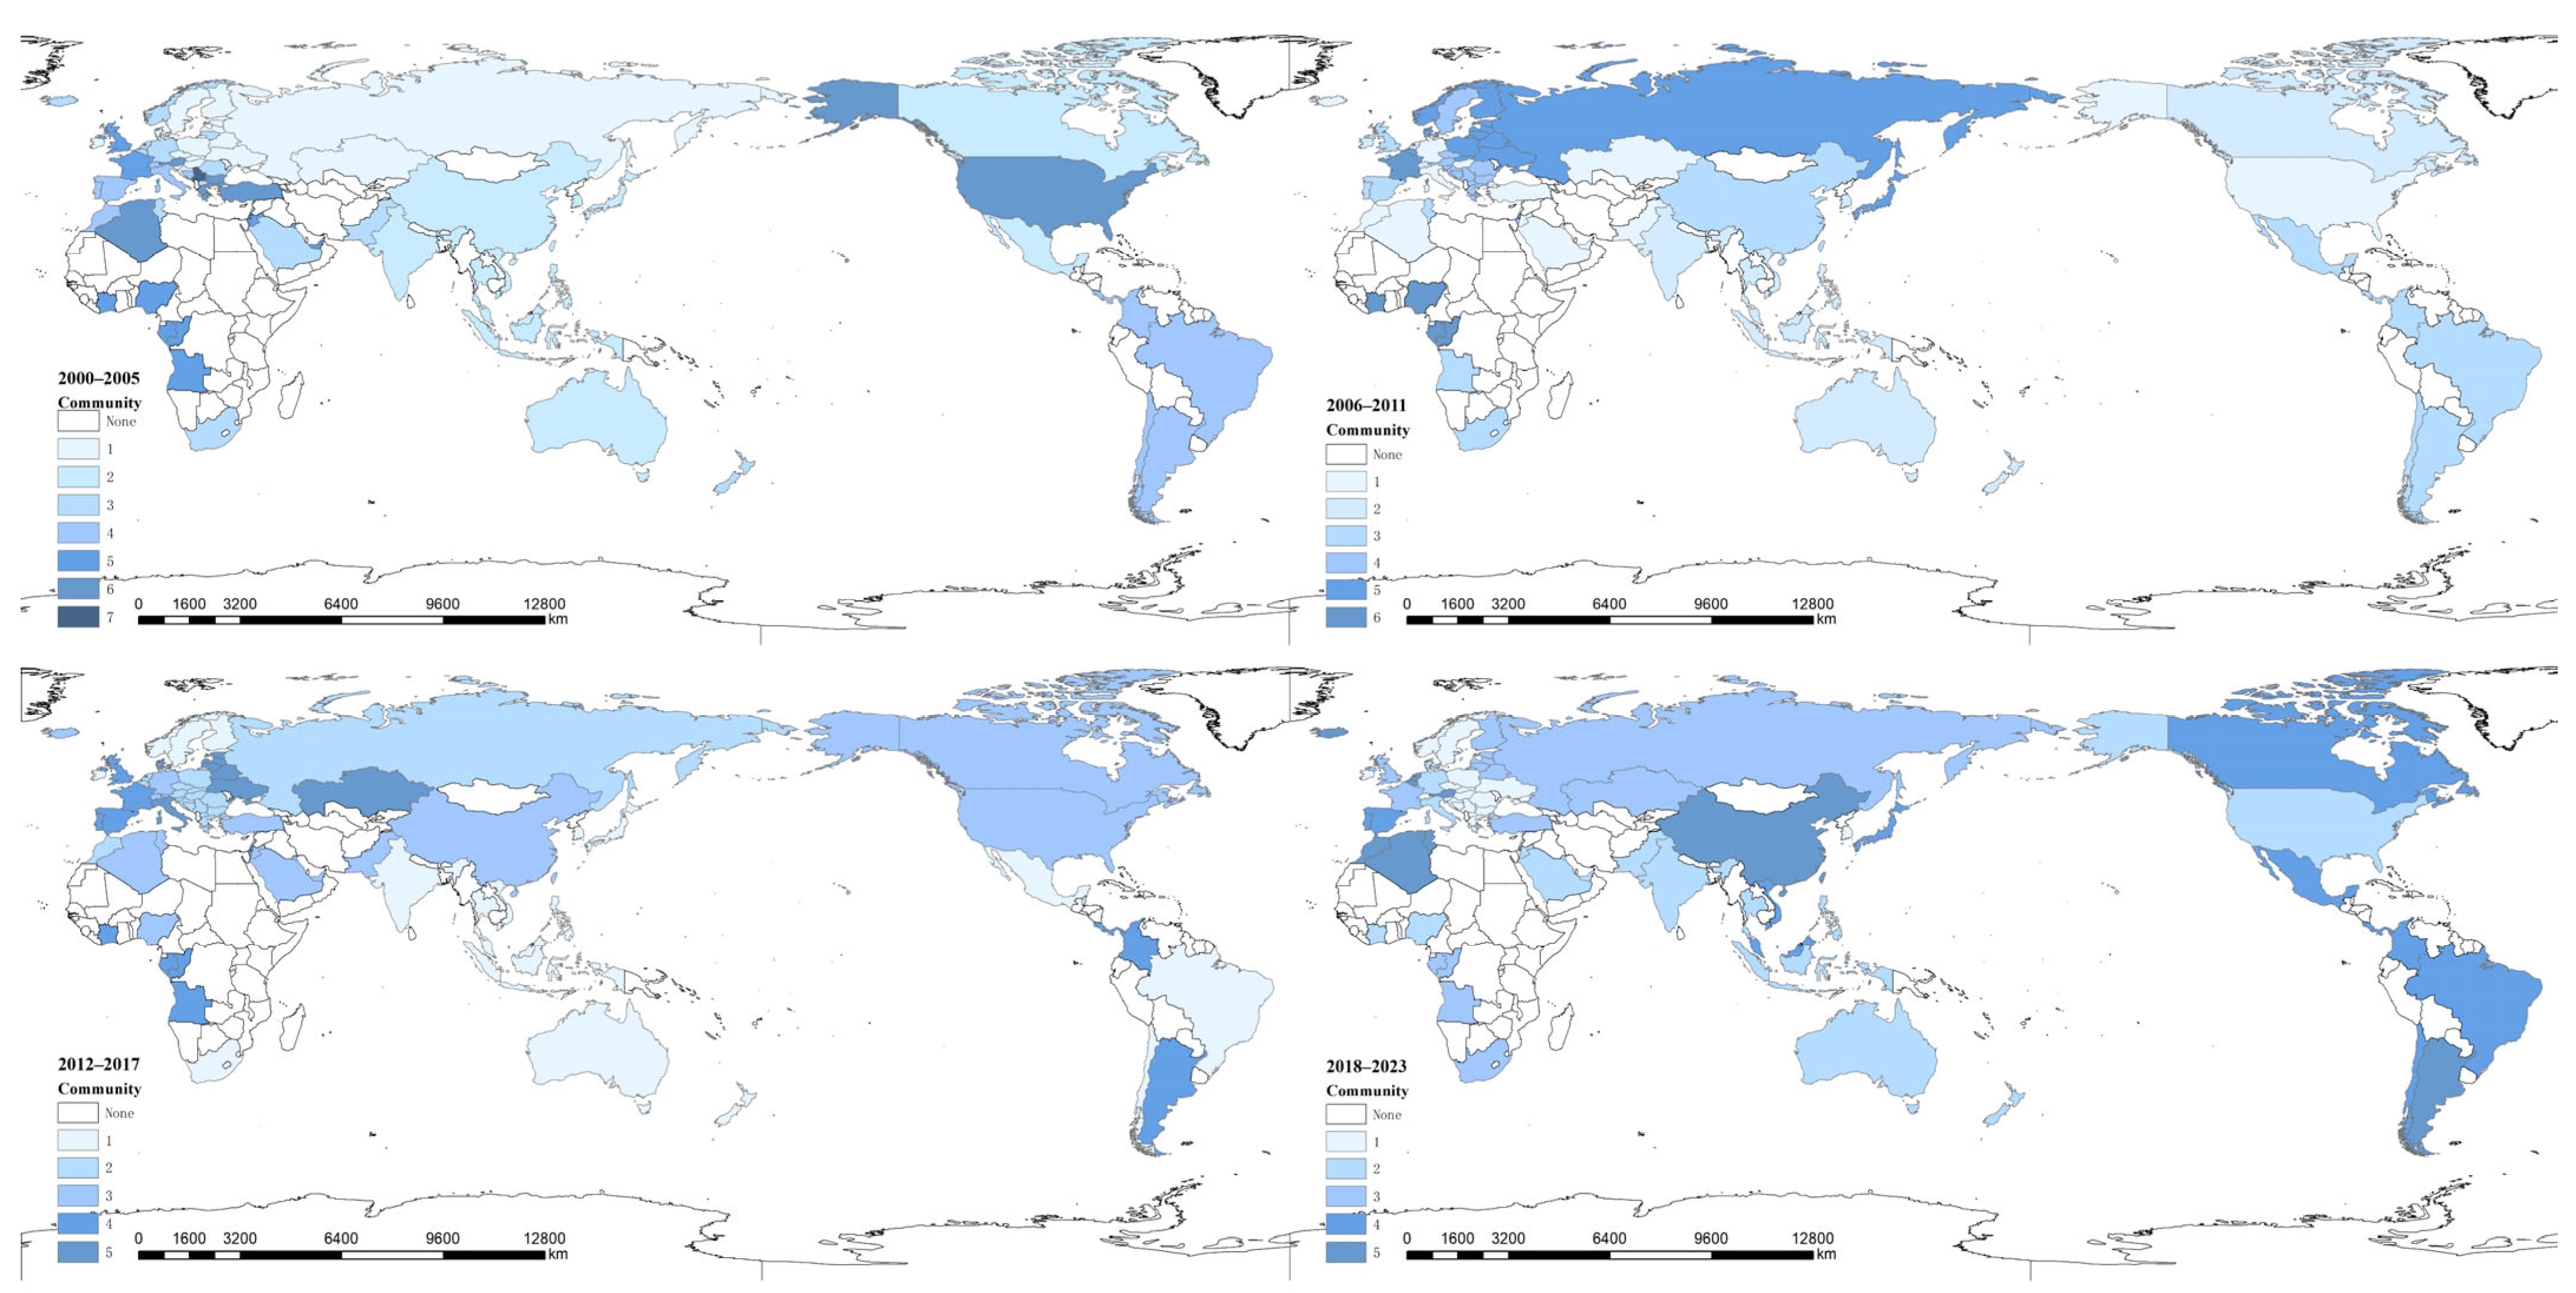
In the community study, we used the Leiden algorithm, which is an unsupervised community discovery algorithm based on modularity optimization, to explore the community evolution in the GIRTN [
39]. The algorithm optimizes community segmentation by maximizing modularity to more accurately identify community structures in the network. The findings (
Figure 7) reveal several key trends in community evolution. First, the number of communities experienced a significant decrease, gradually consolidating from the initial seven communities to five. This change suggests that, over time, the trade links between countries have become stronger and that smaller communities have gradually consolidated into larger communities, thus increasing the frequency and ease of intra-community connections. The community structure of countries in South Asia and Oceania shows a very high degree of stability, with these countries being located within the same community in all four stages. This stability may stem from the locations of these countries within the GIRTN and the relative stability of their trade relationships. In addition, there may be political, geographic, and cultural similarities between these countries, which work together to reduce trade volatility and facilitate the formation of tightly networked communities [
33,
40].
Another notable feature is that community classification gradually exhibits geo-decentralization. Even countries that are geographically distant from each other may be categorized in the same community classification. This phenomenon may be attributed to economic development and shifts in the centre of the country, resulting in changes in the position and role of some countries in the network.
Finally, Europe and Africa are the two continents with the largest number of communities outside of Antarctica. The high number of communities in Europe may be explained by the large number of European countries and the fact that Germany, Italy, the United Kingdom, and France are all important exporters of industrial robots, with differences in their export structure and trading partners. The increase in the number of African communities, on the other hand, may be related to the impact of international political relations. In the early stages, African countries were part of the same community as the UK and France due to their language, culture, and colonial history. However, in the subsequent stages, with the strengthening of China–Africa relations and the increasing influence of the Association of Southeast Asian Nations (ASEAN), African countries gradually integrated into the community structure of the Asia-Pacific region.
6. China’s Competitiveness in the GIRTN
6.1. Overview of China’s Industrial Robot Exports
China’s exports of industrial robots have jumped from being the eighth largest to the third largest worldwide in terms of value, as shown in
Table 3 and
Table 4. This change reflects the country’s increased export capacity for industrial robots, and this trajectory is highly consistent with the implementation cycle of the “Made in China 2025” strategy [
41]. China’s competitive advantage is attributed to its cost-efficient manufacturing and accelerated technological advancement [
42]. As China’s manufacturing sector has upgraded, the quality and performance of its industrial robots have also improved, enabling China to compete with developed countries in the global market. This leapfrog development confirms Juhász et al.’s suggestion that national industrial policy in the new environment still has a driving role in industrial upgrading [
43]. With China’s economic growth and automation upgrades in manufacturing, the country’s import demand for industrial robots has increased, and today, China is one of the largest industrial robot markets in the world.
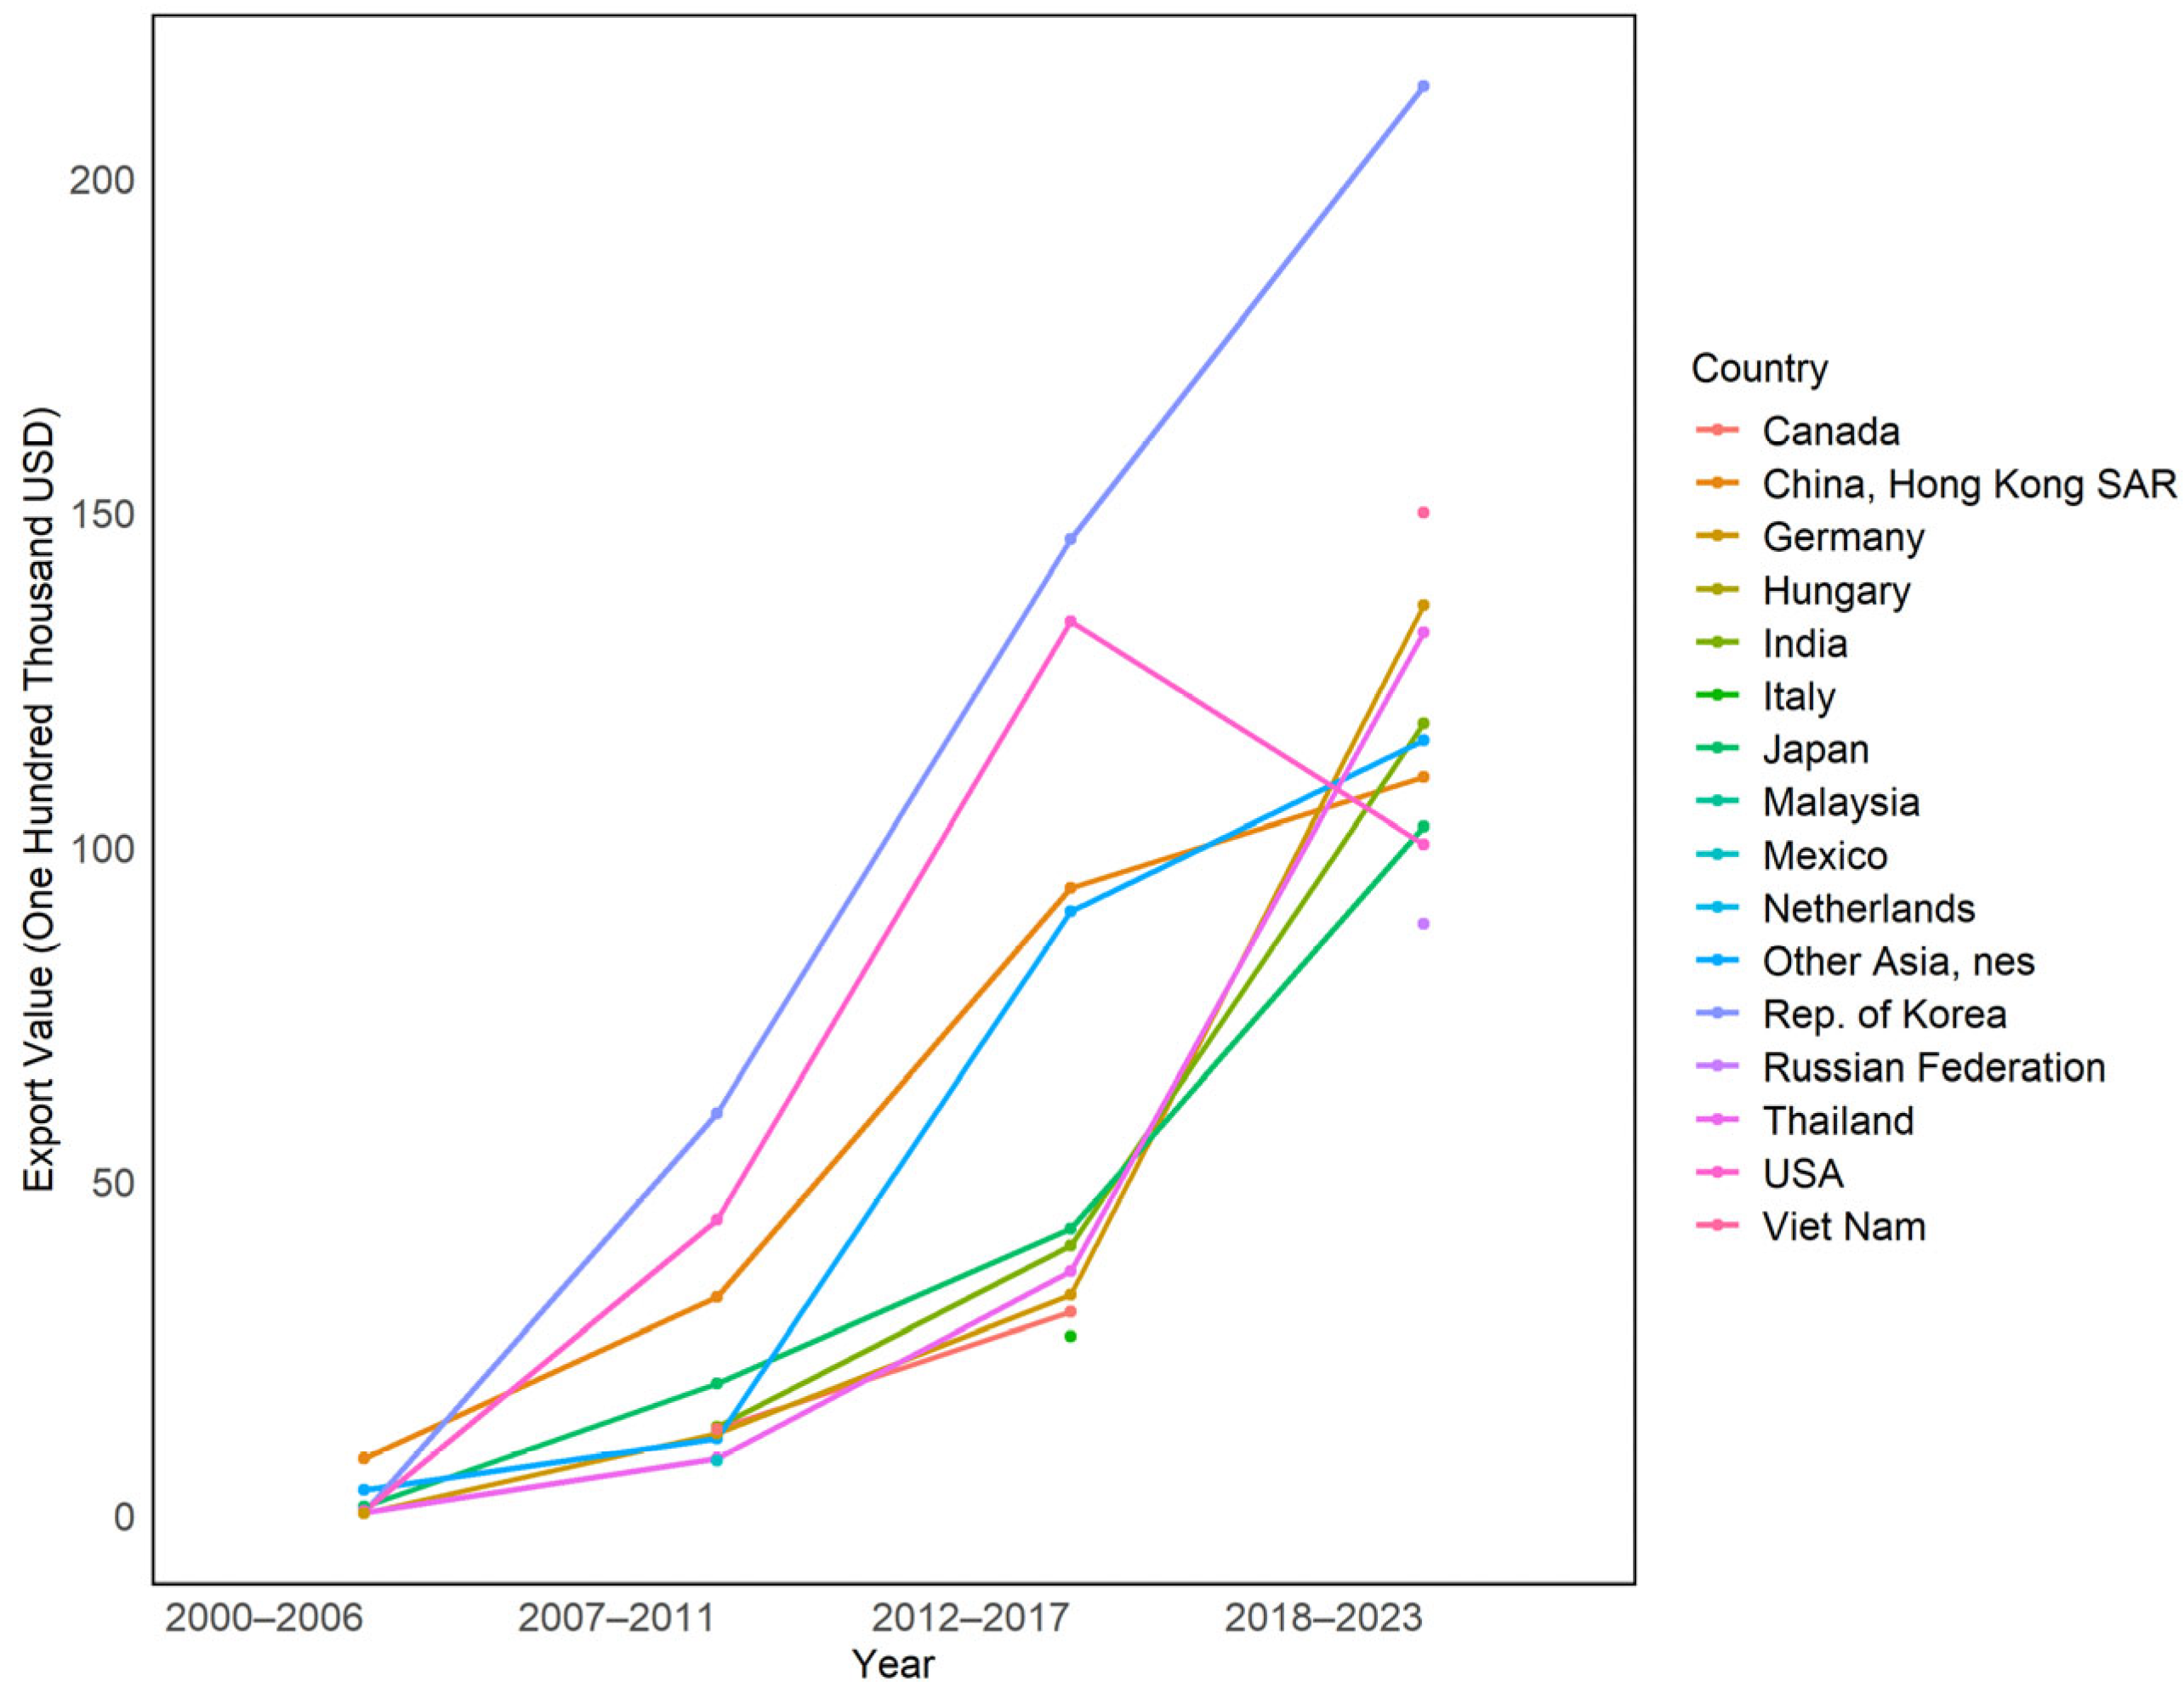
The number of China’s export partner countries in the four stages is 36, 90, 114, and 149, which is in line with the exponential growth model. At the same time, China’s export amount with most countries also has the same significant characteristics of year-on-year growth. This finding indicates that the depth and breadth of China’s industrial robot exports have improved. In terms of export partner countries, the change in the ranking of the top 10 countries is worthy of in-depth attention (in
Figure 8 and
Table 6). South Korea occupied the top position for three stages (except for the 2000–2006 stage), with its share of imports rising from 2.68% to 26.9% and then falling to 16.8%. This finding is closely related to the implementation of its Intelligent Robot Development and Popularization Promotion Act
5 and geographic proximity effects. The USA ranking increased continuously in the first three stages; however, in the 2018–2023 stage, its ranking plummeted to ninth place. This change may be closely related to tense trade policies between the two countries, in addition to factors such as China’s increased trade with other countries [
44]. In 2018, the United States imposed tariffs on imports from China, and the list involved 1102 separate USA tariff lines, including industrial robots.
6 Concerning emerging markets, Thailand rose from eighth to fourth, while Vietnam and Russia entered the list of China’s top ten exporters in the fourth stage, confirming Baldwin’s “Factory Asia 2.0” supply chain restructuring trend [
45]. Asia remains an important demand region and export direction for China’s industrial robots.
In conjunction with
Figure 3, it is found that the number of lines related to China has increased and is no longer dominated by inflow lines; the number of lines flowing out of China is increasing, and the number of large-dollar lines has increased in the third and fourth stages. This finding also indicates that China’s role is gradually shifting from being a major importer to being a major exporter of industrial robots.
6.2. Export Competitiveness of China’s Industrial Robots
This section determines China’s position in the GIRTN through the reciprocity index, industry concentration index, HHI, and betweenness centrality.
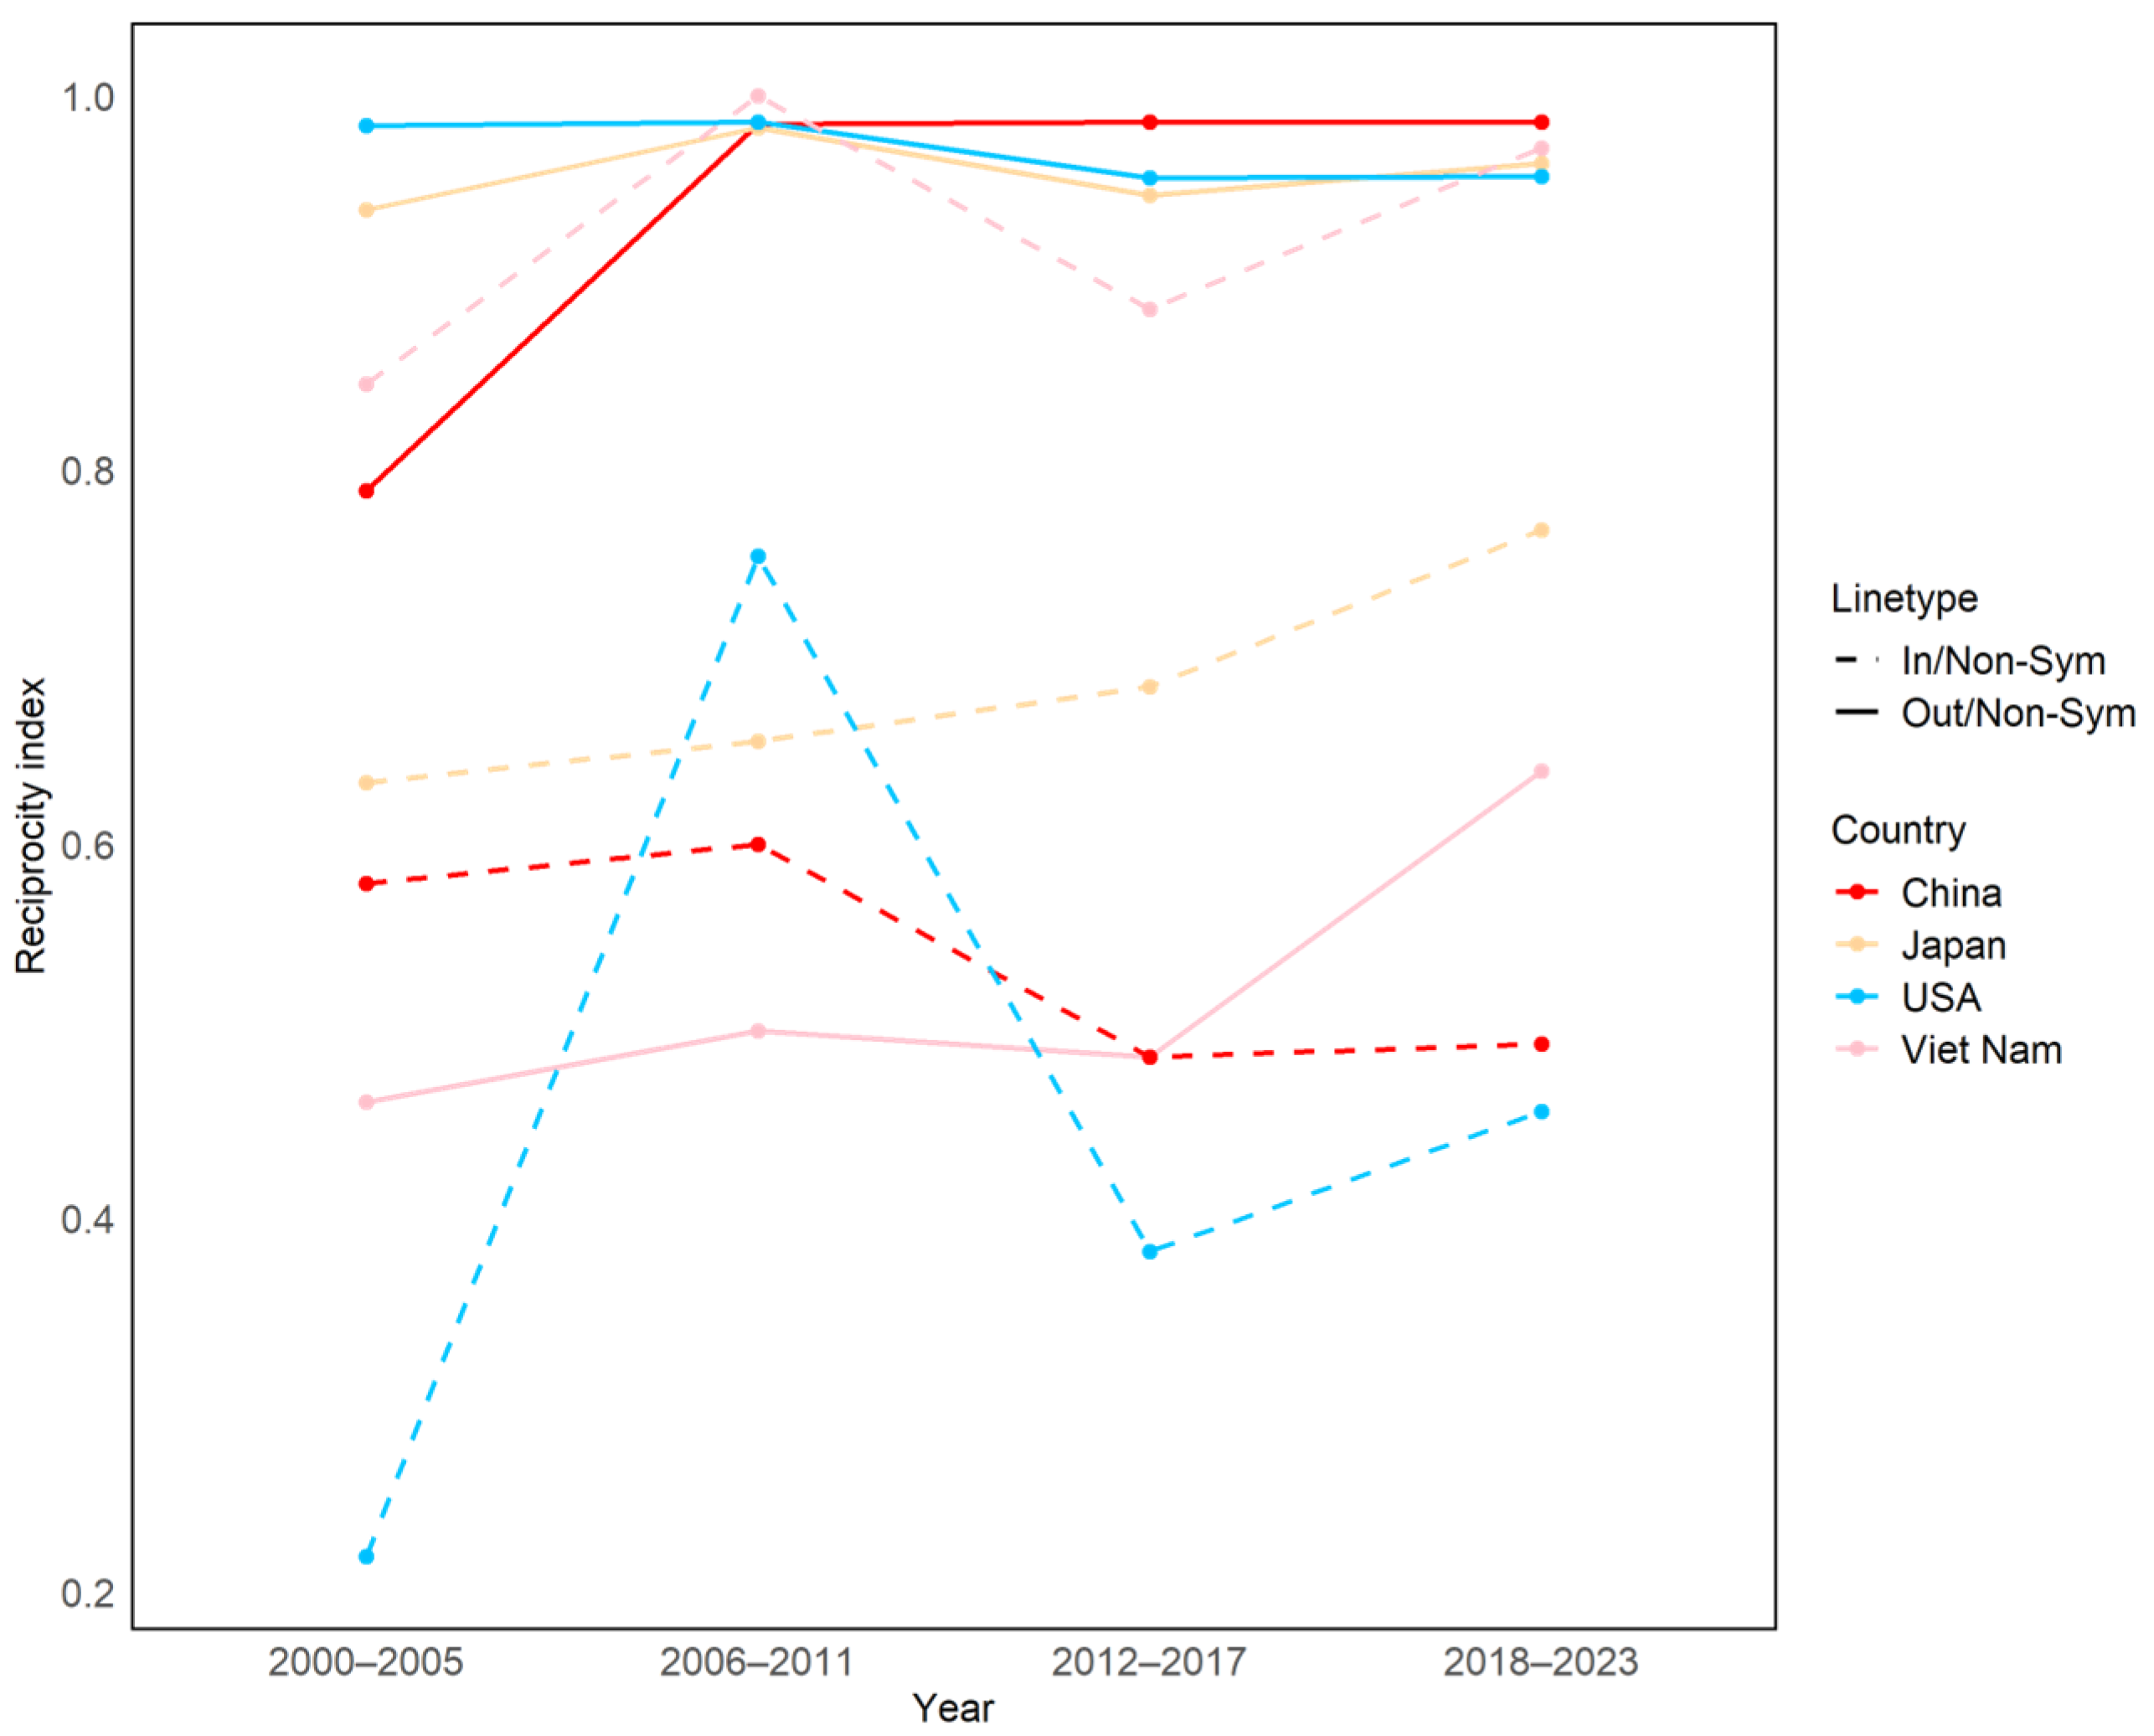
From the perspective of reciprocity (
Figure 9), China’s export non-response rate has the largest increase among the four stages, from 0.789 to 0.986. This finding indicates that the attractiveness of China’s industrial robotic products increased significantly and that most export recipients were unable to establish a reverse trade relationship with China by exporting industrial robots to China. This inability is inextricably related to China’s strategic transformation and policy support in recent years, which has sufficiently improved the competitiveness of Chinese industrial robots [
46,
47]. China’s import unresponsiveness index decreased from 0.579 to 0.493, which also indicates that China can export Chinese industrial robots to importing countries and confirms that the quality of China’s industrial robots has improved greatly and that their substitutability has decreased.
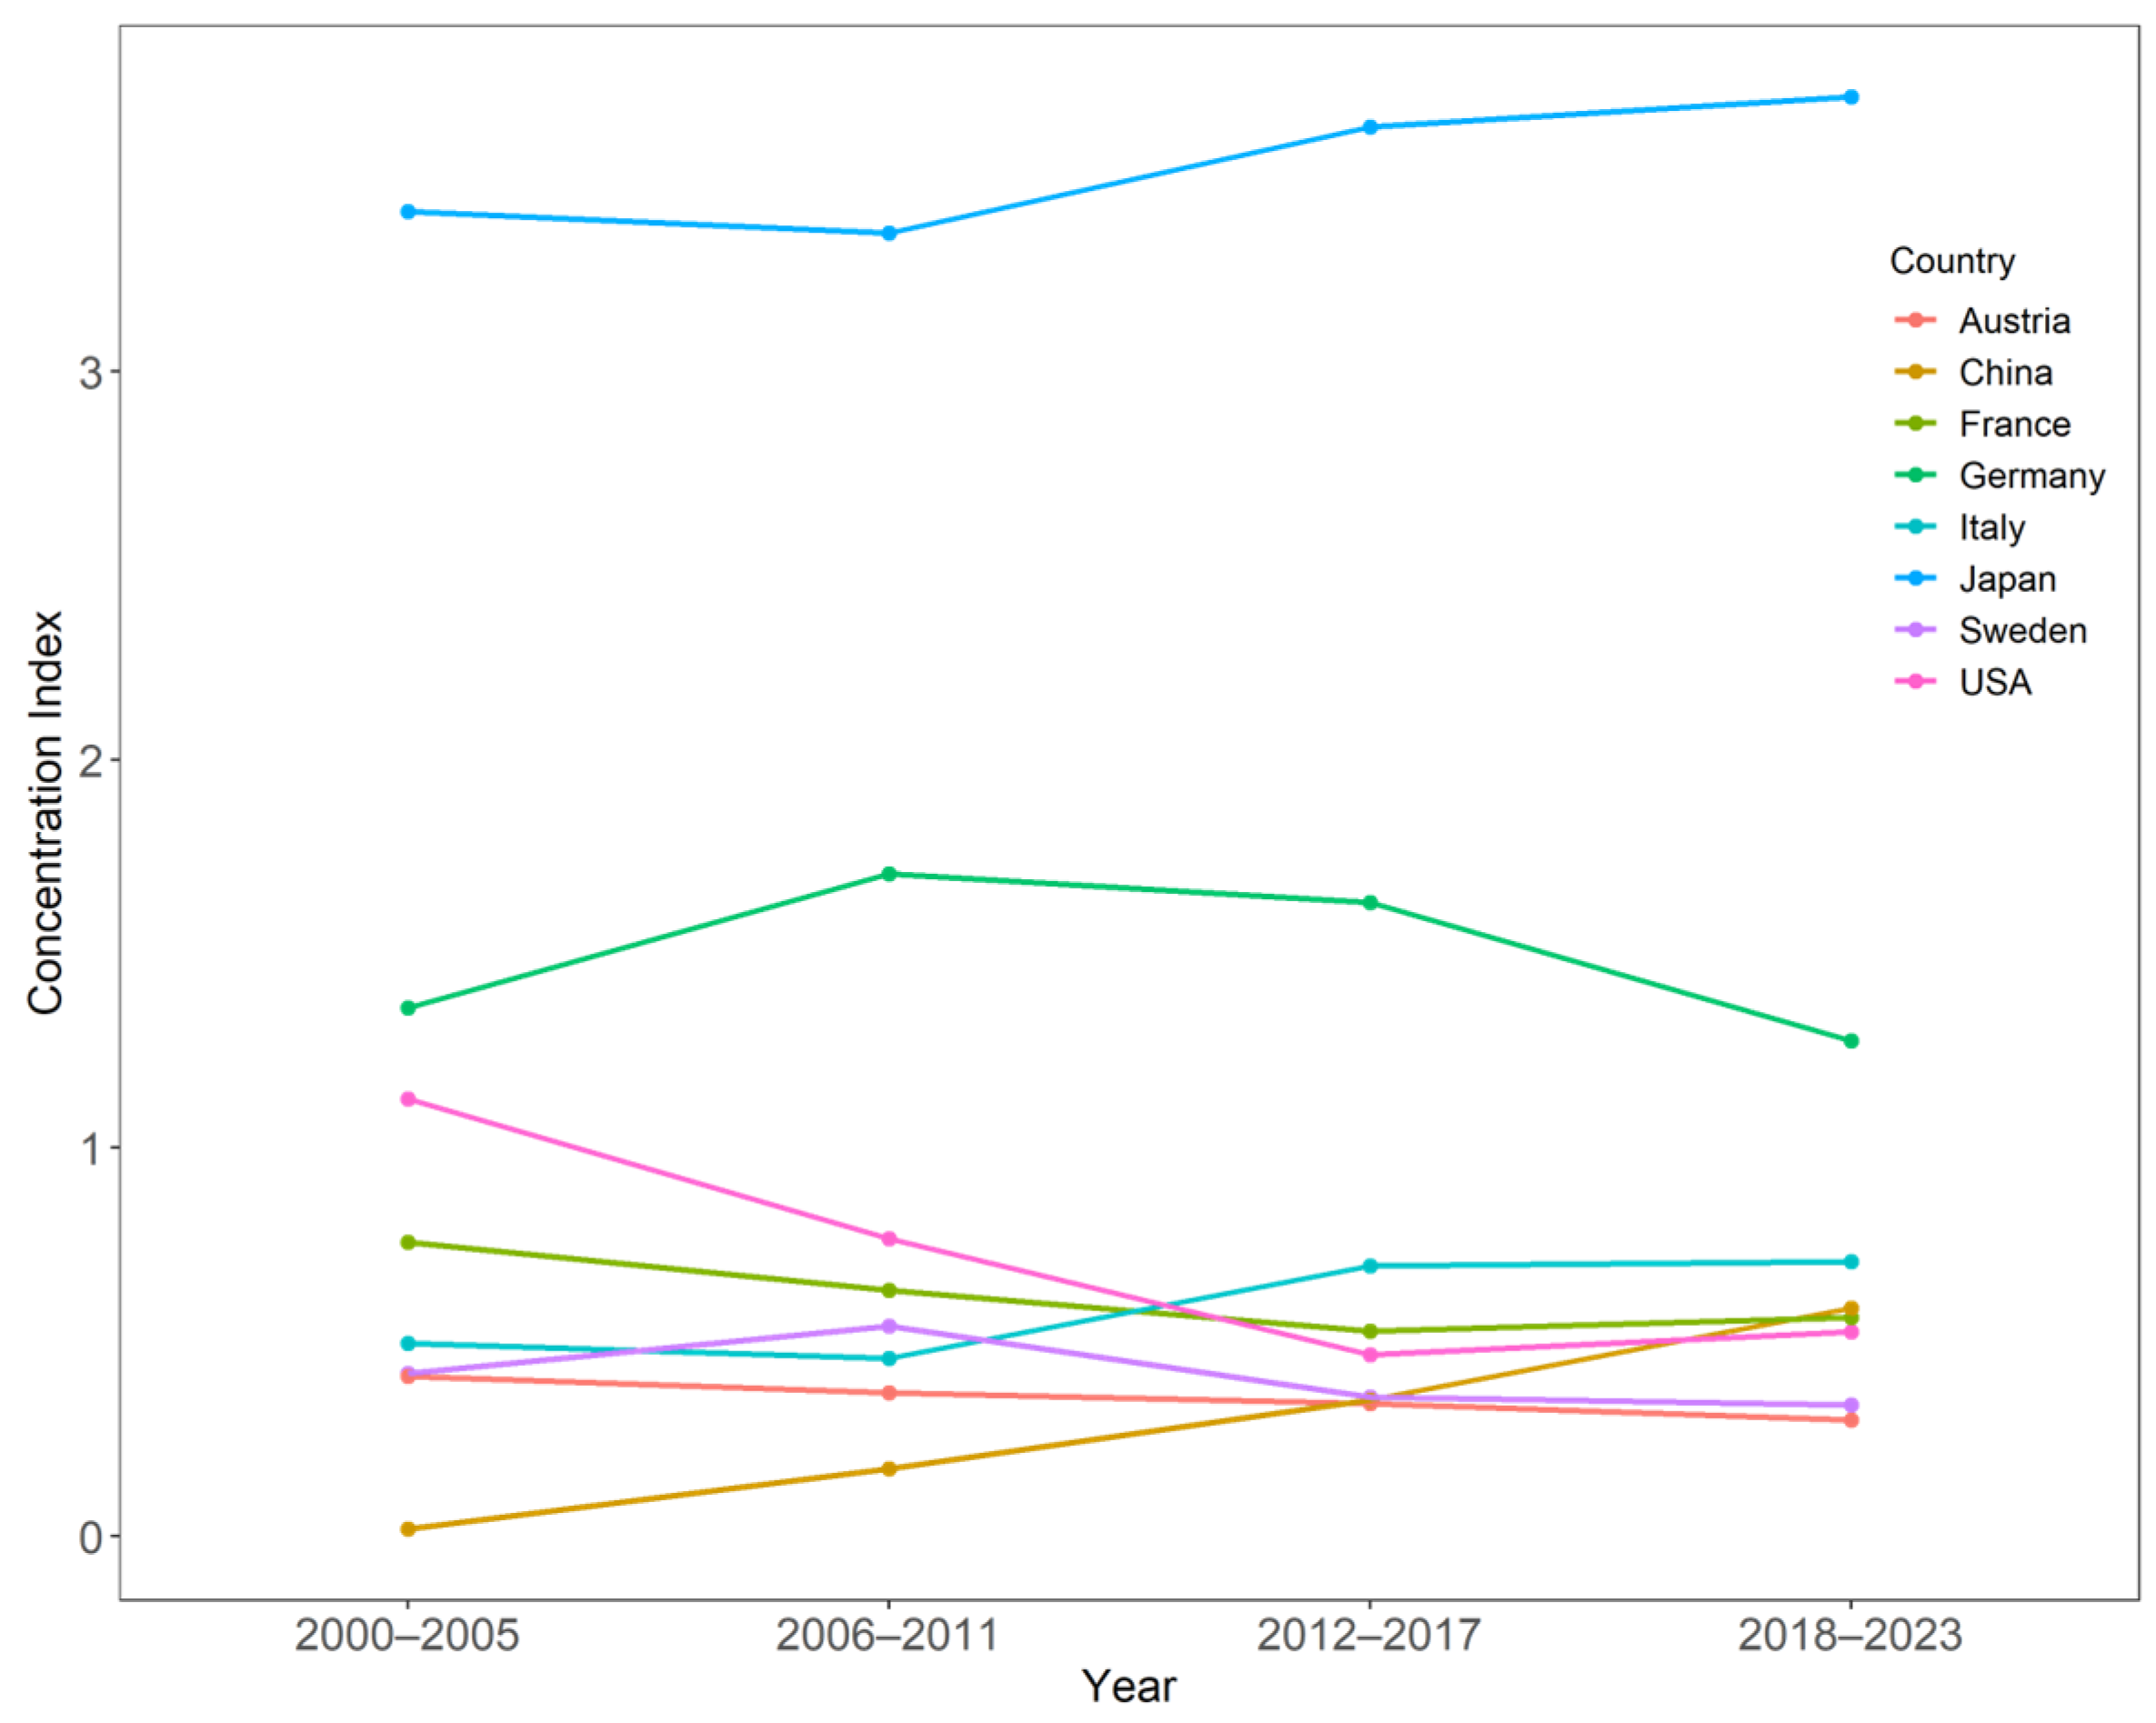
The top eight countries are filtered out based on the export value at each stage. Japan, Germany, the United States, France, Italy, and Sweden were firmly in the top eight countries. Although not in the top eight in the last two stages, Austria has been in ninth place for a long time and is therefore included in C8. In addition, China is included in C8 to analyze its trade competitiveness, as shown in
Table 7.
When the industry concentration index is greater than 1, the country occupies a dominant position in the GIRTN. As shown in
Figure 10, Japan and Germany have been in a competitive advantageous position for a long time. In particular, Japan’s industry concentration indices are all above 3 but show a gradual upward trend, which indicates that Japan has an unshakeable leading advantage in the GIRTN. The industry concentration indices of the United States, France, Sweden, and Austria show a general downward trend, indicating that these countries have gradually lost their dominant position in the evolution of the trade network and that their export capacity has weakened. In particular, the United States had an industry concentration index greater than 1 in the first stage, indicating that it once had a certain competitive advantage in the GIRTN. China’s industry concentration index shows a steady growth trend, although China’s industry concentration index was initially very close to 0. This finding suggests that China is gradually gaining a competitive advantage in trade and surpassing many developed countries, such as the United States and France, and is trending towards overtaking Italy to enter the top three in the industry.
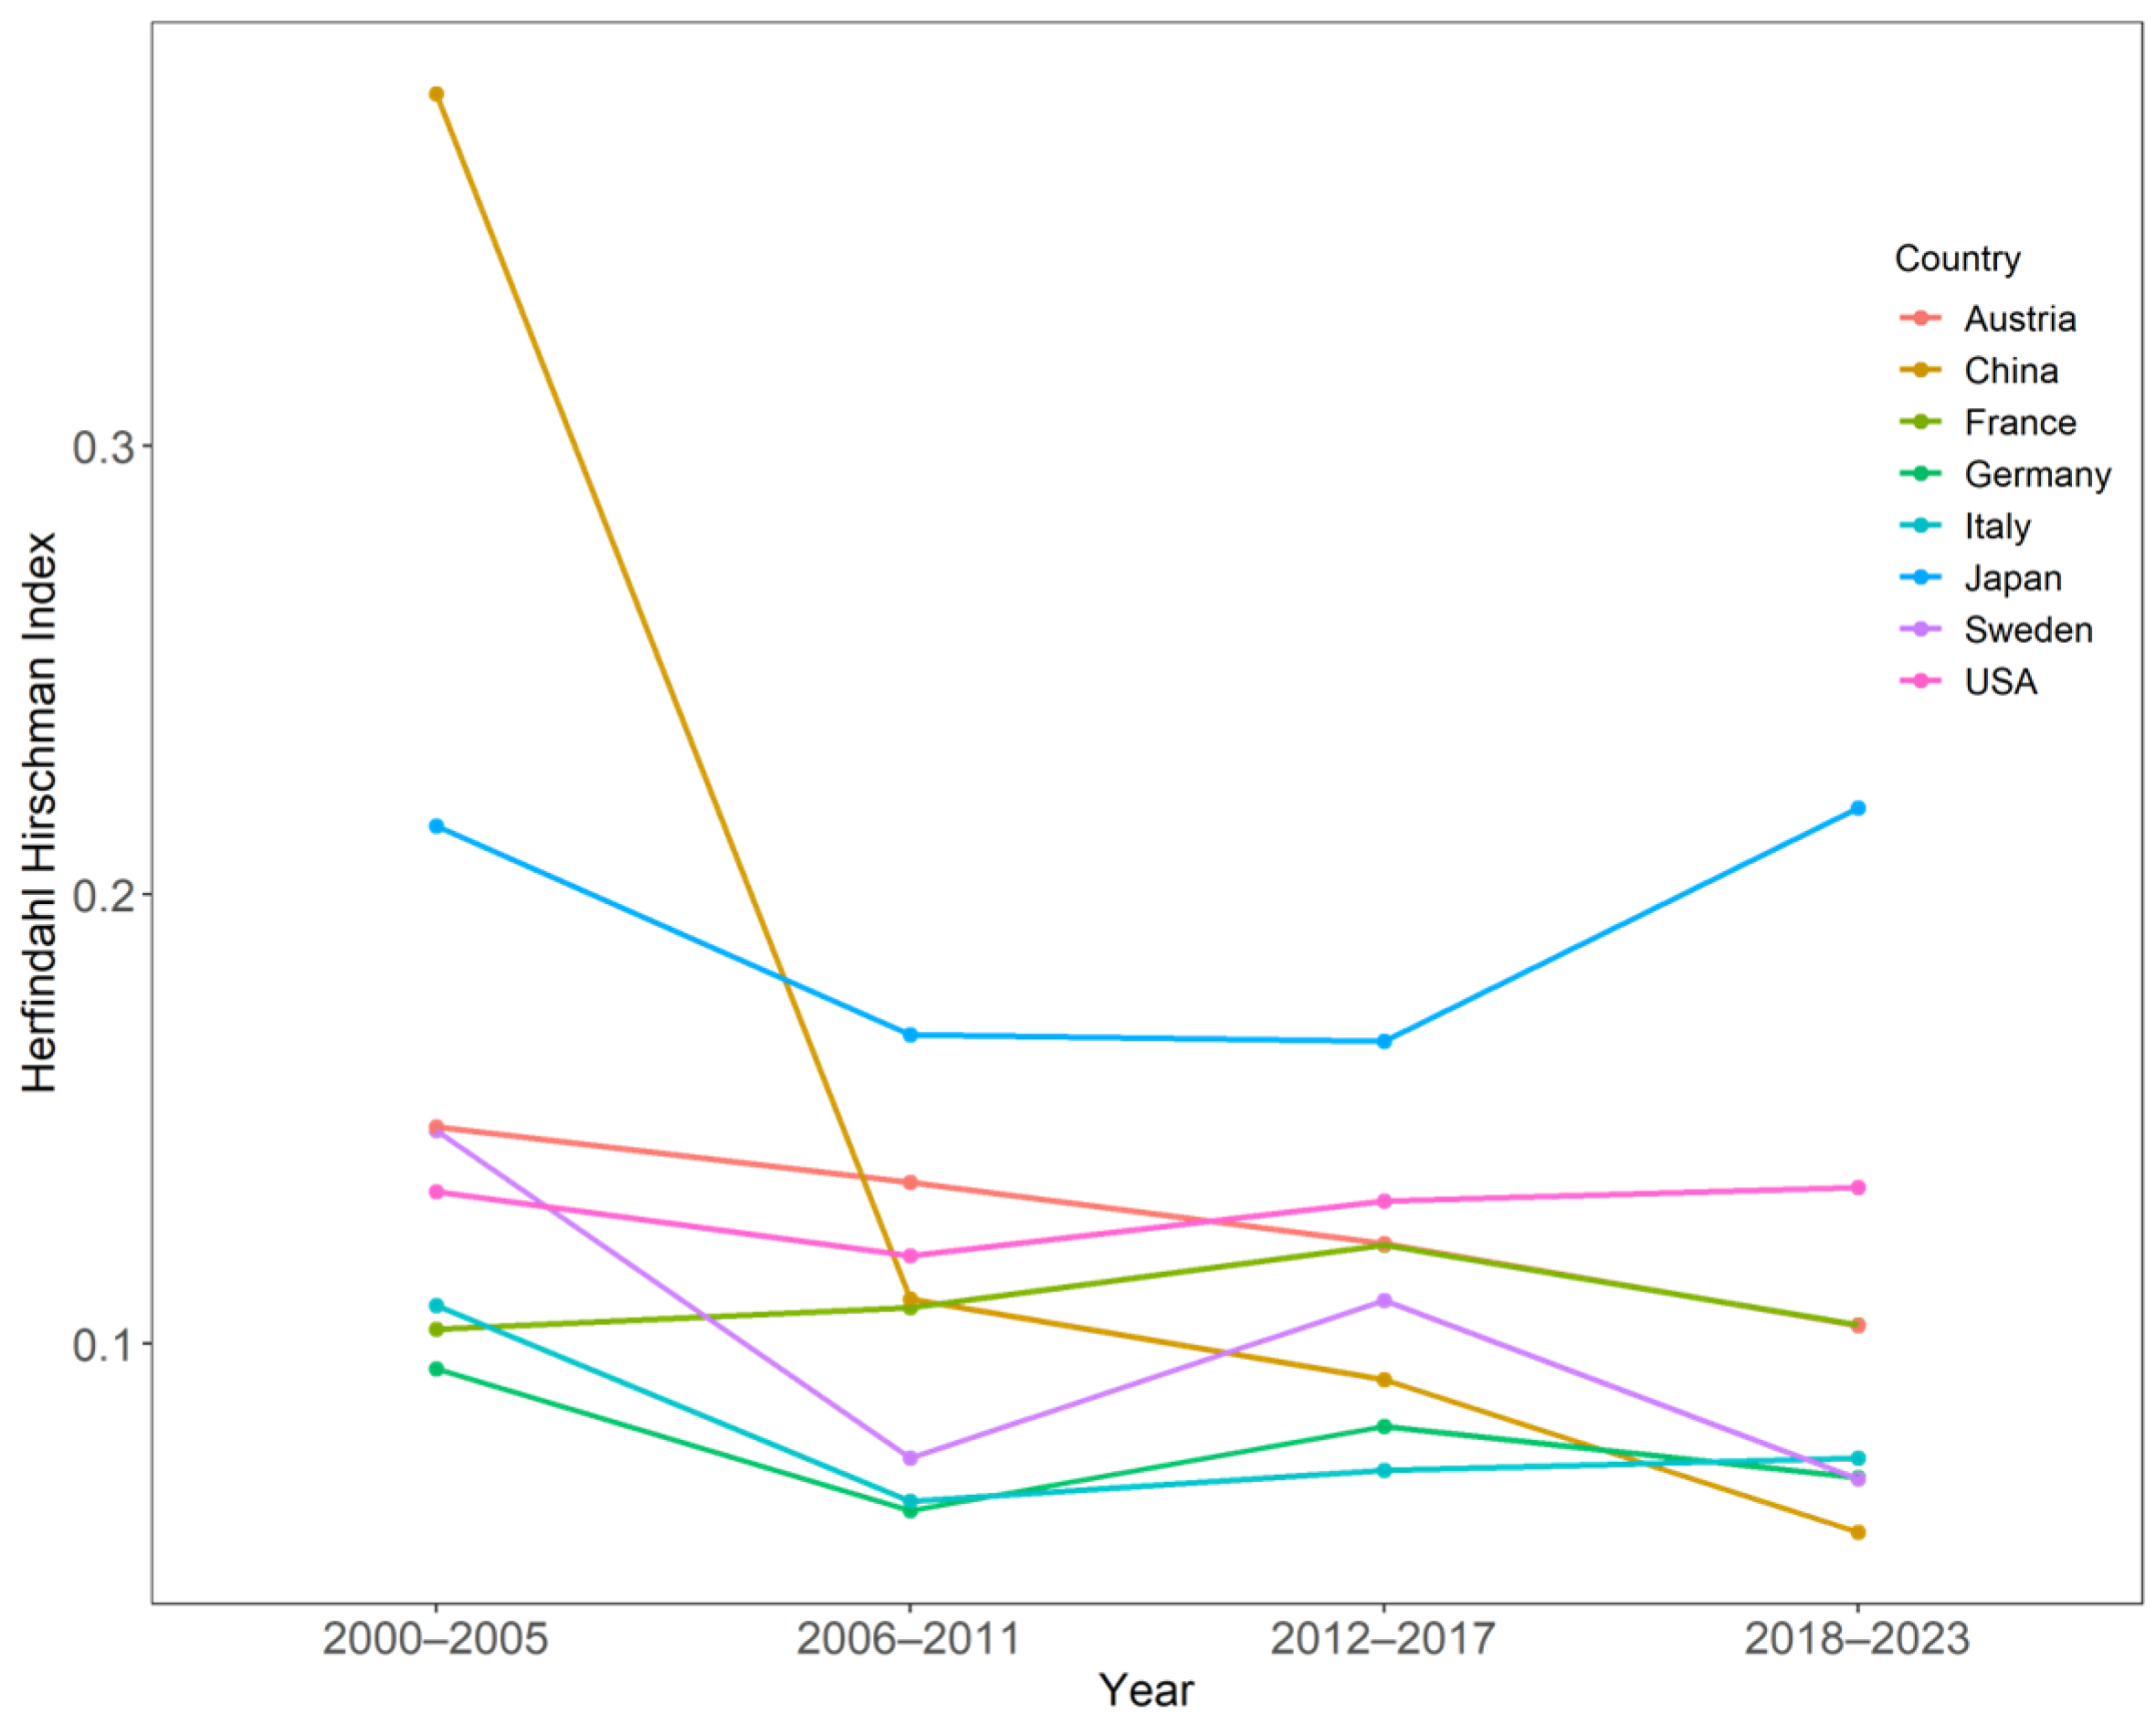
The Herfindahl–Hirschman index is a composite index that measures industry concentration [
48]. The value ranges from (1/N, 1), with a smaller HHI indicating that the country’s export structure is more diversified. Conversely, a larger HHI indicates that the country’s export structure is more homogeneous, implying that trade volatility will be greater [
40]. China is the country with the largest change in the HHI, from the highest HHI in the 2000–2005 period to the lowest HHI in the 2018–2023 period, with a change in value from much higher than 0.378 to 0.058 (
Figure 11). The significant change in the HHI demonstrates the enrichment of China’s industrial robot export structure, which reflects the increased attractiveness of China’s industrial robots and the fact that an increasing number of countries have trade transactions with China. The enhancement of attractiveness is inseparable from the influx of a large number of enterprises in China’s domestic market, intensifying competition and prompting companies to continuously optimize their products. According to information released by the State Administration for Market Regulation, by the end of December 2024, there were a total of 451,700 enterprises in China’s intelligent robot industry. The number of enterprises increased by 206.73% compared to the end of 2020, and by 19.39% compared to the end of 2023.
7 Additionally, through the signalling effect, more countries will be attracted to import Chinese industrial robots, which is a very promising prospect [
49].
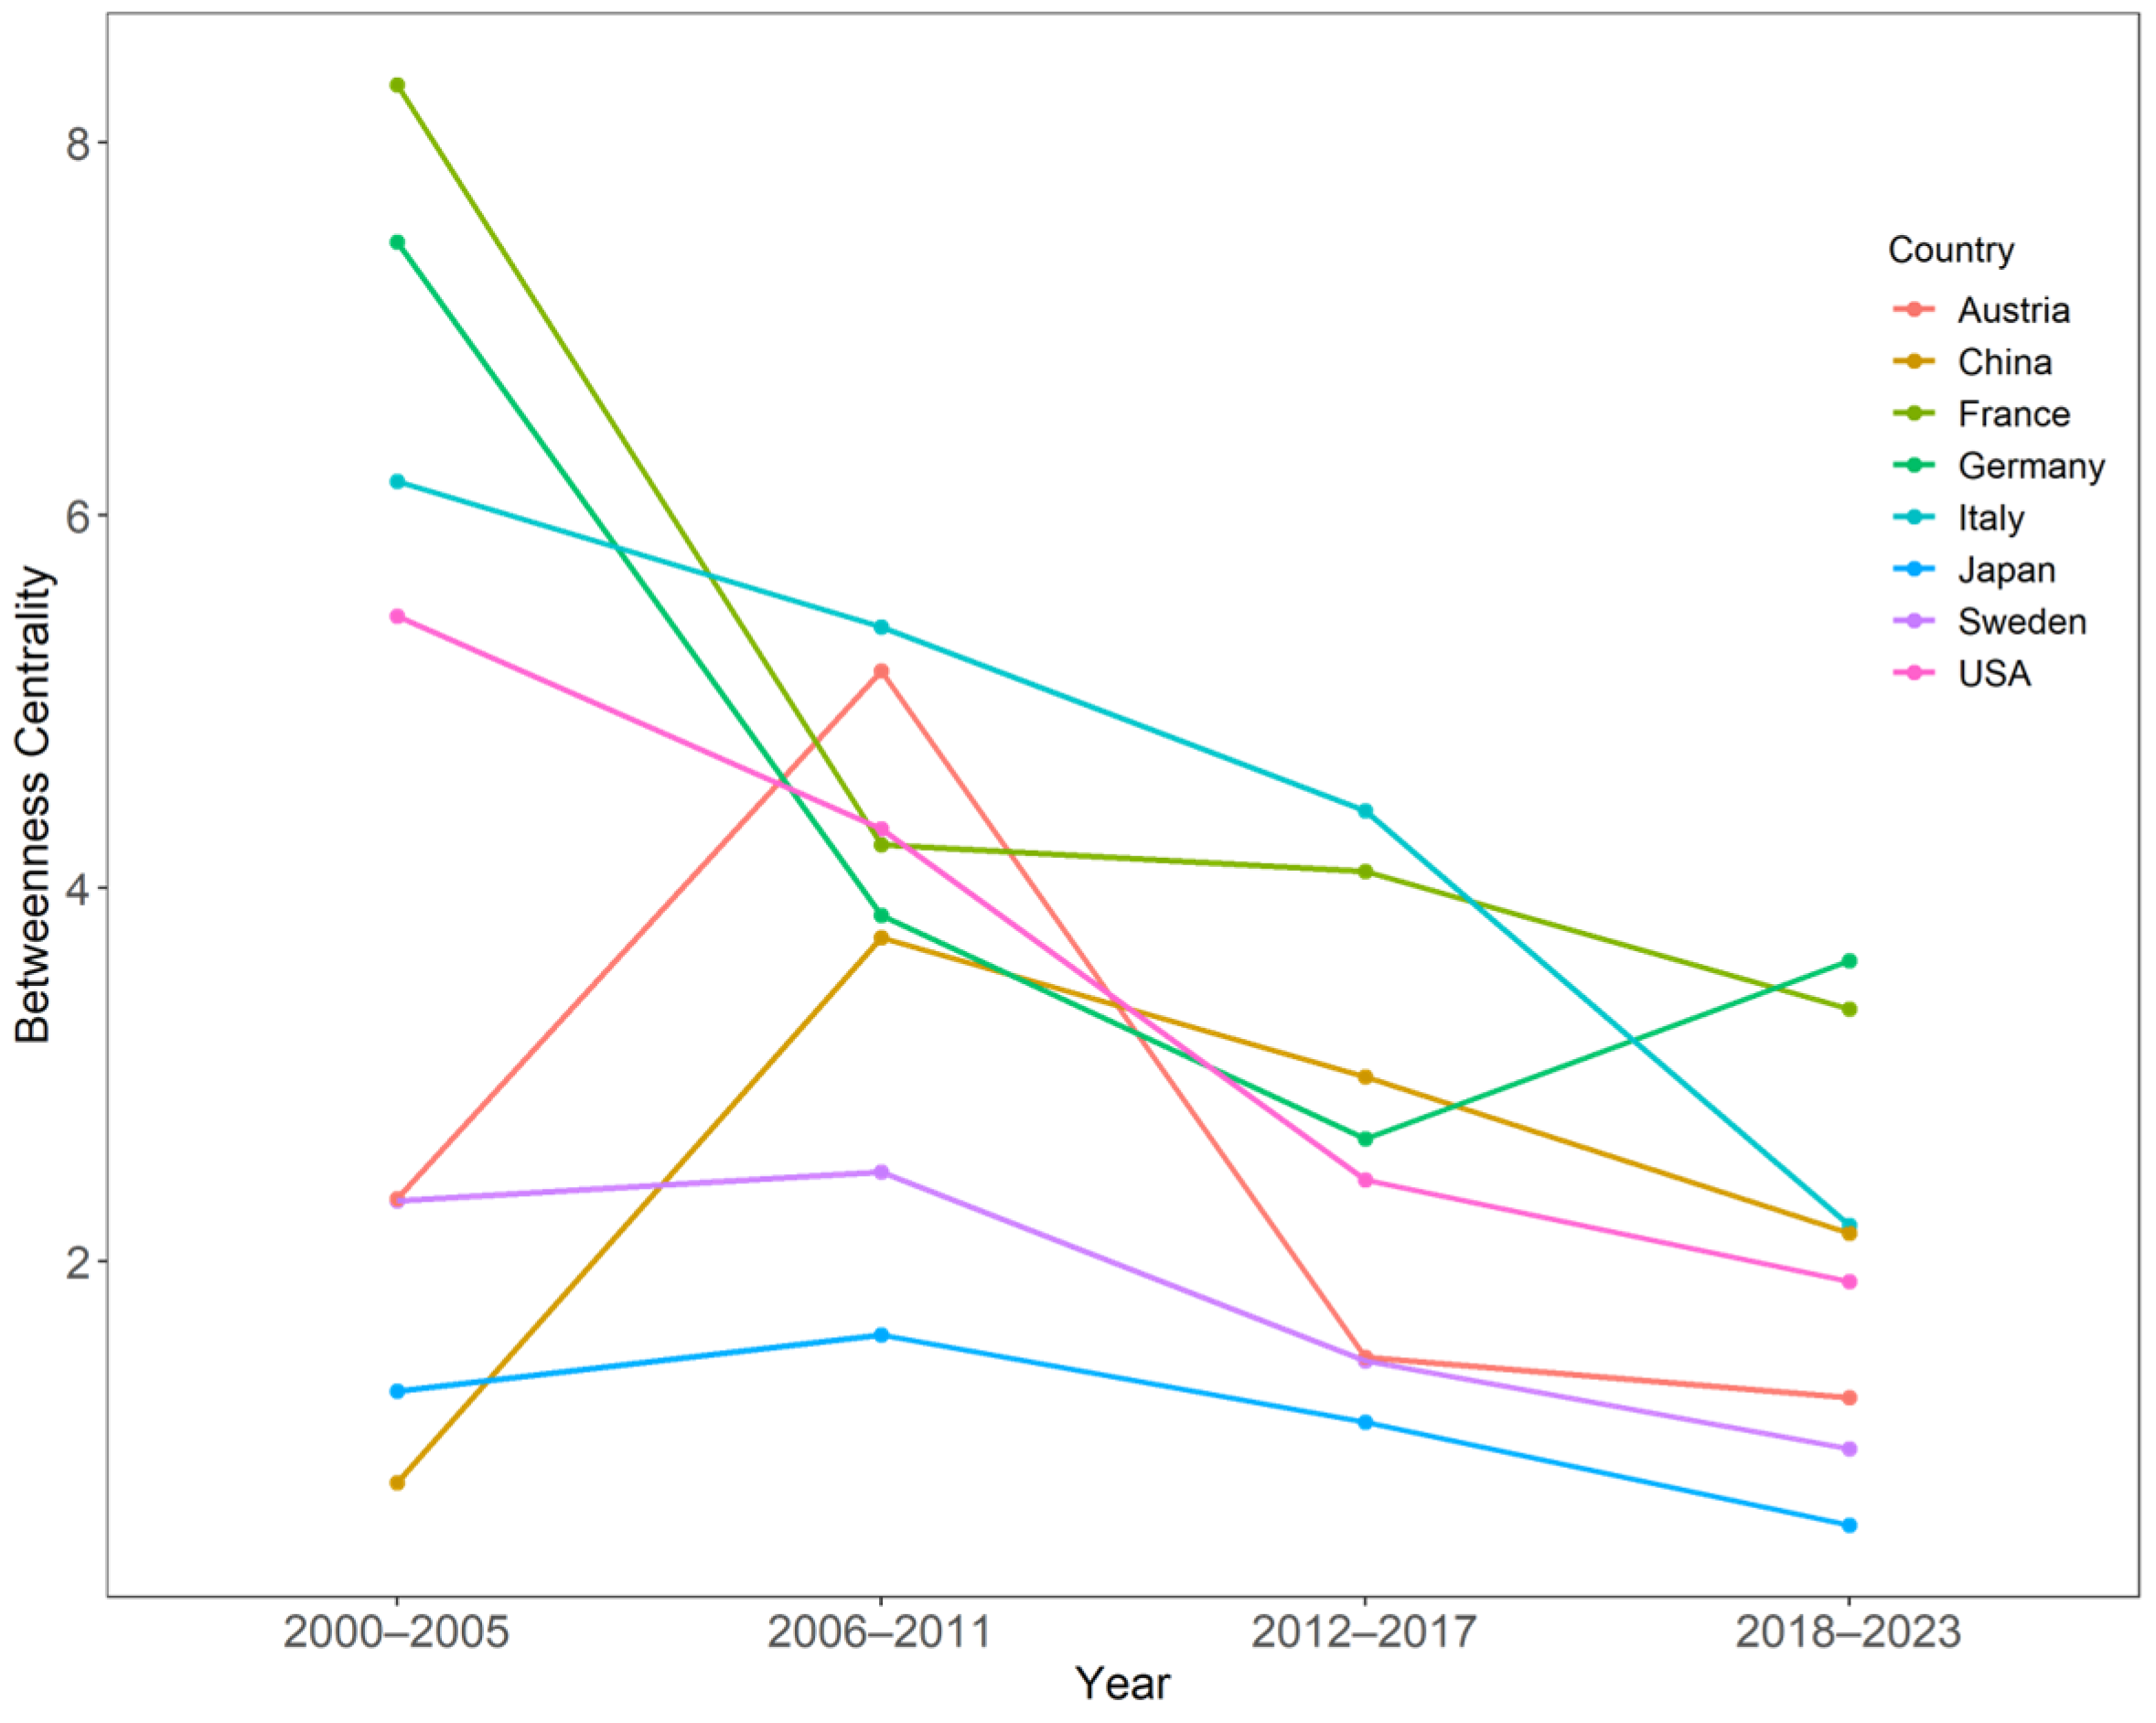
On the basis of structural hole theory, China’s strategic position in the GIRTN and its evolutionary characteristics can be analyzed in depth through the betweenness centrality index [
50]. The results of the study indicate that, against the backdrop of the decline in the overall betweenness centrality of important trading countries, China’s betweenness centrality shows a significant change in stages characterized by first rising and then falling (
Figure 12). In the initial stage (2000–2005), China’s centrality of betweenness was at a low level (0.081), which is mainly attributable to its limited total industrial robot exports and insufficient trade network connectivity, making it difficult for China to play a significant bridging role. This growth pattern peaked at 3.736 in the second stage (2006–2011), indicating a significant increase in China’s bridging role in the GIRTN. However, in the third and fourth stages (2012–2024), there was a moderate pullback in China’s betweenness centrality, which may stem from the diversification of the network structure as a result of increased trade activities in emerging economies. China’s ranking is improving in a stage where betweenness centrality is generally decreasing, suggesting that China’s bridging role is still improving.
The situation between Japan and China presents a paradox: Japan has a high market share (concentration index > 3) but low intermediary control ability (betweenness centrality < 2), which is known as the “high industry concentration-high export concentration-low intermediary control” phenomenon; China, in contrast, is not in a leading market position (concentration index < 1), yet it possesses greater intermediary control ability than Japan. The difference in HHI between China and Japan can partially explain this phenomenon. Japan’s HHI has been high for a long time, while China’s export structure is more diversified. This phenomenon indicates Japan’s over-reliance on specific trade paths, failing to secure a favourable position in the trade network by obtaining a large market share, which may make Japan more vulnerable in the face of shocks [
51]. However, in the face of an increasingly complex international trade environment, China needs to further optimize the structure of its trade network and balance the relationship between concentration and diversification to maintain and enhance its intermediary control capacity.
7. Conclusions
Based on complex network theory, this study constructs a four-stage global industrial robot trade network (GIRTN) from 2000 to 2023, comprehensively applies a variety of topology indicators and combines them with visualization tools, systematically analyzes the evolutionary characteristics of the network at three levels, namely, the macro, meso, and micro levels, and, at the same time, comprehensively assesses China’s competitiveness in the industrial robot market using a multidimensional evaluation index system. This study draws the following main conclusions:
(1) Trade imbalance gradually moderates.
The global industrial robot trade shows a significantly imbalanced pattern, with 13% of the leading countries occupying more than 80% of the export market share; traditional industrial powerhouses such as Japan, Germany, and France have long dominated. However, this imbalanced structure gradually moderated during the period under examination, mainly originating from the rapid development of emerging economies such as China, South Korea, and Singapore. Through technological innovation and industrial upgrading, these countries have gradually eroded the market share of the traditional exporting powers and promoted the diversification of the global trade pattern.
(2) The GIRTN is characterized by a “small world” and weak reciprocity.
The GIRTN exhibits the classic characteristics of a “small-world” network, with short average paths and high clustering coefficients. Despite the increasing density of global trade links, trade intensity still displays a clear core–periphery structure. Western Europe, Southeast Asia, and North America are the major trading regions. Among these regions, the reciprocity among Western European countries is the most prominent, with two-way trade relationships established earlier and then stabilizing. Moreover, the community structure of the trade network has gradually evolved, shrinking from seven to five communities. The spatial agglomeration characteristics of these communities have also weakened over time, reflecting an integration trend in the GIRTN.
(3) The GIRTN is dominated by hub nodes and marginalization nodes.
The nodes in the GIRTN can be divided into four types: hub nodes, whose core degree is high and whose out-degree centrality is significantly larger than the in-degree centrality, representing countries such as Japan, Germany, and other traditional industrial powerhouses; aggregation nodes, whose in-degree centrality is significantly higher than the out-degree centrality, reflecting that the demand for industrial robots is much greater than the supply capacity, with typical countries such as the United Arab Emirates, Chile, and Vietnam; marginalization nodes with lower network connectivity and a higher in-degree centrality than out-degree centrality, showing stronger import dependence; and propagation nodes, which are connected to multiple countries through exports, with strong export capacity but limited import demand. South Korea, India, and Poland have similar movement directions in the quadrant to China, so the policy designs of these countries can be referenced.
(4) China’s competitiveness is gradually rising and shows a positive development trend.
China’s position and competitiveness in the GIRTN have significantly improved, and China has even surpassed traditional industrialized countries. This fact was demonstrated by the continuous expansion of its export scale, steady rise in world rankings, the significant improvement in product competitiveness and quality, the increasing diversification of its trading partners, and the improvement in its intermediary control ability. Based on the current development trend, China is expected to further enhance its central position in the GIRTN in the future. China has achieved a steady increase in market share while maintaining a healthy export structure during its development process, which can serve as a reference for countries with less developed but growing industrial robot industries, such as South Korea, India, and Vietnam.
8. Theoretical Contributions and Recommendations
8.1. Theoretical Contributions
1. This paper updates the latest trade data based on the research of Li et al., revealing new changes in the GIRTN in terms of regional distribution, trade flow, and key nodes [
25]. Meanwhile, this paper visually reveals the evolutionary characteristics of the GIRTN through a trade flow map, community distribution map, and node quadrant map, enriching research on the industrial robotics industry.
2. This paper constructs a multilevel analysis framework at the whole, local, and node levels, which overcomes the limitations of single-level analysis. This integration method can reflect the dynamic characteristics of the GIRTN more comprehensively and provide a scientific decision-making basis for industrial policy-makers.
3. This paper combines complex network analysis with research on China’s trade position in the GIRTN, realizing the organic combination of complex network theory and policy practice and overcoming the regional limitations of established research [
26]. On the one hand, the complex network analysis method provides a powerful tool for revealing the dynamic evolution of China’s trade position in the GIRTN. On the other hand, the policy, practice, and development path of China’s industrial robotics industry further validate the scientific soundness and applicability of the theory in the field of international trade.
8.2. Recommendations
Industrial policies are crucial for guiding the development of the industrial robotics industry. Countries should promote the introduction and diffusion of advanced technologies through import subsidies and other measures while strengthening intellectual property protection and incentivizing local enterprises to research and develop innovations. For countries in the catching-up stage, deepening their technical cooperation and trade is key. Although China’s industrial robot exports have grown significantly, they are still not at the core of the global trade network. To overcome this bottleneck, China should deepen its regional trade cooperation, accelerate the upgrading of its industrial structure, and build diversified trade partnerships to enhance its position in the global value chain and the risk-resistant capacity of the trade network and to make the leap from the periphery to the core.
9. Research Limitations and Prospects
First, this study focuses only on the evolutionary characteristics of the topological structure of the GIRTN and fails to systematically deconstruct the transmission mechanism of multiple complex factors in network dynamics. It is necessary for subsequent studies to construct a composite analytical and quantitative analysis framework that integrates econometric models and complex network analysis and to reveal the evolutionary law of trade networks from endogenous dynamics and exogenous drive through QAP regression analysis and stochastic actor-oriented modelling.
Second, in terms of time series processing, this study adopts a four-stage discretization analysis method. This method can effectively capture the macro-evolutionary trend but may result in a loss of information about sudden structural changes at specific points in time. Subsequent studies need to establish a continuous-time network model and apply a time-indexed random graph model or a dynamic community detection algorithm to accurately characterize the time series evolution of the network microstructure.
Finally, this study did not apply a global value chain and lacks an exploration of correlations among the spatial distribution of the industrial chain, domestic competition environment, and a country’s position. Future research should establish a two-tier coupling analysis framework of the industrial chain and trade networks. Such a framework could accurately define countries’ positions in the industry chain to provide structured decision support for the formulation of industrial policies.


