Abstract
Pakistan’s banking sector faces a critical juncture as rising competition intersects with uneven efficiency, jeopardizing financial stability. This study employs a two-stage empirical framework: (1) evaluating cost-efficiency (CE) evolution via a novel stochastic frontier analysis (SFA) framework incorporating desirable and undesirable outputs (e.g., nonperforming loans) and (2) assessing competition’s impact using a novel multi-product Lerner index across loan, deposit, and asset markets, analyzed via a two-step dynamic panel data system generalized method of moments. The first stage reveals an average CE of 81%, with significant ownership-based disparities. The second stage shows that market power enhances CE overall, supporting the banking-specificity hypothesis, suggesting that regulators balance competition with operational scale benefits. However, market power exhibits duality such as elevating CE in high-efficiency quartile banks but reducing it in low-efficiency quartile ones, confirming the efficient structure hypothesis. This highlights the need for policies promoting efficiency-driven consolidation and addressing structural bottlenecks in underperforming banks. Bank-specific and macroeconomic factors also significantly influence CE. The findings offer a policy roadmap to cultivate a competitive, efficient banking ecosystem, fostering sustainable economic growth.
1. Introduction
The banking sector in Pakistan, a cornerstone of economic stability and growth, plays a pivotal role in resource mobilization and financial intermediation [1]. Despite its systemic importance, inefficiencies in the sector remain a critical concern, with cost-efficiency (CE) central to sustaining competitiveness and economic resilience [2,3,4,5]. While the global banking literature has extensively examined CE in developed economies [6,7,8,9,10,11], Pakistan’s banking sector remains underexplored, with limited studies focusing on technical efficiency [12,13,14] or productivity [15,16], leaving a glaring absence of empirical research on CE in the literature on Pakistan’s banking. It is critical to explore CE in Pakistan’s banking industry for several reasons. To improve competitiveness, CE analyses allow us to identify untapped markets with inefficient capital allocation [17], optimize pricing mechanisms [18], and augment customer-oriented benefits such as reduced rates [19]. CE analyses also facilitate for benchmarking against counterparts, which fosters strategic growth and the uptake of best practices, equipping policymakers and executives with practical insight to address macro-microeconomic performance disparities and enhance sector-wide sustainability [20]. However, previous studies [3,20,21,22,23] on banking CE have often exhibited a critical limitation by neglecting undesirable outputs, particularly non-performing loans (NPLs). This oversight is critical: NPLs directly reflect loan portfolio risks, compliance gaps, and resource misallocation, and their exclusion bias efficiency assessments obscures regulatory compliance and impedes cross-bank comparisons [24,25]. For CE analyses to yield valid and policy-relevant insights, it is essential to account for NPLs as undesirable outputs. These methodological gaps in CE analysis are particularly consequential in Pakistan’s post-deregulation banking sector, where market concentration and unresolved debates about competition’s impact on efficiency necessitate a holistic evaluation of risk, regulatory compliance, and performance. Pakistan’s banking landscape has undergone transformative deregulation since the 1990s, marked by privatization and market liberalization to enhance competition [26,27]. As a result of the significant deregulation, the State Bank of Pakistan (SBP) recently devised Vision 2020, which comprises six crucial strategic goals (SGs)1. These SGs include improving the efficiency of banking operations, safeguarding the country’s financial stability, and nurturing a market that is more competitive2. The SBP has taken several measures to promote competition across the banking industry in Pakistan in order to promote sustainable economic growth within the country. While deregulation aimed to foster efficiency, stability, and competition, the sector remains concentrated, with three major banks dominating market shares (see Appendix A, Figure A1, and Table A1), raising critical concerns about allocative inefficiencies, constrained competitive dynamics, and the long-term sustainability of sectoral growth [28]. The competition–efficiency nexus remains contentious globally, with competing hypotheses: the structural conduct performance hypothesis (SCPH) and quiet life hypothesis (QLH) posit that lower competition reduces efficiency [29,30], while the efficient structure (ESH) and banking specificity hypothesis (BSH) argue that market power enhances efficiency [9,31]. Empirical evidence remains divided, with studies [3,7,9,11,17,22,32] supporting a positive nexus, which is consistent with the ESH and BSH. However, some studies [2,19,21,33,34,35,36,37] revealed a negative linkage, confirming that a lower level of competition within the banking industry leads to lower efficiency, thereby supporting the ideas of the SCPH and QLH and further complicating policy design.
This study addresses critical gaps in the existing literature. First, several stochastic frontier analysis (SFA)-based CE studies [3,20,21,22,23] overlook undesirable outputs such as NPLs, resulting in skewed findings and misleading policy implications. Second, there is a paucity of research on the relationship between competition and CE in Pakistan. Some studies [38,39] are based on the Herfindahl–Hirschman Index, which is an overly simplistic competition metric and has been criticized in the banking literature for not adequately capturing the industry’s complex competitive dynamics. Third, global studies generally constrain competition assessment to single product-specific market segments, such as the asset market [3,40] and loan market [9,41]; fewer studies [7,21] supplemented these with alternative competition metrics, thereby failing to provide a comprehensive perspective on the multifaceted nature of competition across multi-product markets and neglecting spillover effects across interconnected product markets. Banks compete across a broad spectrum of product market segments; therefore, multi-product market competition analyses are highly significant since the effects of competition in one market segment can have a spillover effect on the decisions made regarding prices and efficiency in another product market segment. To bridge these gaps, this research investigates how Pakistan’s banking deregulation, including reforms like the State Bank of Pakistan’s (SBP) Strategic Goals (SGs), has influenced competition and CE while exploring the interplay between competition and CE through the following research question:
Research Question: How has the deregulation of Pakistan’s banking industry influenced competition and CE, and to what extent does competition affect the sector’s CE?
In response to the aforementioned research question, a two-stage empirical framework was developed. In the first stage, an SFA was employed to estimate CE, incorporating both desirable outputs (total loans, deposits, and other earning assets) and undesirable outputs (NPLs) to control for credit risk. The analysis revealed an aggregate industry CE of 81%, with marked disparities across ownership structures: private sector banks (PSBs) exhibited superior efficiency (83%) relative to state-controlled banks (SCBs) (78%), a 5.3 percentage-point gap attributable to divergent governance frameworks, risk appetites, and operational practices. In the second stage, competition was evaluated using the Lerner index (LI) of market power across three product markets (loans, deposits, assets) within a multi-product framework. A two-step dynamic panel data system generalized method of moments (DPDSYS-GMM) estimator was implemented to address endogeneity and dynamic biases in modeling the competition–CE relationship. Results indicate that heightened market power in loan, deposit, and asset markets correlates positively with CE, aligning with the BSH: pricing power enables banks to internalize risk-adjusted returns, optimize resource allocation, and mitigate inefficiencies. Furthermore, high-efficiency quartile banks exhibited amplified CE gains when interacting with market power, consistent with the ESH, wherein scale economies and technological advantages allow dominant institutions to consolidate market share. Conversely, low-efficiency quartile banks experienced CE erosion under competitive pressures, reflecting the destabilizing effects of market discipline on underperforming entities. These findings suggest a dual dynamic of competitive polarization: efficiency leaders leverage market dominance to reinforce performance, while laggards face exacerbated vulnerabilities, driving systemic divergence.
Overall, this study advances the banking efficiency and competition literature through three pivotal innovations:
First, we introduce a methodological innovation by integrating NPLs as undesirable (negative) outputs into the SFA framework for CE estimation. This rectifies a significant limitation in prior studies that overlooked credit risk exposure, enabling a more comprehensive, risk-adjusted evaluation of banking CE.
Second, we pioneer a multi-market analysis of competition by simultaneously evaluating three interconnected banking segments such as loan, deposit, and asset markets within a unified LI framework. This multi-product approach uniquely captures cross-market interactions and spillover effects, revealing how competitive pressures in one segment propagate to influence pricing strategies and efficiency outcomes across others.
Third, we uncover a structural bifurcation in competitive dynamics: high-efficiency banks reinforce their CE advantages through market power (supporting the ESH), whereas low-efficiency institutions experience destabilization under heightened competition. This dual dynamic reconciles the traditional dichotomy between the BSH and ESH while exposing systemic divergence, a critical yet overlooked consequence of financial deregulation.
In a nutshell, our findings offer regulators and bank executives actionable strategies to optimize resource allocation, mitigate systemic risks, and align with SBP’s Vision 2020 goals of fostering a competitive, efficient, and stable financial ecosystem.
The subsequent sections of this research are as follows: Section 2: Literature Review and Hypothesis Development; Section 3: Research Data and Methodology; Section 4: Empirical Results and Discussion; Section 5: Conclusion; Section 6: Policy Recommendations; and Section 7: Research Limitations and Future Research Work.
2. Literature Review and Hypothesis Development
This section reviews theoretical frameworks and empirical evidence exploring the relationship between banking competition and efficiency. It outlines four key hypotheses such as the QLH, SCPH, ESH, and BSH that offer competing explanations for how market power influences efficiency. Conflicting empirical findings are synthesized, highlighting studies supporting both negative (QLH/SCPH) and positive (BSH/ESH) associations between competition and efficiency. Building on this debate, hypotheses are formulated to test whether Pakistan’s banking sector aligns with theories linking market power to efficiency gains or whether efficiency drives market power. The discussion sets the stage for analyzing these dynamics in a specific emerging market context.
2.1. Theoretical Relationship Between Banking Competition and Efficiency
There are four broadly recognized hypotheses that can be explored to illustrate the theoretical linkage between competition and efficiency. Firstly, the QLH introduced by Hicks [30] asserts that, if competition is minimal, businesses have more control over the industry, and management becomes less energized to decrease costs in the pursuit of more profits. As a result of this negligent administration, businesses that occupy a larger share of the industry are less inclined to optimize their profits and, thus, are less efficient. For instance, higher credit revenues and lower deposit costs counteract potential cost increases; this could make banking managers less incentivized to augment efficiency as opposed to a competitive industry. Nonetheless, fostering competition may alleviate this problem, and this will push banking executives to improve their efficiency.
Secondly, the SCPH proposed by Bain [42] stresses that the activities and performance of businesses are influenced by the industry dynamics and higher market power (i.e., concentration) in their respective industries. If there is less competition or high concentration in an industry, businesses might be less efficient since they have greater leverage over the industry and are less likely to be driven out of business. Thus, in accordance with the SCPH, businesses competing within a highly concentrated industry are less likely to perform more efficiently.
Thirdly, in particular, Demsetz [31] introduced the ESH and postulated a causal reversed nexus between competition and efficiency, or, in other words, competition deteriorates efficiency. The ESH opposed the implied conceptual perspective of the SCPH. The ESH perspective holds that performance is the primary driver of structure. In particular, when the industry share of more efficient businesses improves, the industry share of less efficient businesses declines, leading to a higher degree of concentration. If viewed from this standpoint, higher industry concentration would enable a more efficient banking sector. As a matter of fact, Goldberg and Rai [43] also confirmed that more cost-efficient banks boost their business at the expense of their less cost-efficient opponents, resulting in a higher level of power within the industry. Thus, the ESH holds that low competition improves business efficiency. However, the SCPH, QLH, and ESH are not peculiar to the banking industry.
Fourthly, the BSH, which is more relevant to the banking sector, is based on the study of Pruteanu-Podpiera, Weill [9], who posit that higher banking competition lowers CE due to data asymmetries. Credit data asymmetries may promote a banking specificity-type industry structure [44]. Banking firms and policymakers are compelled to track clients and leverage economies of scale to mitigate data asymmetries. Banking firms may access client data at lower costs by cultivating long-term relationships. Strong competition within the banking industry might hinder the ability of bankers to retain long-term commercial relationships. For instance, if competition in the banking industry increases, it may induce clients to switch banks more often. Similarly, accomplishing economies of scale and serving clients for a shorter period could be more costly if the banking industry has more competitors for the same pool of clients, reducing economies of scale and raising operational costs; hence, higher competition undermines the CE of banking firms.
2.2. Empirical Relationship Between Banking Competition and Efficiency
The empirical paradox of the relationship between banking competition and efficiency is well observed in the scarce empirical literature, which mainly focuses on the banking systems of advanced economies. Fewer prior studies supported the QLH, while most of the others supported the BSH and ESH. For this reason, we organize the prior literature on the competition–efficiency nexus based on two paradoxical findings: (i) a positive association and (ii) a negative association.
The research carried out by the studies of [2,19,21,33,34,35,36,37] has shown that competition is negatively associated with efficiency, hence confirming the validity of the QLH or SCPH. From 1986 to 1989, Molyneux and Forbes [37] analyzed the banking sector in Europe. In broad terms, the conclusions corroborate the SCPH, and their insights demonstrate that a higher concentration facilitates anti-competitive operations and networking, thus exerting a negative influence on banking performance. Berger and Hannan [19] discovered an inverse relationship between the efficiency of the banks in the USA and the level of market concentration, which represents competition evaluated by the Herfindahl–Hirschman Index. They assert that less competition drives suboptimal managerial practices, which results in inefficiency. Similarly, Delis and Tsionas [2] showed that the presence of market power (less competition) has negative impacts on the efficiency of the banks on the largest dataset in both the U.S. and EU. markets, thus verifying the validity of the QLH.
In estimating the influence of banking competition on CE ratings, Coccorese and Pellecchia [34] pursued a two-step approach employing datasets on the Italian banking sector from 1992 to 2007. They controlled for additional factors and used the LI of market power to examine competition. According to the study’s results, the LI of market power and CE have a negative relationship, adding confidence to the QLH. Nonetheless, the degree of influence of market power on efficiency was not particularly striking. By examining the Spanish banking industry—which has been through major changes in recent years—banks with vastly different ownership structures and operating models [35] examine the association between competition (or market power) and three separate efficiency measures (or technical cost and allocative). The results illustrate that this association varies with business competitiveness, efficiency indicator, and banking firm type, revealing that the QLH might be pertinent to a specific group of banks. Asongu and Odhiambo [33] examined the competition–efficiency nexus in African banking using a sample of 162 banking entities from 42 economies between 2001 and 2011. Researchers used the LI in the loan market to assess competition and 2SLS in the second stage to investigate its impact on banking efficiency. The results broadly validated the QLH, although the sub-sample with a LI lower than the median propels it. From 2004 to 2016, Eggoh, Dannon [36] examined the connection between market power and the cost-effectiveness of 63 West African Economic and Monetary Union banks. The findings substantiate the QLH by demonstrating that growing market power has a detrimental effect on banking efficiency. However, interestingly, nonlinear analysis articulates that this favorably affects banks’ CE above certain thresholds of market power, establishing the ESH. According to the findings of El Moussawi and Mansour [21], CE had a negative relationship with competition (as measured by LI of market power)3 in the MENA region from 1999 to 2018, supporting the QLH.
However, several prior studies from Europe [7,9,11,41], the USA [17,22], South Asia [45,46], Africa [47], and worldwide [3,40] revealed a positive association between banking competition (i.e., high market power) and efficiency, justifying the BSH, ESH, or both. For instance, Weill [7] examined the competition and CE relationship in 12 European banking industries between 1994 and 1999. They modeled banking competition by applying the Rosse–Panzar H-statistic. Unlike LI, the Rosse–Panzar H-statistic directly measures competition, and the results suggest that competition adversely affects CE. These findings support the ESH and BSH, which posit that lower competition, or in other words, high market power fosters higher efficiency.
In five EU economies, Casu and Girardone [11] examined banking competition and the CE link. Banking CE was assessed using the SFA, DEA, and competition via the LI. A Granger causality test unraveled that market power positively influences CE. The reverse Granger causal relationship between banking CE and competitiveness is lower, which confirms the robustness of the BSH and provides weaker evidence for the ESH. Banking efficiency and competition association were studied for fifteen European Union economies between 1993 and 2002 by Maudos and De Guevara [41], using the LI to estimate market power and stochastic frontier analysis for banking CE. The findings demonstrated that market power is positively associated with CE and nullified the QLH. The association between competition and CE in US commercial banking was shown by Koetter, Kolari [17], using the QLH as a baseline claim. The study assessed U.S. commercial banking competition via the LI. The study’s results show that CE improves with market power (e.g., less competition), reject the practicality of a QLH, and favor the ESH and BSH. Likewise, Pruteanu-Podpiera, Weill [9] investigated quarterly Czech bank time series data from 1994 to 2005 to assess how banking competition affects co-CE. The LI analyzed Czech bank loan competitiveness. A Granger causality test revealed that competition and CE have a negative association, refuting the QLH while backing the ESH and BSH.
Furthermore, recently, Yin [3] focused on the association between banking competition and efficiency in 148 countries from 1995 to 2015. In contrast to the QLH and the support of the BSH, the analysis of banking competition using the LI of asset market power reveals that it enhances CE. Likewise, the findings of Bayeh, Bitar [22] reveal that, between 2001 and 2019, the CE of US banks was positively affected by competition, as examined by the LI of market power in the deposit market, which coincides with the BSH. In addition, Duc-Nguyen, Mishra [40] carried out research on banking systems in 24 emerging economies between 2004 and 2014 to investigate the association between competition and efficiency. Their findings reveal that market power generally promotes efficiency, thus reinforcing the BSH. Nevertheless, the effect of market power fluctuates significantly, and it is more obvious in countries featuring well-established banking systems, tighter capital thresholds, strong market oversight, a dearth of branch networks, and inadequate access to credit data.
The BSH states that weak competition characterized by higher market power in the banking industry is likely to result in CE. It suggests that lower competition, which is referred to as higher market power, in loan, deposit, as well as asset markets has a favorable effect on CE. However, the QLH posits that, in a less competitive financial market landscape, without pressure from other peers, the banks avoid cost-cutting and efficiency enhancement measures, which leads to high operational costs and lower efficiency. Firstly, Koetter, Kolari [17] argued that banks focus on lowering interest rates or relaxing credit restrictions to tempt borrowers in a competitive loan market. This results in a high level of data asymmetry, whereby borrowers are likely to undervalue their degree of risk, thus resulting in elevated inefficiency levels and loan defaults for banks [21]. However, the BSH argues that high market power in the loan market gives banks the flexibility to set higher interest rates, which helps mitigate the data asymmetry and imposes rigorous lending standards [9]. This results in lower loan defaults and enhanced risk control, eventually leading to a reduction in operating costs and an improvement in CE [41]. Contrarily, the lack of pressure to bring down costs in banks results in higher administrative expenses and interest charges in the loan market. Innovation and process improvements, which are vital for the accurate pricing of loans, are broadly overlooked, and, thus, based on the QLH, less competition (i.e., high market power) adversely influences the efficiency [33].
Secondly, intense competition in the deposit market pushes banks to provide inflated interest rates or costly marketing endeavors, thus reducing their interest revenue and overall profit margins. It may become even more challenging and costly for banks to manage liquidity when deposit volumes are subject to seasonal variations. Yet, following BSH high market power in the deposit market brings stability and a high level of predictability in terms of financing sources. As a result, banks might be positioned to reduce costs by enhancing their liquidity control along with favorable interest rate deals, thus improving their overall CE [22]. On the other hand, based on the QLH, reduced competition (i.e., high market power) drives banks to offer less interest to depositors in the deposit market, along with higher operational costs [35] borne by poor returns to depositors, as opposed to investing in customer service or technology, which leads to lower CE.
Thirdly, in a highly competitive asset market, banks interact with the demand from clients for rapid short-term returns, which might lead them to focus on projects with higher instantaneous return and, at the same time, might involve higher risks. This might lead to higher unpredictability and a higher probability of losses in the long run, which, in turn, might be reflected in the higher CE. However, the BSH contends that high market power in the asset market empowers banks to secure deals that are even more productive for procuring or monitoring assets by their preferable conditions and terms [40]. This may lead to a rise in general asset return and enhance CE [3]. However, the QLH argues that, as a result of low competition in the asset market, banks will not be driven to optimize their investment strategies, resulting in higher management fees and lower returns for their clients. Inadequate competition in the market poses inefficiencies and less innovation in investment and risk management strategies [34,36]. Thus, in light of this, we hypothesize as follows:
H1a.
High market power in loan, deposit, and asset markets positively influences the cost-efficiency of Pakistan’s banking industry, supporting the BSH.
The ESH in the banking sector implies that the market power of banks determines the market structure, which is an outcome of the higher efficiency levels of specific types of banks. However, in essence, banks that exhibit higher efficiency levels, more effective governance, and robust cost-reduction strategies can capture more market power at the expense of their less efficient counterparts [31,43]. In this regard, the loan market’s efficient structure (ES) enables highly efficient banks to leverage their market power to benefit from economies of scale and scope. This results in reduced per-unit costs and a lower likelihood of loan defaults in contrast to less efficient peers [9,41], which leads to higher efficiency. Antithetically, high market power and market concentration following the SCPH would result in certain conduct by the firm, which would then affect its performance. Hence, banks in less competitive markets would depict complacency and operational slack with higher costs in contrast to firms in more competitive environments. Higher market power in the loan market would indicate less competitive pressure on the banks, which would, in turn, allow them to charge high loan rates and high margins without necessarily affecting the structure of operational efficiency [23]. In other words, banks with high market power may not consequently be motivated to slash costs or increase efficiency since they can revert to the market power that they possess to be profitable [39], whereas the ES in the deposit market gives highly efficient banks the power to pay lower deposit rates to savers and charge higher lending rates to borrowers, thereby enhancing their overall profitability and efficiency as opposed to their less efficient counterparts [22]. In contrast, higher market power in the deposit market would mean less competitive pressure and would, in turn, accord the banks an opportunity to pay lower interest rates on deposits without the fear of losing customers to competitors [23]. Consequently, this would lessen the competitive pressure on a bank to operate efficiently and cut expenses. Therefore, we expect banks to become complacent in deploying cost-saving measures or adopting efficiency-enhancing technologies. Thus, in accordance with the SCPH, non-competitive structures in the deposit market breed behaviors that adversely influence banks’ CE. Moreover, the banking industry’s ES in the asset market allows highly efficient banks to use their market power for asset portfolio diversification [40], thereby decreasing overall risk, maximizing steady profits at the expense of less efficient rivals, and, thus, enhancing CE. Conversely, higher market power in the asset market would indicate that banks obtain more significant pricing and share control over financial assets. The better position is related to less competitive pressure to be efficiently operated since banks with immense market power will remain profitable regardless of the level of costs, although through high margins [37]. Therefore, the banks do not have pressure to have urgency in streamlining the operations or making investments in technologies that enhance efficiency, which results in higher operational costs. The operational slack and inefficiency implications of that are broadly harmonious with the SCPH, which suggests that a less competitive market structure fosters conduct counterproductive to CE. In light of this, we hypothesize the following:
H1b.
High-efficient banks capture higher market power in loan, deposit, and asset markets at the expense of low-efficient counterparts, which positively influences the CE of Pakistan’s banking industry, supporting the ESH.
3. Research Data and Methodology
This section outlines the data sources, methodology, and analytical framework for studying banking competition and CE in Pakistan. It details the panel dataset, explains the use of stochastic frontier analysis (SFA) to measure CE, and describes the LI framework to assess competition across loans, deposits, and assets. Control variables (bank-specific and macroeconomic factors) and the two-step dynamic panel data system GMM model are introduced to address endogeneity and analyze relationships.
3.1. Research Data
Our study utilizes a balanced panel dataset methodically retrieved from the State Bank of Pakistan’s (SBP) official publications4. The dataset comprises a representative sample of 29 banking firms spanning the period 2006–2020, resulting in a total of 435 bank-year observations. This sample collectively accounts for approximately 90% of the total assets within Pakistan’s banking industry, ensuring a comprehensive representation of the sector’s dynamics. The dataset encapsulates a diverse spectrum of banking institutions, including state-controlled banks (SCBs), private sector banks (PSBs), special-purpose banks (SPBs), and Islamic banks (TBs). To maintain data integrity and completeness, any missing values were systematically replenished using the respective banks’ audited annual financial statements. All financial data are denominated in millions of Pakistani rupees (PKR). Furthermore, macroeconomic indicators such as the annual interest rate, inflation rate, and GDP growth rate were sourced from the World Bank’s global economic database5. This integration of firm-level and macroeconomic data provides a robust foundation for analyzing banking competition and CE nexus within Pakistan’s financial landscape.
3.2. First-Stage Research Methodology: Measurement of Banking CE
Banking CE can be defined as the distance from the optimal best-cost frontier to the cost per unit of a bank’s identical basket of outputs. Studies on banking often use frontier models to evaluate the CE [6]. In the mainstream banking literature, there are two main frontier approaches: parametric, such as stochastic frontier analysis (SFA), and nonparametric, such as data envelopment analysis (DEA). SFA outperforms DEA as it isolates exogenous shocks and assesses errors to prevent overestimating inefficiency by analyzing deviations from the best practice frontier while removing random error. SFA is a more robust and consistent estimator for panel data; therefore, in this research, we have employed SFA to assess the CE of Pakistani banks in line with the study of [48]. Moreover, to accurately represent input–output interactions, SFA requires an appropriate functional form since the banking sector is heavily reliant on service provision [24]. Thus, defining a best-fit production function for true banking activities is challenging. For interest and fees, banks provide a range of products and services [3]. The complex banking operations make the trans-log cost functional form attractive. Recognizing the interconnectedness of banking services and products allows for more flexibility in studying multi-input and multi-output interactions.
Two arguments justify the trans-log cost functional form (TLCFF) over the more restrictive Cobb–Douglas cost functional form (CDCFF). First, unlike the CDCFF, the TLFF is a second-order estimator, allowing nonlinear patterns across inputs and outputs instantaneously. Second, unlike the CDCFF, the TLCFF allows variable returns to scale (VRS). Analyzing banking sector heterogeneity is important since banks of different sizes may have VRS. Thus, we described a trans-log stochastic cost frontier functional form, similar to previous studies. Moreover, efficiency research has three primary approaches for specifying inputs and outputs: the production approach (PA), the intermediation approach (IA), and the value-added approach (VAA). Following the research of [49,50] and other researchers, we preferred VAA as a solution for the input vs. output loan–deposit dilemma, as both PA and IA approach the deposit and loan in unique manners. In this context, we estimated the following trans-log cost frontier:
On the left side of Equation (1), represents the dependent variable where is the total cost of the ith bank at time t, calculated as the sum of interest and non-interest expenses. This expression is measured using the natural logarithm of TC normalized by input labor cost (W1) to impose linear homogeneity in input prices. The model includes four outputs with their logarithmic terms capturing linear output effects. We included three desirable outputs (Y1: total loans, Y2: total deposits, Y3: other earning assets) and one undesirable output (Y4: nonperforming loans, NPLs), in line with Matousek, Rughoo [25]. Prior banking studies indicate that disregarding NPLs as undesirable outputs can result in a significant bias and could inflate efficiency estimates. A bank with lower NPLs might appear to be underperforming if the production process fails to capture both desirable and undesirable outputs. As a practical matter, we account for both desirable and undesirable outputs in assessing Pakistani banks’ CE. Our approach is grounded on earlier studies such as [24,25]; thus, we relinquish academic paradoxes here for succinctness. Quadratic and interaction effects between outputs are modeled through the term , which accounts for nonlinear relationships and interactions in production.
In addition, we modeled three input variables in Equation (1): W1 is the cost of labor, explained as the ratio of wages and salaries to a fixed asset; W2 exhibits cost of physical capital, described as the ratio of operational costs to total assets; and W3 is the cost of borrowed capital, interpreted as the ratio of interest paid on deposits to total deposits. In stochastic frontier studies, TLCFF is a highly consistent technique; however, optimizing it in a multi-input–output condition necessitates analyzing several parameters. Standardizing the total cost and each input cost against one set input cost could fix this issue. Therefore, we standardized the cost frontier trans-log Equation (1) on both sides with the labor cost (W1) as suggested by the studies of [3,6,50] to ensure model homogeneity. The input price ratio includes (physical capital cost relative to labor cost) and (borrowed capital cost relative to labor cost) to reflect cost structure heterogeneity, while their quadratic and cross-product terms capture nonlinear input price effects. Interaction terms between outputs and input prices allow for output-specific cost variations across input prices. Temporal heterogeneity is controlled via , while represents non-negative CE term with truncated normal distribution , and denotes a normally distributed random error term with mean zero and variance i.e., .
3.3. Second-Stage Research Methodology: Measurement of Banking Competition
Traditional examinations of market competition have largely depended on structural measures that involve concentration ratios and the Herfindahl–Hirschman Index (HHI), which is consistent with the traditional empirical industrial organization (TEIO) framework [42]. These measures integrate market structure with competitive intensity, overlooking firm-specific strategic behavior. The new empirical industrial organization’s (NEIO) literature promotes non-structural approaches that measure competitive behavior outright. The Rosse–Panzar H-statistic is extensively used in banking research [7,25]; nevertheless, its industry-level focus limits its applicability for firm-specific analysis. This research leverages the LI to measure bank-specific market strength in three main areas—loans, deposits, and assets—in Pakistan from 2006 to 2020 in line with the studies of [3,9,11,17,22,51,52,53]. The LI, a prominent statistic in modern academia, assesses a bank’s pricing power with respect to marginal cost, facilitating an in-depth analysis of competition. In line with [40], we derived unique Lerner Indices for loans (LILs), deposits (LIDs), and assets (LIAs). The analysis began by estimating a stochastic cost frontier trans-log function (Equation (2)) for each product market (loans, deposits, assets) to derive marginal costs (MC). The trans-log specification incorporates total cost (TC) as the dependent variable, with outputs (total loans, deposits, or assets), input prices (e.g., labor, capital, and funds), and their interactions as independent variables. Year dummies were included to control for temporal heterogeneity, while the error term comprises a stochastic noise component (ϑ) and an inefficiency term (μ). The equations are expressed as follows:
MC was then computed using Equation (3) as the derivative of the cost function with respect to output, scaled by total assets to reflect economies of scale:
Finally, the LI for each bank i in year t is calculated as follows:
where represents the price of the product in a specific market in Equation (4). For assets , price is defined as total net income divided by total assets; for deposits , it is total interest expense over total deposits; and, for loans , it is total interest income divided by total loans. A higher LI indicates greater market power, reflecting a bank’s capacity to set prices above marginal costs. This approach advances upon prior work by enabling product-specific and bank-level competitiveness assessments, circumventing the aggregation bias inherent in structural metrics. By integrating a stochastic frontier framework, we further account for cost inefficiencies, ensuring robust estimates of marginal costs and, consequently, the LI.
3.4. Second-Stage Research Methodology: Measurement of Control Factors
In this study, we additionally introduced bank-specific and macroeconomic control factors. We considered the equity to total asset ratio (EQTTAR). Earlier studies [54,55] showed that EQTTAR positively affects banking efficiency because banking executives are more receptive to keeping their equity buffers high, which safeguards the banks from default risk on interest payments and serves as a buffer for the banks during economic downturns. Meanwhile, a lower EQTTAR signifies less leverage ability and higher risk in banking business activities, which reduces the banking industry’s efficiency. On the other hand, the loan to asset (LTA) ratio reveals a bank’s credit risk and shows a negative relationship between the LTA and banking efficiency [56]. We also took into consideration the cost to income ratio (CTIR) as another proxy to assess the cost management ability of the banking executives. According to Olson and Zoubi [57], there is a negative link between CTIR and the banking efficiency. As a stand-in for the SIZE of the banking firms, we utilized the natural logarithm of total assets as our proxy. Bank SIZE proxy captures the ability of a bank to exploits the economies of scale of its business activities. In their studies, the authors of [3,50,54,55,58] reported that SIZE has a positive influence on bank performance. Furthermore, the inflation rate (INFRATE), interest rate (INTRATE), and gross domestic product growth rate (GDPGR) are crucial economic factors that were incorporated to capture the macroeconomic influence on the banks’ CE, which is well supported by the studies of [3,50,54,55,59].
3.5. Second-Stage Research Methodology: The Impact of Banking Competition on the CE Using Two-Step Dynamic Panel Data System Generalized Method of Moments
To investigate the impact of banking competition on the CE of the Pakistan’s banking industry, we applied a two-step dynamic panel data system generalized method of moments (DPDSYS-GMM) approach. The DPDSYS-GMM estimator offers numerous advantages over traditional fixed effect (FE) and random effect (RE) estimators. First, the DPDSYS-GMM model is appropriate for panel data situations with lagged dependent variables as regressors. Since lagged variables are likely to be correlated with past errors, endogeneity might then be introduced—an issue that is severe for the traditional FE and RE models. The DPDSYS-GMM is superior to the FE and RE models, especially when the estimates are likely to suffer from an endogeneity problem and omitted variable bias. Endogeneity can be explained as when the dependent variable is related to its lagged values. The DPDSYS-GMM effectively controls the problem, taking into account lagged instrument values. The DPDSYS-GMM can handle the explanatory variables’ possible endogeneity using internal instruments or lagged values of the variables [60]. This uniqueness provides an advantage to the DPDSYS-GMM over the FE and RE models, which consider strict exogeneity that leads to biased estimates when there is endogeneity.
Second, DPDSYS-GMM can also effectively deal with unobserved heterogeneity in the same way as an FE model by differentiating the data and removing individual-specific effects that can make the results biased, namely, fixed effects or time-invariant unobserved heterogeneity [61,62]. Unlike the RE model, DPDSYS-GMM does not assume the homogeneity of unobserved effects across individuals, which makes it more flexible and robust in most practical situations. Third, DPDSYS-GMM ensures effectiveness even for relatively small sample sizes, as is a well-known weakness of other estimators, such as the FE model. For instance, the authors of [63,64] argued that the DPDSYS-GMM delivers the most consistent estimates when the time horizon (T) is shorter than the subset of observable cross-sections (N). One has to be cautious, though, in handling the potential problem of instrument proliferation, which is likely to lead to overfitting and biased results. This is properly handled by techniques such as instrument reduction or collapsing. Therefore, two diagnostic tests (e.g., the Hansen J-test) and serial correlation (e.g., the Arellano–Bond test) are warranted to evaluate the validity of the DPDSYS-GMM model.
The first step is to check the overidentification of the instruments in the DPDSYS-GMM model specifications. For this purpose, Roodman [65] asserted that applying the Sargan/Hansen tests could effectively capture the overidentification of the instruments. But the Sargan test of the over-identification of the instruments is only valid if the estimation method takes into account a set of homoscedastic weights, such as in the one-step DPDSYS-GMM approach. In contrast, the Hansen test would look at whether or not the instruments are over-identified if there is a heteroscedastic weight vector, which is often the case in the two-step DPDSYS-GMM approach in line with our case. Second, the serial correlation of the residuals might be amplified in dynamic panel data models. The DPDSYS-GMM can efficiently fix the issues of serial correlation and heteroscedasticity [61,66,67]. In particular, one of the most appealing aspects of DPDSYS-GMM model is that it allows for impartial distribution of error term, which is likewise linearly independent [68,69]. However, the AR (1) and AR (2) diagnostic (e.g., the Arellano–Bond test), as stated by [52,65], can decipher problems of this nature to provide consistent estimates. These diagnostic tests ensure the validity of obtaining reliable results, which is a significant advantage compared to other methods that might not provide such robust diagnostic tools. Thus, in line with [9,11,22], we estimated the following model in the DPDSYS-GMM setting to inspect H1a–H1b:
where represents the CE of ith banks in time t, which was estimated using SFA in the first stage. While signifies the first lag of CE to control for the endogeneity problem, is a measure of competition in three different markets; e.g., loan, deposit, and asset were estimated using stochastic trans-log cost function. is capitalization ratio calculated as total equity over total assets, is total loan to total asset ratio, is cost to income ratio, and is the natural logarithm of total assets. And, for macroeconomic control factors, we deployed the following: is inflation rate, is interest rate, and is gross domestic product growth rate. Additionally, we included to account for technological evolution and economic cycle fluctuations over time. The composite error term is specified as , where represents time-invariant unobserved heterogeneity (individual fixed effects), and denotes idiosyncratic shocks. The idiosyncratic term was assumed to have a mean of zero ( = 0), constant variance, , and no serial correlation across i or t.
4. Results and Discussions
We have investigated the evolution of CE and the influence of competition on CE within the Pakistan’s banking industry. Our research is divided into two stages. Our first-stage CE analysis begins by exhibiting the findings of the CE of Pakistani banks estimated using SFA. We have taken into account both desirable (positive) outputs, such as total deposits, total loans, and other earning assets, and undesirable (negative) outputs, such as non-performing loans, to reveal the complex nature of banking activities and provide insights into CE dynamics across the industry during 2006–2020. Our second-stage analysis delves into the influence of competition on CE. We have examined the competition through the LI of market power in multi-product market segments, i.e., loan, deposit, and asset markets, to analyze how market power in different product market segments influences CE. Further details are exhibited in coming sub-sections.
4.1. First-Stage CE Analysis
We estimated the stochastic trans-log cost frontier (refer to Appendix A, Table A3) using EQ. 1 to assess CE. Table 1 presents the main results, detailing CE estimates for Pakistan’s banking industry across various categories over the period 2006 to 2020. The CE scores range from 0 to 1, with values closer to 1 indicating greater efficiency in minimizing costs relative to the level of outputs produced. Table 1 shows that, during the study period, Pakistani banking industry’s average CE was 81.84%. This indicates that, on average, banks in the sector spend more than 18% more resources than required or that banks could have decreased input resources by more than 18% while maintaining current output levels. In addition, the CE for the whole banking industry varied between 4.57% and 95%, with a high standard deviation (SD) of 9.32%, which means high volatility. In contrast, when we evaluate the banks based on their ownership structure, we discover additional noteworthy variations. Over the time period under scrutiny, we observed that the average CE at state-controlled banks (SCBs) was 78% with a lower SD of 6.8% and that, at public sector banks (PSBs), it was 83% with a slightly higher SD of 8.37%.

Table 1.
CE of Pakistan’s banking industry results summary during 2006–2020.
In contrast to the vast bulk of previous banking studies [20], the foreign banks (FBs), in our case, are not the best performers, showing a CE of 80.41% with a higher SD of 9.80%. It is because domestic banks in Pakistan possess in-depth knowledge of the local industry conditions, rules and regulations, and customer demands, allowing them to better adapt to the needs of domestic consumers and make better decisions, streamline their business practices, and gain higher CE. Furthermore, if we evaluate Islamic banks (IBs) and traditional banks (TBs), we observe that the average CE for both categories of banks is virtually uniform; however, the SD of TBs is higher than that of IBs. Table 2 illustrates a more in-depth summary of the CE evolution from 2006 to 2020, with the Global Financial Crisis (GFC) phase highlighted in bold. Figure 1 shows CE evolution paths from 2006 to 2020 based on banks’ ownership structures.
Table 2.
CE evolution of Pakistan’s banking industry during 2006–2020.
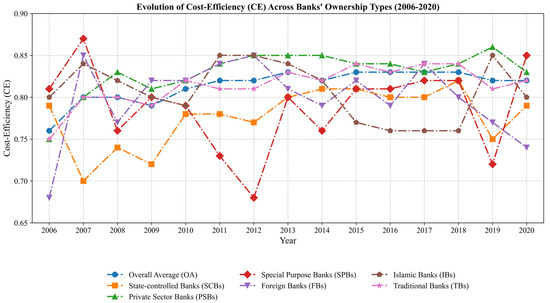
Figure 1.
The evolution of the cost-efficiency of Pakistan’s banking industry during 2006–2020. Source: Python 3.11. Output.
4.2. Second-Stage Analysis: The Impact of Banking Competition on CE
To address our proposed research question, we formulated hypotheses H1a–H1b and applied a two-step DPDSYS-GMM estimator (Equation (5)) to evaluate the impact of banking competition measured by the LI of market power in loan, deposit, and asset markets (Equations (2)–(4)) on CE (Equation (1)). Table 3, Table 4, Table 5 and Table 6 present empirical evidence on how multi-product market competition influences the CE of the Pakistani banking industry. Before presenting the results, it is essential to establish the validity of the two-step DPDSYS-GMM model6. As shown in Table 3, a higher LI in all three markets robustly enhances CE, and coefficients for LILs (loans), LIDs (deposits), and LIAs (assets) are 10.91, 9.56, and 10.23, respectively (p < 0.01). The lagged CE term exhibits strong persistence (0.74–0.87, p < 0.01), confirming the dynamic nature of CE adjustments. Table 4, Table 5 and Table 6 uncover heterogeneity by interacting the LI with efficiency quartiles. In the loan market (Table 4), the baseline LIL boosts CE (7.44–11.07, p < 0.01), but its interaction with low-efficiency quartiles (LIL_Q1) dampens CE (−0.09, p < 0.01). Conversely, interaction with high-efficiency quartiles (LIL_Q3) amplifies CE gains (0.05, p < 0.01). Similar patterns transpire in deposit (Table 5: LID_Q1 = -0.01 vs. LID_Q3 = 0.06) and asset markets (Table 6: LIA_Q1 = −0.09 vs. LIA_Q3 = 0.05), underlining cross-market consistency. Bank-specific controls align with theoretical priors such as EQTAR and SIZE and positively influence CE (0.00–0.01, p < 0.01), indicating that well-capitalized banks are more efficient, likely due to lower funding costs or better risk management and economies of scale benefitting larger banks. Meanwhile, higher LTAs marginally reduce CE (−0.00, p < 0.05), suggesting increased costs of loan processing and monitoring. Macroeconomic factors exert asymmetric effects such as (INFRATE: −0.01 to −0.00, p < 0.10) and (INTRATE: −0.05 to −0.03, p < 0.01) and erode CE, indicating that rising inflation and interest rates undermine efficiency, potentially by raising operational costs or compressing margins. Conversely, the GDPGR shows mixed impacts depending on the market.
Table 3.
Impact of banking competition on CE.
Table 4.
Impact of banking competition in the loan market on CE.
Table 5.
Impact of banking competition in the deposit market on CE.
Table 6.
Impact of banking competition in the asset market on CE.
Table 3 shows a highly positive and significant effect of LILs, LIDs, and LIAs on CE across all models (1–3), suggesting that greater market power in the loan, deposit, and asset markets leads to improved banking CE. These findings can be interpreted as follows: First, banks and other financial services providers play a crucial role in the economy’s overall credit flow, making the loan market a vital component. Market power in the loan segment might potentially enhance banking CE through economies of scale, superior risk control, and access to more extensive data on borrowers. For instance, economies of scale in the loan market permit banks to decrease the total average cost per loan by spreading their fixed costs across a broader range of loans and increasing their CE. Banks increase their CE by diversifying their loan portfolio and promoting their credit risk oversight, which is crucial for banks as it broadens the best resource allocation opportunities and reduces the costs related to loan default. In addition, loan market power allows banks to receive more information than their potential rivals have about loan applicants and their financial status. The ability to process more information can have a substantial effect on making more informed managerial decisions to grant the credit and, thus, increase their CE.
Second, market power in the deposit market enables banks to attract stable funding from savers and investors. This power stems from enhanced funding stability, greater liquidity control, and lower funding costs, ultimately leading to improved CE. A stable source of financing allows banks to use their resources more efficiently. Therefore, the absence of risk associated with fluctuating deposit volumes reduces the cost of deposit-oriented risks, leading to improved CE. Moreover, the banks’ strong liquidity control and supervision allow them to meet the needs of their clients in terms of unexpectedly high-volume withdrawals, resulting in higher CE. Likewise, when the cost of funds reduces, the banks can likely attract funds in the form of deposits at a reduced interest rate, which enhances CE.
Third, the banking asset market involves the trading of equities and bonds, as well as derivatives, mortgage-backed securities, and a wide range of investment vehicles. In a variety of ways, such market power can have a positive influence on CE. For instance, banks with more market power can benefit from sourcing high-quality assets and negotiating the most advantageous terms and prices. High-yielding and low-default-risk investments and loans are considered. With cheaper access to such assets, banks may increase their revenue and decrease their financing expenses. Lower costs for securing this capital result in superior net interest margins, which in turn improve the CE of their credit business operations. Similarly, with such power, banks might potentially enhance their CE by lowering their risks of incurring excessive losses and enhancing their chances of attaining a positive risk–return trade-off through risk diversification. Overall, these findings are consistent with the BSH; thus, we accept H1a.
Table 4, Table 5 and Table 6 (Models 4–12) present the interaction effects of market power and quartile dummies on CE. The results indicate that banks in the Q3 group (high-efficiency quartile), when interacting with market power, exhibit a positive and significant impact on CE. In contrast, banks in the Q1 group (low-efficiency quartile) demonstrate a negative impact on CE when interacting with market power, suggesting that market power may exacerbate inefficiencies among already underperforming banks. This is because the structure of Pakistan’s banking industry, such as the number of firms, their size distribution, and the extent of geographic diversity, is determined by the relative efficiency of different market participants in serving customer needs. In other words, banks that are more efficient in providing financial services are more successful in attracting customers and expanding their market share. In a nutshell, the high-efficient banks increase their market share at the expense of the less-efficient banks, which allows them to gain more market power. Thus, the gain in market power is driven by the efficient structure of the market that, as a result, improves the CE, consistent with the ESH; thus, we accept H1b. Our findings coincide with those of [3,7,9,11,17,22,32] who favored the BSH and ESH. However, our findings are in stark contrast to the studies of [2,19,21,33,34,35,36,37], who broadly supported the SCPH or QLH.
Turning our focus on the bank-specific control factors, we observe that the EQTTAR strongly influences CE in 10 out of 12 models, across models 1–12 (Table 3, Table 4, Table 5 and Table 6). The expected bankruptcy costs theory suggests that a bank’s performance would improve as its equity base expands, since equity is the bank’s most costly source of funding. Having more capital at their disposal equips banking executives with an incentive to increase revenues and transfer a larger portion of those revenues to investors through the reduction in exploitative fees. The growth of the bank’s equity narrows the risk of default as well as the costs associated with financing. Thus, the aggregate effect of this leads to an overall decrease in banks’ costs; therefore, enhancing the CE is consistent with the studies of [54,55]. However, we have observed that the cost to income ratio (CTIR) positively influences the CE but is statistically insignificant across all models 1–12 (Table 3, Table 4, Table 5 and Table 6), possibly because its effect is already captured in the CE measure.
Yet another vital metric that evaluates credit risk is the LTA ratio, which is a measure of how much revenue a bank can extract from its assets. It assesses the degree to which loans serve as a stream of funding for a bank’s overall assets. We found that the LTA has a significant negative influence on the CE of the banks in 10 out of 12 models (Table 3, Table 4, Table 5 and Table 6). This is because, when banks have a high LTA, a large percentage of their assets are tied up in loans, leaving the bank vulnerable to default if borrowers cannot repay their loans. In addition, loan defaults may lead the banks to write off the loans, which amounts to the loss of earnings and capital. In other words, the risks of default means that the cost of the capital for a bank increases as the investors and creditors require larger return to cover the higher risks, while this results in the greater cost and lesser CE for the bank. In addition, prudential regulatory requirements increase costs when a bank possesses a high LTA. There is a certain level of capital that a bank has to preserve to guarantee that it can cover the potential losses on the loan. Banks with a high LTA take on more risk, and regulators may require them to maintain a higher level of capital. Higher capital requirements also increase banks’ costs and thus decrease their CE, and this finding is in line with Brissimis, Delis [56], but it contradicts Carvallo and Kasman [50]. However, bank SIZE has a significant and positive effect on the CE in 11 out of 12 models (Table 3, Table 4, Table 5 and Table 6), implying that the larger banks tend to be more cost-efficient since they have the ability to exploit economies of scale that are consistent with those of [3,50,54,55,58].
By evaluating the effect of macroeconomic control factors, we observed that the INFRATE significantly and negatively influenced the CE in 11 out of 12 models (Table 3, Table 4, Table 5 and Table 6). This finding makes sense in a specific case such as Pakistan, where inflation is always a serious concern, since banks are financial intermediaries in this country that accept deposits from customers and uses those funds to make loans to borrowers. Banks generate revenue by charging borrowers a higher interest rate than they pay depositors and by earning fees for various services that they provide. When the INFRATE is high, it causes prices to rise across the economy, which means that the value of money decreases and purchasing power declines. The decline in the purchasing power of money has the following adverse effects on banks’ CE. To begin with, a high INFRATE increases banks’ operating costs. Banks have to pay more for the products and services that they offer in their business operations, and this increases their related costs. In this case, banks have to spend more money to maintain their business operations. Consequently, the prices of the inputs they use in business rise due to inflation. Thus, there is an overall rise in their costs, which decline their CE.
In addition, the value of the banks’ assets is eroded in inflationary circumstances. Banks have several assets such as bonds, stocks, and loans that generate income to them, but these assets keep decreasing in real value when the INFRATE is sustained for longer periods of time. For instance, when banks loan funds at a fixed interest rate, the value of the loan is eroded when inflation occurs; that is, the borrowers will pay less in real value, and banks will lose the proportionate interest. The decline in the value of assets is accompanied by a rise in the costs of banks. This decline in asset value increases a bank’s overall costs, and, as such, there is a reduction in CE. Finally, there is a rise in banks’ costs due to potential rises in loan defaults: when the INFRATE reduces the purchasing power of money to the debtors, and they, therefore, cannot pay back the loans. A high INFRATE will also increase the interest levels of loans, and borrowers will pay more money to service the compensations for the loans. Finally, a high INFRATE will also reduce banks’ ability in predicting their cash flows. A highly volatile inflationary environment in an economy makes it difficult for banks to forecast future income and expenses, making it challenging to plan and manage their operations effectively, exposing banks to inaccurate lending decisions, hurting their cost structures, and reducing CE. Finally, a high INFRATE also reduces the demand for loans. In times of high inflation, borrowers choose to delay borrowing money because the purchasing power of their income decreases. This decrease in loan demand becomes costly for banks and reduces their CE. These results coincide with the earlier findings of [54,55] but are in stark contrast to the study of [50].
Moreover, we observed that the INTRATE has a negative and statistically significant impact on the CE in all models 1–12 (Table 5 and Table 6). This is due to the falling demand for credit. Customers’ appetite for credit is expected to decline if the INTRATE is high since it might be costly for them to borrow funds. Banks may have to strive more intensely to retain their current creditworthy borrowers, which could reduce their revenues as credit demand drops. If a bank’s revenues are low, investing in technology innovation, new products, and services could be more challenging and, thus, result in lower CE. Secondly, when the INTRATE is high, borrowers may find it more challenging to repay their loans, leading to increased loan defaults. This increase in loan defaults can lead to a rise in NPLs, reducing banks’ profits and increasing their operational costs since collecting NPLs requires additional costs to collect the debts, thus reducing the CE. These findings are in stark contrast with the study of [56].
Finally, we identified a significant positive effect of the GDPGR on CE in 5 out of 12 models (Table 3, Table 4, Table 5 and Table 6). A high GDPGR stimulates innovation and technological advancement, which helps banks reduce their costs. For instance, digital banking and automation advances enable banks to streamline their core business operations and reduce over-reliance on manual processes, which improve their CE. In the same vein, innovative solutions for data analytics and risk management allow banking firms to effectively identify and mitigate risk, resulting in cost reduction and higher CE, which is coherent with the studies of [3,50]. However, it is interesting to note that, in models 1 (Table 4) and 4–6 (Table 5), the effect of the GDPGR on CE is negative. This is because, as the economy grows, banks expand their business activities, which can lead to higher operational costs such as hiring and training new employees, developing new credit products, and implementing new technologies. Higher lending during times of a high GDPGR also increases nonperforming loans (NPLs), which raises the bank’s total cost and reduces the CE, which aligns with the findings of [59].
4.3. Robustness Checks and Additional Analyses
To ensure the robustness and consistency of our main findings, we conducted additional checks examining the impact of banking competition on CE across various ownership types and market segments. Table 7, Table 8, Table 9 and Table 10 report the results of the two-step DPDSYS-GMM estimations, analyzing the relationship between CE and competition, measured by the LI across three markets: loans (LILs), deposits (LIDs), and assets (LIAs). All model specifications pass key diagnostic tests, including the Arellano–Bond AR (1) and AR (2) tests and the Sargan/Hansen tests, confirming the absence of second-order serial correlation and the validity of instruments. Additionally, the Wald chi-square statistics are highly significant across all model specifications, further supporting the robustness of the models (see Table 7, Table 8, Table 9 and Table 10).
Table 7.
Impact of banking competition on CE across different ownership categories.
Table 8.
Impact of banking competition in the loan market on CE across different quartiles and ownership categories.
Table 9.
Impact of banking competition in the deposit market on CE across different quartiles and ownership categories.
Table 10.
Impact of banking competition in the asset market on CE across different quartiles and ownership categories.
The empirical analysis reveals significant heterogeneity in the relationship between LIL, LID, and LIA markets and CE across ownership structures and efficiency tiers. Table 7 validates robust temporal persistence in CE, evidenced by statistically significant lagged CE coefficients (0.86–0.95; p < 0.01–0.05) across all model specifications. Critically, the interaction effects between LI measures and ownership dummies exhibit pronounced divergence. For conventional banks such as SCBs, PSBs, SPBs, and FBs, higher market power across LIL, LID, and LIA markets is associated with considerable CE progresses, with interaction coefficients ranging from 9.21 to 10.56 (p < 0.01–0.05). In contrast, IBs exhibit no statistically significant response to different LI variations (coefficients: 0.01–0.06; p > 0.10), suggesting structural idiosyncrasies in their CE dynamics. This aligns with the literature emphasizing banks’ capacity to leverage economies of scale, optimize risk management practices, and exploit cross-subsidization opportunities inherent in traditional banking activities (e.g., deposit funding subsidizing loan portfolios). For instance, elevated loan market power (LIL) may enable conventional banks to negotiate better funding terms or reduce credit risk, thereby lowering operational costs. Conversely, IBs exhibit no significant CE response to LI variations. These findings are consistent with the BSH, aligning with our core results and receiving empirical support from previous studies [3,22,40,41].
Table 8 extends the previous analysis by exploring the complexity and sensitivity of our main findings through the stratification of loan market competition (LIL) effects across three efficiency quartiles: low (Q1), medium (Q2), and high (Q3). While a direct positive association between LILs and CE persists (7.22–10.26, p < 0.01), nonlinear moderations emerge across efficiency quartiles. Conventional bank interaction with the lowest efficiency quartile (Q1) reveals that LIL elevation paradoxically diminishes CE (−0.14, p < 0.01), yet ownership interactions reverse this trend: SCBs and PSBs in Q1 achieve CE gains through market power leverage (LIL_Q1×SCBs: 0.06, p < 0.05; LIL_Q1×PSBs: 0.10, p < 0.01), whereas IBs in Q1 face exacerbated inefficiency (LIL_Q1×IBs: -0.05, p < 0.10). High-efficiency quartile (Q3) interaction with conventional banks exhibit diminishing returns to market power accumulation (LIL_Q3×SCBs/PSBs/FBs: −0.06–−0.09, p < 0.05–0.01), while IBs uniquely sustain CE improvements (LIL_Q3×IBs: 0.06, p < 0.05), underscoring their resilience in competitive environments. For conventional banks in the lowest efficiency quartile (Q1), heightened market power initially appears counterproductive, exacerbating inefficiencies. Yet, ownership-specific interventions, particularly by SCBs and PSBs, reverse this trend, enabling these institutions to harness market power to offset structural inefficiencies. This suggests that state-backed banks may possess implicit advantages, such as government guarantees or preferential access to liquidity, which allow them to mitigate inefficiencies even in less competitive environments. Conversely, conventional banks in the Q3 experience diminishing returns to market power accumulation, signaling a saturation point where additional market power no longer translates into CE gains. This aligns with the efficient structure hypothesis’s contention that highly efficient institutions may prioritize stability over aggressive market dominance, thereby reallocating resources to sustain existing efficiencies rather than pursuing further market power. Notably, IBs defy this trend in Q3, sustaining CE improvements despite reduced competition. Their resilience may stem from niche market specialization, loyal customer bases, and operational agility, which buffer them from the inefficiencies typically associated with monopolistic markets. These findings are consistent with the studies of [9,11].
Table 9 and Table 10 corroborate the prior dynamics in deposit (LID) and asset (LIA) markets. The direct effects remain homogenously positive (LID: 6.85–9.13; LIA: 7.03–9.72; p < 0.01), yet ownership–efficiency quartile-based interactions complicate outcomes. For instance, Q1 interaction with conventional banks (SCBs, PSBs, FBs) counteract CE erosion through market power utilization (e.g., LID_Q1 × SCBs: 0.06; LIA_Q1 × PSBs: 0.09; p < 0.05–0.01), while IBs in this quartile exhibit persistent inefficiencies (LID_Q1 × IBs: −0.05, p < 0.10; LIA_Q1 × IBs: −0.05, p < 0.05). However, the Q3 interaction reveals diminishing returns (LID_Q3 × SCBs: −0.09; LIA_Q3 × PSBs: −0.08; p < 0.01), contrasting sharply with IBs, which sustain CE gains even under reduced competition (LID_Q3 × IBs: 0.06; LIA_Q3 × IBs: 0.05; p < 0.05). The results presented across Table 9 and Table 10, focusing on competition in LIDs for deposits and LIAs for assets, have a positive and significant impact on CE across all models 1–3. This suggests that banks with greater market power can leverage their competitive advantage to achieve operational efficiencies, likely through pricing power, improved resource allocation, and economies of scale. Further, the interaction of competition with efficiency quartiles (LID_Q1, LID_Q3 for deposits; LIA_Q1, LIA_Q3 for assets) reveals heterogeneous effects. Market power significantly reduces CE in Q1, as seen from the negative coefficients for LID_Q1 and LIA_Q1. This indicates that Q1 banks may struggle to compete in highly competitive markets due to operational constraints. However, market power enhances CE for Q1, as evidenced by the positive coefficients for LID_Q3 and LIA_Q3. These banks likely capitalize on their operational strengths and competitive positioning to achieve higher efficiencies.
Moreover, SCBs exhibit a positive and significant response to market power in Q1 for both deposit and asset markets. This indicates that SCBs may benefit from government backing and regulatory advantages to enhance CE in competitive environments. However, their response in Q3 is negative, suggesting diminishing returns to market power at higher efficiency levels. PSBs consistently benefit from market power in both markets and across quartiles, highlighting their ability to adapt to competitive pressures through innovation and operational improvements. FBs show a slight negative response in Q3, indicating potential challenges in maintaining high CE levels despite market power, possibly due to differences in local market dynamics. Market power negatively impacts IBs in Q1 but positively affects them in Q3, reflecting their growth trajectory as they transition from emerging to established players.
Regarding bank-specific control factors, the EQTTAR and SIZE positively influence CE in most models, while the LTA has a slight negative impact. The CTIR is generally insignificant, suggesting limited direct influence on CE in the presence of other factors. However, macroeconomic control factors, including the INFRATE and INTRATE, negatively affect CE, while the GDPGR contributes positively in fewer models while negatively in others. Overall, findings underscore the unique relationship between competition through different ownership and CE. While market power generally fosters CE, its effects vary significantly across efficiency quartiles and ownership categories. Q3 and PSBs appear to leverage market power most effectively, whereas Q1, particularly IBs and FBs, faces challenges. These insights provide critical implications for policymakers and banking regulators aiming to balance competition with efficiency in Pakistan’s banking sector.
4.4. Theoretical and Practical Contributions
Our Research Provides Several Valuable Contributions to the Existing Banking Literature
Firstly, this research incorporates nonperforming loans (NPLs) as undesirable (negative) outputs to make a more accurate assessment of the CE of Pakistan’s banking industry. Most of the prior stochastic frontier analysis (SFA)-driven banking CE studies [2,3,19,36,40,47,70] have overlooked the negative influence of NPLs in the overall production process, leading to a biased assessment of banking CE. Recently, fewer banking studies [69,70] that use non-parametric methods like data envelopment analysis (DEA) have applied undesirable (negative) outputs like non-performing loans (NPLs). However, parametric studies, such as SFA-driven banking efficiency studies, have rarely used undesirable (negative) outputs [25]. Thus, the integration of NPLs in our research shows a more holistic picture of how NPLs as negative outputs influence the CE of Pakistan’s banking system. Banks with superior NPL administration practices are identified, and their norms may serve as a template for other banks to follow. Likewise, the findings allow academics, authorities, and market participants to better comprehend banks’ effectiveness in managing resources and risk mitigation. This has significant practical implications for assessing the CE of the banking industry in Pakistan. By analyzing the best practices of NPL management, this study shed light on the banks of the best risk management and resource allocation. Policymakers and regulators, based on such empirical evidence, can establish improved policies and supervisory mechanisms that can streamline the general stability and competitiveness of the banking sector. Other impacts of the improvement in NPL management are higher investor confidence, customer assurance, and an expanded model for academic research. Overall, it helps in creating a banking industry that is much more resilient and efficient, due to better operational health and market performance.
Secondly, previous studies on banking competition have employed the LI to analyze a single market area, such as loans, deposits, or assets [3,9,40,41]. In contrast to earlier studies, we employ the LI of market power to evaluate the level of competition in Pakistan’s banking sector across three market areas concurrently. We argue that market areas, such as loans, deposits, and assets, are interrelated with one another and form a complex competitive environment within the Pakistani banking industry. By analyzing market power across all three markets, this research provides a more realistic and in-depth understanding of the competitive conditions within Pakistan’s banking industry. Earlier studies focus on competition within a specific product market niche that might result in biased policy implications for broader conclusions. However, this study advances the existing literature by providing a broader view of competition in the banking industry across multi-product segments. This study further elucidates the spillover effects of shifts in market power from one market area to another, which in turn influence the competitive landscape of the entire banking industry. Moreover, the analysis of banking market power in each of these three market areas provides a more intricate comprehension of the income channels of banks since banks derive their income from diverse channels, such as interest earnings from lending activities, charges levied on deposits, and profits from asset-side investments. The use of the LI of market power for investigating competition across loans, deposits, and assets simultaneously in Pakistan’s banking industry holds the following important practical implications. This all-encompassing strategy allows us to unravel the connectedness of such market areas, giving rise to a more realistic competitive landscape. The policymaker can borrow insights from the findings to formulate balanced regulation that will consider that different market areas are interlinked when setting regulation rather than a single-market analysis that may lead to biased policies. The banks can then devise appropriate strategies, given such helpful information with spillover effects in mind to enhance their competitive positioning across several income-generating channels. Such an understanding of power dynamics in the market can inform better management of risk, strategic planning, and resource allocation, which can ultimately lead to the development of a much more robust and competitive banking environment.
Thirdly, we have explored how competition (e.g., market power in loan, deposit, and asset markets) influences the CE of Pakistan’s banking industry. Unlike earlier research [2,19,41,45,47], which exclusively examined market power within a single market segment, the present research investigates the influence of market power in three markets—loan, deposit, and asset—on CE. This research exposes a more holistic and in-depth understanding of the competition–CE nexus within Pakistan’s banking industry through the relationship between market power and CE by considering these three interdependent categories of market power. Similarly, such insights can shed light on the implications of competition in loan, deposit, and asset markets for CE in a banking industry such as that in Pakistan. This holistic analysis helps us understand how market power in the interconnected market segments contributes to overall CE. Such findings could be used by the policymakers in developing given rules that are better balanced in terms of competition but still succeed in ensuring CE, all of which would help banks manage their operations in such a manner by which they can recognize the implications of market power across these segments with optimized cost structures and improved profitability. Thus, there can be better competitive strategies and resource allocation designed to allow the banking sector to be more efficient and, thus, more resilient.
Fourthly, this research deepens our understanding of the heterogeneity present within the banking sector by exploring the role that market power plays in the CE of banks across a range of efficiency quartiles. The detection of the differential effect of market power due to the efficiency quartile illustrates the significance of analyzing bank-specific characteristics. These analyses enable us to understand the bank performance-specific effect when assessing the effect of market power on CE across different efficiency quartiles in Pakistan’s banking sector. The findings provide unique novel insights into the extent to which market power influences CE, and this finding helps regulators and executives in the banking industry take effective niche-specific measures. Given that the measures should concentrate on improving CE for banks with varying levels of efficiency, the regulatory impact and management practices will be more effective. In particular, the regulatory measures will not be a one-size-fits-all approach but rather performance-quartile-oriented ones. Overall, such an approach can foster a more equitable and efficient environment, which can enable banks to improve their performance based on their unique bank-specific conditions.
5. Conclusions
Based on our study findings, we have concluded that, from 2006 to 2020, the average CE of Pakistan’s banking industry is estimated to be 81%. Although private sector banks (PSBs) are shown to be the better performers, with an average CE of 83%, state-controlled banks (SCBs) have been observed to be poor performers, with an average CE of 78%. Our findings also confirm that Islamic banks (IBs) and traditional banks (TBs) were rather alike in terms of CE, with average levels of 81% and 81%, respectively. Furthermore, the market power in the loan, deposit, and asset markets was used to measure the degree of competition through the LI of market power, and findings have concluded a positive influence on the CE, which has been consistent across three market segments, validating the banking specificity hypothesis. We have likewise uncovered evidence of the heterogeneous effects of market power, confirming a positive effect when market power interacts with banks in the high-efficiency quartile; nevertheless, it exhibits an inverse impact when it interacts with low-efficiency quartile banks. Our findings have been consistent across three market segments, validating the efficient structure hypothesis.
6. Policy Recommendations
Based on our empirical findings that banking competition, measured as market power in loan, deposit, and asset markets, positively influences CE, we present important policy proposals that could potentially help Pakistani banks increase their market power without inhibiting healthy competition throughout the industry, thereby increasing their CE. Our policy directions would be of particular use to the State Bank of Pakistan (SBP) to accomplish its strategic goals (SGs) for Vision 2020.
We propose that banks in Pakistan can expand their market power in the loan market by providing borrowers with low interest rates and attractive payback arrangements. Banks, likewise, may forge stronger links with their customers via dedicated service and the supply of personalized loan products. Similarly, banks can leverage technology to streamline their customers’ loan application and approval processes. In addition, banks may expand their loan portfolios by serving niche markets such as small business owners and homebuyers7. Moreover, banks can differentiate themselves from competitors by providing value-added services, such as financial planning or credit counseling, to help clients achieve their financial goals. However, banking authorities in Pakistan have to strike an equilibrium involving the ostensible upsides to market power in the loan market, for instance, increased CE, and its inevitable downsides, including less client protection or increased structural risk factors. The SBP may align the banks to operationalize this by allowing favorable terms for granting credits. The government may work with the banks to introduce subsidized loan programs targeted at particular sectors, such as agriculture or small-to-medium-sized enterprises (SMEs). To enable them to customize the loan products effectively, the banks must have client relationship management (CRM) systems that accumulate and analyze customer needs and behavior data. This will allow the bank to implement fintech solutions that eliminate all loan application and approval bottlenecks, reduce process times, and increase customer satisfaction. Some hitches do exist in the process of operationalizing the above policy recommendation. For instance, regulatory caps on interest rates may compel banks to set their rates above a minimum. Adding to this, the setup costs related to initial investment in such technology-based infrastructures are high, and there may be some resistance to change at the staff and customer level. However, there are more opportunities than there are challenges. With personalized and convenient loan services, a much higher level of consumer loyalty and retention can be taken to new levels. Banks can rope in niche markets, for instance, rural areas and particular industries, to expand their clientele.
We propose that banks in Pakistan can increase their market power in the deposit market by offering attractive interest rates on deposits, which can attract customers and increase their market share. Banks can provide superior customer service and convenient banking options, such as mobile and online banking, to enhance the customer experience and loyalty. Likewise, banks can increase their reach by opening up facilities and installing new branches in their current systems, hence increasing their reach. Similarly, banks can distinguish themselves and increase their market share by innovating deposit products tailor-made to the specific needs of any customer segment, such as students or retirees. Regulators may need to carry out in-depth cost–benefit analyses to gauge deposit-side banking market power to strike the right balance between stimulating competitiveness and ensuring that resources are used efficiently. Banks in Pakistan can implement such a policy by introducing tiered interest rate regimes where more significant or longer-term deposits yield higher rates. In addition to these, the bank administrators should invest resources in training staff for enhanced customer relation expertise and improve the online banking mechanisms to offer automatic online and mobile banking technologies. In addition, Pakistani banks can expand their mobility by researching the market in the most underserved areas and establishing subsidiaries in such areas. However, there are some barriers to implementing such a policy in Pakistan. Balancing the need to offer attractive deposit rates while ensuring that the business remains profitable can seem daunting, especially in times of low interest rates. Also, it can be a costly and lengthy exercise to establish branch networks, which may also require obtaining regulatory permission. Considering such daunting challenges, one should not overlook the opportunities. For instance, banks that offer attractive interest rates and improved customer service can rapidly increase the volume of funds deposited. Offering innovative and customized deposit solutions allows a bank to differentiate itself from others in a cluttered marketplace.
We propose that banks in Pakistan can increase their market power in the asset market by diversifying their portfolio in a range of assets, like stocks, bonds, and real estate, to spread risk and increase returns. In investment, banks can use their financial analysis to detect the undervalued assets that they can invest in for potential long-term returns. Further, banks may broaden asset management services by diversifying the segment of customers to boost alternative sources of revenue. Banks can establish relationships with other institutional dealers, including investment banks and hedge funds, to gain a broader range of assets and investment opportunities. For example, in the context of assessing the effects that market power will exert on CE in the market for assets, regulators will have to take into account technological progress, handling risks, and the financial stability of the entire sector. Banks may establish special investment teams with sufficient resources to identify the mix of asset classes, balancing risk and return. Pakistani banks can implement the above suggestion by employing well-qualified staff along with high-end analytics to detect undervalued assets and gain maximum return on investment. Furthermore, Pakistani banks could expand the portfolio management services that they provide to other types of clients, such as institutional investors and high-net-worth clients. Nevertheless, the main challenge associated with diverse investments is the nature of the market risks that are intrinsic to them, requiring the execution of effective asset management strategies. Furthermore, maintaining strict adherence to SBP provisions related to asset management and investing protocols could pose a significant challenge. On the other hand, a diversified portfolio of assets could lead to stable sources of income in terms of opportunities.
7. Research Limitations and Future Research Work
As our research is focused on the banking industry of Pakistan, we cannot extrapolate our conclusions to the banking industries of other countries since each country is sensitive to different financial regulations. The dearth of data has been the central constraint of this research; however, future researchers can extend this work to obtain insight into the competitiveness and efficiency of regional banking industries by drawing comparisons to the banking industries in neighboring countries. In this research, we have used SFA and the two-step DPDSYS-GMM. Other non-parametric approaches, such as the two-stage double bootstrap data development analysis and the two-stage meta frontier, may also be used for more precise comparisons. In this research, competition in the banking industry is evaluated using the LI of market power in three market areas; however, other market areas can also be explored, and alternative competition proxies such as the Boone indicator or the Rosse–Panzar model can also be used for comparison.
Author Contributions
Conceptualization, M.M.N. and T.L.; methodology, M.M.N. and S.M.; software, M.M.N. and S.M.; validation, M.M.N., S.M. and X.C.; formal analysis, M.M.N. and S.M.; investigation, M.M.N. and X.C.; resources, T.L. and X.C.; data curation, M.M.N. and S.M.; writing—original draft preparation, M.M.N.; writing—review and editing, M.M.N., T.L., S.M. and X.C.; visualization, S.M. and X.C.; supervision, T.L.; project administration, T.L.; funding acquisition, X.C. All authors have read and agreed to the published version of the manuscript.
Funding
This research received no external funding.
Informed Consent Statement
This study does not involve human subjects; therefore, informed consent is not applicable.
Data Availability Statement
This study utilized secondary datasets, which were analyzed to derive the findings presented. These datasets can be made available upon reasonable request to the corresponding author, in accordance with relevant data-sharing policies and ethical considerations.
Conflicts of Interest
The authors declare no conflicts of interest.
Appendix A
Table A1.
Three largest banks’ market concentration ratio.
Table A1.
Three largest banks’ market concentration ratio.
| YEAR | CR3-LOANS | CR3-DEPOSITS | CR3-ASSETS |
|---|---|---|---|
| 2006 | 40.87 | 44.14 | 41.54 |
| 2007 | 40.38 | 42.86 | 41.49 |
| 2008 | 42.58 | 43.33 | 42.35 |
| 2009 | 43.13 | 42.73 | 40.68 |
| 2010 | 38.28 | 39.53 | 38.57 |
| 2011 | 40.00 | 41.67 | 39.37 |
| 2012 | 41.71 | 41.55 | 41.51 |
| 2013 | 40.91 | 41.85 | 42.00 |
| 2014 | 38.78 | 40.11 | 38.33 |
| 2015 | 36.92 | 41.00 | 38.57 |
| 2016 | 36.95 | 40.83 | 41.33 |
| 2017 | 34.64 | 37.69 | 39.44 |
| 2018 | 35.06 | 38.57 | 40.00 |
| 2019 | 34.48 | 37.50 | 38.57 |
| 2020 | 33.82 | 37.22 | 35.83 |
Source: Author’s own calculations based on annual statistics released by the State Bank of Pakistan (SBP) during the period 2006–2020.
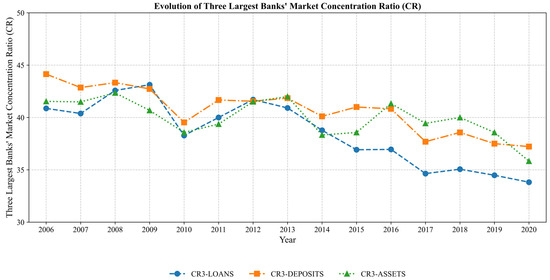
Figure A1.
Three largest banks’ market concentration. Source: Python 3.11. Output.
Figure A1.
Three largest banks’ market concentration. Source: Python 3.11. Output.
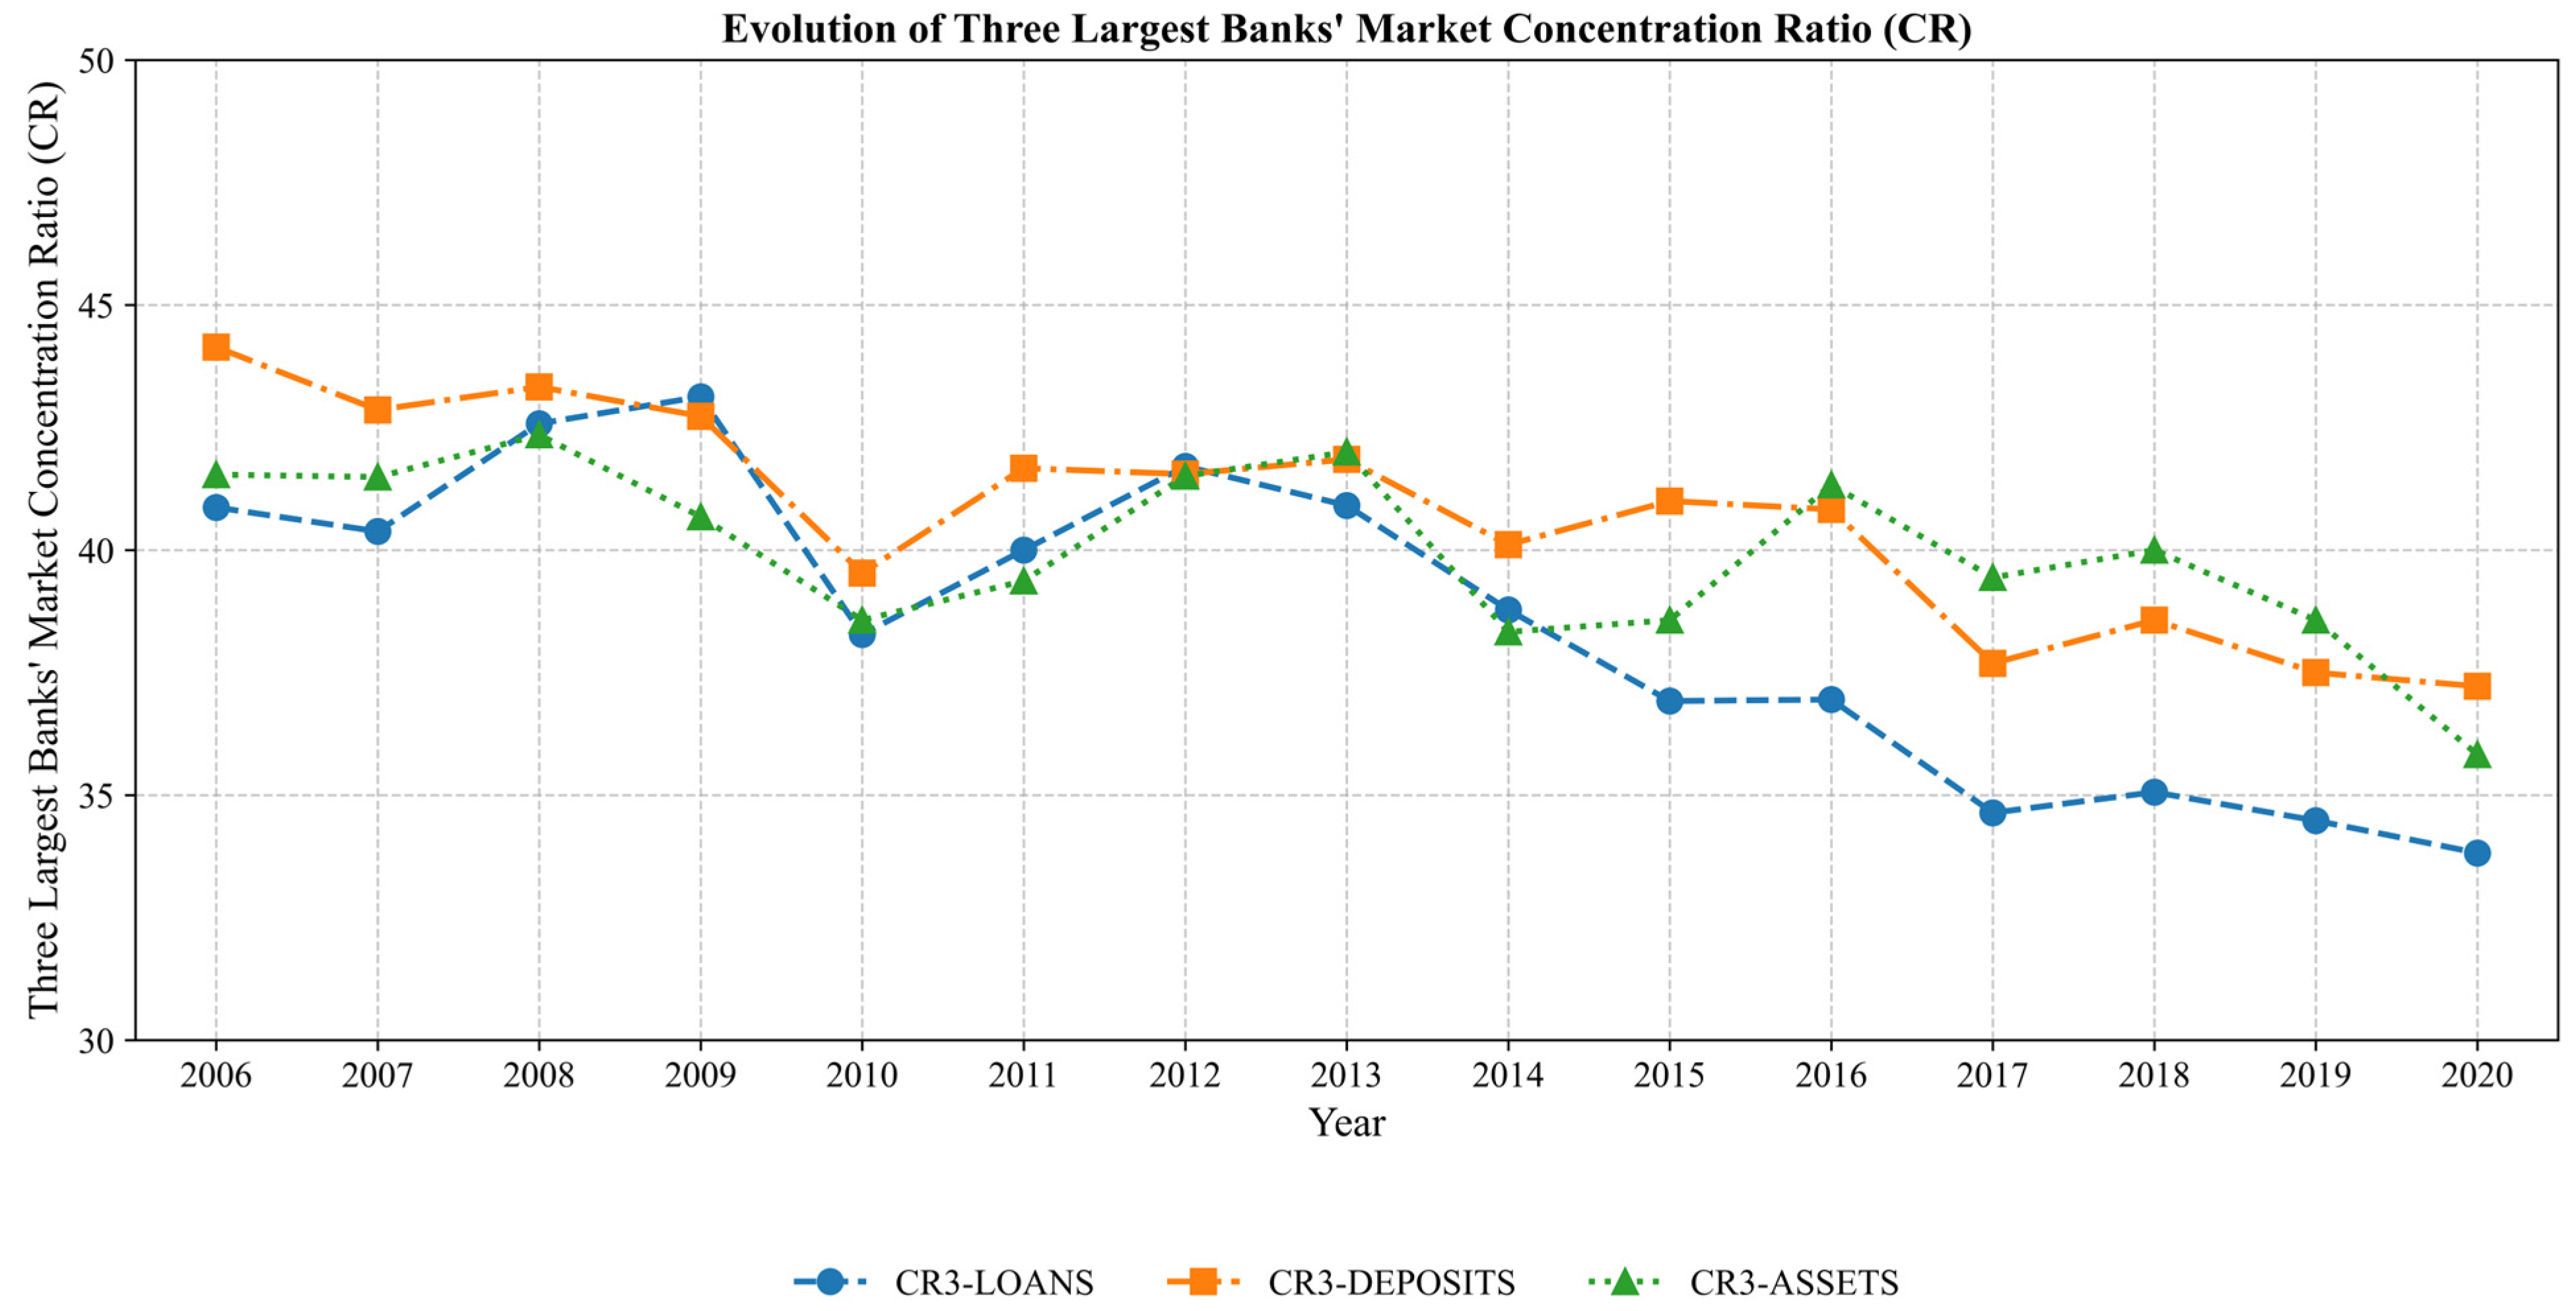
Table A2 shows the summary statistics of the variables used in the first stage to estimate the trans-log stochastic cost frontier model. From 2006 to 2020, we have 435 bank-year observations for 29 banks in Pakistan’s banking industry, which accounts for 97% of the entire banking industry. We considered three inputs and four outputs, and TC is the total cost; all values are given in millions of Pakistani rupees. The mean represents the average value of any specific variable, whereas SD. shows the variations from the mean, which is fairly high for all variables during 2006 and 2020. The range that any specific variable lies within is shown by the Min and Max, which are the lower and upper extremes of that range.
Table A2.
Descriptive Statistics of First-stage Stochastic Frontier Analysis (SFA).
Table A2.
Descriptive Statistics of First-stage Stochastic Frontier Analysis (SFA).
| Cost Frontier Variables | Obs | Mean | SD. | Min | Max |
|---|---|---|---|---|---|
| Total Cost (TC) | 435 | 25,464,095 | 34,195,630 | 2557 | 2.360 × 10⁸ |
| Outputs | |||||
| 435 | 1.731 × 10⁸ | 2.152 × 10⁸ | 32,906 | 1.200 × 10⁹ |
| 435 | 3.037 × 10⁸ | 4.291 × 10⁸ | 139,477 | 2.700 × 10⁹ |
| 435 | 1.861 × 10⁸ | 2.951 × 10⁸ | 1,283,675 | 1.970 × 10⁹ |
| 435 | 16,784,384 | 23,914,103 | 96 | 1.700 × 10⁸ |
| Inputs | |||||
| 435 | 0.03 | 0.01 | 0.00 | 0.19 |
| 435 | 1.85 | 2.00 | 0.00 | 17.55 |
| 435 | 0.07 | 0.09 | 0.00 | 0.96 |
| Year | 435 | 2013 | 4.32 | 2006 | 2020 |
Note: TC: total cost, which includes total interest and non-interest costs, TL (Y1): total loans, TD (Y2): total deposits, OEA (Y3): other earning assets, NPLs (Y4): nonperforming loans, WL (W1): cost of labor, WC (W2): cost of physical capital, WD (W3): cost of borrowed capital, Obs: total number of observations, Mean: the average value, SD: Min: minimum observed value across the sample space, and Max: maximum observed value across the sample space.
In response to the research question presented in the main article, we estimated the trans-log cost frontier function in the maximum likelihood estimation (MLE) setting by utilizing EQ. 1 in the main manuscript while maintaining the truncated normal condition of the CE error term to calculate the CE via the exp (-E(u|e)) in line with the study of [48]. Moreover, we have also estimated Fourier flexible form estimation (FFFE) using the trigonometric form;8 the approximated CE is close to that of our primary trans-log cost frontier model (the difference is less than 0.5%); therefore, we stick to our primary model. However, the FFFE results are also available upon request. Two diagnostic inspections are essential to confirm the validity of our fitted model. To proceed, we evaluated the approximated ), and our estimated γ = 0.9056 is statistically significant at the 1% level, as the variance caused by the persistence of cost inefficiencies in our trans-log cost frontier model. These results show that 90.56% of the variations in our predicted model are due to the presence of cost inefficiencies in the Pakistani banking industry, and only 9.44% variability is due to the random fluctuations. The LR test is another diagnostic that also confirms our model’s validity at 1% 9.
Table A3 exhibits the negative coefficient for the output of total deposits (Y2) from our stochastic trans-log cost frontier model, which implies that a higher output value of deposits leads to lower the costs of our banks. A positive coefficient for the output of other earning assets (Y3) implies that the cost to our banks would grow in response to an increase in the value of these assets, which is coherent with the findings of [25]. Similarly, the direction of the coefficient for the undesirable output NPLs (Y4) perfectly conforms with our expectations; however, it is not statistically significant. So far, we could explain the deposit (Y2) by arguing that the high deposits in the Pakistani banking industry provide banks with a stable source of funding, which lowers the cost of funding for banks. Deposits in the banking sector are deemed a low-cost source of funds compared to other forms of funding, such as borrowing in the capital markets. Deposits are also more stable than other forms of funding, as depositors are less likely to withdraw their funds during times of financial stress. This stability of deposits reduces banks’ funding risk, which lowers their cost of capital and borrowing costs.
Moreover, high deposits reduce banks’ borrowing costs because they can use deposits to fund their business operations rather than borrowing in the capital markets. By relying more on deposits, banks reduce their exposure to market volatility and decrease their borrowing costs, lowering their overall cost of capital. Likewise, when the bank deposit base increases, it promotes the economies of scale for banks, reducing their overall cost of business operations. Economies of scale refer to the cost advantages that arise from increased production or size. Banks with high deposits benefit from economies of scale by spreading their fixed costs, such as technology and infrastructure, over a larger customer base, resulting in lower costs per customer and decreasing their overall cost of operations.
More deposits also improve banks’ credit ratings, lowering their borrowing costs and increasing their access to funding. Credit rating agencies consider the stability and diversity of a bank’s funding sources when assigning credit ratings. Banks with a high proportion of deposits are viewed as having a more stable funding base and are, therefore, more likely to receive a higher credit rating; a higher credit rating lowers banks’ borrowing costs, decreasing their overall cost of capital. The output of other earning assets (Y3) in the Pakistani banking industry encompasses all the assets other than loans, such as securities, investments, and other financial instruments that generate bank revenue. In a broad sense, other earning assets (OEAs) are valuable to banks since they encourage banks to diversify their revenue streams. And yet, high levels of OEA can also elevate banks’ costs, which appears to be the case in Pakistan. For instance, OEAs increase banks’ operational costs since banks must pay fees and commissions to buy and sell OEAs to manage and maintain them. Also, banks must pay brokerage and custodial fees to buy and sell securities and keep OEAs secure. These costs add up, particularly when banks hold an extensive portfolio of OEAs. When the income generated from OEAs does not cover the associated costs, banks’ profitability reduces, and their overall costs increase. While OEAs provide a source of income for Pakistani banks, they also expose banks to additional credit risk. When the value of these assets declines or becomes illiquid and difficult to sell, banks may have to take losses. Also, when banks invest in lower-quality assets, they face a higher risk of credit defaults and other credit-related losses. These losses increase the banks’ costs, thus reducing banking CE.
Table A3.
Stochastic frontier analysis (SFA) trans-log cost function.
Table A3.
Stochastic frontier analysis (SFA) trans-log cost function.
| LN (TC)/LN (W1) | Coefficient | Std. Err. | [95% conf. interval] | |
|---|---|---|---|---|
| LN (Y1) | 0.77 | 0.67 | −0.54 | 2.08 |
| LN (Y1)_LN (Y1) | 0.17 *** | 0.06 | 0.04 | 0.29 |
| LN (Y2) | −2.29 *** | 0.97 | −4.20 | −0.39 |
| LN (Y2)_LN (Y2) | 0.25 *** | 0.04 | 0.16 | 0.34 |
| LN (Y3) | 2.16 *** | 0.73 | 0.73 | 3.60 |
| LN (Y3)_LN (Y3) | −0.16 *** | 0.06 | −0.29 | −0.04 |
| LN (Y4) | 0.12 | 0.29 | −0.44 | 0.69 |
| LN (Y4)_LN (Y4) | −0.02 *** | 0.00 | −0.03 | −0.01 |
| LN (W2/W1) | −0.82 | 1.16 | −3.10 | 1.46 |
| LN (W2/W1)_LN (W2/W1) | −0.88 *** | 0.17 | −1.21 | −0.54 |
| LN (W3/W1) | −0.03 | 2.28 | −4.51 | 4.43 |
| LN (W3/W1)_LN (W3/W1) | −0.11 | 0.29 | −0.68 | 0.45 |
| LN (Y1)_LN (Y2) | −0.50 *** | 0.13 | −0.76 | −0.23 |
| LN (Y1)_LN (Y3) | 0.24 *** | 0.09 | 0.06 | 0.42 |
| LN (Y1)_LN (Y4) | −0.17 *** | 0.05 | −0.27 | −0.06 |
| LN (Y2)_LN (Y3) | −0.04 | 0.10 | −0.23 | 0.15 |
| LN (Y2)_LN (Y4) | 0.24 *** | 0.07 | 0.09 | 0.39 |
| LN (Y3)_LN (Y4) | −0.03 | 0.04 | −0.12 | 0.04 |
| LN (Y1)_LN (W2/W1) | 0.58 *** | 0.17 | 0.23 | 0.93 |
| LN (Y2)_LN (W2/W1) | −0.25 | 0.15 | −0.56 | 0.05 |
| LN (Y3)_LN (W2/W1) | −0.17 | 0.15 | −0.48 | 0.13 |
| LN (Y4)_LN (W2/W1) | −0.11 | 0.07 | −0.25 | 0.02 |
| LN (Y1)_LN (W3/W1) | 0.33 | 0.28 | −0.21 | 0.89 |
| LN (Y2)_LN (W3/W1) | −1.00 *** | 0.21 | −1.42 | −0.59 |
| LN (Y3)_LN (W3/W1) | 1.00 *** | 0.24 | 0.52 | 1.47 |
| LN (Y4)_LN (W3/W1) | −0.46 *** | 0.13 | −0.73 | −0.19 |
| 0.79 *** | 0.10 | 0.60 | 1.03 | |
| 0.25 *** | 0.01 | 0.22 | 0.28 | |
| Constant | −8.63 *** | 3.38 | −15.27 | −1.99 |
| YEAR_DUMMIES | YES | YES | YES | YES |
Log-likelihood = -120.8230, Wald χ2(40) = 947.88 (convergence achieved after 100 iterations). Prob > = 0.0000. *** p < 0.01.
In Table A4, we present the summary statistics for the variables applied in the second-stage analysis. We can observe that the dependent variable (DV), CE, ranges from 4% to 96% with an SD of 9%. Conversely, the competition was evaluated via the LI of market power in three different markets: loan (LIL) ranges from −1.80 to 0.99, deposit (LID) moves from 0.47 to 1, and asset (LIA) fluctuates from −3.54 to 0.99. Furthermore, a statistical summary pertaining to both bank-specific and macroeconomic control factors is also highlighted in Table A4. Besides this, the correlation matrix is illustrated in Table A5. Based on the results, the CE and competition measures (i.e., LIL, LID, and LIA) have a positive correlation. On the other hand, the correlation between the CE and bank-specific control factors equity to total asset ratio (EQTTAR) and loan to total asset (LTA) ratio is negative, while the bank size is positive.
Table A4.
Descriptive statistics of second-stage analysis.
Table A4.
Descriptive statistics of second-stage analysis.
| Variables | Obs | Mean | SD. | Min | Max |
|---|---|---|---|---|---|
| CE (DV) | |||||
| CE | 435 | 0.81 | 0.09 | 0.04 | 0.96 |
| |||||
| 435 | 0.97 | 0.13 | −1.80 | 0.99 |
| 435 | 0.98 | 0.02 | 0.47 | 1 |
| 435 | 0.97 | 0.21 | −3.54 | 0.99 |
| Control factors | |||||
| |||||
| 435 | 29.75 | 101.33 | 0.11 | 710.52 |
| 435 | 51.04 | 22.48 | 1.37 | 165.79 |
| 435 | 35.75 | 13.11 | 5.30 | 87.70 |
| 435 | 18.80 | 1.64 | 14.69 | 22.00 |
| |||||
| 435 | 8.97 | 4.42 | 2.52 | 20.28 |
| 435 | 11.63 | 2.01 | 8.21 | 14.53 |
| 435 | 3.61 | 1.92 | −1.33 | 6.15 |
Note: CE: estimated in the 1st stage using SFA, LIL: LI of market power in loan market, LID: LI of market power in deposit market, LIA: LI of market power in asset market, EQTTAR: equity to total asset ratio, LTA: loan to asset ratio, CTIR: cost to income ratio, SIZE: natural logarithm of total assets, INFRATE: inflation rate, INTRATE: interest rate, GDPGR: GDP growth rate; DV: dependent variable, and IV: independent variable.
Table A5.
Pairwise correlation matrix.
Table A5.
Pairwise correlation matrix.
| # | Variables | (1) | (2) | (3) | (4) | (5) | (6) | (7) | (8) | (9) | (10) | (11) |
|---|---|---|---|---|---|---|---|---|---|---|---|---|
| 1 | CE | 1.00 | ||||||||||
| 2 | LIL | 0.40 *** | 1.00 | |||||||||
| (0.00) | ||||||||||||
| 3 | LID | 0.38 *** | 0.94 *** | 1.00 | ||||||||
| (0.00) | (0.00) | |||||||||||
| 4 | LIA | 0.40 *** | 0.99 *** | 0.93 *** | 1.00 | |||||||
| (0.00) | (0.00) | (0.00) | ||||||||||
| 5 | EQTTAR | −0.24 *** | 0.00 | 0.01 | 0.00 | 1.00 | ||||||
| (0.00) | (0.87) | (0.69) | (0.90) | |||||||||
| 6 | LTA | −0.12 ** | 0.09 ** | 0.14 ** | 0.08 * | 0.66 *** | 1.00 | |||||
| (0.01) | (0.04) | (0.00) | (0.06) | (0.00) | ||||||||
| 7 | CTIR | 0.06 | 0.01 | −0.02 | 0.00 | −0.02 | 0.03 | 1.00 | ||||
| (0.21) | (0.83) | (0.67) | (0.90) | (0.56) | (0.44) | |||||||
| 8 | SIZE | 0.21 *** | 0.04 | −0.04 | 0.05 | −0.43 *** | −0.41 *** | −0.36 *** | 1.00 | |||
| (0.00) | (0.35) | (0.36) | (0.22) | (0.00) | (0.00) | (0.00) | ||||||
| 9 | INFRATE | −0.07 | 0.02 | 0.18 *** | 0.02 | −0.00 | 0.13 ** | −0.16 ** | −0.17 *** | 1.00 | ||
| (0.11) | (0.56) | (0.00) | (0.57) | (0.86) | (0.00) | (0.00) | (0.00) | |||||
| 10 | INTRATE | −0.06 | 0.03 | 0.18 *** | 0.03 | −0.00 | 0.10 ** | −0.19 *** | −0.19 *** | 0.75 *** | 1.00 | |
| (0.20) | (0.51) | (0.00) | (0.52) | (0.98) | (0.02) | (0.00) | (0.00) | (0.00) | ||||
| 11 | GDPGR | −0.00 | −0.04 | −0.16 ** | −0.06 | 0.00 | −0.00 | 0.17 *** | −0.04 | −0.62 *** | −0.47 *** | 1.00 |
| (0.94) | (0.31) | (0.00) | (0.17) | (0.98) | (0.89) | (0.00) | (0.34) | (0.00) | (0.00) |
Note: CE: estimated in the 1st stage using SFA, LIL: LI in loan market, LID: LI in deposit market, LIA: LI in asset market, EQTTAR: equity to total asset ratio, LTA: loan to asset ratio, CTIR: cost to income ratio, SIZE: natural logarithm of total assets, INFRATE: inflation rate, INTRATE: interest rate, and GDPGR: GDP growth rate. *** p < 0.01, ** p < 0.05, * p < 0.1.
Notes
| 1 | https://www.sbp.org.pk/spd/StrategicPlan-2020-Eng.pdf (accessed on 24-12-2023) |
| 2 | Promote banking industry competition (SG3-TO1):
|
| 3 | LI is an inverse measure of competition. |
| 4 | https://www.sbp.org.pk/publications/Pub-Ann.htm (accessed on 17-04-2023) |
| 5 | https://data.worldbank.org/indicator (accessed on 17-04-2023) |
| 6 | The DPDSYS-GMM must fulfill the three essential specifications to validate if the GMM model is appropriately modeled: a significant AR (1) autocorrelation, the absence of AR (2) autocorrelation, and a significant Sargan/Hansen test condition ensure the valid specifications of the DPDSYS-GMM in all models. |
| 7 | https://www.sbp.org.pk/MPMG/index.html (accessed on 16-01-2024) |
| 8 | The parameters derived using the trigonometric harmonic process symbolize the nonlinearities and cyclical sequences in the data that might be modeled by a Fourier flexible functional process. |
| 9 | Validating two opposing models (constrained and unconstrained) assessed via the maximum likelihood method, in which the unconstrained model is maximized over the full sample domain and the constrained model is maximized over specified restrictions, is often performed with the likelihood ratio test. The LR statistic, LR = −2⌊LL(H0) − LL(H1)⌋~χ2, has degrees of freedom from the χ2 distribution equal to the set of constraints in the null hypothesis. While the two models do not vary considerably, the constrained model is acceptable if the statistic has a low value. |
References
- Burki, A.A.; Niazi, G. Impact of financial reforms on efficiency of state-owned, private and foreign banks in Pakistan. Appl. Econ. 2010, 42, 3147–3160. [Google Scholar] [CrossRef]
- Delis, M.D.; Tsionas, E.G. The joint estimation of bank-level market power and efficiency. J. Bank. Financ. 2009, 33, 1842–1850. [Google Scholar] [CrossRef]
- Yin, H. The impact of competition and bank market regulation on banks’ cost efficiency. J. Multinatl. Financ. Manag. 2021, 61, 100677. [Google Scholar] [CrossRef]
- Fiordelisi, F.; Mare, D.S. Competition and financial stability in European cooperative banks. J. Int. Money Financ. 2014, 45, 1–16. [Google Scholar] [CrossRef]
- Izzeldin, M.; Johnes, J.; Ongena, S.; Pappas, V.; Tsionas, M. Efficiency convergence in Islamic and conventional banks. J. Int. Financ. Mark. Inst. Money 2021, 70, 101279. [Google Scholar] [CrossRef]
- Weill, L. Convergence in banking efficiency across European countries. J. Int. Financ. Mark. Inst. Money 2009, 19, 818–833. [Google Scholar] [CrossRef]
- Weill, L. On the relationship between competition and efficiency in the EU banking sectors. Credit. Cap. Mark.–Kredit Und Kap. 2004, 37, 329–352. [Google Scholar] [CrossRef]
- Podpiera, J.; Weill, L. Bad luck or bad management? Emerging banking market experience. J. Financ. Stab. 2008, 4, 135–148. [Google Scholar] [CrossRef]
- Pruteanu-Podpiera, A.; Weill, L.; Schobert, F. Banking competition and efficiency: A micro-data analysis on the Czech banking industry. In Global Banking Crises and Emerging Markets; Brada, J.C., Wachtel, P., Eds.; Springer: Berlin/Heidelberg, Germany, 2016; pp. 52–74. [Google Scholar]
- Casu, B.; Girardone, C. Integration and efficiency convergence in EU banking markets. Omega 2010, 38, 260–267. [Google Scholar] [CrossRef]
- Casu, B.; Girardone, C. Testing the relationship between competition and efficiency in banking: A panel data analysis. Econ. Lett. 2009, 105, 134–137. [Google Scholar] [CrossRef]
- Iimi, A. Banking sector reforms in Pakistan: Economies of scale and scope, and cost complementarities. J. Asian Econ. 2004, 15, 507–528. [Google Scholar] [CrossRef]
- Ataullah, A.; Le, H. Economic reforms and bank efficiency in developing countries: The case of the Indian banking industry. Appl. Financ. Econ. 2006, 16, 653–663. [Google Scholar] [CrossRef]
- Ataullah, A.; Cockerill, T.; Le, H. Financial liberalization and bank efficiency: A comparative analysis of India and Pakistan. Appl. Econ. 2004, 36, 1915–1924. [Google Scholar] [CrossRef]
- Zhu, N.; Shah, W.U.H.; Kamal, M.A.; Yasmeen, R. Efficiency and productivity analysis of Pakistan’s banking industry: A DEA approach. Int. J. Financ. Econ. 2021, 26, 6362–6374. [Google Scholar] [CrossRef]
- Shah, W.U.H.; Hao, G.; Zhu, N.; Yasmeen, R.; Padda, I.U.H.; Kamal, M.A. A cross-country efficiency and productivity evaluation of commercial banks in South Asia: A meta-frontier and Malmquist productivity index approach. PLoS ONE 2022, 17, e0265349. [Google Scholar] [CrossRef]
- Koetter, M.; Kolari, J.W.; Spierdijk, L. Enjoying the quiet life under deregulation? Evidence from adjusted Lerner indices for US banks. Rev. Econ. Stat. 2012, 94, 462–480. [Google Scholar] [CrossRef]
- Fiordelisi, F.; Marques-Ibanez, D.; Molyneux, P. Efficiency and risk in European banking. J. Bank. Financ. 2011, 35, 1315–1326. [Google Scholar] [CrossRef]
- Berger, A.N.; Hannan, T.H. The efficiency cost of market power in the banking industry: A test of the “quiet life” and related hypotheses. Rev. Econ. Stat. 1998, 80, 454–465. [Google Scholar] [CrossRef]
- Prakash, N.; Singh, S.; Sharma, S. Technological diffusion, banking efficiency and Solow’s paradox: A frontier-based parametric and non-parametric analysis. Struct. Change Econ. Dyn. 2021, 58, 534–551. [Google Scholar] [CrossRef]
- El Moussawi, C.; Mansour, R. Competition, cost efficiency and stability of banks in the MENA region. Q. Rev. Econ. Financ. 2022, 84, 143–170. [Google Scholar] [CrossRef]
- Bayeh, A.; Bitar, M.; Burlacu, R.; Walker, T. Competition, securitization, and efficiency in US banks. Q. Rev. Econ. Financ. 2021, 80, 553–576. [Google Scholar] [CrossRef]
- Kuessi, R.; Aguey, S.; Couchoro, M.K. Competition and banking efficiency in the WAEMU: The role of multinationals and institutions. Int. Econ. 2023, 175, 45–62. [Google Scholar] [CrossRef]
- Berger, A.N.; DeYoung, R. Problem loans and cost efficiency in commercial banks. J. Bank. Financ. 1997, 21, 849–870. [Google Scholar] [CrossRef]
- Matousek, R.; Rughoo, A.; Sarantis, N.; Assaf, A.G. Bank performance and convergence during the financial crisis: Evidence from the ‘old’ European Union and Eurozone. J. Bank. Financ. 2015, 52, 208–216. [Google Scholar] [CrossRef]
- Tahir, M.; Shah, S.S.A.; Afridi, M.A. Assessing nature of competition in banking sector of Pakistan. J. Financ. Data Sci. 2016, 2, 244–253. [Google Scholar] [CrossRef]
- Hanif, M.N. Measuring competition in the banking sector of pakistan: An application of boone indicator. JISR Manag. Soc. Sci. Econ. 2017, 15, 47–60. [Google Scholar]
- Levine, R. Finance and growth: Theory and evidence. Handb. Econ. Growth 2005, 1, 865–934. [Google Scholar]
- Bain, J.S. Barriers to New Competition: Their Character and Consequences in Manufacturing Industries; Harvard University Press: Cambridge, MA, USA, 1956. [Google Scholar]
- Hicks, J.R. Annual survey of economic theory: The theory of monopoly. Econom. J. Econom. Soc. 1935, 3, 1–20. [Google Scholar] [CrossRef]
- Demsetz, H. Industry structure, market rivalry, and public policy. J. Law Econ. 1973, 16, 1–9. [Google Scholar] [CrossRef]
- Berger, A.N. The profit-structure relationship in banking—Tests of market-power and efficient-structure hypotheses. J. Money Credit. Bank. 1995, 27, 404–431. [Google Scholar] [CrossRef]
- Asongu, S.A.; Odhiambo, N.M. Testing the quiet life hypothesis in the African banking industry. J. Ind. Compet. Trade 2019, 19, 69–82. [Google Scholar] [CrossRef]
- Coccorese, P.; Pellecchia, A. Testing the ‘quiet life’ hypothesis in the Italian banking industry. Econ. Notes 2010, 39, 173–202. [Google Scholar] [CrossRef]
- Färe, R.; Grosskopf, S.; Maudos, J.; Tortosa-Ausina, E. Revisiting the quiet life hypothesis in banking using nonparametric techniques. J. Bus. Econ. Manag. 2015, 16, 159–187. [Google Scholar] [CrossRef]
- Eggoh, J.; Dannon, H.; Ndiaye, A. Analysis of the quiet life hypothesis implications in the WAEMU banking sector. Afr. Dev. Rev. 2021, 33, 533–545. [Google Scholar] [CrossRef]
- Molyneux, P.; Forbes, W. Market structure and performance in European banking. Appl. Econ. 1995, 27, 155–159. [Google Scholar] [CrossRef]
- Khan, M.U.H.; Hanif, M.N. Empirical evaluation of ‘structure-conduct-performance’ and ‘efficient-structure’ paradigms in banking sector of Pakistan. Int. Rev. Appl. Econ. 2019, 33, 682–696. [Google Scholar] [CrossRef]
- Khan, H.H.; Ahmad, R.B.; Chan, S.G. Market structure, bank conduct and bank performance: Evidence from ASEAN. J. Policy Model. 2018, 40, 934–958. [Google Scholar] [CrossRef]
- Duc-Nguyen, N.; Mishra, A.V.; Daly, K. Variation in the competition—Efficiency nexus: Evidence from emerging markets. Int. Rev. Econ. Financ. 2023, 83, 401–420. [Google Scholar] [CrossRef]
- Maudos, J.; De Guevara, J.F. The cost of market power in banking: Social welfare loss vs. cost inefficiency. J. Bank. Financ. 2007, 31, 2103–2125. [Google Scholar] [CrossRef]
- Bain, J.S. Relation of profit rate to industry concentration: American manufacturing, 1936–1940. Q. J. Econ. 1951, 65, 293–324. [Google Scholar] [CrossRef]
- Goldberg, L.G.; Rai, A. The structure-performance relationship for European banking. J. Bank. Financ. 1996, 20, 745–771. [Google Scholar] [CrossRef]
- Hauswald, R.; Marquez, R. Competition and strategic information acquisition in credit markets. Rev. Financ. Stud. 2006, 19, 967–1000. [Google Scholar] [CrossRef]
- Coccorese, P.; Misra, B.S. Market power and efficiency of Indian banks: Does the “quiet life” hypothesis hold? Manag. Financ. 2022, 48, 953–983. [Google Scholar] [CrossRef]
- Khan, I.U.; Ali, S.; Khan, H.N. Market concentration, risk-taking, and efficiency of commercial banks in Pakistan: An application of the two-stage double bootstrap DEA. Bus. Econ. Rev. 2018, 10, 65–95. [Google Scholar] [CrossRef]
- Asongu, S.; Nting, R.; Nnanna, J. Market power and cost efficiency in the African banking industry. J. Econ. Stud. 2020, 47, 1247–1264. [Google Scholar] [CrossRef]
- Battese, G.E.; Coelli, T.J. A model for technical inefficiency effects in a stochastic frontier production function for panel data. Empir. Econ. 1995, 20, 325–332. [Google Scholar] [CrossRef]
- Berger, A.N.; Humphrey, D.B. Efficiency of financial institutions: International survey and directions for future research. Eur. J. Oper. Res. 1997, 98, 175–212. [Google Scholar] [CrossRef]
- Carvallo, O.; Kasman, A. Convergence in bank performance: Evidence from Latin American banking. N. Am. J. Econ. Financ. 2017, 39, 127–142. [Google Scholar] [CrossRef]
- Hussain, M.; Bashir, U.; Bilal, A.R. Effect of monetary policy on bank risk: Does market structure matter? Int. J. Emerg. Mark. 2021, 16, 696–725. [Google Scholar] [CrossRef]
- Hussain, M.; Bashir, U. Impact of monetary policy on bank lending: Does market structure matter? Int. Econ. J. 2019, 33, 620–648. [Google Scholar] [CrossRef]
- Degl’Innocenti, M.; Mishra, T.; Wolfe, S. Branching, lending and competition in Italian banking. Eur. J. Financ. 2018, 24, 208–230. [Google Scholar] [CrossRef]
- Gardener, E.; Molyneux, P.; Nguyen-Linh, H. Determinants of efficiency in South East Asian banking. Serv. Ind. J. 2011, 31, 2693–2719. [Google Scholar] [CrossRef]
- Nguyen, D.T.T.; Diaz-Rainey, I.; Roberts, H.; Le, M. The non-monotonic relationship between financial integration and cost efficiency: Evidence from East Asian commercial banks. Int. Rev. Econ. Financ. 2022, 80, 418–438. [Google Scholar] [CrossRef]
- Brissimis, S.N.; Delis, M.D.; Papanikolaou, N.I. Exploring the nexus between banking sector reform and performance: Evidence from newly acceded EU countries. J. Bank. Financ. 2008, 32, 2674–2683. [Google Scholar] [CrossRef]
- Olson, D.; Zoubi, T. Convergence in bank performance for commercial and Islamic banks during and after the Global Financial Crisis. Q. Rev. Econ. Financ. 2017, 65, 71–87. [Google Scholar] [CrossRef]
- Khan, S.; Polat, A.; Bashir, U. Factors affecting the financial performance of Islamic banks in Pakistan. FWU J. Soc. Sci. 2023, 17, 62–76. [Google Scholar]
- Řepková, I. Banking efficiency determinants in the Czech banking sector. Procedia Econ. Financ. 2015, 23, 191–196. [Google Scholar] [CrossRef]
- Blundell, R.; Bond, S. Initial conditions and moment restrictions in dynamic panel data models. J. Econom. 1998, 87, 115–143. [Google Scholar] [CrossRef]
- Blundell, R.; Bond, S. GMM estimation with persistent panel data: An application to production functions. Econom. Rev. 2000, 19, 321–340. [Google Scholar] [CrossRef]
- Arellano, M.; Bond, S. Some tests of specification for panel data: Monte Carlo evidence and an application to employment equations. Rev. Econ. Stud. 1991, 58, 277–297. [Google Scholar] [CrossRef]
- Bashir, U.; Yugang, Y.; Hussain, M. Role of bank heterogeneity and market structure in transmitting monetary policy via bank lending channel: Empirical evidence from Chinese banking sector. Post-Communist Econ. 2020, 32, 1038–1061. [Google Scholar] [CrossRef]
- Roodman, D. A note on the theme of too many instruments. Oxf. Bull. Econ. Stat. 2009, 71, 135–158. [Google Scholar] [CrossRef]
- Bashir, U.; Khan, S.; Jones, A.; Hussain, M. Do banking system transparency and market structure affect financial stability of Chinese banks? Econ. Change Restruct. 2021, 54, 1–41. [Google Scholar] [CrossRef]
- Mustafa, S.; Zhang, W.; Naveed, M.M.; e Adan, D. Using social Cognitive theory to reengage dormant users in question and answer Communities: A case study of active StackOverflow participants. Electron. Commer. Res. Appl. 2024, 68, 101450. [Google Scholar] [CrossRef]
- Mustafa, S.; Zhang, W.; Naveed, M. M What motivates online community contributors to contribute consistently? A case study on Stackoverflow netizens. Curr. Psychol. 2023, 42, 10468–10481. [Google Scholar] [CrossRef]
- Mustafa, S.; Zhang, W.; Naveed, M.M. How to mend the dormant user in Q&A communities? A social cognitive theory-based study of consistent geeks of StackOverflow. Behav. Inf. Technol. 2023, 43, 2024–2043. [Google Scholar]
- An, Q.; Chen, H.; Wu, J.; Liang, L. Measuring slacks-based efficiency for commercial banks in China by using a two-stage DEA model with undesirable output. Ann. Oper. Res. 2015, 235, 13–35. [Google Scholar] [CrossRef]
- Huang, J.; Chen, J.; Yin, Z. A network DEA model with super efficiency and undesirable outputs: An application to bank efficiency in China. Math. Probl. Eng. 2014, 2014, 793192. [Google Scholar] [CrossRef]
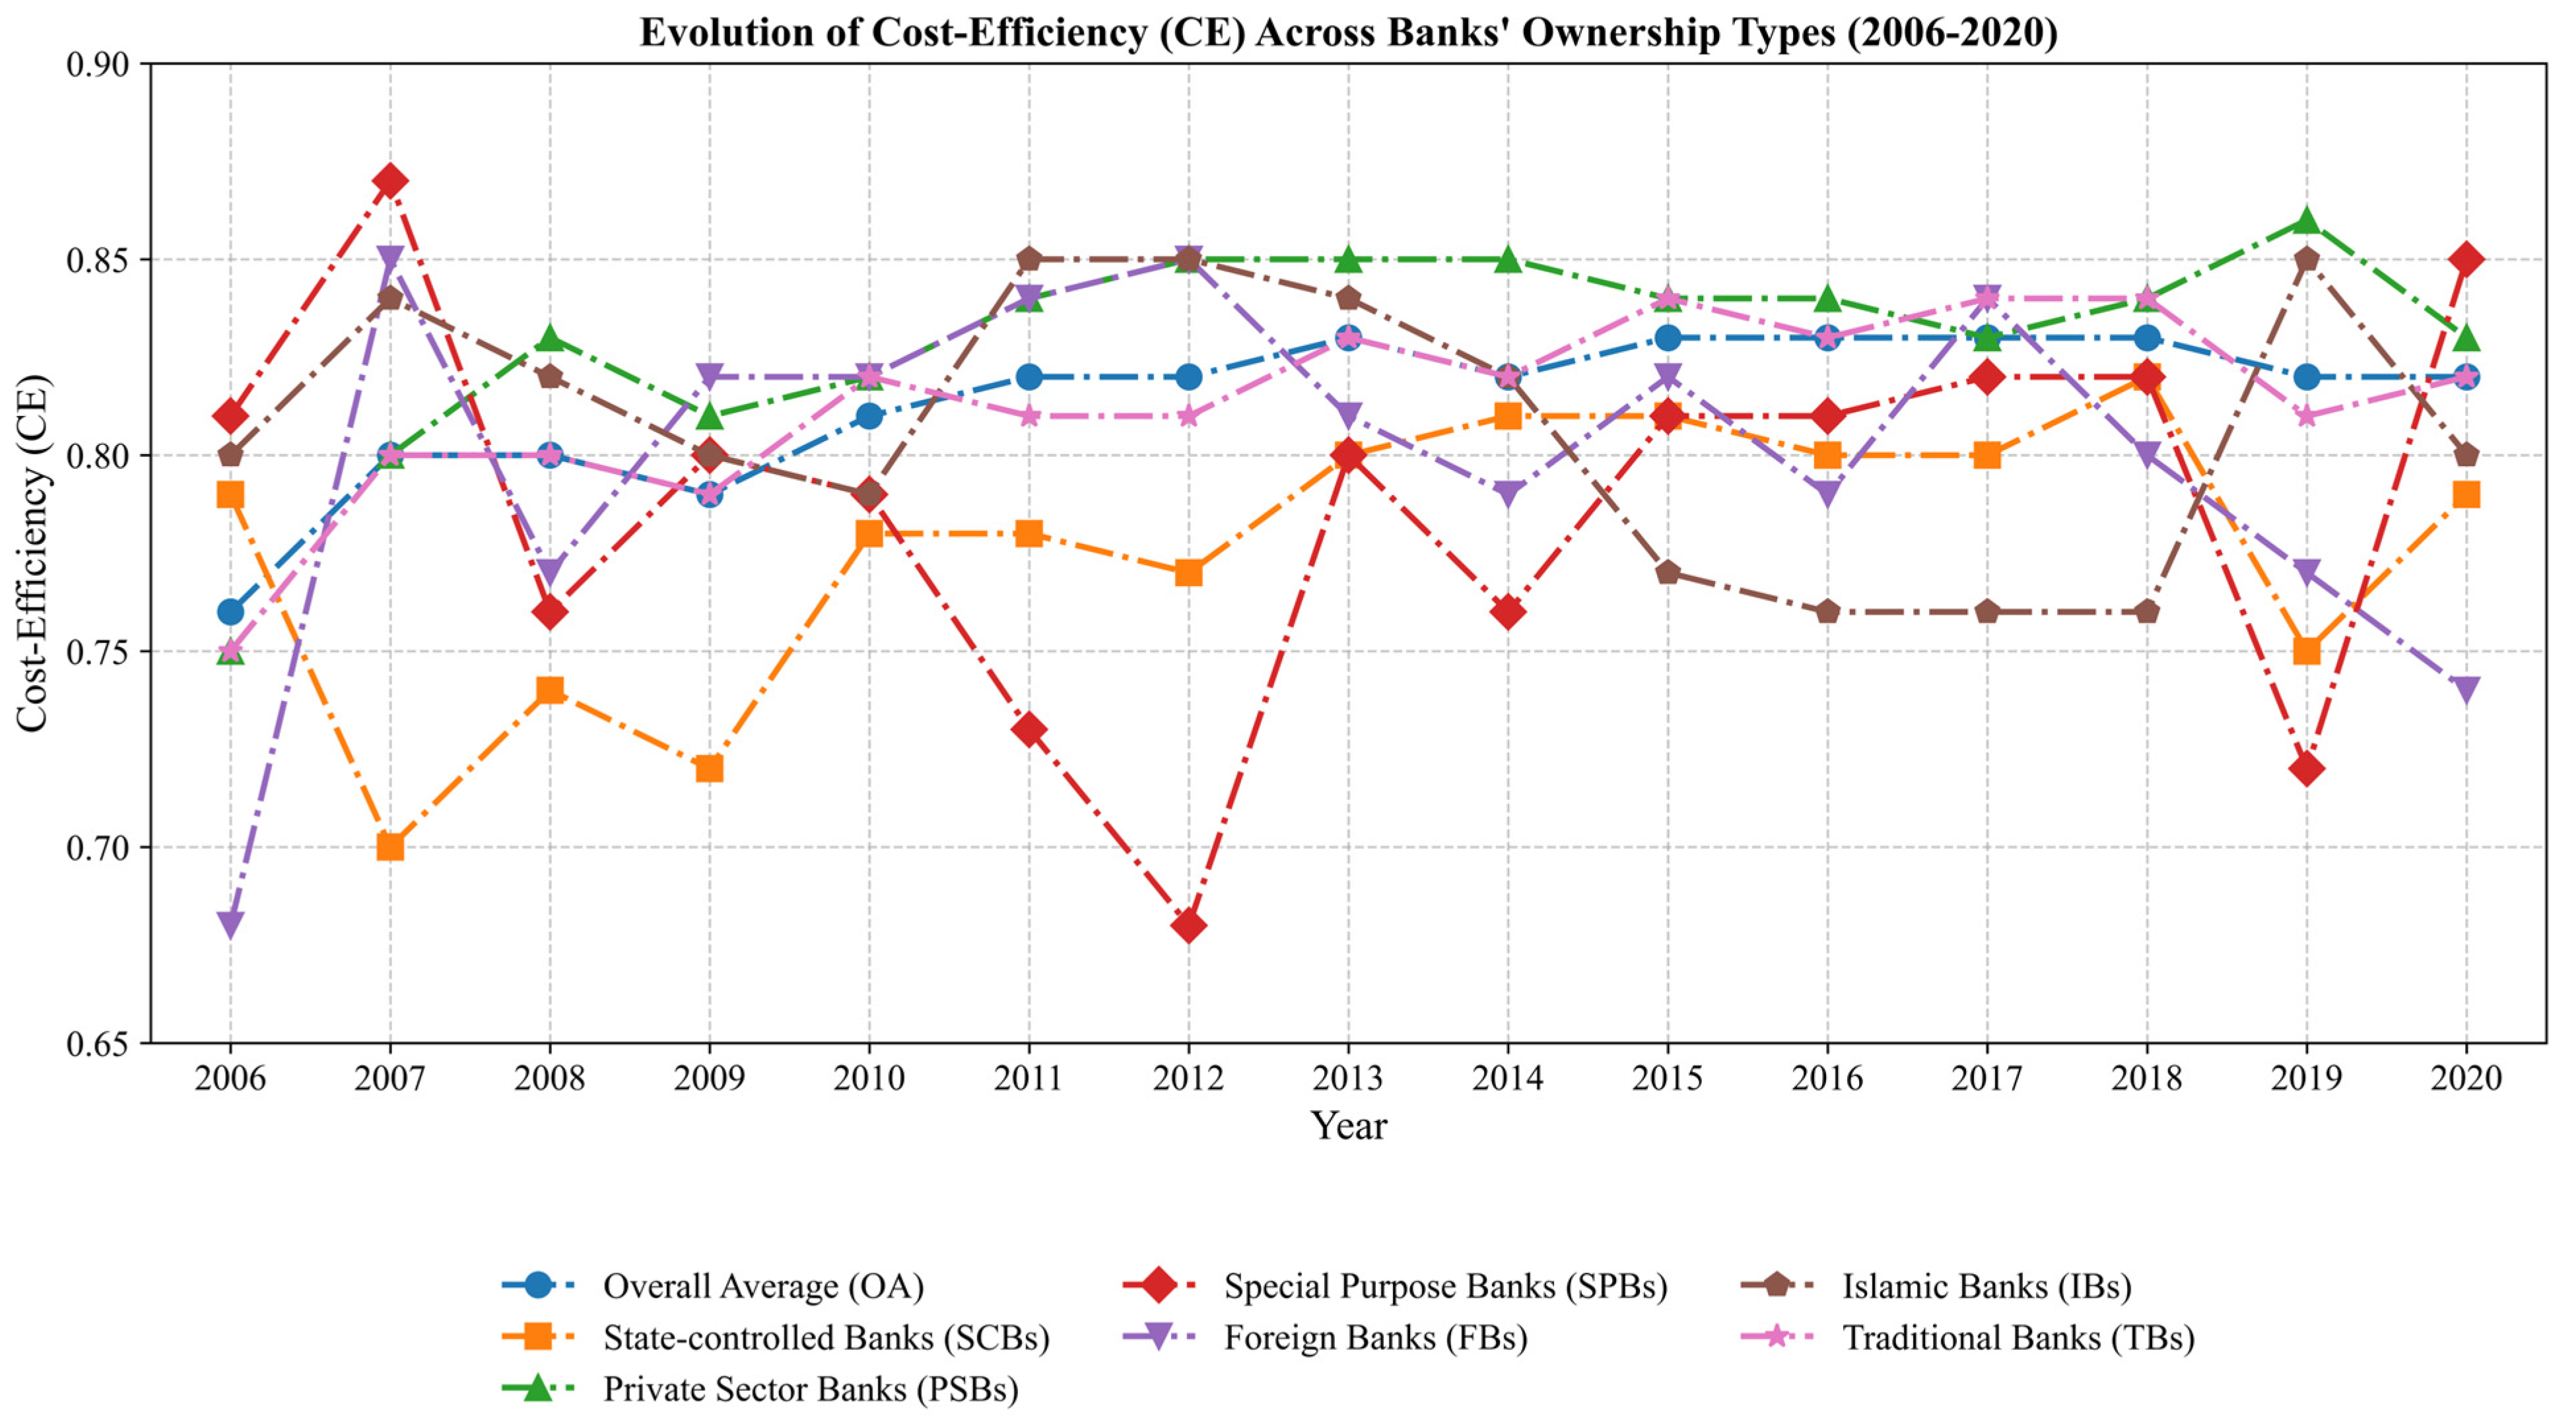
Disclaimer/Publisher’s Note: The statements, opinions and data contained in all publications are solely those of the individual author(s) and contributor(s) and not of MDPI and/or the editor(s). MDPI and/or the editor(s) disclaim responsibility for any injury to people or property resulting from any ideas, methods, instructions or products referred to in the content. |
© 2025 by the authors. Licensee MDPI, Basel, Switzerland. This article is an open access article distributed under the terms and conditions of the Creative Commons Attribution (CC BY) license (https://creativecommons.org/licenses/by/4.0/).