Abstract
Ship collisions pose a significant threat to maritime safety, especially in congested precautionary areas with high vessel traffic density. Traditional collision risk assessment methods, such as distance to closest point of approach (DCPA) and time to closest point of approach (TCPA), often overlook environmental uncertainties and variations in human response. To address these limitations, this study proposes a novel approach for collision risk assessment using automatic identification system (AIS) data. AIS data from vessels in precautionary areas are resampled to synchronize their temporal frameworks, enabling the systematic identification of ship encounters. Each encounter is analyzed by evaluating critical parameters, including the minimum ship encounter distance (MSED), relative azimuth angles, and trajectories, within a customized ship domain model that incorporates vessel characteristics such as ship length and course. Key metrics, such as intrusion depth and time, are calculated based on vessels’ entry and exit points during each encounter. A set of collision risk indices, which integrates both intrusion depth and time, is introduced, with particular emphasis on intrusion depth due to its heightened sensitivity to proximity danger and constrained maneuvering space. An extensive analysis of vessel interactions in the precautionary area establishes a holistic collision risk index. A case study using AIS data from Ningbo–Zhoushan Port, involving a dataset of 1000 ship encounters, demonstrates the effectiveness of the proposed method. Specifically, the holistic collision risk in the No.2 precautionary area is 0.456, while the No.3 precautionary area shows a risk value of 0.443. These results confirm the effectiveness and feasibility of the proposed method for evaluating and classifying collision risks, offering a more precise and reliable framework for collision risk assessment in complex navigational environments.
1. Introduction
Precautionary areas are designated high-alert zones in maritime navigation and are typically established around busy ports and congested waterways to manage dense vessel traffic and mitigate collision risks. These areas are often characterized by intersecting routes, a diversity of vessel types, and dynamic environmental conditions such as tides and weather, all of which increase the frequency of vessel encounters and the potential for collisions [1]. Vessels navigating within these areas must maintain heightened vigilance and continuously monitor their navigational status, nearby vessels, and environmental changes [2]. The risk of collision is significantly heightened due to the high traffic density and the inherent complexity of the maritime environment.
Traditional collision risk assessment methods primarily focus on analyzing vessel encounter situations using quantitative indicators like DCPA and TCPA [3]. These methods evaluate the potential for collisions based on vessels’ relative positions, speeds, and courses, typically assuming linear and predictable movement patterns. By assessing the proximity and timing of vessels’ closest approaches, these methods provide a foundation for decision-making in standard navigational scenarios. However, these approaches have limitations in addressing intricate maneuvers or dynamic traffic patterns, particularly in high-traffic areas. In precautionary areas, vessel routes frequently intersect, and many vessels are engaged in complex maneuvers, such as turns that simultaneously aim to avoid collisions and adhere to recommended routing schemes. These dynamic and multifaceted operations introduce interactions and uncertainties that traditional methods fail to fully capture. Consequently, static metrics like DCPA and TCPA have proven to be insufficient for assessing collision risks in the complex and evolving traffic patterns characteristic of precautionary areas [1,2]. This underscores the necessity for more advanced methods to address the heightened navigational challenges in such environments [2,4].
In response to these challenges, this study proposes a novel approach that integrates extensive AIS data and innovative risk assessment techniques to evaluate holistic collision risks for ships in precautionary areas. This approach evaluates the cumulative effect of all collision-avoidance maneuvers by tracking dynamic changes in vessel behavior, such as alterations in heading, speed, or route, that occur during evasive actions. By analyzing the resultant changes in trajectory, the approach captures the collision-avoidance situations of vessels in response to potential collision threats, thereby offering a more holistic understanding of the interactions and risk dynamics in busy maritime environments.
One of the notable contributions of this study is the integration of AIS-derived intrusion parameters, specifically, intrusion depth and intrusion time, within a ship domain model tailored for high-density traffic conditions in precautionary areas, enabling localized trend analysis and collision risk evaluation in complex navigational scenarios. By identifying recurring patterns of navigational adjustments in specific areas, the method not only uncovers localized high-risk scenarios but also reveals systemic challenges in collision avoidance. This trend analysis is particularly valuable, as it highlights how vessels collectively respond to local constraints, such as high traffic density or adverse environmental conditions, over extended periods. As a result, the method is capable of pinpointing areas where risk mitigation strategies may be required. Moreover, the utilization of a holistic risk metric based on the cumulative outcomes of all observed maneuvers distinguishes this method from traditional risk assessment models. Unlike evaluating risk on an individual vessel basis, the resultant metric encapsulates the broader interplay of vessel interactions, offering a comprehensive risk profile that better reflects the complexities of modern maritime navigation. This approach ensures that subtle yet critical behaviors, frequently neglected by static models, are incorporated into the overall evaluation, thereby offering an innovative solution for predicting and mitigating collision risks in dynamic and congested maritime environments.
The structure of this paper is as follows. Section 1 provides an introduction to the study, while Section 2 reviews existing research on ship collision risk assessment. Section 3 elaborates on the research methodology in detail, followed by Section 4, which presents the practical application of the proposed model. Section 5 discusses its strengths and limitations, and finally, Section 6 summarizes with key findings and suggestions for future research directions.
2. Literature Review
2.1. Indicators and Methods for Ship Collision Risk Assessment
The methods for ship collision risk assessment utilize key indicators such as relative distance, relative speed, TCPA, and DCPA. Table 1 summarizes the specific indicators selected by different authors and the corresponding methods they developed for collision risk assessment. Although these methodologies demonstrate effectiveness in many scenarios, they often fail to account for dynamic and interaction factors, such as vessel characteristics and navigational environment. This limits their ability to address complex maneuvers or dynamic traffic patterns, particularly in high-traffic areas.

Table 1.
Indicators and methods for collision risk assessment.
2.2. Ship Domain and Collision Risk
The concept of a ship’s domain is defined as the designated area surrounding a vessel within which other ships should not intrude to avoid collisions. This domain serves as a buffer zone. Therefore, any breach of this zone can be regarded as a potential risk of collision. By analyzing the trajectories of ships during their maneuvers, it is possible to quantify the collision risk by assessing whether a ship’s domain has been compromised during collision-avoidance processes.
Researchers have proposed various geometric shapes for ship domains, including elliptical, circular, and polygonal forms [3]. Initial studies focused on establishing static geometric formulations of ship domains. For instance, Fujii and Tanaka [23] proposed an elliptical ship domain based on statistical methods, defining the long axis as 8 times the ship’s length and the short axis as 3.2 times its length. This approach was particularly useful for analyzing traffic flow in constrained channels, where a breach of the elliptical boundary would signal increased collision risk. Similarly, Goodwin [24] introduced a circular ship domain partitioned into three asymmetric sectors, aiming to assess encounter distances under the International Regulations for the Prevention of Collisions at Sea. Meanwhile, Pietrzykowski [25] and Ning Wang [26] explored polygonal and quaternion ship domain (QSD) models, respectively, incorporating factors like ship size, speed, and maneuverability into the domain’s shape. In each of these approaches, any violation of the defined geometric boundary is interpreted as an indicator of heightened collision risk.
The advent of automatic identification systems (AIS) has transformed ship domain modeling by enabling dynamic, real-time analyses. Hansen [27] utilized four years of sailing distance data in Southern Danish waters to establish an empirical minimum ship domain—a comfortable buffer that, when breached, signifies an elevated risk of collision. Yueying Wang [28] further introduced a model for confined waters where polygonal domains expand dynamically with increasing speed. Fan Zhang et al. [29] advanced this concept by leveraging AIS data to analyze ship trajectories under varying hydrological conditions in inland waters, dynamically determining the collision-avoidance domain. Here, the breach of the dynamic domain, as detected from the real-time trajectories, quantitatively indicates collision risk and informs traffic management decisions.
Subsequent research has refined the ship domain concept with models that directly link domain violations to collision risk assessment. For example, Dinh et al. [30] proposed a dual-part ship domain that consists of a quadrilateral “blocking zone” and a circular “action zone” to differentiate areas requiring immediate reaction from those demanding heightened caution. Kundakçı et al. [31] utilized extensive ship encounter data from multiple locations to predict safe space requirements for coastal vessels, while Dongqin Liu et al. [32] introduced a dynamic quaternion ship domain (DQSD) model that integrates AIS data with the navigator’s state to capture changes in the domain shape and size in real-time. Notably, Silveira [33] refined the quaternion model by allowing each quadrant to have distinct shapes, thereby enabling domain breaches to serve as direct indicators of collision risk. Additional models, such as those developed by Rawson et al. [34], Zhang and Meng [35], and later, fuzzy and dynamic models by Liu et al. [36,37], further demonstrate that monitoring ship trajectories and assessing domain breaches provide a quantifiable metric for evaluating collision risk under various navigational scenarios.
Collectively, these studies underscore that the ship domain is not only a spatial concept but also a critical risk assessment tool. By analyzing ship trajectories and detecting breaches of the predefined or dynamically adjusted ship domains, researchers and practitioners can quantitatively evaluate the risk of collision. This approach enhances maritime safety by providing a measurable indicator of risk that can be incorporated into collision-avoidance systems and traffic management protocols. However, as noted by Szlapczynski et al. [38], these models are inherently influenced by empirical data limitations, subjective assessments, and the specific assumptions embedded within each modeling approach.
2.3. Assessment of Ship Collision Risk Using AIS Data
The widespread adoption of automatic identification systems (AIS) in maritime navigation has provided a valuable source of historical navigational data, enabling researchers to develop diverse methods for assessing ship collision risk under various scenarios.
At major ports, where traffic density is high and safe maneuvering is critical, AIS data have been effectively employed to assess collision risks. Qin Lin et al. [39] developed a method that utilizes the Gini coefficient to quantitatively evaluate collision risk in routing waters. By calculating the Gini coefficient for each leg’s course over ground (COG) using historical AIS data from Ningbo–Zhoushan Port, they employed a hierarchical clustering algorithm (HCA) to classify 28 routing legs into five distinct risk levels. Hongxiang Feng et al. [40] introduced an alternative method that integrates information entropy with K-means clustering. This technique was applied to the surface channel of Ningbo–Zhoushan Port, where AIS data were used to compute information entropy. K-means clustering then categorizes different segments, identifying precautionary areas (PAs) 2, 4, and 7 as having the highest collision risk. In contrast, other segments, including PA 1, 5, 6, and traffic separation scheme (TSS) segments 16 and 17, fell within the medium–high risk category. AIS data have also proven valuable in high-traffic straits, where the dynamic interaction of vessels requires continuous monitoring. Xiaobo Qu et al. [41] employed AIS data to calculate three collision risk indices—velocity dispersion, additive and subtractive rate, and fuzzy vessel domain overlap—to identify four high-risk segments within the Singapore Strait. Xing Wu et al. [42] analyzed AIS data from the South Texas Straits to quantify the frequency of ship conflicts, thereby capturing route-specific collision risks and highlighting areas where navigational safety measures might be needed.
In open-water environments, AIS data aids in detecting subtle indicators of collision risk. Lei Du et al. [43] utilized AIS data to detect proximity collisions in the North Baltic Sea. By correlating observed ship behaviors with collision risk metrics, their study demonstrated that real-time AIS data can be instrumental in identifying risky navigational patterns in open waters. For regions with complex traffic dynamics, simulation studies incorporating AIS data and additional risk indicators have been developed. Uluscu et al. [44] combined expert judgment with historical accident records within a probabilistic risk model enhanced by AIS data to simulate and assess collision risk in the Istanbul Strait. This integrated approach underscores the potential of AIS data to inform simulation models in challenging navigational environments. Zhensheng Ding et al. [45] developed a ship collision risk quantification model based on the vessel conflict ranking operator (VCRO) with the objective of identifying collision situations from vast amounts of raw AIS data. Xiaofei Ma et al. [46] utilized AIS data to establish a framework of a marine collision risk identification strategy to quantitatively analyze collision risks and provide an easy and convenient way to monitor traffic flow in relevant waters to mitigate the chances of collision. Ryan wen Liu et al. [47] proposed an integrated framework for ship collision risk analysis and validated it through AIS data experiments in the Cheng Shantou waters. The results demonstrate the framework’s superior performance in maritime risk computation, visualization, and forecasting, offering theoretical support for intelligent maritime transportation systems. Haifeng Ding et al. [48] aimed to propose a data fusion-based methodology for the robust assessment of vessel collision risk in inland waterways by integrating AIS data with visual data. Zhao-men Liu et al. [49] introduced a quantitative analysis method for measuring ship collision risk, utilizing both static and dynamic information from AIS data.
While AIS data provides valuable insights into vessel movements and enhances maritime situational awareness, its use in collision risk assessment has notable limitations. The data may be incomplete or inaccurate due to technical issues, non-equipped vessels, or intentional manipulation, potentially leading to risk underestimation. Moreover, conventional risk models based on AIS often oversimplify complex navigational scenarios by relying on static indicators like DCPA and TCPA, neglecting dynamic factors such as weather conditions and human decisions.
3. Methods
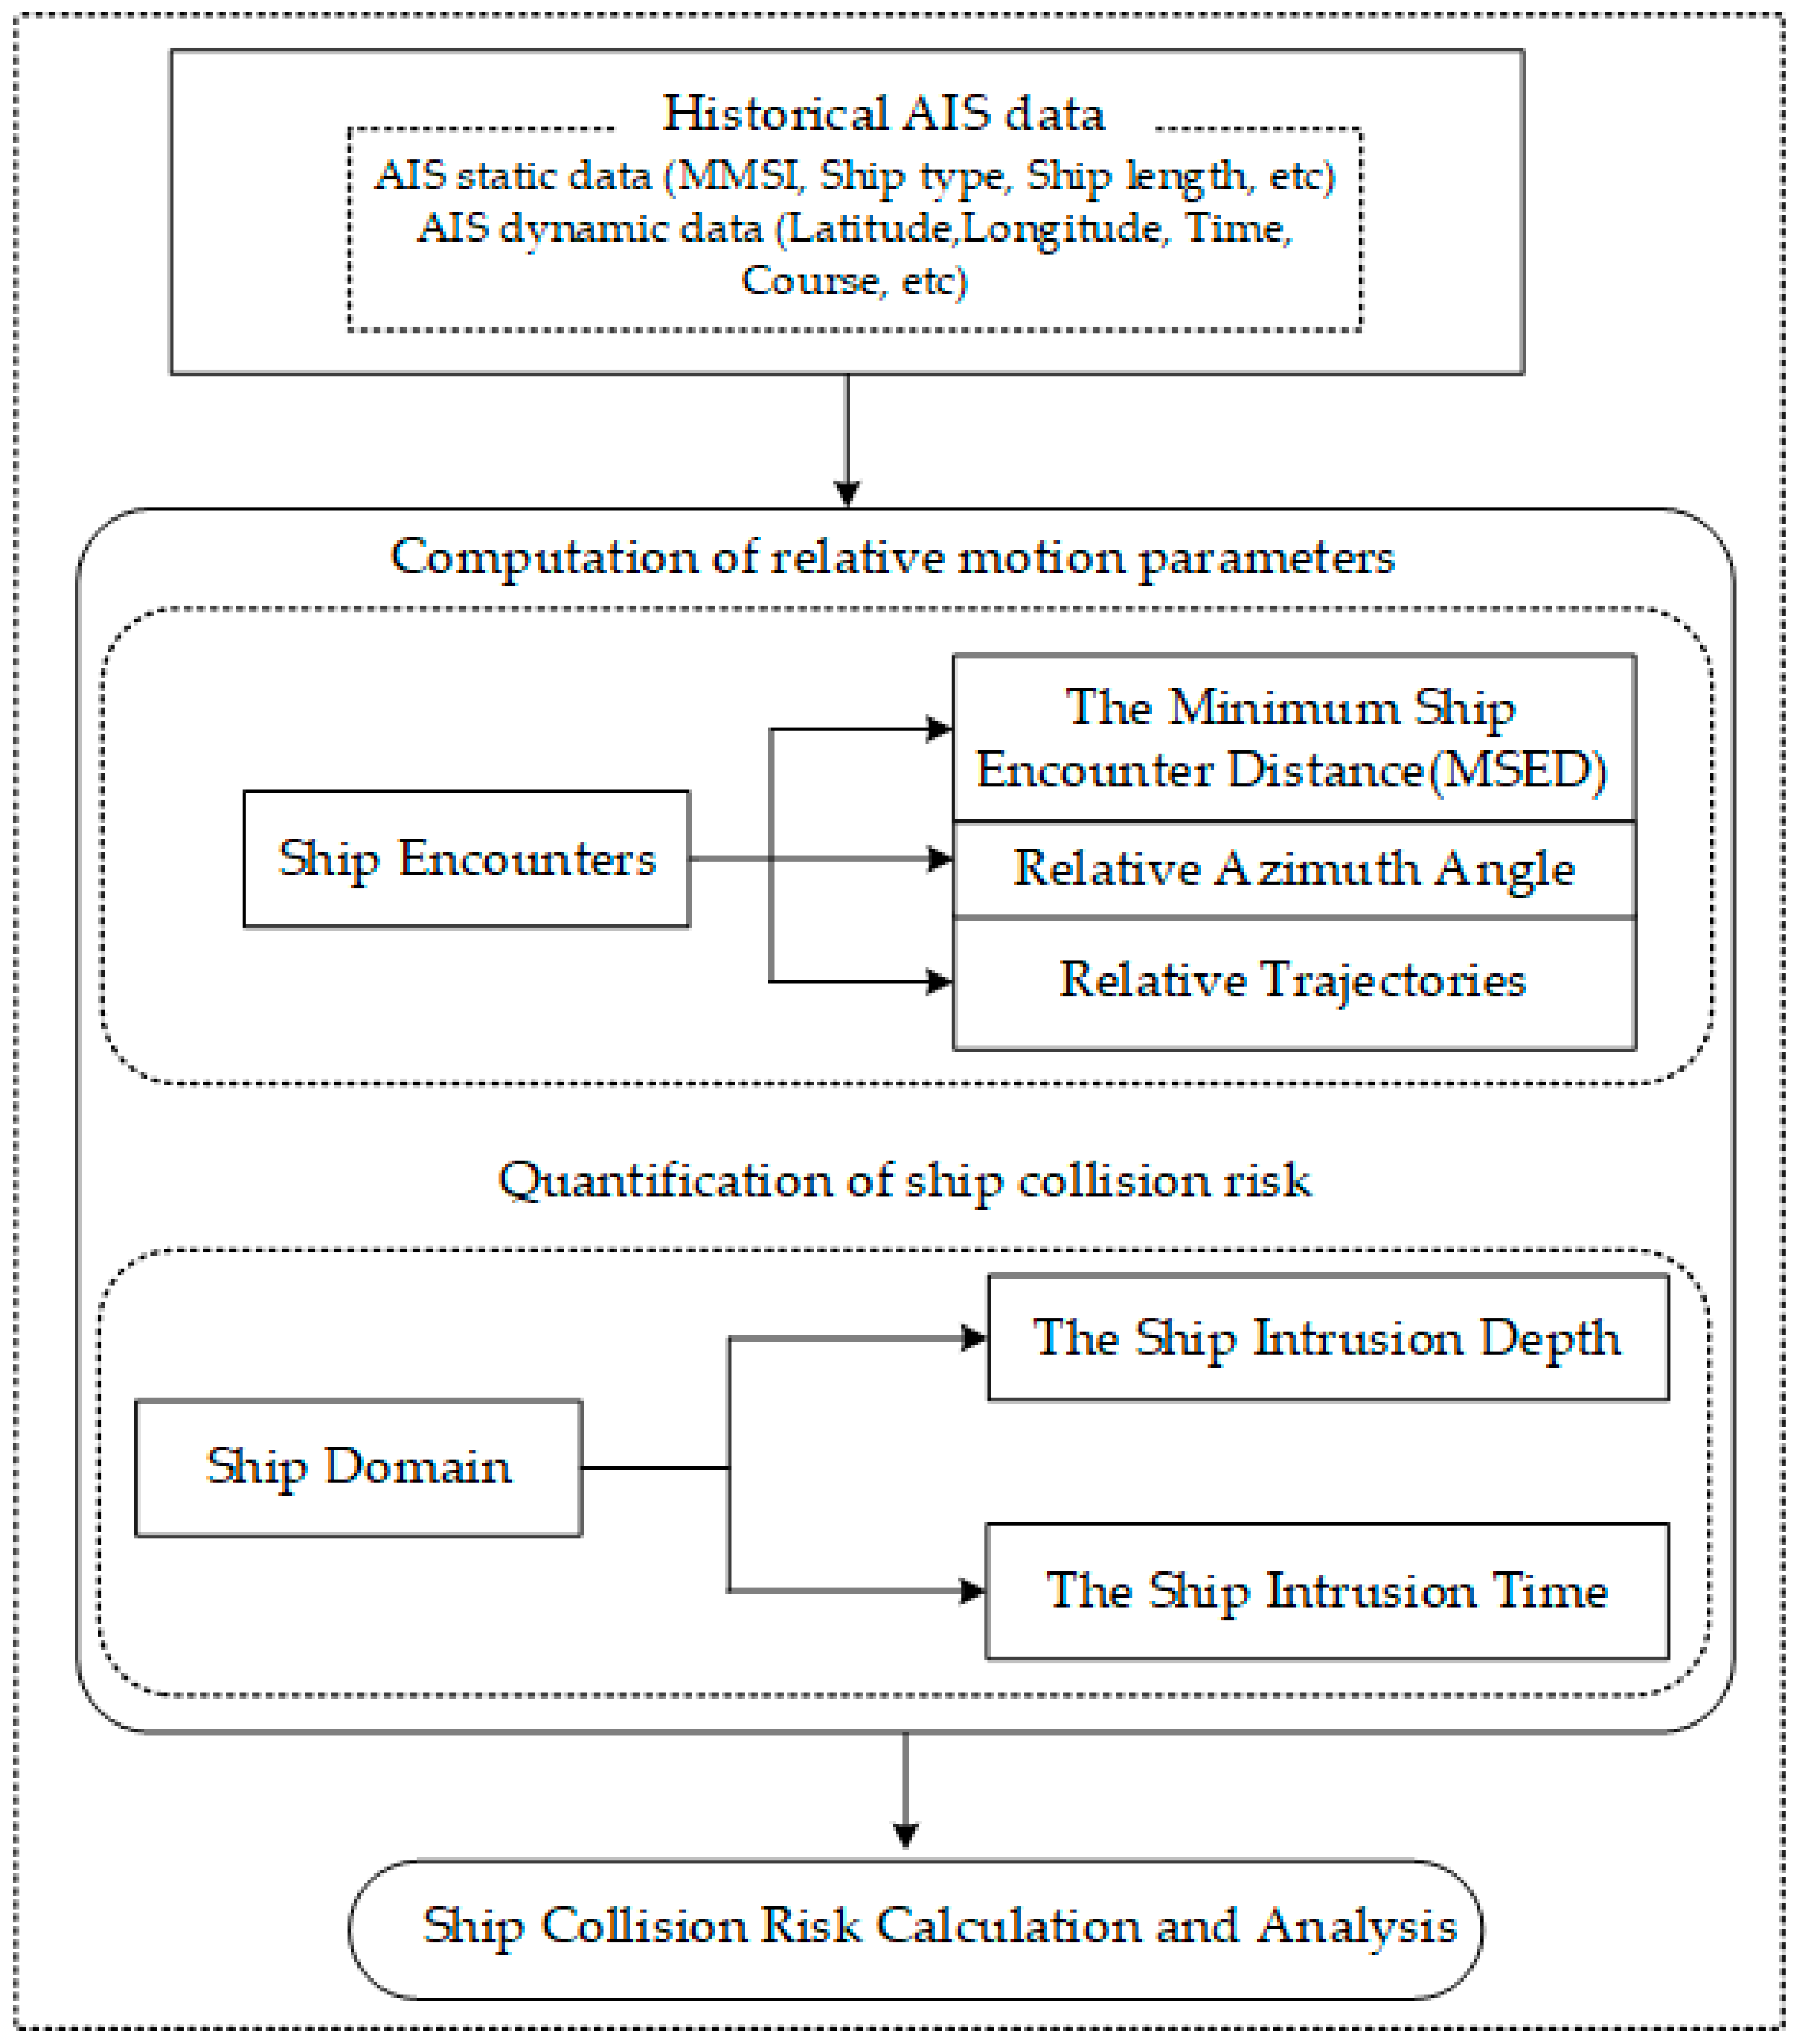
The research methodology, as depicted in Figure 1, is structured to guarantee both the reliability of the data and the robustness of the collision risk assessment. The process involves several key steps. First, rigorous preprocessing of AIS data is undertaken to construct a comprehensive ship trajectory dataset. This step involves cleaning and standardizing the raw data to ensure accuracy and consistency, forming the basis for subsequent analyses. By leveraging spatial and temporal features, the dataset is then analyzed to identify trajectory pairs that correspond to ships encountered within the precautionary area during overlapping time periods. Scenarios involving multiple vessels are evaluated by analyzing all possible two-ship combinations individually. This identification is crucial for isolating potential collision scenarios. For each identified trajectory pair, relative motion parameters are computed. These parameters provide critical insights into collision risk by detailing key metrics such as intrusion time, intrusion depth, and the point of closest approach when a vessel enters another ship’s domain. Finally, a quantitative risk index is derived from the computed parameters, serving as the basis for a systematic evaluation of holistic collision risk patterns within the precautionary area.
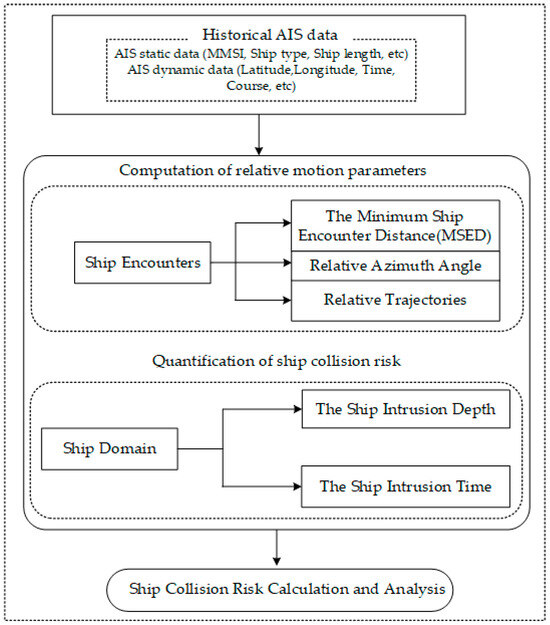
Figure 1.
The flowchart of holistic collision risk assessment in precautionary areas using AIS data.
3.1. Data Pre-Processing and Trajectory Dataset Construction
AIS data are collected by various onboard sensors and transmitted through AIS equipment in a standardized format to reflect the real-time navigation status of vessels. According to the international ITU-R standards, AIS information is categorized into the following four types. (1) Static information refers to data that remains constant during a vessel’s voyage, such as the maritime mobile service identity (MMSI), ship type, and ship length. These details are updated only when the ship’s intrinsic attributes change. (2) Dynamic information includes real-time updates of the vessel’s navigation status, primarily consisting of speed over ground (SOG), course over ground (COG), navigational status, and coordinated universal time (UTC). The transmission frequency of dynamic information is adjusted based on the vessel’s speed and positional changes. (3) Voyage-related information encompasses critical elements about the entire voyage, such as departure port, destination, vessel draught, type of cargo, and the estimated time of arrival (ETA). (4) Safety-related Messages are short messages transmitted to ensure navigational safety, including alerts on weather changes, significant navigational warnings, and other safety-related updates encountered during the voyage.
This study focuses on the ship’s holistic collision risk assessment in precautionary areas based on AIS data. The analysis predominantly utilizes dynamic parameters, namely UTC time, SOG, COG, longitude, and latitude. For static data, the ship’s length, MMSI, and ship type are considered, and vessels classified as tugs are excluded from the analysis due to their distinct operational characteristics.
The transmission frequency of AIS data varies according to the ship’s speed and navigational adjustments. Typically, ships navigating at higher speeds report AIS messages every 6 s, while those moving at lower speeds transmit data at intervals of no more than 10 s. It is essential to unify the temporal resolution across all data to facilitate the reconstruction of ship encounter scenarios from AIS-derived trajectories. Linear interpolation efficiently generates continuous ship trajectories by approximating motion between sparse data points as straight-line segments over short intervals (seconds to minutes), maintaining computational simplicity and motion consistency while reducing data storage requirements. So, this study applied a standardized resampling process to ensure temporal consistency. Specifically, linear interpolation was used to resample the AIS data at 10-second intervals. This interval selection reflects a commonly observed reporting rate across various navigational environments. The AIS data were processed and cleaned using Python 3.10, with the assistance of libraries such as Pandas for data parsing and handling, NumPy for numerical operations, and SciPy for interpolation. Such preprocessing guarantees that all reconstructed ship trajectories share a consistent time base, enabling the accurate identification and analysis of potential collision scenarios.
3.2. Ship Encounter Data Extraction
According to the International Regulations for Preventing Collisions at Sea (COLREGS), when two ships are navigating at sea, if visibility is impaired due to weather, sea conditions, or lighting, both ships are obligated to take avoiding actions regardless of their encounter situation. However, when visibility is good, encounters between ships can be categorized into three scenarios: overtaking, head-on, and crossing. For overtaking, an overtaking situation occurs when the approaching ship is located between 112.5° and 180° relative to the stern of the own ship (right-side overtaking) or between 180° and 247.5° (left-side overtaking). In these cases, the own ship should generally maintain its course and speed unless a close-quarters situation develops, at which point collision-avoidance maneuvers should be initiated. For head-on, a head-on situation is when the relative bearing between the two ships is between 174° and 186°. In such cases, both ships are considered give-way vessels and should turn to starboard to avoid each other. For crossing, when the approaching ship is located between 5° and 67.5° relative to the bow of the own ship, it constitutes a small-angle crossing on the starboard side, and the own ship should turn to starboard to avoid the approaching ship. If the approaching ship is between 67.5° and 112.5°, it is a large-angle crossing on the starboard side. Considering navigation time and economy, the own ship should turn to port to avoid the approaching ship. Conversely, when the approaching ship is between 247.5° and 292.5°, it is a large-angle crossing on the port side, and when it is between 292.5° and 355°, it is a small-angle crossing on the port side. In both port-side crossing situations, the own ship should generally maintain its course and speed unless a close-quarters situation develops, at which point the own ship should turn to starboard to avoid the approaching ship.
To analyze encounter scenarios involving two ships within a designated precautionary area, this study focused on instances where one ship intruded into the other’s navigational domain during the encounter. The first step in the analysis involves selecting the precautionary area for the study. Once this area is defined, each vessel’s entry and exit times are logged. For instance, ship A enters the area at and exits at, while ship B enters at and exits at . When the time intervals of entry and exit for both ships overlap, as specified by Equation (1), it indicates that an encounter has occurred. Encounter trajectory pairs represent interactions between the ships within the precautionary area and are then extracted for further analysis. This refined dataset will provide the foundation for subsequent phases of the study.
3.3. Computation of Relative Motion Parameters
When ships encounter each other in a precautionary area, the holistic collision risk assessment process relies heavily on evaluating their relative motion parameters. Figure 2 illustrates a schematic representation of the encounter processes of two ships, namely the own ship (OS) and the target ship (TS). The positions at time i of the OS and TS are depicted in light yellow and light blue, respectively. The positions of the OS and TS are represented by the coordinates () and (), respectively. The course and speed of each vessel are denoted byandfor OS and and for TS. The computations of the relative distance (D) and relative bearing () between the two ships are shown in the Equations below.
where , denotes the ship encounter points of OS and TS. The function represents the formula for calculating the distance between the ship encounter points. denotes the ship encounter distance between and at time , and the minimum is MSED. The corresponding azimuth angle is denoted as MT. The computations of MSED and MT are shown in Equations (5) and (6).
where D denotes the distance between the two encounter ships at time i, and denotes the minimum D.
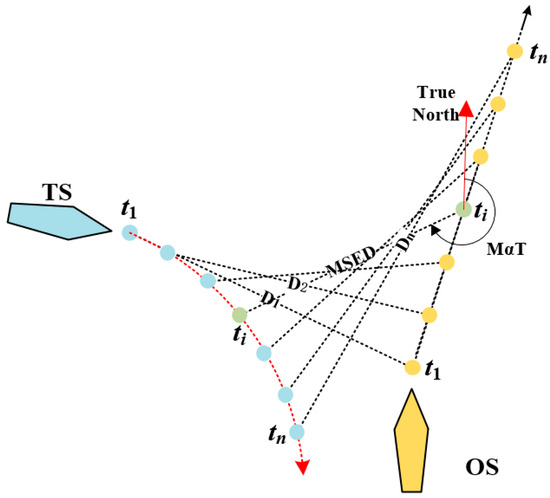
Figure 2.
Relative motion parameters of a ship encounter.
While MSED and DCPA are conceptually aligned under idealized conditions, when both vessels maintain constant course and speed, and no collision-avoidance maneuvers are undertaken, the two metrics diverge significantly in real-world maritime scenarios. DCPA is a predictive measure based on theoretical assumptions of unchanged vessel dynamics, making it highly suitable for real-time navigation support and early collision warning systems. However, in actual navigation, vessels often alter their course or speed in compliance with the COLREGs. Once such evasive actions are taken, the original DCPA loses validity, as the trajectories of the ships are no longer consistent with its underlying assumptions. In contrast, MSED is a retrospective, trajectory-based indicator that captures the true closest point between two ships after any collision-avoidance behavior has been executed. It is derived from historical AIS trajectory data and reflects the realized proximity of vessel encounters rather than the theoretically projected one. As such, MSED offers a more accurate and behavior-aware risk metric, particularly for studies focused on post-incident analysis, empirical risk modeling, or risk mapping in precautionary areas.
3.4. Quantification of Ship Collision Risk
While the MSED offers a static, outcome-oriented measure of collision risk, it cannot capture the dynamic collision-avoidance process. This limitation makes it insufficient to comprehensively assess ship collision risk in the precautionary area.
To address this shortcoming, we introduce ship domain–based indices, specifically intrusion depth and intrusion time, to quantify how deeply and for how long a ship’s domain is penetrated during an encounter. Our approach builds on the concept of the ship domain, using it in conjunction with the MSED and the relative motion parameters between encountering ships.
The ship domain concept proposed by Hansen et al. [27] was adopted. The ship domain is defined as an elliptical region whose boundary is determined by the ship’s length and course. In this definition, the ship’s course sets the orientation of the ellipse’s long axis, with the long axis measuring 8 times the ship’s length and the short axis 3.2 times the ship’s length.
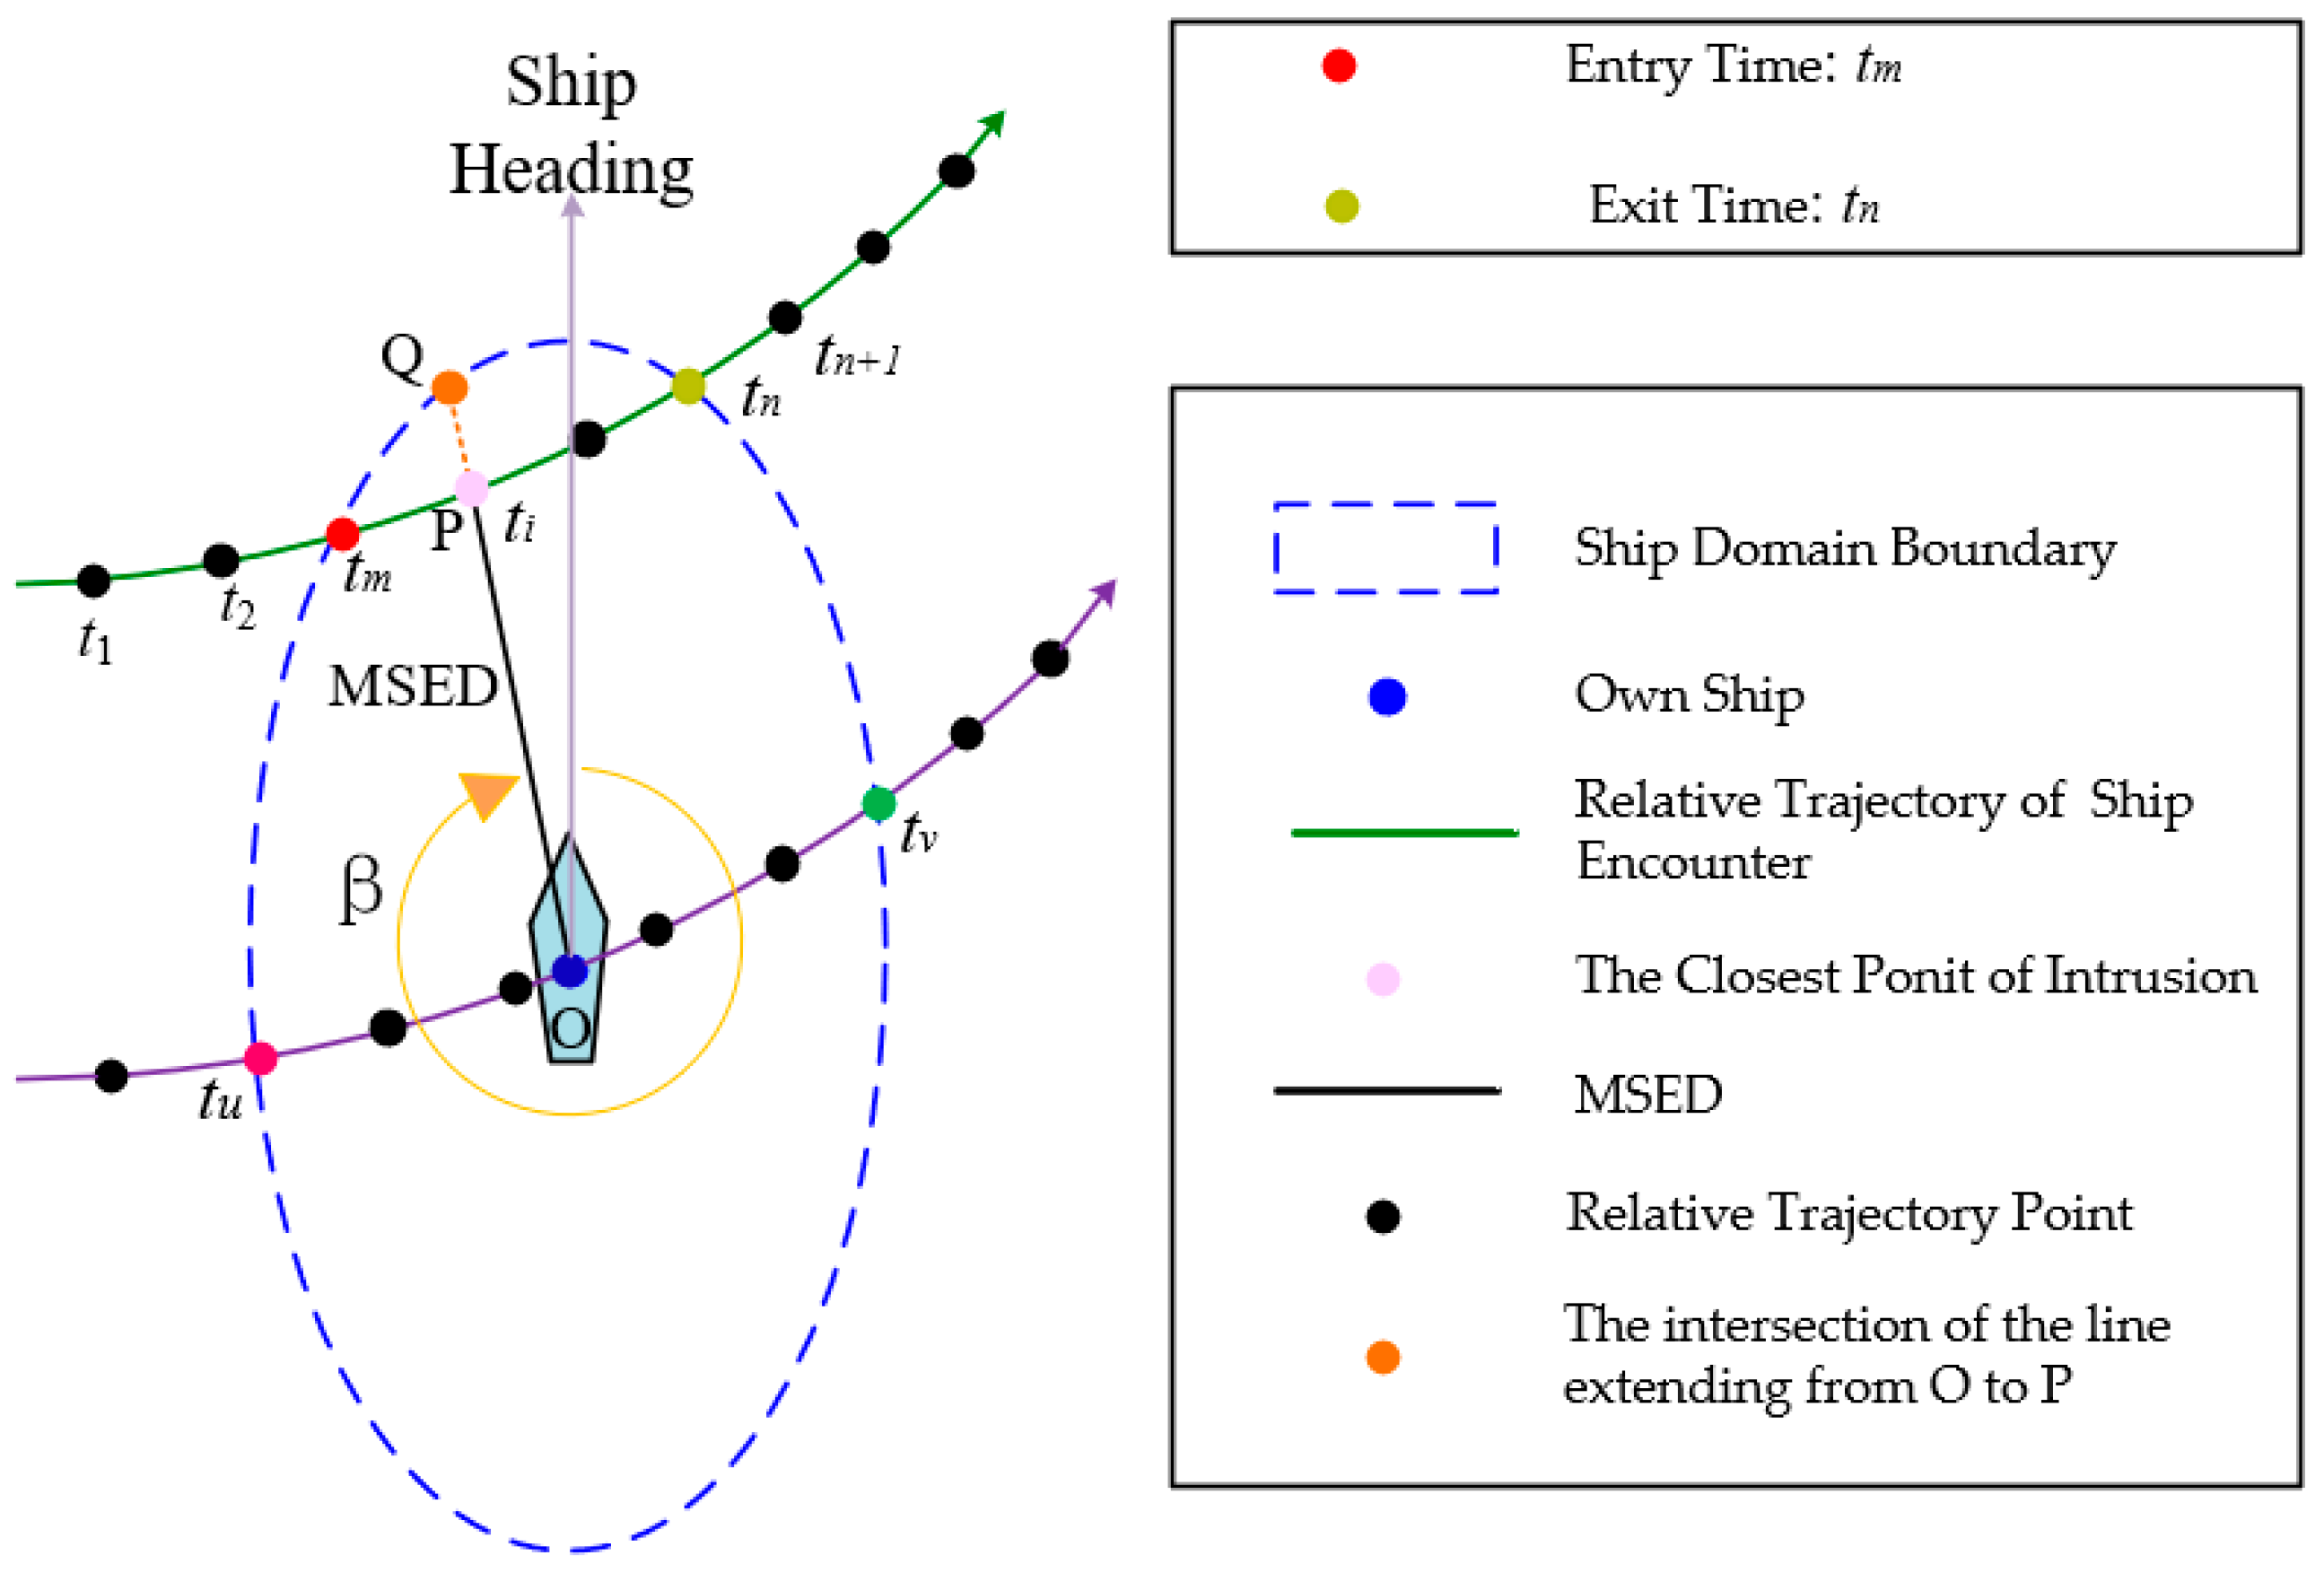
Figure 3 illustrates the own ship’s domain in an encounter. The blue dashed line represents the ship domain boundary of the own ship. The relative trajectory is depicted with green lines, with the solid dots indicating the ship’s relative positions at each sampling time. Red and yellow points mark the entry and exit locations of the other ship as it penetrates the own ship’s domain, with the corresponding entry and exit times denoted as and .

Figure 3.
The relative trajectory in an encounter.
The ship intrusion depth (ID) quantifies how deeply the relative trajectory intrudes into the own ship’s domain; a higher ID implies a greater risk of collision. As illustrated in Figure 3, the closest point of ship intrusion is labeled as P, indicating the location along the relative motion trajectory with MSED. O is the position of the own ship. The intersection of the line extending from O to P with the elliptical boundary is labeled as Q. ID is calculated using Equation (7).
where OQ can be calculated based on Equation (8):
where L is the length of the own ship, and θ is the angle between the azimuth of MSED () and the own ship’s heading.
The ship intrusion time (IT) measures the duration of the intrusion, with a longer IT corresponding to an increased collision risk, and is calculated using Equation (9).
Theoretically, the maximum intrusion time occurs when the relative motion trajectory of the encounter passes through the own ship’s location, O. However, this scenario will never occur because it would imply a collision, and two ships cannot pass each other. For analysis purposes, we can assume a trajectory that passes through O and calculate the times of entering and leaving the own ship’s domain, and , respectively, and use Equation (10) to determine the maximum intrusion time, . If the relative trajectory does not intrude into the own ship’s domain, both IT and ID are set to zero.
In this study, a novel holistic collision risk indicator for precautionary areas is proposed, as shown in following Equations:
where r is the holistic collision risk in the precautionary area, rj denotes the ship collision risk of encounter j, and k is the total number of ship encounters in an observation period. The proposed collision risk indicator accounts for both ship intrusion depth and ship intrusion time, resulting in a more comprehensive evaluation. Coefficients a1 and a2 are the weighting factors assigned to ship intrusion time and ship intrusion depth, respectively. Given that the intrusion depth exhibited significantly greater variability and sensitivity in relation to collision likelihood, this factor was assigned a higher weight. To determine appropriate values, we consulted three professional experts through interviews and scenario evaluations. The experts comprised a maritime administration official, a university professor specializing in maritime safety research, and a highly experienced ship captain. Independently, these experts assessed the relative importance of intrusion depth and intrusion time, providing average weighting values of 0.6 for intrusion depth and 0.4 for intrusion time. Furthermore, our case analyses confirmed this expert assessment, demonstrating minimal variation in intrusion time but significant changes in intrusion depth across the evaluated scenarios.
4. Case Study
4.1. Study Area and AIS Data
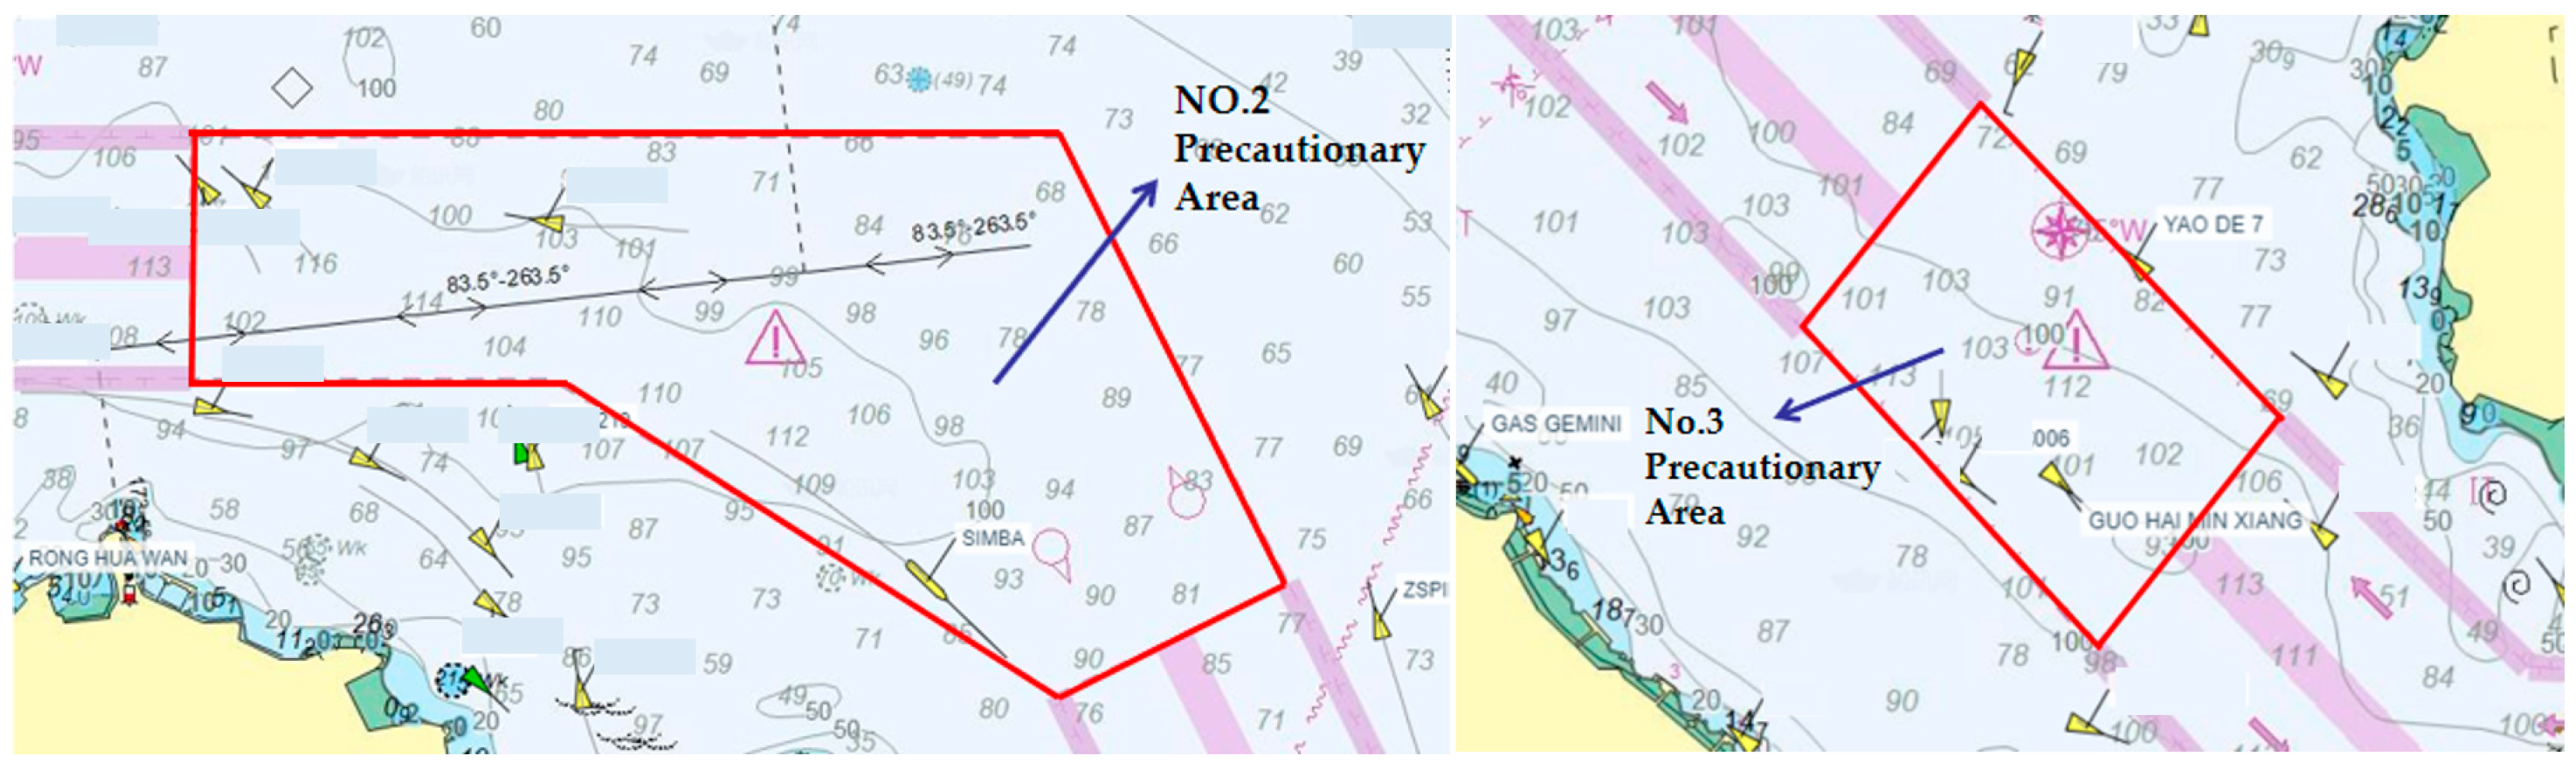
In this study, the No.2 and No.3 precautionary areas (PA2 and PA3) were selected as the study area, as illustrated in Figure 4. PA2 and PA3 of Ningbo–Zhoushan Port and the adjacent waters are key intersection zones for the main traffic flow in the core port area. The area experiences substantial traffic from different directions. Annually, it accommodates the movement of 2300 super-large vessels and 150 LNG vessels, in addition to the daily transit of 300 other vessels. The passenger ferries are regular, further complicating these waters’ navigation environment.
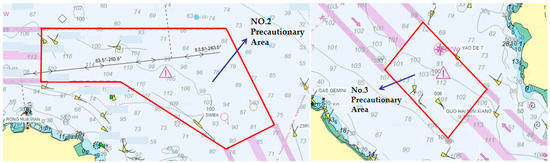
Figure 4.
The study area—No.2 and No.3 precautionary area of Ningbo–Zhoushan Port.
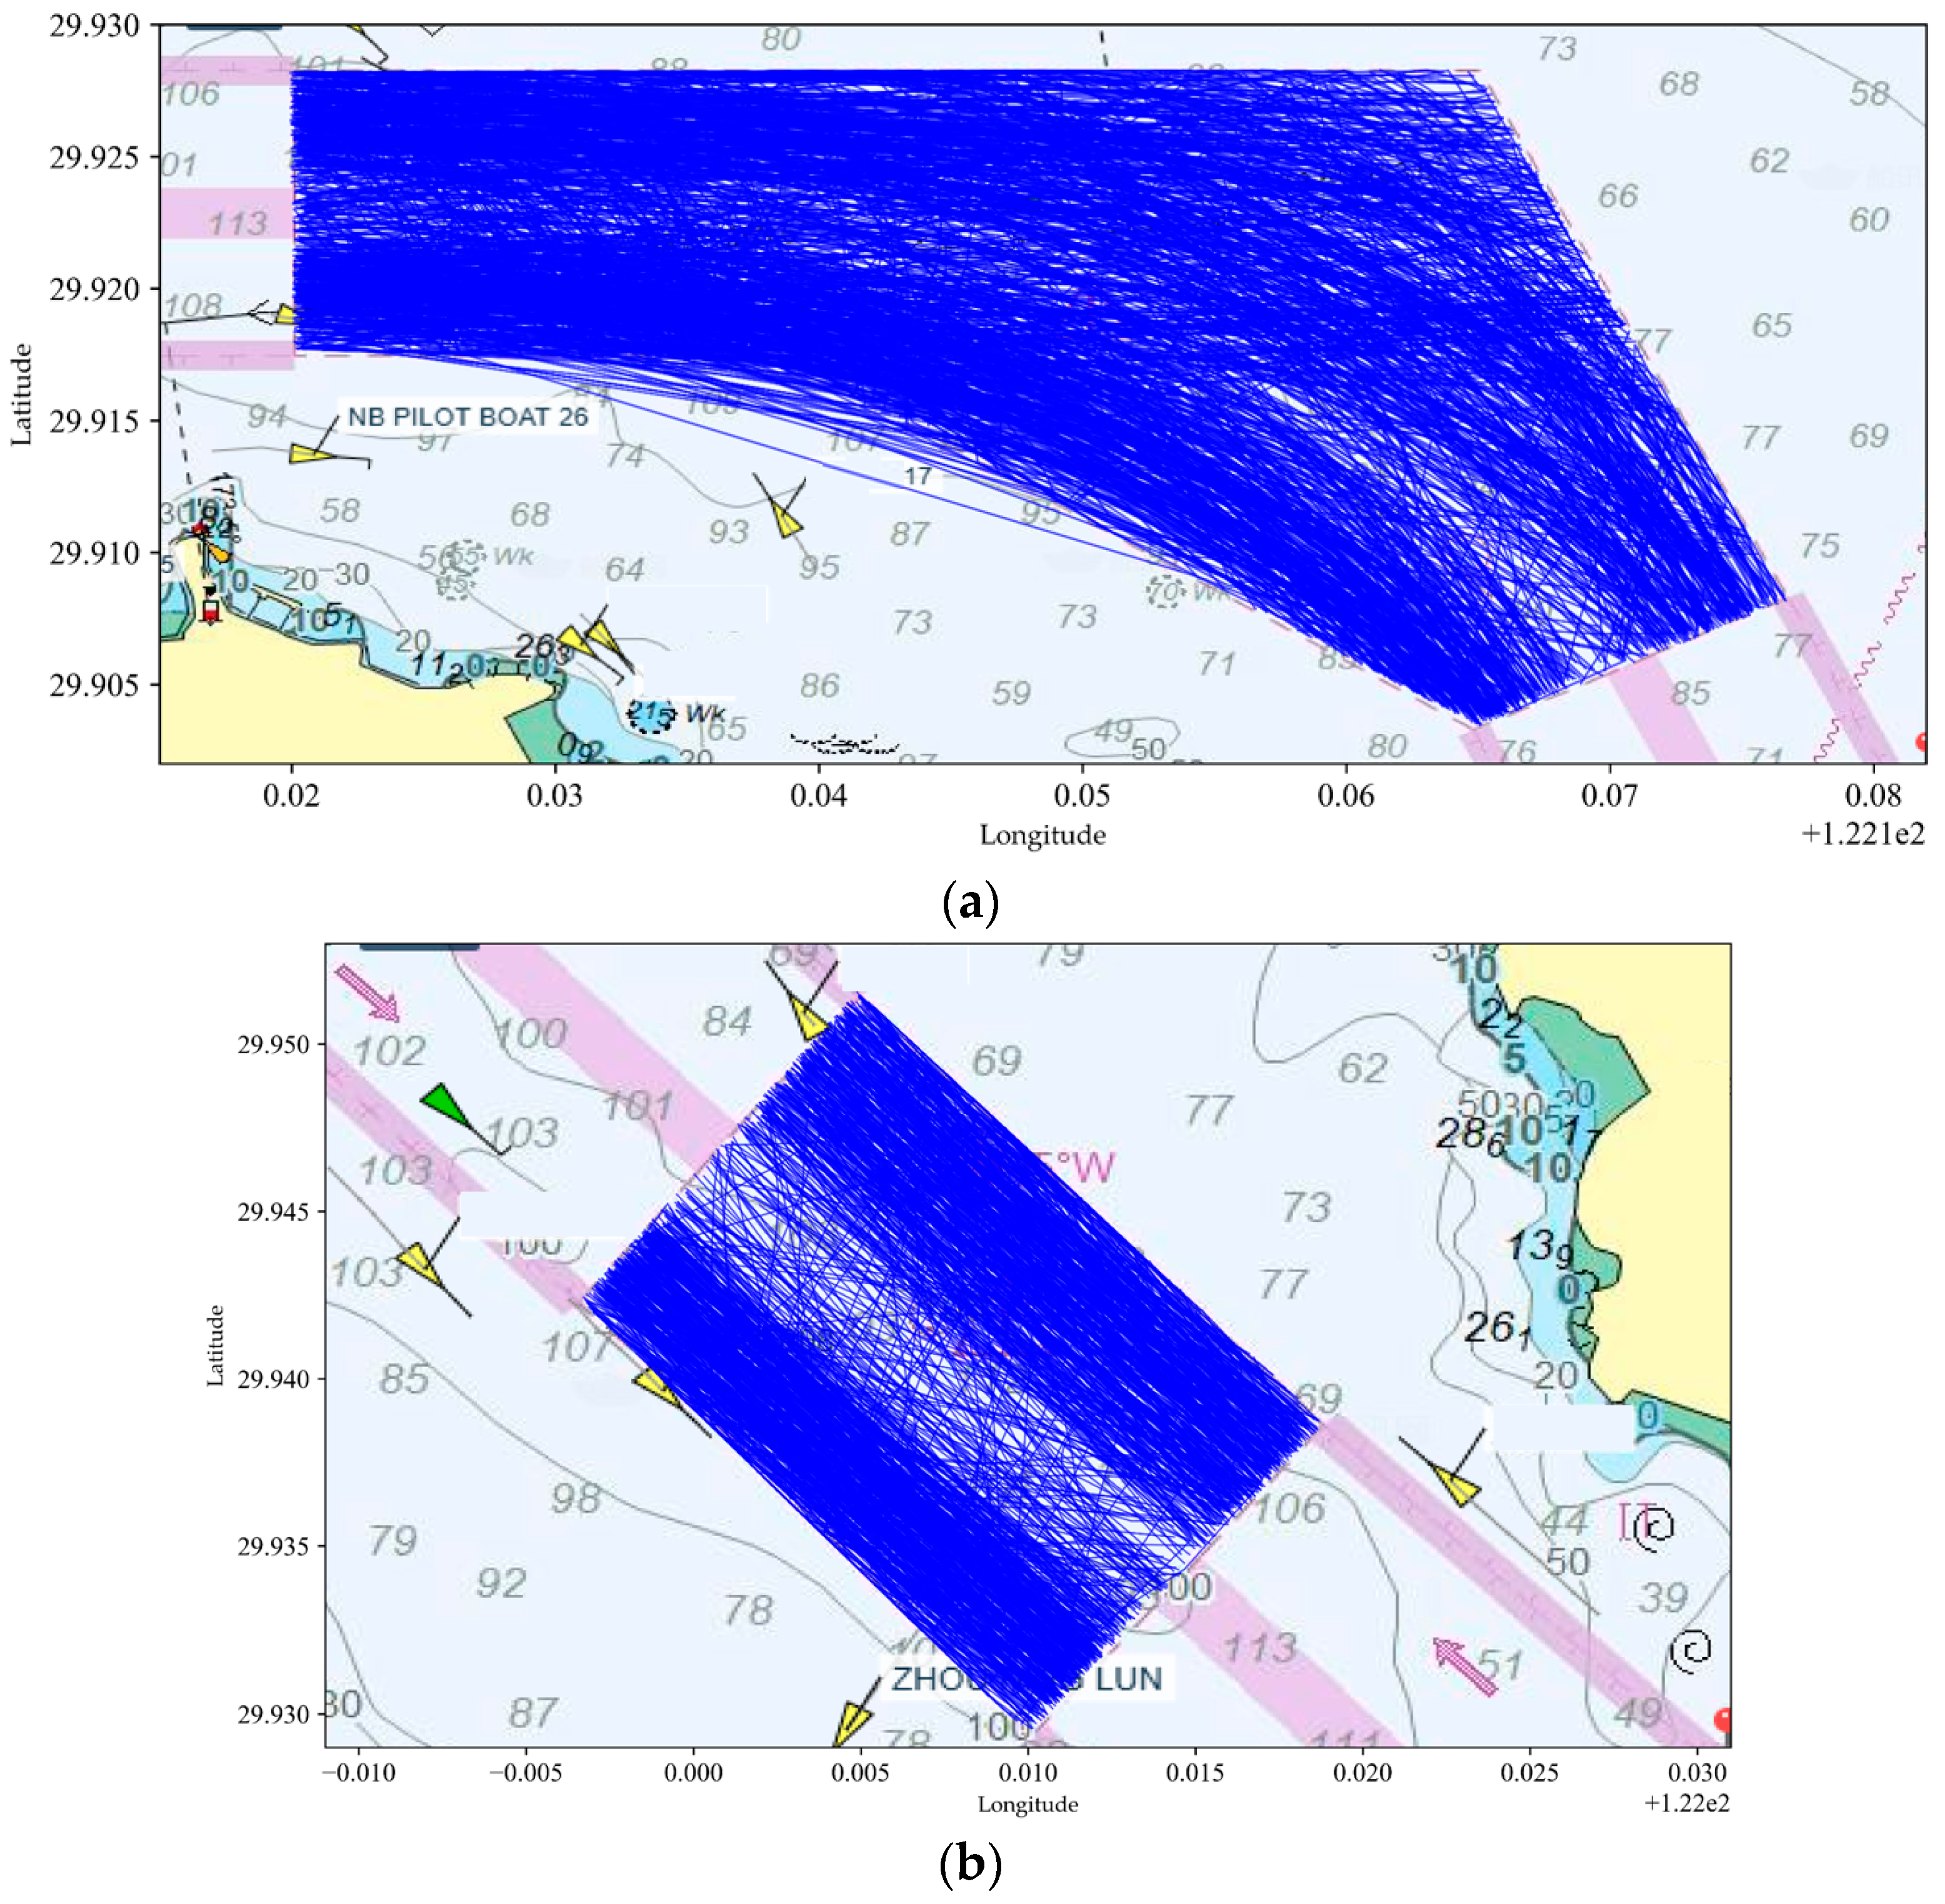
We used historical AIS data from one month in 2020 to illustrate the proposed risk assessment method. The ship trajectories used in the analysis are shown in Figure 5. In precautionary area PA2, the most frequent ship types are cargo ships, container ships, oil tankers, fishing ships, and passenger ships, accounting for 34%, 34%, 23%, 4%, and 4%, respectively. In precautionary area PA3, the most frequent ship types are cargo ships, oil tankers, container ships, fishing ships, and passenger ships, accounting for 46%, 27%, 21%, 2%, and 1%, respectively. The differences in ship-type distribution between PA2 and PA3 indicate the distinct navigational characteristics in these areas. PA2 shows a more balanced mix of cargo and container ships, suggesting that it serves as a versatile transit zone accommodating diverse shipping operations. In contrast, PA3 is dominated by cargo ships and oil tankers, reflecting a higher concentration of heavy commercial and energy-related traffic.

Figure 5.
Ship trajectories in precautionary areas of Ningbo–Zhoushan Port. (a) No.2 precautionary area; (b) No.3 precautionary area.
4.2. Results
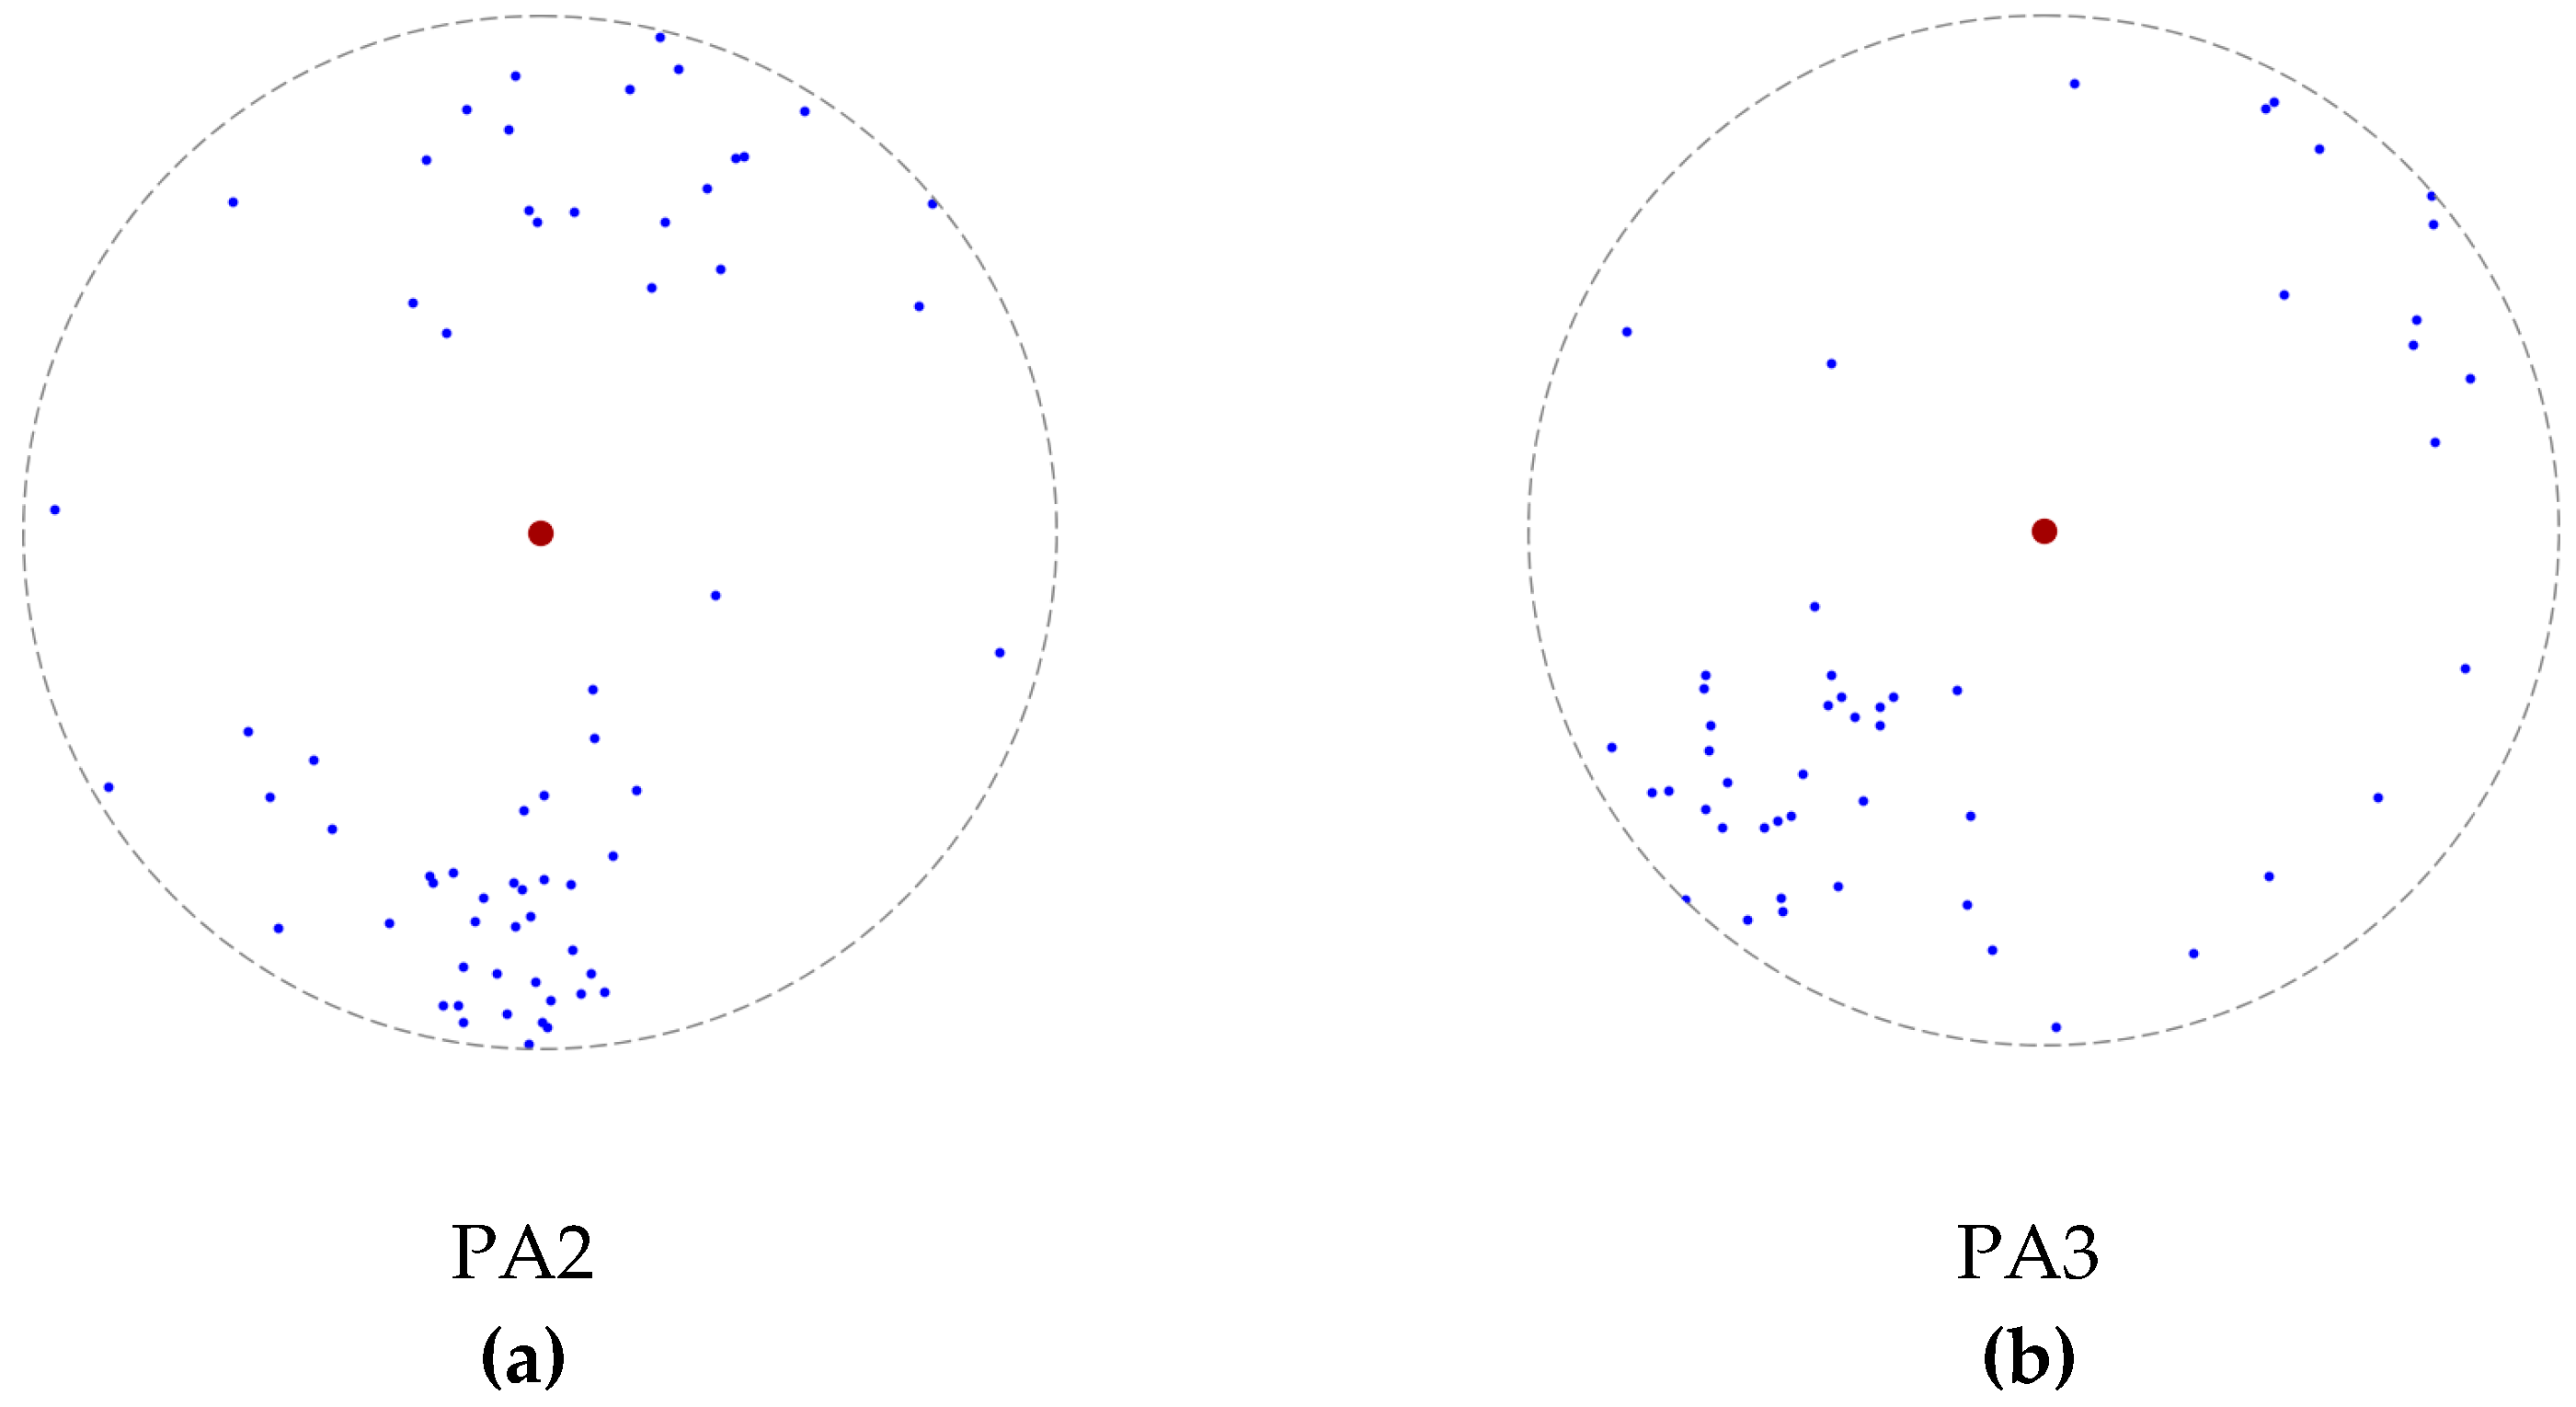
As described in Section 3.2, ship-encounter trajectories are first extracted from AIS data. Subsequently, following the methodologies outlined in Section 3.3 and Section 3.4, the relative motion parameters are computed for risk assessment. Figure 6 presents the distribution of MSED positions and their associated azimuths for ship encounters, with each blue point representing the closest position relative to the own ship (depicted as brown dot) during an encounter. It is clearly observed that PA2 exhibited a more scattered distribution of points, indicating that the closest encounter positions occurred in various locations throughout the precautionary area. In contrast, PA3 showed a more uniform alignment of closest positions along a direction perpendicular to the primary traffic flow. This alignment suggests that MSED typically occurred when two ships passed each other side by side.
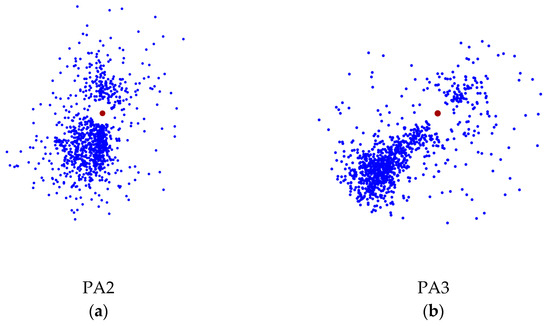
Figure 6.
Distribution of MSED and associated azimuth in precautionary areas: (a) PA2 and (b) PA3.
The distribution of the intrusion points is illustrated in Figure 7, highlighting the encounters in which relative trajectories (depicted as blue dot) intruded into their own ship’s domain (depicted as brown dot). The intrusion region for PA2 appears dispersed, with intrusion points broadly scattered around the own ship. This indicates that, in PA2, ships can approach from multiple directions, reflecting the expansive and less-structured nature of the precautionary area. In contrast, PA3 demonstrates a more concentrated distribution of intrusion points, with other ships’ locations densely clustered on one side of the own ship. This directional concentration suggests a bias, likely the result of more uniform traffic streams following two main directions.
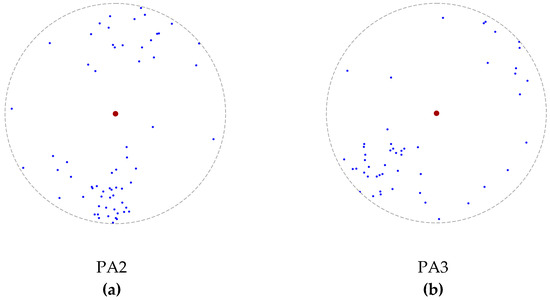
Figure 7.
The distribution of the intrusion depth in precautionary areas: (a) PA2 and (b) PA3.
The density and spatial patterns of the intrusion points provide valuable indications of high-risk collision zones in precautionary areas. Consequently, these findings emphasize the importance of targeted monitoring, particularly in zones where frequent intrusions into the own ship’s domain occur. Enhancing surveillance and preventive measures in these identified high-risk areas could effectively mitigate collision risks and significantly improve maritime safety.
The normalized MSED (N-MSED) can be defined as the ratio between the MSED and the distance from the own ship to the boundary of its ship domain in the direction of the MSED (MSED/OQ). This metric offers a distinct advantage over MSED because it incorporates vessel-specific characteristics and dynamic operational factors associated with the ship domain. While MSED only measures the absolute closest distance between vessels, N-MSED quantifies how deeply one vessel intrudes into another vessel’s defined domain—a domain directly influenced by vessel length, course, and potentially speed. Consequently, N-MSED provides a more comprehensive and realistic assessment of collision risk by explicitly considering the dynamic interplay of vessel dimensions and navigational movements. Therefore, it is better suited for accurately evaluating navigational safety, especially in complex maritime environments.
The distribution of N-MSED is illustrated in Figure 8. For encounters where the relative trajectory intrudes into the own ship’s domain, the N-MSED is smaller than one, indicating a higher collision risk. Conversely, when the MSED is outside the ship’s domain, the N-MSED value is greater than one, reflecting a lower collision risk. Thus, the lower the N-MSED, the higher the potential for ship collisions.
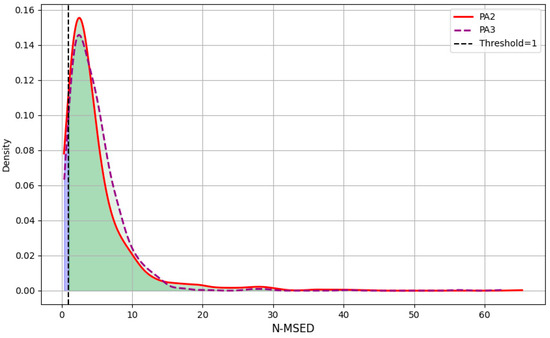
Figure 8.
Probability density of the N-MSED for PA2 and PA3.
Figure 8 shows the distribution of N-MSED values for ship encounters in precautionary areas PA2 and PA3. The purple dashed boundary represents the region profile derived from N-MSED data in PA3, while the solid red boundary with green fill illustrates the region based on PA2 data, using a threshold value of one to determine whether ship encounter trajectories intrude into the ship domain. The green areas indicate the percentage of non-intrusions, while the light-blue ones indicate the percentage of intrusions into the ship domain. A statistical analysis revealed that 94.80% of encounters in PA2 maintained N-MSED values above the critical threshold, with only 5.20% falling below. Similarly, PA3 showed 95.71% of the encounters above the threshold versus 4.29% below. These findings demonstrate that the majority of encounters in both precautionary areas occurred at safe distances, with relatively few instances of domain intrusion.
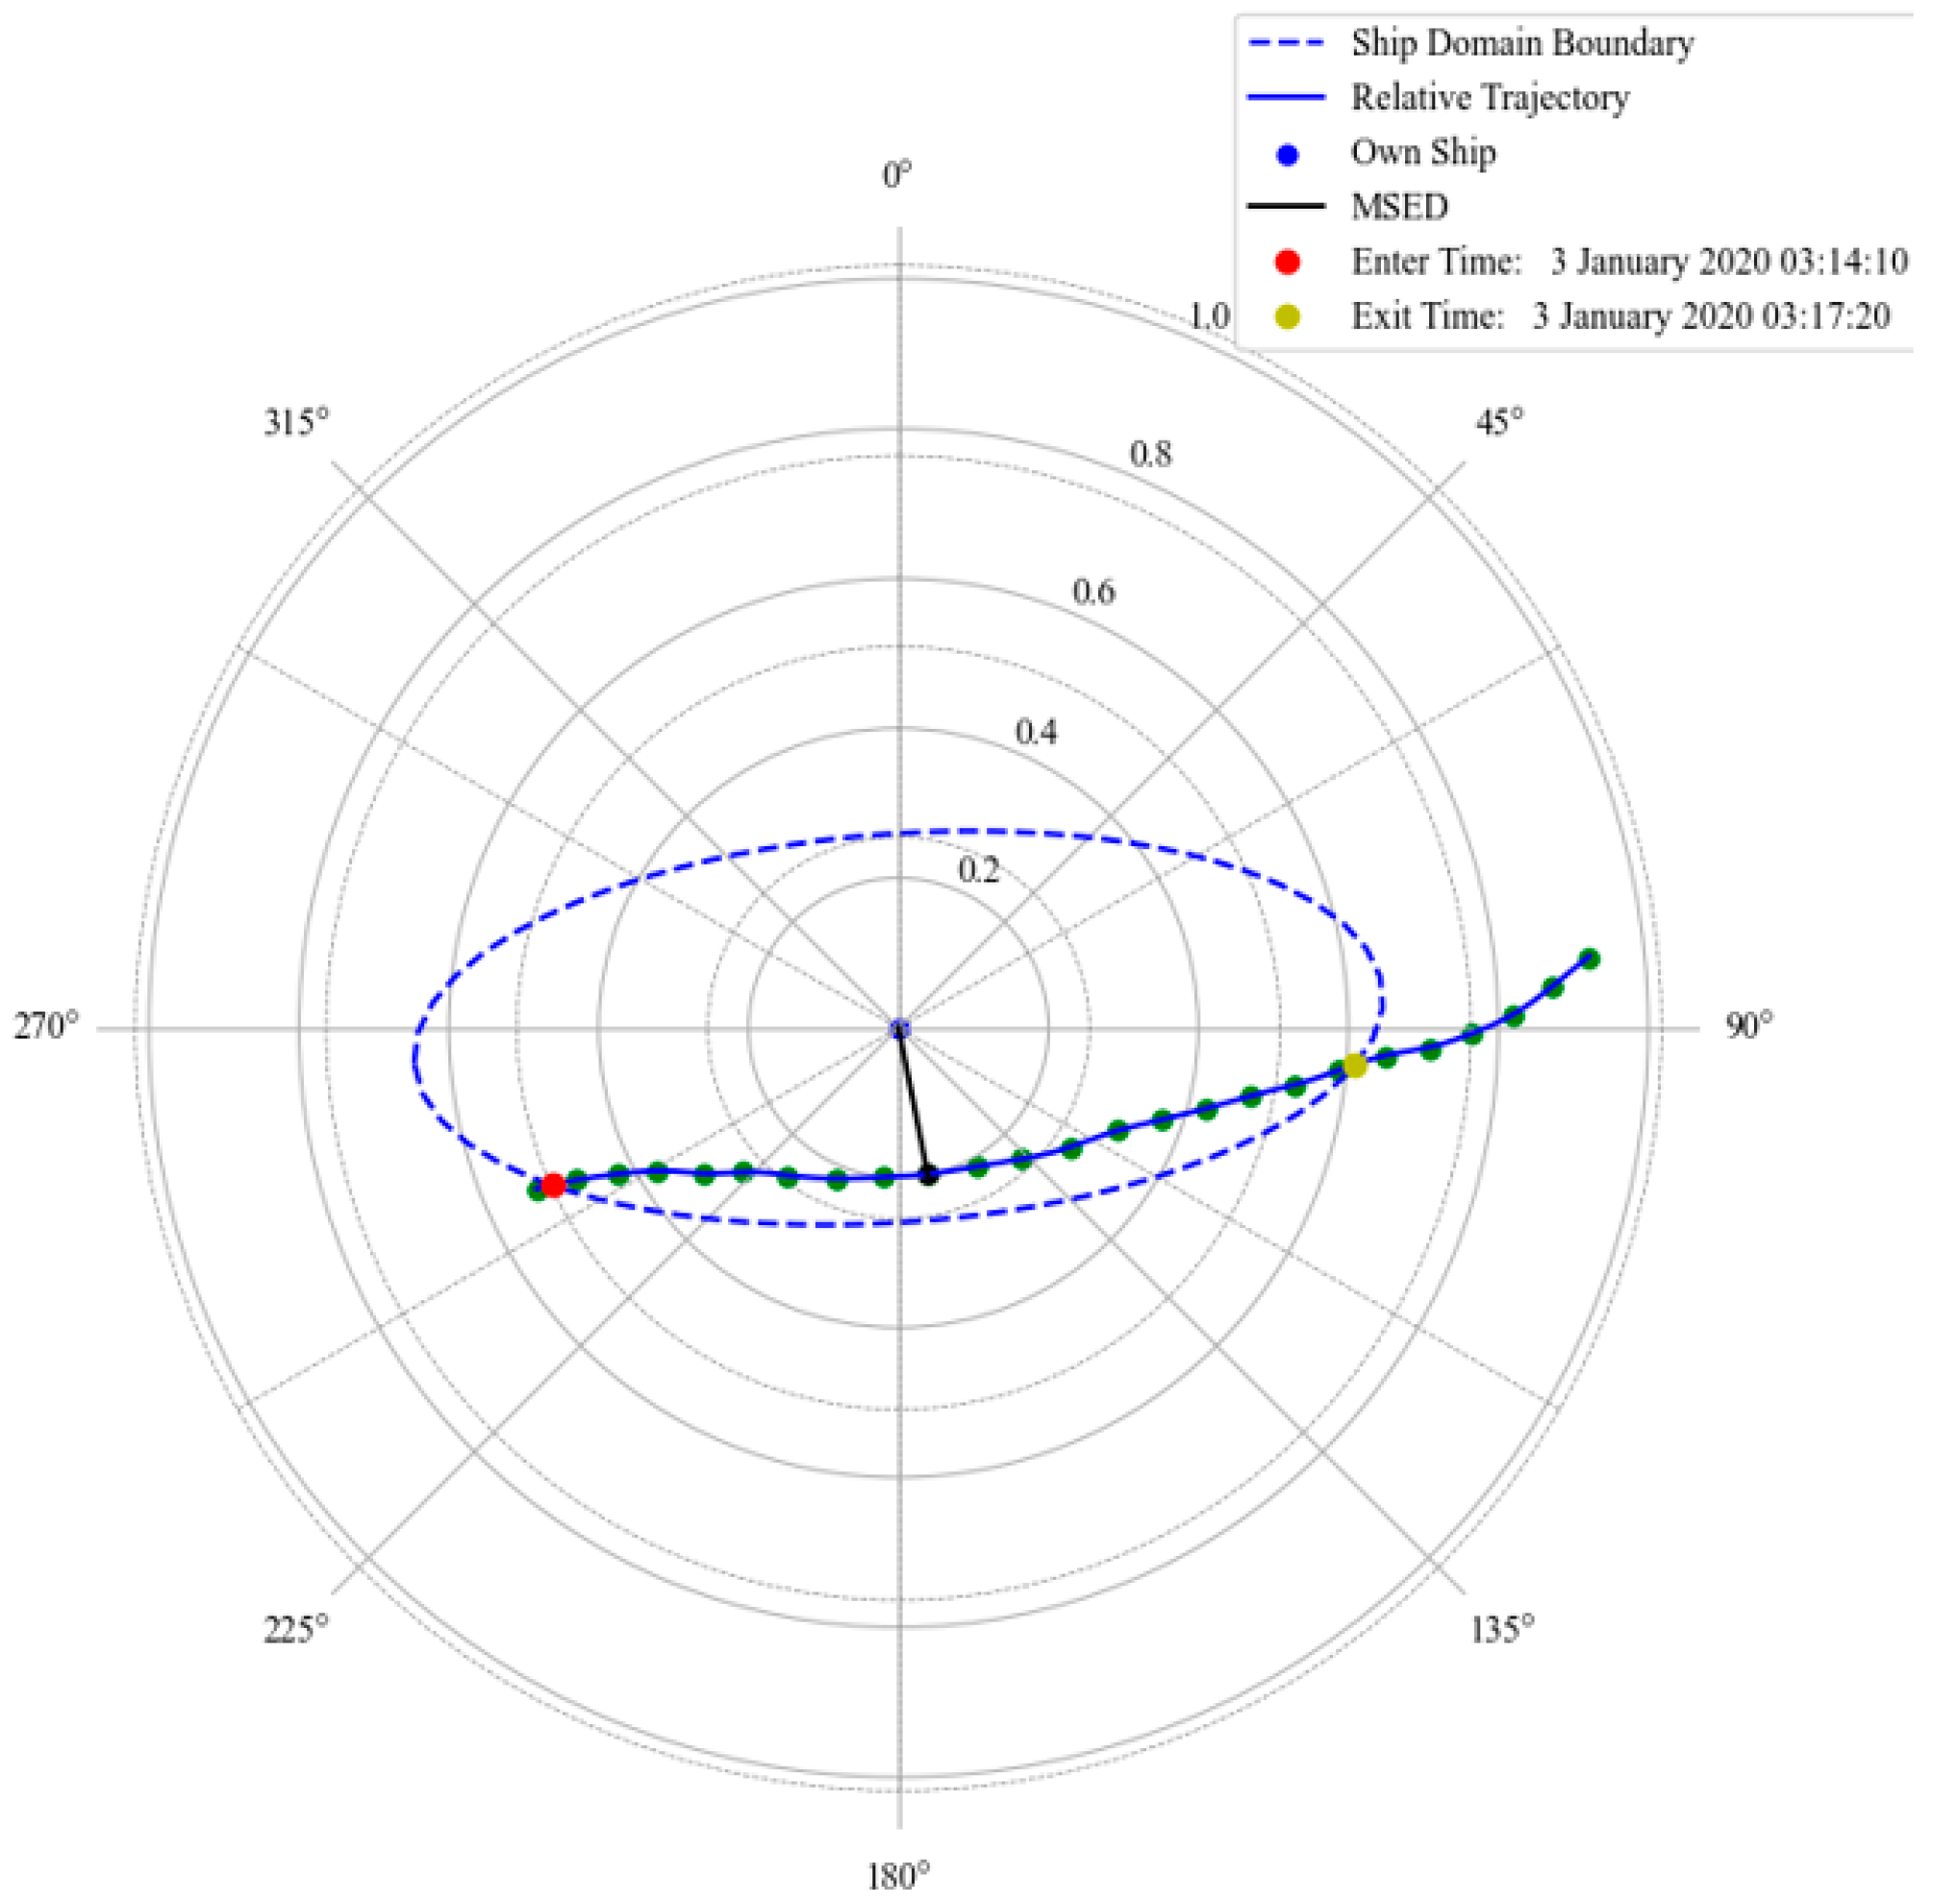
For encounters in which the relative trajectory intrudes into its own ship’s domain, the ship intrusion durations are calculated. An example is illustrated in Figure 9, where the relative motion trajectory enters the own ship’s domain at moment (03:14:10) and exits at moment (03:17:20), resulting in an actual intrusion duration of 3 min and 10 s. Additionally, the intruding ship reaches the closest intrusion point along its relative motion trajectory at 03:15:40.
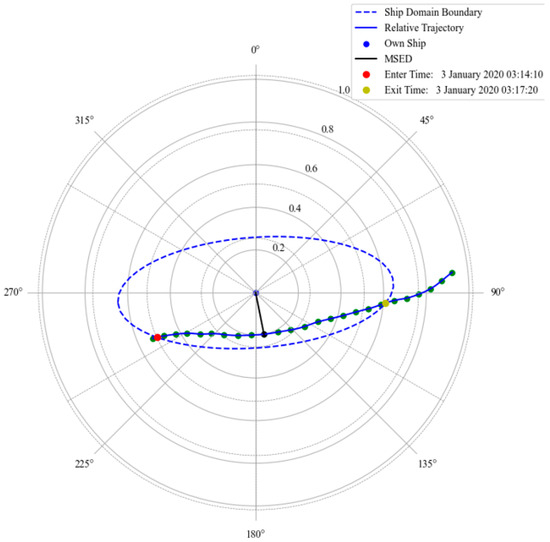
Figure 9.
The relative trajectory in an encounter intruding into the ship domain based on historical AIS data.
The ship intrusion time distributions for the No. 2 and No. 3 precautionary areas are illustrated in Figure 10 and Figure 11. For PA2, the mean intrusion time is 132.88 s, with a standard deviation of 120.80 s, ranging from a minimum of 10 s to a maximum of 790 s. In comparison, PA3 exhibits a shorter mean intrusion time of 113.84 s and a lower standard deviation of 91.95 s, with intrusion durations ranging between 5 and 390 s. Both distributions are right-skewed, indicating that most intrusion durations are relatively short. However, the occurrence of significantly prolonged intrusion times in some cases suggests that certain vessel encounters maintain proximity for extended periods. These prolonged intrusions represent scenarios with high collision risk, implying the need for timely intervention or enhanced navigation management strategies.
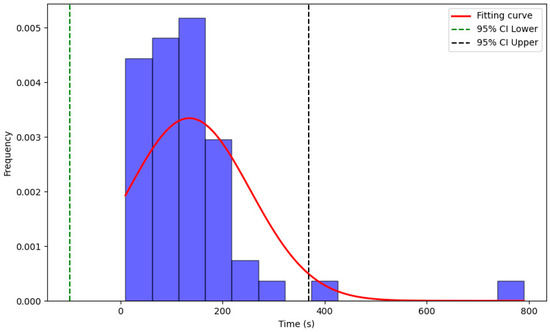
Figure 10.
The intrusion time distribution of PA2.
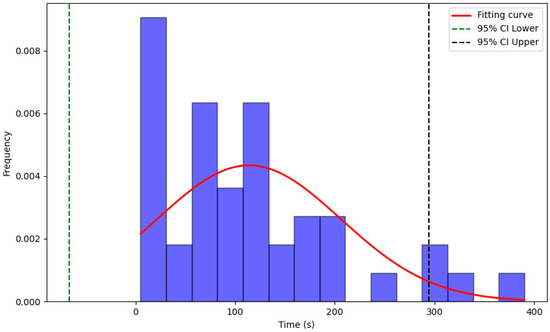
Figure 11.
The intrusion time distribution of PA3.
A comparative analysis of the intrusion times between the PA2 and PA3 precautionary areas highlights notable differences. The mean intrusion time in PA2 (132.88 s) is higher than in PA3 (113.84 s). Moreover, the intrusion times in PA2 exhibit greater variability, with a standard deviation of 120.80 s compared to 91.95 s in PA3. The range of intrusion durations in PA2 (10–790 s) is also broader than in PA3 (5–390 s). These findings indicate that intrusion times in PA3 are more concentrated, likely because this area includes only two main passing traffic streams. In contrast, PA2 experiences a wider range and higher variability in intrusion durations, which are attributable to its more complex traffic patterns involving two main traffic streams crossing. The greater variability and broader range observed in PA2 suggest a higher risk of collisions. Therefore, enhancing navigational guidance in PA2 could be beneficial in reducing extended intrusion durations and improving overall navigational safety.
In most ship encounters, the own ship’s domain was not violated, resulting in collision risk scores of zero. Specifically, 948 encounters in PA2 and 957 encounters in PA3 had zero collision risk. Conversely, 52 encounters in PA2 and 43 encounters in PA3 involved intrusions, yielding holistic collision risk scores of 0.024 for PA2 and 0.019 for PA3 when considering all ship encounters.
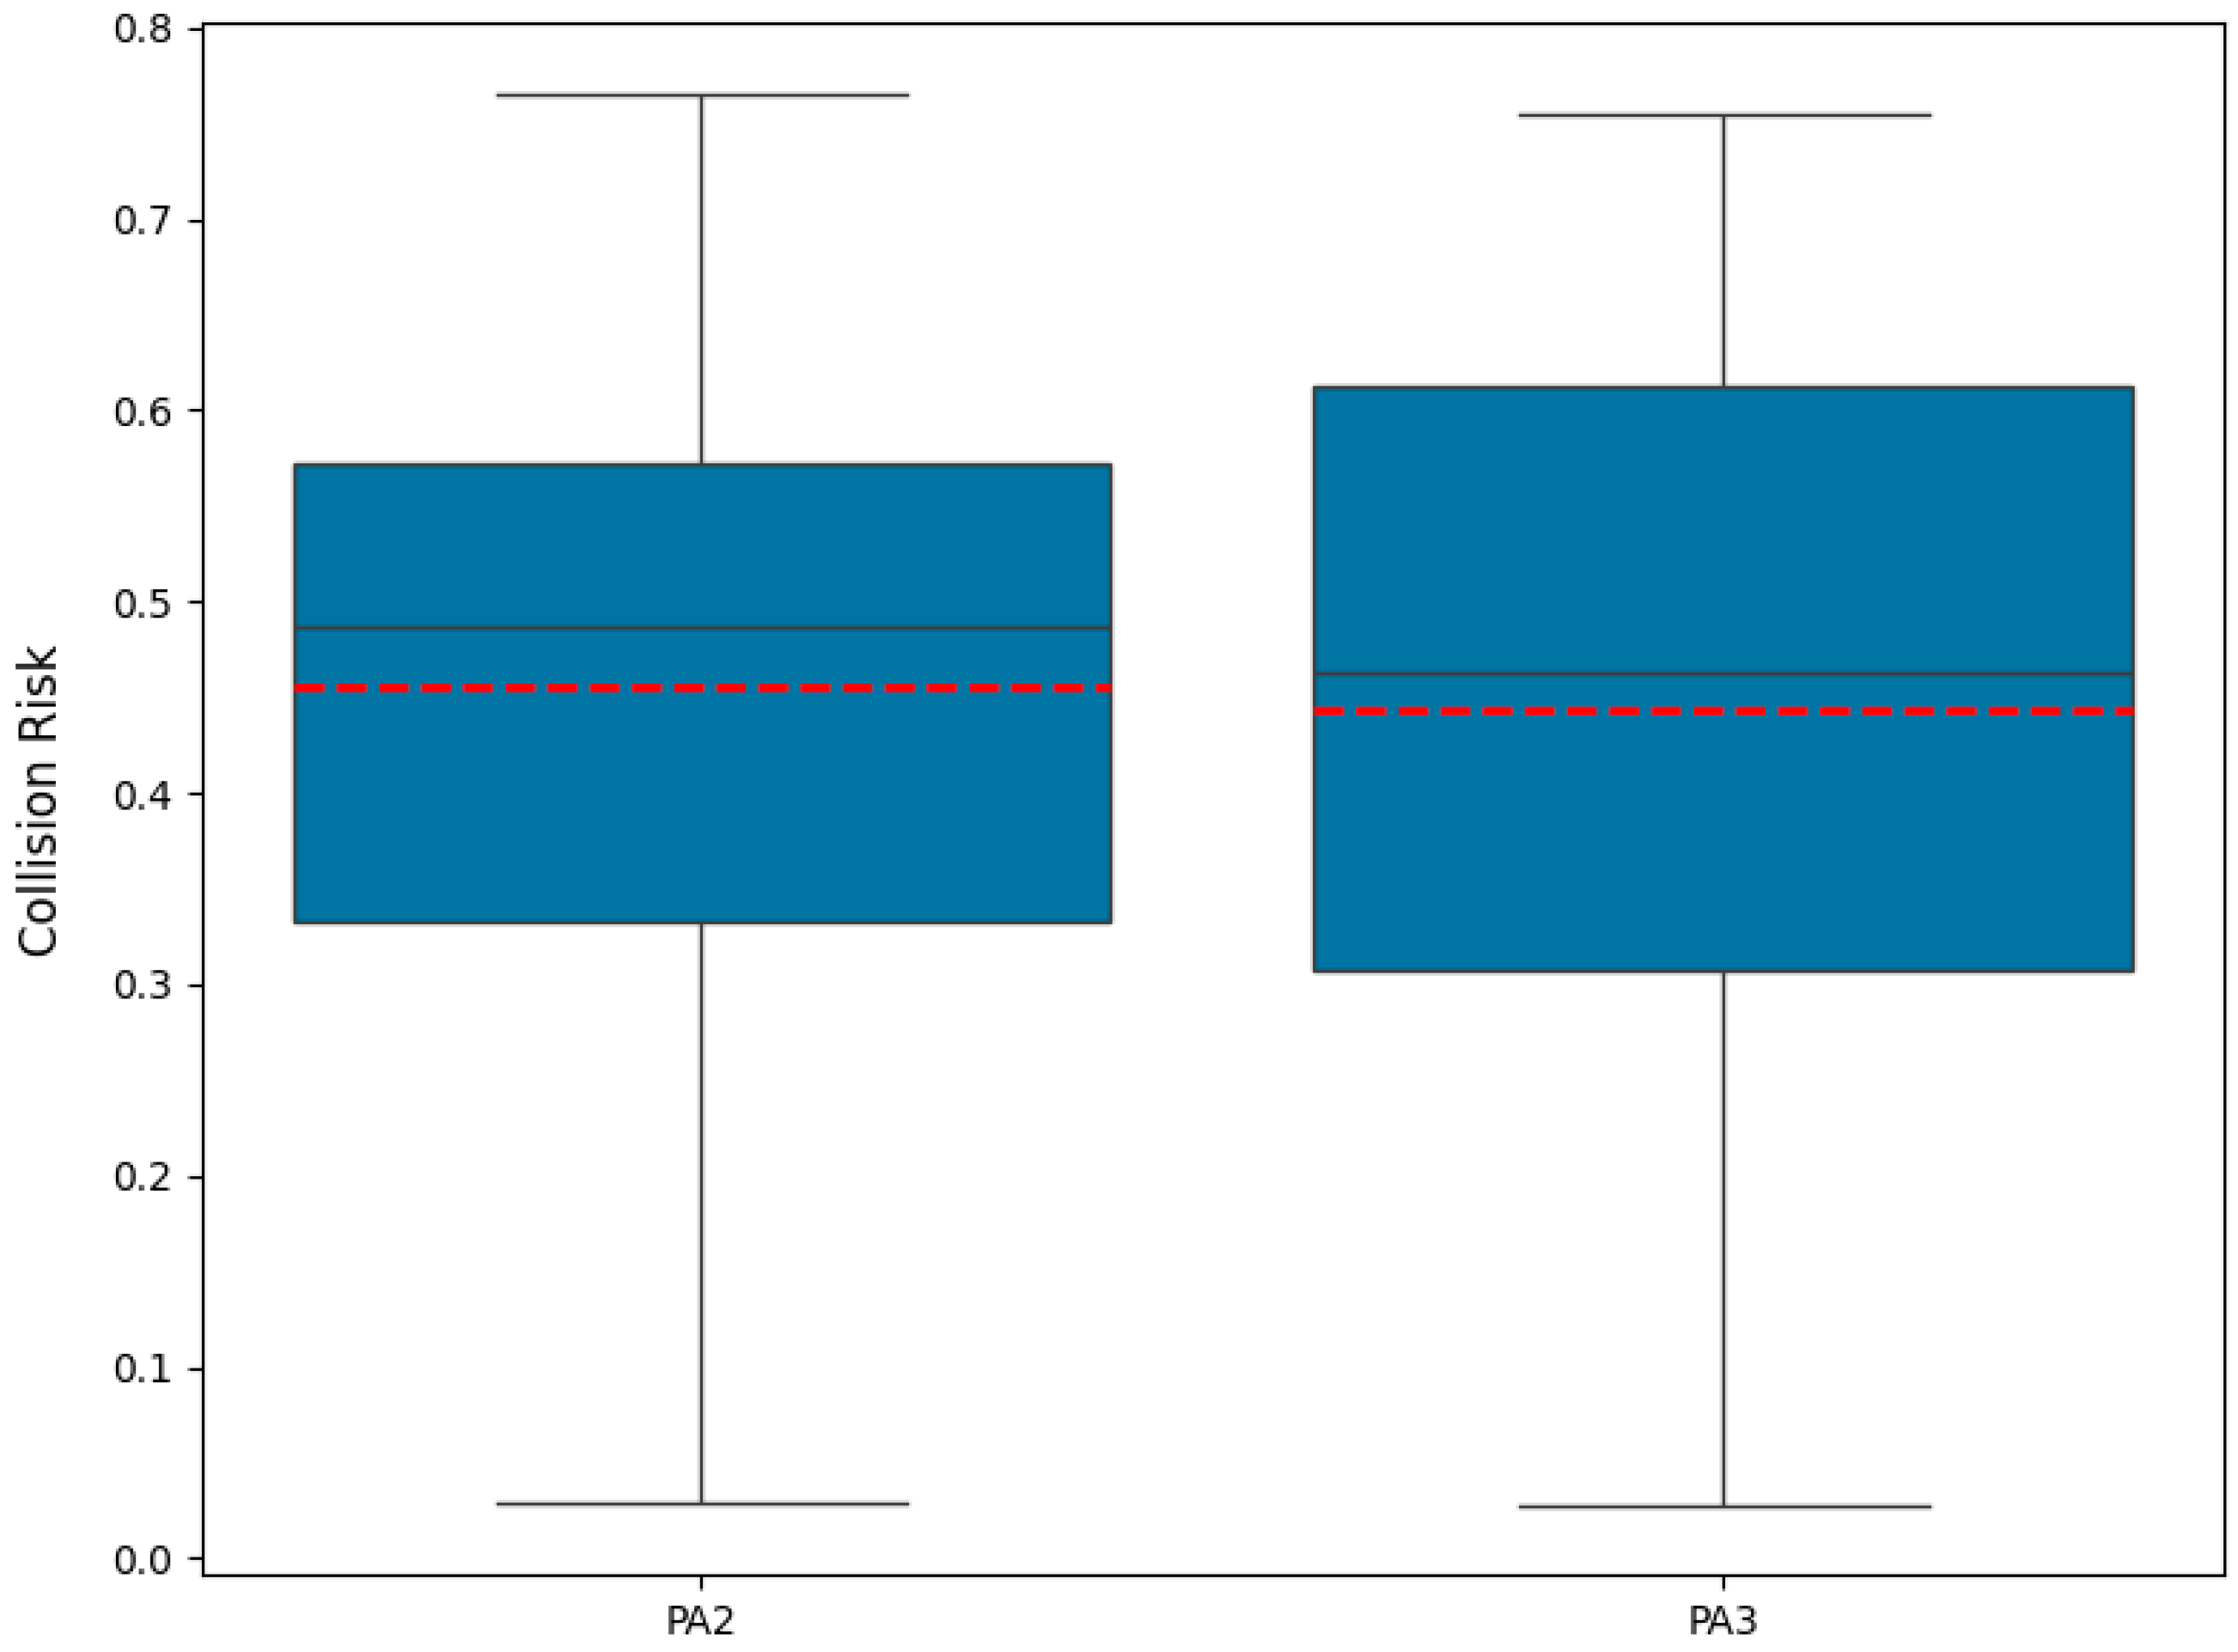
Collision risk scores were also calculated exclusively for encounters involving domain intrusion. Figure 12 illustrates the distribution of these collision risk scores for PA2 and PA3. The holistic collision risk scores (depicted as the red dotted line) for these intrusion-only encounters were 0.456 for PA2 and 0.443 for PA3.
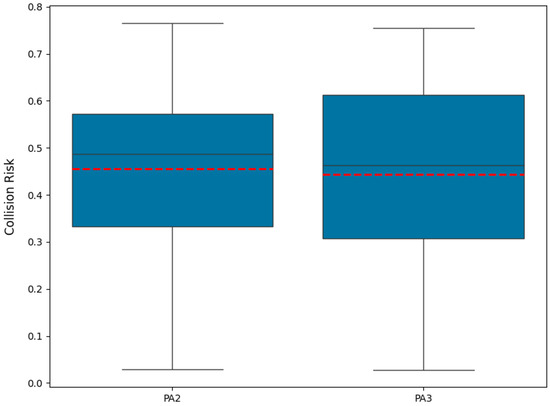
Figure 12.
The ship collision risks in PA2 and PA3.
The results demonstrate that the collision risk scores for PA2 exhibit considerable variation, ranging from approximately 0.0296 to 0.7660. In comparison, the collision risk scores in PA3 vary from approximately 0.0282 to 0.7550. These variations reflect notable fluctuations in collision risk across individual encounters. The slightly higher overall collision risk observed in PA2 aligns logically with expectations, as PA2 typically experiences more complex traffic conditions compared to PA3.
Based on quantitative assessment, historical AIS data from No.2 and No.3 precautionary areas in the core region of Ningbo–Zhoushan Port were further analysed. The proposed method systematically calculated the collision risks for each ship encounter, followed by comprehensive visualization analyses. This enabled a thorough examination of the collision risks from individual vessel interactions at the micro-level to aggregated regional assessments at the macro-level. The results indicate that the holistic collision risk in the No.2 precautionary area is higher than in the No.3 precautionary area.
This finding aligns with the existing research conducted by Hongxiang Feng et al. [41], who developed a novel quantitative collision risk assessment method for ships operating in congested waterways. Their approach combined K-means clustering with information entropy based on AIS data to assess the collision risks within the ship routing system at Ningbo–Zhoushan Port. Their results also categorized the No.2 precautionary area as a high-risk zone and the No.3 precautionary area as a medium-risk zone, further validating the accuracy and reliability of the collision risk assessment outcomes presented in this study.
Additionally, the proposed method in this research enables straightforward calculations of collision risks for any given ship encounter within arbitrary precautionary areas, offering an efficient and easily implementable assessment model. Compared to traditional methods such as DCPA/TCPA and static probabilistic models, the proposed approach offers several notable advantages. (1) It integrates both the spatial and temporal aspects of ship interactions through the dual use of intrusion depth and intrusion time. (2) It accommodates dynamic vessel behavior by incorporating ship-specific parameters such as length, course, and real movement trajectories, thereby enhancing situational realism. (3) It facilitates both retrospective analysis and potential integration into real-time decision-making platforms due to its modular structure and computational efficiency.
Moreover, traditional methods are limited in that they cannot fully capture the complete process of relative trajectory intrusion into the ship domain during encounters. They cannot simultaneously compute both the risk level of individual ship encounters and the aggregated collision risk for an entire precautionary area. The method proposed in this study addresses both shortcomings, providing a more holistic and scalable framework.
In conclusion, the AIS-based collision risk assessment model proposed in this study not only effectively classifies collision risk levels in complex maritime environments but also demonstrates superiority over the existing methods in terms of precision, adaptability, and operational applicability. The results confirm the methodological soundness and practical utility of the approach, offering a reliable tool for both safety evaluation and strategic decision-making in maritime traffic management.
5. Discussion
This paper proposes a novel method for collision risk assessment using AIS data. Ship domains, defined based on vessel-specific characteristics such as ship length and course, are incorporated into collision risk models to effectively analyze ship encounter situations. An illustrative case study using AIS data from the precautionary areas of Ningbo–Zhoushan Port demonstrates that the proposed method accurately characterizes and classifies collision risk levels. Furthermore, comparative analysis with existing studies confirms that this approach is both more effective and innovative, particularly for identifying high-risk collision scenarios.
The spatial and temporal analyses of the relative motion trajectories intruding into the own ship’s domain in PA2 and PA3 offer valuable insights for collision risk assessment and navigation safety management. Spatially, examining ship intrusion depth and duration characterizes the extent and persistence of intrusions into precautionary areas. PA2 demonstrates a broader spatial distribution with longer intrusion durations, indicating a more variable risk profile where intrusions occur from multiple directions and occasionally persist significantly. This variability implies a necessity for dynamic surveillance strategies to effectively manage unpredictable intrusion patterns. In contrast, PA3 exhibits a directional concentration of intrusions, reflecting a more predictable risk pattern likely influenced by navigational or environmental factors. This directional consistency allows for focused monitoring, as intrusion points predominantly cluster on one side of the ships. Probability density analysis further highlights this distinction, with a slightly higher density of high-risk intrusions in PA2, necessitating broader surveillance coverage.
Complementing these spatial findings, a temporal analysis reveals differences in the intrusion durations between PA2 and PA3. A comparison of actual versus theoretical maximum intrusion times shows distinct statistical characteristics between the two areas. Specifically, PA2 has a mean actual intrusion time of 132.88 s with a standard deviation of 120.80 s, whereas PA3 exhibits a shorter mean intrusion time of 113.84 s and a smaller standard deviation of 91.95 s. These findings indicate more concentrated and less variable intrusion durations in PA3, suggesting better regulation or surveillance of maritime traffic. Moreover, the range of actual intrusion durations in PA2 (10–790 s) is substantially larger compared to PA3 (5–390 s), underscoring the greater predictability and stability of traffic in PA3. Consequently, PA2 may require enhanced maritime traffic management or improved navigational guidance to mitigate the risks associated with prolonged intrusion periods.
Collectively, these results underscore the necessity of customized collision risk assessments tailored to the unique characteristics of each precautionary area. The broader spatial distribution and variable temporal intrusion patterns observed in PA2 highlight the need for flexible and comprehensive monitoring approaches to effectively manage sporadic, yet prolonged, high-risk encounters. In contrast, PA3’s predictable and concentrated intrusion patterns suggest that targeted surveillance strategies can efficiently mitigate collision risks. Tailoring monitoring and management practices according to each area’s risk profile can significantly enhance navigational safety and reduce the collision probabilities.
The proposed method is inherently suited for integration into practical monitoring frameworks, as it is grounded in empirical collision-avoidance outcomes and allows for the computation of ship collision risks across entire regions within a specified temporal window. Nonetheless, its application in real-time, mid-voyage monitoring scenarios remains constrained. This limitation primarily stems from the fact that the method relies on retrospective AIS data and confirmed post-encounter outcomes, which are inherently unavailable during ongoing voyages. Therefore, it is not feasible to directly determine the final avoidance maneuvers or outcomes of vessels currently navigating in real time. However, the aggregated regional collision risk levels derived from historical data using this method can serve as a valuable reference benchmark for real-time systems, such as vessel traffic services (VTS) or MASS. These reference risk levels can assist in evaluating the current risk exposure of vessels operating within precautionary areas, thereby supporting real-time situational awareness and decision-making. This auxiliary role enhances the practical relevance of the proposed approach in operational safety management, even if full real-time deployment is not immediately achievable.
The proposed collision risk assessment framework is primarily designed for post-analysis of historical AIS data. However, its structure is also well-suited for potential implementation in real-time operational systems. The computational efficiency of the core components, including trajectory preprocessing, encounter detection, and risk index calculation, has been optimized through algorithmic simplification and modular design. As such, the method can be adapted for real-time use with minimal latency, particularly when integrated with high-frequency AIS data streams. In practical terms, this framework could be deployed within vessel traffic services (VTS) systems to support dynamic decision-making. For instance, the model can continuously assess the collision risk levels of vessels entering the precautionary areas, providing VTS operators with timely warnings and suggested avoidance strategies. Moreover, for maritime autonomous surface ships (MASS), the framework can serve as an input module for onboard navigation systems. By incorporating real-time AIS inputs, the model enables autonomous vessels to dynamically evaluate surrounding traffic situations and proactively adjust their course to mitigate the potential collision risks. Future work may explore further computational optimization, real-time data integration protocols, and validation in simulated or live operational environments to fully realize the framework’s potential in real-time maritime traffic management and autonomous navigation contexts.
Although this study provides foundational insights into collision risk assessment using AIS data within precautionary areas, it has several limitations. First, the current analysis emphasizes intrusion depth and duration but does not account for dynamic factors such as ship speed or traffic density, which could substantially influence collision risk. Second, the method decomposes multi-vessel encounters into pairwise interactions, neglecting the collaborative risks arising from scenarios involving three or more vessels—a critical aspect in high-traffic waterways. Third, the reliance on a static ship domain limits the model’s adaptability to real-world conditions; a dynamic domain approach could better reflect evolving risks during encounters. Dynamic ship domains may offer advantages over static domains in collision risk assessment by adaptively responding to environmental conditions (e.g., winds, waves, currents, and visibility), vessel-specific characteristics (including maneuvering performance under different loads, speed-dependent scaling, and vessel-type variations), and real-time traffic situations (such as surrounding vessel density, encounter scenarios, and VTS/AIS inputs). This adaptive capability enhances risk assessment accuracy by reducing false alarms in complex waters, precisely identifying genuine collision risks in restricted areas, and enabling graded warnings based on intrusion severity and duration, while automatically adjusting safety boundaries according to navigational contexts like narrow channels or open waters.
Therefore, future research should incorporate these dynamic factors, refine the collision risk assessment model accordingly, extend the methodology to evaluate complex interactions among multiple vessels beyond current pairwise analysis limitations, and explore potential integration with automated control systems to enable real-time risk assessments, ultimately reducing collision probabilities within precautionary areas.
6. Conclusions
Ship collisions pose significant threats to maritime safety, particularly in congested precautionary areas with dense vessel traffic. Traditional collision risk assessment methods, such as the distance to the DCPA and TCPA, are limited by environmental uncertainties and unpredictable human responses. To address these limitations, this study proposes an innovative, holistic approach for collision risk assessment using AIS data.
AIS data from vessels navigating in precautionary areas are collected and resampled to ensure synchronized temporal frameworks. Ship encounters are systematically identified, and each potential collision scenario involving multiple vessels is evaluated by analyzing all possible two-ship combinations individually.
For every encounter, the key parameters, including MSED, relative azimuth angles, and trajectories, are computed. These parameters facilitate the application of a customized ship domain model that accounts for specific vessel characteristics such as ship length and course. Critical interaction points, specifically domain entry and exit positions, are pinpointed, enabling the calculation of vital metrics including intrusion depth and intrusion time. Descriptive statistical analyses complemented by visualizations offer comprehensive insights into the encounter characteristics.
A novel set of collision risk indices, integrating both intrusion depth and intrusion time, is developed with particular emphasis on intrusion depth due to its higher sensitivity in indicating proximity danger and constrained maneuvering space. Furthermore, a comprehensive, holistic collision risk index is established based on extensive observations of numerous vessel interactions within the precautionary area. A case study employing AIS data from Ningbo–Zhoushan Port demonstrates that the results confirm the effectiveness and feasibility of the proposed method for evaluating and classifying collision risks. This method provides maritime stakeholders with a more precise, reliable, and robust framework for collision risk assessment in complex navigational environments.
In conclusion, this study addresses the limitations of conventional maritime collision risk assessment methodologies by introducing an innovative AIS-based framework tailored specifically for precautionary areas. Through detailed analyses and the quantification of interaction parameters such as intrusion depth and intrusion time, the approach successfully captures the complexity of navigational behaviors in dense traffic conditions. The results from Ningbo–Zhoushan Port indicate the method’s superior capability in identifying critical vessel encounters, providing valuable insights for improved navigational safety practices. Specifically, we clarify that, although the current methodology is designed for retrospective analysis using historical AIS data, it possesses inherent qualities that support future integration into real-time monitoring frameworks. The model computes region-wide collision risks based on empirically observed avoidance behaviors and interaction outcomes, which can serve as a benchmark for real-time evaluation. As such, the derived regional risk levels offer actionable insights for operational systems like vessel traffic services (VTS), enabling enhanced situational awareness and informed decision-making in precautionary areas. Moreover, we highlight the future potential of adapting the framework for maritime autonomous surface ships (MASS) by coupling the proposed risk assessment indicators, particularly intrusion depth and intrusion time, with onboard autonomous navigation algorithms. This integration would support predictive collision-avoidance strategies and enhance autonomous decision-making capabilities under complex navigational conditions.
Despite these promising implications, further refinement remains necessary. Future developments should incorporate additional vessel-specific factors, directional collision risk analyses, and evaluations under more diverse traffic scenarios. Ultimately, the proposed approach offers maritime authorities and ship operators a practical, data-driven strategy to enhance collision prevention and safety management in high-risk precautionary areas.
In future research, a comprehensive comparative study will be carried out to evaluate the effectiveness of the proposed holistic collision risk assessment method for precautionary areas based on AIS data, in comparison with traditional approaches. This evaluation will be conducted across a range of real-world maritime traffic scenarios, with a particular emphasis on complex and congested environments. The analysis will not be limited to precautionary areas but will also include other navigational waters to examine the method’s broader applicability. Through this comparative study, the advantages and limitations of the proposed model will be quantitatively assessed, offering deeper insights into its practical performance and reliability.
Author Contributions
Conceptualization, Y.Z. (Yu Zhong) and P.Z.; methodology, Y.Z. (Yu Zhong), H.Z., J.L., A.M., and P.Z.; validation, Y.Z. (Yusheng Zhou), M.G., and J.L.; formal analysis, Y.Z. (Yu Zhong), Y.Z. (Yusheng Zhou), and P.Z.; resources, P.Z.; writing—original draft preparation, Y.Z. (Yu Zhong) and H.Z.; writing—review and editing, M.G., J.L., and P.Z.; visualization, Y.Z. (Yu Zhong); supervision, P.Z.; project administration, H.Z. and P.Z.; funding acquisition, P.Z. All authors have read and agreed to the published version of the manuscript.
Funding
This research was funded and the work was supported in part by the National Natural Science Foundation of China (52272334), the Ningbo International Science and Technology Cooperation Project (2023H020), the Key R&D Program of Zhejiang Province (2024C01180), the EC H2020 Project (690713) and the National Key Research and Development Program of China (2017YFE0194700).
Data Availability Statement
Available upon request.
Acknowledgments
We would like to thank the National ‘111’ Centre on the Safety and Intelligent Operation of Sea Bridges (D21013) and the Zhejiang 2011 Collaborative Innovation Center for Port Economy for the support in providing academic and technical resources. The authors would like to thank the K.C. Wong Magna Fund at Ningbo University for their sponsorship.
Conflicts of Interest
The authors declare no conflicts of interest.
References
- Xue, Z.; Zhang, W.; Yin, J. Security Evaluation Model of Precautionary Area Based on Improved Entropy Weight TOPSIS. In Proceedings of the 2020 Chinese Control And Decision Conference (CCDC), Hefei, China, 22–24 August 2020. [Google Scholar]
- Wang, B.L. Research on the Safety Level of Precautionary Area Based on Traffic Conflict Theory. Master’s Thesis, Dalian Maritime University, Dalian, China, 2018. [Google Scholar]
- Zhou, Y.; Du, W.; Liu, J.; Li, H.; Grifoll, M.; Song, W.; Zheng, P. Determination of Ship Collision Avoidance Timing Using Machine Learning Method. Sustainability 2024, 16, 4626. [Google Scholar] [CrossRef]
- Zhang, L.; Zhao, F.; Liu, J.; Liu, S.; Song, J. Assessing the Collision Risks of Merchant and Fishing Ships Based on Behavioral Patterns: A Case Study in Qingdao Port. Ocean. Eng. 2025, 329, 121122. [Google Scholar] [CrossRef]
- Zhang, M.; Montewka, J.; Manderbacka, T. A Big Data Analytics Method for the Evaluation of Ship-Ship Collision Risk Reflecting Hydrometeorological Conditions. Reliab. Eng. Syst. Saf. 2021, 213, 107674. [Google Scholar] [CrossRef]
- Huang, C.; Wang, X.; Wang, H. A Novel Regional Ship Collision Risk Assessment Framework for Multi-Ship Encounters in Complex Waters. Ocean. Eng. 2024, 309, 118583. [Google Scholar] [CrossRef]
- Wang, N.; Yuen, F.K.; Yuan, J. Ship Collision Risk Assessment: A Multi-Criteria Decision-Making Framework Based on Dempster-Shafer Evidence Theory. Appl. Soft Comput. 2024, 162, 111823. [Google Scholar] [CrossRef]
- Korupoju, K.A.; Kapadia, V.; Vilwathilakam, S.A. Ship Collision Risk Evaluation Using AIS and Weather Data Through Fuzzy Logic and Deep Learning. Ocean. Eng. 2025, 318, 120116. [Google Scholar] [CrossRef]
- Ding, H.; Weng, J.; Shi, K. Real-Time Assessment of Ship Collision Risk Using Image Processing Techniques. Appl. Ocean. Res. 2024, 153, 104241. [Google Scholar] [CrossRef]
- Cheng, Z.; Chen, P.; Mou, J. Novel Collision Risk Measurement Method for Multi-Ship Encounters via Velocity Obstacles and Temporal Proximity. Ocean. Eng. 2024, 302, 117585. [Google Scholar] [CrossRef]
- Liu, J.; Zhang, J.; Yang, Z. A Novel Data-Driven Method of Ship Collision Risk Evolution Evaluation During Real Encounter Situations. Reliab. Eng. Syst. Saf. 2024, 249, 110228. [Google Scholar] [CrossRef]
- Zhao, J.; Zeng, S.; Guo, J. A Dynamic Risk Assessment Method for Ship Conflict Based on Imperfect Information Game Theory. Ocean. Eng. 2024, 309, 118396. [Google Scholar] [CrossRef]
- Zheng, L. Ship Collision Risk Assessment Based on D-S Evidence Theory. Master’s Thesis, Dalian Maritime University, Dalian, China, 2024. [Google Scholar]
- Kim, J.-K.; Park, D.J. Determining the Proper Times and Sufficient Actions for the Collision Avoidance of Navigator-Centered Ships in the Open Sea Using Artificial Neural Networks. J. Mar. Sci. Eng. 2023, 11, 1384. [Google Scholar] [CrossRef]
- Xu, X.; Wu, B.; Teixeira, A.P. Ship Collision Risk Assessment and Visualization Using Radar Sequential Images for Intelligent Maritime Supervision. IEEE Trans. Intell. Transp. Syst. 2025, 99, 1–12. [Google Scholar] [CrossRef]
- Ma, J.; Hu, Q.; Liu, T.; Zhu, Z.; Zhou, Y. Research on Ship Collision Risk Calculation in Port Navigation Waters Based on Ising Model and AIS Data. ASCE-ASME J. Risk Uncertain. Eng. Syst. Part. A Civ. Eng. 2024, 10, 04024012. [Google Scholar] [CrossRef]
- Shi, J.; Liu, Z.; Feng, Y. Evolutionary Model and Risk Analysis of Ship Collision Accidents Based on Complex Networks and DEMATEL. Ocean. Eng. 2024, 305, 117965. [Google Scholar] [CrossRef]
- Mao, Z.; Shuo, X.; Xiumin, C. Research on Autonomous Collision Avoidance of Merchant Ship Based on Inverse Reinforcement Learning. Int. J. Adv. Robot. Syst. 2020, 17, 582–606. [Google Scholar]
- Ohn, S.W.; Namgung, H. Interval Type-2 Fuzzy Inference System Based on Closest Point of Approach for Collision Avoidance between Ships. Appl. Sci. 2020, 10, 3919. [Google Scholar] [CrossRef]
- Dawei, G.; Yongsheng, Z.; Ke, Y. Deep Learning-Based Framework for Regional Risk Assessment in a Multi-Ship Encounter Situation Based on the Transformer Network. Reliab. Eng. Syst. Saf. 2024, 241, 109678. [Google Scholar]
- Xuri, X.; Kezhong, L.; Sean, L. Multi-Scale Collision Risk Estimation for Maritime Traffic in Complex Port Waters. Reliab. Eng. Syst. Saf. 2023, 240, 109521. [Google Scholar]
- Shi, J.; Liu, Z. Deep Learning in Unmanned Surface Vehicles Collision-Avoidance Pattern Based on AIS Big Data with Double GRU-RNN. J. Mar. Sci. Eng. 2020, 8, 682. [Google Scholar] [CrossRef]
- Fujii, Y.; Yamanouchi, H.; Matui, T. Survey on Vessel Traffic Management Systems and Brief Introduction to Marine Traffic Studies. Electron. Navig. Res. Inst. Pap. 1984, 1984, 1E–131. [Google Scholar]
- Goodwin, E.M. A Statistical Study of Ship Domains. J. Navig. 1973, 26, 130. [Google Scholar]
- Pietrzykowski, Z.; Uriasz, J. The Ship Domain–A Criterion of Navigational Safety Assessment in an Open Sea Area. J. Navig. 2009, 62, 93–108. [Google Scholar] [CrossRef]
- Wang, N. An Intelligent Spatial Collision Risk Based on the Quaternion Ship Domain. J. Navig. 2010, 63, 733–749. [Google Scholar] [CrossRef]
- Hansen, M.G.; Jensen, T.K.; Lehn-Schiøler, T.; Melchild, K.; Rasmussen, F.M.; Ennemark, F. Empirical Ship Domain Based on AIS Data. J. Navig. 2013, 66, 931–940. [Google Scholar]
- Wang, Y.; Chin, H.-C. An Empirically-Calibrated Ship Domain as a Safety Criterion for Navigation in Confined Waters. J. Navig. 2016, 69, 257–276. [Google Scholar] [CrossRef]
- Zhang, F.; Peng, X.; Huang, L.; Zhu, M.; Wen, Y.; Zheng, H. A Spatiotemporal Statistical Method of Ship Domain in the Inland Waters Driven by Trajectory Data. J. Mar. Sci. Eng. 2021, 9, 410. [Google Scholar] [CrossRef]
- Dinh, G.H.; Im, N. The Combination of Analytical and Statistical Method to Define Polygonal Ship Domain and Reflect Human Experiences in Estimating Dangerous Area. Int. J. E-Navig. Marit. Econ. 2016, 4, 97–108. [Google Scholar]
- Kundakçı, B.; Nas, S.; Gucma, L. Prediction of Ship Domain on Coastal Waters by Using AIS Data. Ocean. Eng. 2023, 273, 113921. [Google Scholar]
- Liu, D.; Zheng, Z.; Liu, Z. Research on Dynamic Quaternion Ship Domain Model in Open Water Based on AIS Data and Navigator State. J. Mar. Sci. Eng. 2024, 12, 516. [Google Scholar] [CrossRef]
- Silveira, P.; Teixeira, A.P.; Soares, C.G. A Method to Extract the Quaternion Ship Domain Parameters from AIS Data. Ocean. Eng. 2022, 257, 111568. [Google Scholar] [CrossRef]
- Rawson, A.; Rogers, E.; Foster, D.; Phillips, D. Practical application of domain analysis: Port of London case study. J. Navig. 2014, 67, 193–209. [Google Scholar] [CrossRef]
- Zhang, W.; Goerlandt, F.; Montewka, J.; Kujala, P. A method for detecting possible near miss ship collisions from AIS data. Ocean. Eng. 2015, 107, 60–69. [Google Scholar] [CrossRef]
- Liu, J.; Shi, G.-Y.; Zhu, K.-G. A novel ship collision risk evaluation algorithm based on the maximum interval of two ship domains and the violation degree of two ship domains. Ocean. Eng. 2022, 255, 111431. [Google Scholar] [CrossRef]
- Liu, K.; Yuan, Z.; Xin, X.; Zhang, J.; Wang, W. Conflict detection method based on dynamic ship domain model for visualization of collision risk Hot-Spots. Ocean. Eng. 2021, 242, 110143. [Google Scholar] [CrossRef]
- Szlapczynski, R.; Szlapczynska, J. Review of Ship Safety Domains: Models and Applications. Ocean. Eng. 2017, 145, 277–289. [Google Scholar] [CrossRef]
- Lin, Q.; Yin, B.; Zhang, X.; Grifoll, M.; Feng, H. Evaluation of ship collision risk in ships’ routing waters: A Gini coefficient approach using AIS data. Phys. A Stat. Mech. Its Appl. 2023, 624, 128936. [Google Scholar] [CrossRef]
- Feng, H.; Grifoll, M.; Yang, Z.; Zheng, P. Collision risk assessment for ships’ routing waters: An information entropy approach with automatic identification system (AIS) data. Ocean. Coast. Manag. 2022, 224, 106184. [Google Scholar] [CrossRef]
- Qu, X.; Meng, Q.; Suyi, L. Ship collision risk assessment for the Singapore strait. Accid. Anal. Prev. 2011, 43, 2030–2036. [Google Scholar] [CrossRef]
- Wu, X.; Mehta, A.L.; Zaloom, V.A.; Craig, B.N. Analysis of waterway transportation in Southeast Texas waterway based on AIS data. Ocean. Eng. 2016, 121, 196–209. [Google Scholar] [CrossRef]
- Du, L.; Valdez Banda, O.A.; Goerlandt, F.; Kujala, P.; Zhang, W. Improving near miss detection in maritime traffic in the northern Baltic Sea from ais data. J. Mar. Sci. Eng. 2021, 9, 180. [Google Scholar] [CrossRef]
- Ulusçu, Ö.S.; Özbaş, B.; Altıok, T.; Or, I. Risk analysis of the vessel traffic in the strait of Istanbul, Risk Anal. Int. J. 2009, 29, 1454–1472. [Google Scholar]
- Ding, Z.; Zhao, M. Visualization modeling method for ship collision risk based on AIS data. J. Electron. Inf. Technol. Comput. Eng. 2024, 8, 953–958. [Google Scholar]
- Ma, X.; Shi, G.; Shi, J.; Liu, J. A framework of marine collision risk identification strategy using AIS data. J. Navig. 2023, 76, 525–544. [Google Scholar] [CrossRef]
- Liu, R.W.; Huo, X.; Liang, M.; Wang, K. Ship collision risk analysis: Modeling, visualization and prediction. Ocean. Eng. 2022, 266, 113–123. [Google Scholar]
- Ding, H.; Weng, J. A robust assessment of inland waterway collision risk based on AIS and visual data fusion. Ocean. Eng. 2024, 307, 118242. [Google Scholar]
- Liu, Z.; Zhang, B.; Zhang, M.; Wang, H.; Fu, X. A quantitative method for the analysis of ship collision risk using AIS data. Ocean. Eng. 2023, 272. [Google Scholar] [CrossRef]


Disclaimer/Publisher’s Note: The statements, opinions and data contained in all publications are solely those of the individual author(s) and contributor(s) and not of MDPI and/or the editor(s). MDPI and/or the editor(s) disclaim responsibility for any injury to people or property resulting from any ideas, methods, instructions or products referred to in the content. |
© 2025 by the authors. Licensee MDPI, Basel, Switzerland. This article is an open access article distributed under the terms and conditions of the Creative Commons Attribution (CC BY) license (https://creativecommons.org/licenses/by/4.0/).