Abstract
Conducting research on the effectiveness of driving simulators is of great significance for enhancing the availability of driving simulator systems. However, in risky environments, traditional methods have the limitation of making it difficult to conduct real vehicle experiments. Therefore, this study proposes a method based on driver physiological indicators to evaluate the effectiveness of driving simulators in risky environments. On the one hand, the two-dimensional extended time to collision theoretical model (2D-TTC) was used to calculate the risk degree. Then, the similarity between the risk degree and the drivers’ electrocardiogram (ECG), electromyogram (EMG), and electrodermal activity (EDA) data sequences was calculated based on the dynamic time warping (DTW) model. On the other hand, we used the complexity and sample entropy of ECG and EMG as indicators to assess the drivers’ physiological load. This paper used intersections as risk scenarios to conduct driving simulation experiments to verify the feasibility of the above method. It was found that changes in drivers’ physiological indicators were consistent with changes in risk degree, with the DTW values of risk degree and drivers’ EDA tending to become smaller and the two sequence values closer to being similar. It was also found that the complexity and the sample entropy of the driver’s ECG and EMG showed higher values in the simulated poor sight intersection scenario compared to the intersection with good sight. In addition, in the simulated heavy traffic intersection scenario, physiological parameters such as EMG complexity and sample entropy, as well as ECG complexity, were higher than in the low traffic flow intersection. These findings are highly consistent with the characteristics of physiological responses in real driving environments, fully demonstrating the effectiveness of the test-driving simulation system in simulating risky traffic scenarios. The method proposed in this paper overcomes the limitations of traditional approaches and effectively validates the effectiveness of driving simulation systems in risky environments. The research results can drive further development and application of driving simulation technology.
1. Introduction
Currently, driving simulators are extensively utilized in research areas such as intelligent vehicle control for safety enhancement, road traffic facilities, intelligent transportation systems, and driver behavior evaluation. They serve as auxiliary research tools in human–machine ergonomics, transportation, vehicle engineering, and related fields [1,2]. Driving simulators provide an artificial virtual environment. The accuracy, effectiveness, and reliability of experiments based on driving simulators largely depend on the effectiveness of the simulator itself [3]. Therefore, the effectiveness of driving simulators is crucial to ensuring the reliability of research outcomes.
The method used to evaluate the effectiveness of driving simulators is basically a comparative evaluation of driving simulation experiments and real vehicle experiments [4]. For example, the driving simulator can be verified and calibrated through statistical analysis of the vehicle’s speed when it passes through a specific area in both real and virtual states [5,6,7]. Another method is to evaluate the simulator by comparing the driver’s experience in real and virtual situations [8]. Driving simulators can also be validated and calibrated by comparing driver behavior in an experimental area under real and virtual conditions [9,10,11,12]. Another feature of the evaluation method is the use of the concept of relative effectiveness [13] in the evaluation. Relative effectiveness is relative to absolute effectiveness. Absolute effectiveness focuses on data consistency and equivalence, while relative effectiveness focuses more on examining whether the driver’s behavior in real and virtual situations has the same order of magnitude and change trend.
Most studies evaluate effectiveness by conducting driving simulation experiments in non-risk scenarios. Alonso et al. [14]. systematically evaluated the effectiveness of driving simulators as a driver training tool in non-risk scenarios. It was found that the simulator excelled in improving driving behavior and enhancing driving skills, especially in non-risk scenarios. Llopis-Castelló et al. [15] derived a speed parameter correction method for a two-lane rural section through a comparative analysis of natural driving data and simulated experimental data. For curved road sections, some scholars have verified driving simulator effectiveness by comparing predicted and experimental speed trajectory curves, focusing on significant differences and trends between the two speeds [8,16]. Lioi et al. [14] found that driving simulators have shown some effectiveness in tunnel safety studies, especially in simulating the behavior of heavy trucks. However, there are still some differences in the simulation of cars, which may be related to the type of vehicle, the driving behavior, or the modeling accuracy of the simulator.
In summary, the main method for verifying the effectiveness of driving simulators involves collecting driver behavior data (such as speed and acceleration) in simulators and real vehicles under non-risk scenarios. Conclusions about effectiveness are drawn by comparing and analyzing the collected behavior data. Unlike ordinary traffic scenarios, real vehicle experiments are challenging to conduct on actual roads due to the specific nature of risky environments. Therefore, it is difficult to evaluate the effectiveness of driving simulators in risky environments by comparing simulated driving with actual driving.
In recent years, with the application of human factor engineering and the development of wearable physiological devices, the use of drivers’ physiological data to study driving behavior has gradually gained attention. Wang et al. [17] used heart rate variability (HRV) characteristics, calculated by sample entropy, to analyze driving fatigue during continuous driving stages. Gemonet et al. [18] conducted a study involving 41 participants to compare driving performance, physiological responses, and self-reported data between a Sherpa2 driving simulator and an actual vehicle on a test track under constant-speed conditions. Their findings indicated that the simulator accurately replicated real-world driving scenarios, as evidenced by the consistency in both behavioral and physiological measures. In a related study, Zontone et al. [19] developed a driver stress detection system by examining endosomatic electrodermal activity (specifically skin potential response, SPR) alongside electrocardiogram (ECG) signals to assess stress levels in real time.
The extensive application of driver physiological data provides new ideas for evaluating the effectiveness of driving simulators in risky environments: to evaluate whether the driving simulator can induce physiological responses similar to those in real driving, thereby verifying the effectiveness of the driving simulator in risky environments. Based on this idea, this study evaluates the effectiveness of driving simulators in intersection risk environments. Specifically, it covers:
- (1)
- Effectiveness evaluation method of the driving simulator in intersection risk environments: The extended TTC theoretical model is used to calculate the risk of intersections, and similarity is used as an indicator to measure the matching degree between the risk and the driver’s physiological data. The complexity and sample entropy of electrocardiogram (ECG) and electromyography (EMG) are used as indicators to evaluate the physiological load of drivers at four types of intersections.
- (2)
- Experimental design for evaluating the effectiveness of the simulator based on the intersection risk environment: Four unsignalized intersection conflict scenarios were designed using the 3D scene editing software VSDesign (Version number 3.1). Twenty-seven drivers were recruited, and a simulation experiment was conducted using the driving simulator KMRTS independently developed by Kunming University of Science and Technology. The wearable physiological detection device Ergo LAB was used to collect the drivers’ ECG, EMG, and EDA data, providing data support for the effectiveness evaluation of simulators in risky intersection environments.
- (3)
- Experimental results analysis and discussion: According to the effectiveness evaluation method, firstly, the changing rules, correlation, and matching degree between the objective risk degree TTC and the drivers’ physiological indicators are analyzed. Secondly, the complexity and sample entropy of the drivers’ ECG and EMG physiological indicators are analyzed. Through the analysis of the above two aspects, the effectiveness of the driving simulator in intersection risk environments will be explored.
The method proposed in this study overcomes the limitations of traditional methods that make it difficult to conduct real car experiments. This method fills a gap in the effectiveness evaluation of driving simulators in risky environments.
2. Method
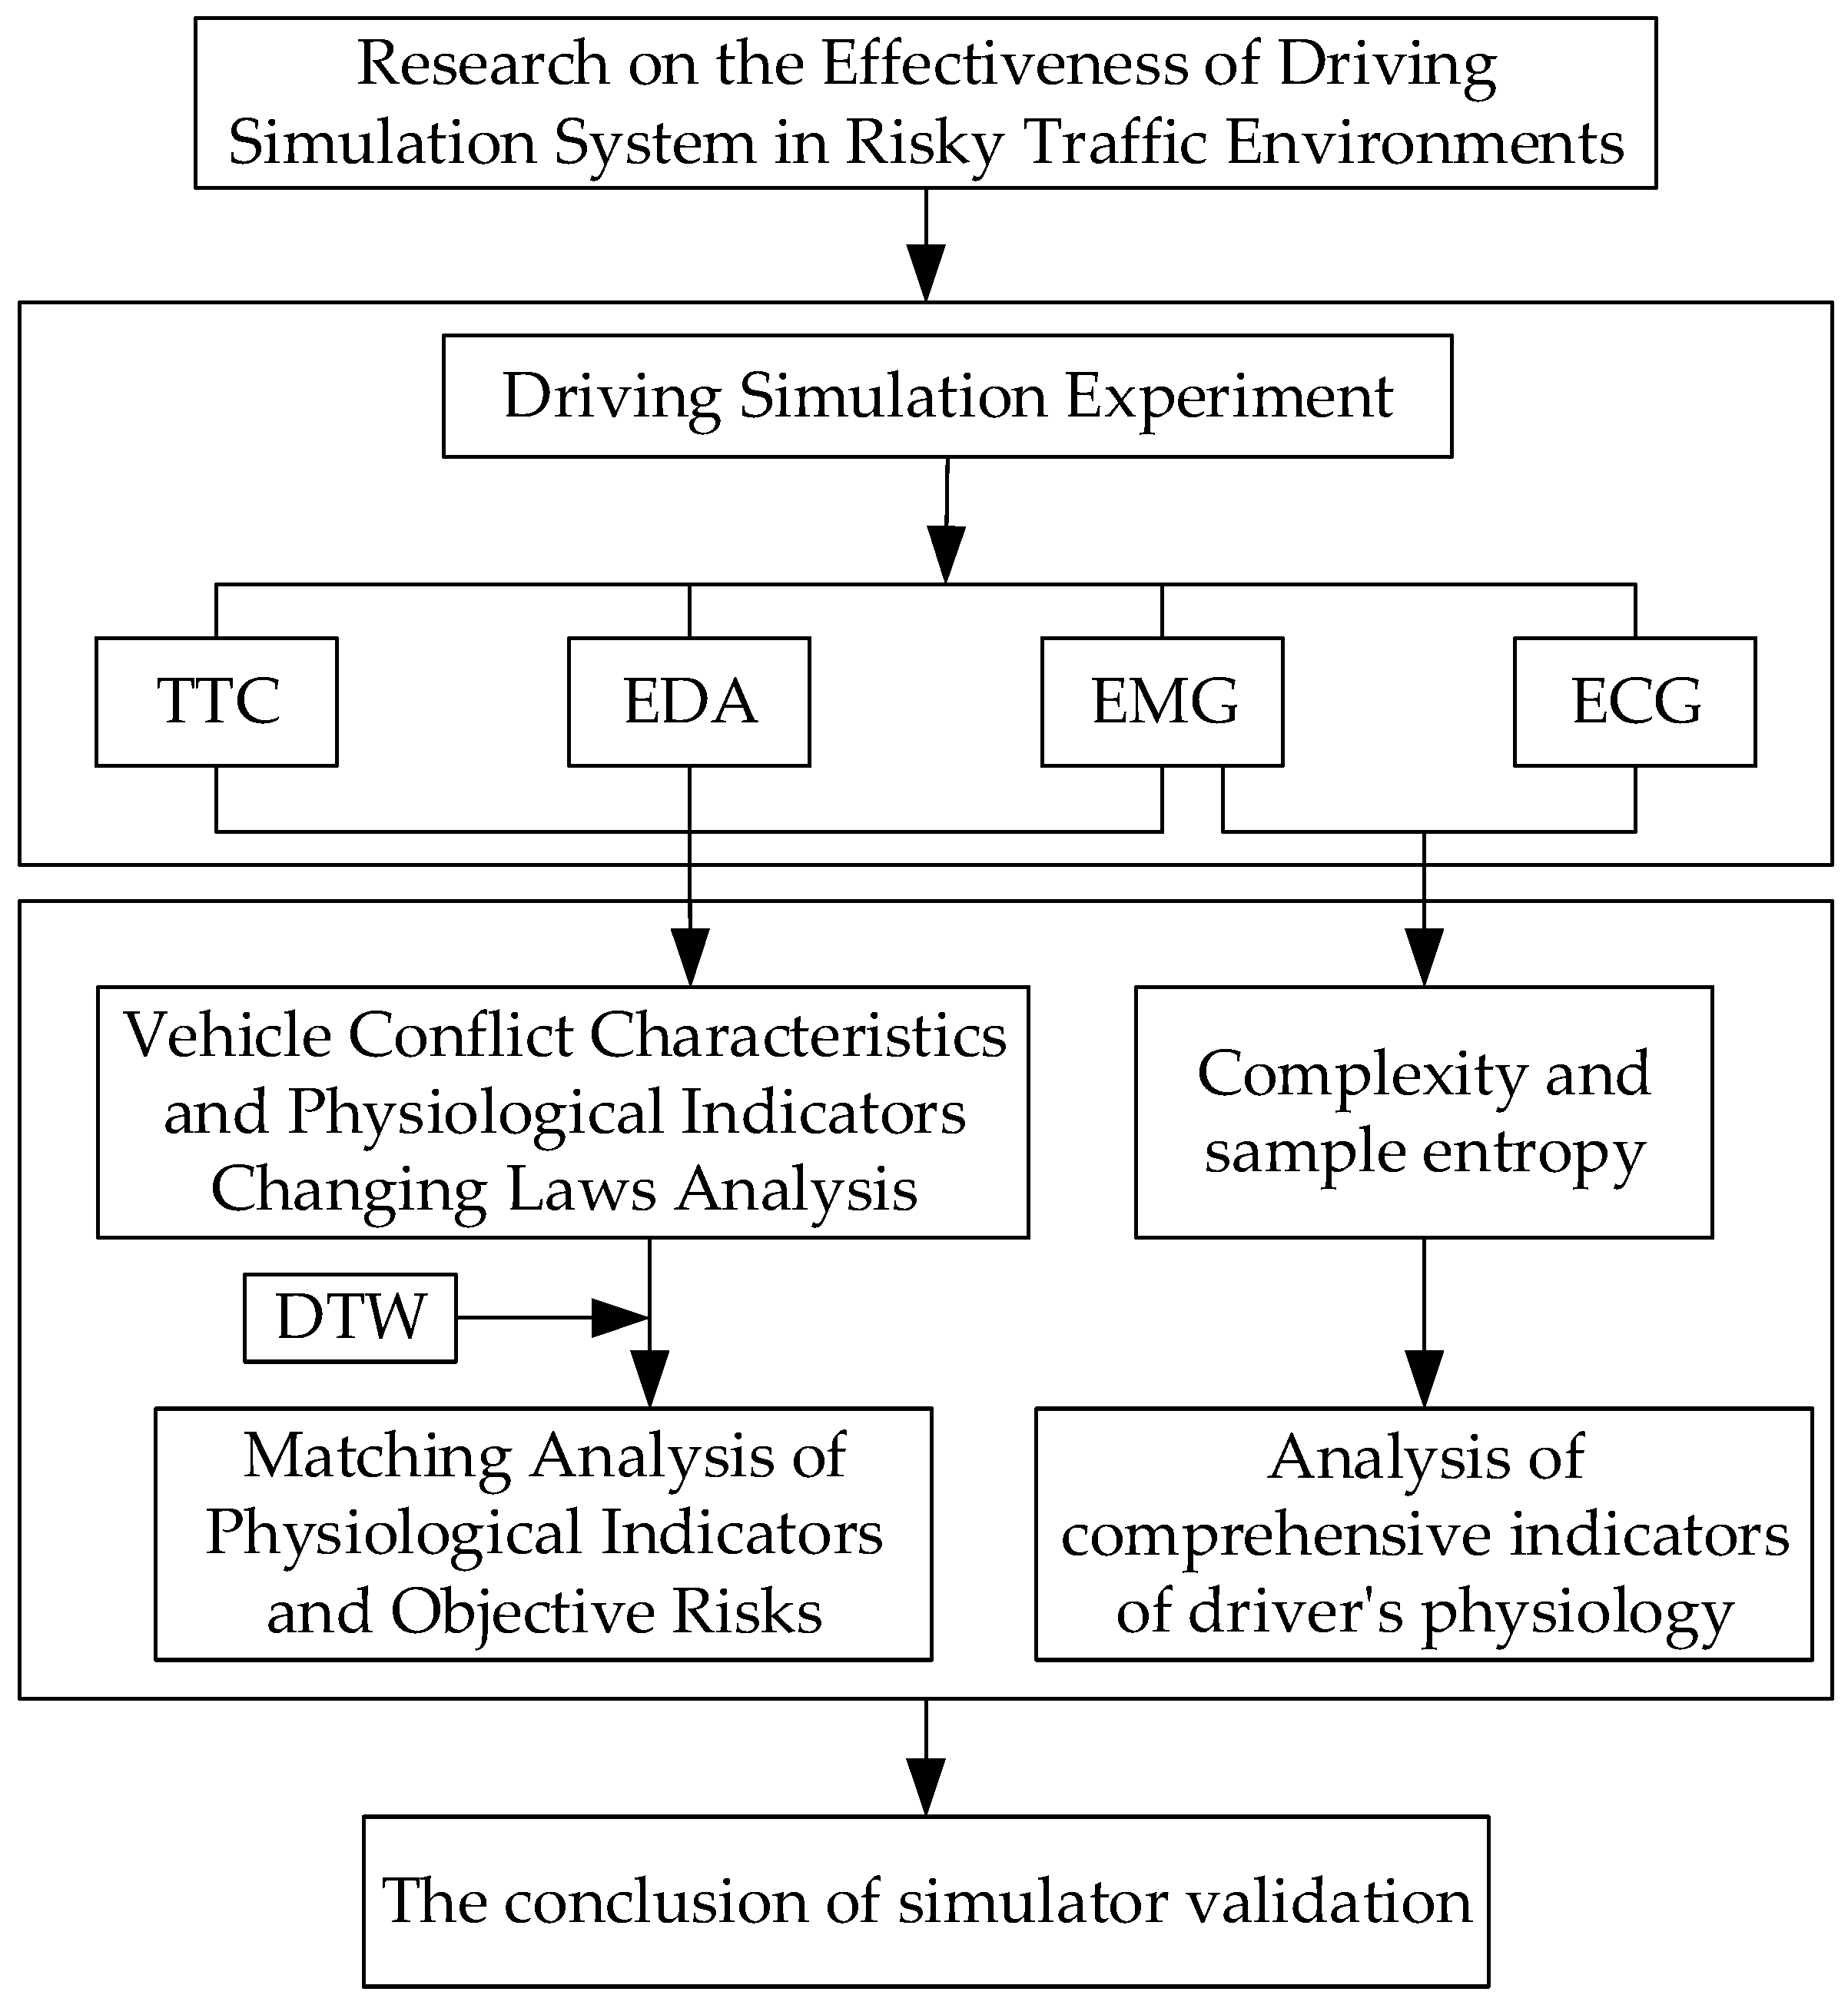
This paper mainly studies two aspects: (1) Using the two-dimensional extended TTC theoretical model as a calibration reference, the drivers’ ECG, EMG, and EDA data in risk intersection environments are first analyzed. Then, the dynamic time warping (DTW) method is applied for similarity evaluation to assess the effectiveness of driving simulators in risk perception. (2) Sample entropy and complexity were used to evaluate the effectiveness of driving simulators in different risky intersection environments. The technical approach of this paper is shown in Figure 1.

Figure 1.
Technical routes for validating simulator effectiveness in risky traffic environments.
2.1. Objective Risk Analysis Based on TTC
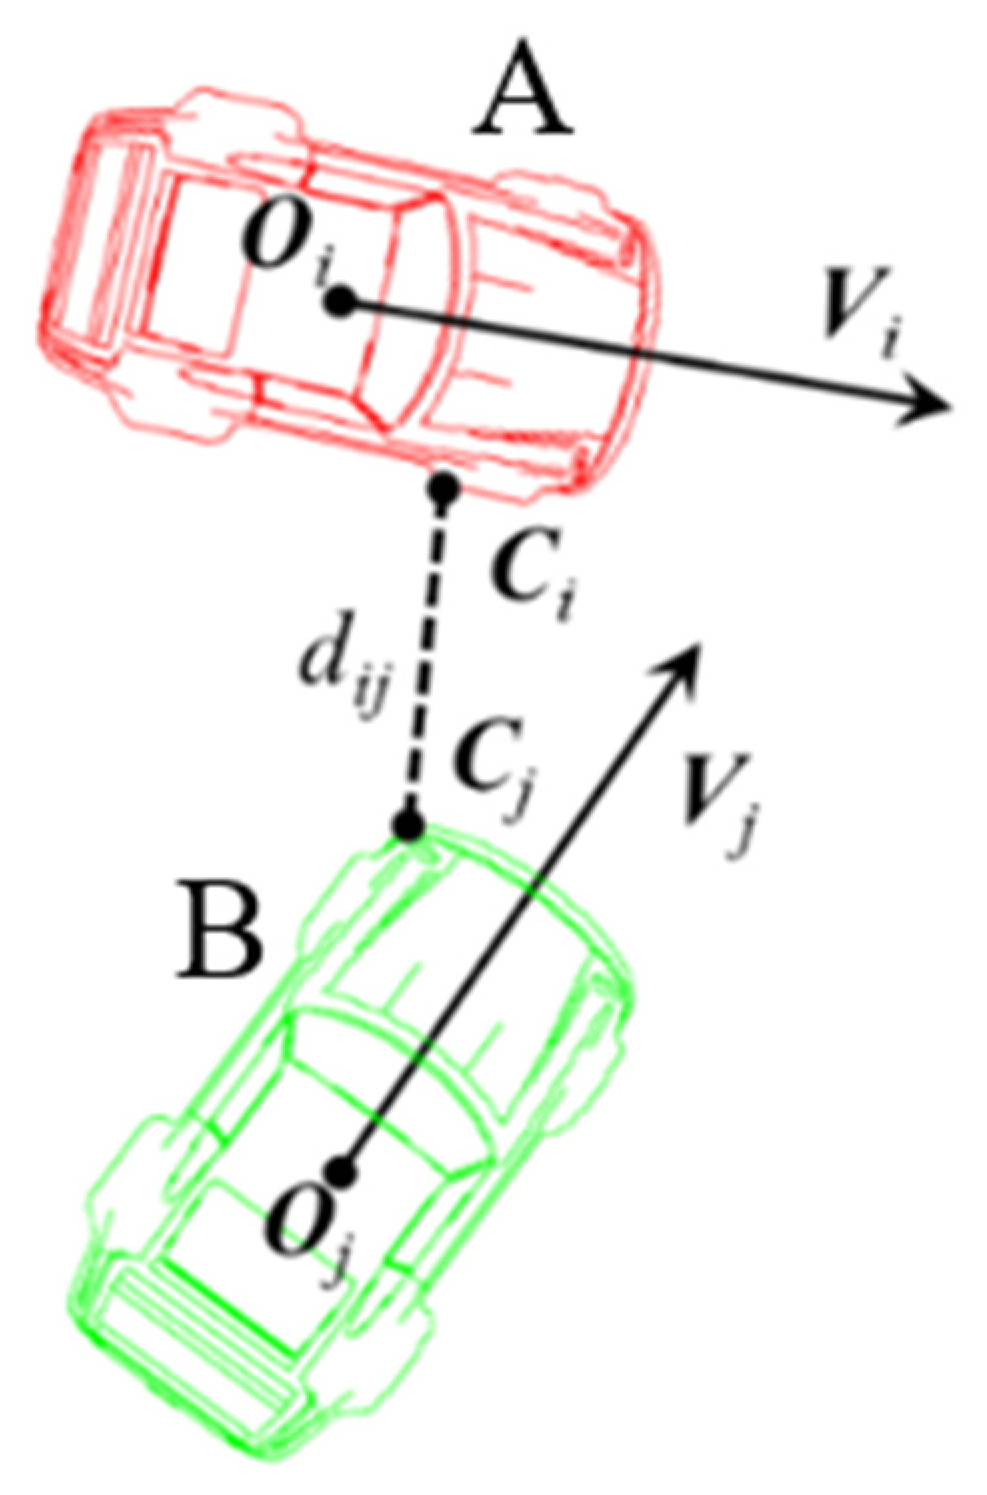
TTC has been extensively studied by many scholars and is now the most commonly used micro-indicator for evaluating traffic safety [20]. According to the definition of TTC, a larger TTC provides drivers with more time to avoid a collision, thereby reducing the probability of a traffic collision. Conversely, a smaller TTC is more likely to result in a collision risk [21]. Building on the classic TTC model, a two-dimensional TTC theoretical model, more suitable for complex environments, is proposed to analyze vehicle conflicts at intersections [22,23,24]. The formula for calculating the two-dimensional TTC is:
As shown in Figure 2, and are the position vectors of the centroids of vehicle A and vehicle B, and are the vector velocities of the vehicles, and and are the lengths of vehicle A and B.
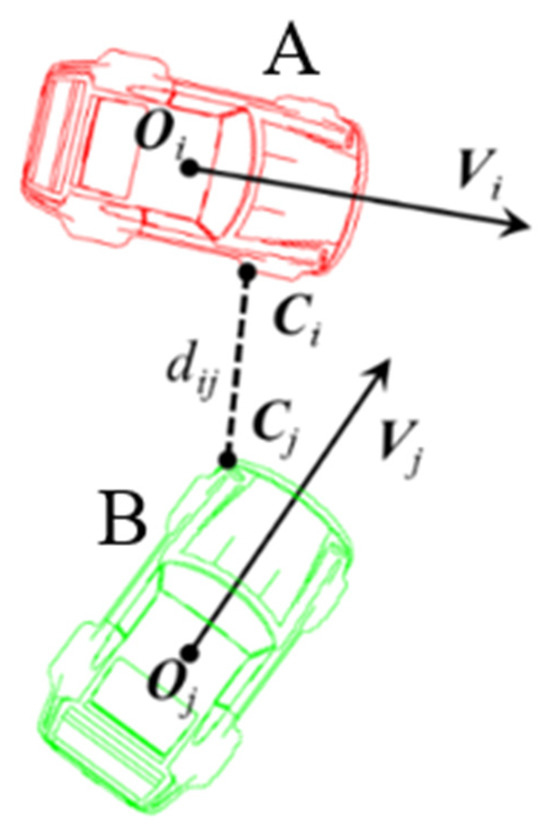
Figure 2.
Vector position and velocity of the vehicles.
2.2. Dynamic Time Warping
To further explore the alignment of physiological indicators with intersection risk, the DTW method was selected to assess the similarity between TTC values and EMG and EDA representations of risk. DTW is an effective and straightforward method for calculating similarity. DTW calculates similarity between two time series by aligning them in time, adjusting for differences in length. Initially, DTW measures similarity between the two datasets, recording the sum of distance measures as the cumulative distance, which indicates their overall similarity [25]. Prior to comparing TTC values with physiological indicators using DTW, the data series must be normalized to standardize mean and variance. Z-normalization was applied to the three raw physiological indicators in the thesis for standardization, as depicted in Formula (2).
In this formula, is the evaluation indicator, is the mean of , and is the standard deviation of .
Assuming that the TTC and EMG values are normalized to and , the similarity between sequence and sequence is expressed by DTW(T,C), as shown in Formulas (3)–(5):
In the above formula, , , and ; is the Euclidean distance calculation formula.
2.3. Complexity and Sample Entropy
Physiological indicators of drivers are strongly influenced by experimental status and personality differences, and there is repetitive information between different indicators. Therefore, further complexity and sample entropy analyses were combined to investigate the differences in randomness indicators such as ECG and EMG.
The Lempel–Ziv complexity is an algorithm for measuring the addition of new patterns as the length of a sequence increases [26]. It reflects the rate at which new patterns emerge as the length of a given time series increases. Complexity is applied to both deterministic and stochastic signals. This is ideal for ECG and EMG indicators that have both deterministic and stochastic characteristics. By calculating the complexity of the ECG and EMG of a driver’s driving process, it can be used as a characteristic parameter to characterize the physiological load of the driver [27].
The specific algorithm for the Lempel–Ziv complexity is as follows: let be the complexity of sequence ; as n→∞, converges to the fixed value , is the number of coarse-grained segments ( for conventional binarization). The normalized equation is Formula (6):
Sample entropy is a newer time series complexity measure with improved resistance to noise and interference, offering greater consistency compared to approximate entropy. It requires minimal data and computing time for valid analysis. It is applicable in studies involving ECG, EMG, and other metrics [27]. The paper calculates the sample entropy of all subjects’ EMG at specific moments during the driver’s process to characterize their physiological load. Sample entropy is represented as SampEn (m, r, N), where stands for dimensionality, for similarity tolerance, and for length. Previous studies [18] suggested that sample entropy yields more reliable results when = 2 and = (0.1 to 0.2) SD, representing the standard deviation of the original data. The sample entropy algorithm is as follows:
- (1)
- Let the original time series at point be and form a set of m-dimensional vectors in the following order:
- (2)
- Define the distance “” between and as the one with the greatest difference between the corresponding elements:
- (3)
- Given a threshold for each value of , count the number of (the number of template matches) and then count the ratio of this number to the total number of distances, denoted by . That is:
- (4)
- Find the average of for all . Then:
- (5)
- Change the vector dimension to and repeat the above steps to obtain . Then, the sample entropy of this sequence is:
3. Experimental Design
3.1. Experimental Equipment
The simulated experimental equipment is shown in Figure 3. The simulator employs a split three-screen display device integrated with the vehicle model 2.0 for the vehicle dynamics, and the virtual road environments were created using VSDesign, which is proprietary software developed by the laboratory.
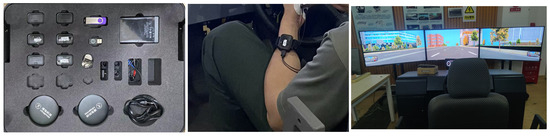
Figure 3.
Simulation equipment.
3.2. Scenario Design
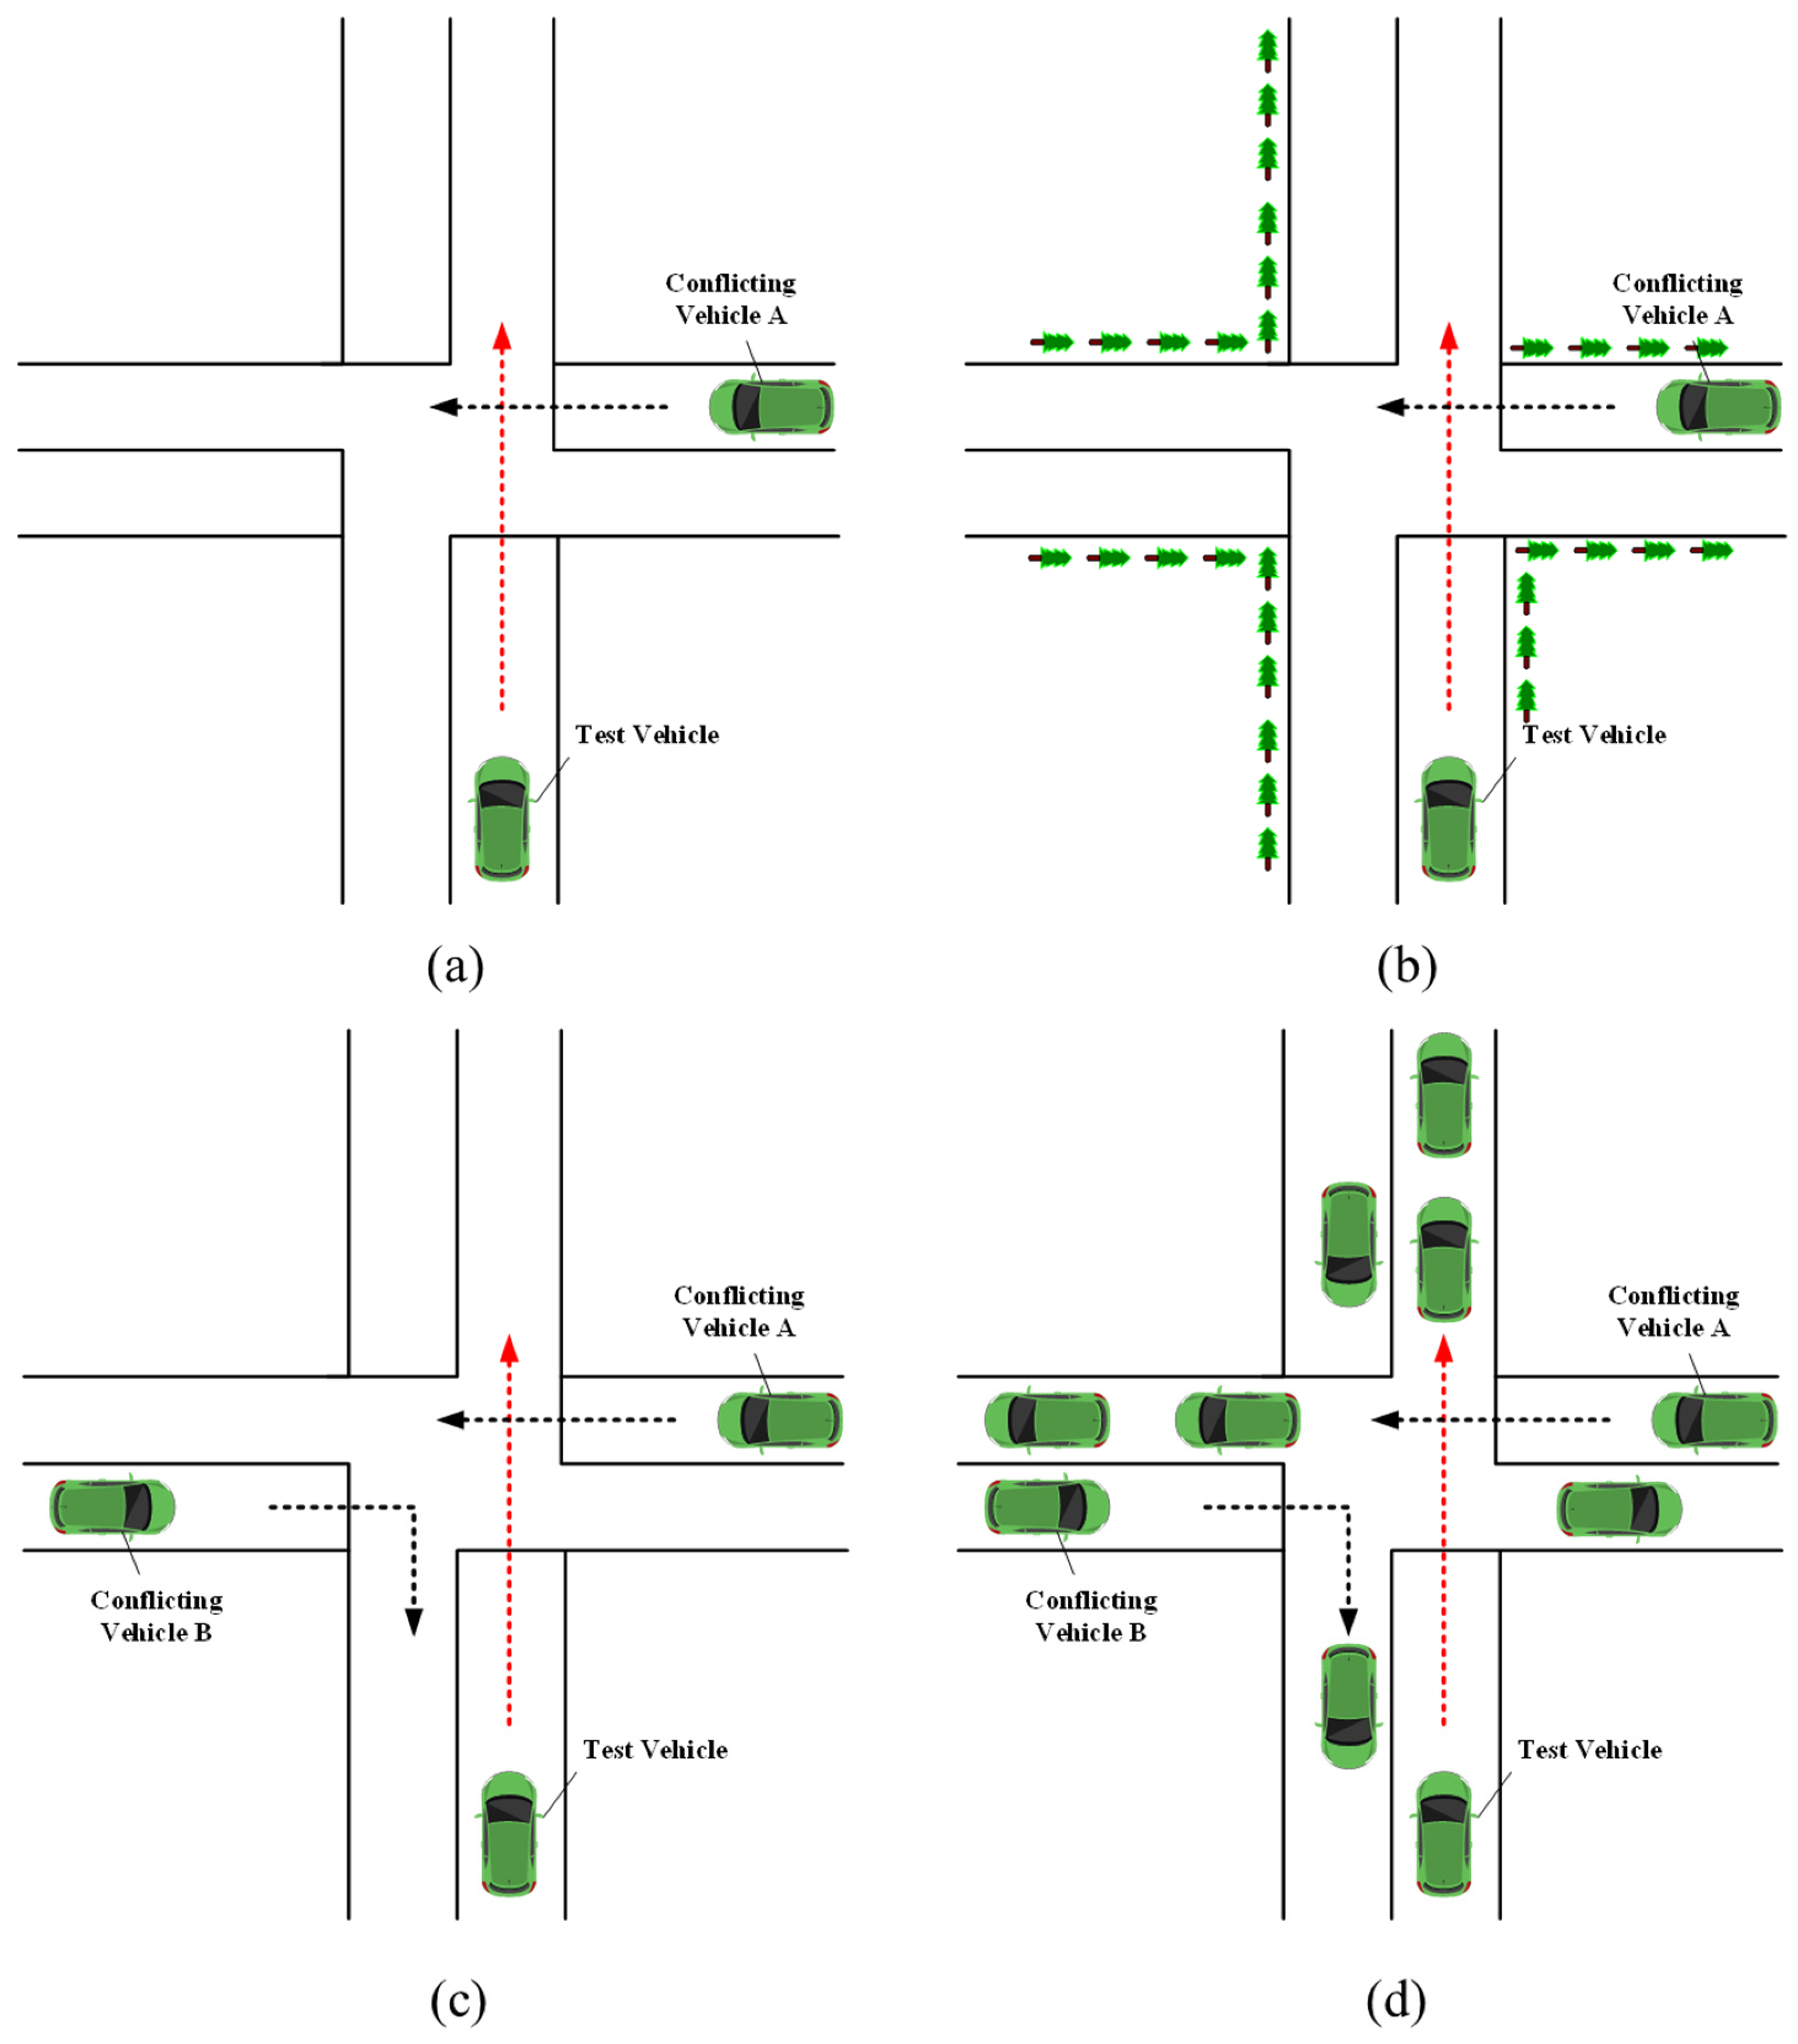
To ensure inclusion of pertinent experimental factors, typical hazardous road environments were prioritized in the experimental scenarios. According to the requirements of the Code for Design of Urban Road Engineering (CJJ37-2012) [28] and the Specification for Design of Intersections on Urban Roads (CJJ152-2010) [29], we designed four intersections without signal control: an intersection with good sight (Figure 4a), an intersection with poor sight (Figure 4b), a low-traffic intersection (Figure 4c), and a heavy-traffic intersection (Figure 4d). Among them, in the intersection with poor sight, there are several obstacles on the right side of the roadway, which obscure the driver’s vision and hinder timely detection of conflicting vehicle A on the right side, and the risk becomes even greater. In the driving simulation scenario, the road specifications are two-way two-lane, with no isolation facilities between the lanes, and the width of each lane is 3.5 m.
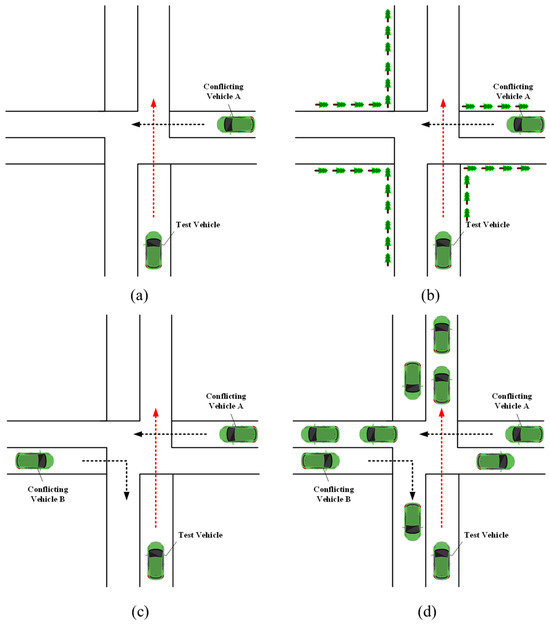
Figure 4.
Conflict scenarios: (a) intersection with good sight, (b) intersection with poor sight, (c) low−traffic intersection, (d) heavy−traffic intersection.
The driving rules of this experiment were formulated with reference to experiments in the relevant literature [30]. Driving rules for the test vehicle involve traveling from south to north, accelerating to 40 km/h, then maintaining this speed and crossing the intersection. Conflicting vehicle A travels east to west at 40 km/h, and conflicting vehicle B travels west to east at 30 km/h, then enters the intersection and turns right. The triggering of traffic conflict is realized by setting the trigger zone. After the test vehicle drives into the trigger zone, the conflicting vehicle starts to move according to the designed route, speed, and other conditions.
3.3. Driver Recruitment
To determine the sample size, we selected power analysis (Formula (12)) to calculate the sample size required for the experiment [31].
where is the calculated sample size, is the upper quantile of the standard normal distribution, is the upper quantile of the standard normal distribution, is the standard deviation of the normal distribution, and is the difference between the mean of the response index and the mean of the reference index.
In the absence of a priori data, you can select , where is the significance level, generally ranging from 0.25~0.5. In addition, a significance level of 10% is usually chosen to reflect a 90% confidence level about the unknown parameter, and a value of 1.65 is chosen for . In order to balance effectiveness and cost-effectiveness, a significance level of 0.5 and an effectiveness of 80% are used; that is, takes a value of 0.5, and is 0.84 when is selected. The results show that the sample size required for the experiment is 25.
Twenty-seven Chinese drivers were recruited to participate in this experiment based on Davenne’s recruitment plan (18 males and 9 females), which means that the sample size selected in this experiment meets the experimental requirements. The participants’ information is shown in Table 1. All drivers had a corrected vision of 1.0 and were able to perform driving tasks skillfully.

Table 1.
Participating drivers.
The experiment consisted of two stages: the preparation stage and the formal experimental stage. During the preparation stage, the staff introduced the experimental background to the drivers and asked them to fill out the informed consent form and the driving style questionnaire. Secondly, the drivers were guided to drive for 10 min in other simulated scenarios in order to familiarize themselves with the operating characteristics of the driving simulator and to determine whether they had dizziness, nausea, etc., that would prevent them from completing the experiment. In the formal experimental phase, electrodes were placed on the driver’s chest, arm, index finger, etc., to collect physiological data from the driver in the four intersection scenarios, and the physiological data began to be recorded synchronously after the vehicle was started. In order to avoid the influence of learning effect on the accuracy of the experimental results, the driving order of each scene was randomly adjusted.
4. Results and Discussion
4.1. Analysis of Single Physiological Index of Drivers at the Low-Traffic Intersection
Driving simulation experiments were conducted using Figure 4 as the experimental scenario. The driver wore the Ergo LAB Physio instrument throughout the experiment. After the experiment, the physiological data corresponding to the conflict road section were obtained by matching them with the vehicle data.
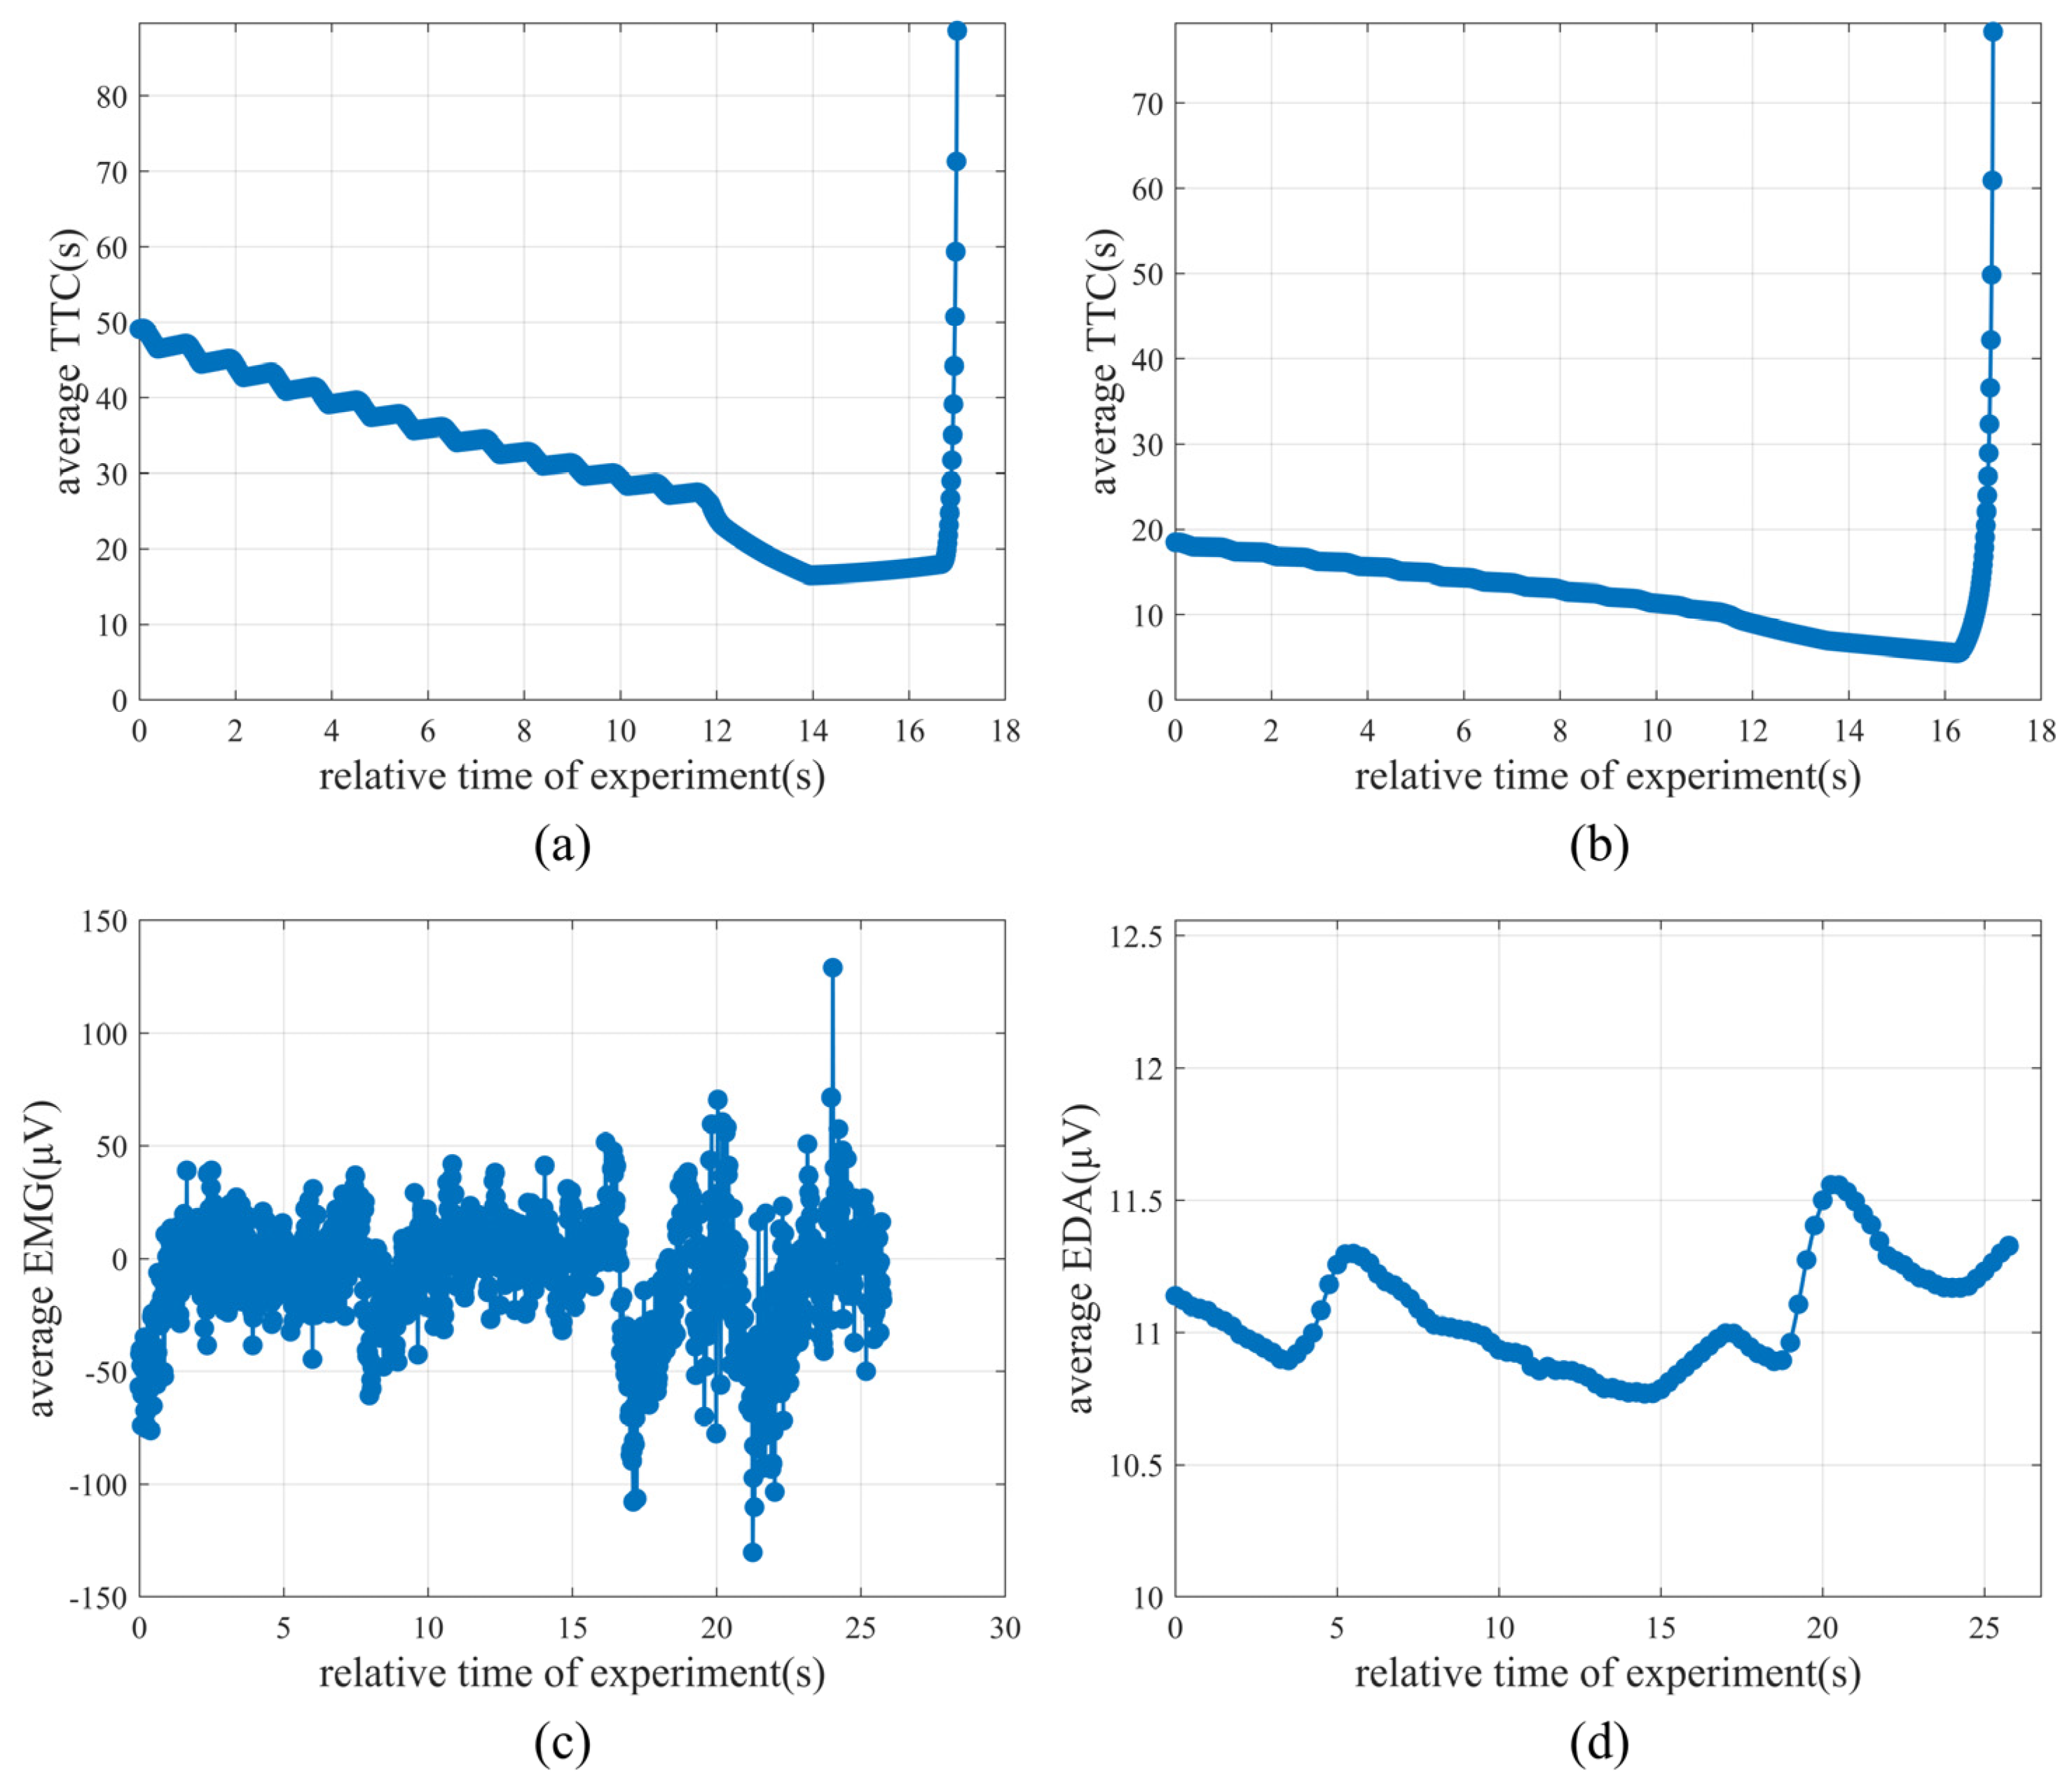
The validity calculations through SPSS (version number 29.0) revealed that the validity was smaller for female drivers and larger for male drivers. Therefore, we selected the data of male drivers for analysis. The TTC values of the test vehicle and vehicle A, as well as the TTC values of the test vehicle and vehicle B, were calculated. In order to facilitate the observation of the TTC curve and the changing trends of the physiological indicators EMG and EDA, the TTC, EMG, and EDA time series were processed by a sliding average. The specific results are shown in Figure 5.

Figure 5.
Physiological data of low−traffic intersection: (a) average TTC of test vehicle and vehicle A, (b) average TTC of test vehicle and vehicle B, (c) average driver EMG in the simulator, (d) driver EDA in the simulator.
From Figure 5, it can be observed that the TTC trend takes the shape of an inverse proportional function. This is because as the test vehicle approaches the intersection, it also gets closer to the conflict vehicle, increasing the risk of collision and causing the TTC value to gradually decrease. At around 16 s, the test vehicle enters the intersection and sees the conflict vehicle. As the two vehicles continue to approach each other, the test vehicle decelerates to reduce the risk. Once the risk is eliminated, the TTC value suddenly changes from approaching zero to becoming infinitely large.
As shown in Figure 5c,d, before the test vehicle enters the intersection and finds the conflicting vehicle, the EMG signal fluctuates smoothly within the range of (−100, 100), the driver’s muscles are in a relaxed state, and the EDA signal changes slightly. At the 16th second, the driver finds the conflicting vehicle and perceives the risk. However, due to the delay in the driver’s reaction time, the EMG and EDA signals fluctuate greatly after 16 s. This indicates that when the driver faces the risk of conflict, his muscles contract, his emotions become tense, and his attention is highly focused.
Based on the above analysis, it can be seen that as the TTC value decreases, the driving risk increases, leading to great fluctuations in the driver’s EDA and EMG signals. TTC is consistent with the EDA signal and EMG signal in terms of the change trend. The driving simulator allows the driver to clearly perceive the change in risk. The driver’s physiological feelings in the driving simulator match the feelings of real driving.
In order to verify our hypothesis more objectively, SPSS software (Version number 29.0) was used to analyze the correlation between EMG, EDA, and TTC values. The results of the analysis are shown below.
As seen in Table 2, there is a significant correlation between driver EMG and EDA indicators and TTC values. Conflict vehicle A (traveling from east to west) has different degrees of influence on drivers’ EMG and EDA. In the process of detecting the conflict vehicle to avoiding it, the driver needs to observe the driving environment and make a judgment. This process is accompanied by changes in emotions, which lead to different degrees of changes in physiological characteristics and changes in related indicators. Similarly, as seen in Table 3, the TTC correlation between EMG, EDA, and conflict vehicle B is significant.
Table 2.
TTC correlation analysis with conflict vehicle A.
Table 3.
TTC correlation analysis with conflict vehicle B.
4.2. Matching Analysis of Physiological Indicators and Objective Risks
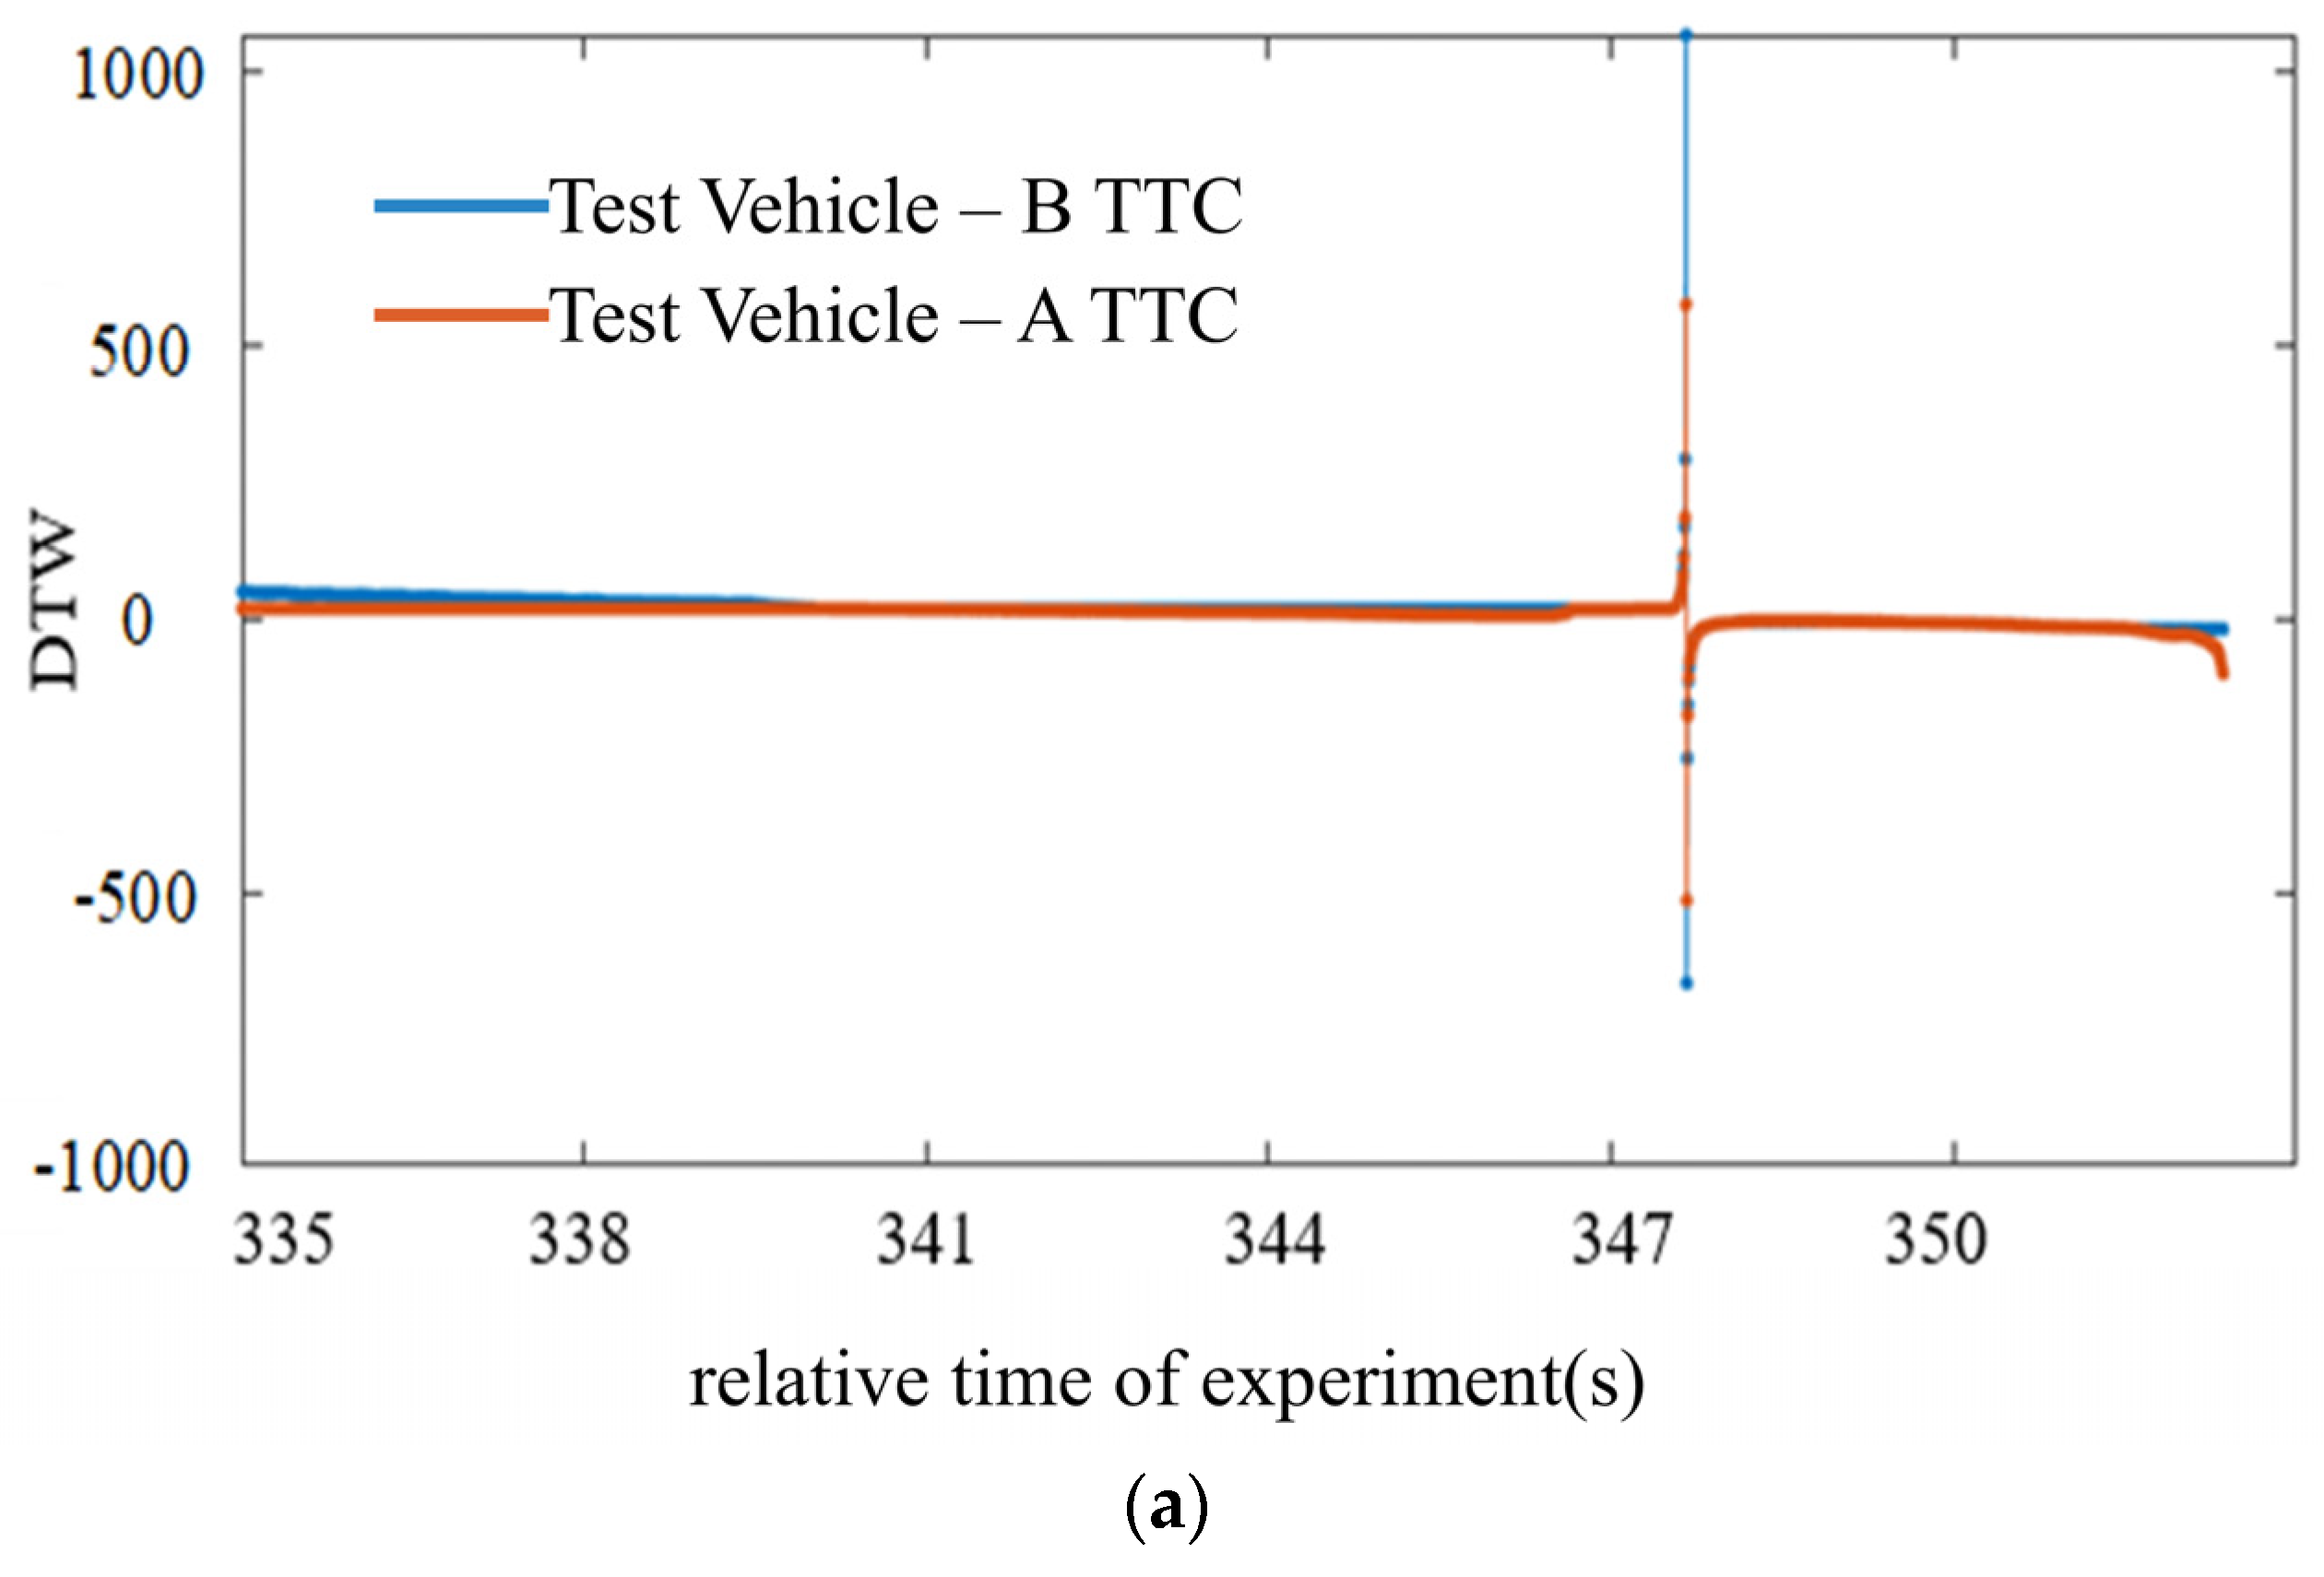
The TTC indicators of the test vehicle based on the two conflict vehicles A and B, and the TTC indicators based on conflict vehicle A, were analyzed for DTW in the same time domain as the driver’s EMG and ECG. The analysis results are shown in Figure 6.
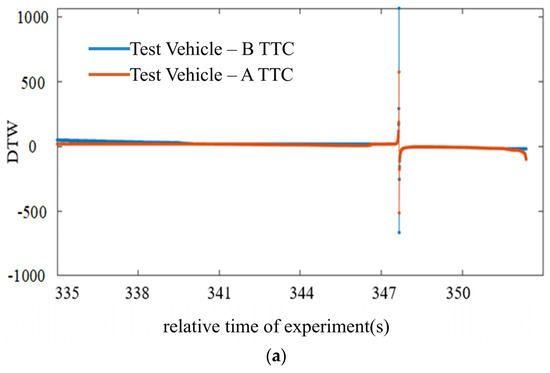
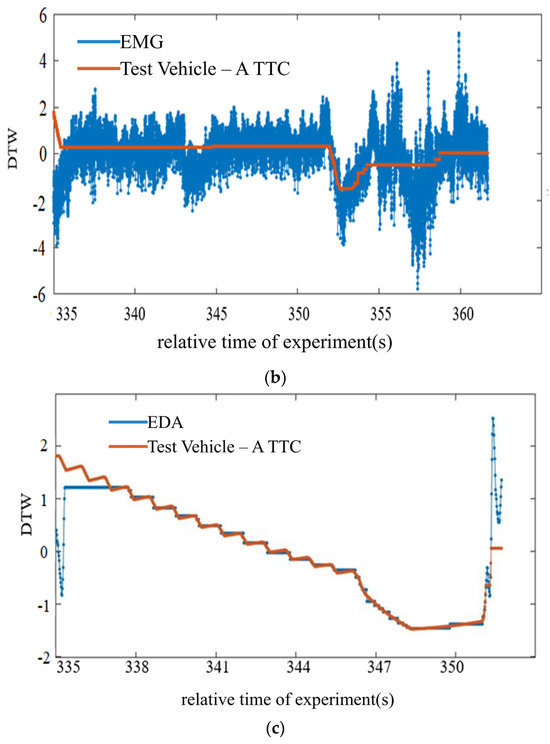
Figure 6.
TTC, EMG, and EDA contrast based on DTW: (a) TTC of vehicle A and TTC of vehicle B, (b) TTC of vehicle A and driver EMG, (c) TTC of vehicle A and driver EDA.
Figure 6 shows the processing result after Z normalization of TTC, EMG, and EDA. It shows the DTW data processing process. Through the overall stretching or compression in the time domain, the similarity calculation of data sequences with unequal lengths is realized. Through the DTW similarity analysis, it can be seen intuitively that in the risk environment set by the test simulator, the driver’s EMG and EDA data collected by the Ergo LAB Physio and the objective risk value calculated based on the TTC theoretical model have similar trends. There is a high degree of matching between them.
For different dimensional data, the size of DTW trajectory similarity is different. For the TTC of vehicle A and the TTC of vehicle B in the same dimension, DTW = 0.1, which is highly similar, indicating that the objective conflict provided by the conflicting vehicle A and the conflicting vehicle B is close. This can also be demonstrated through scene design. When the driver passes through the conflicting intersection, the TTC of vehicle A, and the driver’s EDA of different dimensions, DTW = 106. Excluding the data interference at the beginning of the experiment and at the end of the experiment, only the similarity of the conflicting process is discussed. The value of DTW tends to be smaller, and the two sequence values are more similar. Judging from the matching graphics, the test simulator provides drivers with corresponding physiological feelings based on the risk environment. For a TTC of vehicle A and driver EMG of different dimensions, when the muscles are moderately loaded, although a single motor unit potential can still be seen in some areas on the map, the potentials in other areas are very dense and cannot be distinguished, and we define it as a mixed phase. When the muscles are heavily loaded, high-amplitude potentials with different frequencies, different amplitudes, and staggered, indistinguishable overlapping appear on the graph, which we define as the interference phase. Through a comprehensive comparison with TTC, this result is also in line with the changes in the risk value. In addition, TTC and physiological indicators show different trends due to essential differences in the psycho-behavioral mechanisms they reflect.
4.3. Analysis of Comprehensive Indicators of Driver’s Physiology
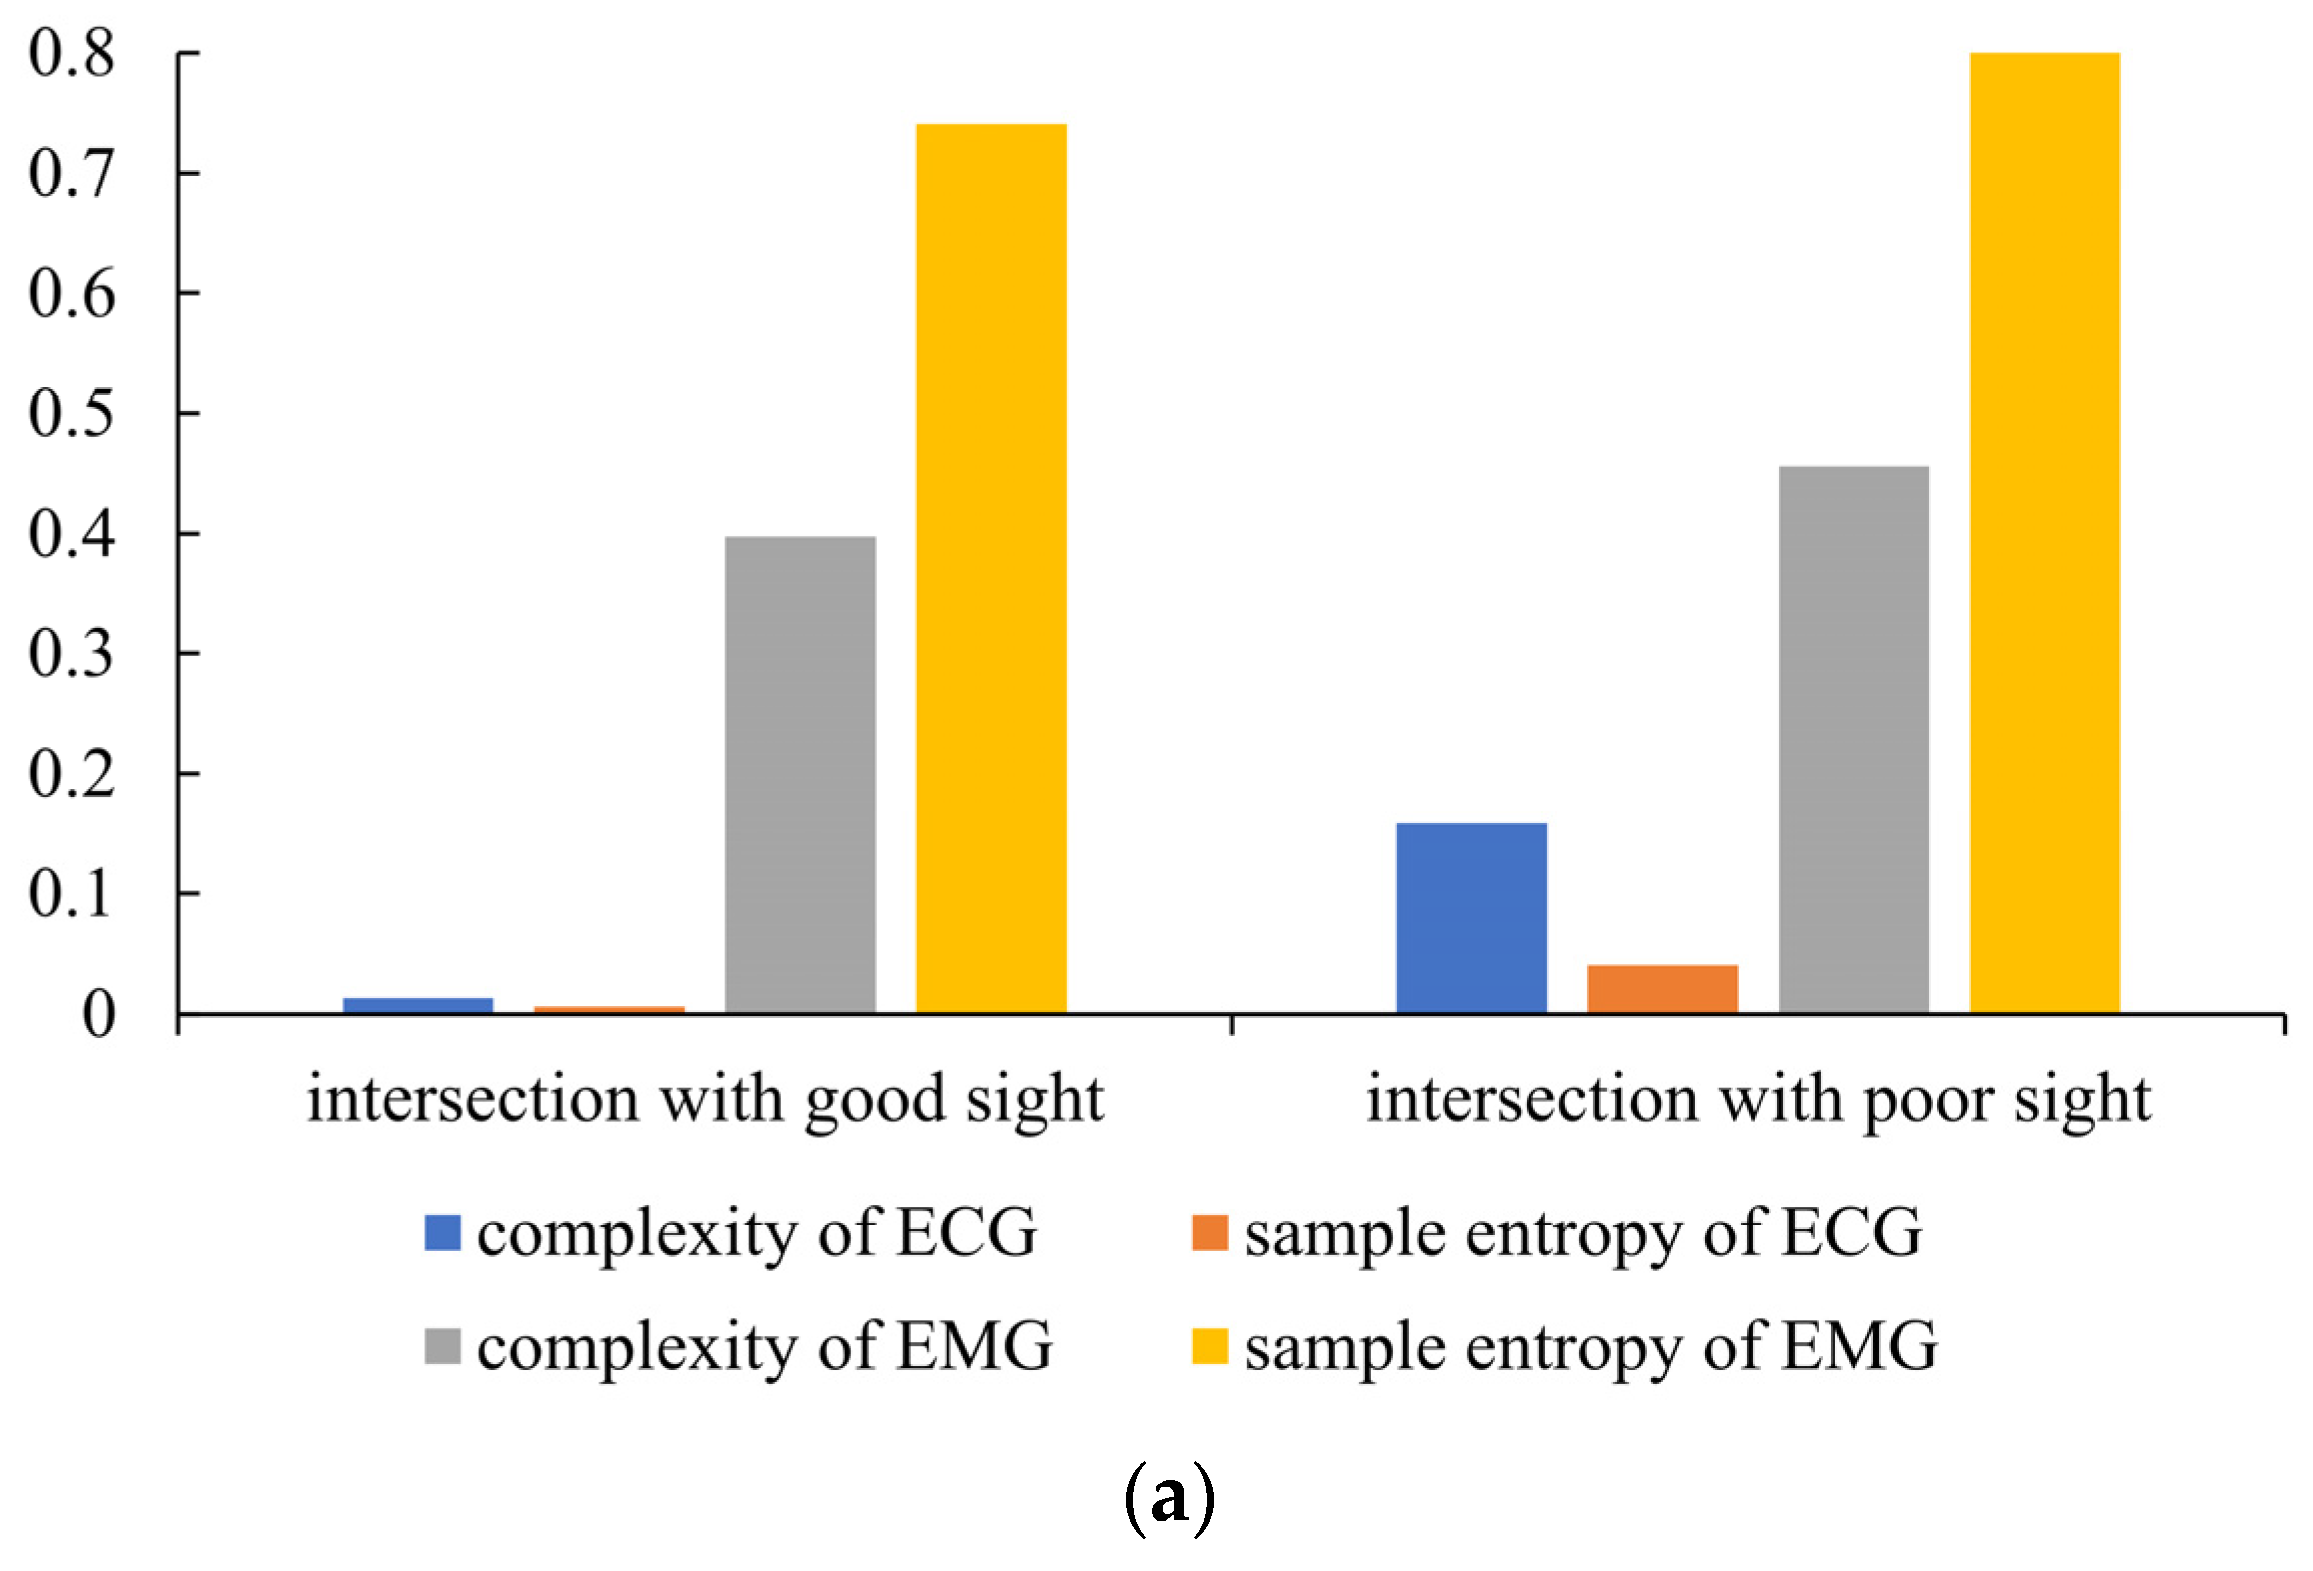
Based on the experimental test results of ECG and EMG, using the model of complexity and sample entropy, the complexity and sample entropy results of the intersection with good sight and the intersection with poor sight, and the low-traffic intersection and the heavy-traffic intersection were obtained, as shown in Table 4, Figure 7.
Table 4.
The complexity and sample entropy of ECG and EMG.
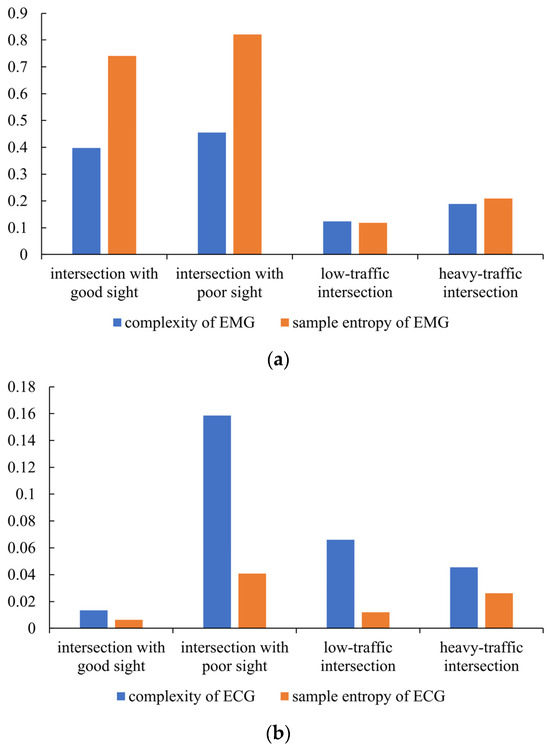
Figure 7.
Complexity and sample entropy: (a) EMG, (b) ECG.
In Figure 7, the trends of the complexity and sample entropy curves are similar. This indicates that the physiological response of the driver in the intersection conflict environment is highly coordinated. This synchronous change shows that the driving simulator brings the driver an overall physiological response. It is not just a single response of a certain part. This also demonstrates that the driver’s physiological response in the driving simulator is similar to that in the real environment.
According to univariate analysis, in Figure 8a, compared with the intersection with good sight, the sample entropy and complexity of the drivers’ ECG and EMG at the intersection with poor sight show an upward trend. The driving task is more difficult at the intersection with poor sight. Drivers need to put more effort into making driving decisions—for example, by turning their head or taking additional looks. The increase in sample entropy and complexity reflects the driver’s increased stress response and alertness. During the experiment, we also observed that the drivers looked at their surroundings more frequently when completing tasks at the intersection with poor sight. This phenomenon is consistent with the results of the data analysis.
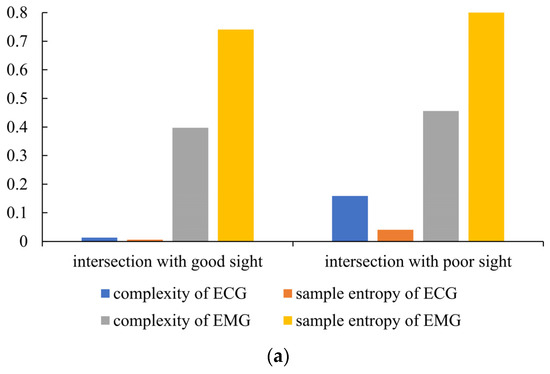
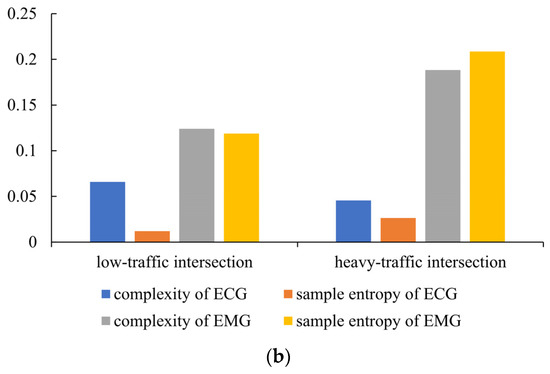
Figure 8.
Changes in ECG and EMG in different conflict scenarios: (a) intersection with good sight and intersection with poor sight, (b) low-traffic intersection and heavy-traffic intersection.
In Figure 8b, except for ECG complexity, the values of other parameters at the heavy-traffic intersection are higher than those at the low-traffic intersection. This indicates that the driving environment at a heavy-traffic intersection increases the physiological load on drivers. Drivers must make more frequent and complex responses in this environment. The reason why the ECG complexity is lower at the heavy-traffic intersection is that although heavy-traffic environments are complex and potentially risky, drivers may cope with heavy traffic through fixed driving patterns or strategies. This reaction causes the fluctuations in the ECG to become more regular and simpler, thereby reducing its complexity.
5. Limitations
Although this study ensures the reliability and validity of the data through scientific sampling methods, there are still limitations at the sample level: First, the sample size (N = 27), although satisfying the basic requirements for statistical analysis, is still insufficient in comparison to the overall size of the drivers, which may impose some limitations on the results. Second, the drivers are mainly young and middle-aged and fail to adequately cover the older driver group, which restricts the conclusions of the study in terms of age dimensions and the generalizability of the study’s findings based on age. Future studies may expand the sample size and diversity through stratified sampling, focusing on strengthening the sample coverage of older drivers to further enhance the comprehensiveness of the study.
6. Conclusions
This study proposes a method to evaluate the effectiveness of driving simulators in risky environments using driver physiological data. We chose risky intersection environments as verification scenarios. The risk calculated by the TTC theoretical model was used as the calibration parameter. The similarity and the sample entropy and complexity based on ECG and EMG were used as evaluation indicators. The feasibility of this method was demonstrated through testing with the driving simulator at Kunming University of Science and Technology.
Through data analysis, it was found that in the test simulator, changes in risk lead to significant fluctuations in the driver’s physiological indicators. This suggests that the simulator enables drivers to clearly perceive changes in intersection risk. After further analysis of the sample entropy and complexity of EMG and ECG, it was concluded that the driver’s physiological load is different in different intersection risk environments, and increases with the increase in the risk level of the risk environment. Additionally, it was observed that the simulator induces an overall physiological response in the driver, rather than affecting a single physiological indicator. This indicates that its degree of simulation of risky intersection scenarios is very high and can achieve the same effect as real scenarios. Rachael A. Wynne’s research indicates that relative effectiveness occurs when the simulator results exhibit the same patterns or effects as actual driving [32]. Based on her findings, we can conclude that test driving simulators are relatively effective in simulating risky intersections.
In this study, we used risky intersections as evaluation scenarios and verified the feasibility of evaluating the effectiveness of driving simulators in risky scenarios based on two-dimensional extended TTC and driver physiological data. TTC theory is often used in the study of traffic conflicts. Therefore, the method described in this paper is more suitable for risky environments where traffic conflicts are prone to occur (such as weaving areas). For other non-conflict risk environments (such as extreme weather), although the methods in this article cannot be used directly, the ideas in this article can be used for reference. The effectiveness of the driving simulator is evaluated by studying the match between risk changes and changes in the driver’s physiological indicators.
The method proposed in this study makes up for the shortcomings of driving simulator effectiveness evaluation in risky environments, providing a new idea for evaluating the effectiveness of driving simulators in risky environments. Relevant research results can promote the development of the driving simulator industry. At the same time, it can also promote the application of driving simulation technology in intelligent transportation fields such as autonomous driving and vehicle–road collaboration.
Author Contributions
The authors confirm contribution to the paper as follows: study conception and design: L.C. and J.X.; data collection: L.C. and J.F.; analysis and interpretation of results: L.C. and J.X.; manuscript draft preparation: J.L. and J.F.; manuscript revision: J.X. and J.F. All authors have read and agreed to the published version of the manuscript.
Funding
This work was supported by the Science and Technology Innovation and Demonstration Projects of the Department of Transportation of Yunnan Province, China (No. 2023-121; 2022-23-3).
Data Availability Statement
The authors do not have permission to share data.
Acknowledgments
The authors would like to offer thanks to Liang Chen, Jingyan Li, Bo Sun, Jiming Xie, and Sen Zhang, who gave their time to collect the data and prepare this manuscript. All agreed on the acknowledgement.
Conflicts of Interest
The authors declare no conflict of interest.
References
- Caffò, A.O.; Tinella, L.; Lopez, A.; Spano, G.; Massaro, Y.; Lisi, A.; Stasolla, F.; Catanesi, R.; Nardulli, F.; Grattagliano, I. The drives for driving simulation: A scientometric analysis and a selective review of reviews on simulated driving research. Front. Psychol. 2020, 11, 917. [Google Scholar] [CrossRef] [PubMed]
- Xiong, J.; Wu, A.; Qin, Y.; Wan, H.; Ji, X.; Guo, F. Experimental study on the effectiveness of driving simulator training. Chin. J. Ergon. 2016, 22, 63–67. [Google Scholar]
- Zhang, S.; Zhao, C.; Zhang, Z.; Lv, Y. Driving Simulator Validation Studies: A Systematic Review. Simul. Model. Pract. Theory 2024, 138, 103020. [Google Scholar] [CrossRef]
- Chen, L.; Xiong, J.; Guo, F.X.; Wan, H.S. Image Calibration Method of Driving Simulator Based on Vision and Cognition. China J. Highw. Transp. 2017, 30, 129–135. [Google Scholar]
- Wen, L.; Fu, D.; Mao, S.; Cai, P.; Dou, M.; Li, Y.; Qiao, Y. LimSim: A long-term interactive multi-scenario traffic simulator. In Proceedings of the 2023 IEEE 26th International Conference on Intelligent Transportation Systems (ITSC), Bilbao, Spain, 24–28 September 2023; pp. 1255–1262. [Google Scholar]
- Chen, L.; Yin, X.; Hu, L.; Yang, J. Research on evaluation model of driving simulator experiment based on fuzzy neural network. J. Kunming Univ. Sci. Technol. Nat. Sci. 2021, 46, 126–134. [Google Scholar]
- Yang, X.; Wen, L.; Ma, Y.; Mei, J.; Li, X.; Wei, T.; Lei, W.; Fu, D.; Cai, P.; Dou, M. DriveArena: A Closed-loop Generative Simulation Platform for Autonomous Driving. arXiv 2024, arXiv:2408.00415. [Google Scholar]
- Alonso, F.; Faus, M.; Riera, J.V.; Fernandez-Marin, M.; Useche, S.A. Effectiveness of driving simulators for drivers’ training: A systematic review. Appl. Sci. 2023, 13, 5266. [Google Scholar] [CrossRef]
- Underwood, G.; Crundall, D.; Chapman, P. Driving simulator validation with hazard perception. Transp. Res. Part F Traffic Psychol. Behav. 2011, 14, 435–446. [Google Scholar] [CrossRef]
- Mayhew, D.R.; Simpson, H.M.; Wood, K.M.; Lonero, L.; Clinton, K.M.; Johnson, A.G. On-road and simulated driving: Concurrent and discriminant validation. J. Saf. Res. 2011, 42, 267–275. [Google Scholar] [CrossRef]
- Risto, M.; Martens, M.H. Driver headway choice: A comparison between driving simulator and real-road driving. Transp. Res. Part F Traffic Psychol. Behav. 2014, 25, 1–9. [Google Scholar] [CrossRef]
- Karl, I.; Berg, G.; Ruger, F.; Farber, B. Driving behavior and simulator sickness while driving the vehicle in the loop: Validation of longitudinal driving behavior. IEEE Intell. Transp. Syst. Mag. 2013, 5, 42–57. [Google Scholar] [CrossRef]
- Blaauw, G.J. Driving experience and task demands in simulator and instrumented car: A validation study. Hum. Factors 1982, 24, 473–486. [Google Scholar] [CrossRef]
- Lioi, A.; Portera, A.; Tefa, L.; Hazoor, A.; Bassani, M. Validation of a driving simulator for road tunnel behavioural studies. Transp. Res. Procedia 2023, 69, 352–359. [Google Scholar] [CrossRef]
- Llopis-Castelló, D.; Camacho-Torregrosa, F.J.; Marín-Morales, J.; Pérez-Zuriaga, A.M.; García, A.; Dols, J.F. Validation of a low-cost driving simulator based on continuous speed profiles. Transp. Res. Rec. 2016, 2602, 104–114. [Google Scholar] [CrossRef]
- Chen, L.; Xie, J.; Wu, S.; Guo, F.; Chen, Z.; Tan, W. Validation of vehicle driving simulator from perspective of velocity and trajectory based driving behavior under curve conditions. Energies 2021, 14, 8429. [Google Scholar] [CrossRef]
- Wang, L.; Zhang, C.; Yin, X.; Fu, R.; Wang, H. A Non-Contact Driving Fatigue Detection Technique Based on Driver’s Physiological Signals. Automot. Eng. 2018, 40, 334–341. [Google Scholar]
- Gemonet, E.; Bougard, C.; Masfrand, S.; Honnet, V.; Mestre, D.R. Car drivers coping with hazardous events in real versus simulated situations: Declarative, behavioral and physiological data used to assess drivers’ feeling of presence. PLoS ONE 2021, 16, e0247373. [Google Scholar] [CrossRef]
- Zontone, P.; Affanni, A.; Bernardini, R.; Piras, A.; Rinaldo, R. Stress detection through electrodermal activity (EDA) and electrocardiogram (ECG) analysis in car drivers. In Proceedings of the 2019 27th European Signal Processing Conference (EUSIPCO), A Coruna, Spain, 2–6 September 2019; pp. 1–5. [Google Scholar]
- Hayward, J.C. Near miss determination through use of a scale of danger. Highw. Res. Rec. 1972.
- Huppert, F.A.; So, T.T. Flourishing across Europe: Application of a new conceptual framework for defining well-being. Soc. Indic. Res. 2013, 110, 837–861. [Google Scholar] [CrossRef]
- Xie, J.; Qin, Y.; Peng, B.; Xia, Y.; Wang, J. Risk Discrimination and Conflict Prediction of Vehicle-Following Behavior in Multi-lane Weaving Sections. J. Transp. Syst. Eng. Inf. Technol. 2021, 21, 131–139. [Google Scholar]
- Ward, J.R.; Agamennoni, G.; Worrall, S.; Bender, A.; Nebot, E. Extending time to collision for probabilistic reasoning in general traffic scenarios. Transp. Res. Part C Emerg. Technol. 2015, 51, 66–82. [Google Scholar] [CrossRef]
- Xing, L.; He, J.; Abdel-Aty, M.; Cai, Q.; Li, Y.; Zheng, O. Examining traffic conflicts of up stream toll plaza area using vehicles’ trajectory data. Accid. Anal. Prev. 2019, 125, 174–187. [Google Scholar] [CrossRef] [PubMed]
- Li, H.; Liang, Y.; Wang, S. Review on dynamic time warping in time series data mining. Control Decis. 2018, 33, 1345–1353. [Google Scholar]
- Ziv, J.; Lempel, A. A universal algorithm for sequential data compression. IEEE Trans. Inf. Theory 1977, 23, 337–343. [Google Scholar] [CrossRef]
- Wang, F.; Wang, H.; Fu, R. Real-time ECG-based detection of fatigue driving using sample entropy. Entropy 2018, 20, 196. [Google Scholar] [CrossRef]
- China Architecture & Building Press. Code for Design of Urban Road Engineering. Industry Standards-Urban Construction; China Architecture & Building Press: Beijing, China, 2012. [Google Scholar]
- China Architecture & Building Press. Specification for Design of Intersections on Urban Roads; China Architecture & Building Press: Beijing, China, 2010. [Google Scholar]
- Qin, Y.; Wu, Y.; Guo, M. A Simulator Study on the Driving Impacts of Four Speed-Calming Measures at Unsignalized Intersections. Appl. Sci. 2024, 14, 3542. [Google Scholar] [CrossRef]
- Cochran, W.G. Sampling Techniques; John Wiley & Sons: New York, NY, USA, 2006. [Google Scholar]
- Wynne, R.A.; Beanland, V.; Salmon, P.M. Systematic review of driving simulator validation studies. Saf. Sci. 2019, 117, 138–151. [Google Scholar] [CrossRef]


Disclaimer/Publisher’s Note: The statements, opinions and data contained in all publications are solely those of the individual author(s) and contributor(s) and not of MDPI and/or the editor(s). MDPI and/or the editor(s) disclaim responsibility for any injury to people or property resulting from any ideas, methods, instructions or products referred to in the content. |
© 2025 by the authors. Licensee MDPI, Basel, Switzerland. This article is an open access article distributed under the terms and conditions of the Creative Commons Attribution (CC BY) license (https://creativecommons.org/licenses/by/4.0/).