1. Introduction
In an era characterized by rapid digital transformation, data-driven approaches to business process management (BPM) have emerged as crucial tools for enhancing efficiency, competitiveness, and decision making in micro, small, and medium enterprises (MSMEs). MSMEs play a fundamental role in economic development, contributing significantly to employment generation and national productivity. However, these enterprises often encounter substantial challenges in adopting and leveraging advanced technologies, particularly those related to data-driven BPM. Given the increasing reliance on data analytics for operational optimization and strategic planning, it is imperative to understand how MSMEs perceive and integrate these technologies into their business processes.
Despite the evident benefits of data-driven BPM—such as improved operational efficiency, enhanced decision-making capabilities, and increased adaptability—many MSMEs struggle with barriers related to technological infrastructure, financial constraints, and skill deficiencies. While large enterprises often possess the necessary resources and expertise to embrace data-driven BPM seamlessly, MSMEs require tailored strategies that align with their unique constraints and operational realities. Thus, understanding MSME owners’ expectations, perceived benefits, and barriers to adoption is essential for fostering a more inclusive and effective digital transition.
The main objective of this study is to explore the expectations of MSME owners regarding the adoption of data-driven approaches to BPM and how these expectations influence adoption behavior. By focusing on the interplay between performance expectation, effort expectation, and organizational readiness, the research seeks to address a critical gap in understanding the factors that facilitate or hinder data-driven approaches to BPM implementation in resource-constrained environments. This focus on owner expectations provides novel insights into the psychological and strategic drivers of technology adoption, emphasizing the need for alignment between perceived benefits and actual outcomes. Furthermore, the study narrows its scope to MSMEs, a sector often underrepresented in digital transformation literature, while highlighting the unique challenges and opportunities these enterprises face in leveraging data-driven tools.
To achieve these objectives, the study employs a quantitative, non-experimental, cross-sectional research design. A structured survey was administered to 1925 entrepreneurs from various economic sectors within the Metropolitan District of Quito. The collected data were analyzed using statistical techniques such as correlation analysis, Kruskal–Wallis tests, and descriptive statistics to extract meaningful insights into MSME owners’ attitudes toward data-driven BPM adoption.
By addressing the interplay between expectations, perceived benefits, and adoption challenges, this study contributes to the existing body of knowledge on digital transformation in MSMEs. Furthermore, its findings offer practical implications for policymakers, business consultants, and technology providers seeking to enhance the adoption of data-driven BPM among resource-constrained enterprises.
With this structured approach, the study provides a comprehensive analysis of MSME expectations and their potential impact on BPM adoption, setting the stage for future research and policy interventions in this domain.
2. Literature Review
Digital transformation has driven the use of data-driven approaches to business process management, especially in micro, small, and medium-sized enterprises (MSMEs). These enterprises constitute a substantial segment of the business landscape. They function as vital engines of growth, thereby contributing significantly to employment generation and GDP. This underscores their importance not only at the national economic level but also in driving global economic progress [
1,
2]. However, these enterprises often face significant challenges, particularly in the context of adopting advanced technologies and data-driven approaches, which are increasingly essential for operational efficiency and competitiveness in the modern market. These organizations face unique challenges related to limited resources, insufficient technological infrastructure, lack of specialized knowledge, and need to maximize their operational efficiency. According to Cadden et al. [
2], MSMEs that adopt a data-driven approach to their business processes experience significant improvements in competitiveness and market responsiveness as these approaches facilitate the transformation of data into valuable insights, enabling MSMEs to make informed decisions, identify areas for improvement, optimize key processes, and align strategies [
2,
3,
4].
The expectations of MSME owners regarding the adoption of data-driven BPM approaches are becoming increasingly pronounced and this determines the future behavior of these organizations. While the adoption of data-driven business practices presents substantial opportunities for MSMEs, it also brings forth notable challenges and controversies regarding accessibility, skill development, and financial viability.
Understanding the expectations for MSMEs to adopt data-driven approaches to business process management, as well as the perceived barriers and benefits, will help MSMEs to improve their growth and competitiveness in the changing business landscape.
Below is a critical review of the academic literature on this topic, highlighting the factors that influence the adoption of these methods, the perceived benefits, and the barriers that persist.
Table 1 shows the perspective of various authors on the essence of what the data-driven approach to business process management is.
For the authors of this research, the data-driven approach to business process management is an approach that integrates and systematizes the collection and analysis of data to transform information into knowledge, which underpins decision making and the objective management of business processes.
A data-driven approach to business process management is characterized by the integration of advanced tools and techniques that transform large volumes of data into actionable insights to improve decision making and optimize processes. According to Czvetkó et al. [
11], this approach uses tools such as process mining to analyze event logs and discover real process flows, as well as simulation and simulation models, including digital twins, to test and optimize process designs. In addition, KPIs and performance metrics derived from data analysis are used to guide redesign efforts, while ontologies and semantic models standardize the representation of knowledge and enable interoperability. In the context of automation, robotic process automation (RPA) and other AI technologies are deployed to optimize processes [
11]. Meanwhile, Shubho et al. [
10] highlight the use of predictive analytics, powered by machine learning algorithms such as decision trees, random forests, and neural networks, along with techniques such as clustering, dimensionality reduction, and text/visualization analysis, to uncover hidden patterns and simplify complex data sets. Finally, Fischer et al. [
12] describe the use of quantitative indicators based on process execution data to prioritize process variants based on their value and importance, while Liu et al. [
15] emphasize an approach focused on data flows and data dependencies, using methods for automatic search and composition of workflow models based on data similarities. This comprehensive set of tools reflects how organizations can transform data into strategic insights that drive continuous improvement and competitiveness.
The adoption of data-driven approaches for business process management (BPM) has experienced significant growth in recent years, driven by the increasing availability of data and the need for organizations to optimize their business processes. The studies of indexed journals in this period reflect an evolution both in the understanding of the benefits and in the identification of the challenges associated with this adoption.
The literature consistently highlights the benefits of adopting a data-driven approach to business process management (see
Table 2).
2.1. Process Optimization
According to Aalst [
19], the data-driven approach to business process management emerges as a key technique that allows business processes to be discovered, analyzed, and improved based on real data, facilitating the identification of previously invisible areas for improvement. Galanti et al. [
17] highlight how data-driven predictive analytics makes it possible to anticipate problems and optimize real-time decision making within workflows. Furthermore, Bøgh et al. [
16] underline that this approach not only optimizes internal processes but also contributes to greater operational agility. Regarding customization, Valdez-Mendia and Flores-Cuautle [
18] highlight that data analysis allows a better understanding of customer needs, offering services more tailored to their expectations. In parallel, Gerschütz et al. [
9] emphasize the importance of economic optimization of design processes and the integration of data-driven methods to support digital transformation. Fischer et al. [
12] complement this view by pointing out that a data-driven approach fosters continuous improvement and informed decision making, while Czvetkó et al. [
11] highlight its ability to mitigate risks and promote transparency in processes. These contributions converge on the idea that the adoption of analytical tools not only optimizes current operations but also lays the foundation for resilient and adaptable organizational transformation in dynamic business environments.
2.2. Informed Decision Making
Decision making in the business context has been significantly transformed by the data-driven approach, allowing organizations to adopt a more agile, accurate, and informed process. According to Shubho et al. [
10], access to real-time data not only facilitates fast and accurate decision making but also enhances organizations’ ability to monitor key performance indicators (KPIs) and anticipate trends using advanced analysis tools. This approach is reinforced by Carillo et al. [
13], who highlight the importance of basing decisions on empirical evidence rather than relying solely on intuition, which fosters a more analytical and rigorous organizational culture. In addition, real-time data visualization emerges as a key resource to streamline the decision-making process, as noted by Shubho et al. [
10], by providing immediate insights that guide both strategic and operational decisions. Along the same lines, Wang and Zhang [
5] emphasize that the use of data for decision making allows for the optimization of internal operations, ensuring that strategies are aligned with updated and relevant information. These contributions converge on the idea that a data-driven approach not only improves the quality of decisions but also lays the foundation for more resilient and adaptive management in dynamic business environments.
2.3. Personalization and Customer Satisfaction
Data-driven personalization emerges as a key benefit of the data-driven approach in business process management for small and medium-sized enterprises (SMEs), enabling a deeper understanding of customer needs and preferences. Valdez-Mendia and Flores-Cuautle [
18] highlight that implementing data-driven personalization strategies not only improves customer experience but also strengthens the relationship between SMEs and their target audiences. Along these lines, Wang and Zhang [
5] underline the importance of product and service personalization to anticipate future customer demands through predictive analytics, allowing organizations to proactively adapt to market expectations. Furthermore, Shubho et al. [
10] highlight the value of geolocation-based insights, which provide a contextualized view of customer behavior in different locations, facilitating more precise segmentation and more effective communication. These approaches converge on the idea that personalization not only fosters customer loyalty but also lays the foundation for more meaningful and sustainable interaction between SMEs and their stakeholders.
2.4. Operational Efficiency
The implementation of a data-driven approach to business process management in small and medium-sized enterprises (SMEs) offers multiple benefits that boost their operational efficiency and competitiveness. According to Aalst [
19], the use of process mining allows the analysis of real event data to optimize internal processes, which translates into greater operational efficiency by identifying areas for improvement and eliminating inefficiencies. Along these lines, Tawil et al. [
7] highlight that SMEs that adopt predictive analytics can significantly reduce costs by anticipating needs and mitigating operational risks. In addition, Czvetkó et al. [
11] underline the importance of automating routine tasks through technologies such as machine learning, which frees up human resources for more strategic and higher-value-added activities. Likewise, these authors highlight that the transparency and standardization of processes allow SMEs to improve the clarity of their operations and better adapt to dynamic environments. These benefits converge in the idea that a data-driven approach not only optimizes internal operations but also lays the foundation for resilient and adaptable organizational transformation in competitive markets.
2.5. Adaptability and Agility
The implementation of a data-driven approach to business process management in small and medium-sized enterprises (SMEs) results in greater adaptability and flexibility to changes in the environment, which is essential for their competitiveness. According to Czvetkó et al. [
11], SMEs can develop greater operational agility by integrating real-time data analytics, allowing them to quickly adjust to market fluctuations. Along these lines, Seppänen et al. [
6] highlight how data analytics fosters organizational adaptability, allowing companies to anticipate and respond effectively to transformations in their business environment. Wang et al. [
20] underline the importance of this approach in enabling rapid responses to unexpected changes, which is particularly valuable in volatile markets. In addition, Gerschütz et al. [
9] highlight that this approach not only supports digital transformation but also provides SMEs with the tools necessary to strategically evolve in an ever-changing technological context. These benefits converge in the idea that a data-driven approach not only improves the resilience of SMEs but also lays the foundation for more dynamic and sustainable management in complex business environments.
2.6. Risk Mitigation
The adoption of a data-driven approach to business process management in small and medium-sized enterprises (SMEs) stands out for its ability to mitigate risks and strengthen organizational resilience. According to Czvetkó et al. [
11], the use of predictive analytics makes it possible to anticipate potential operational problems, facilitating the implementation of preventive measures before risks negatively impact the organization. Furthermore, early identification of potential risks emerges as a key benefit of this approach, as it provides SMEs with the opportunity to address vulnerabilities at early stages. Along these lines, Carillo et al. [
13] underline the importance of proactive management of future contingencies using big data and advanced analytics, which transforms the ability of SMEs to respond effectively to uncertainties in dynamic environments. These benefits converge in the idea that a data-driven approach not only protects SMEs from latent threats but also lays the foundation for more strategic and sustainable management in complex business contexts.
2.7. Automation
Automation emerges as one of the most prominent benefits of the data-driven approach to business process management in small and medium-sized enterprises (SMEs), allowing for the optimization of both routine tasks and the strategic allocation of resources. According to Czvetkó et al. [
11], the automation of repetitive tasks not only frees up human resources for higher-value activities but also reduces errors and improves operational efficiency. Along these lines, Fischer et al. [
12] underline the importance of automatic data-driven process prioritization, allowing SMEs to identify and focus on those areas with the greatest potential for improvement, thus maximizing the impact of their efforts. Furthermore, Galanti et al. [
17] highlight how predictive analytics can be used to automate workflows, anticipating needs and dynamically adjusting operations to respond to changes in the business environment. These benefits converge in the idea that automation, driven by a data-driven approach, not only optimizes internal processes but also lays the foundation for more agile and strategic management in SMEs.
2.8. Organizational Culture and Digital Transformation
Implementing a data-driven approach to business process management in small and medium-sized enterprises (SMEs) not only optimizes operations but also drives key cultural and technological transformations. According to Seppänen et al. [
6], this approach fosters a data-driven leadership culture, where decisionmakers rely on analytics and evidence to guide organizational performance. Along these lines, Carillo et al. [
13] highlight the importance of a cultural transformation towards an analytical approach, allowing SMEs to quickly adapt to changes in the market and improve their organizational learning capacity. Furthermore, Gerschütz et al. [
9] underline that this approach actively supports digital transformation by providing tools to assess the technological readiness of organizations, identifying areas for improvement, and facilitating the integration of digital solutions. These benefits converge in the idea that a data-driven approach not only improves operational efficiency but also lays the foundation for sustainable cultural and technological evolution in SMEs.
2.9. Innovation and Competitiveness
The adoption of a data-driven approach to business process management in small and medium-sized enterprises (SMEs) significantly fosters innovation and improves their competitive position in the market. According to Carillo et al. [
13], this approach not only enables the development of new innovative business models but also provides a competitive advantage through the strategic use of big data, which facilitates a better understanding of the environment and customer needs. Along these lines, Wang and Zhang [
5] highlight that SMEs experience a notable improvement in their innovation capacity, which translates into greater competitiveness and resilience in the face of market challenges. Furthermore, Tawil et al. [
7] underline how innovation in products and services, driven by data analysis, allows SMEs to differentiate themselves from their competitors and quickly adapt to the changing demands of the business environment. These benefits converge in the idea that a data-driven approach not only drives creativity and the development of innovative solutions but also lays the foundation for sustainable growth and greater competitiveness in SMEs.
2.10. Transparency and Standardization
The implementation of a data-driven approach to business process management in small and medium-sized enterprises (SMEs) promotes greater clarity and consistency in the documentation and standardization of processes, key elements for their operational efficiency. According to Gerschütz et al. [
9], detailed process documentation not only captures procedural steps but also includes tools, information sources, and data fragments used, facilitating a comprehensive understanding of internal operations. Along these lines, Czvetkó et al. [
11] highlight how process transparency and standardization allow SMEs to create clear and consistent models that improve collaboration between cross-functional teams and reduce ambiguities in task execution. These benefits converge in the idea that a data-driven approach not only optimizes process management but also lays the foundation for a more structured, scalable operation aligned with market standards.
However, the literature also identifies significant challenges in implementing data-driven approaches to BPM in the context of SMEs [
21,
22].
Table 3 shows the position of the authors analyzed regarding the challenges identified.
2.11. Technological and Infrastructure Limitations
Technological and infrastructure limitations represent some of the main obstacles to the adoption of a data-driven approach to business process management within small and medium-sized enterprises (SMEs). As Justy et al. [
23] highlight, the lack of advanced technological infrastructure and robust data management systems prevents many SMEs from efficiently handling large volumes of information, constituting a critical obstacle to their digital transformation. This problem is exacerbated by low levels of digitalization in certain departments or processes, as Gerschütz et al. [
9] point out, reflecting a significant gap in the adoption of digital tools. Furthermore, the integration of new technologies with legacy systems emerges as a recurring challenge, as documented by Wang and Zhang [
5] and Tawil et al. [
7], who highlight the difficulties inherent in ensuring interoperability between disparate platforms. Finally, the picture is further complicated by the cybersecurity vulnerabilities identified by Seppänen et al. [
6], where the use of digital tools introduces significant risks, such as data breaches and unauthorized access, that threaten the integrity and confidentiality of business information. These factors converge to form a technological environment rife with challenges that SMEs must strategically address to move towards a truly data-driven approach.
2.12. Resource Constraints
Resource constraints emerge as some of the most significant obstacles to the adoption of a data-driven approach to business process management within small and medium-sized enterprises (SMEs). As highlighted by Wang and Zhang [
5] along with Tawil et al. [
6], financial constraints are a critical barrier, as these organizations have reduced budgets that hinder investment in advanced technology needed to implement data analytics solutions. This challenge is exacerbated by the scarcity of technical resources, particularly the lack of trained personnel to implement and maintain such technologies, which is underlined by Tawil et al. [
7] as a factor exacerbating the technical capabilities gap. Furthermore, high initial implementation costs represent a prohibitive burden for many SMEs, which must undertake significant investments before being able to assess the tangible benefits of these tools (no specific author). Finally, the funding gap while waiting for return on investment (ROI) adds another layer of complexity, as SMEs struggle to sustain their digital transformation efforts until results begin to materialize, as noted by Tawil et al. [
7]. These constraints converge to form an environment where the adoption of a data-driven approach is severely limited, highlighting the need for tailored strategies that consider the financial and operational realities of SMEs.
2.13. Training and Skills Challenges
Training and skills challenges emerge as some of the main obstacles to the adoption of a data-driven approach in business process management within small and medium-sized enterprises (SMEs). Seppänen et al. [
6] highlight the shortage of analytical skills as a critical factor, as many employees lack the necessary competencies to effectively interpret and use data, limiting the potential for digital transformation. This problem is exacerbated by the lack of up-to-date technical knowledge, as noted by Tawil et al. [
7], who underline that employees may be outdated in essential digital skills or completely unaware of new technological tools. Furthermore, Czvetkó et al. [
11] emphasize the need for continuous skills development, arguing that rapidly evolving technologies demand constant training to keep up with developments. Finally, the lack of domain-specific data analysts, identified by Tawil et al. [
7], highlights the difficulty of finding professionals who combine advanced technical knowledge with a deep understanding of the sector in which SMEs operate. These challenges converge to form a significant barrier preventing SMEs from fully harnessing the potential of a data-driven approach, underlining the urgent need for comprehensive training and skills development strategies tailored to the realities and resources of these organizations.
2.14. Organizational and Cultural Resistance
Organizational and cultural resistance emerges as one of the most entrenched obstacles to the adoption of a data-driven approach to business process management within small and medium-sized enterprises (SMEs). Wang and Zhang [
5] highlight that employee resistance to change, fueled by fear of the unknown or the potential destabilization of work roles, constitutes a significant barrier to the implementation of advanced digital tools. This challenge is exacerbated by the preference for conventional business methods, as noted by Tawil et al. [
7], who identify a marked inclination towards traditional practices rather than adopting digital innovations. Furthermore, the lack of a robust digital culture, underlined by Wang and Zhang [
5], reflects the absence of a technology-oriented mindset that drives digital transformation. In parallel, Carillo et al. [
13] highlight anxiety towards analytics, evidencing how many employees experience an aversion towards the use of data and statistics, which limits their willingness to integrate analytical tools into their daily activities. Finally, Gerschütz et al. [
9] add another level of complexity by pointing out case-based thinking, where employees tend to describe processes based on individual examples rather than visualizing general flows, making it difficult to standardize and optimize processes through data-driven approaches. These factors converge to form a deep-rooted cultural and organizational resistance, which SMEs must strategically address through training programs, transformational leadership, and effective communication to foster a receptive mindset towards digital innovation.
2.15. Data Management and Quality
Data management and quality emerge as some of the most critical challenges for the adoption of a data-driven approach in business process management within small and medium-sized enterprises (SMEs). Tawil et al. [
7] highlight the absence of sector-specific data, pointing out that many industrial sectors lack relevant information for analysis and strategic decision making, which significantly limits the potential of analytical tools. This problem is exacerbated by the presence of incomplete or noisy data, as noted by Shubho et al. [
10], who underline that low data quality directly affects their usefulness and ability to generate valuable insights. Furthermore, Gerschütz et al. [
9] emphasize insufficient data documentation, particularly in dynamic processes such as product development, where many social interactions and changes in data versions are not fully recorded, generating gaps in the traceability of information. Finally, Czvetkó et al. [
11] highlight the importance of ensuring data reliability and completeness, arguing that accuracy and completeness are critical to building robust data management systems that can support effective digital transformation. These challenges converge to form a complex landscape in which SMEs must address both data availability and quality, ensuring that the tools and strategies implemented are supported by accurate, complete, and relevant information to maximize their impact on improving business processes.
2.16. Implementation and Change Management Challenges
Implementation and change management challenges represent a critical barrier to the adoption of a data-driven approach to business process management within small and medium-sized enterprises (SMEs). Gerschütz et al. [
9] highlight the difficulty in adequately capturing the specific characteristics of certain processes, underlining that current methods fail to reflect the particularities inherent to dynamic activities such as product development. This problem is exacerbated by the dispersion of knowledge about processes, as noted by Fischer et al. [
12], who identify that the understanding of operational flows is fragmented among different people and departments, which complicates the creation of a comprehensive view. In addition, the need to adapt technological solutions to the specific contexts of each organization, also noted by Fischer et al. [
12], highlights the importance of avoiding generic approaches that do not consider the singularities of SMEs. In parallel, Carillo et al. [
13] emphasize the need for carefully planned change management, arguing that cultural and organizational resistance can hinder the effective implementation of new tools and practices. Finally, Wang and Zhang [
5] address the challenge of integrating these tools with existing processes without disrupting current operations, which requires strategies that balance technological innovation with operational continuity. These challenges converge to form a complex landscape that SMEs must carefully navigate, adopting flexible and participatory approaches that allow them to overcome implementation barriers and effectively manage the shift to a truly data-driven model.
2.17. Analytical and Technical Complexity
Analytical and technical complexity represents one of the most significant challenges to the adoption of a data-driven approach in business process management within small and medium-sized enterprises (SMEs). Shubho et al. [
10] highlight the limitations inherent to traditional statistical methods, pointing out that these techniques are not sufficient to address real-time data analysis, a critical need in dynamic environments. This challenge is exacerbated by the complexity in data analysis, as pointed out by Fischer et al. [
12], who underline that exploratory methods may present limitations in terms of validity and reliability, affecting the quality of decisions based on such analyses. Furthermore, Gerschütz et al. [
9] emphasize the lack of understanding of formal modeling languages, an obstacle that hinders the effective implementation of advanced process analysis and design tools. In parallel, Shubho et al. [
10] highlight the problem of information overload, where managers feel overwhelmed by the amount of data available, which can lead to paralysis in decision making. Finally, the same authors also identify the underutilization of existing data, evidencing how many SMEs, despite having large volumes of information, lack the necessary capabilities to take advantage of it strategically. These challenges converge to form a complex technical and analytical landscape, where SMEs must balance the adoption of advanced tools with staff training and the development of robust frameworks to effectively manage and use the available data.
2.18. Leadership and Strategy
Leadership and strategy emerge as critical dimensions that condition the success of adopting a data-driven approach to business process management in small and medium-sized enterprises (SMEs). Wang and Zhang [
5] underline the importance of digital leadership by highlighting that the success of digital transformation depends on leaders who understand, promote, and guide this process effectively. However, this leadership capacity is often absent or insufficient in many SMEs, reflected in a weak digital drive that lacks a clear strategy, thus limiting the tangible benefits of adopting digital tools. Furthermore, the absence of a coherent strategic vision, also pointed out by Wang and Zhang [
5], exacerbates the lack of direction in digitalization initiatives, while the difficulty in measuring impact and return on investment (ROI) highlights the need for robust frameworks to evaluate the results of these transformations. In this context, Vom Brocke and Mendling [
24] emphasize the importance of strategic alignment, arguing that digital initiatives must be closely linked to business objectives to ensure their relevance and sustainability. These challenges converge to form a complex landscape where SMEs must strengthen both leadership and strategic planning, ensuring that technological decisions do not just respond to momentary trends but are integrated into a clear roadmap that maximizes the value generated for the organization.
The methodological framework for effective adoption is structured in three fundamental phases, according to contemporary literature. Vom Brocke and Mendling [
24] emphasize the importance of an initial assessment and preparation phase, which should include a thorough analysis of organizational digital maturity and the definition of strategic objectives. Marcinkowski and Gawin [
25] assert that organizational readiness and a comprehensive data management strategy—from data acquisition to security and privacy—are essential for the success of data-driven business models in the facility management industry. They further emphasize that fostering a collaborative culture that integrates data-driven decision making at every level not only optimizes existing services but also drives innovation and creates new revenue streams, empowering organizations to effectively master the complexities of data. The second phase comprises gradual and systematic implementation, where You and Wu [
26] propose an iterative approach with short implementation and evaluation cycles. The final phase focuses on establishing monitoring and continuous improvement systems, with an emphasis on defining specific performance metrics [
11,
26].
It is important to note that the success in adopting the data-driven approach to BPM in SMEs transcends purely technological aspects. Contemporary literature emphasizes the need to develop an organizational culture that values and understands the use of data in strategic and operational decision making [
2,
6,
23].
As a summary, it is possible to say that the adoption of data-driven approaches in SMEs is influenced by several key enablers that encompass organizational, technological, and strategic aspects. According to Fosso Wamba et al. [
27], competitive pressure and the need to improve operational efficiency drive the implementation of analytical tools, which can generate a significant competitive advantage. Langer [
28] highlights the importance of a mature organizational culture in the use of data, along with the availability of robust and easy-to-use technological tools, as well as the need for analytical skills within BPM teams. Tagscherer and Carbon [
29] emphasize the crucial role of leadership and executive sponsorship in driving data-driven BPM initiatives across the organization. Furthermore, Wang and Zhang [
5] point out that strategic commitment, digital culture, and the integration of digital tools into core processes are critical, while Seppänen et al. [
6] underline the need to align digital initiatives with the overall business strategy and to develop employees’ digital capabilities. Meanwhile, Tawil et al. [
7] highlight the importance of awareness about the benefits of data-driven approaches, along with investment in training and building a “data culture”. Finally, Gerschütz et al. [
9] underscore the need for a robust technological infrastructure, accessible and quality data, and a gradual and iterative approach to implementing solutions. These factors, taken together, provide a comprehensive view of the enablers that can drive the adoption of data-driven methods in SMEs.
On the other hand, the adoption of data-driven approaches in SMEs also faces various inhibitors that hinder their effective introduction. According to Côrte-Real et al. [
30], lack of financial resources is one of the most common obstacles, as many SMEs lack the funds to invest in advanced software and specialized hardware. Furthermore, hiring data analytics experts can be prohibitively expensive for these organizations. Resistance to change within the organization is also a significant challenge, as noted by several authors, due to a lack of understanding about the value of data and fear of technical complexity, which creates resistance among employees, especially in SMEs where traditional processes are deeply entrenched. Martin et al. [
31] emphasize that data quality is another major obstacle, as incomplete, inconsistent, or irrelevant data can lead to erroneous analysis and suboptimal decisions. Furthermore, resistance to organizational change is highlighted as a common barrier, as a data-driven approach to business process management often requires changes to traditional roles, responsibilities, and ways of working. Cao and Iansiti [
32] add that integration with legacy systems is another challenge, especially in organizations with complex and fragmented IT architectures, where the ability to extract and unify data from diverse sources is critical but often complex and costly. Tawil et al. [
7] identify a lack of awareness about the benefits of data-driven approaches, along with limitations in data science skills and expertise, as key barriers, in addition to the absence of sector-specific data and noise or insufficient data for analysis. Faiz et al. [
22] highlight that the complexity of analytical tools can deter SMEs unless they are easy to use, while a lack of adequate technological infrastructure and resistance to abandoning conventional methods are also critical factors. Finally, Czvetkó et al. [
11] point out data security and privacy concerns as significant challenges, as ensuring the security and privacy of data collected and processed through various digital tools is essential but difficult to achieve. These inhibitors, taken together, reflect the multifaceted barriers that SMEs must overcome to successfully adopt data-driven approaches.
The literature collects several models of technology adoption;
Table 4 summarizes the most frequently mentioned ones.
The study of expectations in the context of the adoption of data-driven approaches for business process management, especially in small and medium-sized enterprises (SMEs), emerges as a critical component to understand and facilitate the successful implementation of these technologies. From multiple theoretical and empirical perspectives, several authors agree in emphasizing that expectations not only act as key mediators between prior experience and adoption intention [
40] but also configure fundamental constructs to predict both the intention to use and the actual adoption behavior [
41,
42].
Table 5 presents some of these perspectives.
First, it is relevant to highlight that expectations, such as performance expectancy and effort expectancy, are decisive factors that directly influence the perception of usefulness and ease of use of an emerging technology. According to Ledesma-Chaves et al. [
47], performance expectancy refers to the belief that a specific behavior will lead to the achievement of desired outcomes, which is particularly crucial for SMEs with limited resources, as they carefully evaluate whether investment in technology will generate tangible returns. Furthermore, Lee [
48] points out that these expectations impact opportunity recognition and, consequently, the behavioral intention to adopt such technologies.
From a deeper perspective, expectations not only influence the initial adoption decision but also affect the interpretation of how the technology works once implemented. Cantú Alejandro and Güemes-Castorena [
49] argue that informed expectations, even about possible errors or limitations, contribute to building trust and reducing resistance to change, a common obstacle in the adoption of technological innovations. This aligns with the findings of Veiga et al. [
50], who highlight those prior expectations, together with organizational support, play a crucial role in overcoming barriers related to the underutilization of technological systems.
Furthermore, the analysis of expectations allows identifying cultural and organizational aspects that can influence the willingness to adopt [
51]. In this sense, expectations generate intangible cultural resources that provide the basis for the acceptance and continued use of emerging technologies.
On the other hand, longitudinal studies such as those by Saeed et al. [
52] reveal that pre-implementation expectations have a lasting impact on the formation of usage intention and on how users subsequently evaluate the system. This phenomenon underlines the need to carefully manage expectations from the early stages of the adoption process, as these can explain the gap between the technical implementation of a system and its effective use. Likewise, Zhang et al. [
53] and Tao et al. [
54] suggest diagnosing expectations and emphasize that they influence attitudes towards adoption of technology and that their ignorance and lack of alignment can lead to non-adoption or in the future to disappointment as well as disuse in the case of having previously adopted the technology. According to Gupta et al. [
55], understanding pre-use expectations impacts skill development and subsequent satisfaction and allows for the design of more effective strategies to facilitate adoption and maximize the return on investment in technology.
The main conclusions highlighted the dual role of expectations as both enablers and potential barriers to DD-BPM adoption. On the one hand, well-managed expectations can drive innovation, improve decision making, and enhance competitiveness. On the other hand, unmet or misaligned expectations may lead to resistance, underutilization, or abandonment of these technologies.
In a context where data analytics redefines the rules of the game, aligning the expectations not only enhances the adoption of advanced tools but also inspires a culture of innovation, collaboration, and continuous improvement, leading organizations towards new horizons of operational excellence and competitiveness. Ultimately, the findings suggest that fostering a data-driven culture, investing in skill development, and ensuring leadership alignment are pivotal steps toward successful DD-BPM adoption in MSMEs.
3. Materials and Methods
The methodological design of this study is quantitative, non-experimental, and cross-sectional. The study population comprises micro and small entrepreneurs in the Metropolitan District of Quito, which plays a fundamental role in Ecuador’s economy, consolidating itself as one of the country’s main productive engines [
56]. More than 200,000 micro and small enterprises are considered as an infinite population; with a margin of error of 2.23% and a confidence level of 95%, a sample of 1925 entrepreneurs was obtained, whose composition by economic sector is shown in
Table 6.
The selection of entrepreneurs from each economic sector began by identifying entrepreneurs from a particular sector and asking them to recommend other potential participants who also met the criteria of belonging to the sector in question and having more than three years of operation considering that they had already passed the inclusion phase. This process was repeated until the desired sample size was reached in each sector of the economy. Snowball sampling was selected due to the absence of a comprehensive sampling frame or accessible database of entrepreneurs who met the study’s criteria. This method enabled the research team to access a hard-to-reach population by leveraging initial participants’ networks to identify additional eligible subjects across various economic sectors. In doing so, the approach not only ensured that participants possessed the requisite operational experience and sector affiliation but also enriched the sample with diverse perspectives crucial for understanding the adoption of data-driven business process management.
To mitigate potential biases inherent in snowball sampling, several strategies were implemented. Initial participants were deliberately chosen from a diverse range of economic sectors to prevent overrepresentation of any single group, and limits were set on the number of referrals each respondent could provide to ensure broader sample heterogeneity. Additionally, efforts were made to verify that the distribution of sectors within the sample accurately reflected the overall economic structure of the Metropolitan District of Quito. These measures collectively minimized selection bias and enhanced the reliability and validity of the study’s findings.
The final sample, comprising 1925 entrepreneurs, is distributed according to company size as follows: micro enterprises (37.2%), small enterprises (61.7%), and medium enterprises (1.1%). Regarding the gender distribution of business owners, 67.7% were male and 32.3% female. With respect to entrepreneurial experience, participants reported a wide range spanning from 3 to 58 years, with a mean of 23.96 years (SD = 8.63), indicating a sample with considerable business trajectory and moderate dispersion in years of experience, suggesting the inclusion of both relatively novice entrepreneurs as well as those with extensive business careers.
Based on Cuesta Santos [
57], a tool specifically engineered to evaluate entrepreneurs’ expectations concerning the adoption of data-driven approaches to BPM was utilized in the present study. This instrument employs a scaled pyramid scale, integrating ascending and descending levels to symbolize distinct ordinal levels of expectations, as illustrated in
Figure 1.
The ascending steps symbolize positive expectations, ranging from “no expectations” to “maximum positive expectations”. Conversely, the descending steps denote negative expectations, from “minimum negative expectations” to “maximum negative expectations”. Each step signifies an ordinal level (e.g., from 1 to 7 on the ascending scale and from 7 to 1 on the descending scale).
The question accompanying the instrument, “How likely are you to adopt data-driven approaches to improve the management of your company’s processes?” was carefully designed to serve as the cornerstone of the study, ensuring alignment with its objectives and facilitating a comprehensive exploration of entrepreneurs’ expectations. This question directly addresses the core focus of the study: entrepreneurs’ expectations regarding DD-BPM adoption, capturing how MSME owners perceive the integration of data-driven solutions into their operational frameworks. By doing so, it aligns with the broader aim of understanding both the opportunities and challenges associated with digital transformation in resource-constrained environments. Using the stepped pyramid scale, the question effectively captures a spectrum of expectations, ranging from positive perceptions, such as confidence in the benefits of data-driven BPM, to negative ones, such as skepticism or perceived barriers. This dual measurement capability allows for a nuanced analysis of entrepreneurs’ attitudes, providing insights into both their optimism and concerns about adopting these technologies. Additionally, the responses to this question can be disaggregated to explore various dimensions, such as differences across economic sectors, firm size, or levels of entrepreneurial experience, enabling a deeper understanding of how diverse factors influence expectations and revealing sector-specific dynamics. The question is also clear, concise, and straightforward, making it easily understandable for entrepreneurs and reducing the risk of ambiguity in responses. This clarity is particularly important in studies involving MSMEs, where respondents may have varying levels of familiarity with technical terminology. Furthermore, this question aligns with previous research, such as the works of Tawil et al. [
7] and Justy et al. [
23], which emphasize the importance of understanding entrepreneurs’ perceptions and expectations toward the adoption of digital technologies. By building established theoretical frameworks and empirical findings, the question reinforces the study’s contribution to the existing body of knowledge while addressing gaps related to MSMEs’ unique challenges and opportunities. In summary, the inclusion of this question ensures that the instrument is both robust and relevant, enabling a comprehensive exploration of entrepreneurs’ expectations while reflecting a balance between methodological rigor and practical applicability, making it an ideal tool for capturing the complexities of MSME owners’ attitudes toward data-driven BPM adoption.
This instrument, based on a scaled pyramid model, provides a nuanced understanding of expectations by integrating both ascending (positive) and descending (negative) scales, thereby capturing a broad spectrum of entrepreneurial perceptions. Unlike traditional Likert scales, which measure attitudes along a single continuum, this instrument differentiates between positive and negative expectations, ensuring a more precise and comprehensive assessment. Moreover, it extends beyond basic frequency analysis by incorporating multiple analytical metrics that enhance the depth and accuracy of expectation measurement. It captures overall sentiment, offers a weighted evaluation of response distribution, identifies concentration patterns across response categories, and quantifies the degree of divergence in expectations, thereby providing insights into the level of consensus or polarization among respondents. Additionally, it ensures statistical rigor through inferential analyses, including tests to examine differences across economic sectors and business sizes, further strengthening the reliability and applicability of the findings [
55]. Its alignment with the UTAUT reinforces its predictive accuracy in explaining technology adoption behavior. These features collectively establish it as a robust and comprehensive tool for assessing expectations in the context of data-driven BPM adoption.
The validation process of the instrument was conducted in accordance with a rigorous methodology, ensuring its quality and accuracy. Initially, content validity was assessed by consulting 10 experts in the field of entrepreneurship, who evaluated the relevance and clarity of the scale levels, resulting in an average congruence index of 0.85, which exceeds the accepted reference value (k ≥ 0.80). The reliability of the instrument was then analyzed by means of a pilot test applied to 50 entrepreneurs, obtaining Cronbach’s alpha coefficient of 0.92, which reflects a high internal consistency. Finally, predictive validity was determined through a correlation analysis between the results of the instrument and business metrics, such as revenue growth, reaching a Pearson’s coefficient of 0.68 with a statistical significance level of p < 0.01. The findings of this study substantiate the instrument’s aptitude in quantifying entrepreneurs’ expectations with a high degree of validity and reliability.
The data collected through the instrument are analyzed using various descriptive and inferential metrics:
A: positive expectations—number of rising marks (A).
D: negative expectations—number of marks going down (D).
N: total sum of positive and negative expectations (total number of participants who ticked).
Thus, Cse is a continuous variable that oscillates in the range 1 to −1 and can take value 0. Cse = 1 indicates that all participants have rising (positive) expectations, Cse = −1 indicates that all participants have declining (negative) expectations, and Cse = 0 indicates that half of the participants’ perceived expectations are rising (+) and the other half are falling (−).
- 2.
The coefficient of expectations, based on the relative proportion of steps (
Cepr), is an indicator that seeks to capture the richness of the distribution of responses along ascending and descending steps. Rather than simply counting the number of positive and negative marks, a weighted average is calculated that considers the relative weight of each step within the context of the instrument. The expression for this is as follows:
where:
: weighted average of ascending steps.
: weighted average of descending steps.
: total number of evaluated steps.
Calculation Steps
Record how many participants selected each ascending () and descending () step.
- 2.
Calculate the weighted average:
For downward steps:
where:
: step number.
: frequency of responses at step .
Table 7 presents how to interpret the indicator.
- 3.
The relative frequency of expectations (
RFe) is a descriptive measure that calculates the percentage of responses in each step with respect to the total number of marks made. It indicates, for each step and mark, the percentage that corresponds to it of the total number of marks. The expression used to calculate it is as follows:
where:
Me: number of marks on step s (s = 1, 2, 3…7 in ascent or descent).
N: total number of marks (total number of participants).
The FRe allows us to identify if there are significant concentrations of responses at certain steps, which may not be evident in the aggregate indicator Cse.
- 4.
The mode (Mo) is expressed with respect to the instrument as the step most frequently marked by the participants, resulting in an indicator differentiated as Mo-A (mode of participants with ascending expectations “A”) or, conversely, as Mo-D (mode of participants with descending expectations “D”).
- 5.
The median of expectations (), which is the recommended statistic for moving from description to statistical inference. If the median is on a high rung of the ascending scale, it indicates that most participants have positive expectations, even if there are some with very negative perceptions. If the median is close to the neutral point of the scale, it reflects a balance between positive and negative expectations.
- 6.
Polarization index (PI) measures the dispersion between the extreme responses, i.e., how far apart the responses are at the extremes of the scale. This index can be calculated using the following formula:
: sum of the frequencies of the extreme responses (both the most optimistic and the most pessimistic). For ascending responses: Ascending 7 (highest positive expectations). For the descending responses: Downward 1 (highest negative expectations).
: total sum of all responses in the different categories.
Table 8 shows an interpretation scale for the polarization index (PI), which can help assess the level of dispersion between extreme responses.
To further study the expectations for the adoption of data-driven approaches to business process management, a complementary questionnaire was applied. This questionnaire was structured in four sections: knowledge of BPM (five items, α = 0.89), current use of these approaches (four items, α = 0.85), perceived benefits (five items, α = 0.88), and perceived barriers (five items, α = 0.87). A 5-point Likert scale was utilized, where 1 indicates “Strongly disagree” and 5 “Strongly agree”. The questions addressed aspects such as familiarity with analytical tools, perceived benefits for operational efficiency, related barriers, and the degree of current adoption in the ventures. Cronbach’s alpha coefficients obtained in the pilot test indicate high internal consistency for each dimension, thereby supporting the reliability of the questionnaire. This allows for the development of two indicators calculated as averages of the responses of each section derived from each scale of the questionnaire:
Knowledge of BPM and data-driven approaches (CD-BPM).
Current use of data-driven approaches (UA-BPM).
The results of the step marks will be analyzed for comparison by introducing some variables into the analysis (see
Table 9):
To assess differences in expectations about the adoption of data-driven approaches among MSME owners, non-parametric tests using ordinal data and categorical variables were employed. For polytomous variables (economic sector, size of business), we used the Kruskal–Wallis test, whose statistic
(where
Ri is the sum of ranks of group
i,
ni its size,
N the total observations, and
k the groups) assesses differences in medians between k independent groups. Both methods, by relying on ranks, avoid parametric assumptions, reporting
p-values (α = 0.05) to infer statistical significance. In cases of significant H, post hoc comparisons with Bonferroni correction (
p-adjusted =
p × m, where m is the number of comparisons) were applied to control type I errors [
58].
Numerical variables (previous experience, performance indicators) were analyzed using Spearman’s correlation (
ρ) whose statistic is
; where
di is the difference between ranks of each pair of observations, quantifying monotonic associations. All analyses assumed α = 0.05, reporting
p-values and effect sizes (U, H,
ρ) to interpret significance and magnitude of differences or correlations [
55]. The selection of Spearman’s rank correlation coefficient was deemed more appropriate than Pearson’s, as it more adequately evaluates the monotonic relationship among non-normally distributed variables. While Pearson’s correlation measures the strength of a linear relationship, Spearman’s is better suited for studies in which the relationships between the analyzed variables may not be strictly linear. Furthermore, its reliance on rank ordering rather than raw data makes it less sensitive to outliers, thereby enhancing its robustness in empirical studies characterized by high variability.
4. Results
The data collected using the expectations measurement instrument allow us to arrive at the following results:
In general, the simple coefficient of expectations (Ces) takes a value of −0.654 for the sample analyzed. This value indicates that there is a negative trend in terms of expectations regarding the adoption of data-based approaches for business process management, but not in an absolute way. This general indicator is outlined by calculating the coefficient of expectations based on the relative proportion of steps (Cepr), which in the case in question shows a value of −0.383. This Cepr value is within the interval (−0.4, 0), which indicates a slight predominance of negative expectations in relation to the adoption of data-based approaches for business process management. Specifically, this value reflects that negative expectations among participants are slightly higher than positive expectations, although the difference is not significant enough to be considered as moderate pessimism.
From an interpretive perspective, the value of Cepr = −0.383 suggests that, although most participants hold more negative than positive expectations regarding the adoption of data-driven approaches to business process management, the magnitude of this difference is not overwhelming. This could indicate some concern or uncertainty on the part of participants regarding the implementation and impact of data-driven approaches to business process management but not reaching an absolute rejection.
In practical terms, this value reflects a general tendency towards a slight distrust or caution in the adoption of data-driven approaches to business process management, although there is a considerable proportion of participants who still have positive expectations regarding their future adoption, suggesting that the perception landscape regarding data-driven approaches to business process management is mixed, with a slight bias towards the negative.
Descriptive indicators such as relative frequency of expectations (
FRe) and mode (Mo-A and Mo-D), as well as median of expectations (
), for the analyzed sample can be observed in
Figure 2.
The analysis of the frequency distribution of the expectation steps shows an asymmetry in the perception of the participants. It is observed that the ascending mode (Mo-A) and the descending mode (Mo-D) indicate the most frequently selected steps in each direction of the scale. Likewise, the median (−4) represents the central point of the observed values, suggesting a predominant trend: low expectations regarding the adoption of data-driven approaches to business process management.
The percentage breakdown of the responses reveals that the levels of moderately (23.84%) and lowly (23.32%) negative expectations are the most frequent, followed by highly negative (15.38%) and minimally negative (14.75%) expectations. In contrast, positive expectations reach lower levels, with the category of moderate (4.05%) and high (4.68%) expectations showing relatively low frequencies.
From an interpretive perspective, these results suggest that most entrepreneurs have low expectations related to the adoption of data-driven approaches to business process management, given that the modal and median values are in the range of negative expectations. This pattern could indicate a lack of confidence in the approach analyzed or a generalized perception of risk or uncertainty. Additionally, the presence of reduced frequencies at the most extreme levels (maximum positive or negative expectations) suggests a distribution concentrated in the center of the scale, with a bias towards the negative side.
In terms of inference, the distribution of the data indicates that the level of expectations is not uniformly distributed but rather follows a pattern where negative evaluation categories predominate. This may have implications for entrepreneurs’ decision making regarding the adoption of data-driven approaches to business process management, given that low expectations could influence the willingness to adopt data-driven approaches to business process management.
Since the polarization index (PI) obtained is 0.05, this value is in the low polarization range (0 < PI ≤ 0.1), indicating that the responses are mostly concentrated on intermediate options, with a minimal presence of extreme responses. This implies that most entrepreneurs share relatively similar perceptions without a marked segmentation in the responses. In terms of variance, this could be associated with a leptokurtic distribution, characterized by a greater concentration of values around the mean and narrower tails.
Furthermore, the low polarization implies that there is no significant conflict in the perceptions of the respondents, suggesting a certain consensus within the group of entrepreneurs that make up the sample. This may be indicative that the expectations measured on the scale reflect a tendency shared by most participants, without extreme divisions in the responses. From an applied perspective, this result could be interpreted as an environment with relatively homogeneous opinions, which could facilitate decision making or the design of strategies based on the predominant expectations of the group.
By sectors of the economy, the behavior of these general indicators can be seen in
Figure 3.
The simple coefficient of expectations (Ces), which measures entrepreneurs’ perceptions regarding the adoption of data-driven approaches to business process management, presents negative values in all the sectors analyzed, indicating a general tendency towards cautious or skeptical expectations regarding the adoption of data-driven approaches to business process management. However, the magnitude of these coefficients varies significantly between sectors:
Agriculture, Livestock, Forestry, and Fisheries (−0.769) and Commerce (−0.763): These sectors show the highest coefficients of absolute value, suggesting that entrepreneurs in these areas have fewer negative expectations or perceive fewer challenges in integrating data-driven approaches to business process management.
Services (−0.665) and Construction (−0.536): The coefficients in these sectors are in an intermediate range. This could be interpreted as a moderate perception of difficulties or a certain skepticism, although less marked than in sectors with higher coefficients in absolute value.
Manufacturing (−0.159): This sector stands out for presenting a considerably lower coefficient in absolute value, which implies that entrepreneurs in this area have relatively more negative expectations or, at least, show greater skepticism regarding the adoption of data-driven approaches to business process management.
The results of the one-sample t-test show a statistically significant difference between the sample mean and the test value (0), with t(4) = −5.116, p = 0.007. The estimated mean difference is −0.5784, with a 95% confidence interval ranging from −0.8923 to −0.2645, indicating that the true population mean is probably smaller than the reference value. Since the confidence interval does not include the null value and the significance level is below the conventional threshold of 0.05, the null hypothesis is rejected in favor of the alternative hypothesis, concluding that the sample mean differs significantly and negatively from the test value. Although all sectors share a general trend of negative expectations towards the adoption of data-driven approaches to business process management, there are substantial differences in the intensity of these perceptions, which could reflect variations in the capacity for technological adaptation, previous experience in digital transformation, or specific market conditions in each sector.
The coefficient of expectations based on the relative proportion of steps (Cepr), which reflects entrepreneurs’ perceptions about the adoption of data-driven approaches to business process management, presents negative values in all the sectors analyzed. This indicates that, in general, expectations regarding the integration of these solutions are moderately cautious. However, differences in the intensity of these perceptions are observed between sectors:
Agriculture, Livestock, Forestry, and Fisheries (−0.367): This sector presents the least negative value, which could be interpreted as a slightly more optimistic expectation or, at least, less skepticism regarding the adoption of data-driven approaches to business process management.
Manufacturing (−0.378) and Commerce (−0.374): The coefficients in these sectors are very similar and are in a range close to that of agriculture, which suggests comparable and moderate perceptions about the process of adoption of data-driven approaches to business process management.
Services (−0.383): A slightly more negative value is observed in this sector, which may reflect a slightly greater perception of the challenges associated with the implementation of these technologies.
Construction (−0.425): This sector stands out for presenting the most negative coefficient, which implies that entrepreneurs in this area show more skeptical expectations or perceive greater difficulties in adopting data-driven approaches to business process management.
Although all sectors share a tendency towards negative expectations, the degree of skepticism varies, being more pronounced in the agriculture, livestock, forestry, and fisheries sectors and less marked in the construction sector, which could be due to differences in the capacity for technological adaptation and in the perception of the challenges specific to each sector.
The results of the one-sample t-test indicate a highly significant difference between the sample mean and the test value (0), with t(4) = −37.636, p < 0.001. The estimated difference in means is −0.3854, with a 95% confidence interval ranging from −0.4138 to −0.3570, suggesting that the true population mean is significantly lower than the reference value. The extreme magnitude of the t-statistics and the narrow confidence interval reinforce the robustness of the finding, ruling out the null hypothesis with a high degree of certainty. These results show a systematic negative trend in the variable analyzed, which has relevant implications for the theoretical and applied interpretation of the phenomenon under study.
The differences observed between the indicators reflect the methodological diversity in the assessment of entrepreneurs’ expectations regarding the adoption of data-driven approaches to business process management. While the simple coefficient of expectations (
Ces) is characterized by a more elementary discrimination, based on the dichotomy of ascent–decline without incorporating the degrees of intensity, the coefficient based on the relative proportion of steps (
Cepr) offers a more nuanced analysis by weighing the distribution of responses along the various steps. This methodological distinction allows a more precise capture of the richness of perceptions in each sector, thus explaining the variations detected in the coefficients between sectors and providing a more robust interpretative framework to understand the underlying dynamics in the adoption of data-driven approaches to business process management. The results of the marked steps expressing the adoption expectations were correlated with the indicators calculated: as results of the application of the survey on knowledge about BPM and data-driven approaches (CD-BPM) and current use of data-driven approaches (UA-BPM); the variables related to entrepreneur characteristics (experience); and business results (sales) (see
Table 10).
The table presents the bivariate correlation matrix between the variables related to the adoption of data-driven approaches to business process management and the selected business indicators. Pearson correlation coefficients are indicated next to the significance levels, where ** denotes significance at the 0.01 level (p < 0.01) and * at the 0.05 level (p < 0.05). The variable Expectations show positive and statistically significant correlations with all other variables: with Total Sales (r = 0.217), with Years of Experience as an Entrepreneur (r = 0.333), and with Knowledge of Data-Driven Approaches (r = 0.256), all at p < 0.01. The correlation with Current Use of Data-Driven Approaches, although also significant (r = 0.076, p < 0.01), is of a lower magnitude. This indicates that higher step positioning (a higher position on the scale) is associated with higher sales, more experience, and more knowledge about these approaches, although its relationship with current use is less pronounced. However, although there is a positive relationship in the correlations found, these are weak, indicating that other factors such as financial resources, organizational culture, and resistance to change could be playing a more important role in the formation of these expectations.
In particular, the relationship between knowledge and expectations can be quite complex. In general, as entrepreneurs’ knowledge about data-driven approaches to business process management increases, expectations tend to increase as well, but the relationship can have different nuances depending on the context.
Realistic expectations: As knowledge about something increases, more realistic expectations develop. That is, the more one knows, the more aware one tends to be of the difficulties, limitations, and nuances that may arise in a situation. In this sense, knowledge can help to have more precise and well-founded expectations.
Higher expectations: On the other hand, in certain cases, increased knowledge can lead to higher expectations. Having more knowledge of data-driven approaches to business process management can lead to expecting to achieve better results since one has greater confidence in one’s own capabilities and in the tools available.
To assess the nuances of the correlations found, the correlation between expectations and knowledge of data-driven approaches to business process management by economic sector was calculated (see
Table 11).
Table 11 explores the relationship between expectations of adoption of data-driven approaches to business process management and current knowledge of these tools, segmented by economic sector. The results indicate significant heterogeneity in the relationship between knowledge about data-driven approaches to business process management and adoption expectations, depending on the economic sector. In general, sectors with greater exposure to advanced technologies, such as manufacturing, services, and construction, showed positive and statistically significant correlations (
p < 0.05). In contrast, the agriculture, livestock, forestry, and fishing sectors did not present evidence of a significant relationship.
4.1. Analysis by Sector
Manufacturing (ρ = 0.396, p = 0.000). The manufacturing sector exhibited a moderate and positive correlation between knowledge about data-driven approaches to business process management and adoption expectations. This result suggests that, in this sector, higher knowledge about AI is associated with higher expectations about its implementation. The statistical significance (p = 0.000) supports the robustness of this relationship, which could reflect the increasing integration of digital technologies in industrial processes.
Services (ρ = 0.253, p = 0.000). In the services sector, the correlation was weak but positive and statistically significant. This indicates that, although knowledge about data-driven approaches to business process management influences adoption expectations, this relationship is less pronounced compared to other sectors. Given the larger sample size (N = 1022), the results are particularly reliable, highlighting the relevance of AI in customer-oriented and digitalized sectors.
Construction (ρ = 0.333, p = 0.005). The construction sector showed a moderate and positive correlation, like the manufacturing sector. The statistical significance (p = 0.005) suggests that knowledge about data-driven approaches to business process management has a notable impact on adoption expectations, possibly due to the growing interest in technologies such as automated construction and data-driven project management.
Trade (ρ = 0.181, p = 0.000). In the commerce sector, the correlation was weak but significant, indicating a limited relationship between knowledge about AI and adoption expectations. Despite the low magnitude of the correlation, the sample size (N = 651) ensures the reliability of the results. This could reflect a perception of the lower relevance of data-driven approaches to business process management in traditional commercial activities.
Agriculture, Livestock, Forestry, and Fishing (ρ = 0.109, p = 0.595). In this sector, the correlation was practically null and not significant, suggesting that knowledge about data-driven approaches to business process management has no clear impact on adoption expectations. This lack of relationships could be attributed to factors such as lower exposure to advanced technologies or the perception that data-driven approaches to business process management are not applicable to agricultural or livestock activities.
The findings underline the importance of knowledge about data-driven approaches to business process management as a key factor in shaping adoption expectations, although its impact varies by economic sector. Sectors such as manufacturing, services, and construction show greater sensitivity to this factor, probably due to their greater exposure to digital technologies and their ability to integrate innovative solutions. In contrast, the agricultural sector seems to be less influenced by knowledge about data-driven approaches to business process management, which could reflect structural or cultural barriers to the adoption of these technologies.
It is important to analyze the indicator perception of benefits of adopting data-driven approaches to business process management (PB-BPM).
Figure 4 shows the results, by economic sector, of the items evaluated in the applied survey.
The agriculture, livestock, forestry, and fisheries and trade sectors present less negative Cepr values (−0.367 and −0.374, respectively) and step means that, despite being in negative ranges (which generally indicates cautious expectations), can be interpreted together with the means of the statements (hypothetically higher) as indicating that these entrepreneurs tend to value positively the potential benefits of data integration (e.g., efficiency improvement, cost reduction, anticipation of problems, better customer understanding, and employee satisfaction).
Similarly, the barriers to the adoption of data-driven approaches to business process management (B-BPM) were assessed.
Figure 5 shows the results obtained.
The analysis of
Figure 5 reveals significant patterns in the distribution and intensity of barriers hindering the implementation of data-driven approaches to business process management across various economic sectors. Prioritizing these barriers by sector provides a crucial perspective for understanding the specific challenges each industry faces in its transition toward more digitalized management models.
The results indicate that the agricultural sector exhibits a notable prevalence of resource-related constraints, with lack of funding (3.80) emerging as the primary impediment, closely followed by organizational resistance to change (3.75). This configuration of barriers suggests that primary sector enterprises face fundamental difficulties in allocating resources for digital transformation initiatives, likely due to narrow operating margins and traditional organizational structures. In stark contrast, the manufacturing sector reports the lowest values across all evaluated categories, which could be interpreted as an indicator of greater digital maturity or a sectoral predisposition toward adopting data-driven technologies. However, even within this comparatively advanced sector, economic considerations—specifically the lack of financial resources (3.30) and the perception of high investment costs (3.25)—remain the most significant obstacles.
Particularly revealing is the case of the construction sector, which exhibits the highest levels of resistance across almost all analyzed dimensions. The extraordinarily high resistance to change (3.90) and the perception of excessively high investment requirements (3.95) suggest the presence of deeply entrenched structural barriers, potentially linked to long-established work methodologies and the sector’s characteristically fragmented value chains. The services sector presents a barrier configuration predominantly shaped by cultural and capability-related factors, with organizational resistance to change (3.55) ranking as the most significant challenge. This finding may reflect the inherent complexities of transforming knowledge-intensive processes that are highly dependent on human factors.
A cross-sectoral analysis reveals that financial constraints constitute a universal concern, consistently appearing among the top two barriers in all analyzed sectors. This common denominator suggests that, regardless of sectoral particularities, the perception of high investment requirements represents a fundamental obstacle to the digitalization of business processes in the current economic landscape.
Notably, concerns related to data security and privacy do not rank as the primary barrier in any of the examined sectors, with the sole exception of the trade sector, where they occupy the third position (3.65). This finding partially contradicts the prevailing narrative that cybersecurity concerns are the principal impediment to technological adoption and underscores the need to recalibrate intervention strategies to prioritize the identified economic and cultural barriers.
The significant intersectoral variability in the intensity and prioritization of barriers highlights the need for differentiated approaches to facilitate the adoption of data-driven methods, tailored to the specific characteristics of each sector. Policies and strategies aimed at promoting digital transformation should, consequently, acknowledge these sectoral divergences and design targeted support mechanisms to mitigate the most pressing barriers identified in each industry.
The construction sector, with a Cepr of −0.425 and a mean number of steps of −2.072, presents the most pronounced barriers to adoption, which is reflected in the means of the barrier items, which are the highest (for example, 3.90 in item 21 and values close to 3.90 in the others). This indicates that entrepreneurs in the construction sector perceive obstacles such as lack of resources, high investment in technology, and internal resistance to change in a very significant way.
The services and commerce sectors present moderate Cepr (−0.383 in services and −0.374 in trade) and mean steps that, although negative, are accompanied by intermediate values in the barriers (around 3.5 to 3.70). This suggests that, although there are difficulties, entrepreneurs in these sectors recognize barriers but to a lesser extent than in construction.
In the manufacturing industries sector, a Cepr of −0.378 and an average number of steps of −0.599 are observed. The manufacturing sector shows a less negative trend in the assessment of barriers, reflected in slightly lower means (around 3.10 to 3.30). This can be interpreted as meaning that, although barriers are recognized (for example, in training or investment), they are not perceived as intensely as in other sectors.
Finally, the agriculture, livestock, forestry, and fishing sector has Cepr values (−0.367) and an average number of steps (−3.500) that are in ranges comparable to commerce, presenting a perception of barriers around 3.65–3.80. This suggests that, despite certain challenges (such as investment in technology or training), entrepreneurs in this sector may be somewhat more familiar or convinced of the viability of implementing data-driven BPM, even though they recognize significant obstacles.
The result obtained from the adoption expectations could be analyzed for comparison by introducing some variables into the analysis. First, the result of the Kruskal–Wallis test is shown, indicating that the distribution of the variable “Steps” which contains the value of the steps marked in terms of expectations, differs significantly between the different economic sectors (
p = 0.000) (see
Figure 6).
Since the significance value is below the 0.05 threshold, the null hypothesis is rejected, suggesting that expectations for the adoption of data-driven approaches to business process management are not homogeneous across sectors. This difference may reflect variations in perception, level of readiness, or implementation of these approaches depending on the specific characteristics and needs of each industry. The analysis based on the Kruskal–Wallis test and pairwise comparisons between economic sectors reveal significant differences in the distribution of the variable studied (
Figure 7).
The average ranking shows that the sectors with the highest values are services (951.13) and trade (921.32), while construction (1078.76) and manufacturing (1183.43) have the lowest values, suggesting disparities in the variable analyzed. Pairwise comparisons confirm that, after correction for multiple testing, the only significant difference is between agriculture, livestock, forestry, and fishing and manufacturing (
p = 0.026), indicating that these sectors have remarkably different distributions. Without adjustment, statistically significant differences are observed in trade vs. manufacturing (
p < 0.001) and services vs. manufacturing (
p < 0.001), which shows that the manufacturing sector stands out in terms of the average ranking. However, comparisons such as agriculture vs. trade, trade vs. services, and construction vs. manufacturing do not show significant differences after correction. These findings suggest that the adoption of data-driven approaches to business process management is not homogeneous across sectors, with manufacturing showing the greatest divergence from the others and ranking as the sector with the lowest adoption expectations.
Table 12 provides an understanding of the above by showing the average of the steps that measure adoption expectations.
The observed heterogeneity highlights the need for differentiated sectoral approaches to understand and promote the adoption of data-driven approaches to business process management within the business management of the analyzed ventures.
Similarly, the Kruskal–Wallis test was developed to compare the distribution of the “Step of the Ladder” variable between different categories of company size and yields a significant value (
p = 0.000), indicating that there are statistically significant differences between the groups analyzed (See
Figure 8).
Since the p-value is less than the significance level of 0.05, the null hypothesis, which posited that the distributions were equal across all company size categories, is rejected. This suggests that company size influences the variable studied, evidencing differences in the way in which different company sizes are positioned on the evaluated scale.
The analysis of pairwise comparisons of company size, represented in the graph and table, evaluates whether the distributions of the business categories differ significantly (see
Figure 9).
The graph illustrates micro enterprises (average range: 873.17), small enterprises (1014.96), and medium-sized enterprises (1993.26), connected by lines indicating the comparisons made. In the table, the difference between micro enterprises and small enterprises presents a test statistic of −141.790 with a standard error of 25.848, resulting in a standardized statistic of −5.485 and an adjusted
p-value of 0.0000, indicating a statistically significant difference (α = 0.05). In contrast, the comparison between micro and medium-sized enterprises shows a test statistic of −220.094 with a standard error of 120.988, obtaining a standardized statistic of −1.819 and an adjusted
p-value of 0.207, implying that the difference is not significant. Similarly, the comparison between small and medium-sized enterprises yields a test statistic of −78.304, with a standard error of 120.304 and a standardized statistic of −0.651, obtaining an adjusted
p-value of 1.000, which shows the absence of significant differences between these categories. Consequently, it is concluded that there is a significant difference in the size distribution between micro and small enterprises, while no statistically significant differences are found between small and medium-sized enterprises, nor between micro and medium-sized enterprises. These results suggest that micro enterprises display differentiated behavior compared to other categories, but no significant differences can be established between small and medium-sized enterprises in terms of the criterion analyzed.
Table 13 shows the averages of the steps of expectations that corroborate the results discussed above.
The above shows that micro enterprises are becoming more optimistic in their expectations of adopting data-driven approaches to business process management.
4.2. Summary of Key Findings
To enhance clarity, the key findings are summarized below:
General adoption expectations: Expectations for adopting data-driven BPM in MSMEs are predominantly negative (Cepr = −0.383); while there is no outright rejection, entrepreneurs show skepticism and caution regarding the implementation of these tools; and the low polarization index (PI = 0.05) indicates that most respondents share similar perceptions.
Sectoral differences: Manufacturing (−0.159) and construction (−0.536) exhibit the most negative expectations, citing high implementation costs and resistance to change; agriculture (−0.367) and trade (−0.374) have less negative expectations, as they recognize benefits such as personalization and operational efficiency; and services (−0.665) presents an intermediate stance, with concerns about organizational adaptation.
Influence of firm size: Micro enterprises (−3.9554) show the highest resistance to adoption, due to resource and knowledge limitations: small enterprises (−2.0168) exhibit greater openness, possibly due to better access to digital tools; and medium enterprises (−1.1429) are the most optimistic, suggesting that larger businesses perceive a greater strategic value in data-driven BPM.
Key correlations: Greater knowledge of data-driven BPM → higher adoption expectations (ρ = 0.256, p < 0.01); more entrepreneurial experience → greater willingness to adopt (ρ = 0.333, p < 0.01); higher revenue → higher acceptance of data-driven BPM (ρ = 0.217, p < 0.01); and current use of data-driven BPM does not guarantee positive future expectations (ρ = 0.076, p < 0.01), indicating potential implementation challenges.
Main barriers to adoption: Technological and infrastructure limitations: many MSMEs lack adequate tools; financial constraints: high implementation costs hinder adoption; lack of training: a shortage of analytical skills among entrepreneurs; organizational resistance: traditional business structures reject change; and data quality issues: incomplete or inconsistent information affects decision making.
Contributions of the study: Sectoral differences: not all MSMEs face the same barriers to adoption; impact of firm size: micro enterprises face more difficulties than medium-sized firms; role of knowledge: familiarity with data-driven BPM improves adoption perceptions; and disconnect between current use and future expectations: having experience with BPM does not guarantee an optimistic view of its long-term impact.
4.3. Contributions to the Field
The study provides novel insights into MSME expectations regarding DD-BPM adoption, shedding light on both enabling factors and barriers that influence implementation. Key contributions include: sector-specific insights: prior research has largely treated MSMEs as a homogenous group, but this study reveals significant sectoral disparities in adoption expectations; impact of firm size: unlike previous studies that focus on large enterprises, our findings show that micro enterprises face disproportionately higher adoption barriers; knowledge as a key enabler: the study confirms that familiarity with DD-BPM strongly influences adoption expectations, reinforcing the need for education and training programs; and disconnect between current use and future expectations: while some MSMEs are already using data-driven BPM, their expectations remain lukewarm, indicating potential implementation inefficiencies.
5. Discussion
This study highlights the critical role of expectations in the adoption of data-driven business process management (DD-BPM) within MSMEs, emphasizing how sectoral characteristics, firm size, and knowledge influence perceptions. The findings reveal a disconnect between current DD-BPM users and their future adoption expectations, suggesting inefficiencies in implementation. Sectoral differences underscore the need for industry-specific strategies, as manufacturing and construction face significant cost and complexity barriers, while trade and agriculture recognize customer-related benefits but remain hesitant. Additionally, this research provides empirical validation for the role of financial and organizational barriers, reaffirming that resource constraints remain a primary challenge for MSME digital adoption. By bridging gaps in literature and expanding the discourse on MSME digital transformation, this study offers valuable insights for policymakers and industry leaders to design targeted interventions that facilitate a smoother transition to data-driven BPM.
The results presented in the study on MSME owners’ adoption expectations of data-driven approaches to business process management (DD-BPM) reveal a nuanced landscape of perceptions, challenges, and opportunities. These findings align with and extend prior research into several key areas, offering insights into the psychological, organizational, and sectoral factors influencing DD-BPM adoption.
The study highlights that expectations play a dual role in the adoption of DD-BPM: they can either drive innovation and competitiveness or lead to resistance and underutilization. This finding resonates with earlier studies such as those by Gupta et al. [
44], who emphasized that pre-adoption expectations significantly shape post-adoption satisfaction and continuance intentions. The negative trend in expectations observed in this study (
Cepr = −0.383) suggests that many MSME owners approach DD-BPM with caution, likely due to perceived risks, resource constraints, or limited understanding of its benefits. This cautious stance is consistent with Cantú Alejandro and Güemes-Castorena’s work [
49], which noted that trust and distrust coexist during the adoption of emerging technologies, often leading to mixed perceptions.
However, the study also reveals that not all sectors exhibit uniform pessimism. For instance, the manufacturing and construction sectors show higher correlations between knowledge of DD-BPM and positive expectations (
ρ = 0.396 and
ρ = 0.333, respectively). This variation underscores the importance of sector-specific contexts, as highlighted by Faiz et al. [
22], who identified that digital technology adoption determinants differ across industries. The relatively lower expectations in sectors like agriculture, livestock, silviculture, and fishing (
ρ = 0.109,
p = 0.595) may reflect structural barriers, such as limited exposure to advanced technologies or skepticism about their applicability.
The Kruskal–Wallis test results indicate significant differences in adoption expectations across economic sectors, particularly between manufacturing and other sectors. This heterogeneity aligns with Tawil et al.’s findings [
7], which emphasize that SMEs face unique challenges depending on their industry context. For example, manufacturing firms, which are more likely to have prior experience with technological integration, exhibit fewer negative expectations compared to sectors like construction, where high costs and resistance to change are perceived as major barriers.
The divergence of expectations across sectors can be interpreted through the perspective of Venkatesh et al. [
38] using the unified theory of acceptance and use of technology (UTAUT). According to the UTAUT, performance expectancy and effort expectancy are critical drivers of technology adoption. In this study, sectors with higher familiarity with data-driven tools (e.g., manufacturing and services) report more optimistic expectations, suggesting that these enterprises perceive greater alignment between DD-BPM capabilities and their operational needs. Conversely, sectors with limited technological exposure may struggle to envision how DD-BPM could address their specific challenges, leading to lower expectations.
The analysis of firm size reveals that micro enterprises (−3.9554 mean steps) exhibit more negative expectations than small (−2.0168) and medium-sized enterprises (−1.1429). This finding echoes Perdana et al.’s [
4] observation that resource constraints, including financial and human capital limitations, disproportionately affect smaller firms’ ability to adopt data-driven solutions. Micro enterprises, despite their agility, may lack the infrastructure and expertise required to implement DD-BPM effectively, resulting in heightened skepticism.
Interestingly, the absence of significant differences between small and medium-sized enterprises suggests that, once a certain threshold of resources and capabilities is reached, firm size becomes less influential in shaping expectations. This insight aligns with Carillo et al.’s [
13] argument that fostering a culture of data-driven decision making is crucial for overcoming size-related barriers.
The weak but statistically significant correlation between knowledge of DD-BPM and expectations (r = 0.256,
p < 0.01) supports Ledesma-Chaves et al.’s [
47] assertion that increased awareness can lead to more realistic or elevated expectations. However, the strength of this relationship varies by sector, with manufacturing showing the strongest correlation (
ρ = 0.396,
p = 0.000). This variability suggests that, while knowledge is a critical factor, its impact is mediated by contextual elements such as industry norms, technological readiness, and leadership commitment.
The study identifies key barriers to DD-BPM adoption, including lack of resources, high investment costs, and internal resistance to change. These findings corroborate Susanty et al.’s [
22] profiling of SME readiness, which highlighted similar obstacles. Notably, the construction sector reports the highest perceived barriers, reflecting the complexity and cost-intensive nature of implementing data-driven solutions in this field.
On the other hand, sectors like agriculture and trade demonstrate a stronger recognition of potential benefits, such as improved efficiency and customer understanding. This dichotomy between perceived barriers and benefits mirrors Justy et al.’s [
23] exploration of drivers and barriers to data analytics adoption in SMEs, emphasizing the need for tailored strategies to address sector-specific concerns.
The study’s findings carry significant implications for both practitioners and policymakers. Given the sectoral heterogeneity in expectations, interventions should be customized to address the unique needs and challenges of each industry; for example, manufacturing firms might benefit from advanced training programs, while agriculture-focused initiatives could emphasize practical applications of DD-BPM. Enhancing knowledge and skills related to DD-BPM is essential for shifting expectations from negative to positive, with policymakers supporting this through subsidies, workshops, and partnerships with technology providers. As noted by Wang and Zhang [
5], fostering a digital culture and ensuring leadership alignment are pivotal for successful DD-BPM adoption, necessitating that organizations invest in change management practices to mitigate resistance and build trust. Additionally, micro enterprises require targeted support to overcome resource constraints, with collaborative platforms or shared services potentially enabling smaller firms to access DD-BPM tools without bearing prohibitive costs.
While this study provides valuable insights, several avenues for future research emerge. To overcome its limitations and further explore causal relationships between expectations and adoption behavior, various directions are proposed. Longitudinal studies, such as that of Saeed et al. [
52], could track how initial expectations evolve over time and influence DD-BPM adoption, offering insights into the long-term dynamics of this process. Additionally, investigating how cultural factors shape expectations and adoption behaviors across different regions would enhance the understanding of global trends. Methodologically, additional analyses, such as multiple regression models or mediation/moderation analysis, could be conducted to uncover deeper insights and refine the understanding of key relationships within the data. Experimental designs or controlled interventions could help establish causal links by assessing the impact of specific factors on expectations and adoption behaviors. Finally, structural equation modeling (SEM) could be employed to analyze complex causal relationships among multiple variables, providing a more comprehensive perspective on the adoption process. These research directions build upon this study’s findings while addressing its methodological constraints [
59].
Although this study primarily examined the adoption of data-driven business process management (BPM) in MSMEs, it did not explore in depth the role of artificial intelligence (AI) and machine learning (ML) in process automation. These technologies represent a natural progression in BPM, offering enhanced decision-making capabilities, efficiency, and scalability. However, their adoption in MSMEs remains constrained by technological infrastructure limitations, financial restrictions, and the need for specialized expertise. While our findings highlight existing barriers to data-driven BPM, future research should examine how AI and ML could further enhance BPM adoption in resource-constrained enterprises. This includes investigating the feasibility of intelligent automation in MSMEs, assessing its impact on process optimization, and identifying the organizational and technical conditions necessary for successful implementation [
60,
61,
62].
Future studies could also explore how DD-BPM interacts with other innovations, such as artificial intelligence and blockchain, to create synergistic effects. Finally, developing more granular metrics to capture the multidimensional nature of expectations could enhance the precision of future analyses.
6. Conclusions
The analysis of expectations regarding the adoption of data-driven approaches to business process management reveals significant sectoral heterogeneity that not only challenges traditional models of technology adoption but also raises fundamental questions about the structural, organizational, and cultural factors shaping the perception of technological change in micro, small, and medium-sized enterprises (MSMEs).
The manufacturing sector emerges as a paradigmatic case. Despite exhibiting moderately negative expectations overall, it shows the strongest positive correlation between knowledge of data-driven business process management (DD-BPM) and predisposition toward its adoption. This finding suggests that technical knowledge and prior exposure to digital tools play a crucial role in shaping more favorable expectations. In this sense, the manufacturing sector not only represents fertile ground for digital transformation but also embodies a model of technological transition where education and training emerge as key determinants.
In contrast, the service sector raises a crucial question: Could the intangible nature of services, along with their inherent dependence on human and subjective factors, act as an additional barrier to the integration of data-driven approaches? Although this sector shows a positive correlation between knowledge and expectations, this relationship is less pronounced than in manufacturing. This contrast invites further exploration into how the inherent characteristics of each sector influence the perception and adoption of emerging technologies, opening new lines of research into the adaptability of DD-BPM approaches to specific contexts.
On the other hand, the construction sector positions itself as the most skeptical regarding the adoption of these methodologies. With the most negative coefficient of expectations based on the relative proportion of steps (Cepr) among all sectors, the construction industry exhibits a combination of low expectations and significantly higher perceived barriers. Resistance to change, the perception of excessive investment, and the lack of specialized training seem to erect a difficult barrier to overcome. However, this same context turns the construction sector into an ideal laboratory for analyzing strategies to overcome barriers in sectors traditionally resistant to digitalization.
In an interesting contrast, the agricultural, livestock, forestry, and fishing sectors present cautious expectations but with a relatively high valuation of the potential benefits of DD-BPM approaches. Despite the low correlation between knowledge and expectations in this sector, entrepreneurs seem to recognize the usefulness of these approaches for optimizing processes and reducing costs. This sector could become a space for accelerated adoption if more effective technology diffusion strategies were designed.
Finally, the commercial sector finds itself at a crossroads. Its negative expectations, though not extreme, reflect significant perceived barriers that are not insurmountable. The modest but positive correlation between knowledge and predisposition toward adoption suggests latent potential that could be unlocked through strategic interventions.
These findings invite a rethinking of theoretical models of technology adoption and a deeper exploration of the sectoral dynamics that shape business predisposition to change. The observed heterogeneity not only highlights the need for differentiated approaches for each sector but also underscores the urgency of capacity-building, financing, and public policy strategies that facilitate the transition toward a more informed and data-driven business management approach.
This study contributes to the broader BPM and digital transformation literature by offering a comprehensive, sector-specific, and size-based analysis of MSME adoption expectations, an area that remains underexplored in existing research. Unlike prior studies that focus primarily on large enterprises, this research provides empirical evidence of the unique constraints and opportunities within MSMEs, shedding light on the role of knowledge gaps, financial barriers, and organizational resistance in shaping digital adoption. Furthermore, the study’s mixed-method approach—combining expectations measurement with correlation analysis and sectoral comparisons—offers a multidimensional perspective, strengthening its validity. By identifying key disparities in adoption expectations across industries and firm sizes, this study not only aligns with but also extends theoretical models like TOE and expectation-based adoption frameworks, providing actionable insights for future research and policy interventions aimed at supporting MSMEs in their transition to data-driven BPM.


 ,
, 
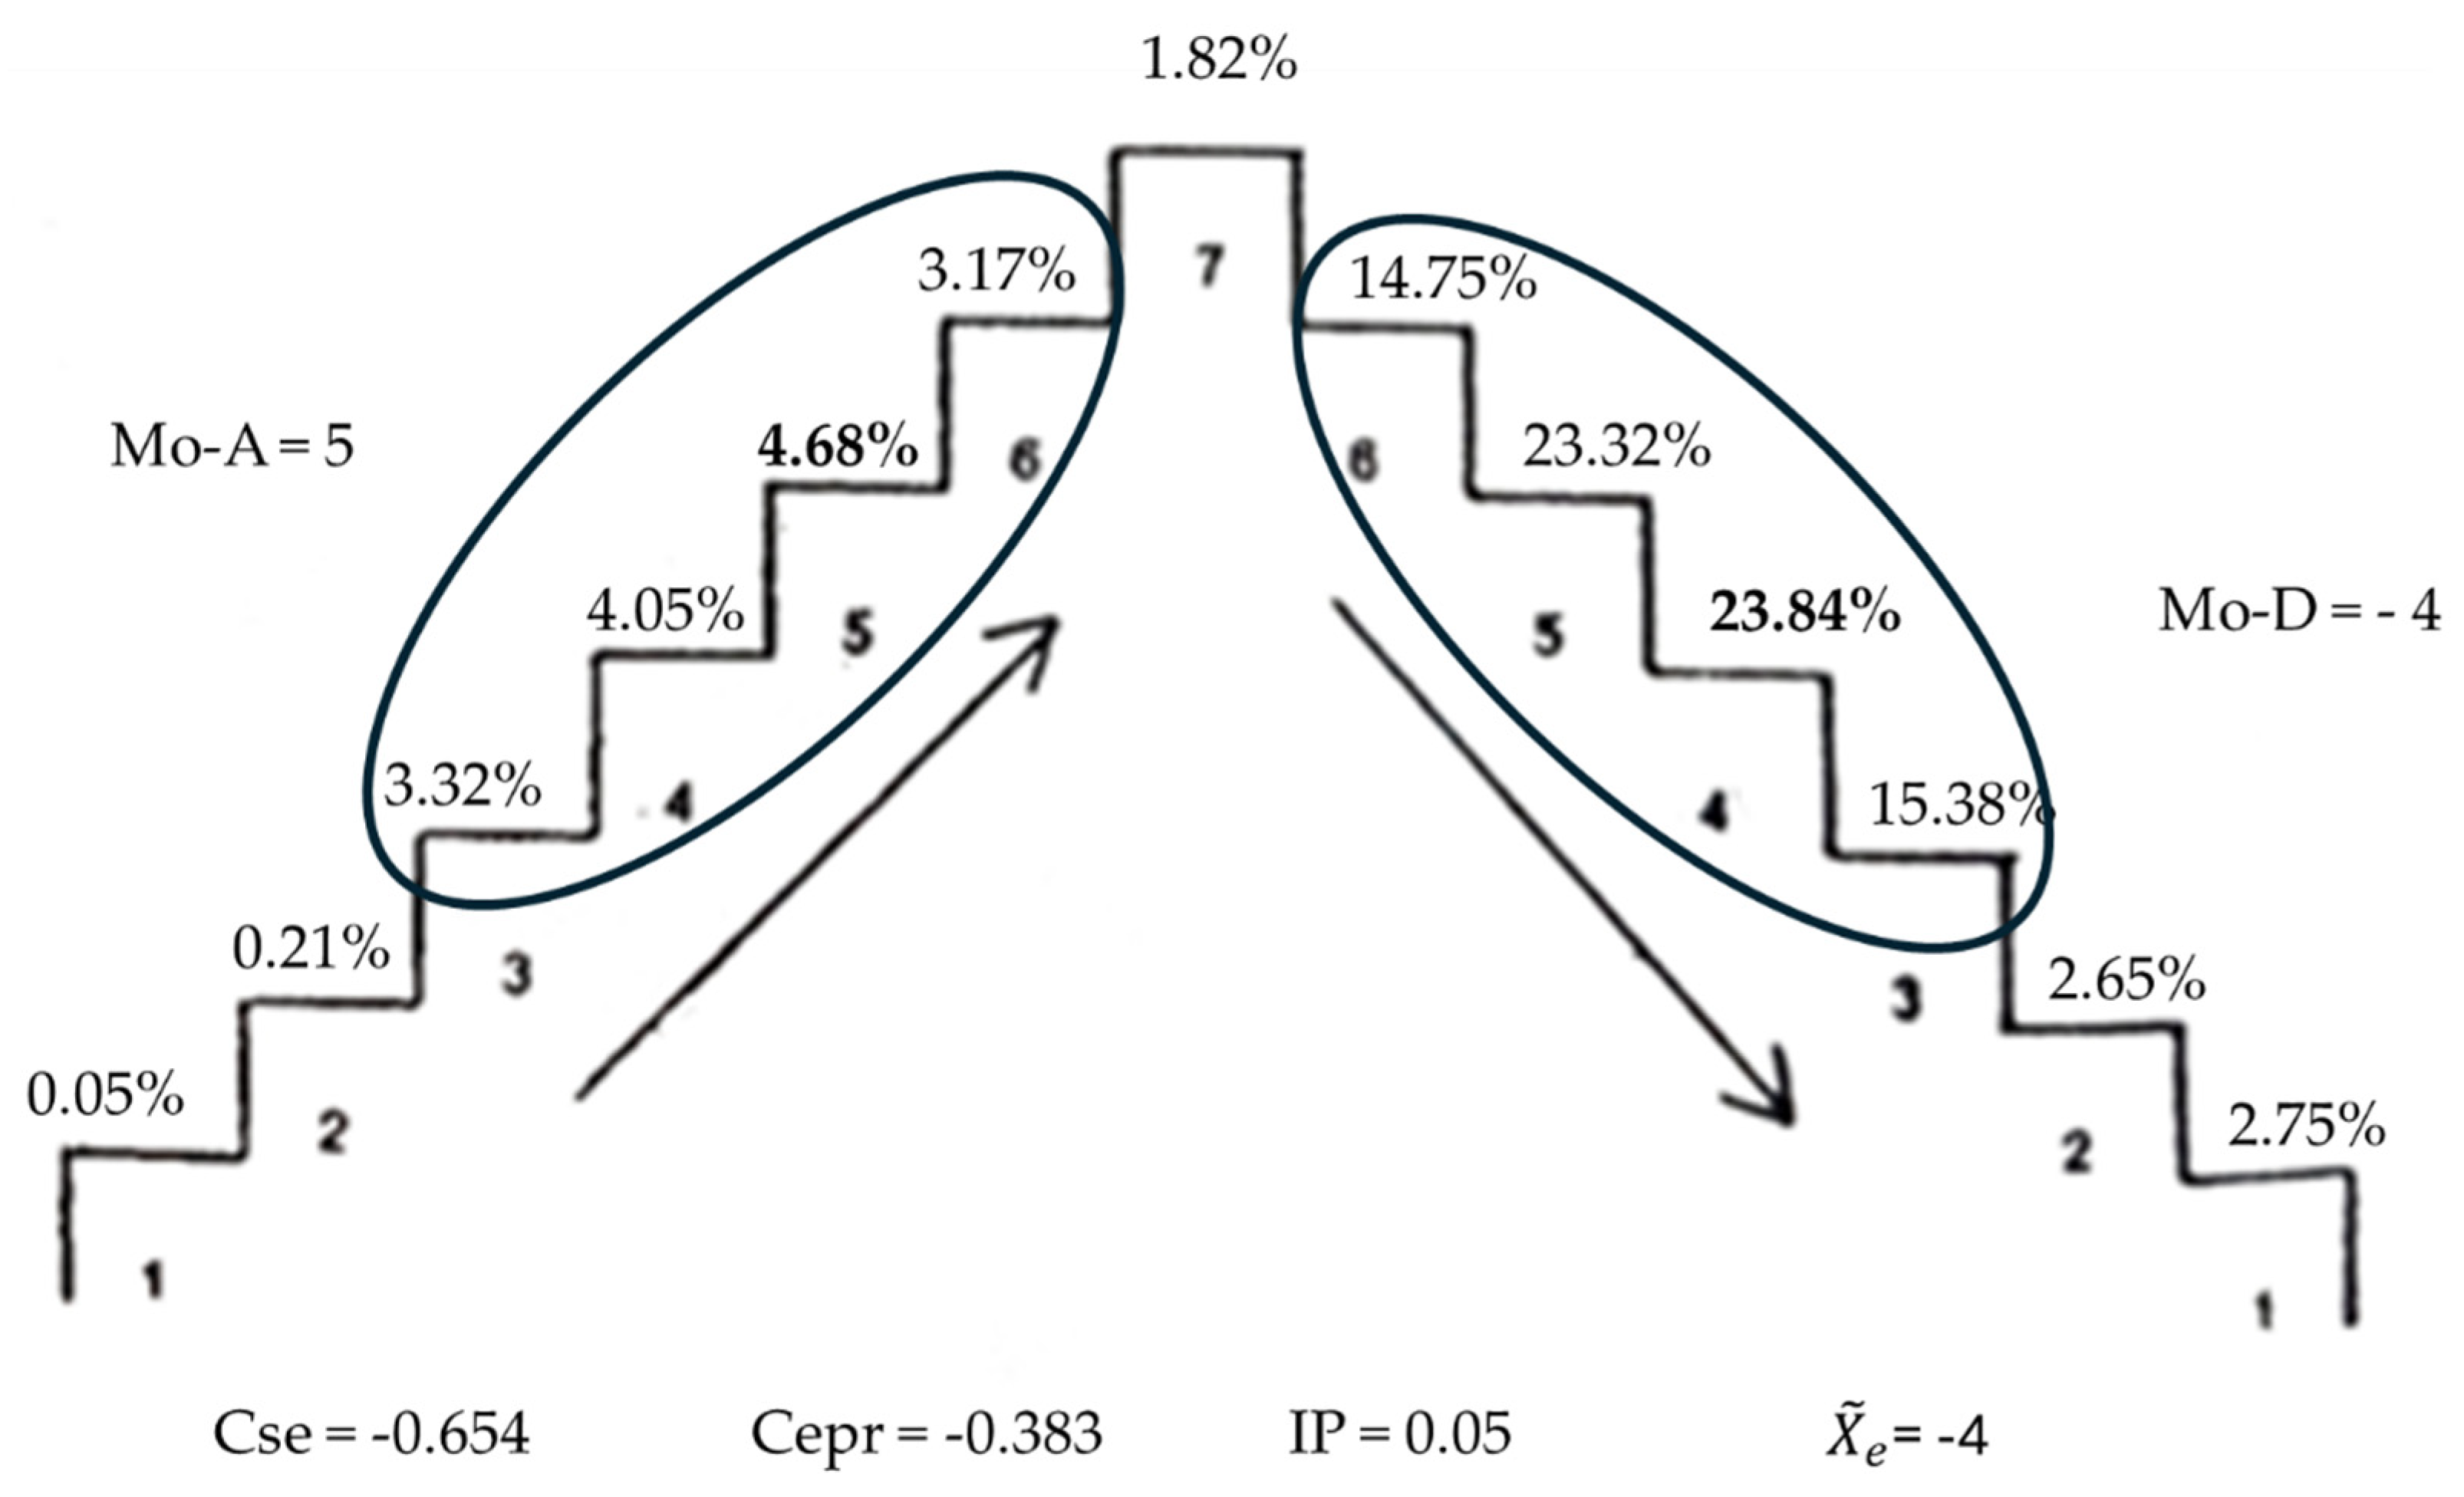
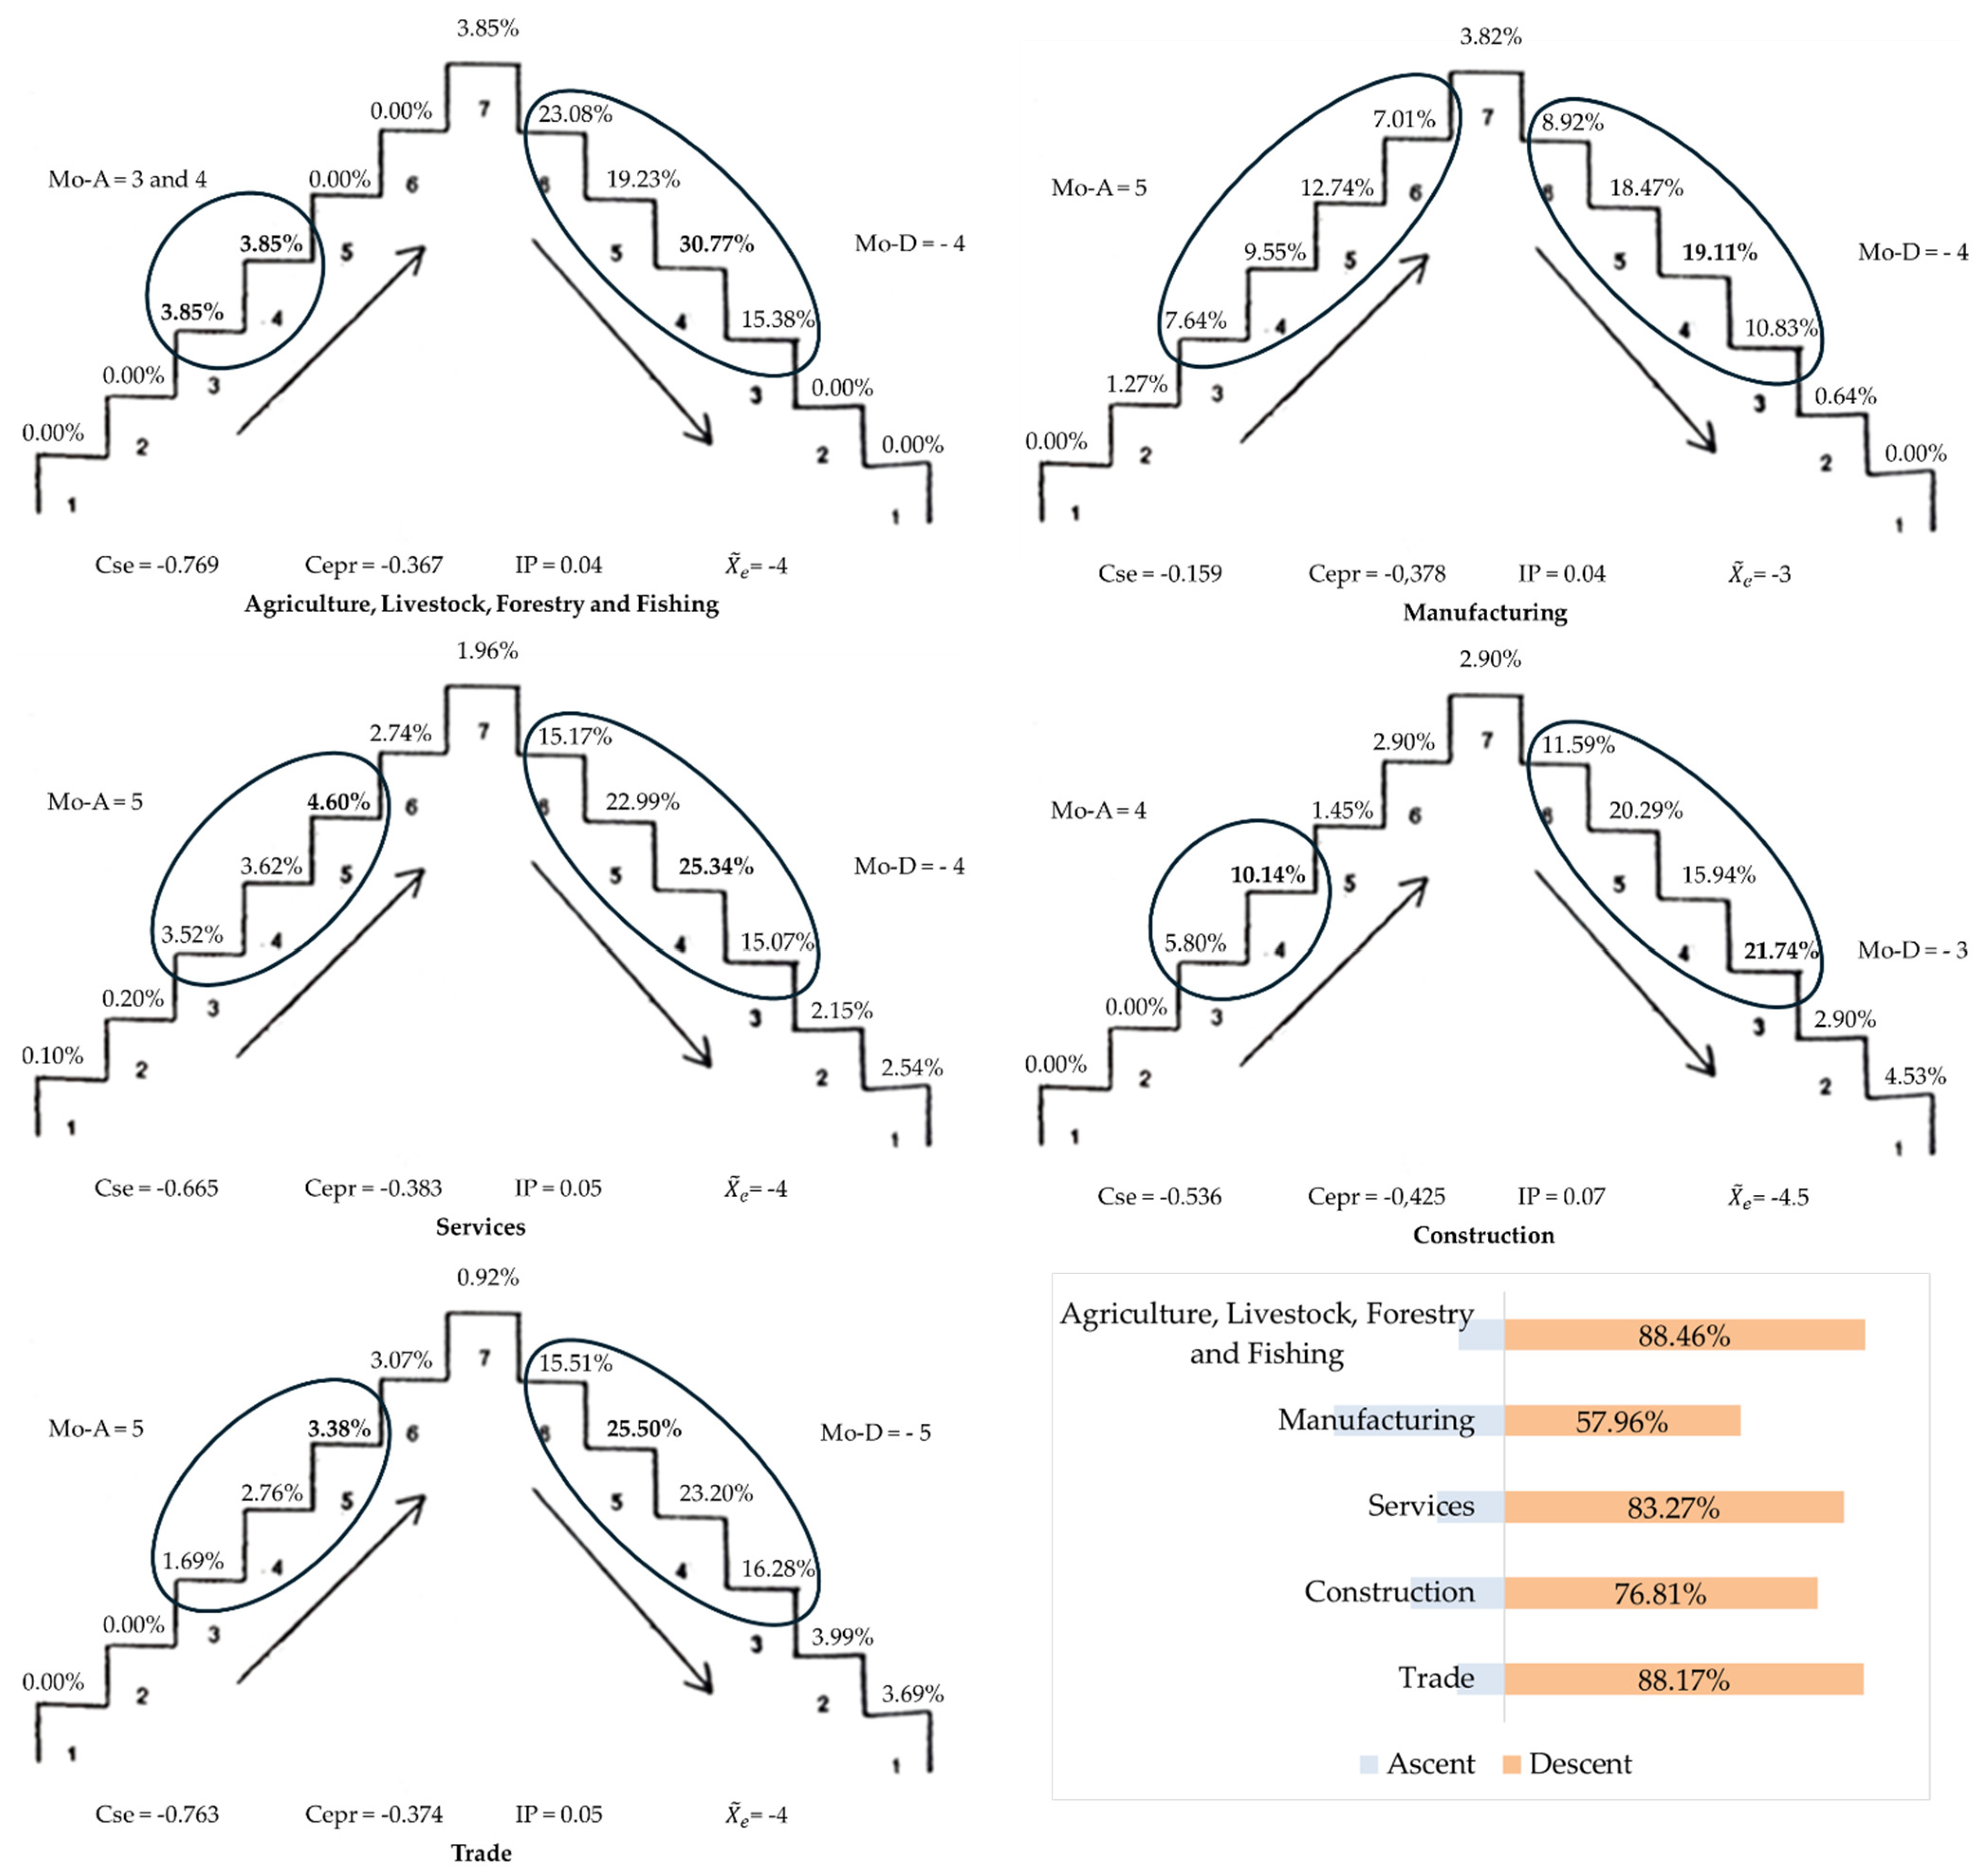
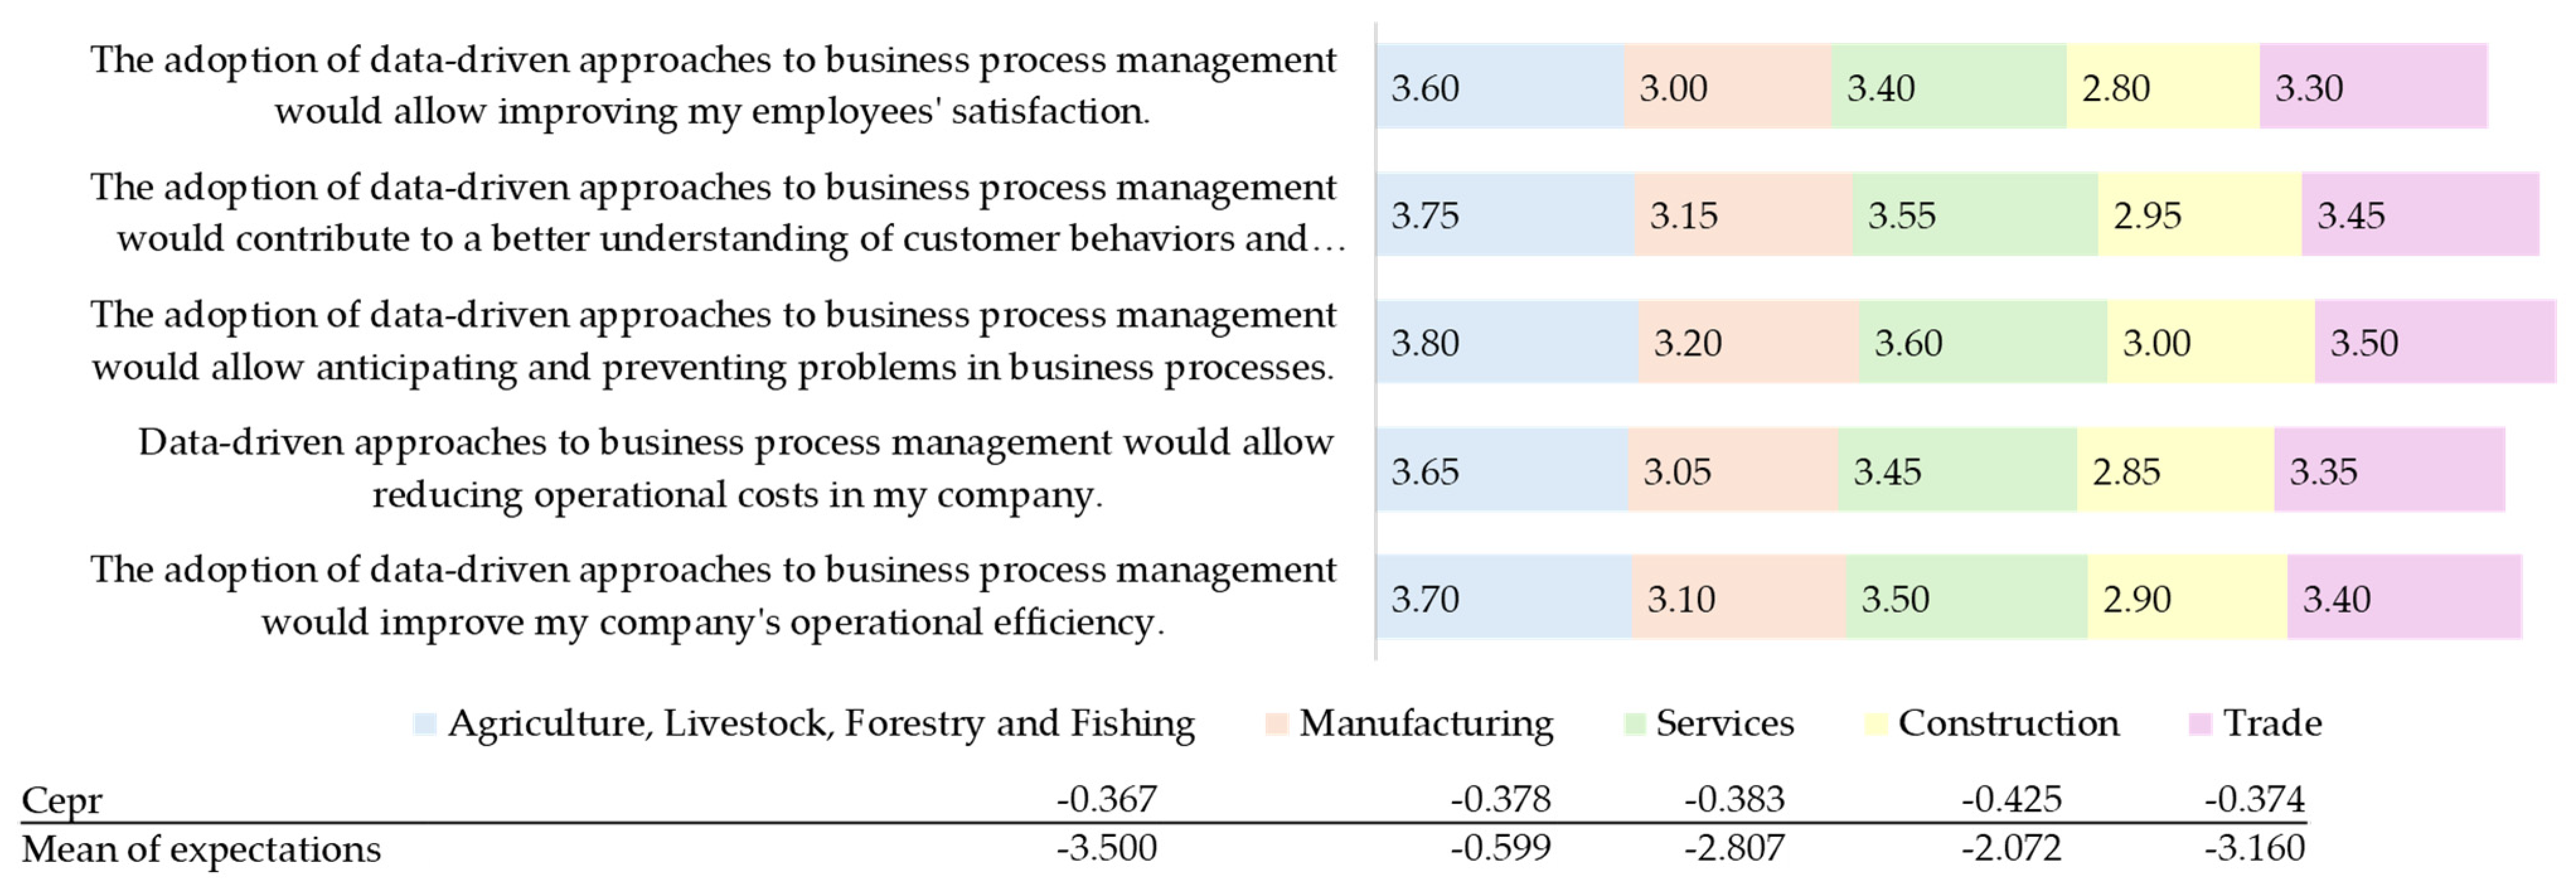
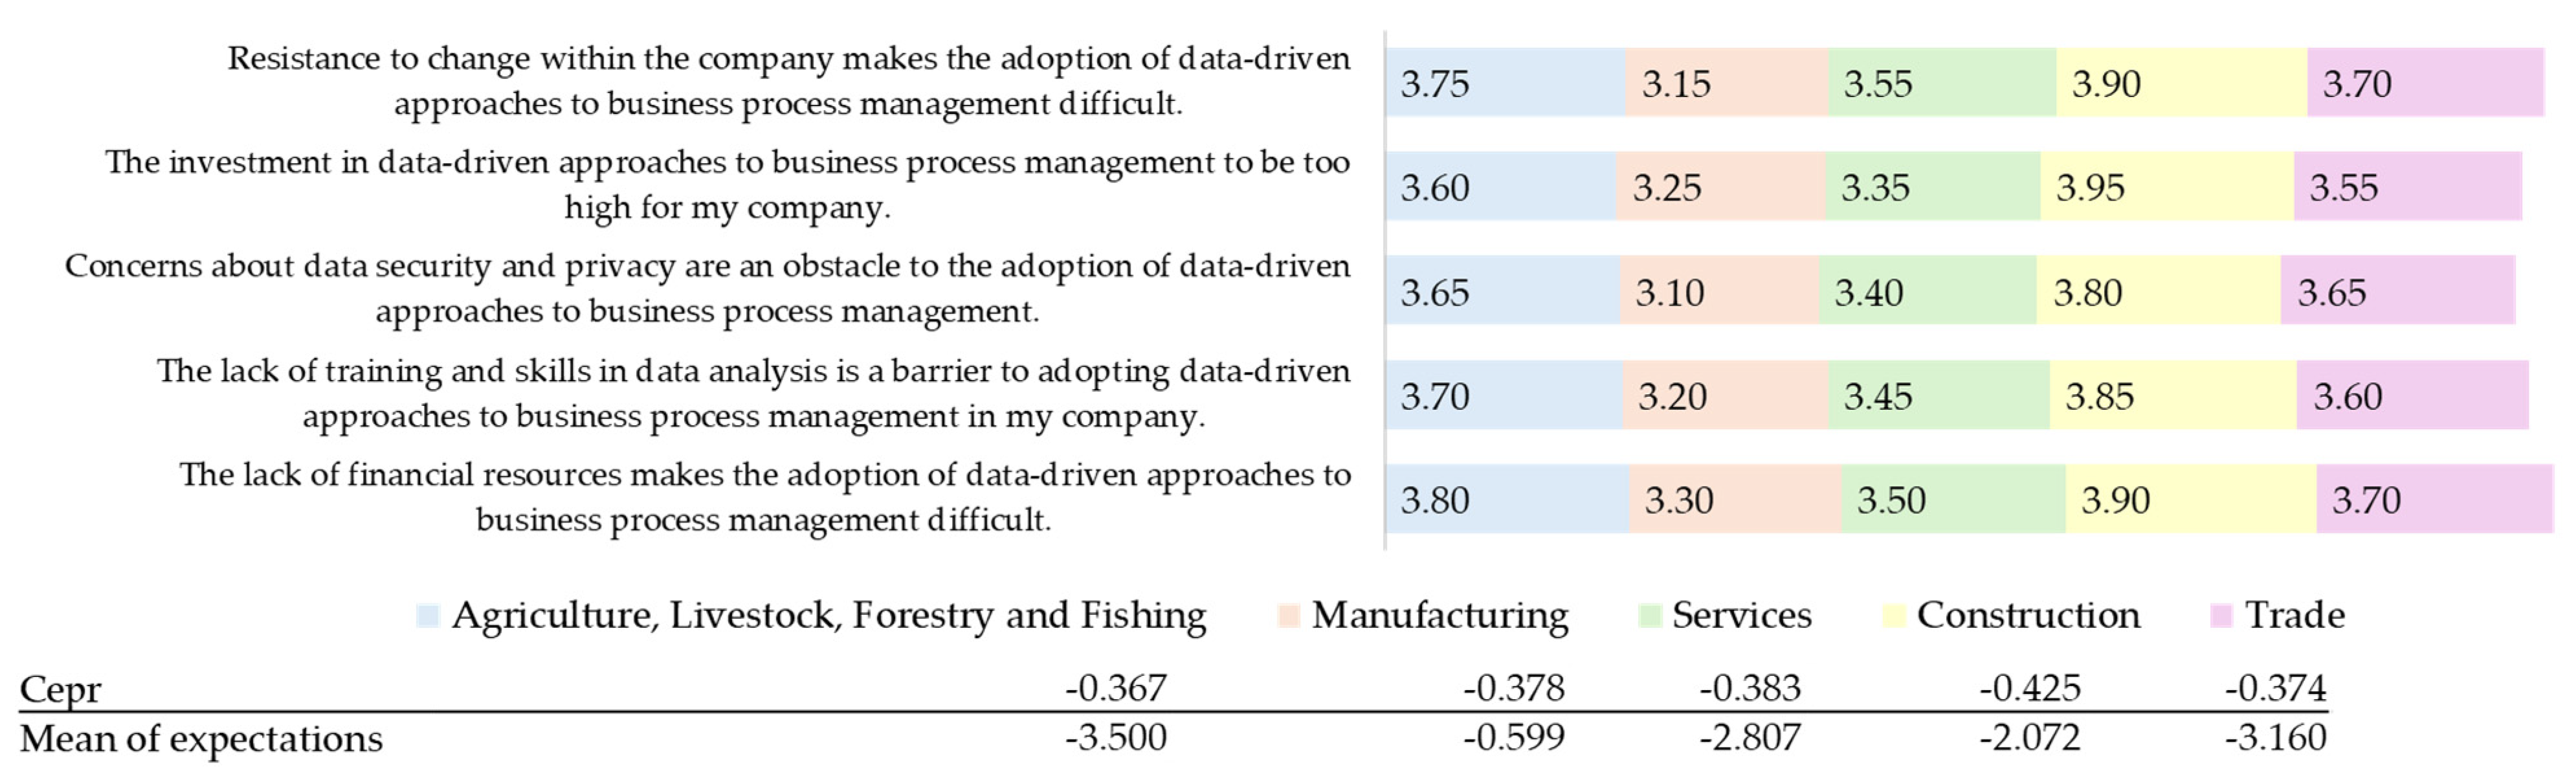
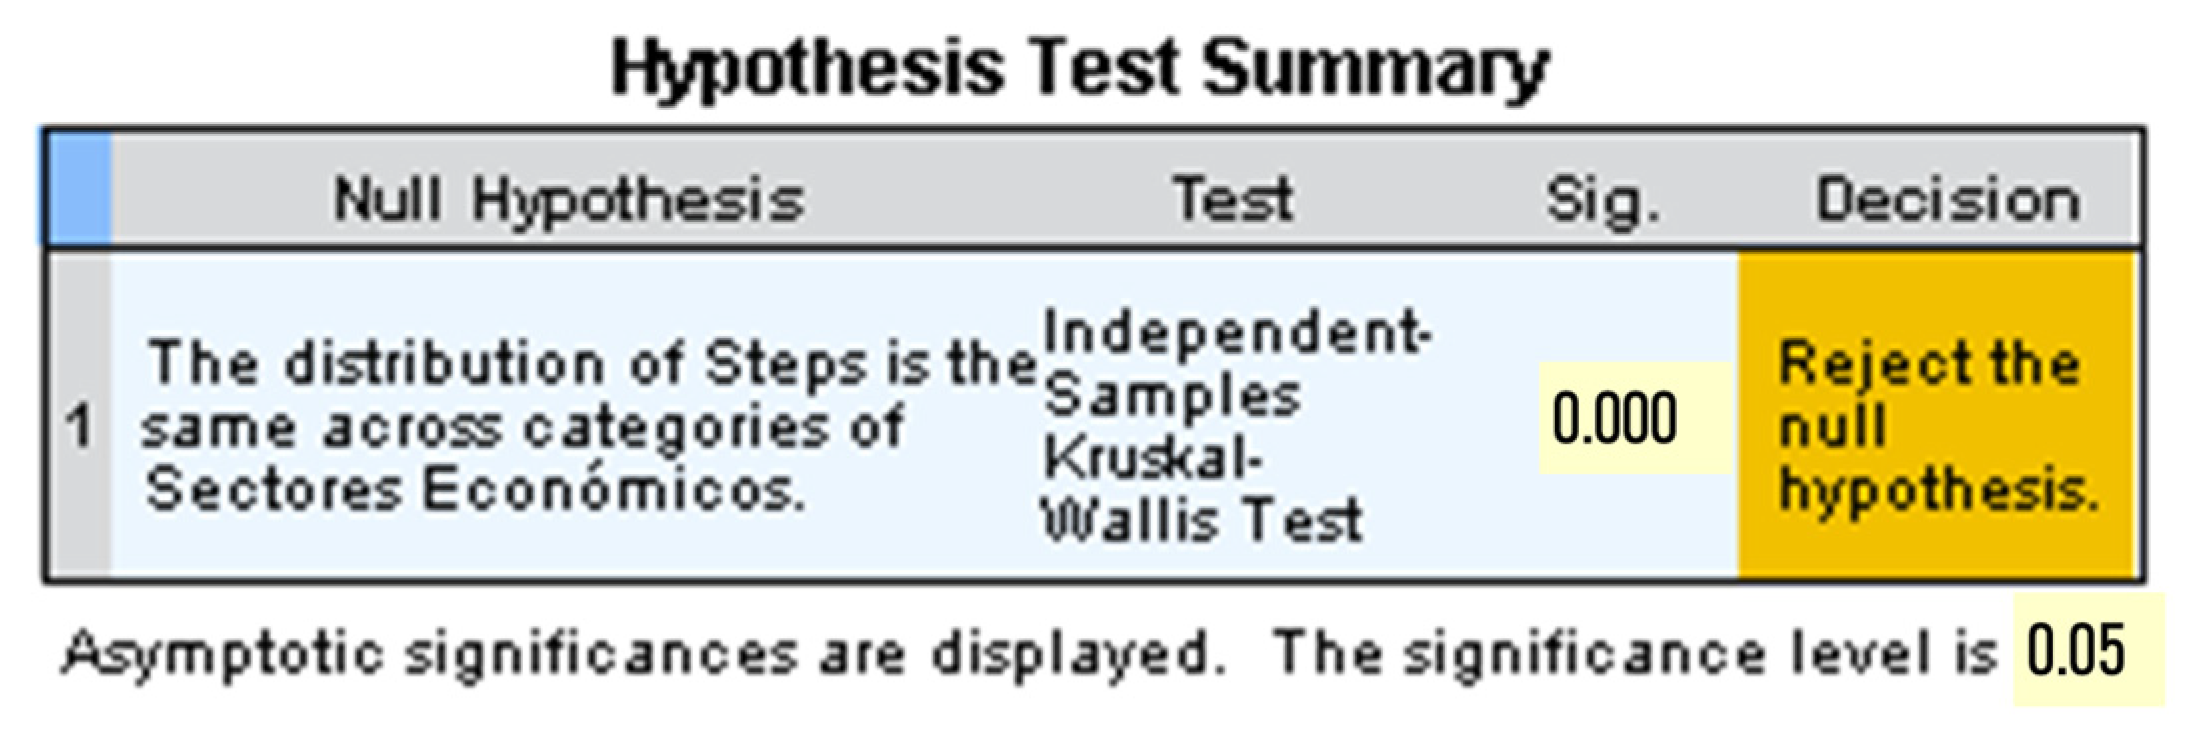
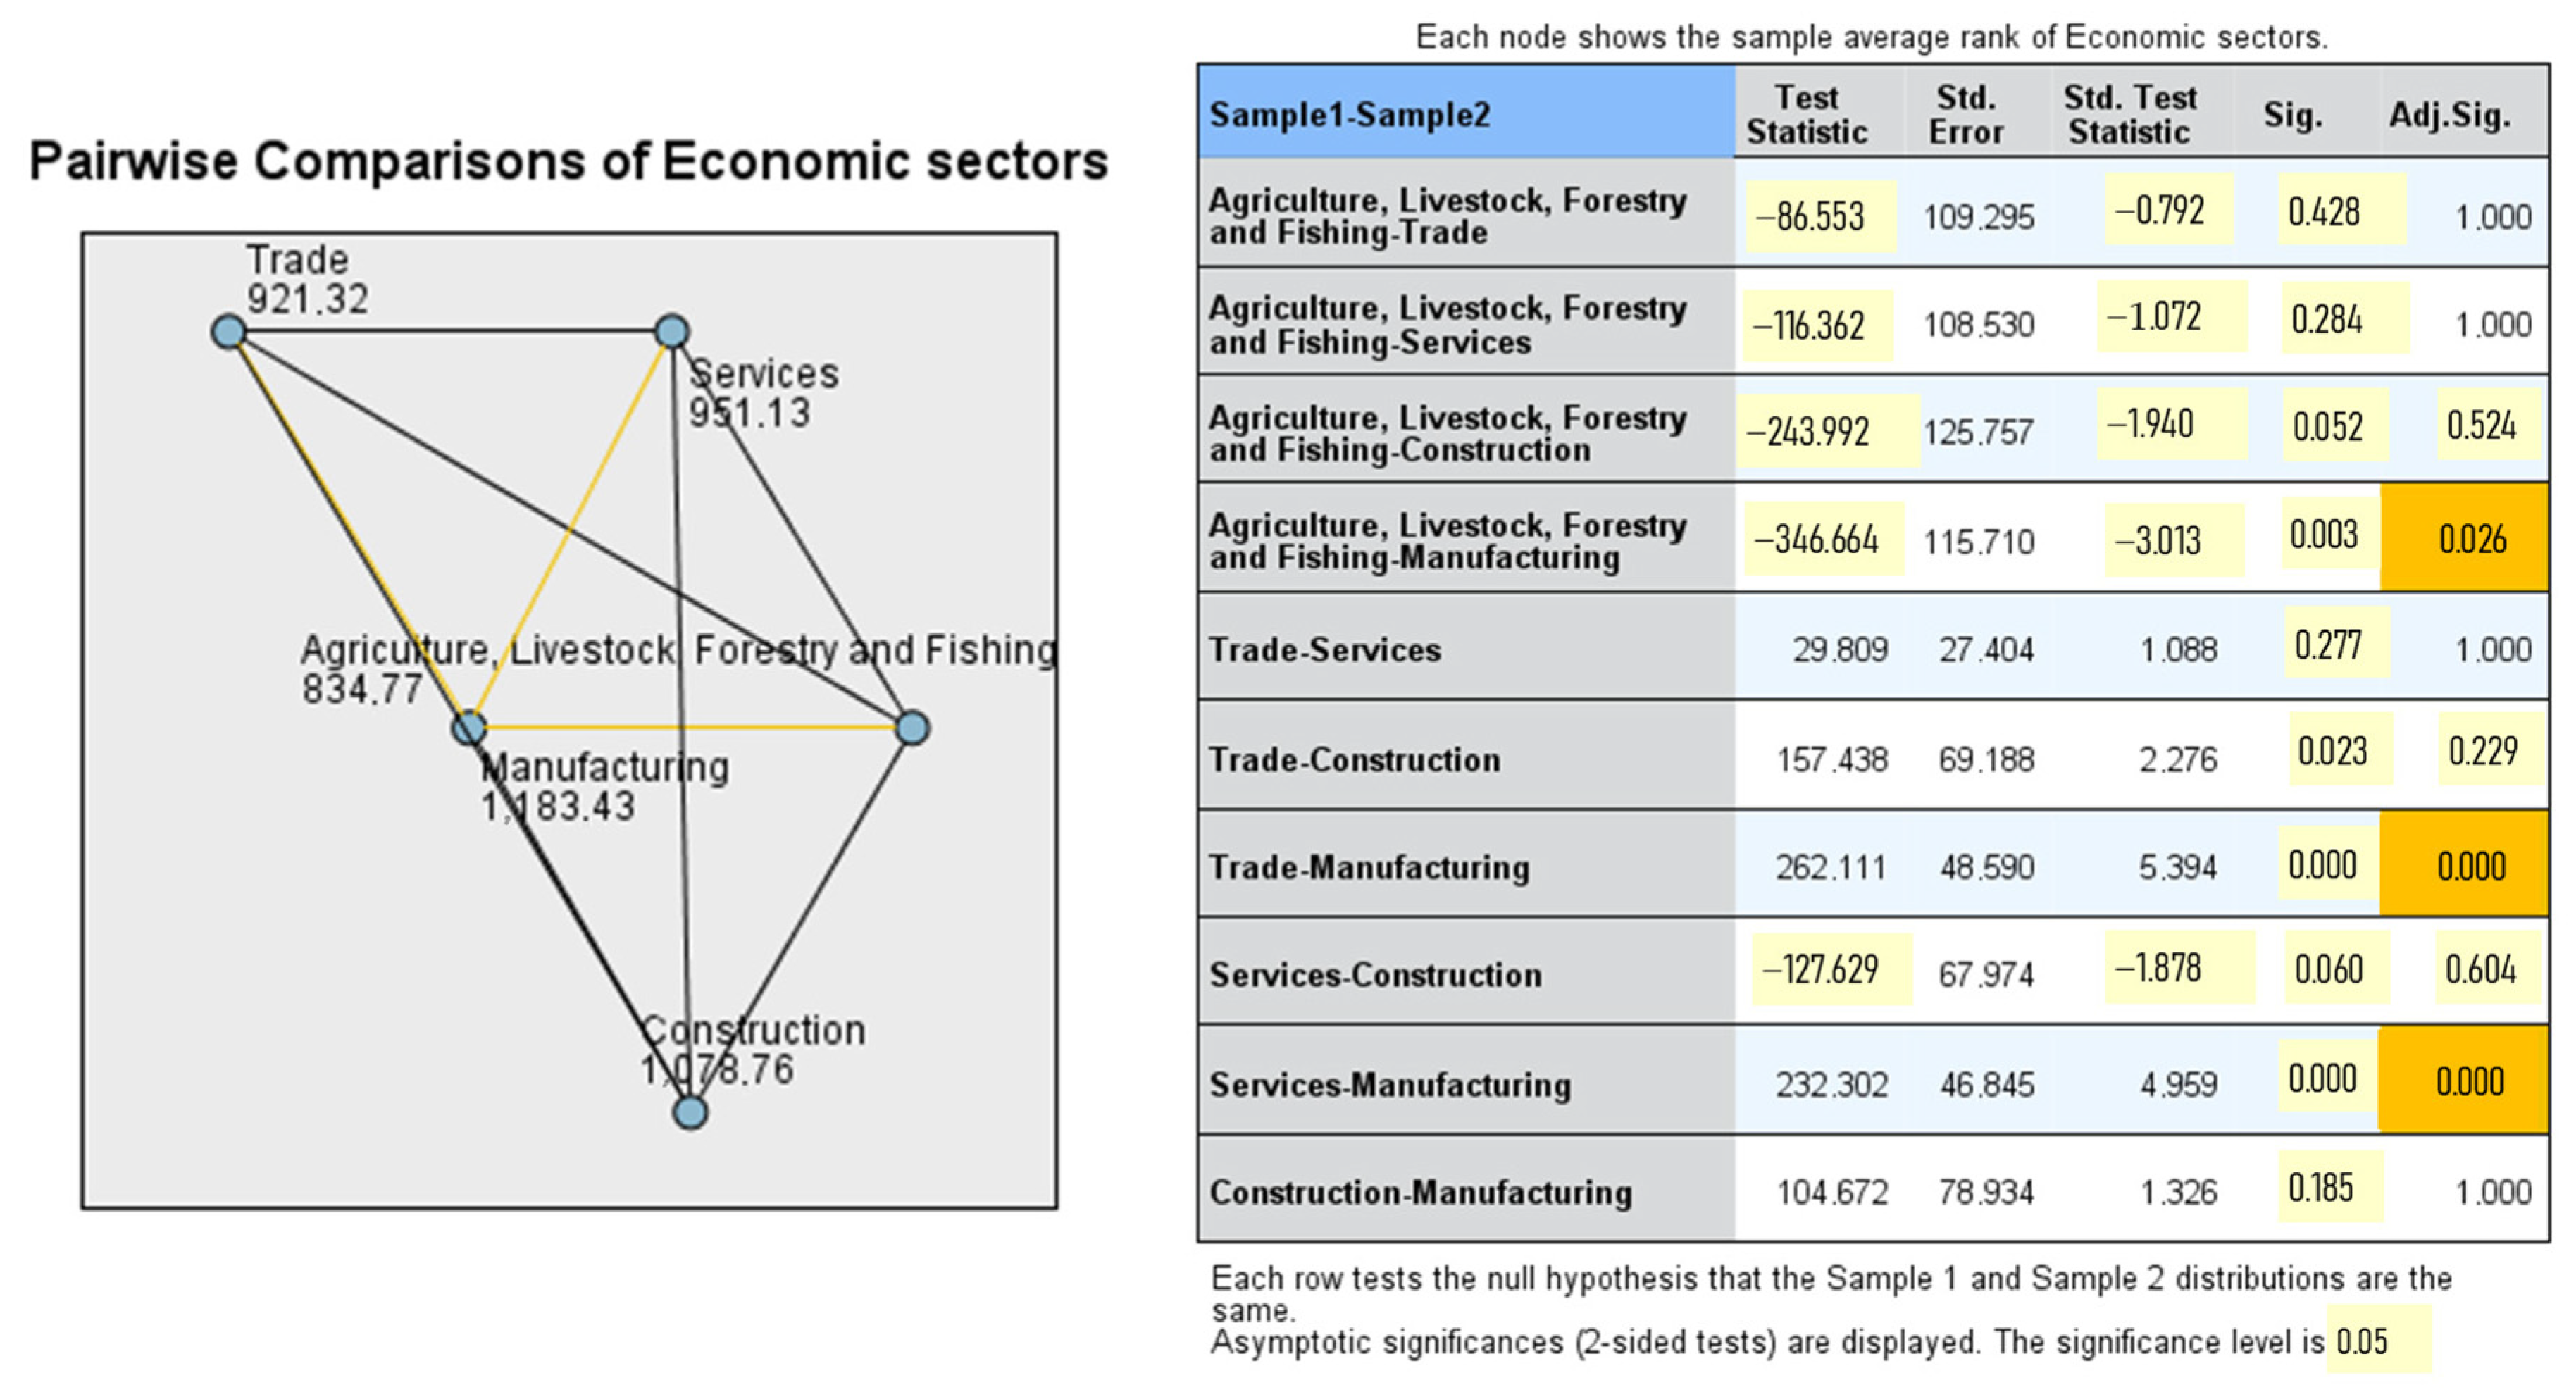
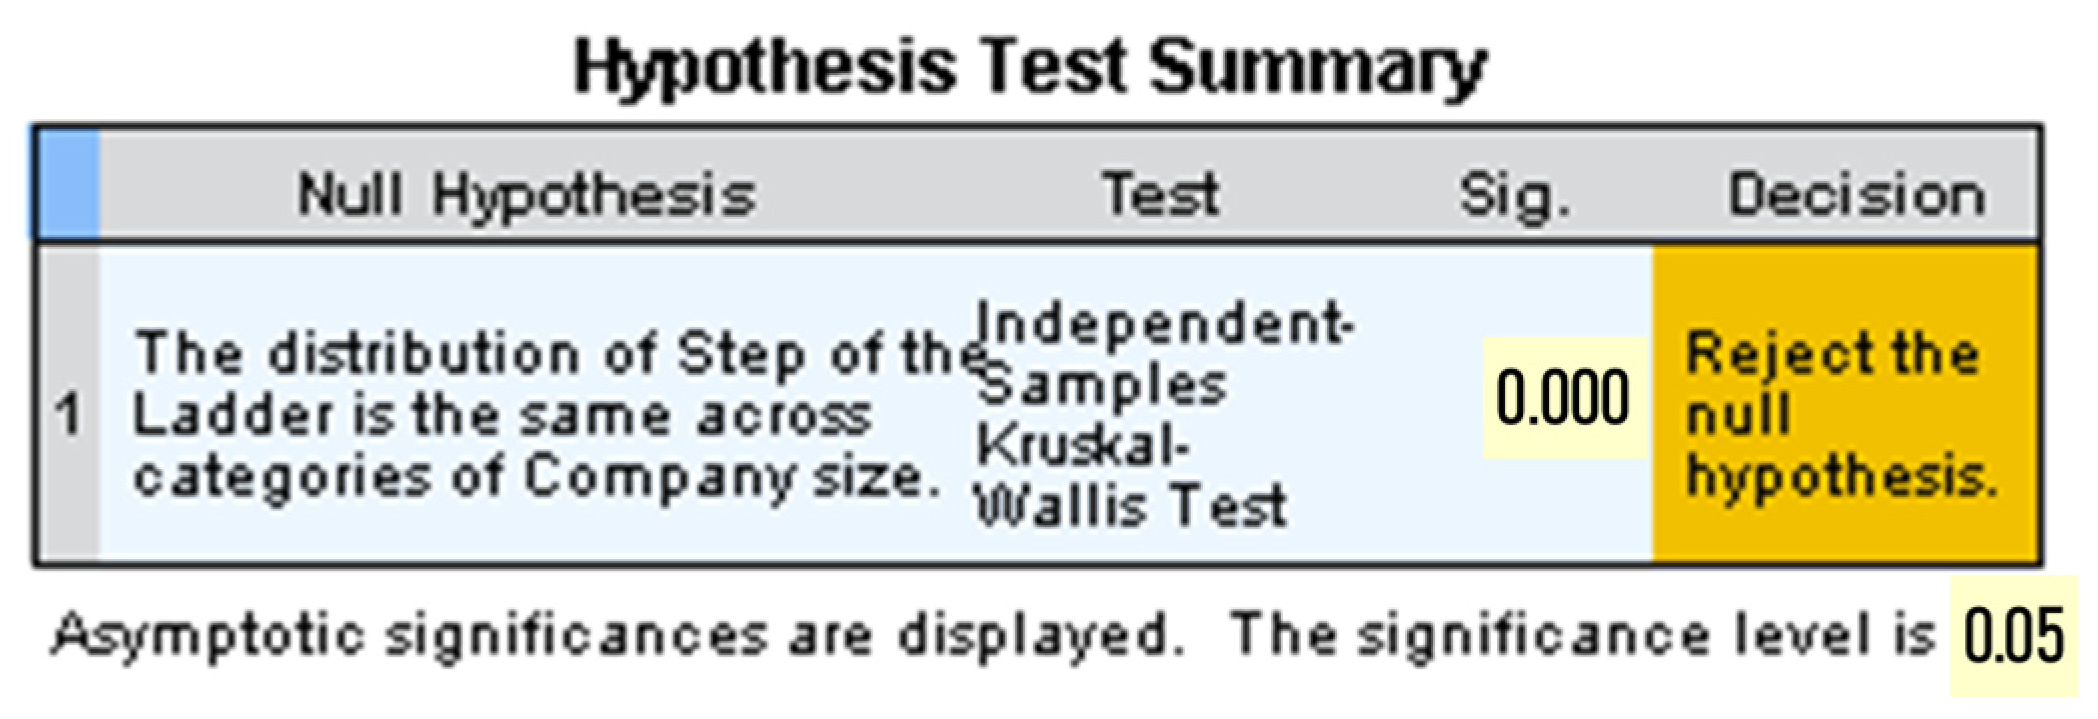
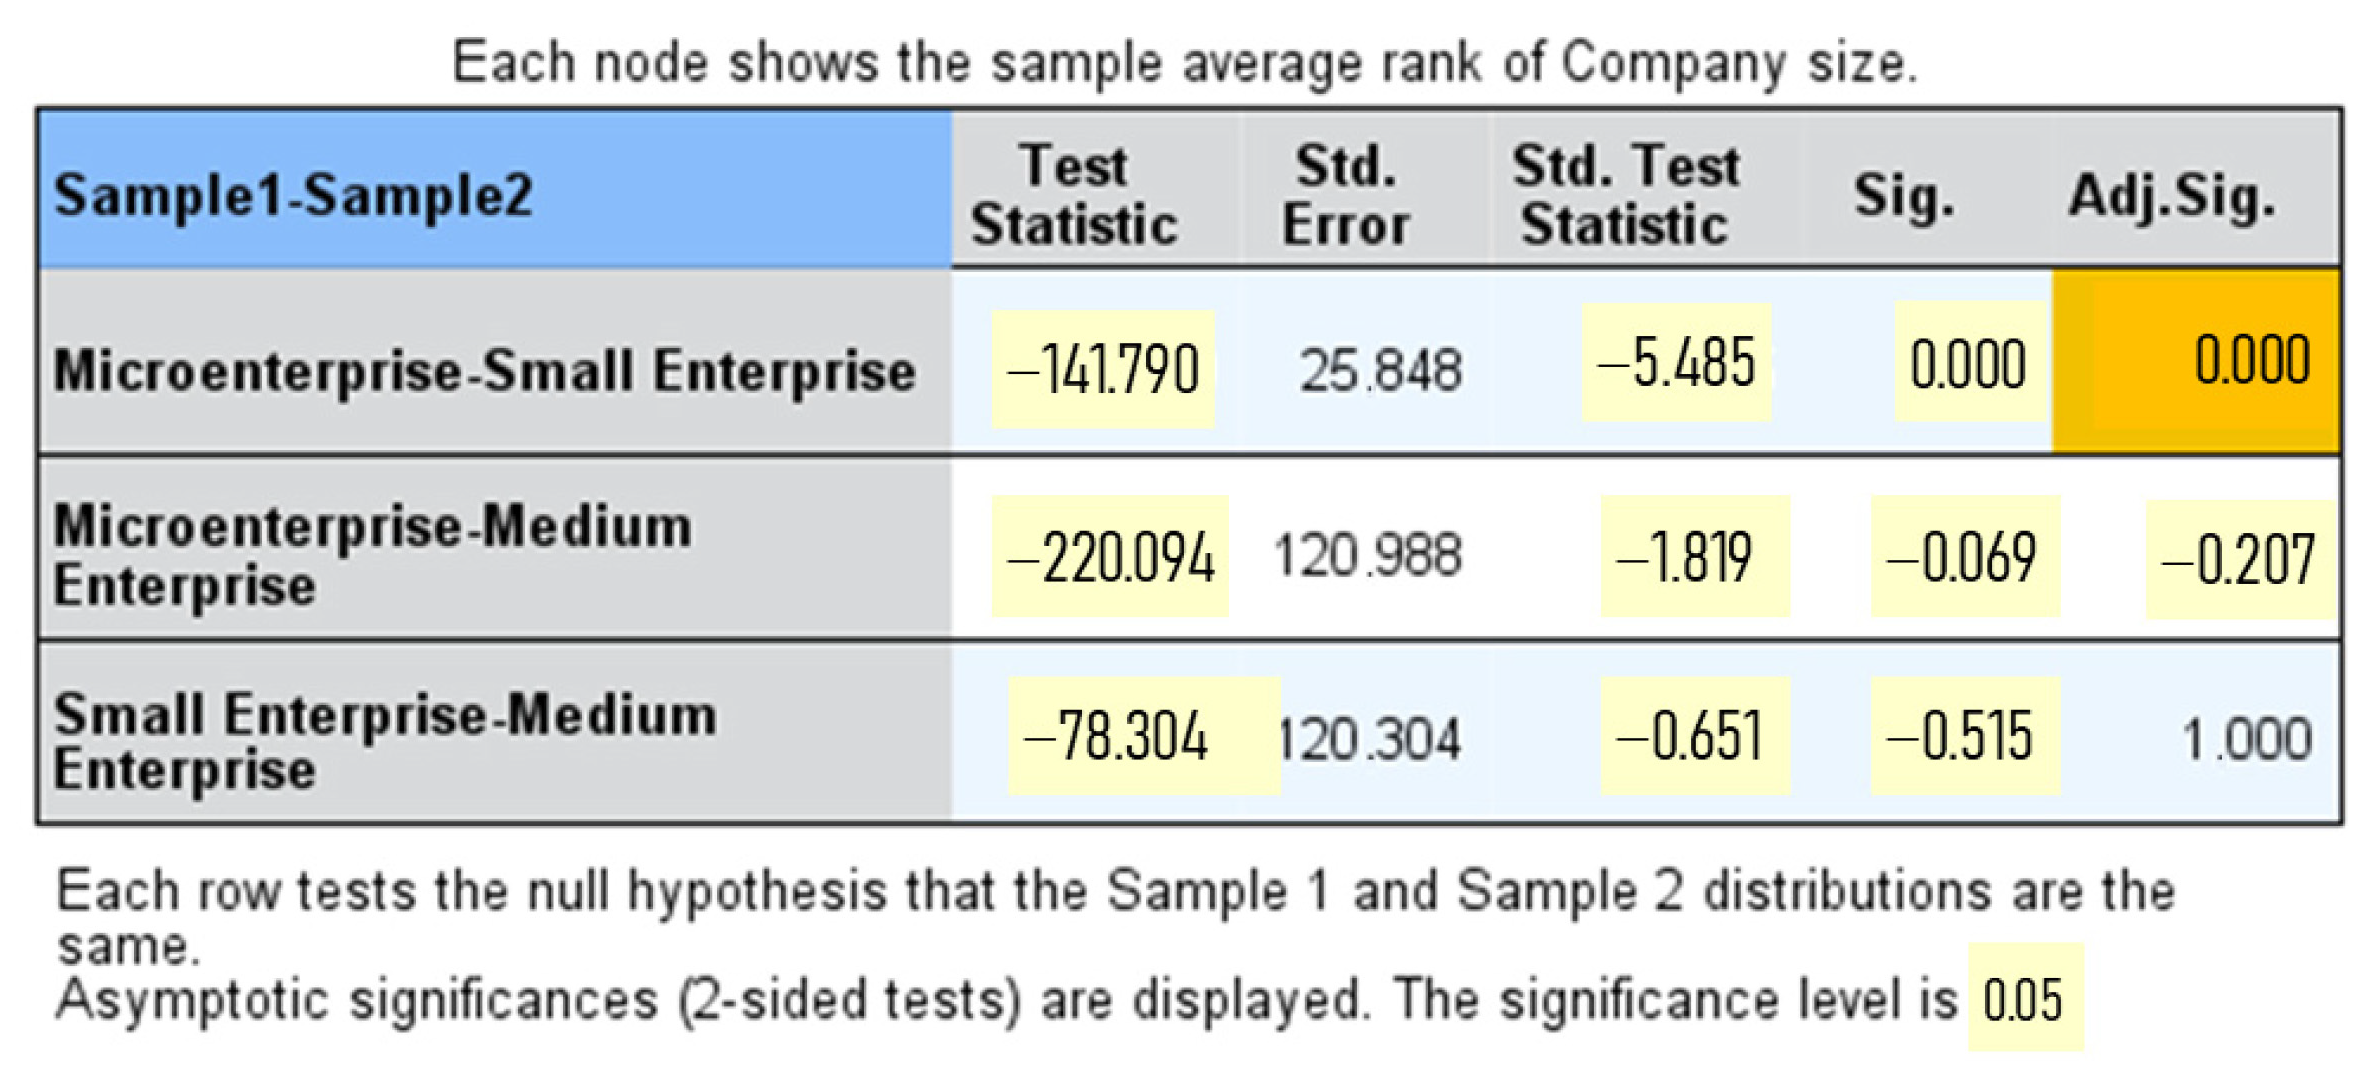
