1. Introduction
The efficiency and reliability of business processes in commercial banks are crucial for maintaining financial stability, enhancing customer satisfaction, and sustaining competitive advantage in a rapidly evolving market. Traditional process evaluation methods, which rely heavily on post-execution qualitative assessments and static frameworks, struggle to capture the dynamic complexities of modern banking operations. These methods often lack real-time monitoring capabilities, fail to leverage granular event log data, and overlook the interdependencies among organizational actors, potentially hindering proactive risk management and operational optimization.
Recent advancements in process mining and its organizational-perspective enhancement techniques, particularly social network analysis (SNA), offer transformative opportunities to overcome these challenges. As a data-driven discipline, process mining reconstructs and analyzes workflows using event logs generated during process execution, uncovering deviations, inefficiencies, and compliance risks [
1]. Beyond control flow discovery, process mining also enhances organizational processes, where SNA plays a pivotal role. By modeling participants as nodes and their interactions as weighted edges, SNA reveals hidden structural dynamics, such as power imbalances, collaboration bottlenecks, and role centrality, that directly impact process outcomes [
2]. Despite their potential, a significant gap remains in systematically integrating granular event log analytics with organizational dynamics to generate actionable insights tailored to commercial banking. Notably, there is a lack of data-driven, process-oriented evaluation frameworks specifically designed for the commercial banking sector. Moreover, existing frameworks lack a clear methodology for dynamically balancing process efficiency, quality, and flexibility within the unique operational constraints and regulatory environments of commercial banks.
Therefore, this study addresses the following research question: How can commercial banks effectively evaluate and optimize their business processes dynamically by integrating data-driven methodologies, such as process mining, social network analysis, and multi-criteria decision-making approaches?
This study proposes a dynamic evaluation framework that synergizes process mining and the DEMATEL-AHP hybrid model to assess commercial bank processes across three dimensions: efficiency, quality, and flexibility. Our framework leverages real-time event logs to shift from retrospective analysis to proactive monitoring, enabling timely interventions aligned with strategic objectives. Specifically, process discovery reconstructs control flows and identifies deviations from standard operating procedures (SOPs). SNA quantifies organizational interdependencies to contextualize inefficiencies. DEMATEL-AHP dynamically weighs evaluation indicators, balancing expert judgment with empirical data to prioritize critical indicators.
Our empirical analysis of a Chinese bank’s performance guarantee process yielded critical insights into the trade-offs involved in organizational reform. We analyzed the processes before and after centralization. Increased flexibility has resulted in a decline in the efficiency and quality of the post-centralization process. Furthermore, social network analysis contextualized these declines, revealing structural shifts such as reduced departmental cohesion and fragmented collaboration patterns, where critical handovers between headquarters and branches created bottlenecks. These findings highlight a paradox: while centralization enhances procedural adaptability, it can undermine operational rigor if not accompanied by synchronized SOP updates and cross-departmental training. We explicitly clarify that the proposed evaluation framework is designed to be broadly applicable across commercial banks, rather than limited to a single institution, despite the fact that the initial empirical validation was conducted using a detailed case study from a specific Chinese bank.
The contributions of this work are threefold. First, we advance the theoretical foundation of business process management (BPM) by introducing a multi-dimensional evaluation framework tailored to the unique operational and regulatory demands of commercial banks. Second, we demonstrate the practical applicability of the hybrid model combining process mining with DEMATEL-AHP using an empirical case study on performance guarantee processes, offering actionable insights for process redesign. Third, our methodology addresses the limitations of traditional evaluation models by emphasizing scalability, adaptability, and data-driven decision-making.
The remainder of this paper is organized as follows.
Section 2 reviews the foundational literature on process mining and process evaluation.
Section 3 details the methodology.
Section 4 presents the process evaluation framework.
Section 5 applies the framework to a real-world case study in a commercial bank.
Section 6 concludes with implications, limitations, and future research directions.
2. Literature Review
2.1. Process Discovery and Process Mining Applications in Banking
Process mining has fundamentally transformed traditional business process management by operationalizing event log analysis. Defined as the bridge between data mining techniques and BPM practices [
3,
4], process mining enables the reconstruction of data-driven processes through three core components: process discovery that extracts workflow patterns from event logs, conformance checking that validates process adherence, and process enhancement that optimizes workflows [
5]. Unlike traditional BPM, which relies on prescriptive to-be models, process mining enables organizations to systematically analyze and improve their as-is processes by leveraging the digital footprints of information systems.
Process discovery refers to algorithms that automatically generate process models (e.g., Petri nets, BPMN, C-net) from event logs without prior knowledge of the workflow structure. Initial research established the foundation by suggesting techniques to extract process patterns from event logs [
6,
7]. Subsequently, the Alpha algorithm was introduced, which served as a milestone in process discovery and constructed Petri nets by analyzing event log dependencies [
8]. However, the Alpha algorithm faced limitations in handling noisy or incomplete logs, prompting the development of Heuristic Miner [
9,
10] and Genetic Miner [
11,
12] to improve robustness. Modern process discovery techniques prioritize scalability, accuracy, and interpretability. Fuzzy Miner [
13] simplifies models by clustering frequent activities, while Inductive Miner [
14] uses divide-and-conquer strategies to handle complex logs. More recently, hybrid approaches integrating machine learning have received attention [
15,
16].
Table 1 describes some representative process discovery algorithms.
From an organizational perspective, process enhancement often leverages social network analysis to optimize organizational workflows by uncovering hidden behavioral patterns and collaboration dynamics among employees, thereby identifying opportunities for performance improvement and best practice adoption [
21,
22]. Empirical studies have demonstrated the practical application of process mining-based social network extraction in various domains. Some studies have introduced holistic frameworks combining organizational model mining, SNA, and information flow analysis to map organizational hierarchies, role distributions, and communication pathways [
23]. Their work underscores how SNA-driven insights into informal networks and collaboration inefficiencies can directly inform process redesign strategies, such as streamlining handovers or reallocating responsibilities to mitigate bottlenecks. However, SNA-based approaches predominantly rely on historical event logs, rendering them ill suited for real-time or adaptive environments, and limiting proactive process adjustment where organizational structures and roles evolve dynamically. Meanwhile, handling “spaghetti models” is challenging due to their complexity, which requires visualization and clustering techniques for interpretability [
22].
Process mining has been thoroughly studied in the banking sector, enabling a comprehensive study of critical stages and pathways in transaction processes, thus assisting in the detection of suspected fraudulent actions and abnormalities [
24,
25]. Some scholars have used process mining tools in Disco to conduct a multi-dimensional analysis of loan process logs, including event, resource, and case dimensions, while also considering customer data and process management policies [
26]. In addition, investigations combining process mining and classic and non-classic probability models have revealed that non-classical probability models perform better in uncertain, complex decision-making scenarios [
27]. Moreover, the integration of artificial neural networks with process mining techniques has been employed to predict potential failures during process execution, particularly the likelihood of loan application cancellations [
28].
The increasing regulatory complexity and operational demands facing modern banking institutions have catalyzed the adoption of artificial intelligence and data-driven technologies for both process optimization and compliance monitoring. Some scholars have investigated how machine learning, predictive analytics, and automation improve accuracy and efficiency in regulatory submissions within the U.S. banking sector [
29,
30]. They presented case studies and strategic frameworks for AI integration in reporting workflows, highlighting benefits such as reduced operational costs and enhanced decision-making.
2.2. Process Evaluation
Process evaluation is essential for the maintenance, optimization, and updating of commercial bank business processes, allowing managers to obtain a comprehensive overview of current business operations to identify existing issues and bottlenecks, consequently uncovering the potential for enhancement and decision-making. Existing studies have mainly focused on the following aspects:
Continuous improvements in the theoretical framework. Scholars have proposed a series of classic business process evaluation frameworks, such as the Business Process Maturity Model (BPMM) [
31] and the Balanced Scorecard (BSC) [
32]. These models comprehensively considered the efficiency, quality, and flexibility of the process from a strategic perspective.
The use of a multi-dimensional evaluation indicator system. Measuring process performance using a singular dimension is insufficient for the requirements of contemporary organizations [
33]. Consequently, multi-dimensional evaluation methodologies are typically employed, including financial indicators, such as cost and revenue growth rates, as well as operational indicators, like process cycle and mistake rates [
34].
The integration of data-driven and digital transformation. With the widespread application of AI and big data, researchers have investigated the application of robotic process automation (RPA) and process mining technologies to enhance the efficacy of process automation execution, thereby proactively optimizing and evaluating business processes [
35].
Process evaluation involves determining the weights of evaluation indicators, and a series of well-validated theoretical frameworks have been developed. The subjective weighting method is a method for determining indicator weights based on expert experience and judgment. Common subjective weighting methods include the Delphi Method [
36] and the Analytic Hierarchy Process (AHP) [
37]. The objective weighting method is based on data statistical analysis and avoids the interference of subjective factors, including the Entropy Method [
38] and Principal Component Analysis (PCA) [
39]. The combined weighting method integrates the advantages of subjective and objective weighting methods, typically using linear weighting or variable weight coefficient methods to combine subjective expert opinions and objective data results. In recent years, combined weighting methods based on fuzzy comprehensive evaluation have gradually emerged that can better handle complex and highly uncertain process evaluation problems [
40]. With the advancement of technology, some weight-determination methods based on artificial intelligence have been applied to business process evaluation. For example, genetic algorithms are used to optimize evaluation data and automatically learn and adjust weight distributions [
41].
3. Methodology
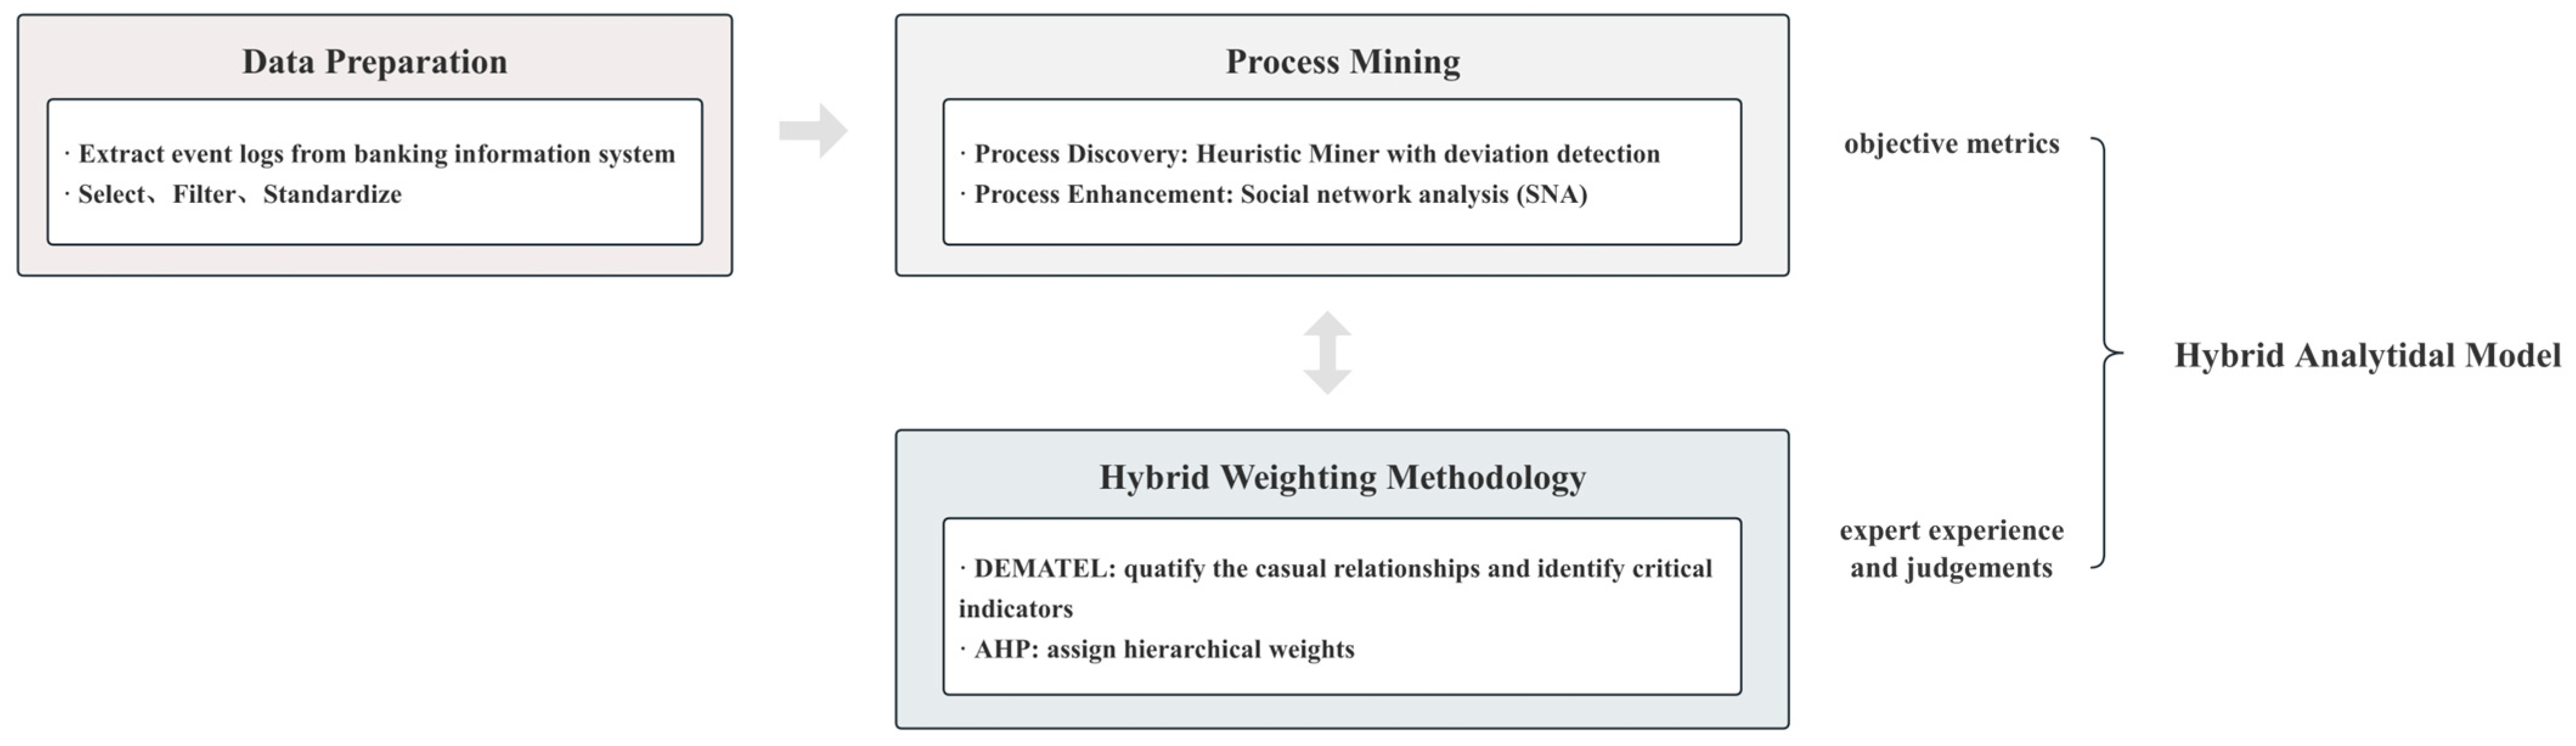
To address the limitations of traditional process evaluation frameworks in capturing dynamic complexities and organizational interdependencies, this study integrated three complementary methodologies: process discovery, SNA, and the DEMATEL-AHP hybrid method. Process mining enables the data-driven reconstruction of workflows from event logs, uncovering deviations and inefficiencies in control flow. SNA complements this by analyzing the structural dynamics of organizational interactions, revealing hidden collaboration patterns and bottlenecks. Meanwhile, the DEMATEL-AHP method bridges subjective expert judgments with objective data to hierarchically weigh evaluation indicators, ensuring a balanced prioritization of efficiency, quality, and flexibility dimensions. These methods collectively form a hybrid analytical model that combines granular event log analysis, organizational behavior modeling, and multi-criteria decision-making, thereby enhancing the adaptability and robustness of process evaluation in dynamic banking environments.
3.1. Process Mining
Process mining serves as the foundation for workflow discovery. By leveraging event logs generated during process execution, it reconstructs the as-is process model and quantifies deviations from predefined standards (e.g., SOP flowcharts). This study selected the Heuristic Miner algorithm for process discovery as it is optimized to handle noisy logs and incorporate domain-specific follow-up matrices. Process mining outputs, including dependency graphs and deviation paths, directly feed into subsequent SNA and DEMATEL-AHP analyses, providing empirical evidence for efficiency and quality assessments.
3.1.1. Process Discovery: Heuristic Miner
The objective of process mining is to derive insights regarding business processes from event logs [
42]. To rediscover the process model for process evaluation and analyze the process objectively, we decided to use the Heuristic Miner algorithm, which was introduced by Weijters in 2003 [
17] and refined in 2006 [
18]. Heuristic Miner remains one of the most frequently applied process discovery algorithms given its ability to filter out low-frequency paths, reduce model complexity, and highlight dominant behavioral patterns. This makes it particularly useful for real-life banking processes that often include exceptional or irregular cases. Heuristic Miner can produce a process model that is easier to interpret and visualize compared to other process discovery algorithms. This is crucial for communicating process insights to business stakeholders.
The Heuristic Miner algorithm primarily involves three steps:
Construction of the dependency/frequency table (D/F table);
Induction of the dependency/frequency graph (D/F graph);
Generation of the Directly Follow Graph (DFG) from the D/F graph.
To construct a D/F table, we needed to investigate the causal dependencies present in the log. If an activity was always followed by another activity, this indicated a dependency relation between both activities. A frequency-based metric was used to define the dependency relation between two activities, a and b ().
However, the traditional Heuristic Miner lacks explicit mechanisms to detect deviations between the actual execution process derived from event logs and SOP. Process deviation is a core indicator for measuring business compliance, risk controllability, and operational efficiency [
43]. To address this gap, we propose an enhanced Heuristic Miner algorithm that integrates domain-specific SOP constraints, enabling the automatic identification of process deviations, such as unauthorized activities or non-compliant paths. Specifically, we established a follow-up matrix derived from the follow-up relationships of activities in the SOP and incorporated it into the Heuristic Miner algorithm.
Let L be an event log over ζ, i.e., . Let a, b ∈ ζ: if there is a trace and such that , , and .
Here,
is the number of times
occurs in
L:
is the dependency value between a and b. Of note, the value of
is always between −1 and 1. If it is close to 1, there is a strong positive dependency between a and b. If it is close to −1, there is a strong negative dependency.
is the value in the follow-up matrix. In addition,
shows the coloring of activities and paths in the process. If there is a deviation activity or path, it will be colored.
The paths with dependency below the threshold in the normal path were hidden. In the deviation process path, the impact of the threshold was not considered. Finally, the D/F graph was established based on the D/F table, and we generated DFG from the D/F graph. It should be noted that this study utilized the PM4PY API tool to analyze business processes instead of relying on tools like Disco and ProM [
44].
3.1.2. Process Enhancement: Social Network Analysis
Traditional process discovery algorithms predominantly focus on reconstructing the control flow perspective, providing a partial view of business processes. However, event logs inherently encapsulate multi-dimensional information that extends beyond mere workflow steps, including organizational perspective and time perspective. To address this limitation and holistically enhance process performance, this study integrated social network analysis as a critical component of process enhancement.
As a network-based methodology, SNA systematically uncovers hidden structural dynamics within organizational ecosystems. It maps nodes (e.g., roles, departments, or individual employees) and weighted edges (e.g., collaboration frequency or handover efficiency) to quantify relationships and identify pivotal actors or bottlenecks. For instance, role centrality highlights key personnel whose actions significantly influence process outcomes. High-weight edges may reflect excessive collaborative burdens, potentially impeding the timely execution of critical activities.
In this study, SNA complemented control flow analysis by contextualizing deviations within organizational realities and linking workflow inefficiencies to organizational dynamics. By modeling departments and roles as nodes, and modeling their interactions as weighted edges, SNA quantified structural metrics such as network density, centrality, and clustering coefficients. These metrics revealed shifts in collaboration patterns and identified non-compliant operations. We selected several statistics to analyze the social network behind the process. The statistics are presented in
Table 2.
3.2. The DEMATEL-AHP Method
To synthesize subjective expertise and objective data, the DEMATEL-AHP method systematically weighs evaluation indicators. DEMATEL identifies causal relationships among indicators through expert-driven pairwise comparisons, while AHP assigns hierarchical weights based on their relative importance. This dual approach ensures that critical indicators are prioritized in alignment with the bank’s strategic goals.
3.2.1. DEMATEL
To systematically identify critical indicators for evaluating banking processes, we tailored the DEMATEL method to align with the unique operational and regulatory demands of commercial banks. Unlike generic applications, our approach integrated domain-specific expertise with empirical data from process mining and SNA, enabling a nuanced analysis of causal relationships among efficiency, quality, and flexibility indicators.
The Decision-Making Trial and Evaluation Laboratory (DEMATEL) method is a systematic approach to analyze complex causal relationships among factors in interconnected systems [
45]. Developed in the 1970s, it is widely used in decision-making, supply chain management, and sustainability studies to identify critical elements and visualize cause–effect structures [
46].
Step 1 (Generate the group direct-influence matrix
X): To systematically evaluate the 36 process evaluation indicators across efficiency, quality, and flexibility dimensions, we designed a structured questionnaire (see
Appendix A.1) that combined quantitative metrics with expert judgment, following the DEMATEL-AHP framework. We invited a panel of 25 experts, including 20 experienced banking professionals (risk managers, loan officers, and auditors) and five academic researchers specializing in financial process management. This diverse composition ensured both practical relevance and theoretical rigor.
In accordance with the DEMATEL methodology, participants rated the pairwise influence between each pair of indicators using a standardized 0 to 4 scale, where 0 indicated “no influence” and 4 indicated “very high influence”. To unify expert opinions and construct the direct relation matrix, we normalized each individual matrix and then aggregated them by averaging across all responses, ensuring consistency while preserving expert diversity.
According to the results from the questionnaires we collected, we constructed a direct influence matrix , where quantifies the direct influence of factor i on factor j. For example, indicated a high influence of process volatility on efficiency and indicated a moderate influence of flexibility on compliance risks.
Step 2 (Establish the normalized direct influence matrix
N): The direct influence matrix was normalized to ensure convergence in subsequent steps. The normalized matrix
N was derived as follows:
This bounded the spectral radius of N to ensure that .
Step 3 (Construct the total influence matrix T): The total influence matrix T, capturing both direct and indirect effects, was calculated using a convergent matrix power series: ), where I is the identity matrix. Each element represents the total effect of actor i on factor j.
Step 4 (Produce the influential relation map): For each factor
i, we needed to compute the prominence and relation, where
indicates the overall role of the factor and
classifies factors as “cause”
or “effect”
.
3.2.2. AHP
The Analytic Hierarchy Process (AHP) developed by Thomas L. Saaty in the 1970s is a multi-criteria decision-making method that combines expert judgment with mathematical computation using hierarchical modeling [
37]. In this study, AHP was integrated with DEMATEL to allocate weights to multi-dimensional indicators in commercial bank process evaluation. The implementation steps were as follows:
Step 1 (Problem decomposition and hierarchy construction): The problem was broken down into a hierarchy of decision elements, typically consisting of a goal at the top, followed by criteria, sub-criteria, and alternatives at lower levels. Based on the evaluation framework proposed in
Section 4, the goal layer was defined as “Comprehensive Process Performance”, with three criterion layers: efficiency (C1), Quality (C2), and flexibility (C3). Sub-criteria layers further dissected these into specific indicators.
Step 2 (Expert pairwise comparisons and matrix construction): Decision makers performed pairwise comparisons between elements at each level of the hierarchy, assessing the relative importance or preference of one element over another. The comparisons were quantified using a scale, commonly the 1 to 9 Saaty scale, where a score of 1 indicated equal importance and 9 indicated extreme preference. For two elements
and
, the pairwise comparison matrix
A was represented as follows:
Here, represents the relative importance of element compared to element . The matrix was reciprocal, where .
Step 3 (Priority vector calculation and weight allocation): The pairwise comparison matrix was derived from a priority vector, which reflected the relative weight or importance of each criterion and alternative.
Step 4 (Consistency check): AHP also included a consistency check to ensure that the pairwise comparisons were logically consistent. The consistency ratio (CR) was calculated as follows:
CI is the consistency index and RI is the random consistency index, which depends on the size of the matrix. If CR was less than 0.1, the pairwise comparisons were considered consistent.
3.3. The Hybrid Analytical Model
The hybrid analytical model is a systematic framework designed to evaluate business processes in commercial banks by synergizing data-driven insights, organizational behavior analysis, and multi-criteria decision-making. The model comprises three interconnected modules in
Figure 1.
In the data preprocessing phase, event logs were first extracted from the banking information systems to ensure the comprehensive capture of process data. The raw data then underwent rigorous refinement, including noise filtering, timestamp alignment, and format standardization, to enhance data accuracy and consistency. This phase established a robust foundation for subsequent process analysis and comparative studies.
In the process mining phase, both process discovery and process enhancement were applied to provide a comprehensive framework for evaluating both the operational workflows and the underlying organizational dynamics in banking processes. In terms of process discovery, we employed an enhanced Heuristic Miner algorithm to reconstruct as-is workflows from event logs. A key innovation is the integration of a follow-up matrix derived from SOP flowcharts that enables the automatic detection of deviations, such as unauthorized activities or non-compliant paths. In addition, process enhancement leveraged SNA to map and analyze collaboration networks among departments and personnel. By representing organizational entities as nodes and their interactions as edges weighted by collaboration frequency, SNA quantified structural metrics such as network density and centrality to identify bottlenecks.
The weighting approach integrated DEMATEL and AHP to achieve a balanced prioritization of process evaluation indicators. Specifically, DEMATEL was first applied to uncover and quantify the causal relationships among various indicators. Building on these insights, AHP was then employed to assign hierarchical weights, ensuring that the relative importance of each indicator was accurately reflected. By synthesizing objective metrics obtained from process mining with expert judgments, this method generated comprehensive final weights for the dimensions of process efficiency, quality, and flexibility.
In summary, the proposed hybrid analytical model integrated process mining, SNA, and the DEMATEL-AHP method to offer a comprehensive framework for process evaluation. Process mining provided granular insights into workflow dynamics, while social network analysis contextualized operational inefficiencies by revealing underlying organizational dynamics. The DEMATEL-AHP component further ensured that evaluation criteria were strategically aligned, synthesizing objective performance metrics with expert judgment. The proposed hybrid analytical model supports real-time monitoring and agile optimization, enabling banks to mitigate risks such as non-compliance, enhance operational stability, and effectively balance flexibility with control.
4. The Process Evaluation Framework
Traditional models, such as BSC and BPMM, primarily address efficiency and quality from a strategic standpoint. However, these models fall short in parsing real-time event logs and quantifying the impact of organizational interactions on process flexibility. Building upon the hybrid analytical model presented in
Section 3, this section describes a comprehensive, multi-dimensional evaluation framework for commercial bank business processes. Notably, van der Aalst’s synergistic evaluation framework emphasizes the necessity of integrating real-time digital footprints with organizational interaction patterns for continuous process optimization [
47], which directly informed our technical architecture design.
Although Reijers and Mansar’s classical framework provides a foundational structure for evaluating business process improvements through the dimensions of time, cost, quality, and flexibility, its reliance on static operational metrics limits its adaptability to dynamic financial environments [
48,
49]. Derived from case studies and subjective evaluations, their process evaluation studies potentially lack empirical validation in complex, data-intensive contexts such as modern banking operations. Furthermore, their framework does not fully address the need for real-time performance monitoring or leverage granular operational data to capture emergent inefficiencies in evolving processes. This is a critical gap given the increasing digitization of financial transactions and regulatory demands for transparency.
To overcome these limitations, we developed a data-driven evaluation framework for process redesign in commercial banking with process mining. Our methodology systematically incorporated three core dimensions: process efficiency, process quality, and process flexibility. We thoroughly accounted for the characteristics of commercial bank business processes and the regulatory environment under the financial sector, thereby ensuring the applicability of the evaluation framework in financial contexts. This data-centric approach enabled dynamic process assessment grounded in event logs extracted from the information systems while maintaining alignment with the structural characteristics of financial business processes and the compliance requirements of the banking regulatory environment.
Process efficiency was evaluated using the execution time of each case and activity, including the completion time of the case and the execution time of the activity. Highly efficient business processes can significantly reduce resource waste and enhance overall operational performance.
Process quality was assessed based on the operational quality of business processes, including process execution volatility, matching rate, etc. Process execution volatility was used to evaluate the volatility of the time required for the execution of activities or cases, represented by the standard deviation of time. The smaller the standard deviation was, the more stable and standard the process. The matching rate was considered from the perspectives of case and variant dimensions. The matching rate for cases was measured by dividing the execution paths permitted by the SOP flowchart in each case by the total number of paths in all cases. The matching rate for variants was measured by dividing the execution variants permitted by the SOP flowchart in each case by the total number of variants in all cases. The specific formula for the matching rate was as follows:
Moreover, process deviation is a crucial component of risk monitoring in commercial banks and serves as a vital indicator for assessing business compliance in process quality, which refers to the disparity between the actual business processes and the SOP flowcharts. Thus, we set the proportion of deviation activities and the proportion of deviation paths as indicators. The proportion of deviation activities denoted the ratio of activities not outlined in the SOP flowchart to the total number of activities recorded in the event logs, whereas the proportion of deviation paths denoted the ratio of paths not specified in the SOP flowchart to the total number of paths in the event logs.
Process flexibility was considered from the perspective of the completeness of process models and their capacity to adapt to the evolving market environment. Flexible processes make resource allocation more efficient. The indicators of process flexibility included the number of process variants, the average path of process variants, etc. The framework for the process evaluation indicators is shown in
Appendix A Table A1.
5. Case Study
5.1. Data and Descriptions
We collected the event log from a Chinese commercial bank with an emphasis on loan application performance guarantees, driven by three primary considerations. First, Chinese commercial banks are currently in a critical stage of digital transformation, characterized by regular process improvements and organizational restructurings. Thus, this case study provided representative insights into the wider banking sector. Second, the chosen bank underwent a clearly defined organizational change, namely, centralization of the approval authority for performance guarantee. This provided an ideal setting with distinct pre- and post-centralization conditions, enabling the precise empirical evaluation of the impact of structural changes on business processes. Third, performance guarantee processes entail strict risk management requirements and compliance sensitivity, thus illustrating the relevance and benefits of our suggested multi-dimensional, data-driven evaluation methodology, which incorporates efficiency, quality, and flexibility indicators.
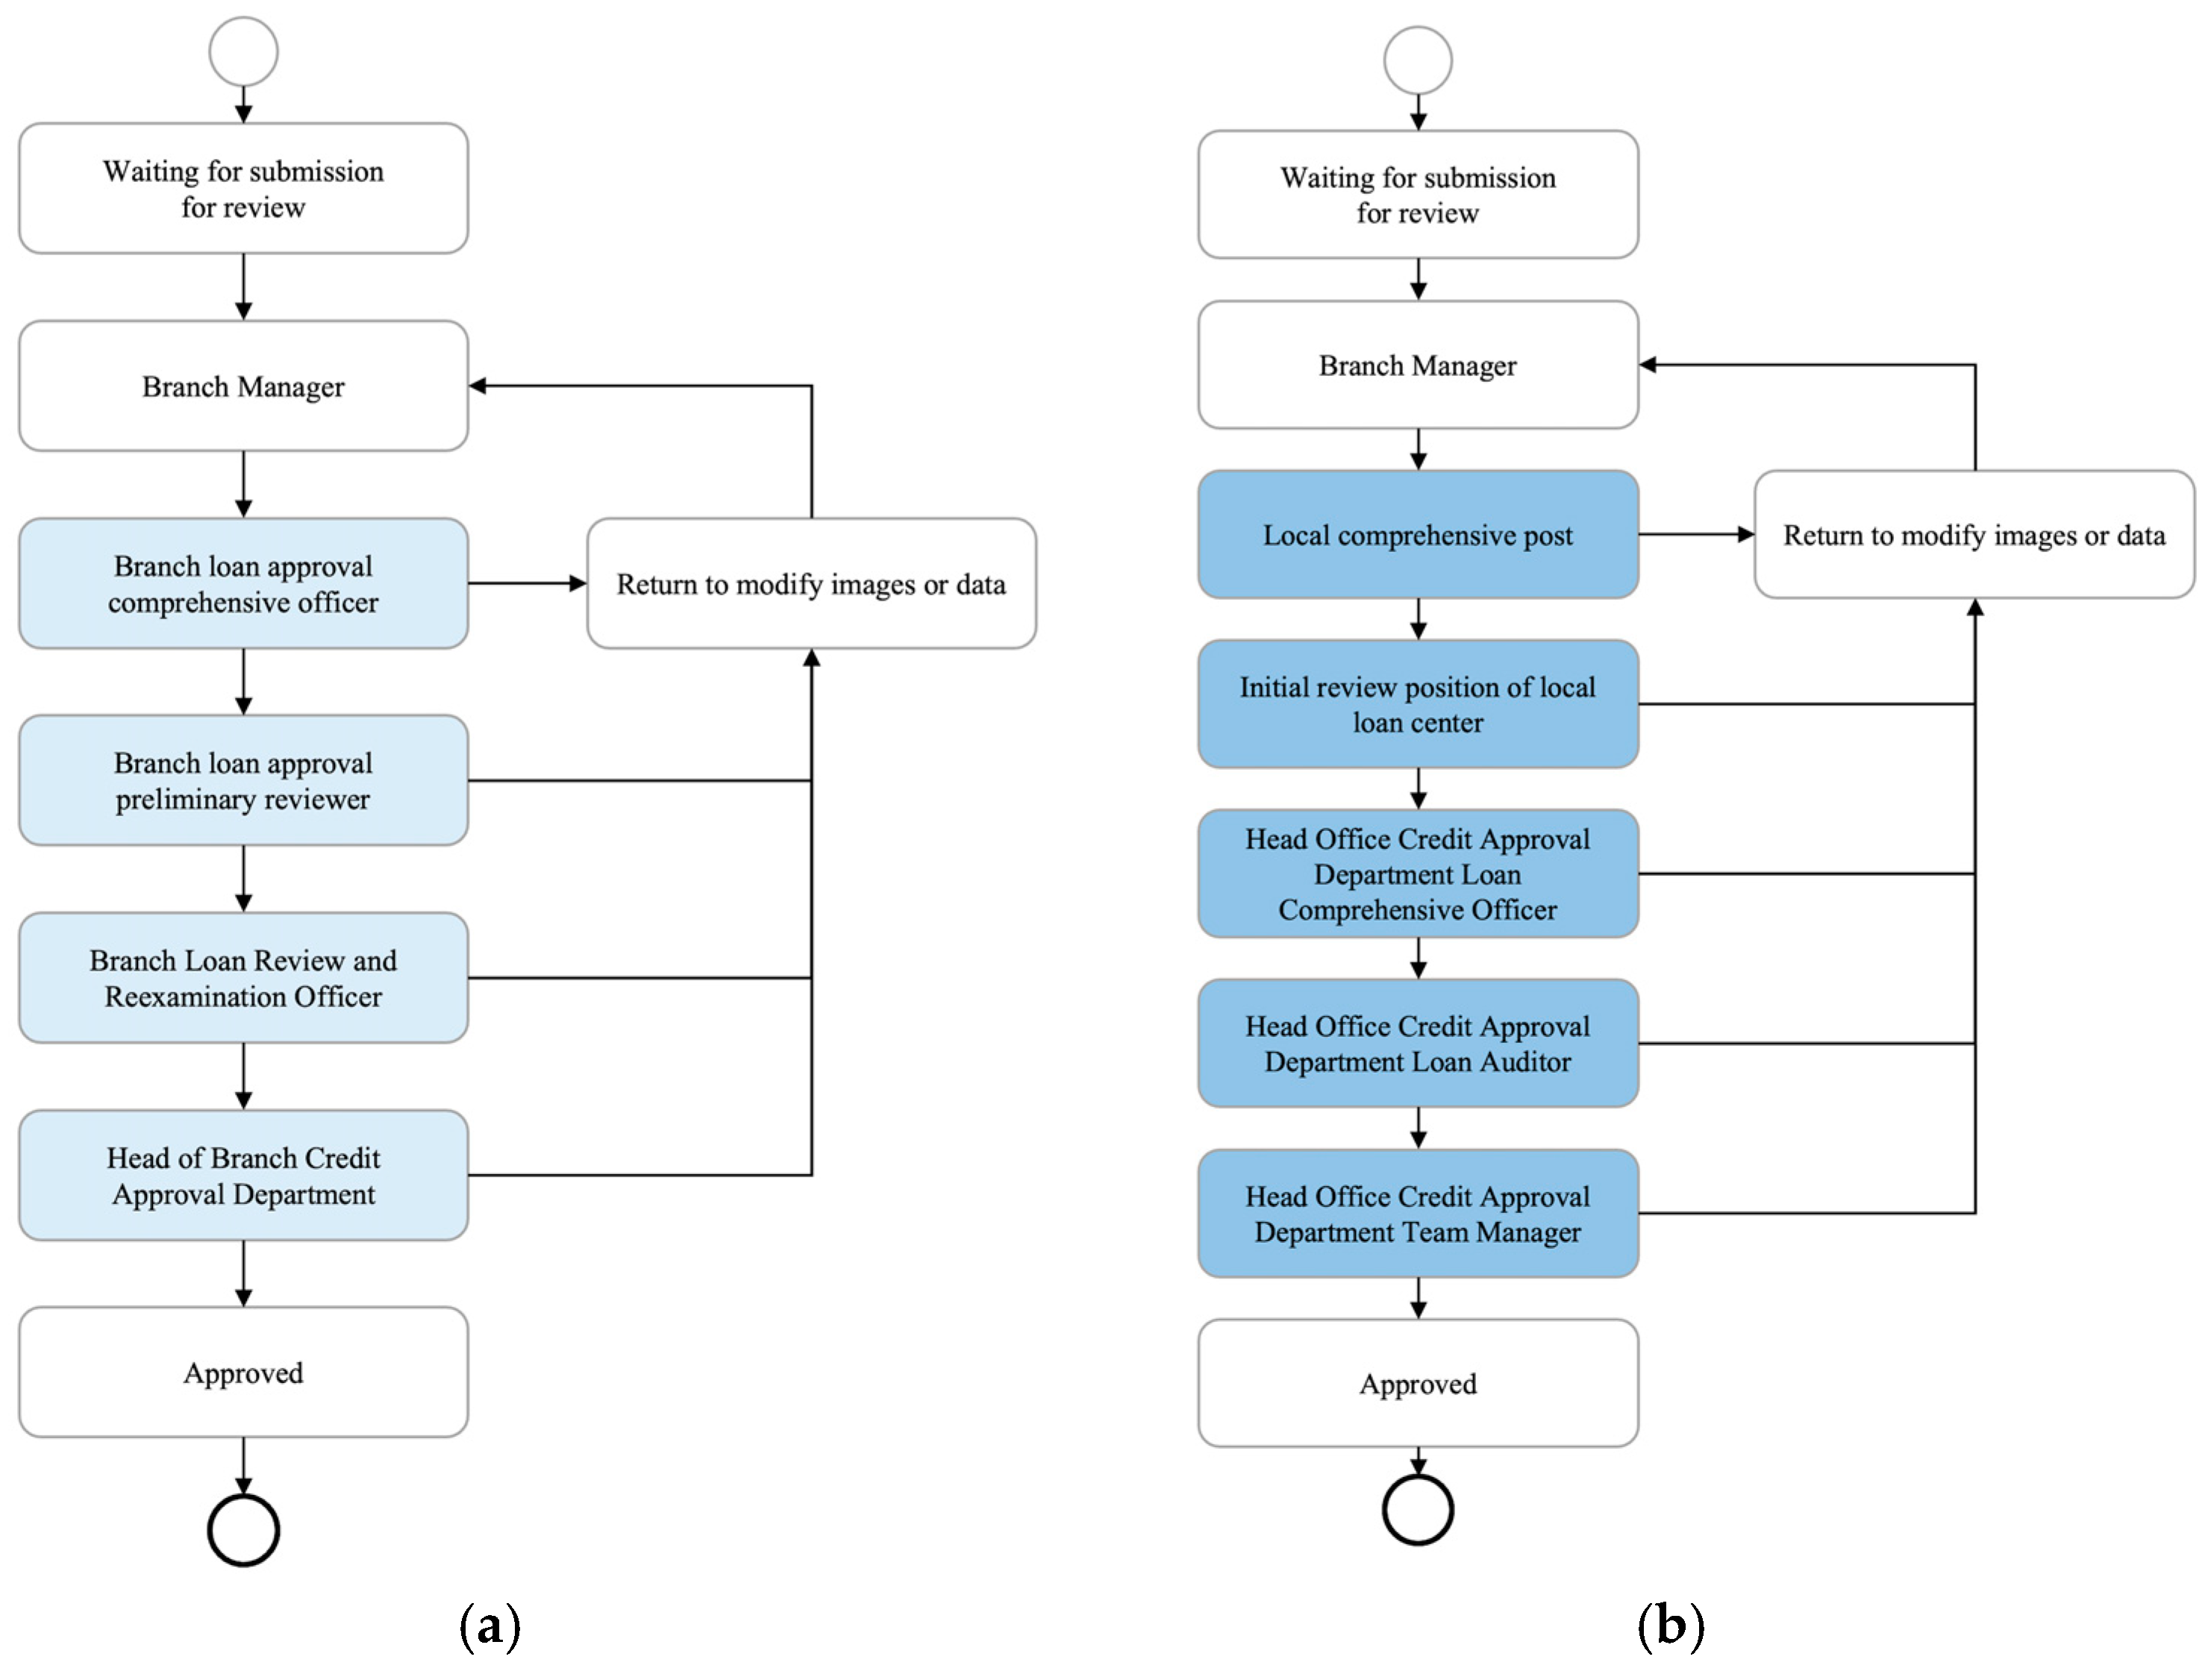
To optimize business processes regarding performance guarantee, the case bank redesigned the loan approval process at the end of October 2024, centralizing some review authorities at the head office level. This change resulted in the formation of two different loan approval processes for performance guarantees, providing a solid data foundation and source of issues for the evaluation of business processes in this paper. The SOP flowcharts before and after centralizing are shown in
Figure 2.
Table 3 and
Table 4 provide event log information before and after the review authority was centralized, including the case ID (CaseID), activity name (Activity), activity execution time (DateTime), activity executor ID (UserID), and activity execution department number (OrgID). CaseIDs, such as “BP202403180008xx” and “BP202403200009xx”, represent two business transactions separately. Each case was represented by a trace with several activities. The execution of the activity involved specific personnel (UserID), a specific department (OrgID), and the execution time (DateTime). CaseID, Activity, and DateTime were essential elements for process analysis and process mining. In contrast, personnel and department were not necessary, so they were also called resource elements (Resource). We collected 85 cases in total before the review authority was centralized and 306 cases in total after centralization.
The event log after centralization was similar to that before centralization. However, the specific contents, such as Case ID and activity name, differed, indicating that they represented different cases.
5.2. Process Discovery and Social Network Analysis
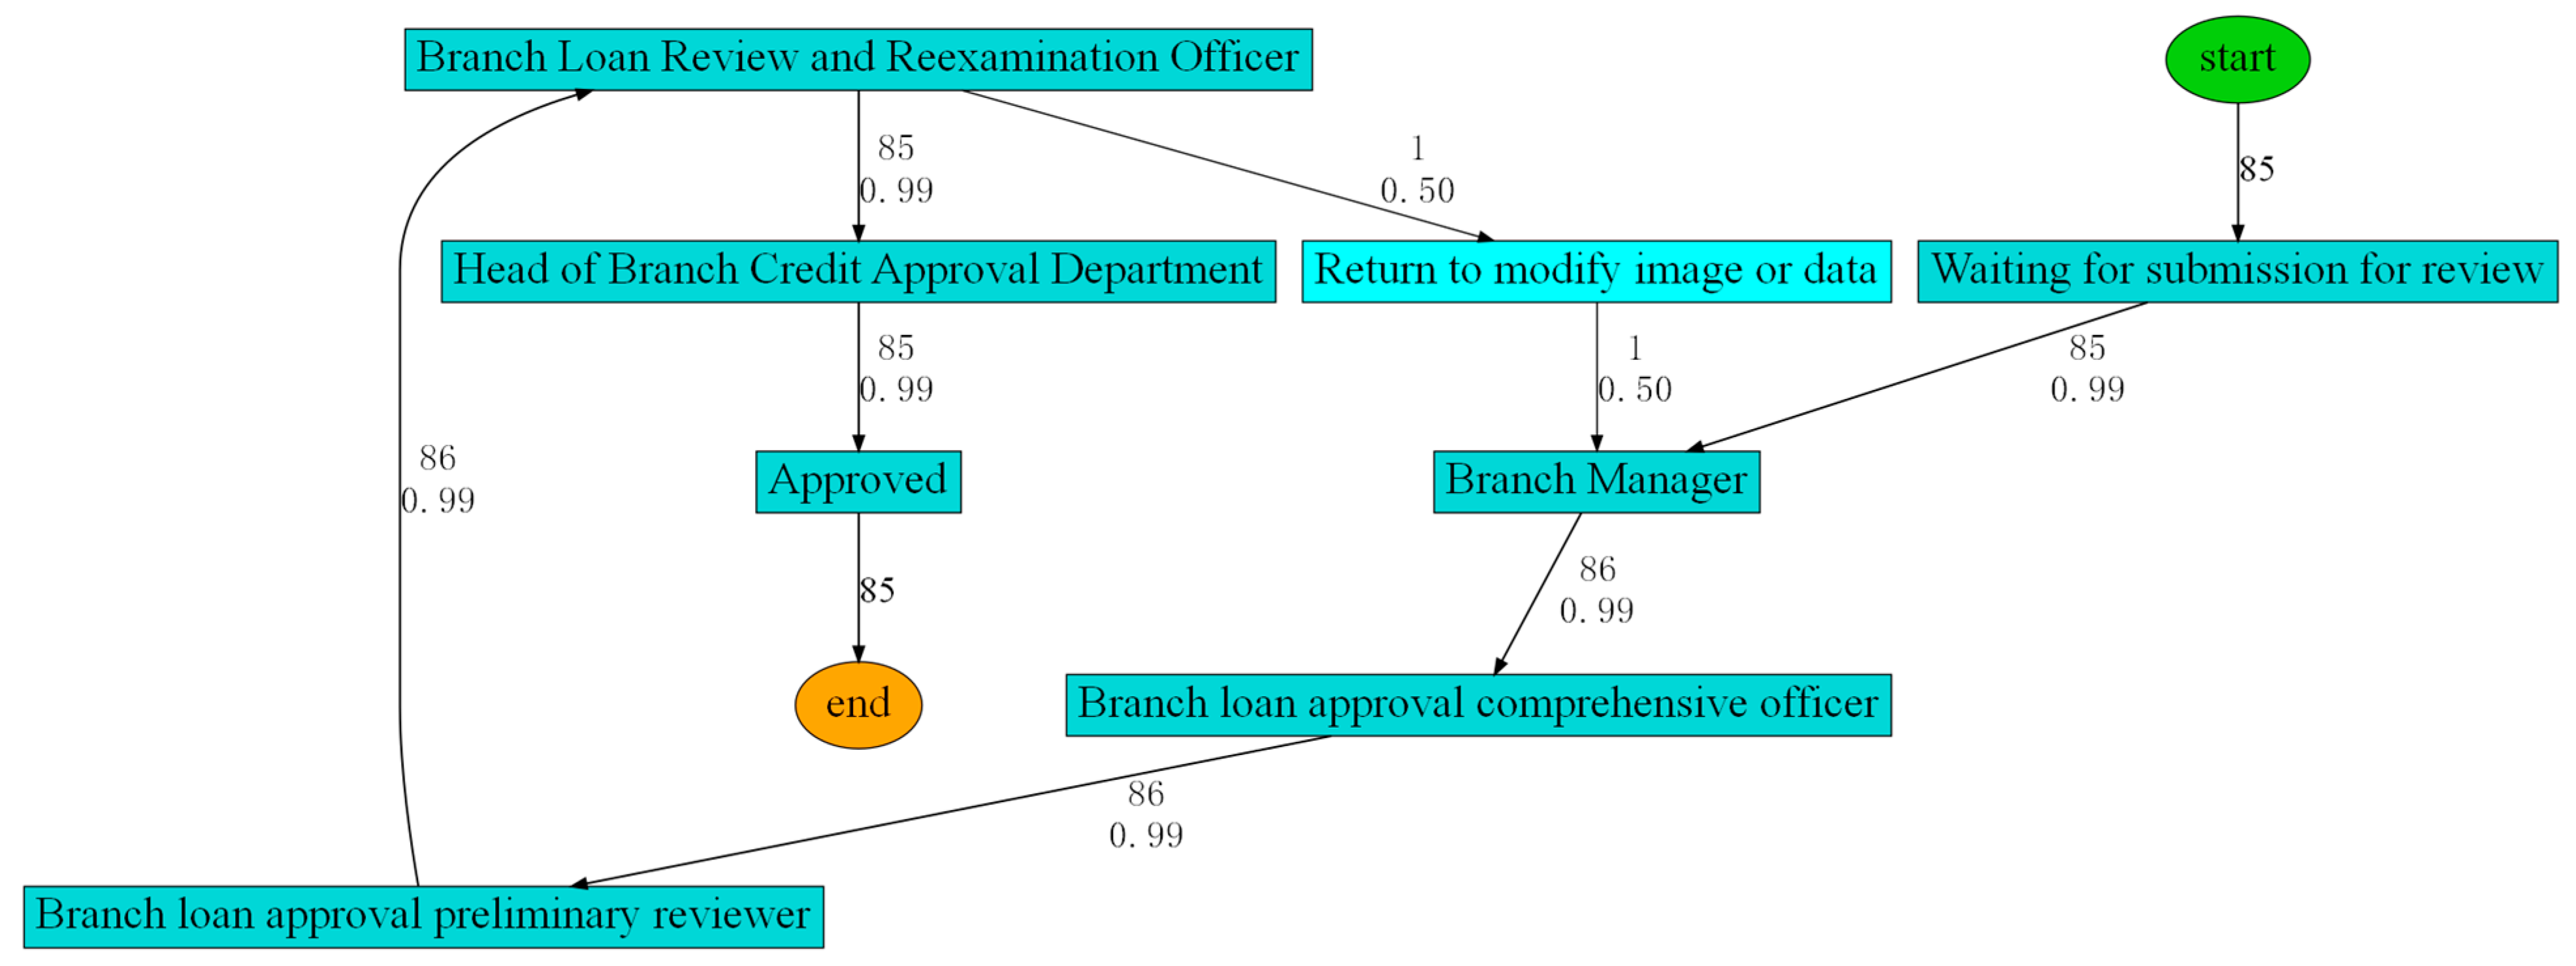
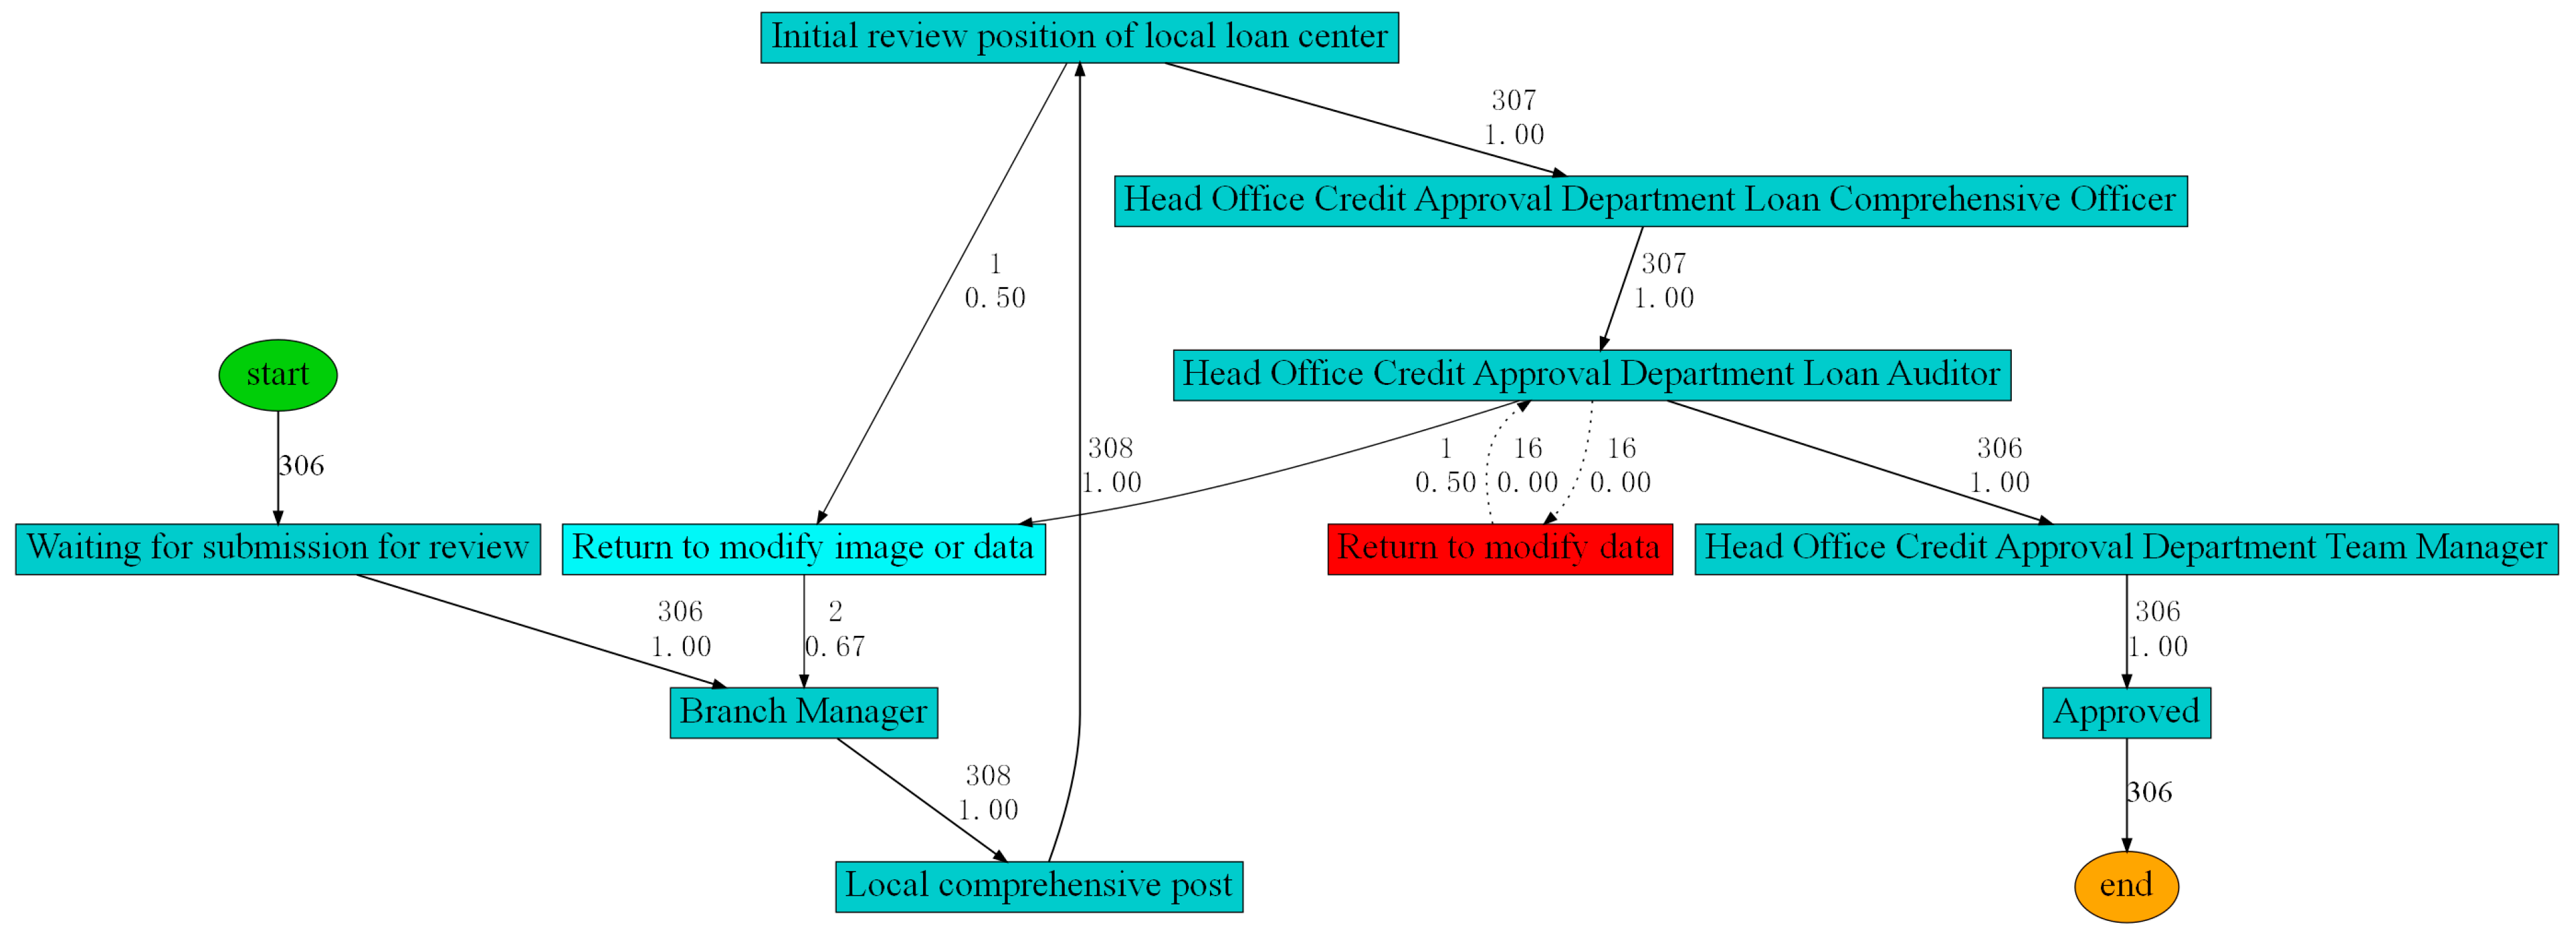
Based on the prior knowledge of the SOP flowchart, this study constructed a follow-up relationship matrix of activities for performance guarantee before and after centralization, which is present below. To integrate the follow-up matrix into the Heuristic Miner algorithm, we used the event log of the performance guarantee to rediscover the process model. Specifically, the pre-centralization process model (
Figure 3) was derived from the combination of event logs before organizational restructuring and the follow-up relationship matrix
. The post-centralization model (
Figure 4) was derived from the combination of event logs after the centralization and the matrix
. We set the threshold equal to 0.5 in the Heuristic Miner algorithm, following commonly used defaults in the literature and existing tools such as the PM4PY framework. The generated process models are shown in
Figure 3 and
Figure 4.
The red activities denote deviation activities, whereas the dotted lines illustrate deviation paths.
Figure 3 indicates that a deviation activity called “return to modify data” occurred in the process after the centralization. After a discussion with experts on the case bank, we confirmed this activity to be a newly incorporated activity node. The function of the “return to modify image or data” activity was divided into two parts after centralization: “return to modify image” and “return to modify data”. However, the information technology system failed to explore the actual execution process of the business in a timely manner, resulting in delays in system maintenance and the SOP flowchart. The analysis results are shown in
Table 5.
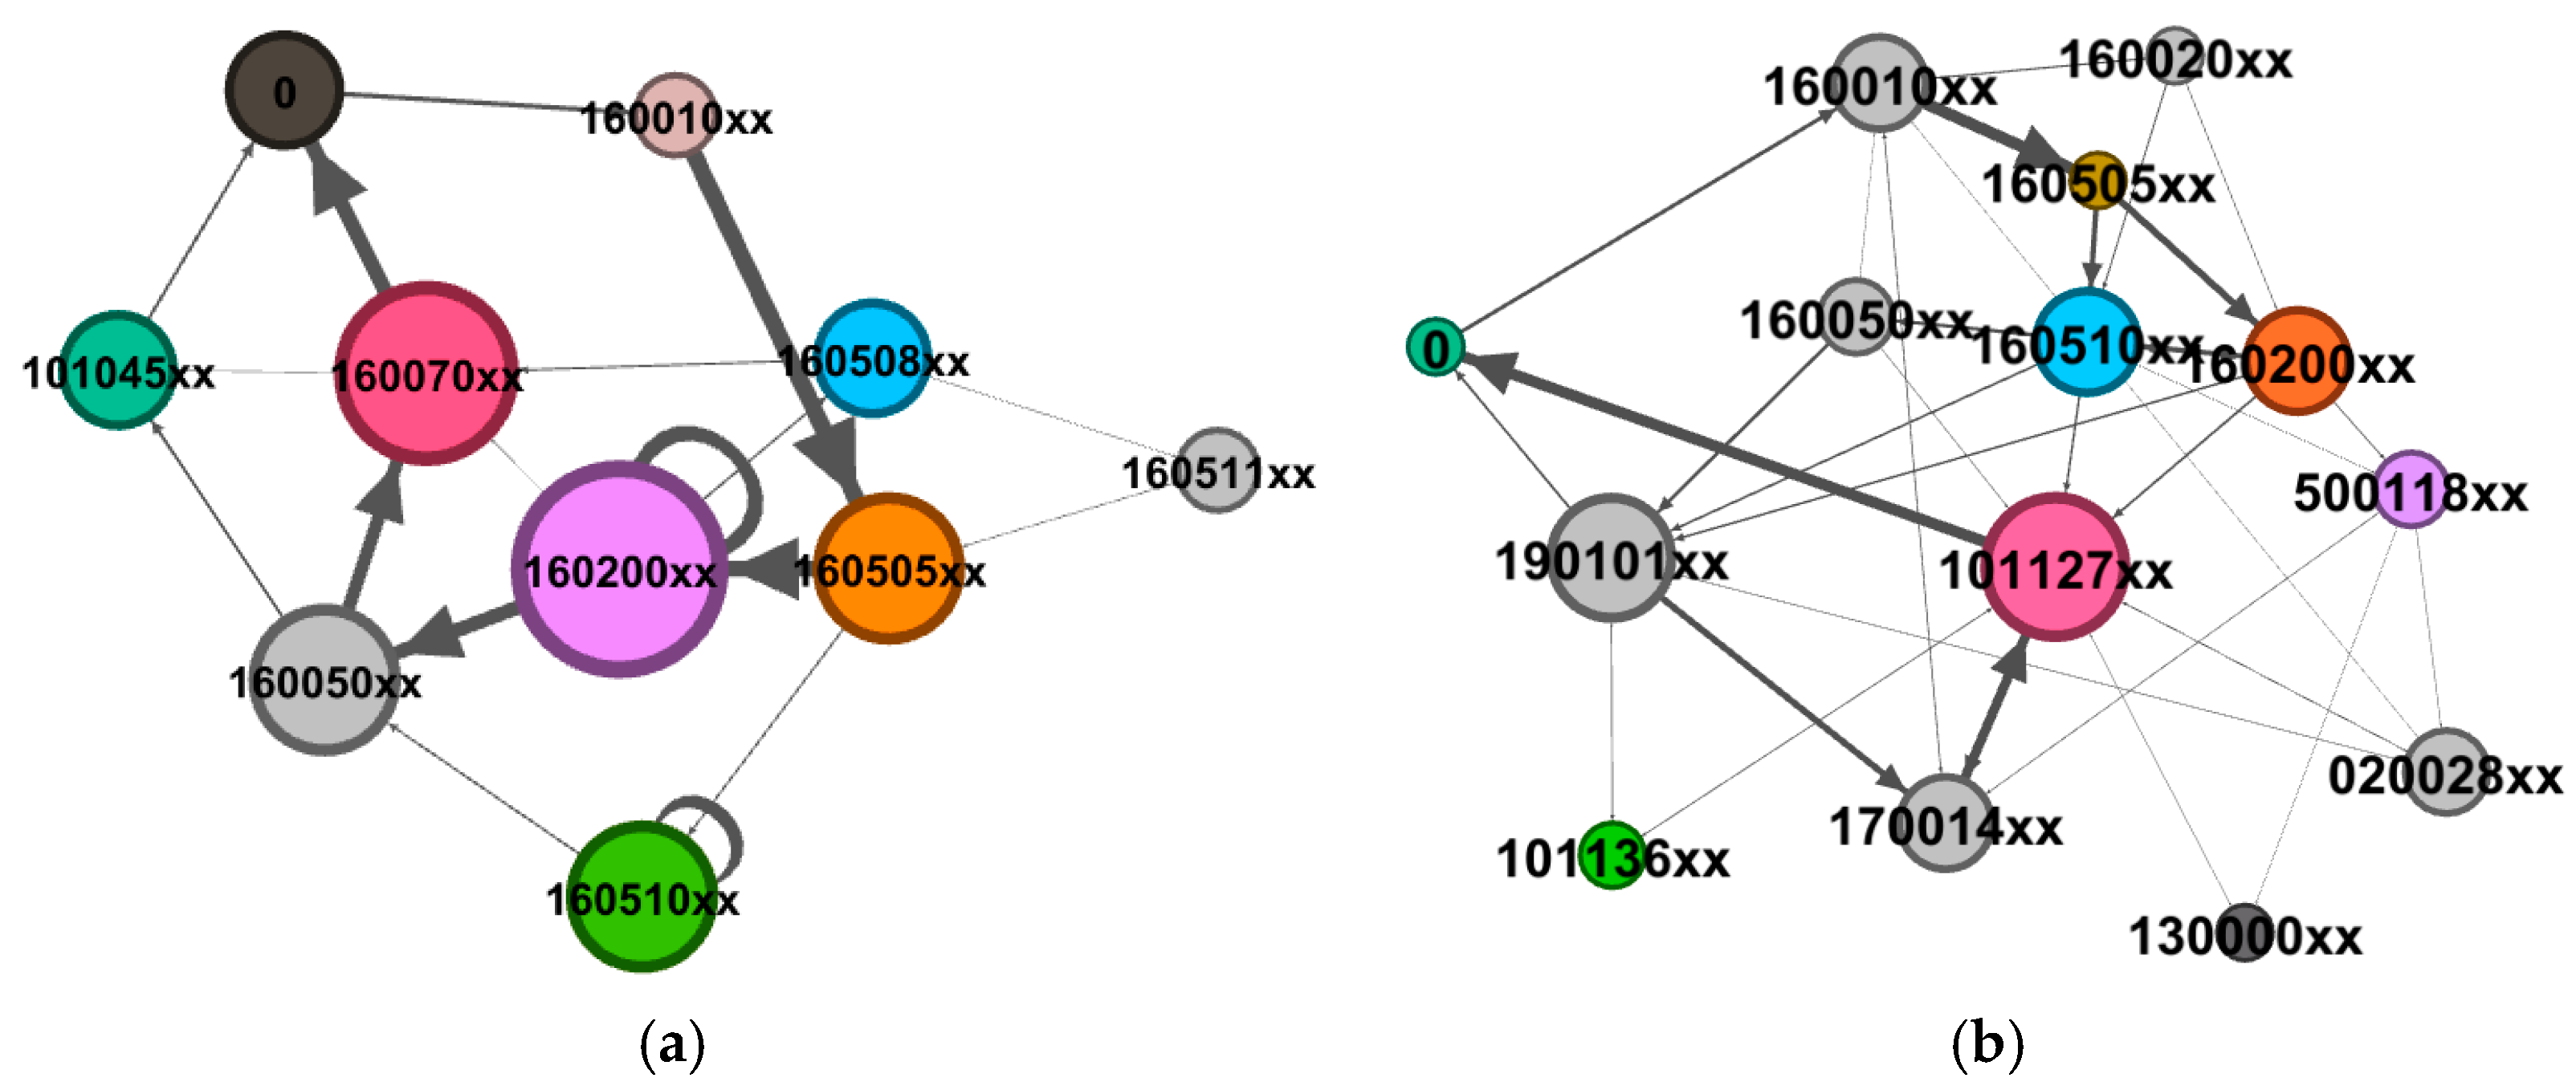
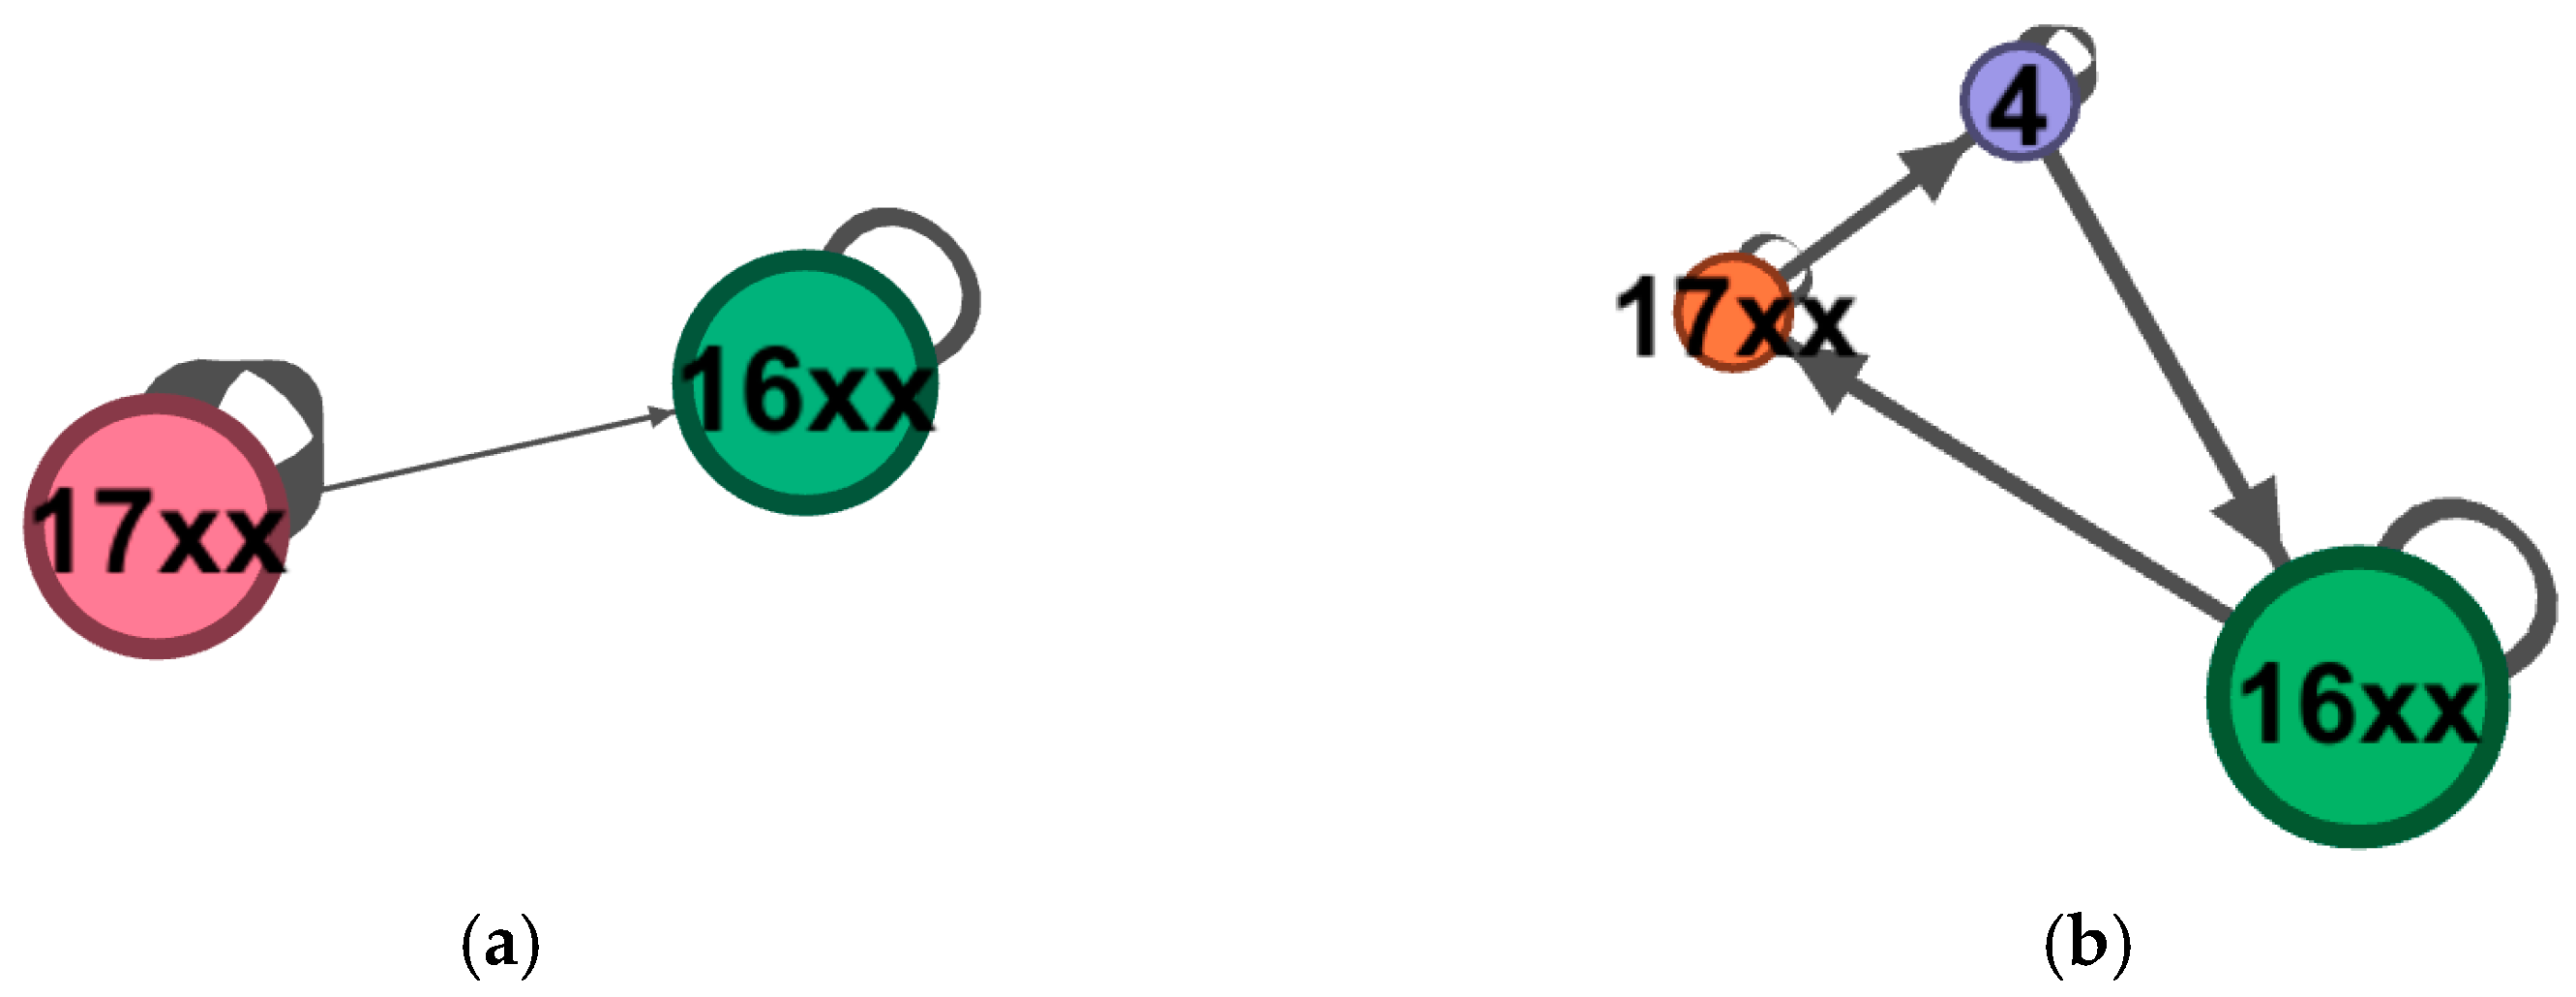
This study additionally utilized SNA to thoroughly investigate the information underlying the process with the event log of performance guarantee, as shown in
Figure 5 and
Figure 6.
It is shown that the larger the circle, the more frequently the node was executed, and the thicker the connecting arcs, the more times the path was executed. Through social networks analysis, it was revealed that the number of business personnel engaged in business processes after the centralization was significantly more than before the centralization, with the introduction of a new department at the head office level. This change may have led to a decrease in process efficiency. Moreover, the social network of personnel indicated that certain activities before the centralization were assigned to the same individual for processing (e.g., 160200xx exhibited a closed loop), suggesting potential non-compliant operations. The quantitative results for the network indicators are detailed in
Table 6.
The statistical results indicated an increase in the number of audit participants, audit participating departments, and network connections after centralization. With regard to personnel in the network, density and average degree increased, while network diameter, average path length, and average clustering coefficient decreased. These findings indicate that the connections among auditors were more intimate, and the reduced number of pathways between auditors signified higher process flexibility.
5.3. Process Evaluation
This study utilized the DEMATEL-AHP method to simplify the framework for the process evaluation indicators and assign weights to quantify the importance of different indicators in each dimension. Specifically, we utilized the principles of the DEMATEL method to identify 15 evaluation indicators with greater centrality tailored to the business context of performance guarantee, given the multitude of evaluation indicators. Furthermore, we used the AHP method to assign weights to the selected indicators. The results are shown in
Appendix A Table A2 and
Appendix A Table A3.
Using the methodology of DEMATEL-AHP, the indicators of process efficiency and process quality were highly ranked and had a significant location within the overall process evaluation framework in terms of the performance guarantee of the case bank. This finding was potentially associated with the strict timeliness requirements of the performance guarantee.
Table 7 summarizes process evaluation results from DEMATEL-AHP and statistical analysis based on process mining, from both subjective and objective perspectives.
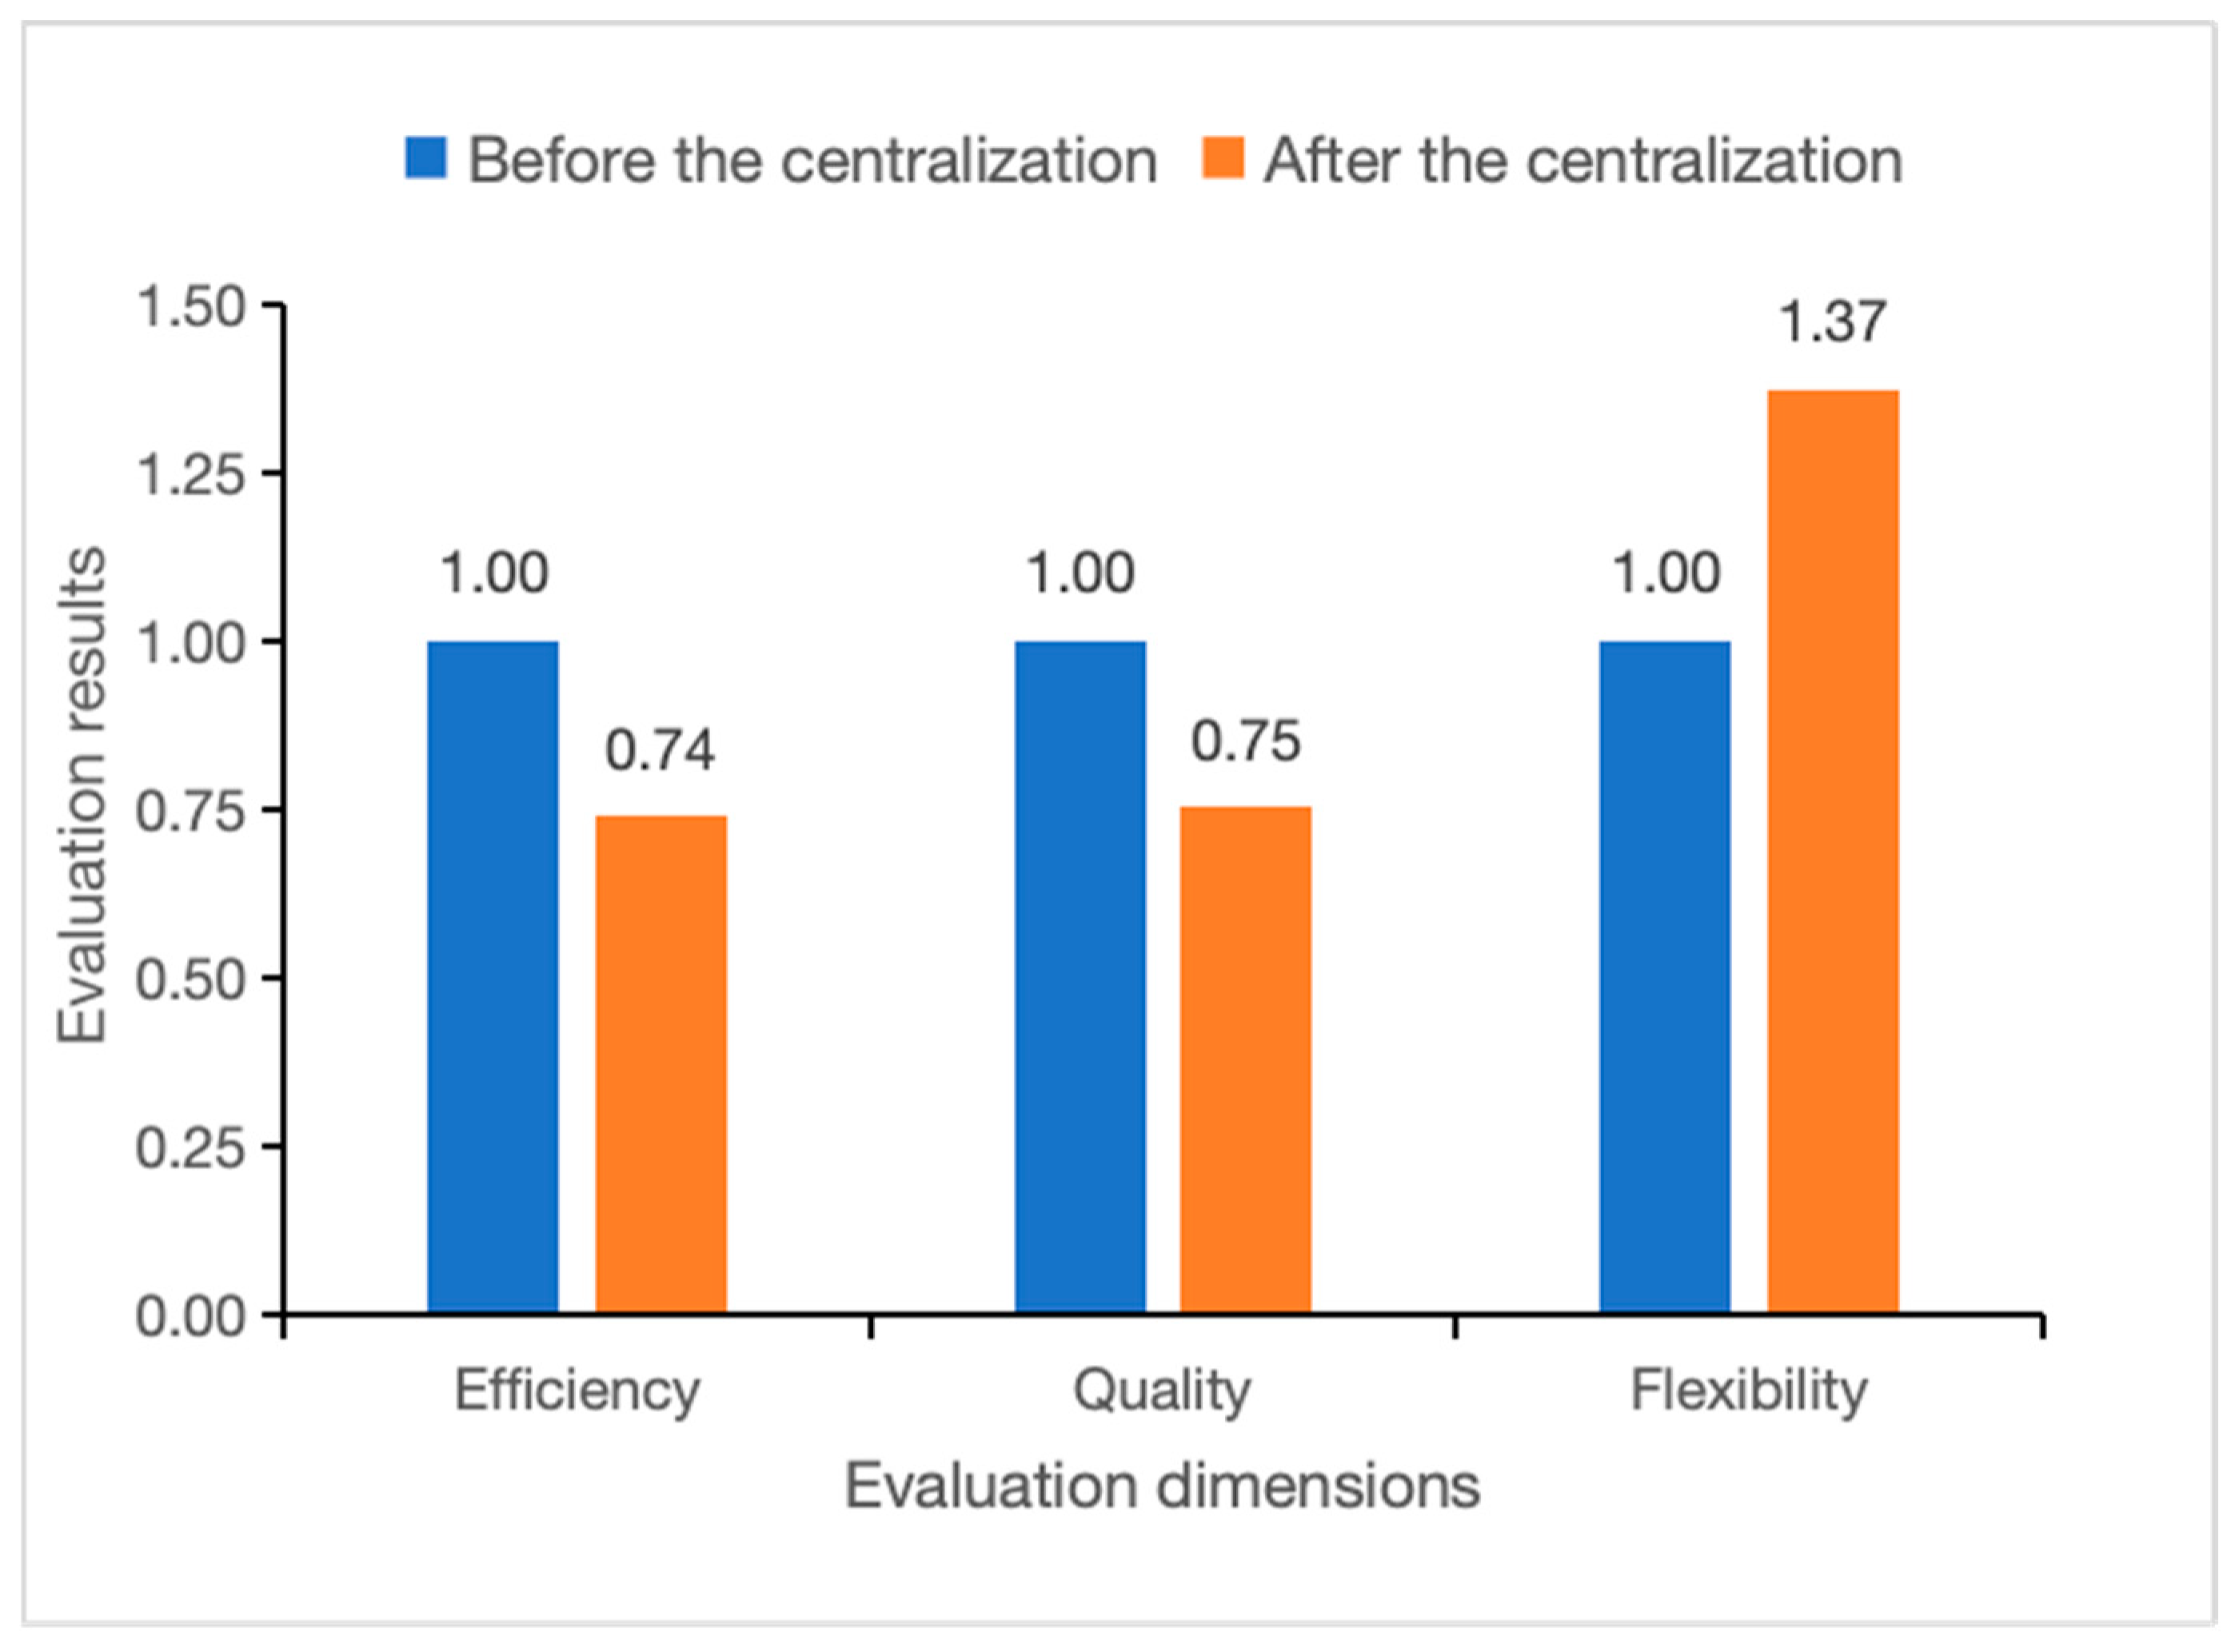
According to the weights of all indicators, we removed the influence of case quantity and the positive and negative polarity of indicators from the results of process evaluation. Thus, we obtained the curves for process evaluation in each dimension, as shown in
Figure 7.
The three baseline columns normalized to unity (1.00) represent pre-centralization process performance metrics, serving as reference values for comparative analysis. The results indicated that processes after centralization exhibited superior flexibility compared to processes before centralization. However, post-centralization processes fell short in terms of efficiency and quality compared with pre-centralization processes. Regarding an explanation, processes before the centralization were adjusted over an extended period and attained considerable stability. However, the employees’ unfamiliarity with processes after centralization and the absence of timely updates to SOPs created impediments in business operations, thereby diminishing both the efficiency and quality of processes, corroborating the social network findings. In addition, pre-centralization processes were mostly approved by the branch bank, but several activities after the centralization were approved by the head office department. The communication limitations between departments also impeded the implementation of business processes. From the perspective of process flexibility, post-centralization processes exhibited increased flexibility, further providing business personnel with increased business processing authority. However, the increased authority given to business personnel may have resulted in non-compliant activities and increased risk.
Moreover, we explored the potential usage of large language models (LLMs) in process evaluation. However, due to scale limitations in this context, it was unfeasible to input the event logs of performance guarantees into LLMs as word prompts. Referring to Alessandro et al. [
50], we employed the PM4PY API tool to abstract the business process into process variants and Petri net representations. The information and word prompts were subsequently integrated into LLMs to evaluate the performance guarantee processes before and after centralization and provide improvement suggestions. A sample is provided in Algorithm 1.
| Algorithm 1. Usage of the pm4py’s OpenAI/GPT-4 integration for process evaluation. |
import pandas as pd
import pm4py
dataframe = pd.read_csv(“performance_guarantee.csv”)
dataframe = pm4py.format_dataframe(dataframe, case_id = ‘caseid’, activity_key = ‘activity’, timestamp_key = ‘dateTime’)
log = pm4py.convert_to_event_log(dataframe)
iq1 = “““\n What are the root causes of issues in the process? Please provide only process and data specific considerations. Please analyze from three aspects: process efficiency, process quality, and process flexibility, no general considerations.”””
print(pm4py.llm.abstract_variants(log) + iq1)
net, im, fm = pm4py.discover_petri_net_inductive(log)
iq2 = “““\n Can you provide suggestions to improve the process model based on your domain knowledge?”””
print(pm4py.llm.abstract_petri_net(net, im, fm) + iq2) |
Using the above algorithm process, the process analysis results and optimization suggestions generated by LLMs are shown in
Table 8.
The results of the LLM analysis were similar to the evaluation results of this study to a certain extent. (1) In terms of process efficiency, the low efficiency of processes before centralization was attributed to excessive approval nodes, while the low efficiency of processes after centralization was due to multiple returns and modifications, leading to a longer overall cycle. (2) In terms of process quality, there were different approval paths in the process prior to centralization; this easily caused redundant reviews. The low quality of processes after centralization may have stemmed from issues with the accuracy of the reported data, thereby compromising overall process quality. This also indirectly indicated that employees may not have been familiar with the new process of performance guarantee. (3) In terms of process efficiency, the flexibility of processes before centralization required modification. Although the flexibility of processes after centralization improved, it remained essential to develop an intelligent diversion mechanism to optimize path allocation.
The process evaluation based on LLMs not only provided a root cause analysis of the processes but also guidance and suggestions for future process optimization. The LLMs demonstrated great potential in the analysis, evaluation, and optimization of business processes and provided an innovative interactive method for business professionals to manage these processes.
5.4. Discussion
This case study clearly demonstrated a trade-off between flexibility and operational rigor in the post-centralization process. The increase in process flexibility resulted from an increase in process variants and a reduction in network diameter. However, this enhancement was accompanied by a trade-off in efficiency and quality. The duration for case completion roughly increased, and 10% of operations diverged from standard operating procedures due to outdated workflows and personnel’s inadequate familiarity. Social network analysis additionally uncovered structural fragmentation. The enlarged scope of audit involvement resulted in diminished departmental coherence, leading to delays in inter-departmental transitions.
This case study on the performance guarantee procedure at the case bank provides essential insights into the trade-offs inherent in organizational reforms, especially centralization efforts. First and foremost, the centralization of business processes enhances procedural flexibility, but unintentionally reduces efficiency and quality. The identified core problems, including increased communication costs between branches and headquarters, fractured departmental partnerships, and initial disorganization stemming from obsolete SOP documentation, suggest feasible managerial actions. Banks implementing similar centralized plans should prioritize the simultaneous updating of SOP documentation, the enhancement of cross-departmental training programs, and investment in communication infrastructure to alleviate initial inefficiencies.
Second, the enhanced process flexibility observed after centralization highlights the need to achieve a careful balance between flexibility and control, especially in relation to compliance risks. The increased flexibility grants employees greater autonomy in executing processes. This is beneficial in a dynamic market environment. However, it simultaneously increases the likelihood of non-compliant behaviors and operational risks. Consequently, the implementation of more robust monitoring mechanisms using real-time deviation detection is of paramount importance.
Third, the structural insights provided by the SNA emphasize that banks must continuously assess their organizational interaction patterns when undertaking significant operational changes. Our findings emphasize the importance of meticulously observing collaboration patterns and promptly resolving structural barriers to maintain operational coherence and compliance integrity during process reform and redesign.
Although the context described here is specific, the managerial challenges encountered, such as efficiency and quality trade-offs, compliance concerns, and organizational dynamics, are revealed. These challenges are pervasive across numerous commercial banking operations globally. Consequently, despite the empirical evidence originating from a specific banking context in China, the suggested multi-dimensional evaluation framework is extremely flexible and scalable, providing generalizable insights into a wider range of commercial banking operations. Due to the generalizability of our framework, other commercial banks can utilize the suggested methodology to perform similar dynamic process evaluations. Despite differences in the legal landscape, organizational architecture, and IT systems potentially influencing particular implementation aspects, the essential elements of the process evaluation framework remain resilient and adaptable. Future research could extend our framework to diverse banking contexts, further validating and enhancing its external validity.
6. Conclusions
This study proposed a data-driven framework for evaluating business processes in commercial banks, addressing the critical limitations of traditional post-hoc qualitative methods. By integrating process mining with the DEMATEL-AHP hybrid model, we demonstrated how real-time event logs can systematically quantify interactions among three core dimensions, including process efficiency, quality, and flexibility, to enhance financial stability and regulatory compliance.
Through an empirical case study considering a Chinese bank’s performance guarantee process, we revealed a paradoxical trade-off between flexibility and operational rigor after the centralization of the audit authority. Specifically, post-centralization workflows exhibited improved flexibility, but at the cost of reduced efficiency and quality. This decline was attributed to two key factors: (1) employees’ unfamiliarity with newly centralized procedures, leading to inconsistent SOP adherence, and (2) increased inter-departmental communication limitations, particularly between branch offices and headquarters, which introduced bottlenecks in critical handovers. This procedural inefficiency not only affected internal compliance but also directly impacted service delivery, potentially degrading customer satisfaction due to longer waiting times and inconsistent service experiences.
However, this study presents several limitations for further research. First, this empirical research was confined to a single business scenario, namely, performance guarantee. Future research should extend this framework to other financial processes to verify its generalizability, such as loan approvals and fraud detection. Specifically, further case studies involving diverse types of banks (e.g., state-owned, regional, or digital banks) and processes with varied complexity would provide richer empirical evidence. Additionally, investigating cross-case similarities and differences will help validate the robustness and adaptability of the proposed framework across different operational and regulatory environments.
Second, although this study emphasizes compliance and operational dimensions, the current framework insufficiently addresses critical performance drivers, such as organizational structure, employee skill level, and the degree of computerization. Incorporating critical performance drivers explicitly into future frameworks will allow banks to pinpoint more precisely how these factors influence efficiency through streamlined structures, how these factors influence quality through enhanced employee skills, and how these factors influence flexibility through advanced technological support.
Third, although the framework relies on near-real-time event logs, its applicability in scenarios with poor data quality and integrity requires further investigation. Given the highly regulated nature of the banking sector, future research should provide more in-depth analyses regarding regulatory compliance constraints, such as the Data Security Law of the People’s Republic of China (DSLPRC), the Personal Information Protection Law (PIPL), and specific audit standards such as internal control and data governance guidelines issued by Chinese regulatory authorities. Explicit discussions of how these regulations shape the acquisition, processing, storage, and usage of event log data in data-driven process evaluation would enhance practical relevance. Future work should explore the practical implementation challenges, such as event log standardization, unified management of data access rights across departments, and balancing data-sharing with privacy protection.
Finally, although the current model emphasizes descriptive analytics, integrating predictive AI techniques, such as Long Short-Term Memory(LSTM) for real-time deviation prediction [
51,
52], or graph neural networks (GNNs) for dynamic social network analysis [
53], it could significantly enhance proactive risk mitigation capabilities. Such predictive capabilities would not only enhance proactive risk mitigation but also optimize customer service by enabling banks to proactively identify and prevent process failures, thereby maintaining service quality and operational reliability. In addition, the long-term adaptability of the framework requires the continuous integration of emerging technologies. LLMs could automate SOP updates by analyzing regulatory texts and event logs synchronously [
54,
55], while real-time data streams may further reduce latency in process monitoring [
56].
In summary, to support the intelligent transformation of commercial banks, we recommend expanding data-driven process evaluation across broader application scenarios. Future efforts should also incorporate key indicators into the evaluation framework to enable more targeted and effective process improvements. To guarantee the viability of log-based analysis, data governance under existing regulatory frameworks must be strengthened, especially with regard to data quality, standardization, and cross-departmental access control. Furthermore, proactive risk management and service reliability will be further improved by the responsible integration of AI-driven technologies such as LSTMs, GNNs, and LLMs into process monitoring and optimization. Ultimately, a hybrid approach that combines operational data, customer feedback, and regulatory insights will be crucial for building adaptive, intelligent, and resilient process management systems in the evolving financial landscape.
Author Contributions
Conceptualization, Z.N., Y.L. and B.X.; methodology, Z.N. and Y.L.; software, Z.N.; validation, Z.N., Y.L. and B.X.; formal analysis, Z.N. and Y.L.; investigation, Z.N.; resources, Z.N.; data curation, Z.N.; writing—original draft preparation, Z.N. and Y.L.; writing—review and editing, Z.N. and Y.L.; visualization, Z.N. and Y.L.; supervision, B.X.; project administration, Z.N., Y.L. and B.X.; funding acquisition, B.X. All authors have read and agreed to the published version of the manuscript.
Funding
This research was funded by the National Natural Science Foundation of China (special project “Modeling and Optimization of Financial Service Based on Data and Behavior”, grant number 72342024; “Technology Finance: Theories and Empirical Evidence”, grant number 72495150; “Bounded Rationality of Financial Consumers, Misconduct of Financial Institutions and Suboptimal Financial Consumption Decisions”, grant number 72071102) and National Social Science Foundation of China (special project “Research on the Innovative Path of Social Credit System in the Modernization of Social Governance”, grant number 23&ZD175).
Institutional Review Board Statement
Not applicable.
Informed Consent Statement
Not applicable.
Data Availability Statement
The data presented in this study are available on request from the corresponding author due to privacy reasons for the restriction.
Conflicts of Interest
Zaiwen Ni is a postdoctoral research fellow jointly affiliated with the Postdoctoral Research Station of Nanjing University and the Postdoctoral Research Workstation of Suzhou International Development Group Co., Ltd. The authors declare that this collaboration does not involve any commercial or financial relationships that could be construed as a potential conflict of interest.
Abbreviations
The following abbreviations are used in this manuscript:
| SNA | Social Network Analysis |
| SOP | Standard Operating Procedure |
| BPM | Business Process Management |
| BPMM | Business Process Maturity Model |
| BSC | Balanced Scorecard |
| RPA | Robotic Process Automation |
| PCA | Principal Component Analysis |
| DEMATEL | Decision-Making Trial and Evaluation Laboratory |
| AHP | Analytic Hierarchy Process |
| D/F | Dependency/Frequency |
| DFG | Directly Follow Graph |
| DSLPRC | Data Security Law of the People’s Republic of China |
| PIPL | Personal Information Protection Law |
| LLM | Large Language Model |
| LSTM | Long Short-Term Memory |
| GNNs | Graph Neural Networks |
Appendix A
Appendix A.1. Questionnaire for Process Evaluation
| Expert Background | |
| Years of experience in banking processes: | |
| Role/Position: | |
| This questionnaire aims to assess the interrelationships among process evaluation indicators using the DEMATEL method. Your expertise will help identify causal relationships and the degree of influence between these indicators. Please evaluate how each indicator (rows) influences others (columns) using the scale below. |
Instructions
1. Review the list of indicators (Table A1) and their descriptions.
2. For each row indicator, rate its influence on every column indicator using the 0–4 scale.
0: No influence 1: Low influence 2: Moderate influence 3: High influence 4: Very high influence
3. If an indicator has no logical influence on another, mark “0”. |
| Please fill in the matrix below: |
| For each row indicator, they are influencing indicators. For each column indicator, they are influenced indicators. |
Influencing Indicator →
Influenced Indicator ↓ | X1 | X2 | X3 | X4 | X5 | X6 | X7 | X8 | … | L9 | L10 | L11 | L12 |
| X1 | 0 | | | | | | | | | | | | |
| X2 | | 0 | | | | | | | | | | | |
| X3 | | | 0 | | | | | | | | | | |
| X4 | | | | 0 | | | | | | | | | |
| X5 | | | | | 0 | | | | | | | | |
| X6 | | | | | | 0 | | | | | | | |
| X7 | | | | | | | 0 | | | | | | |
| X8 | | | | | | | | 0 | | | | | |
| … | | | | | | | | | … | | | | |
| L9 | | | | | | | | | | 0 | | | |
| L10 | | | | | | | | | | | 0 | | |
| L11 | | | | | | | | | | | | 0 | |
| L12 | | | | | | | | | | | | | 0 |
Table A1.
The framework of process evaluation indicators.
Table A1.
The framework of process evaluation indicators.
| Dimensions | Indicators | Description | Code |
|---|
Process
Efficiency | The longest/shortest/average/median completion time of cases | Calculates the longest/shortest/average/median completion time of cases | X1~X4 |
| The longest/shortest/average/median execution time of activities | Analyzes the activity involved in each case and calculates the longest/shortest/average/median execution time of activities | X5~X8 |
| The longest/shortest/average/median execution time of the most common process variants in each case | Calculates the longest/shortest/average/median execution time of the most common process variants in each case | X9~X12 |
| The average/median execution time of all process variants | Calculates the average/median execution time of all process variants | X13~X14 |
Process
Quality | The standard deviation | Calculates the standard deviation of the execution time of cases; if process quality is high, the execution time of cases will have less volatility
| Z1 |
| The matching rate for cases | Measured by dividing the execution paths permitted by the SOP flowchart in each case by the total number of paths in all cases
| Z2 |
| The matching rate for variants | Measured by dividing the execution variants permitted by the SOP flowchart in each case by the total number of variants in all cases
| Z3 |
| The proportion of deviation activities/paths/cases | Calculates the percentage of deviant activities/paths/cases | Z4~Z6 |
| The one-time pass rate of the business | Calculates the percentage of cases without loops; if process quality is high, the indicator will be high
| Z7 |
| The standard deviation of the average duration of processes that can be successfully addressed | Calculates the standard deviation of the average time of processes that can be successfully addressed; if process quality is high, the time of successfully addressed processes will be similar
| Z8 |
| The return rate of processes | Calculates the percentage of return in processes; if process quality is high, the indicator will be low
| Z9 |
| The average number of cases included in process variants | Calculates the average number of cases included in process variants; if process quality is higher, the number of process variants will be higher, resulting in the decline of the indicator
| Z10 |
Process
Flexibility | The number of process variants in the SOP flowchart/ the number of process variants in the deviations/ the total number of process variants | Calculates the number of process variants appearing in the SOP flowchart, the number of process variants appearing in the deviations, and the total number of process variants; the higher the number of variants, the more flexible the process | L1~L3 |
| The number of minor/major/total cases included in variants | Calculates the number of cases in the first 80% of variants, the number of cases in the last 20% of variants, and the total number of cases involved in the variants | L4~L6 |
| The ratio of the maximum number of cases included in each variant to the total number of cases | Aims to find the maximum number of cases involved in each variant and calculates the ratio of the maximum number of cases to the total number
| L7 |
| The average number of paths/activities of variants | Calculates the average number of paths/activities of the variants; if the average number of paths/activities of the variants is higher, this means that the process is more flexible | L8~L9 |
| The mean of the in/out-degree of nodes in the SOP flowchart | If the mean of the in/out-degree of nodes is higher, this means that the process is more flexible | L10 |
| The mean of the in/out-degree of nodes in the deviation process | L11 |
| The mean of the node in/out-degree of the process model produced by process discovery algorithms | L12 |
Table A2.
The calculation results of DEMATEL.
Table A2.
The calculation results of DEMATEL.
First-Level
Dimension | Code | Secondary Dimension | Influencing Degree | Influenced Degree | Centrality Degree | Cause Degree |
|---|
Process
Efficiency | X3 | The average completion time of cases | 1.261680 | 1.542437 | 2.804117 | −0.28076 |
| X7 | The average execution time of the most common process variants in each case | 1.245133 | 1.500359 | 2.745492 | −0.25523 |
| X11 | The average execution time of all process variants | 1.377733 | 1.349405 | 2.727138 | 0.028328 |
| X13 | The average execution time of activities | 1.172580 | 1.411153 | 2.583733 | −0.23857 |
Process
Quality | Z1 | The standard deviation | 1.028089 | 1.442609 | 2.470698 | −0.41452 |
| Z2 | The matching rate for cases | 1.056534 | 1.727010 | 2.783544 | −0.67048 |
| Z3 | The matching rate for variants | 1.307704 | 0.969577 | 2.277281 | 0.338127 |
| Z6 | The proportion of deviation cases | 1.360562 | 0.945558 | 2.30612 | 0.415005 |
| Z7 | The one-time pass rate of the business | 1.979496 | 0.707431 | 2.686927 | 1.272065 |
| Z9 | The return rate of processes | 1.395815 | 0.874086 | 2.269900 | 0.521729 |
| Z10 | The average number of cases included in process variants | 1.330780 | 1.160963 | 2.491742 | 0.169817 |
Process
Flexibility | L1 | The total number of process variants | 1.846279 | 0.547540 | 2.393819 | 1.298739 |
| L7 | The ratio of the maximum number of cases included in each variant to the total number of cases | 0.956362 | 1.390355 | 2.346716 | −0.43399 |
| L9 | The average number of paths of variants | 0.999034 | 1.366067 | 2.365101 | −0.36703 |
| L12 | The mean of the node in/out-degree of the process model produced by the process discovery algorithm | 1.765015 | 0.477418 | 2.242433 | 1.287598 |
Table A3.
The calculation results of AHP.
Table A3.
The calculation results of AHP.
First-Level
Dimension | First-Level Weight | Code | Secondary Dimension | Secondary Weight | Total Weight | Sorting |
|---|
Process
Efficiency | 0.389 | X3 | The average completion time of cases | 0.386 | 0.150 | 1 |
| X7 | The average execution time of the most common process variants in each case | 0.145 | 0.056 | 8 |
| X11 | The average execution time of all process variants | 0.188 | 0.073 | 6 |
| X13 | The average execution time of activities | 0.281 | 0.109 | 2 |
Process
Quality | 0.412 | Z1 | The standard deviation | 0.132 | 0.055 | 9 |
| Z2 | The matching rate for cases | 0.108 | 0.045 | 11 |
| Z3 | The matching rate for variants | 0.069 | 0.029 | 14 |
| Z6 | The proportion of deviation cases | 0.185 | 0.076 | 5 |
| Z7 | The one-time pass rate of the business | 0.231 | 0.095 | 3 |
| Z9 | The return rate of processes | 0.211 | 0.087 | 4 |
| Z10 | The average number of cases included in process variants | 0.063 | 0.026 | 15 |
Process
Flexibility | 0.199 | L1 | The total number of process variants | 0.312 | 0.062 | 7 |
| L7 | The ratio of the maximum number of cases included in each variant to the total number of cases | 0.198 | 0.039 | 13 |
| L9 | The average number of paths of variants | 0.266 | 0.053 | 10 |
| L12 | The mean of the node in/out-degree of the process model produced by the process discovery algorithm | 0.225 | 0.045 | 11 |
References
- van der Aalst, W.M.P.; La Rosa, M.; Santoro, F.M. Business Process Management Don’t Forget to Improve the Process! Bus. Inf. Syst. Eng. 2016, 58, 1–6. [Google Scholar] [CrossRef]
- Johnson, J.C. Social-Structures—A Network Approach; Wellman, B., Berkowitz, S.D., Eds.; CUP Archive: Cambridge, UK, 1988; Volume 90, pp. 1000–1001. [Google Scholar]
- Aalst, W.V.D. Process Mining: Data Science in Action; Springer Publishing Company: Berlin/Heidelberg, Germany, 2016. [Google Scholar]
- Aalst, W.M.P. Process Mining: Overview and Opportunities. ACM Trans. Manag. Inf. Syst. 2012, 3, 1–17. [Google Scholar] [CrossRef]
- van der Aalst, W.M.P. Process Mining: Discovery, Conformance and Enhancement of Business Processes; Springer: Berlin/Heidelberg, Germany, 2012. [Google Scholar]
- Cook, J.E.; Wolf, A.L.; Assoc Comp, M. In Automating process discovery through event-data analysis. In Proceedings of the 17th International Conference on Software Engineering, Seattle, WA, USA, 23–30 April 1995. [Google Scholar]
- Agrawal, R.; Gunopulos, D.; Leymann, F. Mining process models from workflow logs. In Advances in Database Technology—Edbt’98; Schek, H.J., Saltor, F., Ramos, I., Alonso, G., Eds.; Springer: Berlin/Heidelberg, Germany, 1998; Volume 1377, pp. 469–483. [Google Scholar]
- van der Aalst, W.; Weijters, T.; Maruster, L. Workflow mining: Discovering process models from event logs. IEEE Trans. Knowl. Data Eng. 2004, 16, 1128–1142. [Google Scholar] [CrossRef]
- Weijters, A.; van der Aalst, W.M.P. Rediscovering workflow models from event-based data using little thumb. Integr. Comput.-Aided Eng. 2003, 10, 151–162. [Google Scholar] [CrossRef]
- Weijters, A.J.; van Der Aalst, W.M.; De Medeiros, A.A. Process Mining with the Heuristics Miner Algorithm; Eindhoven University of Technology: Eindhoven, The Netherlands, 2006. [Google Scholar]
- De Medeiros, A.A.; Weijters, A.J.M.M.; Van Der Aalst, W.M. Using Genetic Algorithms to Mine Process Models: Representation, Operators and Results; Eindhoven University of Technology: Eindhoven, The Netherlands, 2005. [Google Scholar]
- van der Aalst, W.; Buijs, J.; van Dongen, B. Towards Improving the Representational Bias of Process Mining. In Proceedings of the 1st International Symposium on Data-Driven Process Discovery and Analysis (SIMPDA), Campione d’Italia, Italy, 29 June–1 July 2011. [Google Scholar]
- Gunther, C.W.; van der Aalst, W.M.R. Fuzzy mining—Adaptive process simplification based on multi-perspective metrics. In Proceedings of the 5th International Conference on Business Process Management, Brisbane, Australia, 24–28 September 2007. [Google Scholar]
- Leemans, S.J.J.; Fahland, D.; Aalst, W.M.P. Discovering Block-Structured Process Models from Event Logs—A Constructive Approach. In Proceedings of the Application and Theory of Petri Nets and Concurrency—34th International Conference, PETRI NETS 2013, Milan, Italy, 24–28 June 2013. [Google Scholar]
- Le, M.; Gabrys, B.; Nauck, D. A hybrid model for business process event and outcome prediction. Expert Syst. 2017, 34, e12079. [Google Scholar] [CrossRef]
- Tama, B.A.; Comuzzi, M.; Ko, J. An Empirical Investigation of Different Classifiers, Encoding, and Ensemble Schemes for Next Event Prediction Using Business Process Event Logs. ACM Trans. Intell. Syst. Technol. 2020, 11, 1–34. [Google Scholar] [CrossRef]
- De Smedt, J.; De Weerdt, J.; Vanthienen, J. Multi-paradigm Process Mining: Retrieving Better Models by Combining Rules and Sequences. In Proceedings of the On the Move (OTM) Event, Amantea, Italy, 27–31 October 2014. [Google Scholar]
- Broucke, S.; De Weerdt, J. Fodina: A robust and flexible heuristic process discovery technique. Decis. Support Syst. 2017, 100, 109–118. [Google Scholar] [CrossRef]
- Bergenthum, R. In Prime Miner—Process Discovery using Prime Event Structures. In Proceedings of the 1st International Conference on Process Mining (ICPM), Aachen, Germany, 24–26 June 2019. [Google Scholar]
- Augusto, A.; Conforti, R.; Dumas, M.; La Rosa, M.; Polyvyanyy, A. Split miner: Automated discovery of accurate and simple business process models from event logs. Knowl. Inf. Syst. 2019, 59, 251–284. [Google Scholar] [CrossRef]
- Aalst, W.M.P.V.D.; Reijers, H.A.; Song, M. Discovering Social Networks from Event Logs. Comput. Support. Coop. Work 2005, 14, 549–593. [Google Scholar] [CrossRef]
- Ye, J.H.; Li, Z.W.; Yi, K.; Al-Ahmari, A. Mining Resource Community and Resource Role Network From Event Logs. IEEE Access 2018, 6, 77685–77694. [Google Scholar] [CrossRef]
- Song, M.; Van der Aalst, W.M. Towards comprehensive support for organizational mining. Decision. Support Syst. 2009, 46, 300–317. [Google Scholar] [CrossRef]
- Rodríguez-Quintero, J.-F.; Sánchez-Díaz, A.; Iriarte-Navarro, L.; Maté, A.; Trujillo, J. Fraud Audit Based on Visual Analysis: A Process Mining Approach. Appl. Sci. 2021, 11, 4751. [Google Scholar] [CrossRef]
- Srivastava, S. Process Mining Techniques for Detecting Fraud in Banks: A Study. Turk. J. Comput. Math. Educ. 2021, 12, 3358–3375. [Google Scholar]
- Bautista, A.D.; Wangikar, L.; Akbar, S.M.K. Process Mining-Driven Optimization of a Consumer Loan Approvals Process The BPIC 2012 Challenge Case Study. In Proceedings of the 10th International Conference on Business Process Management (BPM), Tallinn, Estonia, 3–6 September 2012. [Google Scholar]
- Moreira, C.; Haven, E.; Sozzo, S.; Wichert, A. Process mining with real world financial loan applications: Improving inference on incomplete event logs. PLoS ONE 2018, 13, e020780. [Google Scholar] [CrossRef] [PubMed]
- Borkowski, M.; Fdhila, W.; Nardelli, M.; Rinderle-Ma, S.; Schulte, S. Event-based Failure Prediction in Distributed Business Processes. Inf. Syst. 2017, 81, 220–235. [Google Scholar] [CrossRef]
- Tillu, R.; Muthusubramanian, M.; Periyasamy, V. From Data to Compliance: The Role of AI/ML in Optimizing Regulatory Reporting Processes. J. Knowl. Learn. Sci. Technol. 2023, 2, 381–391. [Google Scholar] [CrossRef]
- Paripati, L.K.; Agarwal, A.; Shah, J.; Narukulla, N.; Hajari, V.R. The Impact of AI on Regulatory Compliance and Anti-Money Laundering Efforts in Payment Processing. J. Res. Appl. Sci. Biotechnol. 2023, 2, 241–252. [Google Scholar] [CrossRef]
- Szelagowski, M.; Berniak-Wozny, J. The adaptation of business process management maturity models to the context of the knowledge economy. Bus. Process Manag. J. 2019, 26, 212–238. [Google Scholar] [CrossRef]
- Hoque, Z. 20 years of studies on the balanced scorecard: Trends, accomplishments, gaps and opportunities for future research. Br. Account. Rev. 2014, 46, 33–59. [Google Scholar] [CrossRef]
- Sang, P.; Li, W. Comprehensive Benefit Evaluation of Business Process Reengineering Measures for the Whole Process Engineering Consultancy Based on Entropy Weight Method-TOPSIS. Proj. Manag. Technol. 2024, 22, 98–103. [Google Scholar]
- Van Looy, A.; Shafagatova, A. Business process performance measurement: A structured literature review of indicators, measures and metrics. SpringerPlus 2016, 5, 1797. [Google Scholar] [CrossRef] [PubMed]
- Plattfaut, R.; Rehse, J.-R.; Jans, C.; Schulte, M.; van Wendel de Joode, J. Robotic process automation—Research impulses from the BPM 2023 panel discussion. Process Sci. 2024, 1, 5. [Google Scholar]
- Kozak, M.; Iefremova, O. Implementation of the Delphi technique in finance. E-Finans. Financ. Internet Q. 2014, 10, 36–45. [Google Scholar]
- Saaty, T.L. Decision making—the Analytic Hierarchy and Network Processes (AHP/ANP). J. Syst. Sci. Syst. Eng. 2004, 13, 1–35. [Google Scholar]
- Shi, Y.; Liu, J.; Yu, Z.; Li, Y. Research on the Enterprise Financial Risk Assessment Model Based on Entropy Weight-MABAC Method: A Case Study of Group A. China Certif. Public Account. 2024, 5, 116–121. [Google Scholar]
- Zhang, K. Research on the Application of Principal Component Analysis in Portfolio Investment. E-Commer. Rev. 2024, 13, 6. [Google Scholar]
- Zhu, H. Research on Credit Risk Assessment Model of Commercial Banks Based on AHP-Fuzzy Comprehensive Evaluation Method. Intell. Comput. Appl. 2020, 4, 4. [Google Scholar]
- Huo, Y.; Han, Z. Research on the Method for Determining Multi-index Weights Based on Generalized Maximum Entropy Principle and Genetic Algorithm. Math. Stat. Manag. 2005, 24, 7. [Google Scholar]
- van der Aalst, W.; Weijters, A. Process mining: A research agenda. Comput. Ind. 2004, 53, 231–244. [Google Scholar] [CrossRef]
- Hosseinpour, M.; Jans, M. Auditors’ Categorization of Process Deviations. J. Inf. Syst. 2024, 38, 67–89. [Google Scholar] [CrossRef]
- Berti, A.; Zelst, S.V.; Schuster, D. PM4Py: A process mining library for Python. Softw. Impacts 2023, 17, 100556. [Google Scholar] [CrossRef]
- Si, S.-L.; You, X.-Y.; Liu, H.-C.; Zhang, P. DEMATEL Technique: A Systematic Review of the State-of-the-Art Literature on Methodologies and Applications. Math. Probl. Eng. 2018, 2018, 3696457. [Google Scholar] [CrossRef]
- Shi, L.; Jia, Y.; Liu, Q. Exploratory Research into Influence Factors of Team Goal Orientation: Based on the Methods of Grounded Theory and Concept Lattice-Weighted Group DEMATEL. Oper. Res. Manag. Sci. 2016, 25, 104–112. [Google Scholar]
- Sarkis, J.; Talluri, S. A Synergistic Framework for Evaluating Business Process Improvements. Int. J. Flex. Manuf. Syst. 2002, 14, 53–71. [Google Scholar] [CrossRef]
- Reijiers, H.A.; Mansar, S.L. Best practices in business process redesign: An overview and qualitative evaluation of successful redesign heuristics. Omega-Int. J. Manag. Sci. 2005, 33, 283–306. [Google Scholar] [CrossRef]
- Cho, M.; Song, M.; Comuzzi, M.; Yoo, S. Evaluating the effect of best practices for business process redesign: An evidence-based approach based on process mining techniques. Decis. Support Syst. 2017, 104, 92–103. [Google Scholar] [CrossRef]
- Berti, A.; Schuster, D.; van der Aalst, W.M.P. Abstractions, scenarios, and prompt definitions for process mining with llms: A case study. In International Conference on Business Process Management; Springer Nature: Cham, Switzerland, 2023; pp. 427–439. [Google Scholar]
- Tax, N.; Verenich, I.; La Rosa, M.; Dumas, M. Predictive Business Process Monitoring with LSTM Neural Networks. In Advanced Information Systems Engineering; Springer International Publishing: Berlin/Heidelberg, Germany, 2017; pp. 477–492. [Google Scholar]
- Pham, D.L.; Ahn, H.; Kim, K.S.; Kim, K.P. Process-Aware Enterprise Social Network Prediction and Experiment Using LSTM Neural Network Models. IEEE Access 2021, 9, 57922–57940. [Google Scholar] [CrossRef]
- Min, S.; Gao, Z.; Peng, J.; Wang, L.; Fang, B. STGSN—A Spatial-Temporal Graph Neural Network framework for time-evolving social networks. Knowl.-Based Syst. 2021, 214, 106746. [Google Scholar] [CrossRef]
- Lashkevich, K.; Milani, F.; Avramenko, M.; Dumas, M. Llm-assisted optimization of waiting time in business processes: A prompting method. In International Conference on Business Process Management; Springer Nature: Cham, Switzerland, 2024; pp. 474–492. [Google Scholar]
- Fani Sani, M.; Sroka, M.; Burattin, A. Llms and process mining: Challenges in rpa: Task grouping, labelling and connector recommendation. In International Conference on Process Mining; Springer Nature: Cham, Switzerland, 2023; pp. 379–391. [Google Scholar]
- Malek, Y.N.; Kharbouch, A.; Khoukhi, H.E.; Bakhouya, M.; Florio, V.D.; Ouadghiri, D.E.; Latre, S.; Blondia, C. On the use of IoT and Big Data Technologies for Real-time Monitoring and Data Processing. Procedia Comput. Sci. 2017, 113, 429–434. [Google Scholar] [CrossRef]
| Disclaimer/Publisher’s Note: The statements, opinions and data contained in all publications are solely those of the individual author(s) and contributor(s) and not of MDPI and/or the editor(s). MDPI and/or the editor(s) disclaim responsibility for any injury to people or property resulting from any ideas, methods, instructions or products referred to in the content. |
© 2025 by the authors. Licensee MDPI, Basel, Switzerland. This article is an open access article distributed under the terms and conditions of the Creative Commons Attribution (CC BY) license (https://creativecommons.org/licenses/by/4.0/).


