Abstract
As global energy demand grows and the focus on environmental sustainability intensifies, wind energy, as a form of clean energy, plays a pivotal role in the global energy transition. The public–private partnership (PPP) model, by integrating resources from both the public and private sectors, effectively propels the implementation of wind energy projects. However, these projects face a myriad of risks during both development and operation, making effective risk management crucial to project success. This paper, through literature analysis and System Dynamics methodology, develops a risk diversification indicator system that covers the entire project lifecycle. In addition, by combining the improved G1 weighting method and the entropy method, a dynamic risk model is established. Furthermore, through numerical simulation and sensitivity analysis, the risk levels of each subsystem and the key boundary risk factors are identified, and a set of highly adaptable risk diversification strategies is proposed. These strategies will enhance the resilience of wind energy PPP projects, foster trust among stakeholders, help participants effectively respond to and predict risk evolution, improve the project’s risk tolerance, and ensure its long-term sustainable operation.
1. Introduction
The growth of global energy demand and the increasing focus on environmental sustainability are driving the green transformation of the energy sector [1]. In this context, the international community is developing a series of policy frameworks to support renewable energy, aiming to optimize the energy structure and accelerate the transition to green energy [2]. These policies are intended to alleviate the environmental burden caused by traditional energy sources and to address the growing energy demand by promoting renewable resources, such as wind and solar energy, thereby achieving long-term environmental and economic sustainability [3]. Among these, wind energy, as a renewable, clean, and efficient form of energy, occupies a pivotal position in the global energy structure adjustment [4]. Thanks to its high technical maturity and environmental friendliness, wind energy has become a core component of many organizations’ and countries’ energy policies [5,6]. For example, the International Renewable Energy Agency (IRENA) encourages member countries to strengthen investment in and deployment of wind energy through technological innovation and policy support, to promote the widespread use of renewable energy [7]. The European Union’s “European Green Deal” plans to achieve carbon neutrality by 2050 through massive investments in wind energy and other renewable resources [8,9]. Additionally, the United States supports the development of wind energy projects through measures such as the Production Tax Credit (PTC) and the Investment Tax Credit (ITC), significantly reducing investment costs and accelerating the marketization process of wind technology [10,11,12]. These policies not only enhance the economic feasibility of wind energy but also provide solid policy and financial support for the global green energy transition.
Despite the many advantages of wind energy as a promising renewable resource, its development and operation face numerous challenges [13,14]. While technological maturity is continuously improving, it is still insufficient in some regions, increasing the risk of technology implementation [15]. Additionally, the site selection process for wind energy projects is complex, requiring comprehensive consideration of geographical, environmental, and community factors, all of which can affect the feasibility and social acceptance of the projects [16]. Furthermore, wind energy projects often require substantial initial investments and long construction periods, adding to the difficulty of fundraising and increasing financial risk [17]. The public–private partnership (PPP) model provides innovative solutions for wind energy projects [18]. By integrating the policy support and regulatory frameworks of the public sector with the capital and technological innovation of the private sector, the PPP model effectively propels the implementation of wind energy projects [19]. This collaborative approach not only helps diversify investment risks but also enhances the attractiveness and economic viability of projects by equitably distributing risks and benefits [20]. Moreover, the PPP model enhances the management efficiency and operational performance of projects, ensuring that wind energy projects can develop stably in complex market and technological environments.
In establishing and perfecting public–private partnership mechanisms, the core task is the accurate assessment of project risks and ensuring that these risks are equitably distributed among all parties [21]. In-depth risk analysis helps optimize resource allocation, ensures that key risks are properly managed, and avoids overinvestment in low-risk factors [22,23]. During the financing and operational phases of the project, investors often bear higher personal risks due to a lack of experience and flexible strategies [24]. Additionally, differences in institutional development between countries expose wind energy PPP projects to policy, legal, and social risks, increasing project uncertainty and affecting investor risk assessments [25,26,27]. Therefore, clearly delineating public and private responsibilities and implementing effective risk control measures are key to ensuring the sustainable development of wind energy PPP projects [28]. However, traditional risk management methods have certain limitations in addressing these complex risks. Risk control under the PPP model primarily relies on the risk-sharing and joint responsibility principles between the public and private sectors [29], with the party best able to control a risk typically assuming responsibility [30]. For external risks with unclear responsibilities, vague boundaries often lead to conflicts between the government and private enterprises, which may affect the normal operation of the project [31]. In wind energy PPP projects, investors have limited control over market demand and policy changes, and this uncertainty can weaken their investment intentions. Market development is influenced by the financial environment and policy regulations, but these factors are often beyond the government’s full control [32,33]. Introducing the concept of risk diversification helps to break through these limitations by integrating the strengths of multiple parties, providing adaptive solutions for complex risks, promoting public–private cooperation and trust [34], enhancing investor confidence [35], thereby attracting more capital, and laying a solid foundation for the long-term stability and success of the project.
Risk diversification is a crucial concept derived from agricultural disaster risk management [36], financial investment, and finance management [37]. In agricultural disaster risk management, risk diversification enhances capital efficiency and liquidity through temporal and spatial expansion, as well as the utilization of capital markets [38]. In the financial sector, risk is reduced and diversified by constructing a diversified investment portfolio [39,40]. In wind energy PPP projects, traditional risk management methods often fall short when addressing long-term or global issues, such as insufficient temporal and spatial diversification of risk, making it difficult to effectively monitor across different phases and entities [41]. Furthermore, unclear boundaries of risk responsibility not only hinder the effective segmentation of risk but also pose challenges in risk management and collaborative operations among partners, leading investors to prefer traditional over innovative financing models [42]. Additionally, the complexity of risks in wind energy PPP projects increases management difficulties [43,44], such as policy changes that may cause an increase in financing costs, thereby increasing financial risk; construction delays can weaken operational efficiency, thereby increasing operational risk [45]. These factors not only affect timely risk response but can also lead to the deterioration of project cooperation relationships and project delays.
To enhance the overall resilience and adaptability of wind energy PPP projects, targeted risk analysis and assessment, along with effective risk diversification measures, are especially crucial. This approach not only attracts more stakeholders to participate but also helps establish a cooperative mechanism for shared risk, ensuring the project’s long-term sustainability [46]. Although numerous studies have explored the risks of wind energy PPP projects and achieved certain results, these studies are primarily focused on static risk assessments, with less emphasis on the dynamic evolution of project risks; thus, they are slightly lacking in dynamic assessment capabilities. Moreover, while existing research pays attention to direct risk analysis, there is insufficient focus on the resilience of responses to risks. Many studies also tend to focus on a specific phase or participant of the project, overlooking the spatial and temporal dispersion of risks. This may lead to inadequate consideration of risk transmissibility between different entities and phases, while also lacking a systematic analysis of risk assessment and its diversification across time and space. Specifically, temporal dispersion focuses on how risks evolve over the course of a project’s timeline, while spatial dispersion concerns how risks are transferred and shared among different project participants. Insufficient attention to both can often lead to difficulties in accurately predicting and controlling the trend of risk development in practice.
To address the current research gaps, this study constructs a risk diversification indicator system and dynamic evolution model specifically for wind energy PPP projects based on the System Dynamics approach. By establishing the causal feedback mechanisms and stock–flow models between risk factors, this study more intuitively and quantitatively reveals the interactions among risk factors and their dynamic patterns over time. Additionally, by integrating subjective and objective weighting methods, the quantification of risk factor weights enhances the objectivity and accuracy of risk assessments, overcoming the limitations of traditional risk studies that rely solely on single methods or static analysis. Lastly, through the simulation of actual cases, this paper validates the effectiveness of the model and creatively proposes a series of diversified risk dispersion strategies and risk control measures, further enhancing the practicality and application value of the research findings. The main contributions of this research are: (1) for the first time, combining System Dynamics with the concept of risk dispersion, providing a novel dynamic analysis perspective for risk management in wind energy PPP projects, which helps stakeholders understand the mechanisms of risk dispersion more intuitively and in depth, and optimizes risk control pathways; (2) exploring the dynamic evolution of risks in wind energy PPP projects from a spatio-temporal perspective, the simulation reveals key boundary risk factors, clarifies the transferability and accountability boundaries of risks at different stages and among different participants, and offers in-depth risk management strategies and practical guidance for wind energy PPP projects.
2. Research Process and Methods
2.1. Research Process
This article aims to provide a theoretical basis for effective risk management by all parties involved in wind energy PPP projects. The specific research process, as shown in Figure 1, can be broadly divided into three main stages. Initially, through the literature analysis method, a systematic review and analysis of 126 relevant publications was conducted to identify representative and frequently occurring risk factors. Based on these, a comprehensive risk indicator system was constructed, encompassing subsystems such as construction delays, financing, construction quality, construction cost overruns, operational overruns, and insufficient expected returns. Subsequently, using System Dynamics methods, causal feedback and stock–flow diagrams for wind energy PPP project risks were created using Vensim PLE software (Vensim PLE version 6.3) to further analyze and reveal the interactions among risk factors and their dynamic change mechanisms.
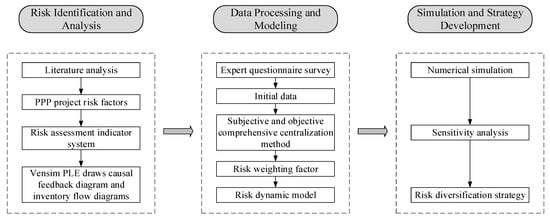
Figure 1.
Flowchart of this paper.
Next, based on the dynamic analysis mentioned above, data were collected through expert surveys, and the weights of each boundary risk factor were determined using a combined subjective and objective weighting method. On this basis, a dynamic risk simulation model was built to simulate and predict risk trends, providing a scientific basis for risk quantification.
Finally, through model simulation and analysis of specific cases, the risk levels of six major target risks were identified. Further, through sensitivity analysis, 11 key boundary risk factors were determined that need special attention and control in actual project management. Based on these findings, this study proposes a series of targeted risk dispersion strategies and control measures, discussing their application methods and effects in actual wind energy PPP projects. The aim is to enhance the overall risk resistance of the projects through a scientific and systematic risk management approach, thereby fostering cooperation and trust among all stakeholders.
The flowchart in Figure 1 clearly demonstrates the logical relationships and information transfer processes among the three key stages. Specifically, the risk factor identification and indicator system construction stage lays the foundation for subsequent data processing and modeling work. The combination of the weights of boundary risk factors obtained from data processing with System Dynamics modeling further supports the subsequent simulation and sensitivity analysis, providing a basis for developing risk dispersion strategies and control measures. This clear structural path ensures the logical consistency and reliability of the entire research process.
2.2. Research Methods
Common risk assessment techniques include Event Tree Analysis (ETA) [47], Fault Tree Analysis (FTA) [48], Failure Modes and Effects Analysis (FMEA) [49], Monte Carlo simulation [50], and System Dynamics. Both ETA and FTA provide causal relationships and consequence pathways starting from an initial or top event, but they generally lack a dynamic perspective and consideration of system feedback mechanisms. While effective in revealing potential failure paths and possible outcomes, these methods mainly offer static risk analyses and do not cover the evolution of events over time or the dynamic changes in complex feedback mechanisms. FMEA focuses on identifying and assessing potential failure modes and their impacts on systems, providing a more detailed record for lifecycle management of projects. However, it remains limited to static risk assessments and does not consider the overall dynamic behaviors of systems. Monte Carlo simulation offers a powerful tool for handling randomness and uncertainty, effectively performing dynamic analyses and providing probabilities and forecasts of risks. However, this method focuses on quantifying randomness and uncertainty and may not adequately reveal the interactions and dynamic feedback within complex systems.
In contrast, System Dynamics offers a comprehensive analytical tool. System Dynamics was introduced by Jay Forrester in the 1950s at the Massachusetts Institute of Technology and is used to study the structure of complex systems, the impact of feedback loops, and time delays on behavior [51,52]. It can simulate and assess the dynamic changes in various variables over time and their interactions, addressing the limitations of the aforementioned methods. This method can simulate the dynamic behavior of systems, making it particularly suitable for understanding the interactions and changes among elements in PPP projects [53]. In wind energy PPP projects, risk management involves not only assessing the impact of individual events but also considering the long-term interactive effects of various economic, environmental, and technical factors. System Dynamics is capable of integrating these complex interdependencies and constructing dynamic models that include feedback loops, thereby providing detailed insights into how policy adjustments and market changes affect the sustainability and risk conditions of the projects. Its main advantages include clearly describing the risk structure, illustrating risk sources and transmission paths through causal diagrams [54], and using stock–flow models to simulate the dynamic changes and mutual influences of risk factors [55,56], thus providing decision support for managing complex risks [57]. System Dynamics also emphasizes the importance of feedback loops, helping to identify and understand the nonlinear characteristics of systems [58,59], and supports testing different risk response strategies, such as risk transfer and diversification, providing scientific evidence for decision-makers to choose the optimal risk management strategies [60]. Therefore, given the advantages of System Dynamics in analyzing and solving complex, dynamic problems, this paper opts to use the System Dynamics approach to study risks in wind energy PPP projects.
3. Construction of a Risk Index System
3.1. Induction and Analysis of Risk Factors Based on the Literature
3.1.1. Preliminary Identification of Risk Factors
Based on a literature review methodology, this paper collected 126 academic articles related to PPP project risk research published between January 2013 and August 2024 from the Web of Science using the keywords “PPP, wind energy, risk, PPP risk management, PPP risk diversification”. After an initial screening, the titles, abstracts, and keywords of these articles were examined in detail to ensure they met the research standards. The first round of filtering primarily excluded literature unrelated to the research objectives, while the second round involved a full-text reading to further confirm the relevance of the articles. Although this study primarily focuses on risk management and risk diversification in wind energy PPP projects, it also includes other types of PPP projects to obtain a more comprehensive perspective on public–private models. Through these two rounds of filtering, 26 representative articles on PPP risk factors were selected for in-depth analysis. These articles cover a broad range of risk factors in wind energy projects, thus providing a rich theoretical and practical foundation for this study.
In analyzing the risk factors from the selected literature, we noted variations in the expression of the same risk factors across different language backgrounds, such as “political opposition” and “political hostility”, both indicating government opposition. Based on frequency analysis, risk factors that appear more frequently are considered to have higher reference value. The results of the frequency analysis of PPP risk factors (see Appendix A, Table A1) focused on retaining the more frequently occurring risk factors, while those appearing less frequently (1–3 times) were eliminated based on quantitative data.
3.1.2. Identification and Definition of Risk Factors
Based on these analyses, it was determined that the risk factors in PPP projects are interrelated and span various stages, such as decision-making, financing, construction, operation, and the entire project lifecycle. By simplifying and categorizing these risk factors, a clear list was established (see Appendix A, Table A2). Among these, factors such as lack of support from government, unstable government, political interference, corruption and bribery, and nationalization/expropriation are categorized as political risks and have an impact on other risks across the entire SD system. Therefore, in the subsequent application of System Dynamics, these political risks were simplified and excluded from further consideration in this study.
3.2. Analysis Model Based on System Dynamics
3.2.1. Causal Feedback Diagram of Wind Energy PPP Project Risks
Based on the methods and characteristics of System Dynamics, a risk causal feedback model for wind energy PPP projects was constructed using Vensim PLE software (see Figure 2) to visually demonstrate the causal relationships between various risk factors in the project. By categorizing the identified risk factors according to the project stages and labeling the polarity of each arrow in the model, the nature of each feedback loop can be clearly identified. This feedback loop indicates that any deterioration in one factor will exacerbate other risk factors through a chain reaction, leading to an overall increase in the project’s risk.
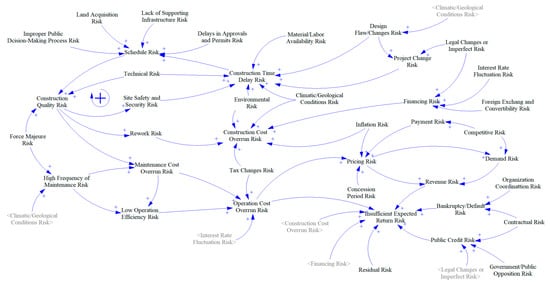
Figure 2.
Causal feedback diagram of risk factors for wind energy PPP projects. (The “+” indicates the positive cumulative relationship between the factors.)
3.2.2. Stock–Flow Diagram of Wind Energy PPP Project Risks
Through the analysis of the risk causal feedback diagram, the risks of construction delay, financing, construction quality, cost overruns, operational cost overruns, and insufficient expected returns were defined as state constants, while the corresponding risk factors were considered as rate variables. Other variables were categorized as auxiliary variables or constants, leading to the construction of the wind energy PPP project risk stock–flow diagram (Figure 3).
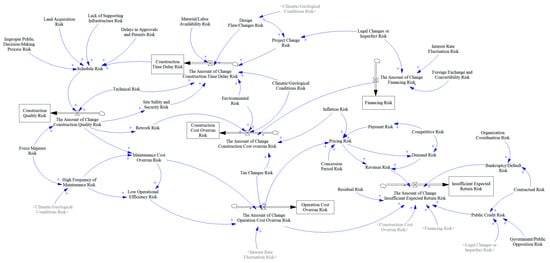
Figure 3.
Stock and flow diagram of risk factors for wind energy PPP projects. The “+” symbol represents the positive cumulative relationship between factors. (The “Source” refers to the starting or ending point of the flow, and “Valve” is used to control the flow rate.)
3.3. Boundary and Subsystem Risk Analysis
3.3.1. Identification of Boundary Risks
According to the risk stock–flow diagram, boundary risk factors can be identified as connection points between the system and the external environment. Boundary risks refer to the risks that may occur at the interface between a project or system and its external environment. These risks are typically caused by external factors and involve direct interactions with the external environment. The uniqueness of boundary risk factors lies in the fact that they are influenced solely by external factors, with no direct impact from the internal system of the project. This study identified the following 20 boundary risks: improper public decision-making process risk, land acquisition risk, lack of supporting infrastructure risk, delay in approval and permitting risk, materials/labor availability risk, legal changes/imperfections risk, interest rate fluctuation risk, exchange rate and convertibility risk, technological risk, environmental risk, climate/geological conditions risk, inflation risk, force majeure risk, tax changes risk, concession period risk, competition risk, organizational coordination risk, contractual risk, residual risk, and government/public opposition risk. The identification of these boundary risks provides a foundation for further analysis of risk transmission paths and their impacts.
3.3.2. Subsystem Risk Cause Tree Analysis
The cause tree analysis of the target risk subsystems (Figure 4, Figure 5, Figure 6, Figure 7, Figure 8 and Figure 9) reveals the primary sources of the target risks and helps project managers identify key intervention points to gain a deeper understanding of the root causes and potential consequences of the risks.
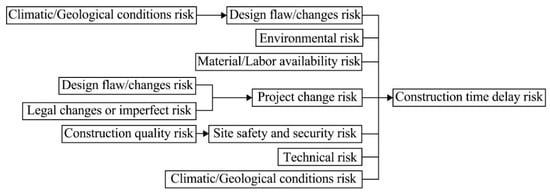
Figure 4.
Cause tree analysis of construction time delay risk.
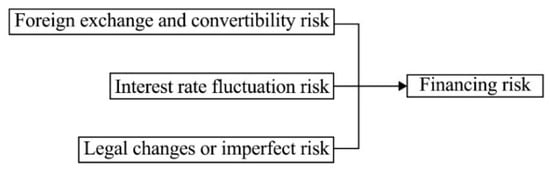
Figure 5.
Cause tree analysis of financing risk.
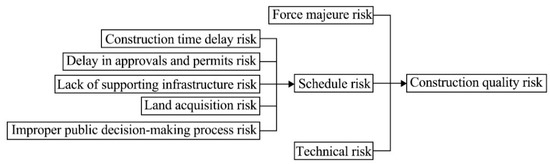
Figure 6.
Cause tree analysis of construction quality risk.
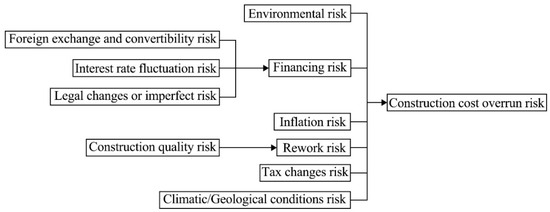
Figure 7.
Cause tree analysis of construction cost overrun risk.

Figure 8.
Cause tree analysis of operation cost overrun risk.
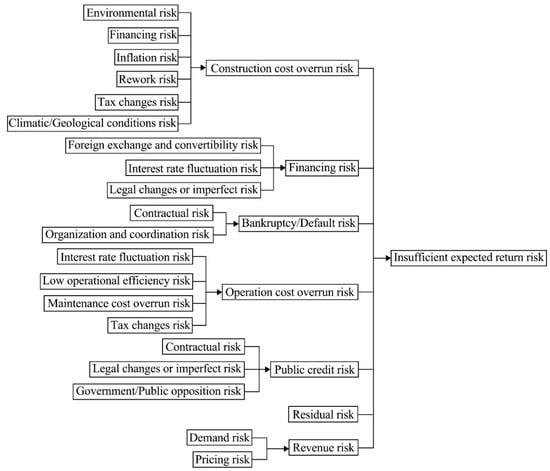
Figure 9.
Cause tree analysis of insufficient expected return risk.
4. Calculation of Risk Weights and Construction of a Dynamic Risk Model
4.1. Questionnaire Survey and Data Collection
To ensure the breadth and reliability of the data, this study employed a detailed and specific survey method. The survey was conducted from June 2022 to February 2023, targeting seasoned experts and practitioners in the PPP field. The selection criteria included having at least five years of work and research experience in PPP projects and significant influence in project risk management. To enhance the validity of the survey questionnaire, researchers initially conducted online interviews and face-to-face discussions with several industry experts from wind energy PPP projects, performing multiple rounds of meticulous optimization regarding the questionnaire’s relevance, accuracy, wording, order, and layout. An example question from the optimized questionnaire is: “Please evaluate the impact of the following boundary risk factors on the overall performance of the PPP project based on your experience”. The optimized questionnaire was distributed through online forms to PPP-related academic forums on WeChat groups, and targeted invitations were sent to industry experts and scholars to ensure extensive data collection. Additionally, offline interviews were conducted to gain deeper insights into the respondents’ views and experiences, thereby enhancing the quality and depth of the data.
Furthermore, during the annual “China PPP Forum” conference, the author engaged in in-depth discussions with some of the conference participants, mainly experts from the PPP expert database of the Ministry of Finance and the National Development and Reform Commission, as well as relevant scholars, government officials, and consulting institutions. The data collected from this survey hold a certain level of professionalism and authority. The research is ethical and has been approved by relevant institutions for use within this research scope. Respondents represented multiple sectors, including construction, finance, and government, and ranged from project managers to senior management, ensuring diversity in industry and experience levels. A total of 972 questionnaires were distributed, and 135 valid responses were collected, resulting in an effective response rate of 13.89%. This rate is higher than the average response rates for similar studies on PPP models, such as 12% in Li et al. [61] and 9.4% in Salman et al. [62]. Therefore, the collected survey data effectively support the corresponding research and data analysis needs. The specific profile of the respondents is provided in Appendix B, Table A3.
4.2. Calculation of Risk Factor Weight Coefficients
- (1)
- Subjective Weighting Method
The subjective weighting method is a technique that allocates weights based on the personal assessments of decision-makers or experts regarding the importance of the indicators. This method primarily relies on the experts’ experience and judgment, emphasizing the scientific rigor and accuracy of the assessment. However, due to its strong subjectivity, the results of this method can sometimes be difficult for other decision-makers or analysts to accept.
- (2)
- Objective Weighting Method
The objective weighting method, on the other hand, allocates weights based on the original data by determining the functional relationship between the data and the weights. This method is independent of the decision-maker’s subjective opinions and typically provides a more accurate reflection of the actual situation. It can also more effectively represent the practical significance of multiple evaluation indicators.
To ensure the fairness of the evaluation results and reduce the influence of human factors, this study combines both subjective and objective weighting methods. The integrated approach uses the improved G1 method and the entropy method for weight allocation of the risk factors, aiming to overcome the subjectivity issues inherent in the traditional Analytic Hierarchy Process (AHP).
4.2.1. Calculation Using the Improved G1 Method
The G1 weighting method was originally a subjective weighting method based on comparing the importance ratios of evaluation indicators [63]. To increase the difference in weight values and improve the accuracy of the weights, the G1 method was improved by scoring the importance of neighboring evaluation indicators. In expert scoring standards, although the use of a 10-level scale can indicate more detailed attitudinal differences among the respondents, the increase in the number of levels will blur the definition of each level, which will cause the respondents to feel a certain amount of confusion. Therefore, to ensure reliable scoring, the meaning of the points on the metric scale must be clearly understood. If the meaning of the points on the metric scale is not clear, then the reliability and validity of the measure will be compromised. Based on this, combined with the ref. [64] and other related materials, this paper proposes to further optimize the improved G1 weighting method by using a seven-level scale. The specific calculation steps are as follows:
- ①
- Expert scoring. Scores for the importance of adjacent indicators are collected through survey questionnaires from experts. Please refer to Table A4 in Appendix B for the scoring standards; higher values indicate greater importance of the indicators.
- ②
- Ranking the importance of evaluation indicators. According to the score of the -th expert on the importance of the indicator, according to the size of the score to rank, such as the indicator , the importance score, , is greater than the importance of the indicator score, , and then it is recorded as , and the ranking of importance is as follows:
- ③
- Ratio of importance for adjacent indicators. Based on the score of the -th expert on the importance of the evaluation indicator, the ratio of the importance scores of the adjacent indicators is taken as the ratio of the weights, and the ratio of the weights of the evaluation indicator, , to the indicator is described as follows:where is the weight of the indicator, , based on the score of the -th expert.
- ④
- Calculation of indicator weights. The indicator, , is given a weight as follows:The weights of the other indicators can be derived from the recursive formula as follows:where .The weights of each target risk were calculated using the improved G1 weighting method, with the results detailed in Table A5 in Appendix B.
4.2.2. Calculation Using Entropy Method
The entropy method is an objective weighting method that determines weights by analyzing the statistical properties of the data, using the entropy value of each risk factor to measure its lack of information [65]. The coefficient of variation further measures the variability of each risk factor in the dataset, reflecting the importance of the different risk factors [66]. The objectivity of this method ensures that the weights are assigned scientifically and rationally, which is accomplished through the following steps:
- ①
- Constructing the matrix. Expert ratings are collected and a scoring matrix, , is constructed as follows:
- ②
- Quantification of risk indicators. Quantify the risk indicators in the matrix as follows:
- ③
- Calculate the risk factor entropy value, . Calculate the entropy value of each risk factor using the following entropy value formula:where , is the number of samples, .
- ④
- Calculation of the coefficient of variation of risk factors. The coefficient of variation of the indicators is calculated based on entropy as follows:The greater the difference in the indicator value, , and the lower the entropy value, the greater the and the more important the indicator.
- ⑤
- Find the weights. Find the weight of each risk factor based on the coefficient of variation as follows:The entropy method was used to determine the proportion, entropy value, coefficient of variation, and final weight coefficients for each risk factor. The detailed results can be found in Table A6 in Appendix B.
4.2.3. Determining the Combined Weight of the Risk Factors
The improved G1 weighting method, by incorporating a seven-point scale, significantly enhances the precision and reliability of weight calculation. This optimization reduces the subjectivity of ratings and increases the reliability and validity of assessments, making the experts’ evaluation of the importance of risk factors more precise and distinctive. Furthermore, the entropy method, as an objective weighting approach, determines weights by analyzing data variability, adding necessary objectivity to the assessment process. This ensures that risk assessments not only reflect experts’ intuitive judgments but also accurately quantify the actual impact of each risk factor in the project.
The weight values obtained from the improved G1 weighting method and the entropy method are combined and assigned, and the combined weights are considered optimal when the sum of the squares of the deviations of the weights obtained using the two methods is minimized, i.e., the weights of the subjective and objective weighting methods are half of each other. This combined subjective and objective approach effectively balances the advantages of expert insights and data analysis, thereby enhancing the accuracy and reliability of risk weights. Derived from Equations (4) and (9), the formula for calculating the combined weights is as follows:
In this equation, represents the weight value obtained from the improved G1 weighting method, and represents the weight value derived from the entropy method. Using this approach, we have integrated and weighted the various types of risks in the table, with the final results detailed in Table A7 in Appendix B.
4.3. System Dynamics Equations for Risk Factors
Building upon the creation of causal feedback diagrams and stock–flow diagrams for risk factors, this study determined the weights of each risk factor through expert surveys and a combined subjective–objective weighting method. Utilizing these weights and the causal relationships of risk factors shown in Figure 2, along with existing theories in the field of System Dynamics [67], a set of System Dynamics equations suitable for risk analysis in wind energy PPP projects was established to dynamically simulate the interactions of risk factors and their evolving trends over time. The equations, as shown in Table 1, employ INTEG to represent integration and PULSE (Q, R) as the pulse function, which simulates pulses that change over time, where Q represents the time of the first pulse, and R is the pulse interval. The parameter “a” corresponds to the construction phase of the project, while “b” corresponds to the operational phase.

Table 1.
Dynamic equations for each risk subsystem.
5. Dynamic Simulation of Risks
5.1. Numerical Simulation of Subsystems
The boundary risk factors of the project were quantitatively scored based on the actual construction situation and questionnaire data. To ensure the consistency of the data, the assignment range of the boundary risk factors was set between 0 and 1, where 0 indicates that the risk has no impact, and 1 indicates that the impact of the risk has a definite presence. By processing the arithmetic mean of the collected boundary risk expert scoring data, the risk estimates for each boundary risk factor were obtained, and the specific results are shown in Table 2.
Table 2.
Estimates of boundary risk factors for wind energy PPP projects.
The boundary risk factors of the wind energy PPP project were simulated and evaluated using Vensim PLE software. In the initial setup, the model’s starting value (initial time) was set to 0, and the final value (final time) was set to 120, with 0–12 representing the construction period and 13–120 the operational period. The time unit was set to quarters, with a time step (DT) of 1. The model inputs the numerical values and functional relationships of boundary risk factors and was thoroughly debugged before starting the simulation. The simulation results appeared normal (Figure 10, Figure 11, Figure 12, Figure 13, Figure 14 and Figure 15), consistent with expected trends, and showed no significant anomalies or unexplainable fluctuations. In Figure 10, Figure 11, Figure 12 and Figure 13, as the construction period ends, a stable slope change transitioning to a horizontal line is observed, indicating that the subsystem risks are no longer increasing and have stabilized. Figure 14 and Figure 15 show that subsystem risks are only active during the operational phase, remaining unchanged during the construction period. Furthermore, multiple repeat simulations of the model, including extreme testing of parameters and sensitivity checks, consistently demonstrate the model’s stability and reliability.
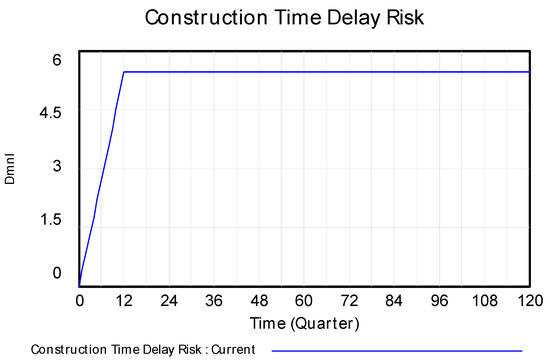
Figure 10.
Construction time delay risk simulation results (“DMNL” refers to dimensionless units used in the model to represent the ratios or relative changes between variables, while “Quarter” denotes the division of the time axis into quarters, which is used to display seasonal data or the results of time series analyses).
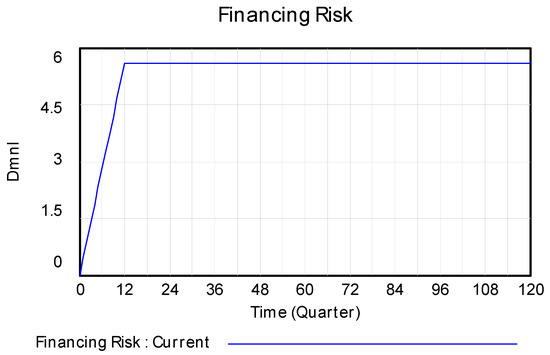
Figure 11.
Financing risk simulation results.
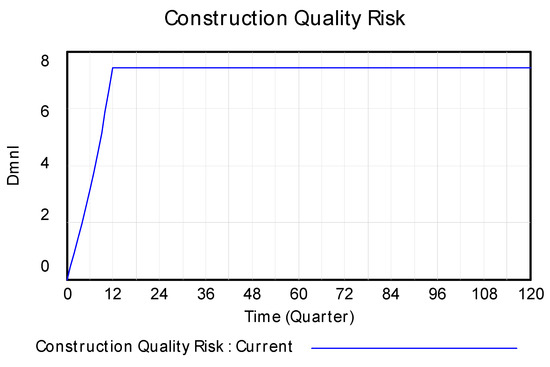
Figure 12.
Construction quality risk simulation results.
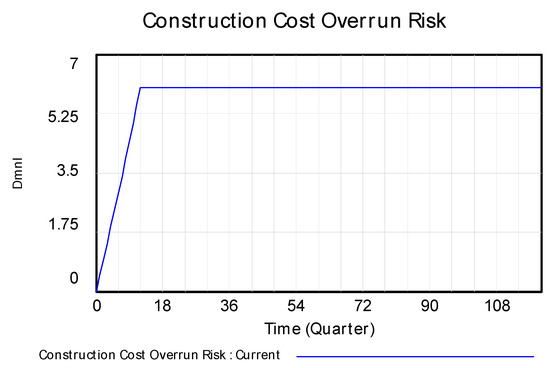
Figure 13.
Construction cost overrun risk simulation results.
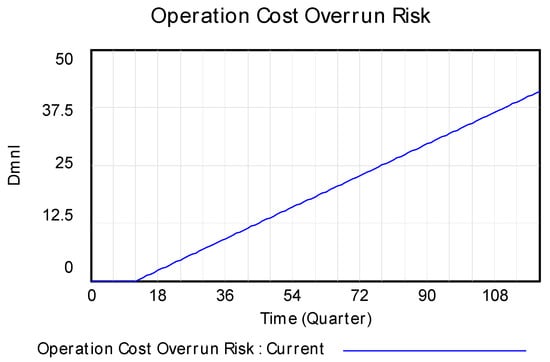
Figure 14.
Operation cost overrun risk simulation results.

Figure 15.
Insufficient expected return risk simulation results.
Based on the risk simulation results, to further clarify the assessment of risk levels, this study drew on the related findings of Wang [68] and John et al. [69]. Building on expert consensus and the Delphi method, the maximum risk value, , was divided into five levels within the range , with specific interval divisions presented in Table 3. In practice, we invited 10 experts with extensive experience in PPP project management to determine the criteria for risk level classification through two rounds of Delphi consultations. The expert panel conducted in-depth discussions and scoring based on industry practices and actual project data, and they unanimously agreed that the risk value should be divided into five intervals, from 0 to , with each interval increasing by .
Table 3.
Wind energy PPP projects risk levels.
During the concession period of the wind energy PPP project, the risk values need to be treated differently according to the different risk spans of the construction and operation periods of the subsystems. The simulation results show that the risk maximum value, , of the construction time delay risk, financing risk, construction quality risk, and construction cost overrun risk in the construction phase is 7.418. According to Table 3, during the construction period, construction quality risk and construction cost overrun risk are categorized as major risks, while financing risk and construction time delay risk are categorized as relatively high risks. The simulation also shows that the order of risk is as follows: construction quality risk > construction cost overrun risk > financing risk > construction time delay risk.
Similarly, during the operational phase, simulation analysis indicates that the maximum risk value, , for the operational cost overrun risk and insufficient expected return risk is 218.161. Therefore, in this case, the insufficiency of expected return risk is assessed as a significant risk, while the operational cost overrun risk is assessed as low-risk. This analysis provides a foundation for formulating risk control strategies, but specific risk control measures require further detailed analysis to effectively reduce risks.
5.2. Sensitivity Analysis of Boundary Risks
Sensitivity analysis is a technique used to assess the extent to which the output of a model or system responds to changes in one or more input parameters [69,70]. Simply put, it is used to determine how changes in specific variables affect the outcomes of a decision model. In the risk management of wind energy PPP projects, sensitivity analysis helps decision-makers identify key risk factors and evaluate how the cumulative impact of these factors over time influences the project, thereby optimizing decisions and controlling critical risks throughout the concession period.
In this study, the method of controlling variables was employed to simulate single-factor changes, aiming to explore the impact paths of various boundary risk factors on target risks. Specifically, new datasets were generated in Vensim PLE, and while keeping other risk factors constant, the values of boundary risk factors that significantly impact the target risk were increased by 50% based on the results of the subsystem risk cause tree analysis to simulate changes in target risks. The parameter change range was set at 50%, a decision based on the variation intervals determined through multiple rounds of expert evaluations using the Delphi method. This setup not only ensures the feasibility of parameter changes in reality but also effectively reflects the sensitivity of the risks. This range represents extreme but possible scenarios used to assess the robustness of the system under different stress levels.
In analyzing the trends of risk changes in various subsystems, in addition to maintaining consistency with the results from Figure 10, Figure 11, Figure 12, Figure 13, Figure 14 and Figure 15, we found that changes in the parameters of individual risk factors led to significant changes in risk levels. This discovery reveals the high sensitivity of boundary risk factors to target risks, indicating the need to pay special attention to the uncertainties of these factors in actual projects and to determine which risk factors should be controlled during the concession period. The sensitivity analysis results of risk factors under each subsystem are detailed in Figure 16, Figure 17, Figure 18, Figure 19, Figure 20 and Figure 21. Boundary risk factors not listed are considered to have little or no impact on the target risks. Additionally, through multiple sensitivity analysis validations, results show that despite the impact of parameter changes, the key risk trends and sensitivity rankings remain relatively stable, thus confirming the robustness of the model.
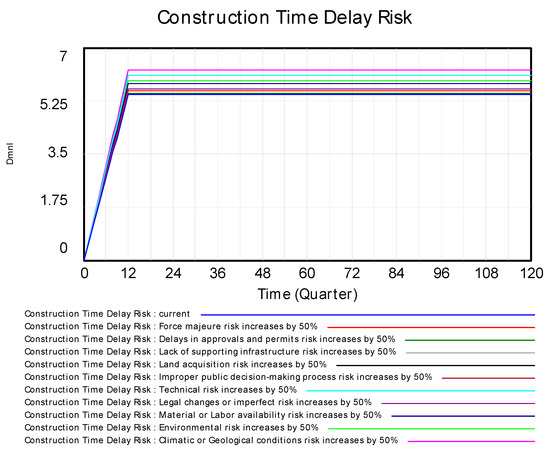
Figure 16.
Construction time delay risk sensitivity analysis.
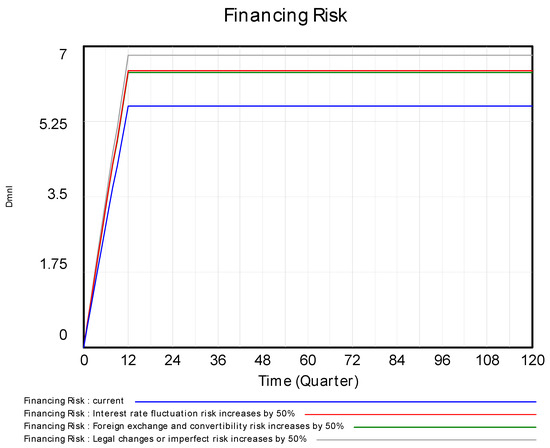
Figure 17.
Financing risk sensitivity analysis.
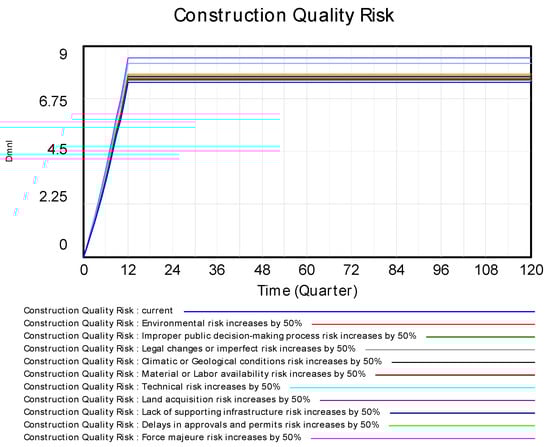
Figure 18.
Construction quality risk sensitivity analysis.
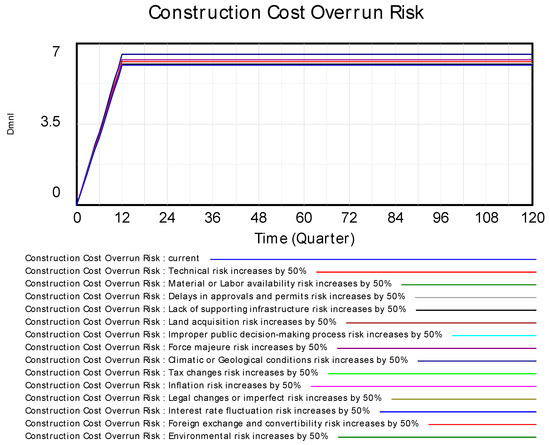
Figure 19.
Construction cost overrun risk sensitivity analysis.
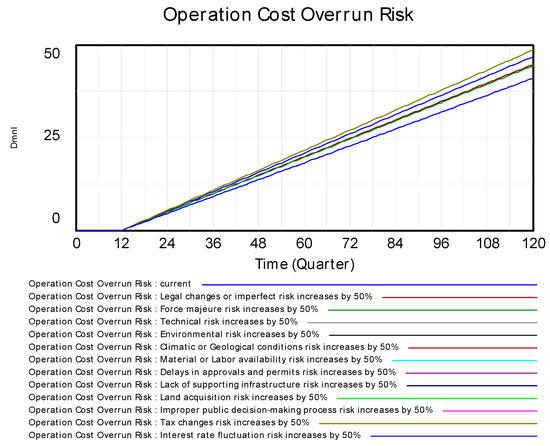
Figure 20.
Operation cost overrun risk sensitivity analysis.
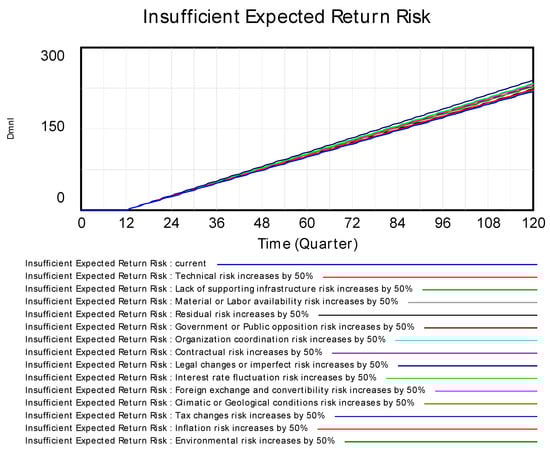
Figure 21.
Insufficient expected return risk sensitivity analysis.
During the 30-year concession period, the risk management system of the wind energy PPP project shows dynamic changes in risks based on certain trends, due to interactions among various subsystems. This paper conducted sensitivity analyses on individual risk factors and simulated the development trends of risks as the values of these risk factors change. The trends obtained are consistent with the simulation results shown in Figure 10, Figure 11, Figure 12, Figure 13, Figure 14 and Figure 15. Further observation revealed that changes in certain boundary risk factors have a significant impact on the target risks. Moreover, to further verify the reliability of the model, this study selected a specific offshore wind power PPP project in Yancheng, Jiangsu Province, for empirical validation. The project, which started in 2015, employs a typical PPP model involving local government departments, a wind energy development company (China Huaneng New Energy Co., Ltd.—Beijing, China), financial institutions (China Construction Bank– Beijing, China), and the local electricity grid company. By collecting and organizing operational data and risk management records of the project over the past five years, especially the actual performance of key factors such as technical risks, environmental risks, and policy risks, this study found that the risk trends simulated by the dynamic risk model developed in this paper closely match (with a similarity exceeding 85%) the actual risk trends of the project. This further indicates that the dynamic risk model constructed in this paper has good empirical applicability and can effectively reflect the patterns of risk changes in real projects.
Subsequently, by analyzing and ranking the sensitivity results for each subsystem, the boundary risk factors that have a significant impact on the target risks were identified. The ranking results are summarized in Table 4, which lists the top five boundary risks in each subsystem. Notably, the financing risk subsystem contains fewer risk factors (only three), indicating that other boundary risks have minimal impact on it.
Table 4.
Boundary risk ranking under sensitivity analysis.
6. Results and Discussion
Through numerical simulation, we identified six major risk subsystems in wind energy PPP projects: construction quality, construction cost overruns, and insufficient expected returns are considered significant risks; financing risks and construction delays are classified as higher risks; and operational overruns are low-risk. Among the three significant risks, the boundary risks that most impact construction quality are force majeure risk, technical risk, delays in approvals and permits risk, climatic/geological conditions risk, and environmental risk, with a 50% increase in their risk factor values leading to respective increases in construction quality risk factors of 14.209%, 11.267%, 5.088%, 4.116%, and 2.231%. The boundary risks with the greatest impact on construction cost overrun risk are tax changes risk, interest rate fluctuation risk, climatic/geological conditions risk, environmental risk, and force majeure risk, with a 50% increase in their risk factor values causing respective increases in construction cost overrun risk factors of 8.241%, 8.236%, 7.927%, 7.924%, and 3.833%. The boundary risks most impacting the risk of insufficient expected returns are legal changes or imperfect risk, interest rate fluctuation risk, foreign exchange and convertibility risk, tax changes risk, and inflation risk, with a 50% increase in their risk factor values resulting in respective increases in insufficient expected return risk factors of 9.342%, 6.457%, 5.661%, 4.558%, and 4.254%. Among the two higher risks, the boundary risks that most impact financing risk are legal changes or imperfect risk, interest rate fluctuation risk, and foreign exchange and convertibility risk, with a 50% increase in their risk factor values leading to respective increases in financing risk factors of 21.280%, 14.749%, and 13.971%. The boundary risks that most impact construction delay risks are climatic/geological conditions risk, technical risk, environmental risk, material/labor availability risk, and legal changes or imperfect risk, with a 50% increase in their risk factor values resulting in respective increases in construction delay risk factors of 14.999%, 11.381%, 8.132%, 6.844%, and 3.713%. Operational overrun risk is classified as low-risk, and the boundary risks that most affect it are tax changes risk, interest rate fluctuation risk, climatic/geological conditions risk, and force majeure risk, with a 50% increase in their risk factor values causing respective increases in operational overrun risk factors of 18.563%, 14.228%, 9.038%, and 8.172%. Therefore, the boundary risk factors that require particular control in the project include force majeure risk, technical risk, delays in approvals and permits risk, climatic or geological conditions risk, environmental risk, tax changes risk, legal changes or imperfect risk, interest rate fluctuation risk, foreign exchange and convertibility risk, inflation risk, and material/labor availability risk. These risk factors can have a profound impact on the feasibility, construction efficiency, and long-term operation of the project. To better prevent and address these risks, effective risk diversification measures must be implemented to manage them appropriately.
The principle of risk diversification emphasizes the reasonable sharing and management of risks, which is especially crucial in wind energy PPP projects that involve substantial funding and multiple stakeholders. Project risks may arise at any stage, so it is essential to comprehensively consider the interactions between all relevant parties and risk factors. In this study, project participants are categorized into three groups: government and regulatory agencies, project implementers, and market and societal stakeholders. Among these, government departments and project implementers are the two main risk-bearing entities. Government and regulatory agencies are responsible for providing policy support, establishing the legal framework, and overseeing project implementation. Project implementers, including developers, contractors, investors, and technology suppliers, are responsible for the development, construction, and operation of the project. Market and societal participants, such as electricity buyers, local communities, and environmental organizations, focus on the social benefits and environmental impact of the project. By incorporating market and societal stakeholders into the risk management system, this study proposes a more comprehensive risk control framework that ensures risks can be managed and diversified from multiple dimensions. It is particularly important to emphasize that, for specific risks, the main relevant participants should proactively assume greater responsibility. Additionally, all participants need to fully recognize that risks in the project should not be borne solely by the party directly affected but should be viewed as a shared responsibility for the entire project. The occurrence of any single risk may trigger other risks through a chain reaction, affecting the overall success of the project. Therefore, all stakeholders should actively collaborate, jointly bear risks, and reasonably allocate responsibilities to enhance the project’s overall risk resilience, ensuring its long-term stable operation and success. Based on these principles, Table 5 details the specific risk diversification measures for each participant concerning the 11 key risk factors that require focused control. This effort to strengthen cooperation and coordination aims to minimize the potential impact of risks on the project, ensuring the successful implementation and sustainable development of wind energy PPP projects.
Table 5.
Boundary risks that require key control and their diversification measures.
7. Conclusions
In wind energy PPP projects, scientifically sound and effective risk management and mitigation strategies are key to achieving mutual benefits for all parties involved. This study has developed a risk mitigation indicator system that covers the entire project lifecycle, involving stakeholders such as government and regulatory agencies, project implementers, and market and societal participants. The system clearly delineates the boundaries of risk responsibility, helping projects identify and address potential risks in advance. It not only enhances the project’s risk management capabilities and predictability but also boosts investor confidence. The research further reveals the dynamic evolution patterns of risks in wind energy PPP projects and identifies key boundary risk factors. It proposes a multidimensional risk management strategy based on risk diversification theory. This strategy, by dispersing risks across different parties or stages, can not only improve the overall stability and success rate of the project but also enriches traditional risk identification and allocation mechanisms, providing practical reference for the field of risk management.
This study provides innovative strategies for risk management in wind energy PPP projects, but there is still room for improvement in their application and dissemination. Although the System Dynamics model offers a powerful tool for understanding and predicting risk evolution, its application relies on high-quality and accessible data, and the results may be influenced by initial model settings, data accuracy, and the reasonableness of parameter assumptions. The selection of specific parameters and the universality of the model require further validation with more extensive industry data. Therefore, future research could establish a more standardized and formalized risk assessment framework, integrating advanced methods such as big data analytics and intelligent technologies to enhance dynamic monitoring and real-time feedback capabilities for risks. Additionally, by expanding the data sample scope and gathering more data from industry experts and research institutions, the universality of the model could be further validated, and parameter settings optimized, improving the stability and reliability of assessment results. Exploring the integration of System Dynamics models with other economic models or machine learning algorithms could enhance the model’s predictive accuracy and automatic adjustment capabilities. It may also be beneficial to empirically test the model developed in this study in wind energy PPP projects across different regions, systems, and cultural environments to verify and enhance its cross-regional applicability. By pursuing these approaches, more effective methods for dynamic risk dispersion and real-time monitoring can be explored, further enhancing the operability of the risk management strategies proposed in this study in practice, thereby promoting the long-term success and global dissemination of wind energy PPP projects.
Author Contributions
Conceptualization, R.L.; methodology, R.L. and Y.W.; software, R.L.; validation, R.L., S.L. and Y.W.; formal analysis, R.L.; investigation, R.L. and S.L.; resources, Y.W.; data curation, S.L.; writing—original draft preparation, R.L.; writing—review and editing, R.L., S.L. and Y.W.; visualization, R.L. and S.L.; supervision, Y.W.; project administration, R.L.; funding acquisition, Y.W. All authors have read and agreed to the published version of the manuscript.
Funding
This work was supported by the Ministry of Education Humanities and Social Sciences Research Planning Fund Project of China under grant No.24YJA630093, and the National Natural Science Foundation of China under grant No. 71901068.
Data Availability Statement
Data Availability Statement: The authors confirm that the data supporting the findings of this study are available within the article.
Acknowledgments
The authors would like to express their sincere gratitude to the editor and the anonymous reviewers for their insightful and constructive comments.
Conflicts of Interest
The authors declare that the research was conducted in the absence of any commercial or financial relationships that could be construed as a potential conflict of interest.
Appendix A
Table A1.
Risk identification in PPP projects.
Table A1.
Risk identification in PPP projects.
| Risk Factors | References | Total | |||||||||||||||||||||||||
|---|---|---|---|---|---|---|---|---|---|---|---|---|---|---|---|---|---|---|---|---|---|---|---|---|---|---|---|
| A | B | C | D | E | F | G | H | I | J | K | L | M | N | O | P | Q | R | S | T | U | V | W | X | Y | Z | ||
| Lack of support from government | * | * | * | * | * | * | * | * | * | * | * | 11 | |||||||||||||||
| Unstable government | * | * | * | * | * | * | * | * | * | * | * | * | 12 | ||||||||||||||
| political interference | * | * | * | * | * | * | * | * | * | * | * | * | * | * | * | * | 16 | ||||||||||
| Corruption and bribery | * | * | * | * | * | * | * | * | 8 | ||||||||||||||||||
| Nationalization/expropriation | * | * | * | * | * | * | * | * | * | * | 10 | ||||||||||||||||
| Inflation risk | * | * | * | * | * | * | * | * | * | * | * | * | * | 13 | |||||||||||||
| Interest rate fluctuation risk | * | * | * | * | * | * | * | * | * | * | * | * | * | 13 | |||||||||||||
| Legal changes or imperfect risk | * | * | * | * | * | * | * | * | * | * | * | * | * | * | * | * | * | * | * | 19 | |||||||
| Tax changes risk | * | * | * | * | * | * | * | * | 8 | ||||||||||||||||||
| Government/Public opposition risk | * | * | * | * | * | * | * | * | * | * | * | * | 12 | ||||||||||||||
| Environmental risk | * | * | * | * | * | * | * | * | * | * | * | * | * | * | * | * | 16 | ||||||||||
| Force majeure risk | * | * | * | * | * | * | * | * | * | * | * | * | * | * | * | * | 16 | ||||||||||
| Climatic/Geological conditions risk | * | * | * | * | * | * | * | * | 8 | ||||||||||||||||||
| Construction time delay risk | * | * | * | * | * | * | * | * | * | * | * | * | 12 | ||||||||||||||
| Site safety and security risk | * | * | * | * | * | 5 | |||||||||||||||||||||
| Construction quality risk | * | * | * | * | * | * | * | * | * | * | * | 11 | |||||||||||||||
| Construction cost overrun risk | * | * | * | * | * | * | * | * | * | * | * | * | * | * | 14 | ||||||||||||
| Contractual risk | * | * | * | * | * | * | * | * | * | * | * | * | * | 13 | |||||||||||||
| Material/Labor availability risk | * | * | * | * | * | * | * | * | * | * | 10 | ||||||||||||||||
| Delays in approvals and permits risk | * | * | * | * | * | * | * | * | 8 | ||||||||||||||||||
| Design flaw/changes risk | * | * | * | * | * | * | * | * | * | * | * | * | * | 13 | |||||||||||||
| Demand risk | * | * | * | * | * | * | * | * | * | * | * | * | * | 13 | |||||||||||||
| Maintenance cost overrun risk | * | * | * | * | * | * | * | * | * | 9 | |||||||||||||||||
| Operation cost overrun risk | * | * | * | * | * | * | * | * | * | * | * | * | * | 13 | |||||||||||||
| High frequency of maintenance risk | * | * | * | * | * | * | * | 7 | |||||||||||||||||||
| Low operational efficiency risk | * | * | * | * | * | * | 6 | ||||||||||||||||||||
| Residual risk | * | * | * | * | * | 5 | |||||||||||||||||||||
| Organization coordination risk | * | * | * | * | * | * | * | * | 8 | ||||||||||||||||||
| Political risk | * | * | * | * | * | * | * | * | * | * | * | * | * | * | * | * | 16 | ||||||||||
| Land acquisition risk | * | * | * | * | * | * | * | * | 8 | ||||||||||||||||||
| Revenue risk | * | * | * | * | * | * | * | * | * | * | * | * | 12 | ||||||||||||||
| Technical risk | * | * | * | * | * | * | * | * | * | * | * | * | * | * | * | * | * | 17 | |||||||||
| Financing risk | * | * | * | * | * | * | * | * | * | * | * | * | * | * | * | 15 | |||||||||||
| Concession period risk | * | * | * | * | 4 | ||||||||||||||||||||||
| Payment risk | * | * | * | * | * | * | 6 | ||||||||||||||||||||
| Bankruptcy/Default risk | * | * | * | * | * | 5 | |||||||||||||||||||||
| Competitive risk | * | * | * | * | * | * | * | * | * | 9 | |||||||||||||||||
| Improper public decision-making process risk | * | * | * | * | * | * | * | * | * | * | * | 11 | |||||||||||||||
| Foreign exchange and convertibility risk | * | * | * | * | * | * | * | 6 | |||||||||||||||||||
| Lack of supporting infrastructure risk | * | * | * | * | * | * | 6 | ||||||||||||||||||||
| Public credit risk | * | * | * | * | * | * | * | 7 | |||||||||||||||||||
| Pricing risk | * | * | * | * | * | * | * | 7 | |||||||||||||||||||
| Project change risk | * | * | * | * | * | * | 6 | ||||||||||||||||||||
* Inclusion of the specific risk factor in a reference. References: A = Hwang et al. [71]; B = Chou and Pramudawardhani [72]; C = Loosemore and Cheung [73]; D = Zhang et al. [74]; E = Shrestha et al. [75]; F = Shrestha et al. [76]; G = Nguyen et al. [77]; H = Keers and Van Fenema [78]; I = Wang et al. [79]; J = Le et al. [80]; K = Owolabi et al. [81]; L = Feng et al. [82]; M = Luo et al. [83]; N = Othman and Khallaf [84]; O = Kaminsky [85]; P = Bao et al. [86]; Q = Sun et al. [87]; R = Wang et al. [88]; S = Othman [89]; T = Chen et al. [90]; U = Guo et al. [91]; V = Jiang et al. [92]; W = Liu et al. [93]; X = Wang et al. [94]; Y = Chang et al. [95]; Z = Fleta-Asín and Muñoz [96].
Table A2.
List of risk factors for PPP projects.
Table A2.
List of risk factors for PPP projects.
| Project Phase | Risk Factor | Risk Description |
|---|---|---|
| Decision-making phase | Land acquisition | Wind energy projects often face challenges related to environmental protection requirements and land use rights negotiations, which can lead to increased costs and project delays. |
| Delays in approvals and permits risk | The complex environmental impact assessments and energy planning approval processes add to the costs and time, limiting the flexibility for project adjustments. | |
| Improper public decision-making process risk | Irregular decision-making procedures and a lack of expertise may lead to errors in risk assessment and project delays. | |
| Government/Public opposition risk | Environmental impacts may trigger opposition from the public and government, thereby increasing the political and social risks of the project. | |
| Financing phase | Financing risk | The financing risk of wind energy projects primarily arises from fluctuations in the financial markets and an inadequate financing structure, which may lead to increased funding costs and hinder the financing process. |
| Construction phase | Construction time delay risk | Delays in construction result in increased costs and project schedule slippage, affecting the timely commissioning of wind energy projects. |
| Site safety and security risk | Safety incidents that may occur during construction, including risks associated with high-altitude work and equipment operation. | |
| Construction quality risk | Failure to meet standards in materials or construction may lead to quality issues in wind turbines and their supporting structures. | |
| Construction cost overrun risk | Budget overruns due to fluctuations in raw material prices or construction delays. | |
| Material/Labor availability risk | Shortages of critical materials, such as steel or specialized technical labor, can lead to project delays. | |
| Technical risk | Challenges in implementing wind power technology, including system integration and energy efficiency that do not meet expectations. | |
| Design flaw/changes risk | Insufficient initial design leading to subsequent changes, increasing costs and complexity. | |
| Lack of supporting infrastructure risk | Insufficient connections to the electrical grid or inadequate road infrastructure can impact the construction and operation of wind farms. | |
| Project change risk | Necessary engineering adjustments due to changes in policies, environmental requirements, or technological updates. | |
| Operational phase | Demand risk | Instability in wind power market demand caused by market dynamics, economic fluctuations, or policy changes. |
| Maintenance cost overrun risk | Frequent repairs and increased costs due to quality issues with wind power equipment. | |
| High frequency of maintenance risk | Extreme weather conditions and other force majeure factors frequently impact the stability and maintenance requirements of wind power equipment. | |
| Operation cost overrun risk | Increased operational costs due to changes in interest rates, tax policies, or poor management. | |
| Low operational efficiency risk | Operational inefficiencies or outdated technology affecting the efficiency and energy output of wind farms. | |
| Operational phase | Revenue risk | Revenue falling below expectations due to market price fluctuations in wind power or substandard energy output. |
| Pricing risk | Fluctuations in electricity market prices or policy adjustments affecting wind power sales prices, leading to revenue falling below expectations. | |
| Competitive risk | Market share loss due to new competitors entering the market or improvements in alternative energy technologies. | |
| Payment risk | Delays or inability of the power purchaser to pay electricity fees due to economic pressures or policy changes. | |
| Full life cycle phase | Legal changes or imperfect risk | New environmental regulations or changes that affect the cost and operation of wind power projects. |
| Contractual risk | Ambiguous risk allocation or unclear responsibilities in wind power contracts leading to legal disputes. | |
| Force majeure risk | Damage to wind power facilities caused by natural disasters such as storms or earthquakes. | |
| Environmental risk | Cost increases or project delays due to stricter environmental protection regulations affecting wind power projects. | |
| Climatic/Geological conditions risk | Extreme weather or unstable geological conditions increasing the construction and operational risks of wind power projects. | |
| Bankruptcy/Default risk | Financial difficulties or defaults by partners affecting the continuity of the wind power project. | |
| Inflation risk | Inflation potentially leading to increased operational costs for wind power projects. | |
| Interest rate fluctuation risk | Fluctuations in financing costs due to changes in interest rates, affecting the financial stability of wind power projects. | |
| Tax changes risk | Changes in tax laws that may impact the economic benefits of wind power projects. | |
| Public credit risk | Failure of the government to fulfill support policies or financial commitments, affecting the investment return of the project. | |
| Residual risk | The residual value of facilities after the project ends may be lower than expected. | |
| Concession period risk | An early end to the concession period could result in insufficient investment recovery. | |
| Foreign exchange and convertibility risk | Exchange rate fluctuations or conversion restrictions affecting the cost of procuring equipment from international markets. | |
| Organization coordination risk | Inefficiency and cost overruns caused by poor project management. |
Appendix B
Table A3.
Respondent information table.
Table A3.
Respondent information table.
| Respondent Profile | Category and Percentage |
|---|---|
| Type of Organization | Government (1.96%) |
| State-owned Enterprise (29.41%) | |
| Private Enterprise (9.8%) | |
| Research Institution (11.76%) | |
| Universities (47.06%) | |
| Years of Experience in the Construction Industry | Less than 6 years (39.22%) |
| 6–10 years (21.57%) | |
| 11–15 years (13.73%) | |
| More than 15 years (25.49%) | |
| Years of Experience in PPP Projects | None (5.88%) |
| Less than 3 years (41.18%) | |
| 3–5 years (23.53%) | |
| More than 5 years (29.41%) | |
| Number of PPP Projects Participated In | None (3.92%) |
| Less than 3 projects (54.9%) | |
| 3–5 projects (13.73%) | |
| More than 5 projects (27.45%) |
Table A4.
Expert scoring standards.
Table A4.
Expert scoring standards.
| Importance Level | Score |
|---|---|
| Extremely important | 7 |
| Strongly important | 6 |
| Significantly important | 5 |
| Comparatively important | 4 |
| Fairly important | 3 |
| Slightly important | 2 |
| Not important | 1 |
Table A5.
Weights used in the improved G1 weighting method.
Table A5.
Weights used in the improved G1 weighting method.
| Progress risk | Delays in approvals and permits risk | Construction time delay risk | Improper public decision-making process risk | Land acquisition risk | Lack of supporting infrastructure risk | ||||||||||||||||||||
| 0.207 | 0.203 | 0.215 | 0.196 | 0.176 | |||||||||||||||||||||
| Change in construction quality risk | Progress risk | Technical risk | Force majeure risk | ||||||||||||||||||||||
| 0.345 | 0.299 | 0.359 | |||||||||||||||||||||||
| Project change risk | Design flaw/changes risk | Legal changes or imperfect risk | |||||||||||||||||||||||
| 0.520 | 0.480 | ||||||||||||||||||||||||
| Construction time delay risk | Project change risk | Climatic/Geological conditions risk | Design flaw/changes risk | Environmental risk | Site security risk | Technical risk | Material/Labor availability risk | ||||||||||||||||||
| 0.159 | 0.130 | 0.152 | 0.132 | 0.149 | 0.134 | 0.134 | |||||||||||||||||||
| Construction cost overrun risk | Rework risk | Climatic/Geological conditions risk | Environmental risk | Tax changes risk | Financing risk | Inflation risk | |||||||||||||||||||
| 0.178 | 0.154 | 0.158 | 0.198 | 0.158 | 0.156 | ||||||||||||||||||||
| Financing risk | Legal changes or imperfect risk | Interest rate fluctuation risk | Foreign exchange and convertibility risk | ||||||||||||||||||||||
| 0.405 | 0.323 | 0.272 | |||||||||||||||||||||||
| High frequency of maintenance risk | Force majeure risk | Climatic/Geological conditions risk | |||||||||||||||||||||||
| 0.506 | 0.494 | ||||||||||||||||||||||||
| Maintenance cost overrun risk | Change in construction quality risk | High frequency of maintenance risk | |||||||||||||||||||||||
| 0.522 | 0.478 | ||||||||||||||||||||||||
| Low operational efficiency risk | Maintenance cost overrun risk | High frequency of maintenance risk | |||||||||||||||||||||||
| 0.503 | 0.497 | ||||||||||||||||||||||||
| Operation cost overrun risk | Tax changes risk | Maintenance cost overrun risk | Low operational efficiency risk | Interest rate fluctuation risk | |||||||||||||||||||||
| 0.280 | 0.267 | 0.237 | 0.215 | ||||||||||||||||||||||
| Demand risk | Competitive risk | Pricing risk | |||||||||||||||||||||||
| 0.488 | 0.512 | ||||||||||||||||||||||||
| Pricing risk | Payment risk | Inflation risk | Concession period risk | Operating cost risk | |||||||||||||||||||||
| 0.270 | 0.251 | 0.255 | 0.224 | ||||||||||||||||||||||
| Revenue risk | Demand risk | Pricing risk | |||||||||||||||||||||||
| 0.511 | 0.489 | ||||||||||||||||||||||||
| Insolvency default risk | Organization coordination risk | Contractual risk | |||||||||||||||||||||||
| 0.463 | 0.537 | ||||||||||||||||||||||||
| Public credit risk | Contractual risk | Legal changes or imperfect risk | Government/Public opposition risk | ||||||||||||||||||||||
| 0.329 | 0.342 | 0.329 | |||||||||||||||||||||||
| Insufficiency expected return risk | Revenue risk | Construction cost overrun risk | Financing risk | Salvage value risk | Operation cost overrun risk | Bankruptcy/ Default risk | Public credit risk | ||||||||||||||||||
| 0.162 | 0.149 | 0.149 | 0.134 | 0.146 | 0.144 | 0.116 | |||||||||||||||||||
Table A6.
Coefficients of key risks determined using the entropy method.
Table A6.
Coefficients of key risks determined using the entropy method.
| Key Risks | Risks j | |||
|---|---|---|---|---|
| Progress risk | Delays in approvals and permits risk | 0.963 | 0.037 | 0.313 |
| Construction time delay risk | 0.982 | 0.018 | 0.155 | |
| Improper public decision-making process risk | 0.985 | 0.015 | 0.131 | |
| Land acquisition risk | 0.975 | 0.025 | 0.215 | |
| Lack of supporting infrastructure risk | 0.978 | 0.022 | 0.186 | |
| Change in construction quality risk | Progress risk | 0.950 | 0.050 | 0.427 |
| Technical risk | 0.976 | 0.024 | 0.207 | |
| Force majeure risk | 0.957 | 0.043 | 0.365 | |
| Project change risk | Design flaw/changes risk | 0.977 | 0.023 | 0.421 |
| Legal changes or imperfect risk | 0.968 | 0.032 | 0.579 | |
| Construction time delay risk | Project change risk | 0.982 | 0.018 | 0.066 |
| Climatic/Geological conditions risk | 0.958 | 0.042 | 0.155 | |
| Design flaw/changes risk | 0.982 | 0.018 | 0.067 | |
| Environmental risk | 0.958 | 0.042 | 0.156 | |
| Site security risk | 0.974 | 0.026 | 0.096 | |
| Technical risk | 0.919 | 0.081 | 0.300 | |
| Material/Labor availability risk | 0.957 | 0.043 | 0.159 | |
| Construction cost overrun risk | Rework risk | 0.946 | 0.054 | 0.260 |
| Climatic/Geological conditions risk | 0.966 | 0.035 | 0.167 | |
| Environmental risk | 0.971 | 0.029 | 0.141 | |
| Tax changes risk | 0.966 | 0.034 | 0.163 | |
| Financing risk | 0.98 | 0.020 | 0.095 | |
| Inflation risk | 0.964 | 0.036 | 0.175 | |
| Financing risk | Legal changes or imperfect risk | 0.968 | 0.032 | 0.263 |
| Interest rate fluctuation risk | 0.967 | 0.033 | 0.271 | |
| Foreign exchange and convertibility risk | 0.944 | 0.057 | 0.466 | |
| High frequency of maintenance risk | Force majeure risk | 0.971 | 0.029 | 0.401 |
| Climatic/Geological conditions risk | 0.957 | 0.043 | 0.599 | |
| Maintenance cost overrun risk | Change in construction quality risk | 0.964 | 0.036 | 0.454 |
| High frequency of maintenance risk | 0.956 | 0.044 | 0.547 | |
| Low operational efficiency risk | Maintenance cost overrun risk | 0.965 | 0.035 | 0.468 |
| High frequency of maintenance risk | 0.960 | 0.04 | 0.532 | |
| Operation cost overrun risk | Tax changes risk | 0.938 | 0.062 | 0.336 |
| Maintenance cost overrun risk | 0.967 | 0.033 | 0.179 | |
| Low operational efficiency risk | 0.957 | 0.043 | 0.234 | |
| Interest rate fluctuation risk | 0.954 | 0.047 | 0.251 | |
| Demand risk | Competitive risk | 0.980 | 0.020 | 0.463 |
| Pricing risk | 0.977 | 0.023 | 0.537 | |
| Pricing risk | Payment risk | 0.969 | 0.032 | 0.242 |
| Inflation risk | 0.971 | 0.029 | 0.222 | |
| Concession period risk | 0.954 | 0.046 | 0.351 | |
| Operating cost risk | 0.976 | 0.024 | 0.185 | |
| Revenue risk | Demand risk | 0.980 | 0.020 | 0.538 |
| Pricing risk | 0.983 | 0.017 | 0.462 | |
| Insolvency default risk | Organization coordination risk | 0.968 | 0.032 | 0.650 |
| Contractual risk | 0.983 | 0.017 | 0.350 | |
| Public credit risk | Contractual risk | 0.978 | 0.022 | 0.318 |
| Legal changes or imperfect risk | 0.976 | 0.025 | 0.360 | |
| Government/Public opposition risk | 0.978 | 0.022 | 0.322 | |
| Insufficiency expected return risk | Revenue risk | 0.974 | 0.026 | 0.134 |
| Construction cost overrun risk | 0.967 | 0.033 | 0.171 | |
| Financing risk | 0.980 | 0.020 | 0.103 | |
| Salvage value risk | 0.962 | 0.038 | 0.198 | |
| Operation cost overrun risk | 0.968 | 0.032 | 0.168 | |
| Bankruptcy/Default risk | 0.978 | 0.022 | 0.116 | |
| Public credit risk | 0.979 | 0.021 | 0.111 |
Table A7.
Combined weights of risk factors.
Table A7.
Combined weights of risk factors.
| Progress risk | Delays in approvals and permits risk | Construction time delay risk | Improper public decision-making process risk | Land acquisition risk | Lack of supporting infrastructure risk | ||||||||||||||||
| 0.260 | 0.179 | 0.173 | 0.206 | 0.181 | |||||||||||||||||
| Change in construction quality risk | Progress risk | Technical risk | Force majeure risk | ||||||||||||||||||
| 0.386 | 0.253 | 0.362 | |||||||||||||||||||
| Project change risk | Design flaw/changes risk | Legal changes or imperfect risk | |||||||||||||||||||
| 0.471 | 0.480 | ||||||||||||||||||||
| Construction time delay risk | Project change risk | Climatic/Geological conditions risk | Design flaw/changes risk | Environmental risk | Site security risk | Technical risk | Material/Labor availability risk | ||||||||||||||
| 0.113 | 0.143 | 0.110 | 0.144 | 0.123 | 0.217 | 0.147 | |||||||||||||||
| Construction cost overrun risk | Rework risk | Climatic/Geological conditions risk | Environmental risk | Tax changes risk | Financing risk | Inflation risk | |||||||||||||||
| 0.219 | 0.161 | 0.150 | 0.181 | 0.127 | 0.166 | ||||||||||||||||
| Financing risk | Legal changes or imperfect risk | Interest rate fluctuation risk | Foreign exchange and convertibility risk | ||||||||||||||||||
| 0.334 | 0.297 | 0.369 | |||||||||||||||||||
| High frequency of maintenance risk | Force majeure risk | Climatic/Geological conditions risk | |||||||||||||||||||
| 0.454 | 0.547 | ||||||||||||||||||||
| Maintenance cost overrun risk | Change in construction quality risk | High frequency of maintenance risk | |||||||||||||||||||
| 0.488 | 0.513 | ||||||||||||||||||||
| Low operational efficiency risk | Maintenance cost overrun risk | High frequency of maintenance risk | |||||||||||||||||||
| 0.486 | 0.515 | ||||||||||||||||||||
| Operation cost overrun risk | Tax changes risk | Maintenance cost overrun risk | Low operational efficiency risk | Interest rate fluctuation risk | |||||||||||||||||
| 0.308 | 0.223 | 0.236 | 0.233 | ||||||||||||||||||
| Demand risk | Competitive risk | Pricing risk | |||||||||||||||||||
| 0.476 | 0.525 | ||||||||||||||||||||
| Pricing risk | Payment risk | Inflation risk | Concession period risk | Operating cost risk | |||||||||||||||||
| 0.256 | 0.237 | 0.303 | 0.205 | ||||||||||||||||||
| Revenue risk | Demand risk | Pricing risk | |||||||||||||||||||
| 0.525 | 0.476 | ||||||||||||||||||||
| Bankruptcy default risk | Organization coordination risk | Contractual risk | |||||||||||||||||||
| 0.557 | 0.444 | ||||||||||||||||||||
| Public credit risk | Contractual risk | Legal changes or imperfect risk | Government/Public opposition risk | ||||||||||||||||||
| 0.324 | 0.351 | 0.326 | |||||||||||||||||||
| Insufficiency expected return risk | Revenue risk | Construction cost overrun risk | Financing risk | Salvage value risk | Operation cost overrun risk | Bankruptcy/ Default risk | Public credit risk | ||||||||||||||
| 0.148 | 0.160 | 0.126 | 0.166 | 0.157 | 0.130 | 0.114 | |||||||||||||||
References
- Liu, Y.; Song, P. Digital Transformation and Green Innovation of Energy Enterprises. Sustainability 2023, 15, 7703. [Google Scholar] [CrossRef]
- Li, Y.; Tang, D.; Yuan, C.; Diaz-Londono, C.; Agundis-Tinajero, G.D.; Guerrero, J.M. The Roles of Hydrogen Energy in Ports: Comparative Life-Cycle Analysis Based on Hydrogen Utilization Strategies. Int. J. Hydrogen Energy 2025, 106, 1356–1372. [Google Scholar] [CrossRef]
- Yang, Q.-C.; Zheng, M.; Chang, C.-P. Energy Policy and Green Innovation: A Quantile Investigation into Renewable Energy. Renew. Energy 2022, 189, 1166–1175. [Google Scholar] [CrossRef]
- Berg, V.I.; Zakirzakov, A.G.; Gordievskaya, E.F. Dynamics Analysis of Wind Energy Production Development. IOP Conf. Ser. Earth Environ. Sci. 2017, 50, 012033. [Google Scholar] [CrossRef]
- Li, M.; Carroll, J.; Ahmad, A.S.; Hasan, N.S.; Zolkiffly, M.Z.B.; Falope, G.B.; Sabil, K.M. Potential of Offshore Wind Energy in Malaysia: An Investigation into Wind and Bathymetry Conditions and Site Selection. Energies 2023, 17, 65. [Google Scholar] [CrossRef]
- Acosta-Silva, Y.D.J.; Torres-Pacheco, I.; Matsumoto, Y.; Toledano-Ayala, M.; Soto-Zarazúa, G.M.; Zelaya-Ángel, O.; Méndez-López, A. Applications of Solar and Wind Renewable Energy in Agriculture: A Review. Sci. Prog. 2019, 102, 127–140. [Google Scholar] [CrossRef] [PubMed]
- Mengi-Dinçer, H.; Ediger, V.Ş.; Yesevi, Ç.G. Evaluating the International Renewable Energy Agency through the Lens of Social Constructivism. Renew. Sustain. Energy Rev. 2021, 152, 111705. [Google Scholar] [CrossRef]
- Hopuare, M.; Manni, T.; Laurent, V.; Maamaatuaiahutapu, K. Investigating Wind Energy Potential in Tahiti, French Polynesia. Energies 2022, 15, 2090. [Google Scholar] [CrossRef]
- Kamali Saraji, M.; Streimikiene, D. A Novel Multicriteria Assessment Framework for Evaluating the Performance of the EU in Dealing with Challenges of the Low-Carbon Energy Transition: An Integrated Fermatean Fuzzy Approach. Sustain. Environ. Res. 2024, 34, 6. [Google Scholar] [CrossRef]
- Costoya, X.; deCastro, M.; Carvalho, D.; Gómez-Gesteira, M. On the Suitability of Offshore Wind Energy Resource in the United States of America for the 21st Century. Appl. Energy 2020, 262, 114537. [Google Scholar] [CrossRef]
- Dorrell, J.; Lee, K. The Politics of Wind: A State Level Analysis of Political Party Impact on Wind Energy Development in the United States. Energy Res. Soc. Sci. 2020, 69, 101602. [Google Scholar] [CrossRef]
- Mourão, R.R.; Mayer, A.; Cavallini Johansen, I.; Bortoleto, A.P.; Ninni Ramos, K.; Brown, E.; McCright, A.; Lopez, M.C.; Moran, E. News Consumption, Partisanship, and Energy Preferences in Brazil and the United States. Environ. Commun. 2024, 1–20. [Google Scholar] [CrossRef]
- Borunda, M.; Ramírez, A.; Garduno, R.; García-Beltrán, C.; Mijarez, R. Enhancing Long-Term Wind Power Forecasting by Using an Intelligent Statistical Treatment for Wind Resource Data. Energies 2023, 16, 7915. [Google Scholar] [CrossRef]
- Mastoi, M.S.; Zhuang, S.; Haris, M.; Hassan, M.; Ali, A. Large-Scale Wind Power Grid Integration Challenges and Their Solution: A Detailed Review. Environ. Sci. Pollut. Res. 2023, 30, 103424–103462. [Google Scholar] [CrossRef] [PubMed]
- Tan, J.D.; Chang, C.C.W.; Bhuiyan, M.A.S.; Minhad, K.N.; Ali, K. Advancements of Wind Energy Conversion Systems for Low-Wind Urban Environments: A Review. Energy Rep. 2022, 8, 3406–3414. [Google Scholar] [CrossRef]
- Spyridonidou, S.; Vagiona, D.G. Systematic Review of Site-Selection Processes in Onshore and Offshore Wind Energy Research. Energies 2020, 13, 5906. [Google Scholar] [CrossRef]
- Onar, S.Ç.; Kılavuz, T.N. Risk Analysis of Wind Energy Investments in Turkey. Hum. Ecol. Risk Assess. Int. J. 2015, 21, 1230–1245. [Google Scholar] [CrossRef]
- Martins, A.C.; Marques, R.C.; Cruz, C.O. Public–Private Partnerships for Wind Power Generation: The Portuguese Case. Energy Policy 2011, 39, 94–104. [Google Scholar] [CrossRef]
- Awuku, S.A.; Bennadji, A.; Muhammad-Sukki, F.; Sellami, N. Promoting the Solar Industry in Ghana through Effective Public-Private Partnership (PPP): Some Lessons from South Africa and Morocco. Energies 2022, 15, 17. [Google Scholar] [CrossRef]
- Sastoque, L.M.; Arboleda, C.A.; Ponz, J.L. A Proposal for Risk Allocation in Social Infrastructure Projects Applying PPP in Colombia. Procedia Eng. 2016, 145, 1354–1361. [Google Scholar] [CrossRef]
- Tallaki, M.; Bracci, E. Risk Allocation, Transfer and Management in Public–Private Partnership and Private Finance Initiatives: A Systematic Literature Review. Int. J. Public Sect. Manag. 2021, 34, 709–731. [Google Scholar] [CrossRef]
- Li, F.; Phoon, K.K.; Du, X.; Zhang, M. Improved AHP Method and Its Application in Risk Identification. J. Constr. Eng. Manag. 2013, 139, 312–320. [Google Scholar] [CrossRef]
- Cesarone, F.; Colucci, S. Minimum Risk versus Capital and Risk Diversification Strategies for Portfolio Construction. J. Oper. Res. Soc. 2018, 69, 183–200. [Google Scholar] [CrossRef]
- Akomea-Frimpong, I.; Jin, X.; Osei-Kyei, R. A Holistic Review of Research Studies on Financial Risk Management in Public–Private Partnership Projects. Eng. Constr. Arch. Manag. 2021, 28, 2549–2569. [Google Scholar] [CrossRef]
- Gao, Y.; Lau, C.K. Risk Assessment of Urban Rail Transit Project Using Interpretative Structural Modelling: Evidence from China. Math. Probl. Eng. 2021, 2021, 5581686. [Google Scholar] [CrossRef]
- Zhang, K.; Zhou, H.; Li, H.; Tang, A.; Li, C. Composite Power System Risk Evaluation Considering the Accurate Model of Renewable Power Output. Energy Rep. 2023, 9, 1861–1874. [Google Scholar] [CrossRef]
- Liu, J.; Liu, J.; Hu, J. Forecasting the Investors’ Escalation of Commitment in PPP Project at Different Project Stages: A Regression Model Based on the Influence of Social Factors. Eng. Manag. J. 2024, 36, 30–41. [Google Scholar] [CrossRef]
- Martiniello, L.; Morea, D.; Paolone, F.; Tiscini, R. Energy Performance Contracting and Public-Private Partnership: How to Share Risks and Balance Benefits. Energies 2020, 13, 3625. [Google Scholar] [CrossRef]
- Mao, Y.; Zhang, Y. Risk Identification and Allocation of the Utility Tunnel PPP Project. AIP Publishing LLC 2017, 1839, 020132. [Google Scholar] [CrossRef]
- Karim, N.A.A. Risk Allocation in Public Private Partnership (PPP) Project: A Review on Risk Factors. Int. J. Sustain. Constr. Eng. Technol. 2011, 2, 8–16. [Google Scholar]
- Liu, J.; Liu, J.; Bu, Z.; Zhou, Y.; He, P. Path Analysis of Influencing Government’s Excessive Behavior in PPP Project: Based on Field Dynamic Theory. Transp. Res. Part A Policy Pract. 2022, 166, 522–540. [Google Scholar] [CrossRef]
- Wang, D.; Qiao, Z. The Influence of Capital Deepening on Regional Economic Development Gap: The Intermediary Effect of the Labor Income Share. Sustainability 2022, 14, 16853. [Google Scholar] [CrossRef]
- Liu, Y.; Ling, H.; Ou, P.; Xu, K.; Kong, L. Pollution Emission Right Trading Policy and Green Total Factor Productivity. Technol. Anal. Strateg. Manag. 2024, 1–18. [Google Scholar] [CrossRef]
- Choo, W.; De Jong, P. Insights to Systematic Risk and Diversification across a Joint Probability Distribution. Insur. Math. Econ. 2016, 67, 142–150. [Google Scholar] [CrossRef]
- Li, Q.; Zhang, W. Sparse and Risk Diversification Portfolio Selection. Optim. Lett. 2023, 17, 1181–1200. [Google Scholar] [CrossRef]
- Ciullo, A.; Strobl, E.; Meiler, S.; Martius, O.; Bresch, D.N. Increasing Countries’ Financial Resilience through Global Catastrophe Risk Pooling. Nat. Commun. 2023, 14, 922. [Google Scholar] [CrossRef]
- Frey, R.; Hledik, J. Diversification and Systemic Risk: A Financial Network Perspective. Risks 2018, 6, 54. [Google Scholar] [CrossRef]
- Deng, G.; Kang, S.; Guo, K. Analysis on the Present Situation of Agricultural Catastrophe Risk Diversification in China. In Proceedings of the 7th Annual Meeting of Risk Analysis Council of China Association for Disaster Prevention, Changsha, China, 4–6 November 2016. [Google Scholar]
- Uchiyama, Y.; Kadoya, T.; Nakagawa, K. Complex Valued Risk Diversification. Entropy 2019, 21, 119. [Google Scholar] [CrossRef]
- Sugitomo, S.; Maeta, K. Quaternion Valued Risk Diversification. Entropy 2020, 22, 390. [Google Scholar] [CrossRef]
- Amiri, O.; Ayazi, A.; Rahimi, M.; Khazaeni, G. Risks of Water and Wastewater PPP Projects: An Investors’ Perspective. Constr. Innov. 2022, 22, 1104–1121. [Google Scholar] [CrossRef]
- Adu Gyamfi, T.; Aigbavboa, C.O.; Thwala, W.D. Risk Resources Management Influence on Public–Private Partnership Risk Management in Construction Industry. Confirmatory Factor Analysis Approach. J. Eng. Des. Technol. 2022, 22, 1544–1569. [Google Scholar] [CrossRef]
- Zhang, J.; Wang, T.; Zhang, L. Legal Risk Assessment Framework for International PPP Projects Based on Metanetwork. J. Constr. Eng. Manag. 2021, 147, 04021090. [Google Scholar] [CrossRef]
- Chen, H.; Wan, A.; Wei, G.; Peng, B. Multi-Dimensional Identification of Investment Risks in Renewable Energy Projects along the Belt and Road: An Integrated Framework Based on HHM and WRT. Technol. Anal. Strateg. Manag. 2024, 1–14. [Google Scholar] [CrossRef]
- Attarzadeh, M.; Chua, D.K.H.; Beer, M.; Abbott, E.L.S. Options-Based Negotiation Management of PPP–BOT Infrastructure Projects. Constr. Manag. Econ. 2017, 35, 676–692. [Google Scholar] [CrossRef]
- Cvetković, P.N. Typology and Control of the Risks by the Public Private Partnership. Zb. Rad. Pravnog Fak. Nišu 2012, 63, 121–145. [Google Scholar]
- Mineo, S. Comparing Rockfall Hazard and Risk Assessment Procedures along Roads for Different Planning Purposes. J. Mt. Sci. 2020, 17, 653–669. [Google Scholar] [CrossRef]
- Guo, J.; Ma, K. Risk Analysis for Hazardous Chemical Vehicle-Bridge Transportation System: A Dynamic Bayesian Network Model Incorporating Vehicle Dynamics. Reliab. Eng. Syst. Saf. 2024, 242, 109732. [Google Scholar] [CrossRef]
- Li, X.; Yan, X.; Ma, L.; Li, H.; Wang, H.; Cai, L.; Lu, S.; Tang, C.; Wei, X. Probabilistic Risk Analysis for Catenary System of Heavy-Haul Railway Based on Casual Inference. Concurr. Comput. 2025, 37, e8368. [Google Scholar] [CrossRef]
- Xu, Z.; He, Z.; Wang, X. Efficient Risk Estimation via Nested Multilevel Quasi-Monte Carlo Simulation. J. Comput. Appl. Math. 2024, 443, 115745. [Google Scholar] [CrossRef]
- Guo, B.; Li, J. Research on the Evolution of Participants Collaboration Mechanism in PPP Model Based on Computer Simulation: Based on the Old Community Renovation Project. J. Supercomput. 2020, 76, 2417–2434. [Google Scholar] [CrossRef]
- Li, R.; Zhang, G.; Li, S.; Wang, A. Driving Mechanism of High-Tech Enterprises Sustainable Development from Collaborative Dual Innovation Perspective in Eastern China Based on System Dynamics Model. Technol. Anal. Strateg. Manag. 2023, 36, 4531–4548. [Google Scholar] [CrossRef]
- Bajomo, M.; Ogbeyemi, A.; Zhang, W. A Systems Dynamics Approach to the Management of Material Procurement for Engineering, Procurement and Construction Industry. Int. J. Prod. Econ. 2022, 244, 108390. [Google Scholar] [CrossRef]
- Zhao, Y.; Zhou, Y.; Zhang, Y.; Chen, H. Exploring Intellectual Property Risk Inducement and Formation Mechanism of Innovation-Oriented Enterprises: A Grounded Theory Approach and System Dynamics Model Analysis. Technol. Anal. Strateg. Manag. 2023, 36, 4686–4700. [Google Scholar] [CrossRef]
- Liu, A.; Chen, K.; Huang, X.; Li, D.; Zhang, X. Dynamic risk assessment model of buried gas pipelines based on system dynamics. Reliab. Eng. Syst. Saf. 2021, 208, 107326. [Google Scholar] [CrossRef]
- Huang, L.; Wang, C.; Cui, B.; Zhou, H.; Wu, M.; Li, C. Employing an Interpretive Structural Modeling–System Dynamics Approach for Deep Foundation Pit Risk Assessment Model. ASCE-ASME J. Risk Uncertain. Eng. Syst. Part A Civ. Eng. 2024, 10, 04024004. [Google Scholar] [CrossRef]
- Hu, B.; Leopold, A.; Pickl, S. Concept and Prototype of a Web Tool for Public–Private Project Contracting Based on a System Dynamics Model. Cent. Eur. J. Oper. Res. 2015, 23, 407–419. [Google Scholar] [CrossRef]
- Morcillo, J.D.; Angulo, F.; Franco, C.J. Analyzing the Hydroelectricity Variability on Power Markets from a System Dynamics and Dynamic Systems Perspective: Seasonality and ENSO Phenomenon. Energies 2020, 13, 2381. [Google Scholar] [CrossRef]
- Calvo-Amodio, J.; Tercero-Gómez, V.G.; Ramirez-Galindo, J.G.; Martínez-Salazar, I. A Systemic Analysis of Professional Certification Rates: The Case of a Six Sigma Training Certificate Program. Eng. Manag. J. 2014, 26, 13–22. [Google Scholar] [CrossRef]
- Reiner, G.; Natter, M.; Drechsler, W. Life Cycle Profit–Reducing Supply Risks by Integrated Demand Management. Technol. Anal. Strateg. Manag. 2009, 21, 653–664. [Google Scholar] [CrossRef]
- Li, B.; Akintoye, A.; Edwards, P.J.; Hardcastle, C. Perceptions of Positive and Negative Factors Influencing the Attractiveness of PPP/PFI Procurement for Construction Projects in the UK: Findings from a Questionnaire Survey. Eng. Constr. Archit. Manag. 2005, 12, 125–148. [Google Scholar] [CrossRef]
- Salman, A.F.M.; Skibniewski, M.J.; Basha, I. BOT Viability Model for Large-Scale Infrastructure Projects. J. Constr. Eng. Manag. 2007, 133, 50–63. [Google Scholar] [CrossRef]
- Ying, L.; Qianying, D.; Zhihui, C.; Junwen, C.; Zhengjiang, L. Generation Model of Optimal EmergencyTreatment Technology for Sudden Heavy MetalPollution Based on Group-G1 Method. Pol. J. Environ. Stud. 2021, 30, 5899–5908. [Google Scholar] [CrossRef]
- de Rada, V.D. Handbook of Survey Research. Rev. Int. Sociol. 2013, 71, 229–233. [Google Scholar]
- Shannon, C.E. The Mathematical Theory of Communication. Bell Labs Tech. J. 1950, 3, 31–32. [Google Scholar] [CrossRef]
- Nikunj Agarwal, H.G. Entropy Based Multi-Criteria Decision Making Method under Fuzzy Environment and Unknown Attribute Weights. Glob. J. Technol. Optim. 2015, 06, 13–20. [Google Scholar] [CrossRef]
- Bayer, S. Business Dynamics: Systems Thinking and Modeling for a Complex World. Interfaces 2004, 34, 324–326. [Google Scholar]
- Wang, Y.; Gong, L.; Zheng, S.; Han, X.; Zhang, J.; Huang, Y. Temporal and Spatial Evolution of Public–Private Partnership (PPP) Project Risks in China: 2003–2019. Adv. Civ. Eng. 2024, 2024, 2689594. [Google Scholar] [CrossRef]
- John, A.; Yang, Z.; Riahi, R.; Wang, J. A Risk Assessment Approach to Improve the Resilience of a Seaport System Using Bayesian Networks. Ocean Eng. 2016, 111, 136–147. [Google Scholar] [CrossRef]
- Saltelli, A.; Puy, A.; Lo Piano, S. Sensitivity Analysis. SSRN J. 2021. [Google Scholar] [CrossRef]
- Hwang, B.-G.; Zhao, X.; Gay, M.J.S. Public Private Partnership Projects in Singapore: Factors, Critical Risks and Preferred Risk Allocation from the Perspective of Contractors. Int. J. Proj. Manag. 2013, 31, 424–433. [Google Scholar] [CrossRef]
- Chou, J.-S.; Pramudawardhani, D. Cross-Country Comparisons of Key Drivers, Critical Success Factors and Risk Allocation for Public-Private Partnership Projects. Int. J. Proj. Manag. 2015, 33, 1136–1150. [Google Scholar] [CrossRef]
- Loosemore, M.; Cheung, E. Implementing Systems Thinking to Manage Risk in Public Private Partnership Projects. Int. J. Proj. Manag. 2015, 33, 1325–1334. [Google Scholar] [CrossRef]
- Zhang, S.; Chan, A.P.C.; Feng, Y.; Duan, H.; Ke, Y. Critical Review on PPP Research—A Search from the Chinese and International Journals. Int. J. Proj. Manag. 2016, 34, 597–612. [Google Scholar] [CrossRef]
- Shrestha, A.; Chan, T.-K.; Aibinu, A.A.; Chen, C.; Martek, I. Risks in PPP Water Projects in China: Perspective of Local Governments. J. Constr. Eng. Manag. 2017, 143, 05017006. [Google Scholar] [CrossRef]
- Shrestha, A.; Chan, T.-K.; Aibinu, A.A.; Chen, C.; Martek, I. Risk Allocation Inefficiencies in Chinese PPP Water Projects. J. Constr. Eng. Manag. 2018, 144, 04018013. [Google Scholar] [CrossRef]
- Nguyen, A.; Mollik, A.; Chih, Y.-Y. Managing Critical Risks Affecting the Financial Viability of Public–Private Partnership Projects: Case Study of Toll Road Projects in Vietnam. J. Constr. Eng. Manag. 2018, 144, 05018014. [Google Scholar] [CrossRef]
- Keers, B.B.M.; Van Fenema, P.C. Managing Risks in Public-Private Partnership Formation Projects. Int. J. Proj. Manag. 2018, 36, 861–875. [Google Scholar] [CrossRef]
- Wang, H.; Liu, Y.; Xiong, W.; Song, J. The Moderating Role of Governance Environment on the Relationship between Risk Allocation and Private Investment in PPP Markets: Evidence from Developing Countries. Int. J. Proj. Manag. 2019, 37, 117–130. [Google Scholar] [CrossRef]
- Le, P.T.; Chileshe, N.; Kirytopoulos, K.; Rameezdeen, R. Investigating the Significance of Risks in BOT Transportation Projects in Vietnam. Eng. Constr. Arch. Manag. 2020, 27, 1401–1425. [Google Scholar] [CrossRef]
- Owolabi, H.A.; Oyedele, L.O.; Alaka, H.A.; Ajayi, S.O.; Akinade, O.O.; Bilal, M. Critical Success Factors for Ensuring Bankable Completion Risk in PFI/PPP Megaprojects. J. Manag. Eng. 2020, 36, 04019032. [Google Scholar] [CrossRef]
- Feng, Y.; Guo, X.; Wei, B.; Chen, B. A Fuzzy Analytic Hierarchy Process for Risk Evaluation of Urban Rail Transit PPP Projects. J. Intell. Fuzzy Syst. 2021, 41, 5117–5128. [Google Scholar] [CrossRef]
- Luo, C.; Ju, Y.; Dong, P.; Gonzalez, E.D.R.S.; Wang, A. Risk Assessment for PPP Waste-to-Energy Incineration Plant Projects in China Based on Hybrid Weight Methods and Weighted Multigranulation Fuzzy Rough Sets. Sustain. Cities Soc. 2021, 74, 103120. [Google Scholar] [CrossRef]
- Othman, K.; Khallaf, R. Identification of the Barriers and Key Success Factors for Renewable Energy Public-Private Partnership Projects: A Continental Analysis. Buildings 2022, 12, 1511. [Google Scholar] [CrossRef]
- Kaminsky, J.A. Improving Public–Private Partnerships for Renewable Electricity Infrastructure in Lower- and Middle-Income Countries. J. Constr. Eng. Manag. 2022, 148, 04022012. [Google Scholar] [CrossRef]
- Bao, F.; Martek, I.; Chen, C.; Wu, Q.; Chan, A.P.C. Critical Risks Inherent to the Transfer Phase of Public–Private Partnership Water Projects in China. J. Manag. Eng. 2022, 38, 04022006. [Google Scholar] [CrossRef]
- Sun, G.; Sun, J.; Li, F. Influencing Factors of Early Termination for PPP Projects Based on Multicase Grounded Theory. J. Constr. Eng. Manag. 2022, 148, 04022120. [Google Scholar] [CrossRef]
- Wang, Y.; Li, Q.; Zuo, J.; Bartsch, K. How Did Balance Loss Occur? A Cross-Stakeholder Analysis of Risk Misallocation in a Sponge City PPP Project. Water Resour. Manag. 2022, 36, 5225–5240. [Google Scholar] [CrossRef]
- Othman, K. Renewable Energy Public-Private Partnership Projects in Egypt: Perception of the Barriers and Key Success Factors by Sector. Alex. Eng. J. 2023, 75, 513–530. [Google Scholar] [CrossRef]
- Chen, H.; Wang, J.; Feng, Z.; Liu, Y.; Xu, W.; Qin, Y. Research on the Risk Evaluation of Urban Wastewater Treatment Projects Based on an Improved Fuzzy Cognitive Map. Sustain. Cities Soc. 2023, 98, 104796. [Google Scholar] [CrossRef]
- Guo, Y.; Wang, X.; Liu, L.; Chen, C.; Martek, I.; Luo, X. Dynamic Assessment of the Transfer Risks in China’s Public–Private Partnership Water Projects: A System Dynamics Approach. J. Infrastruct. Syst. 2023, 29, 04023033. [Google Scholar] [CrossRef]
- Jiang, F.; Lyu, Y.; Zhang, Y.; Guo, Y. Research on the Differences between Risk-Factor Attention and Risk Losses in PPP Projects. J. Constr. Eng. Manag. 2023, 149, 04023090. [Google Scholar] [CrossRef]
- Liu, Y.; Wang, X.; Zhang, J.; Guo, S. How Risk Factors Lead to the Early Termination of Public–Private Partnership Projects in China: A Multi-Case Study Based on Social Network Analysis and Interpretive-Structure Modeling. Eng. Constr. Arch. Manag. 2023, 32, 824–846. [Google Scholar] [CrossRef]
- Wang, Z.; Zhou, Y.; Jin, X.; Zhao, N.; Sun, J. Risk Allocation and Benefit Distribution of PPP Projects for Construction Waste Recycling: A Case Study of China. Eng. Constr. Archit. Manag. 2023, 30, 3927–3956. [Google Scholar] [CrossRef]
- Chang, Z.; Zheng, Y.; Qu, M.; Gao, X.; Tian, X.; Liu, G. Motion Analysis of International Energy Agency Wind 15 MW Floating Offshore Wind Turbine under Extreme Conditions. J. Mar. Sci. Eng. 2024, 12, 1166. [Google Scholar] [CrossRef]
- Fleta-Asín, J.; Muñoz, F. Risk Allocation Schemes between Public and Private Sectors in Green Energy Projects. J. Environ. Manag. 2024, 357, 120650. [Google Scholar] [CrossRef] [PubMed]
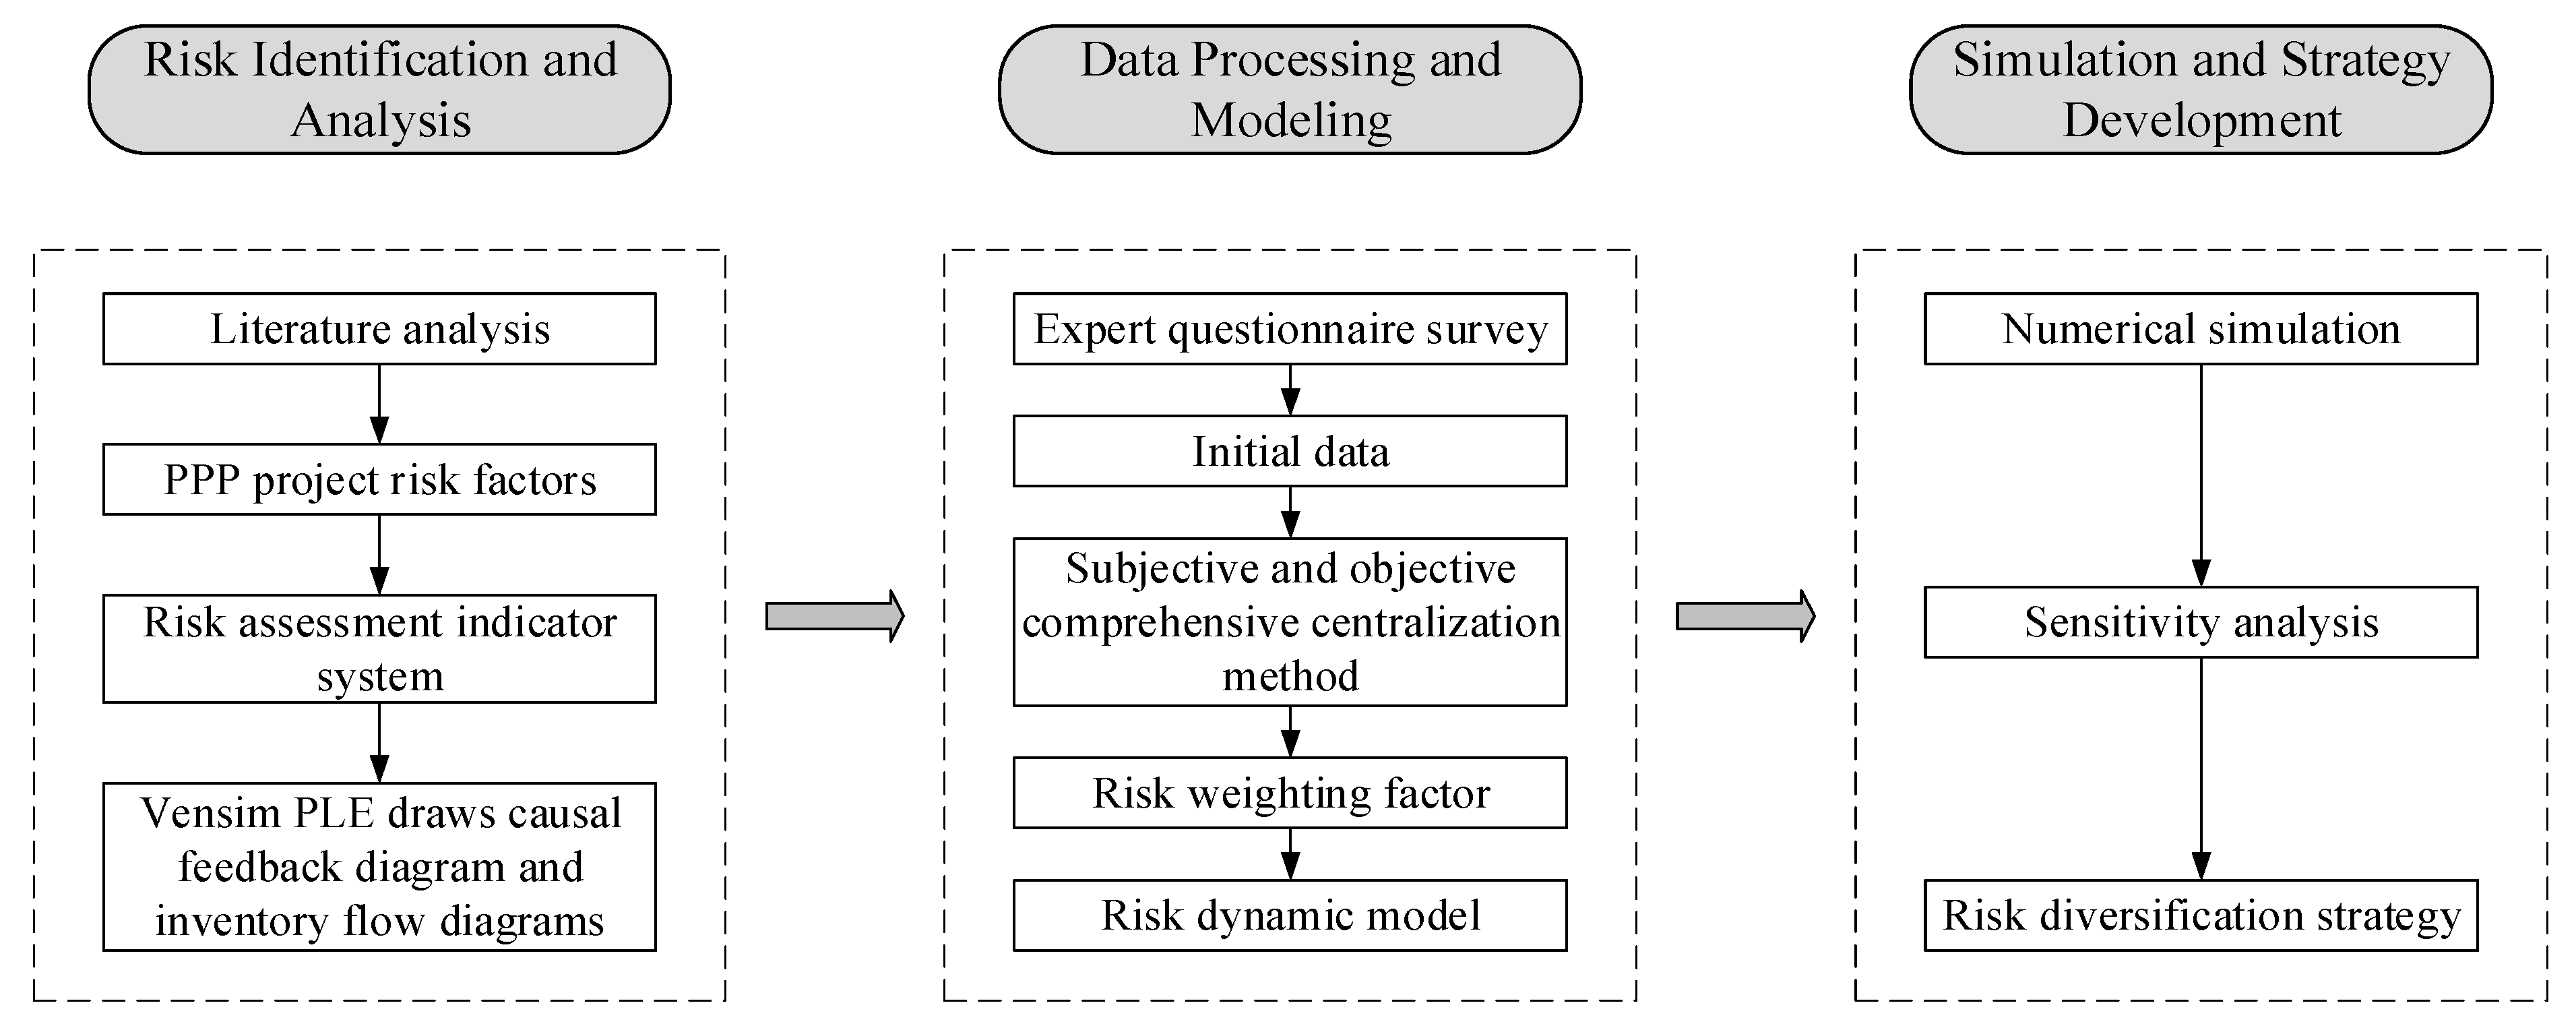
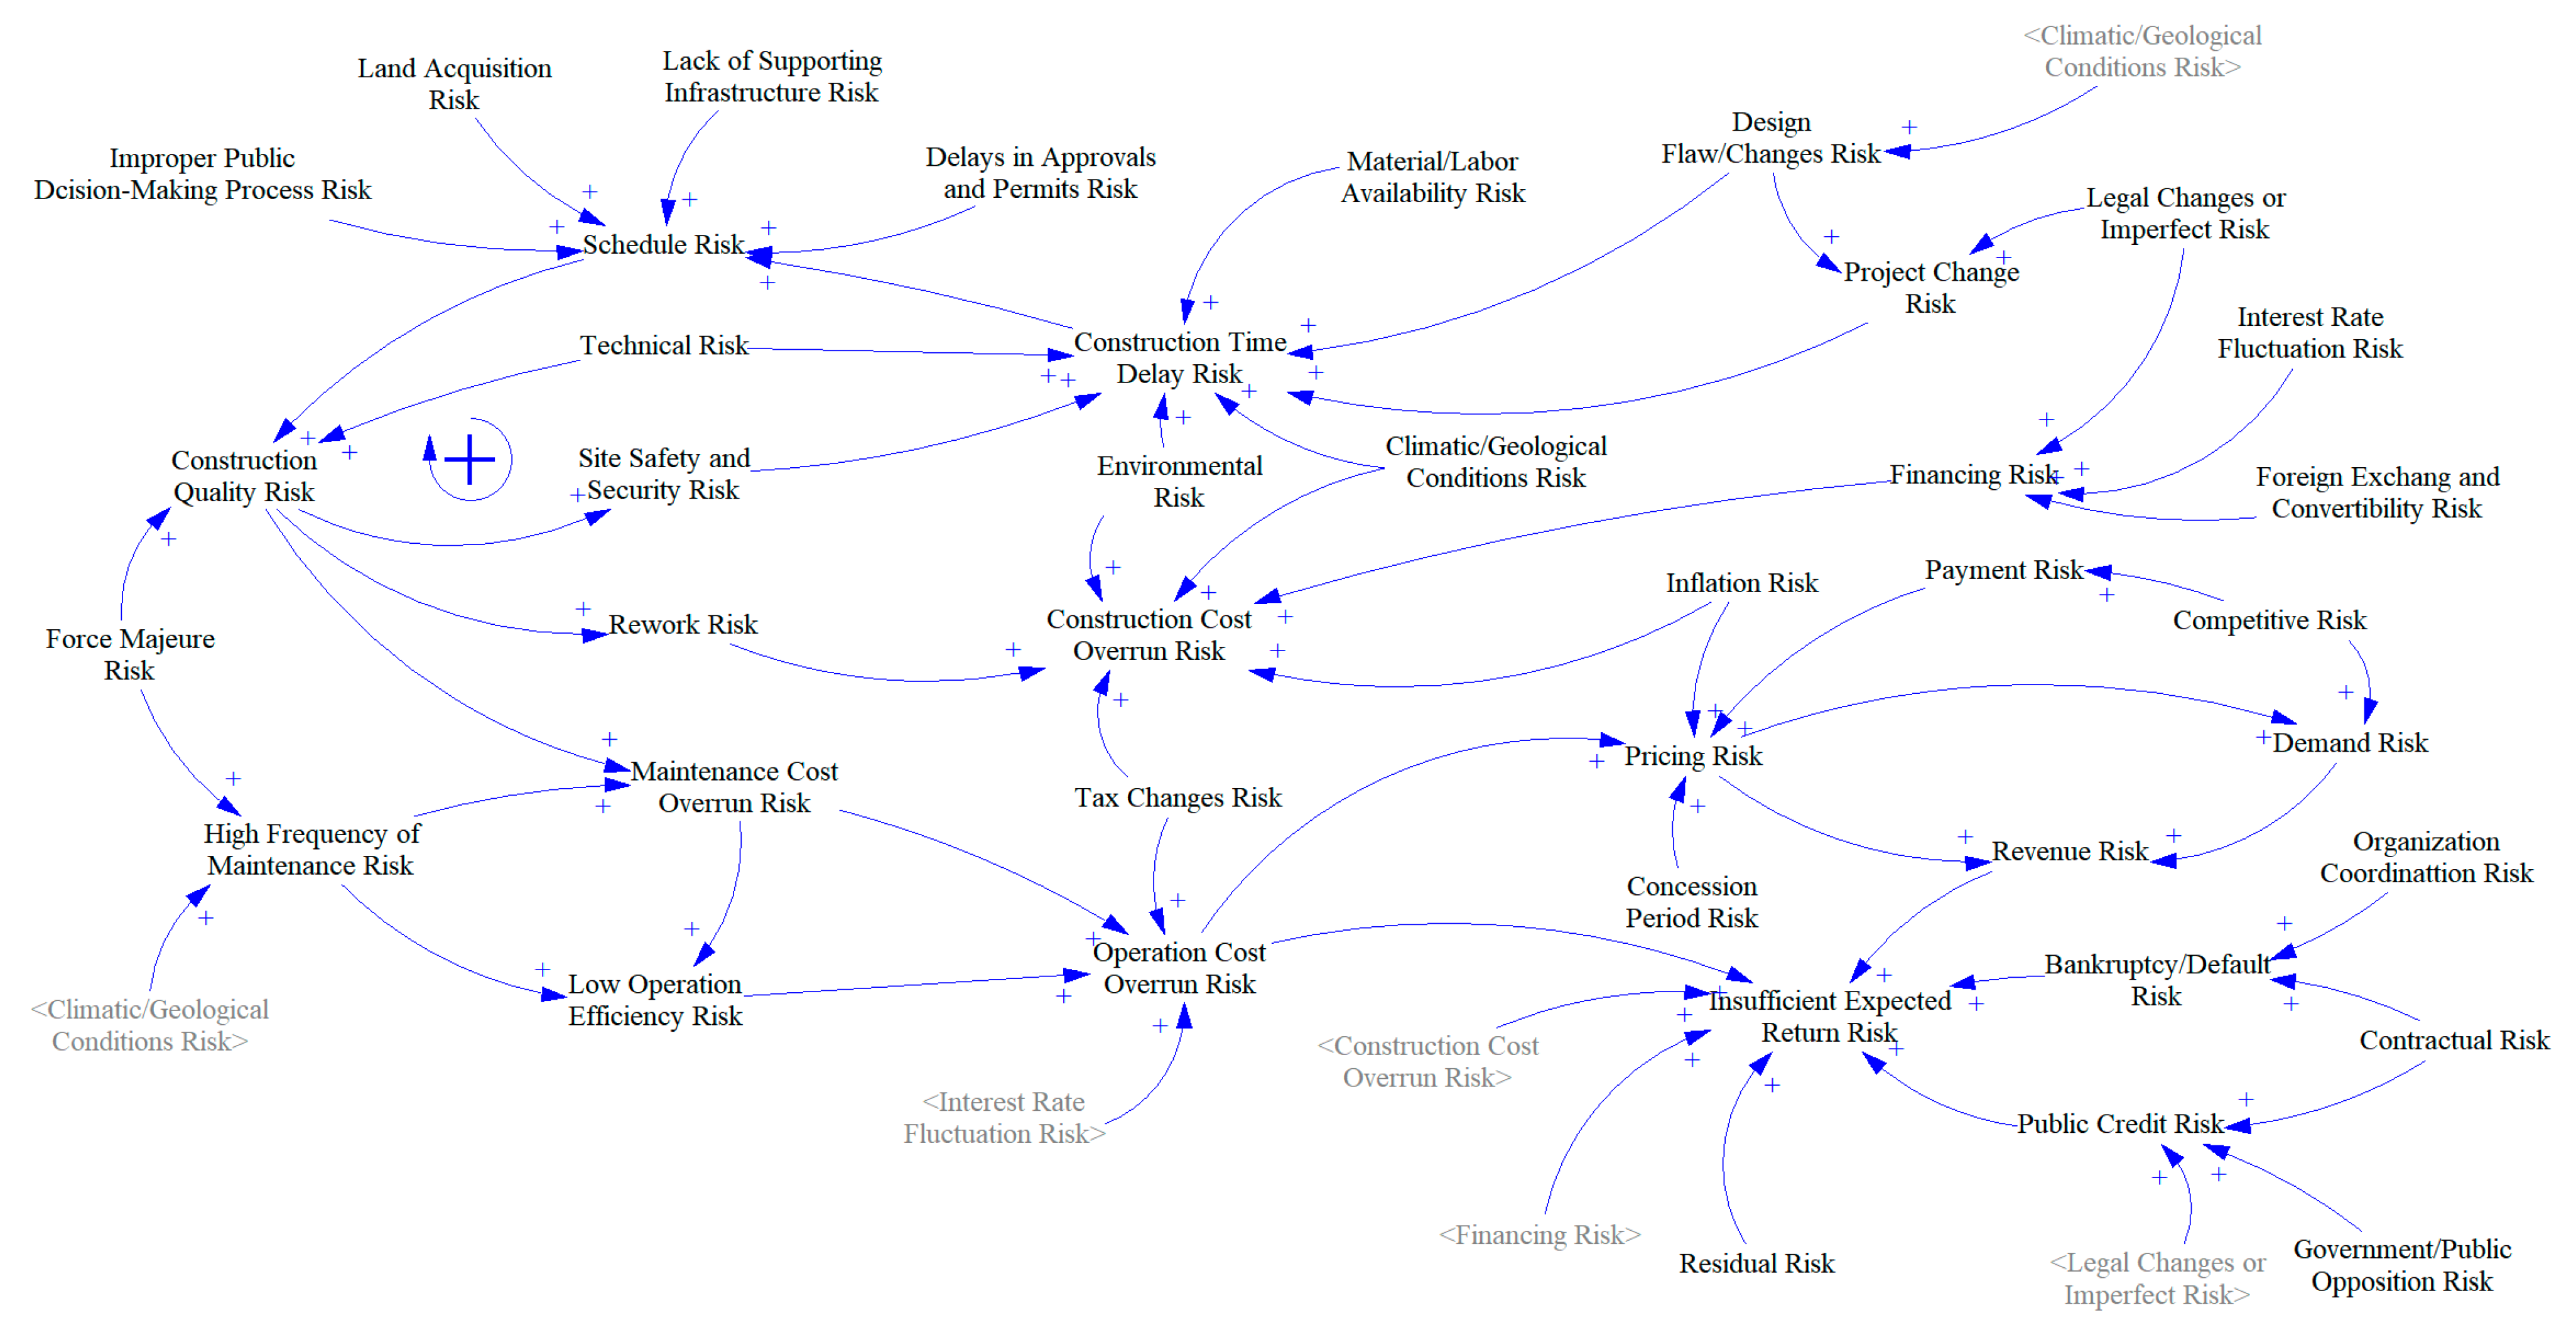
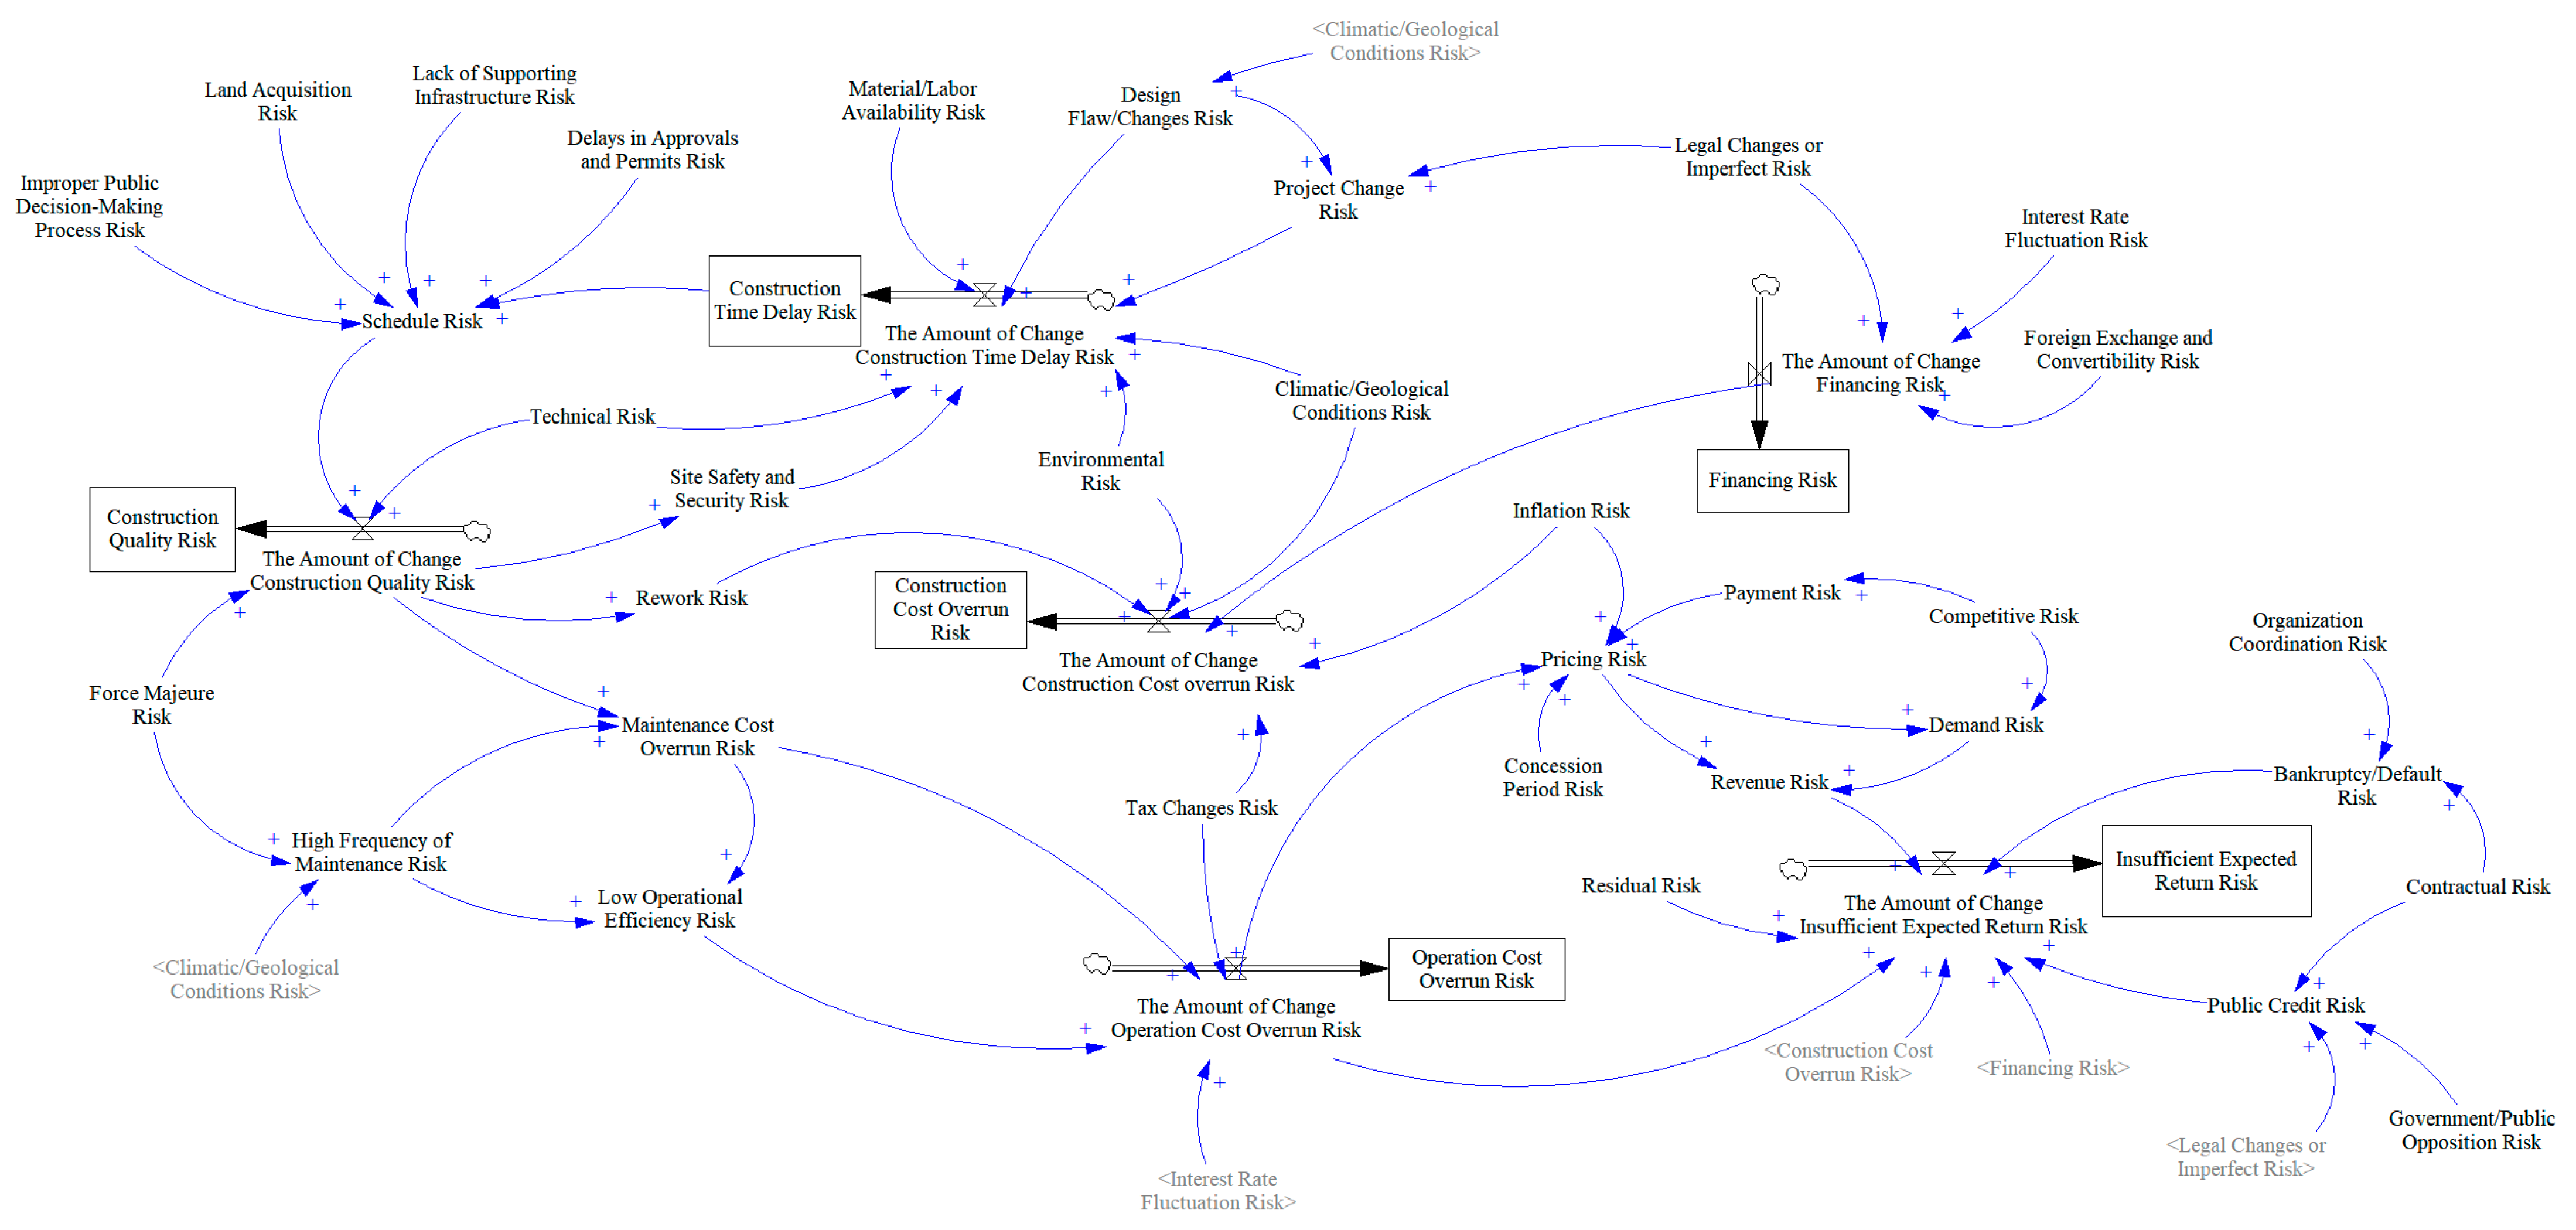

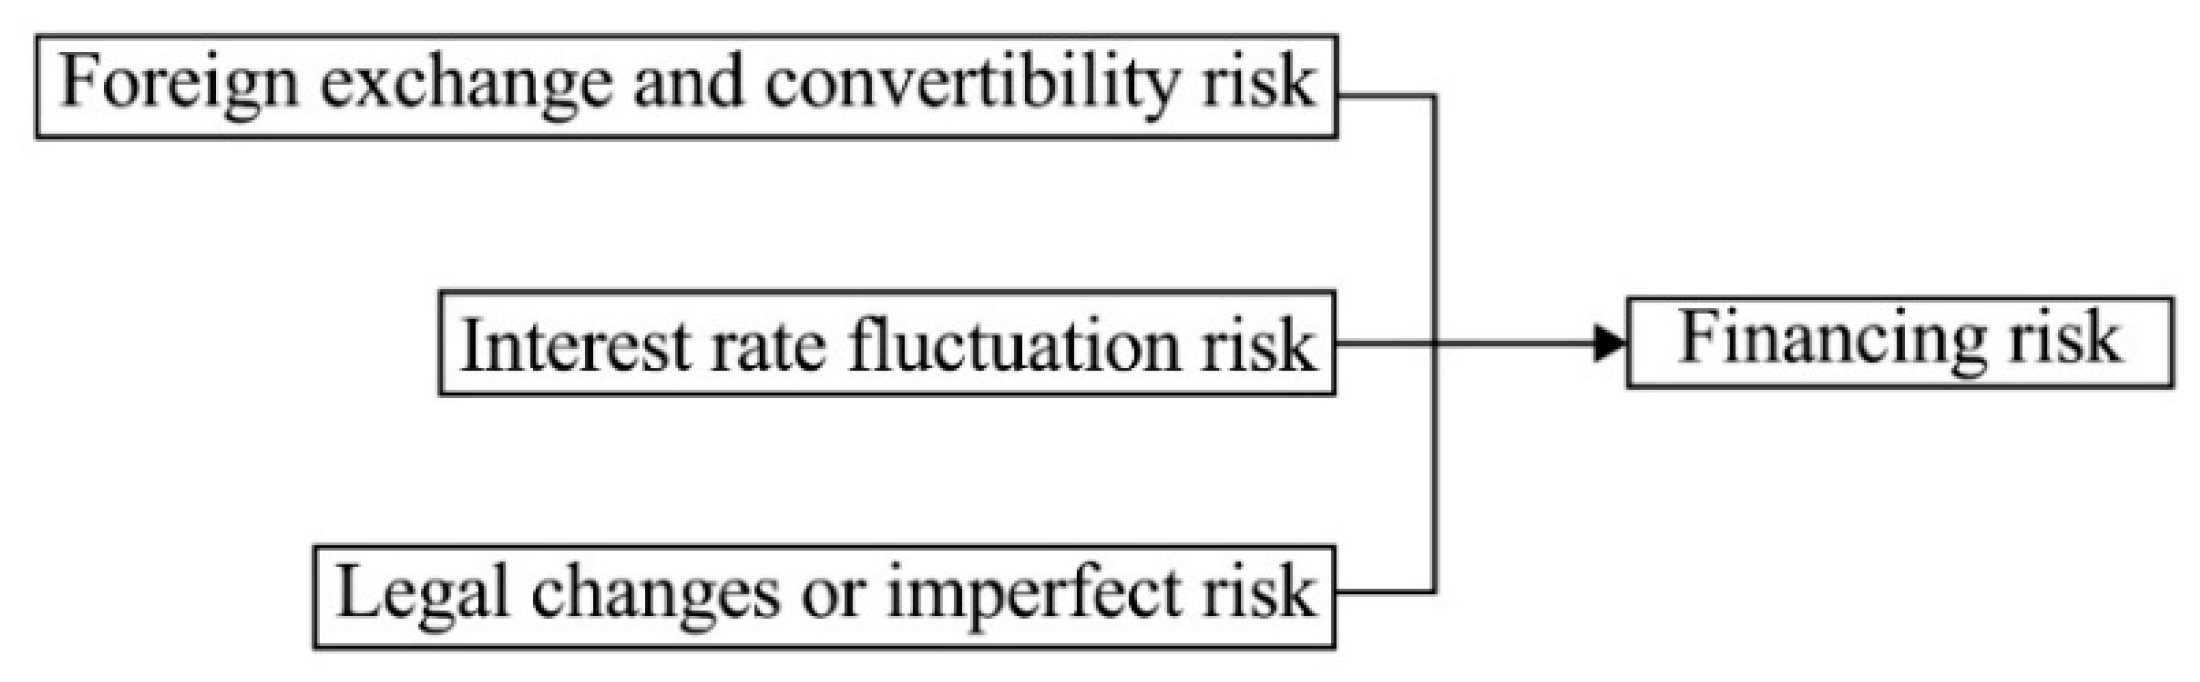


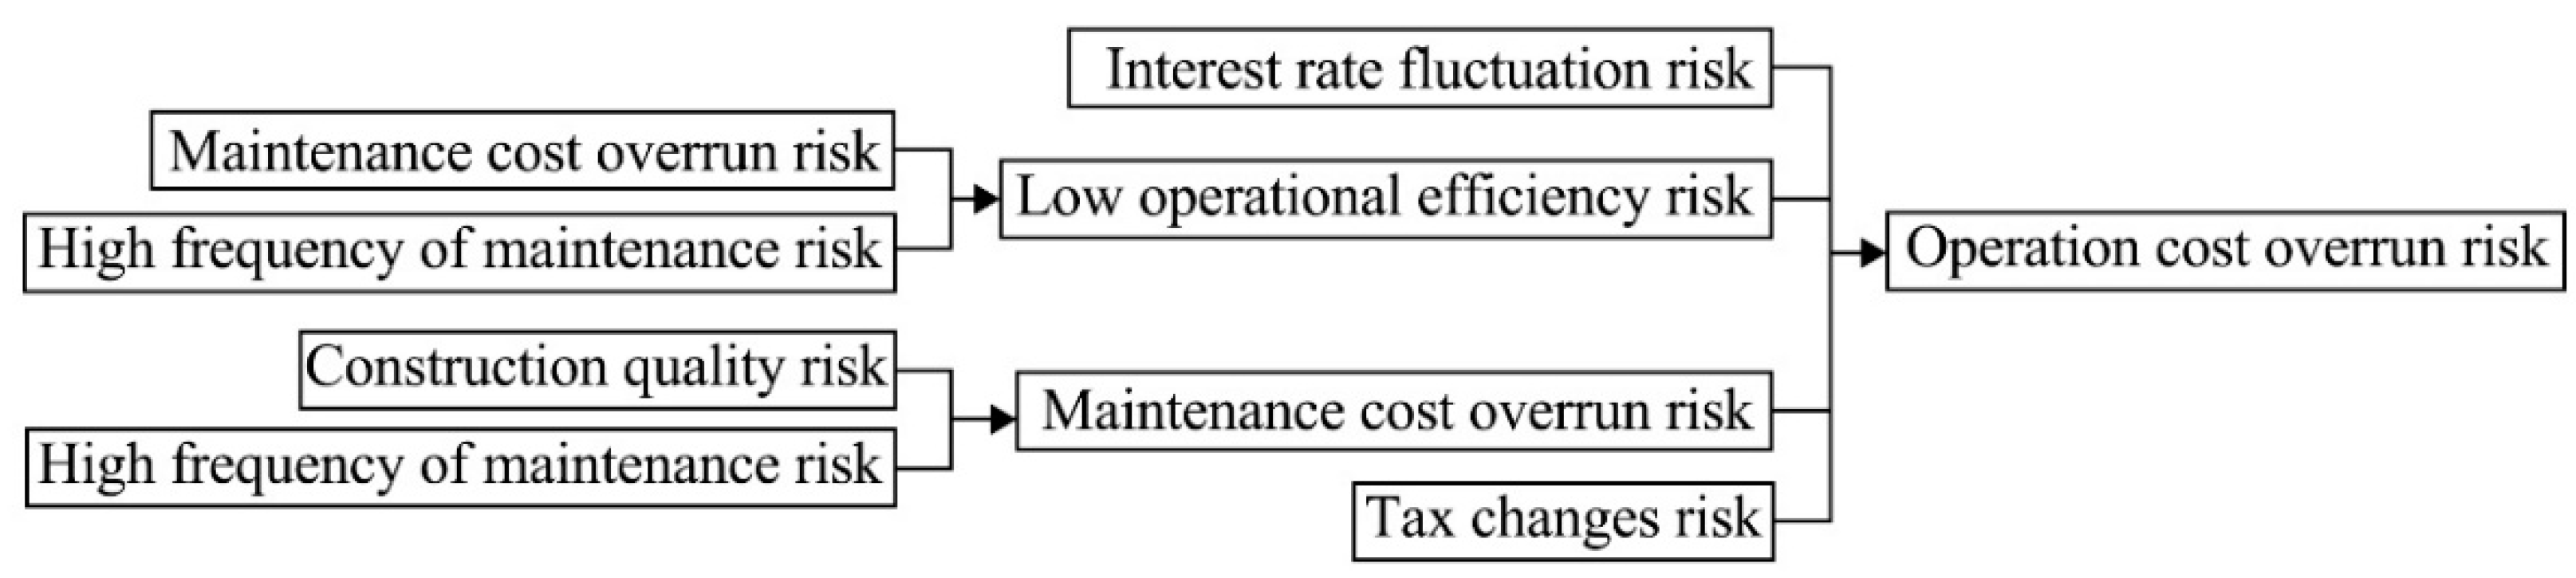
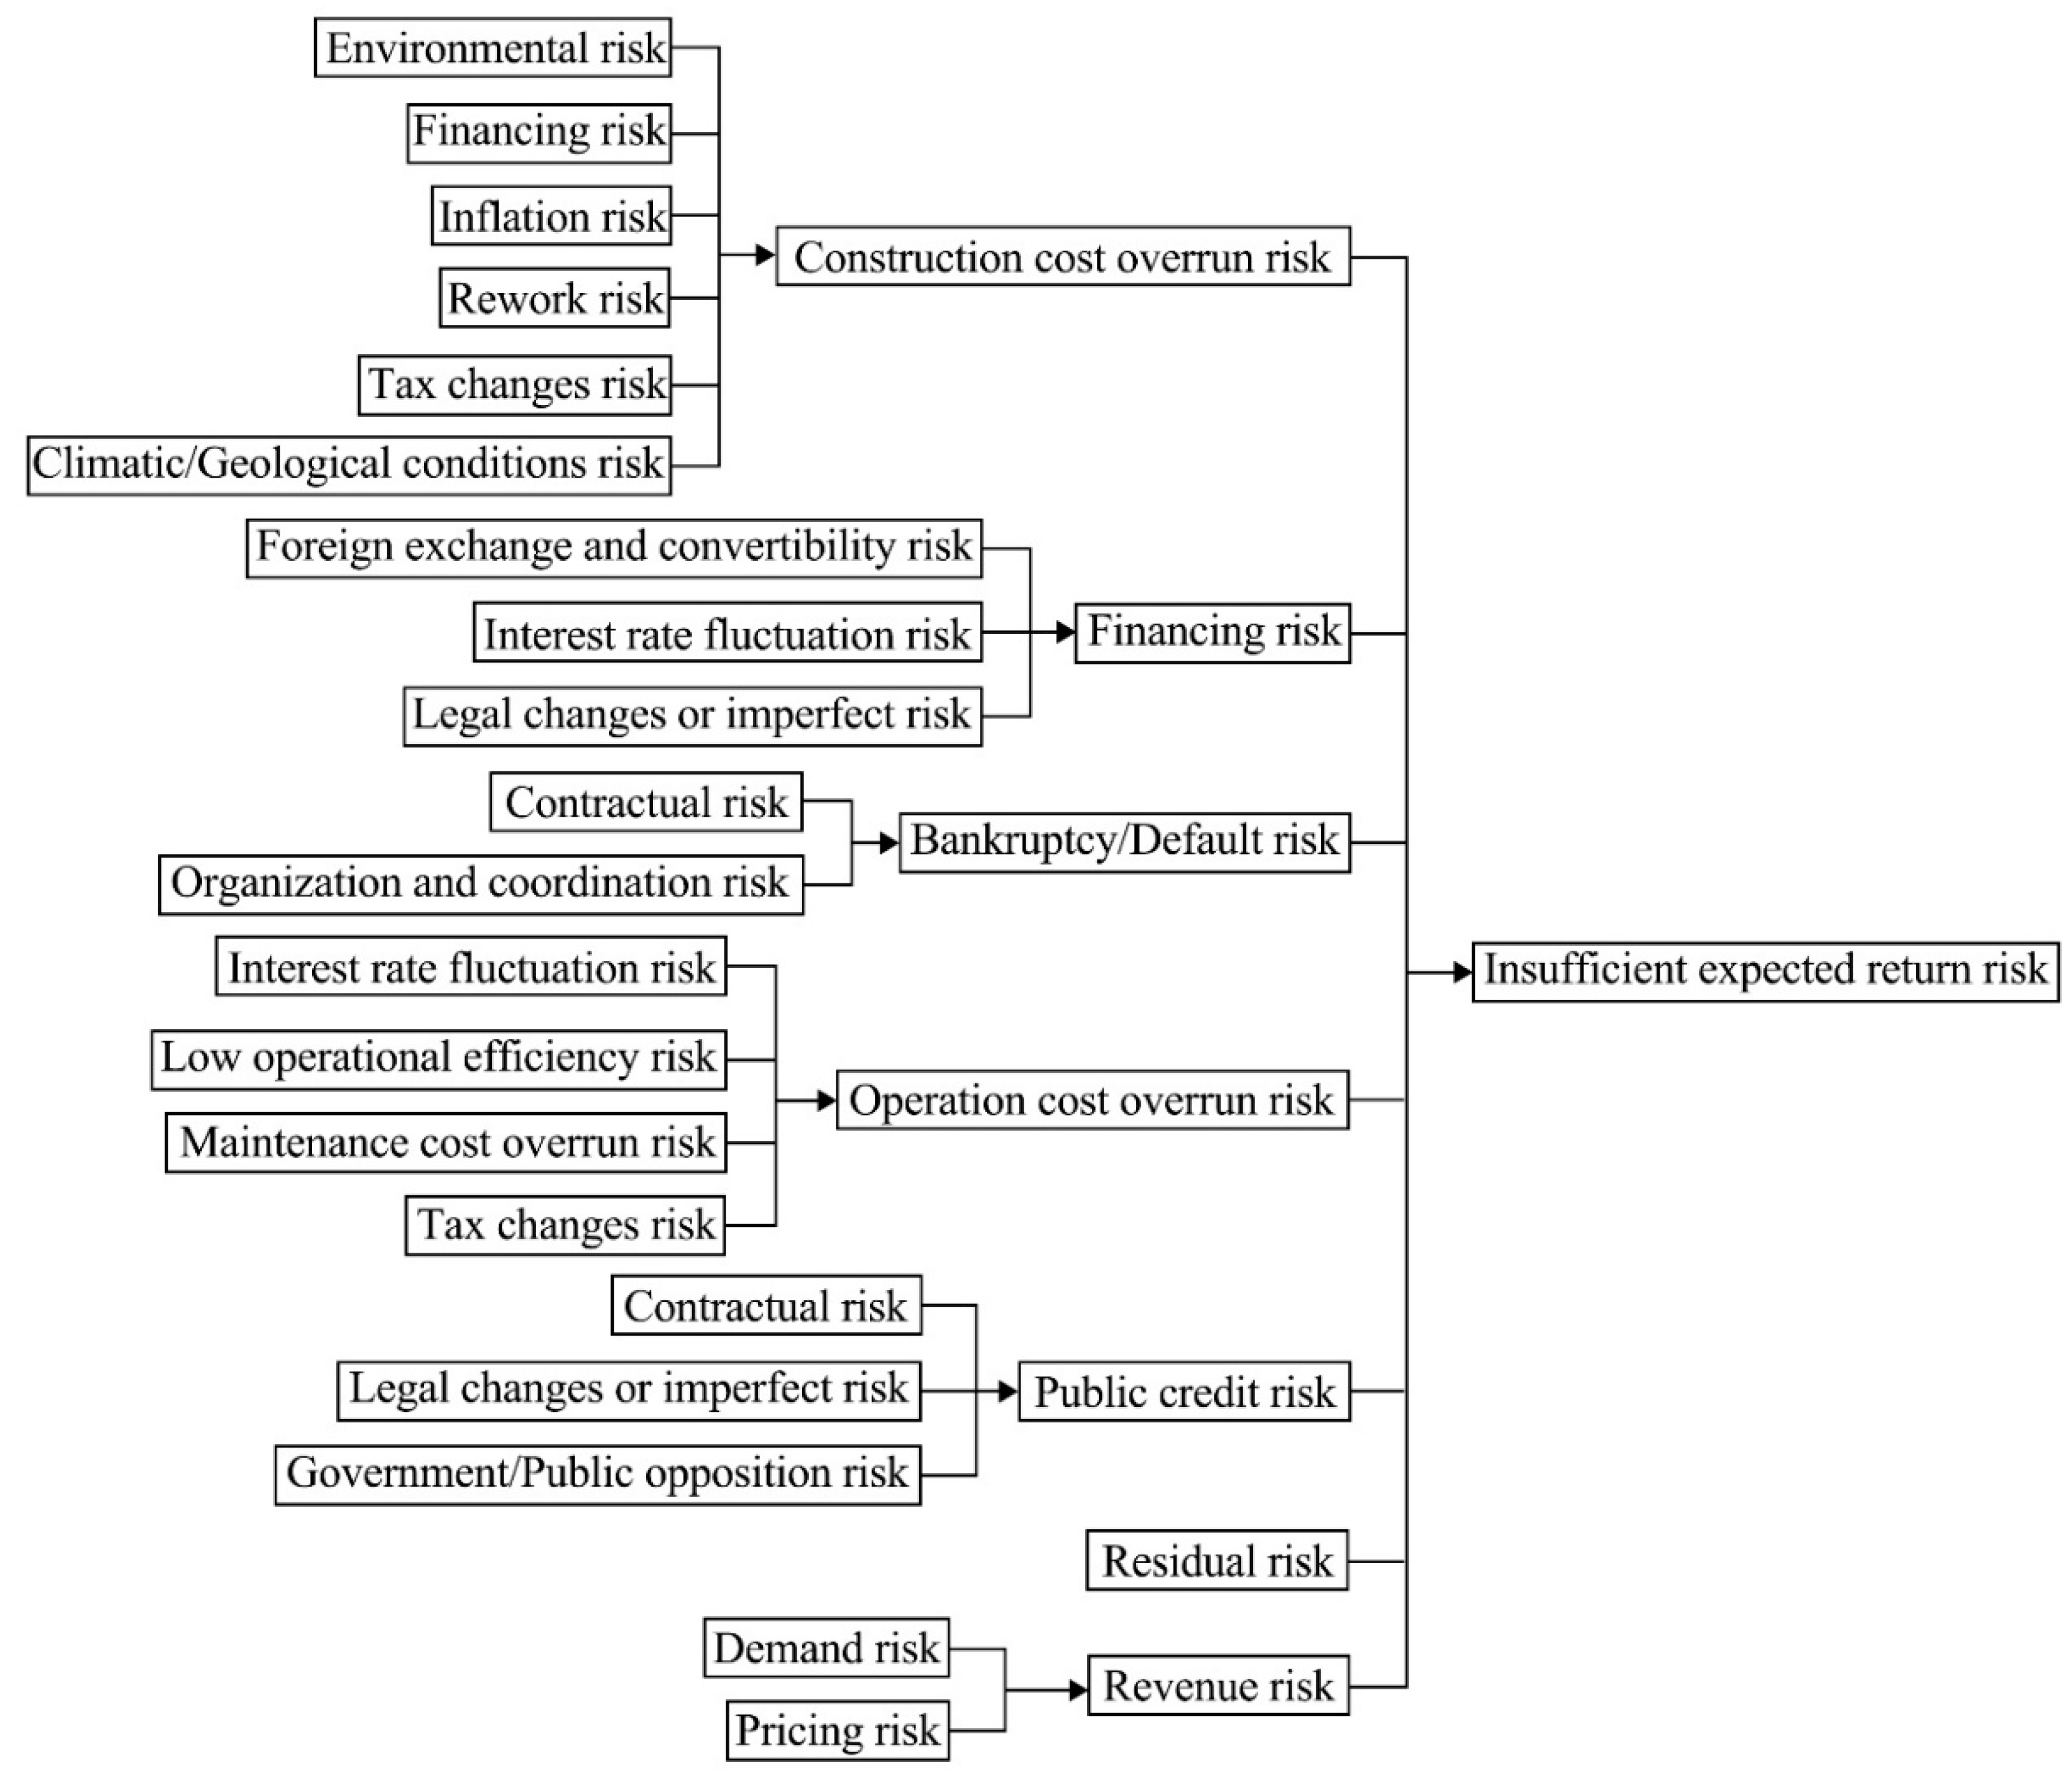

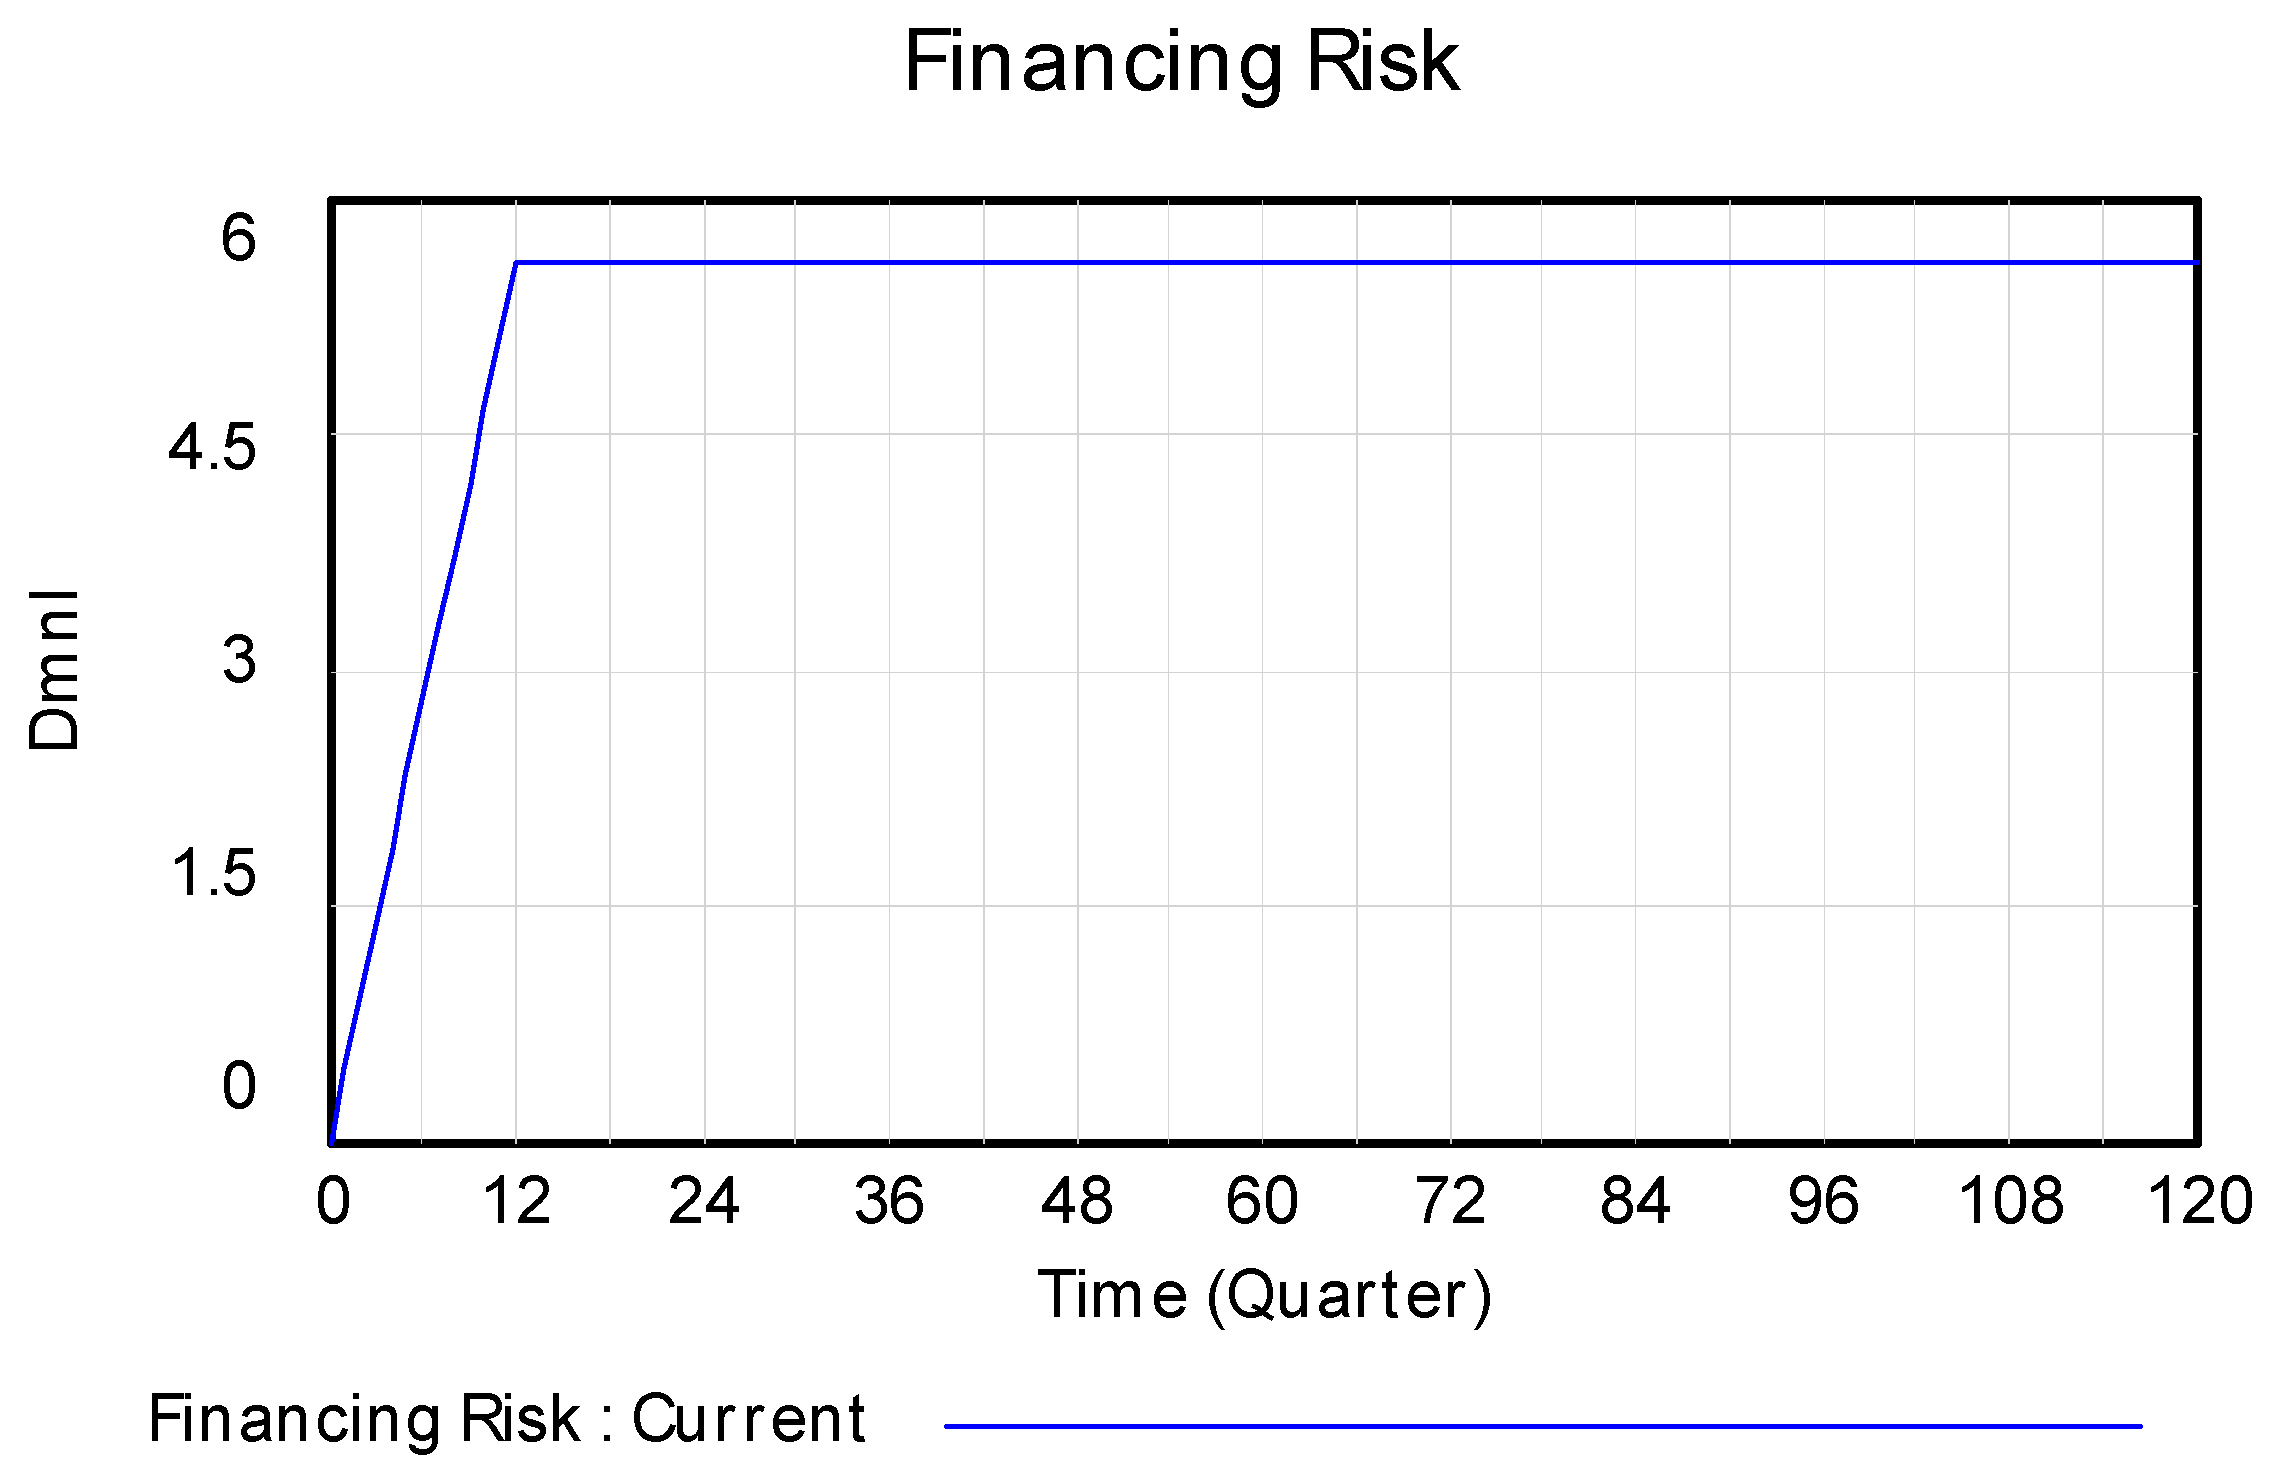
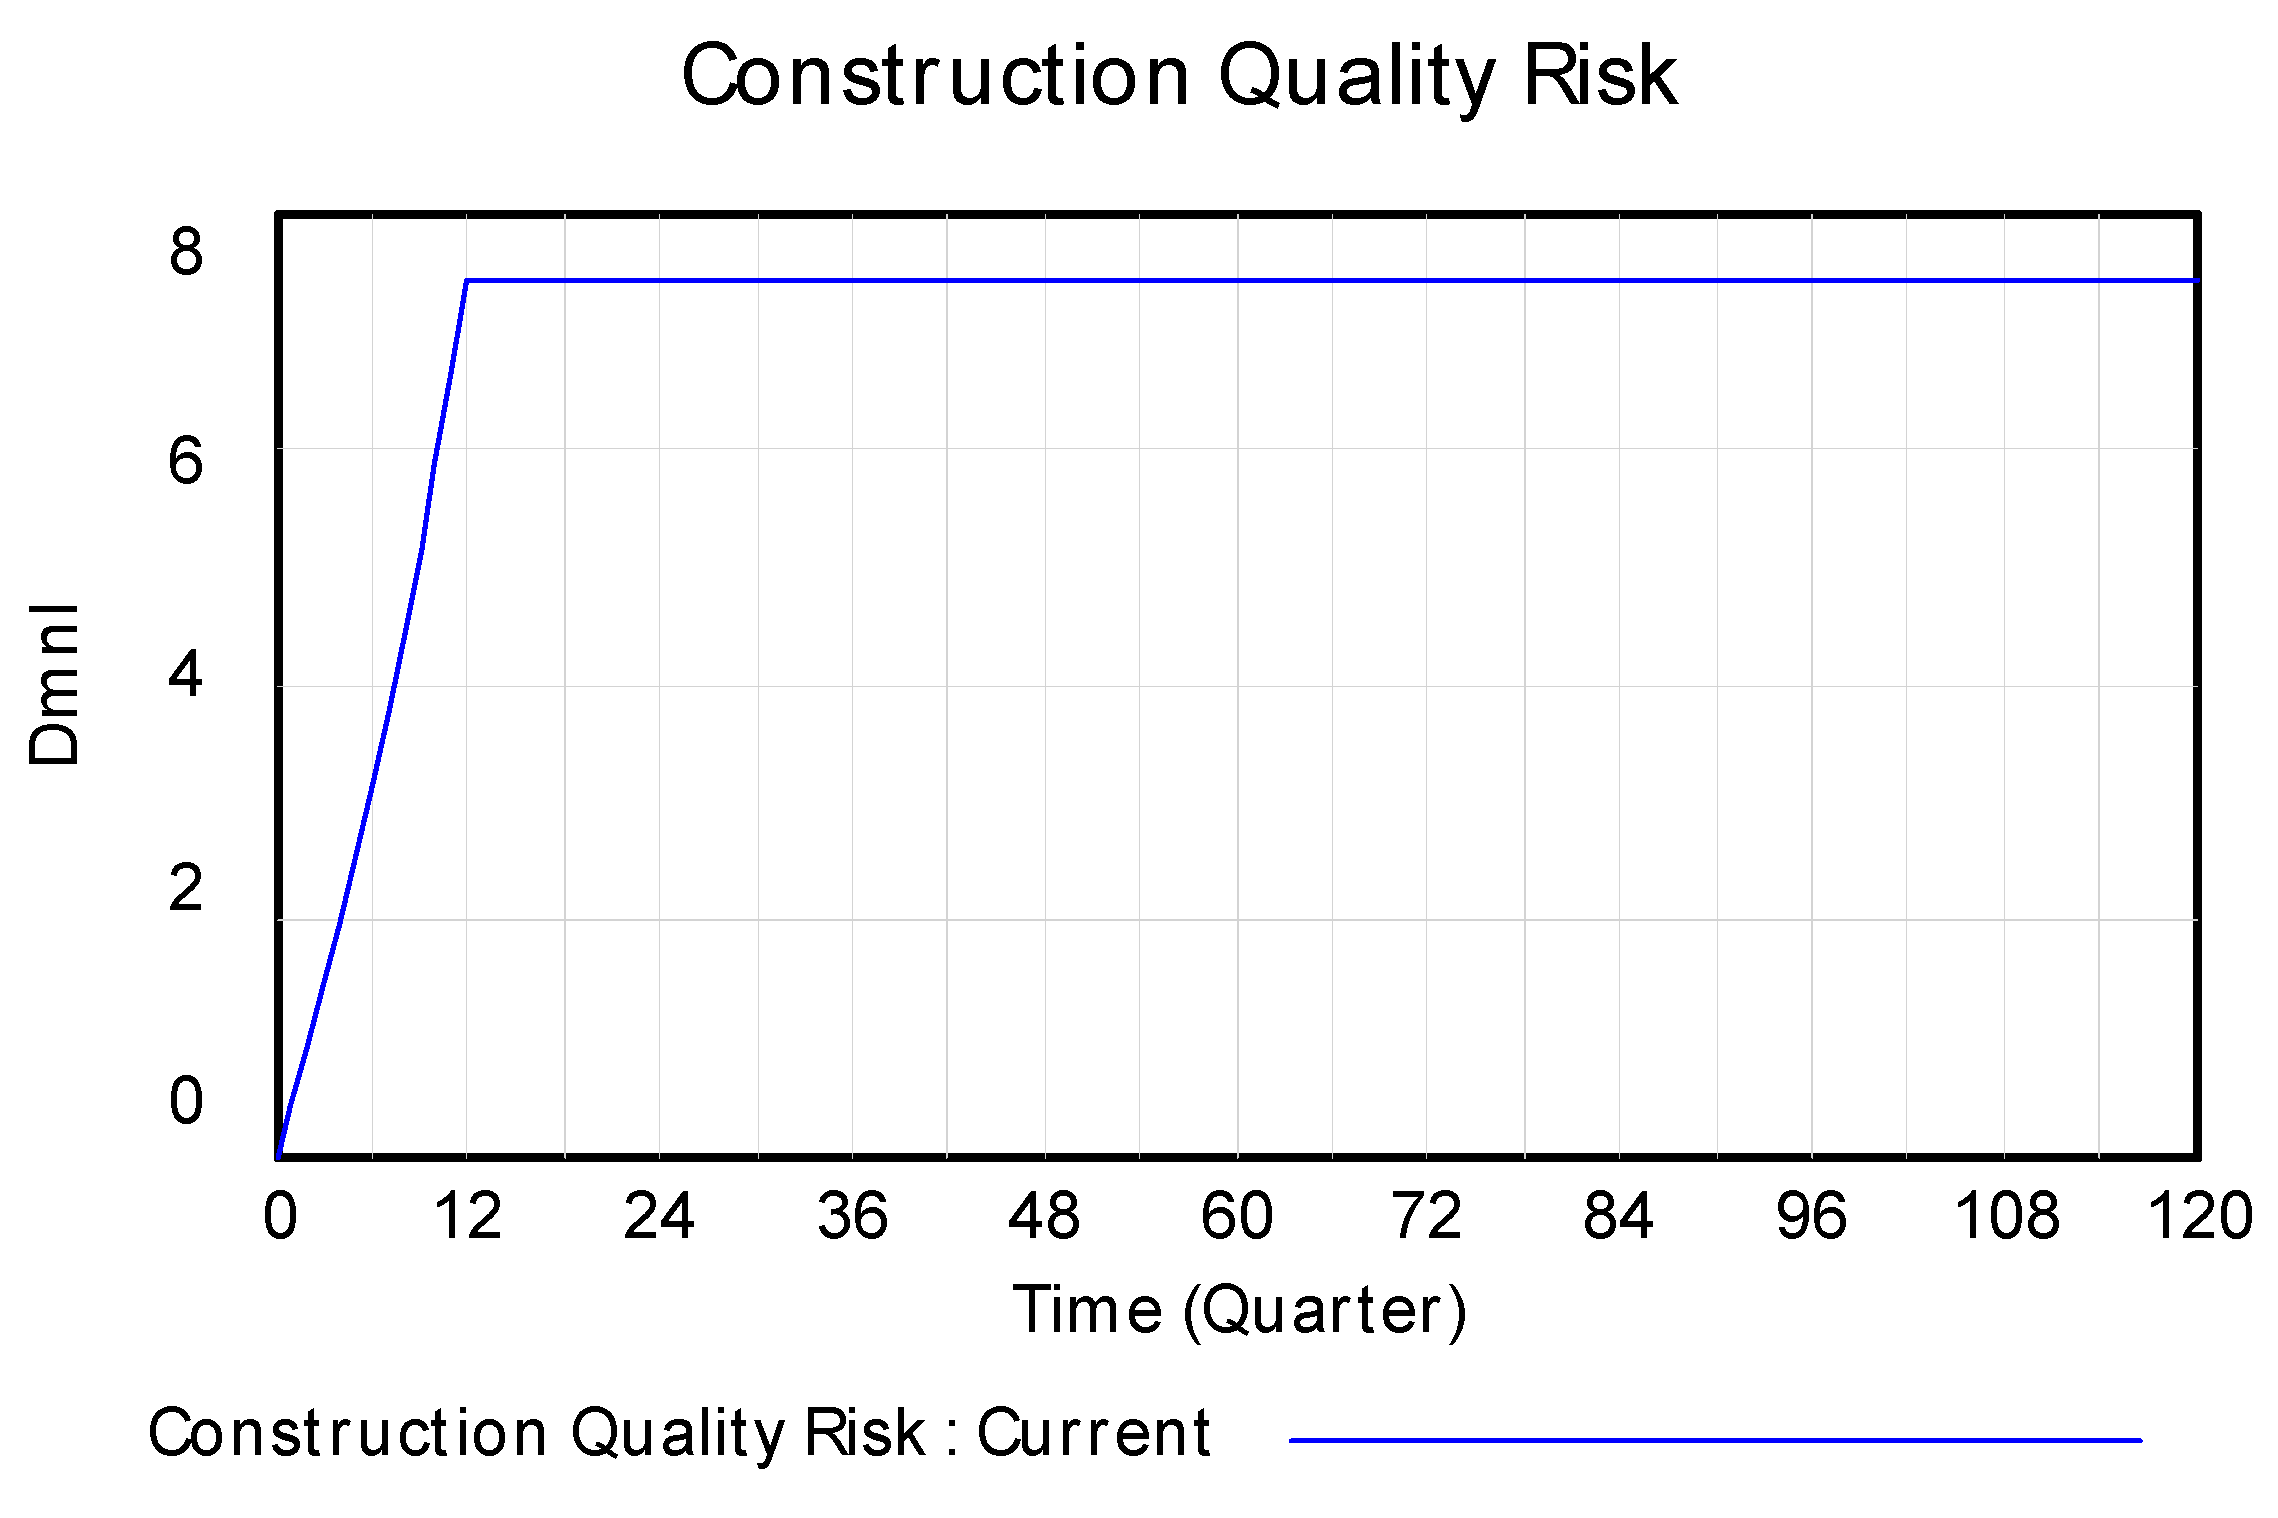
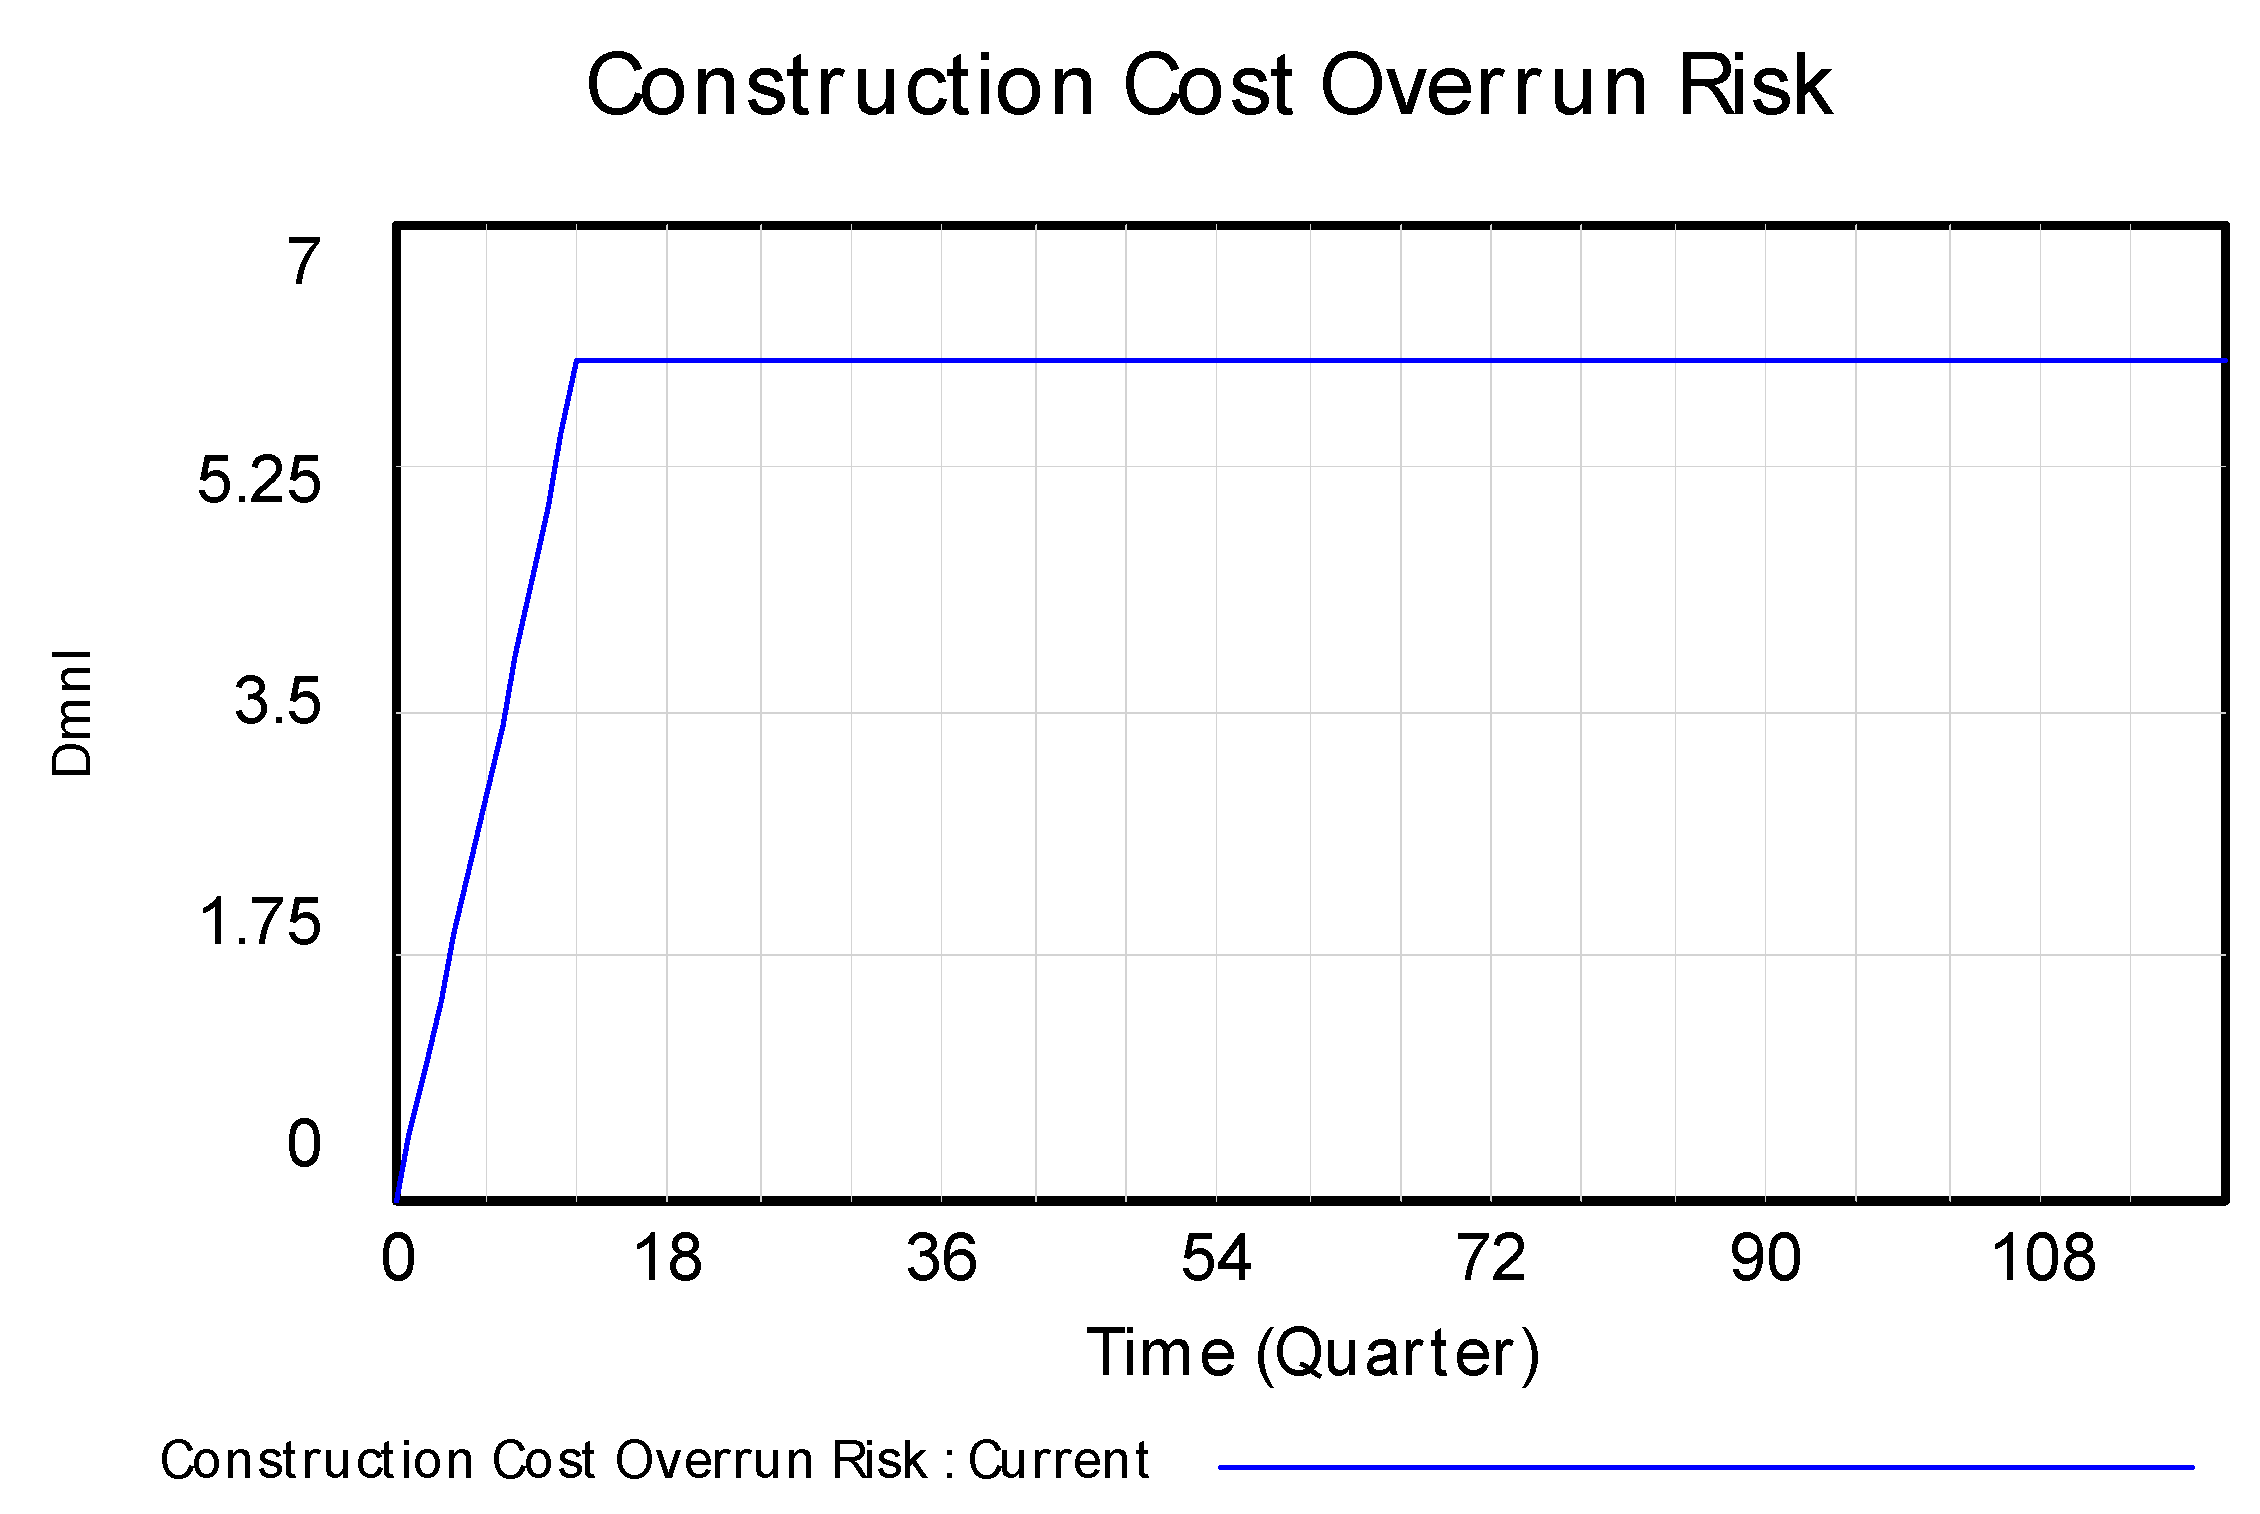
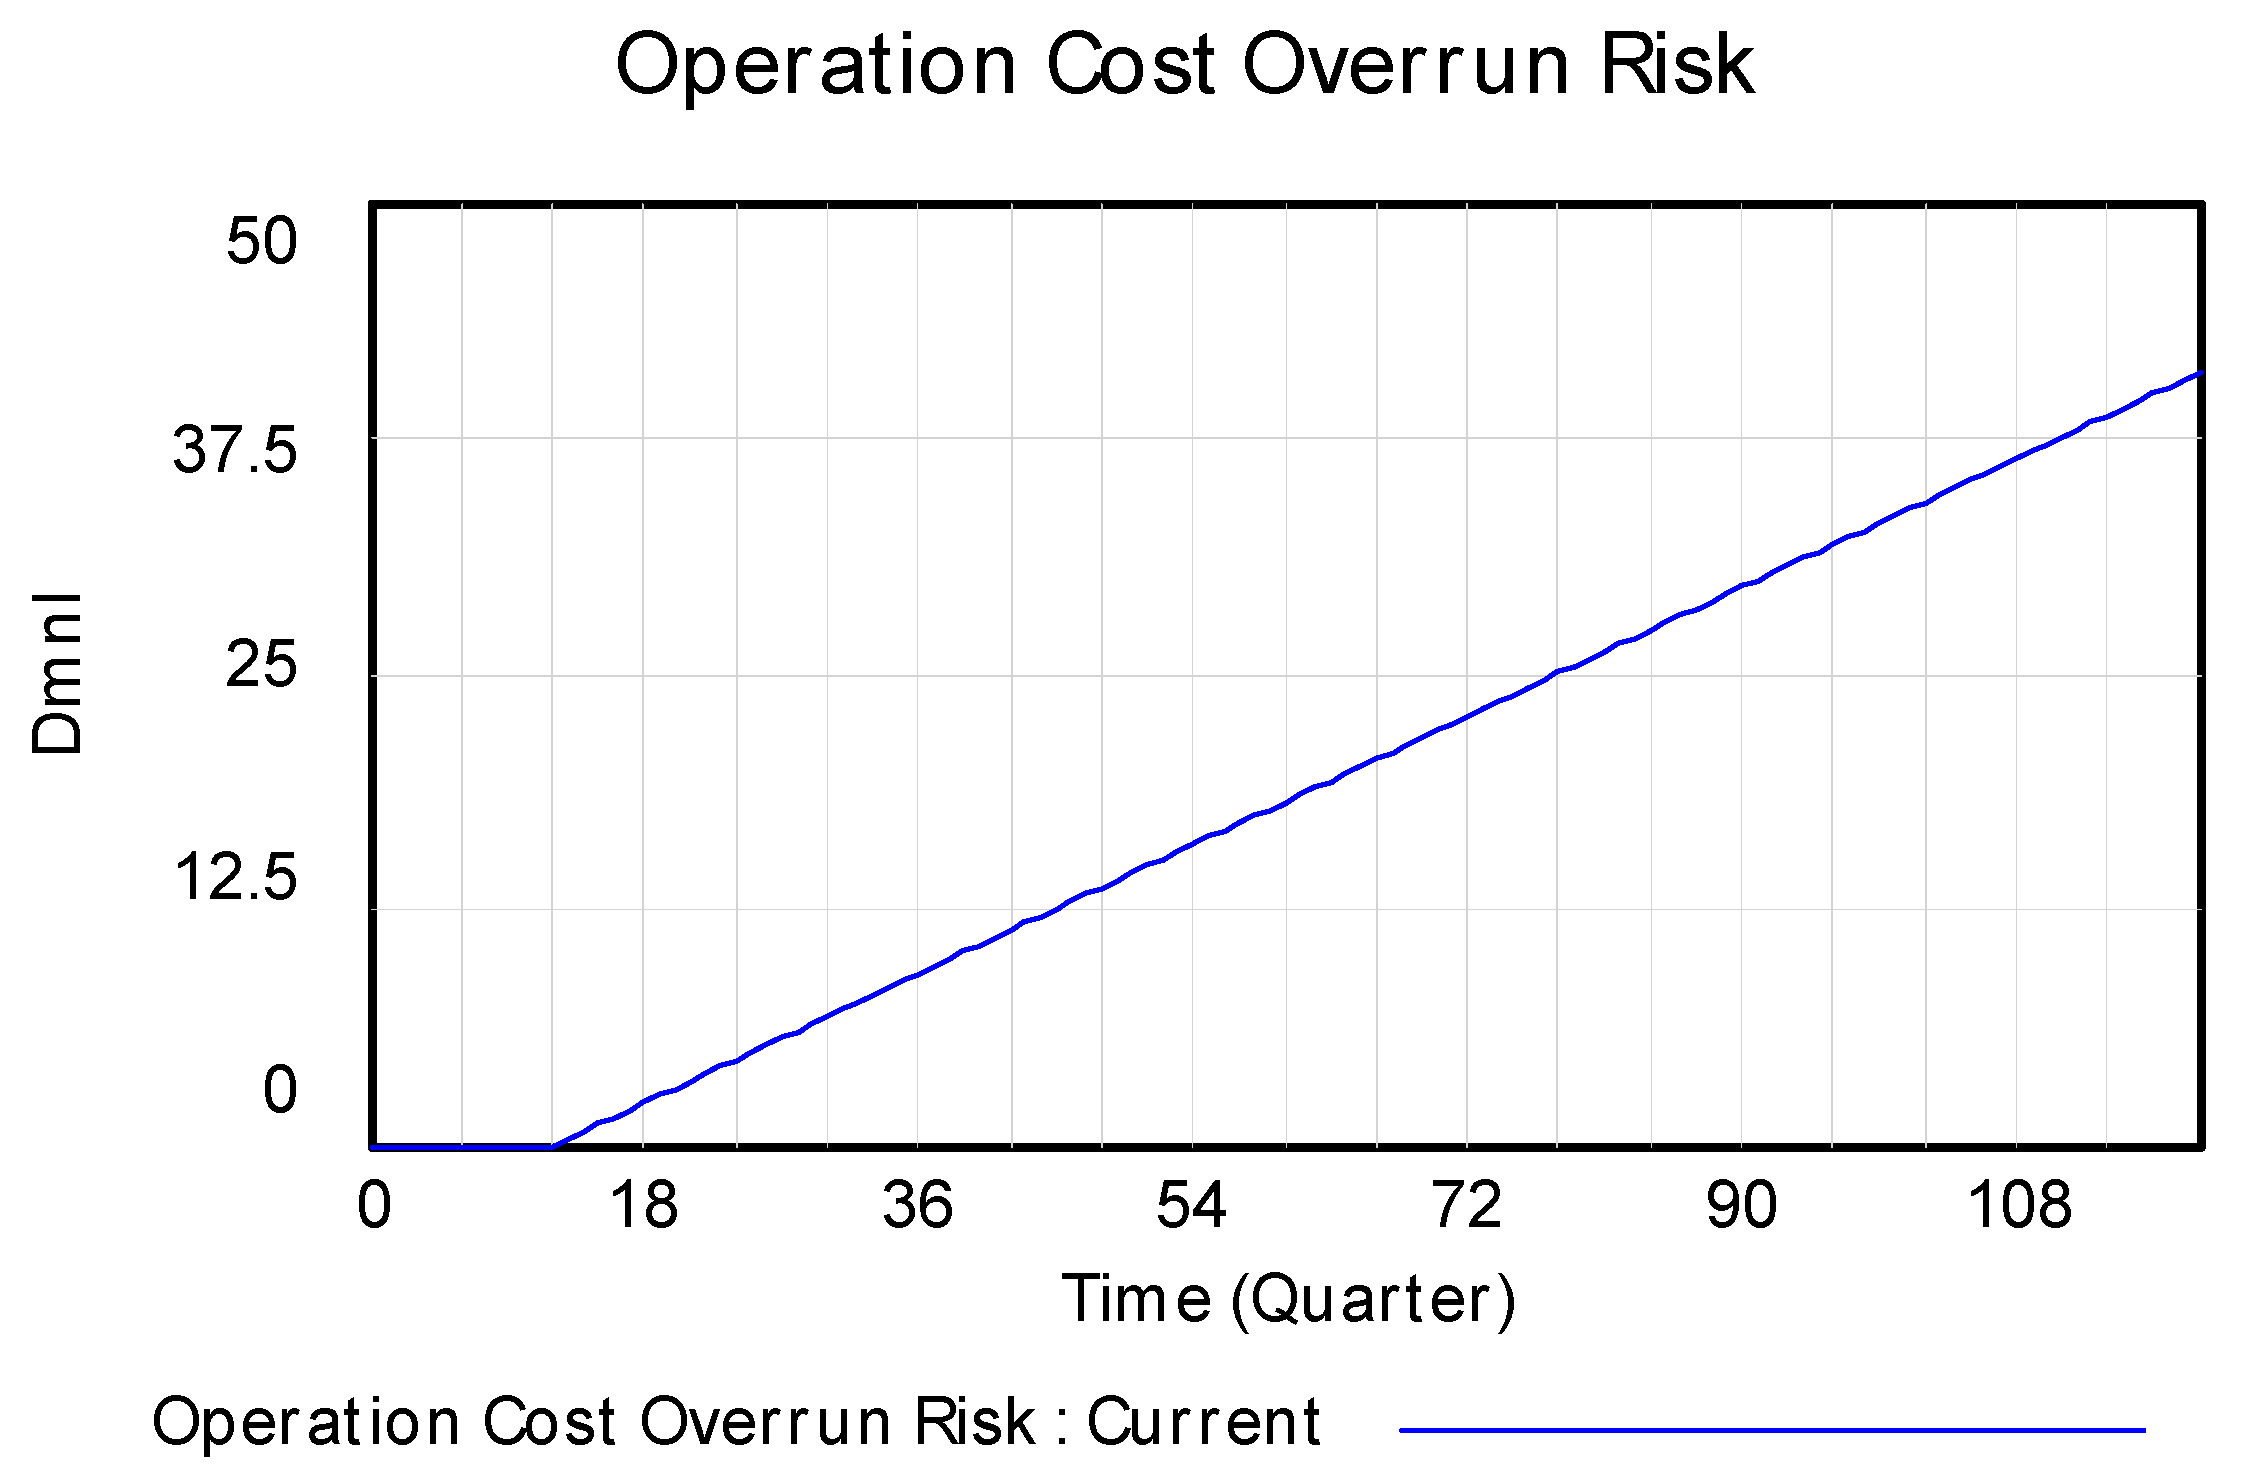
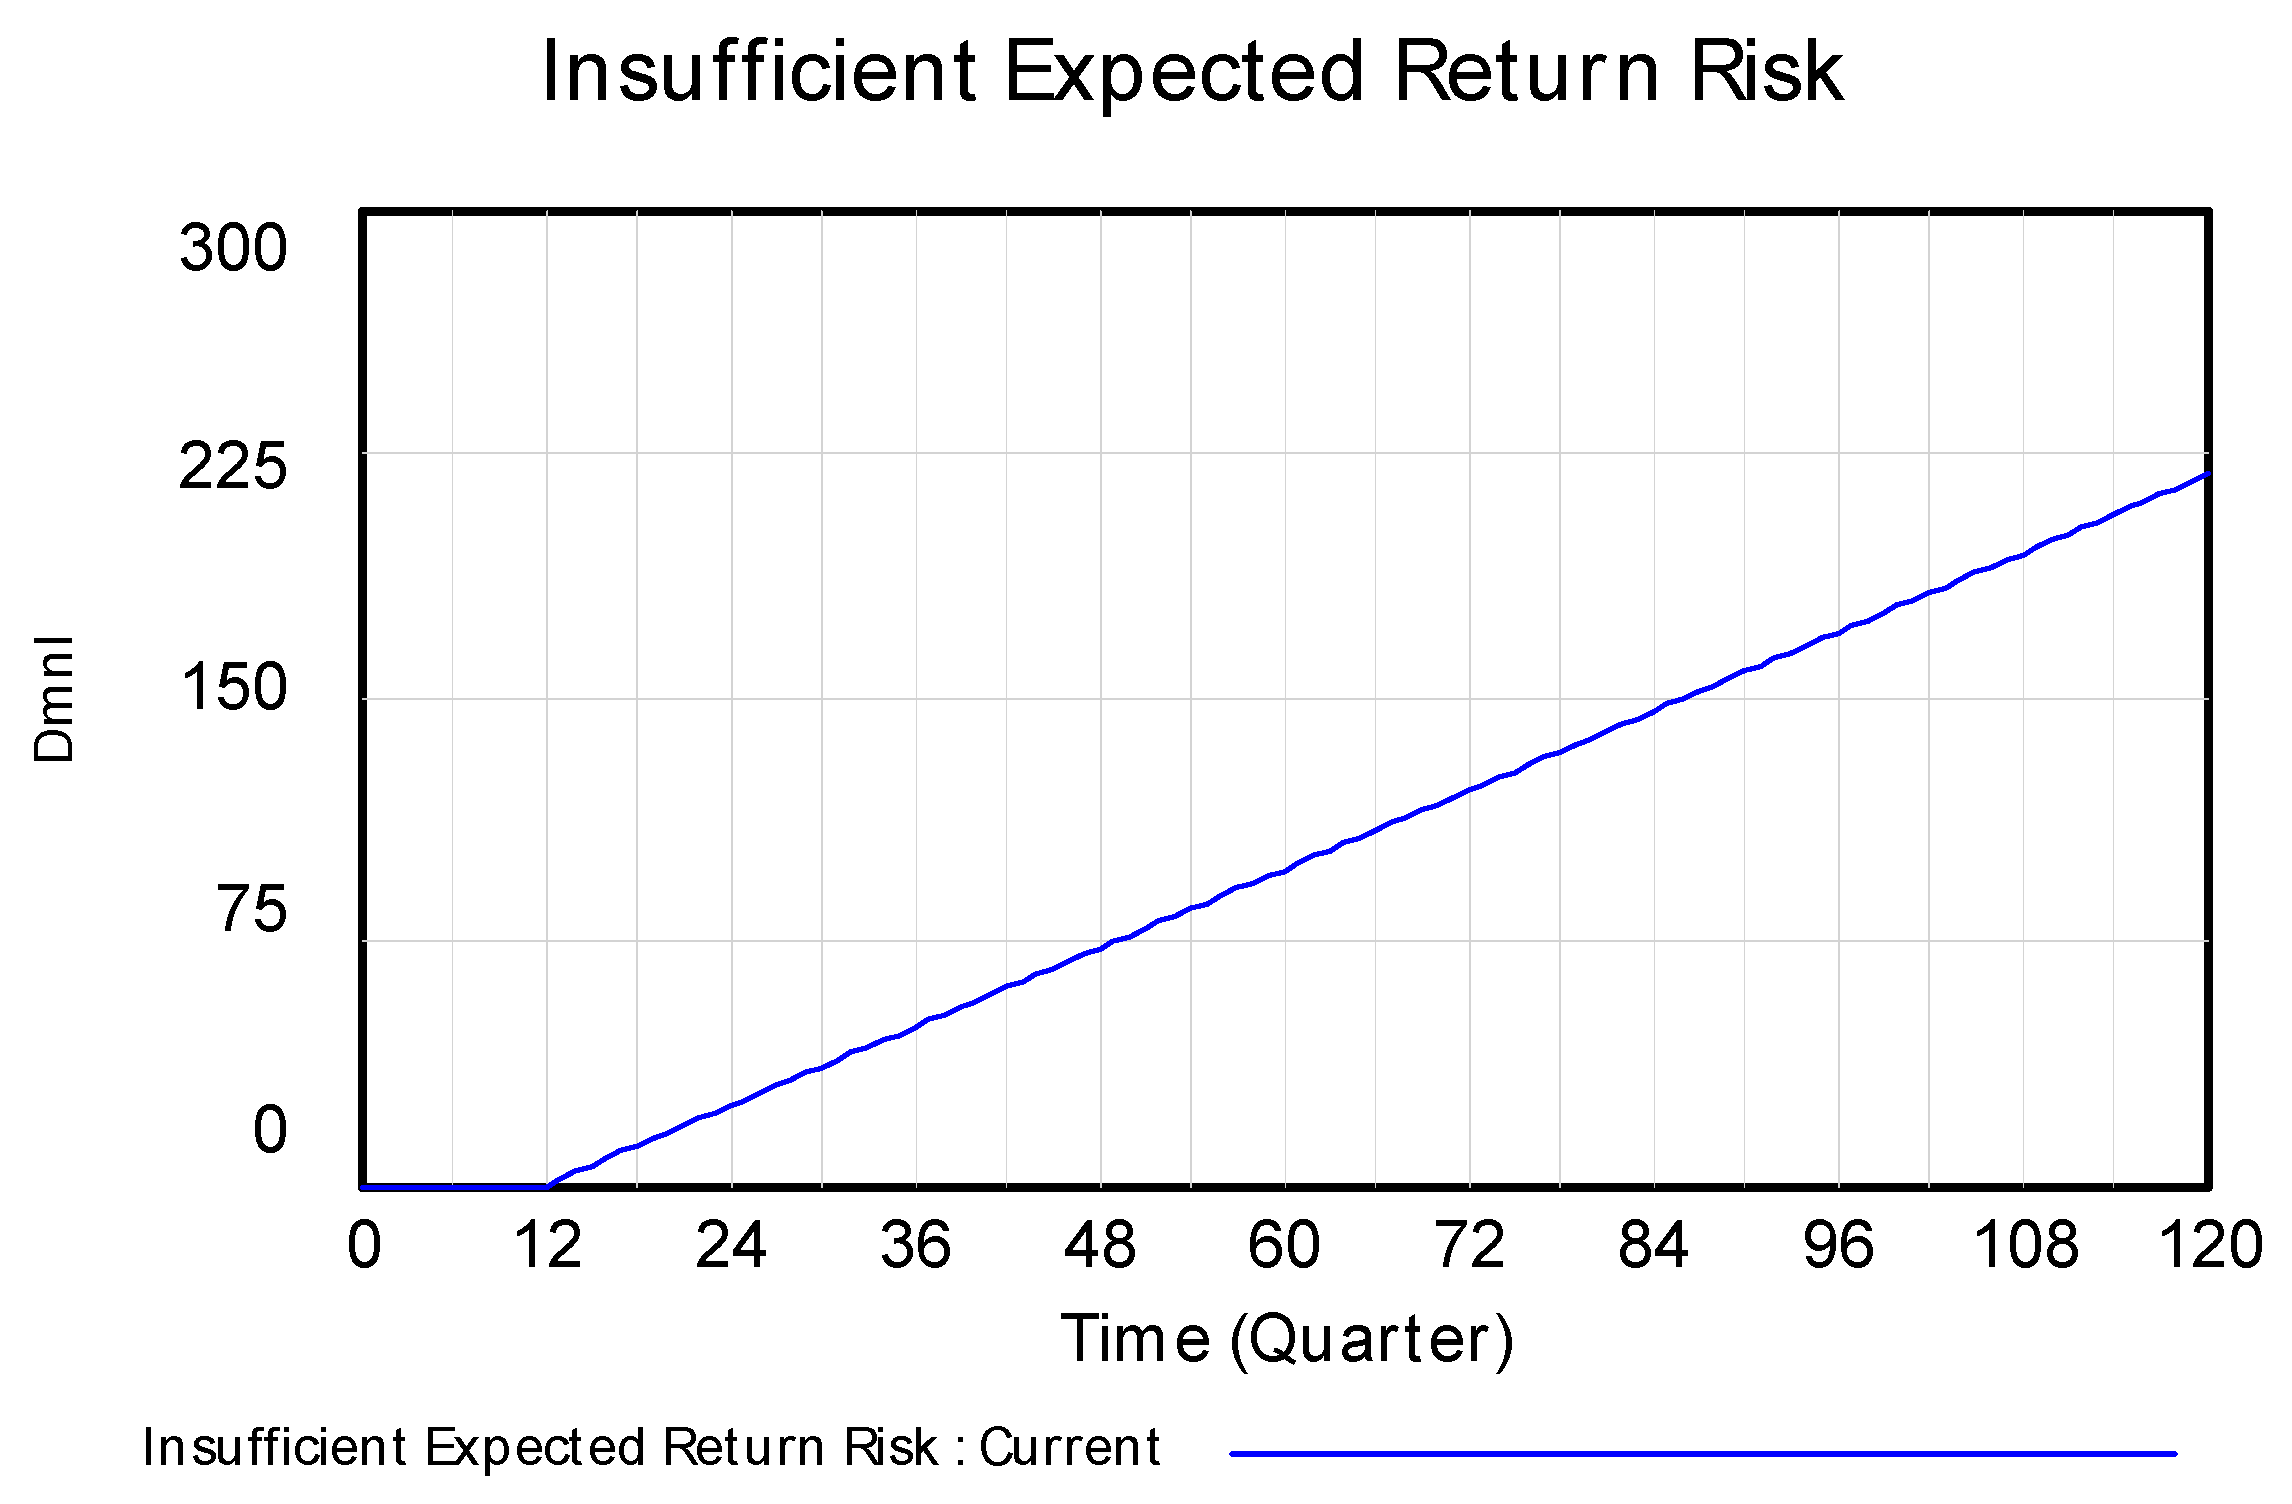
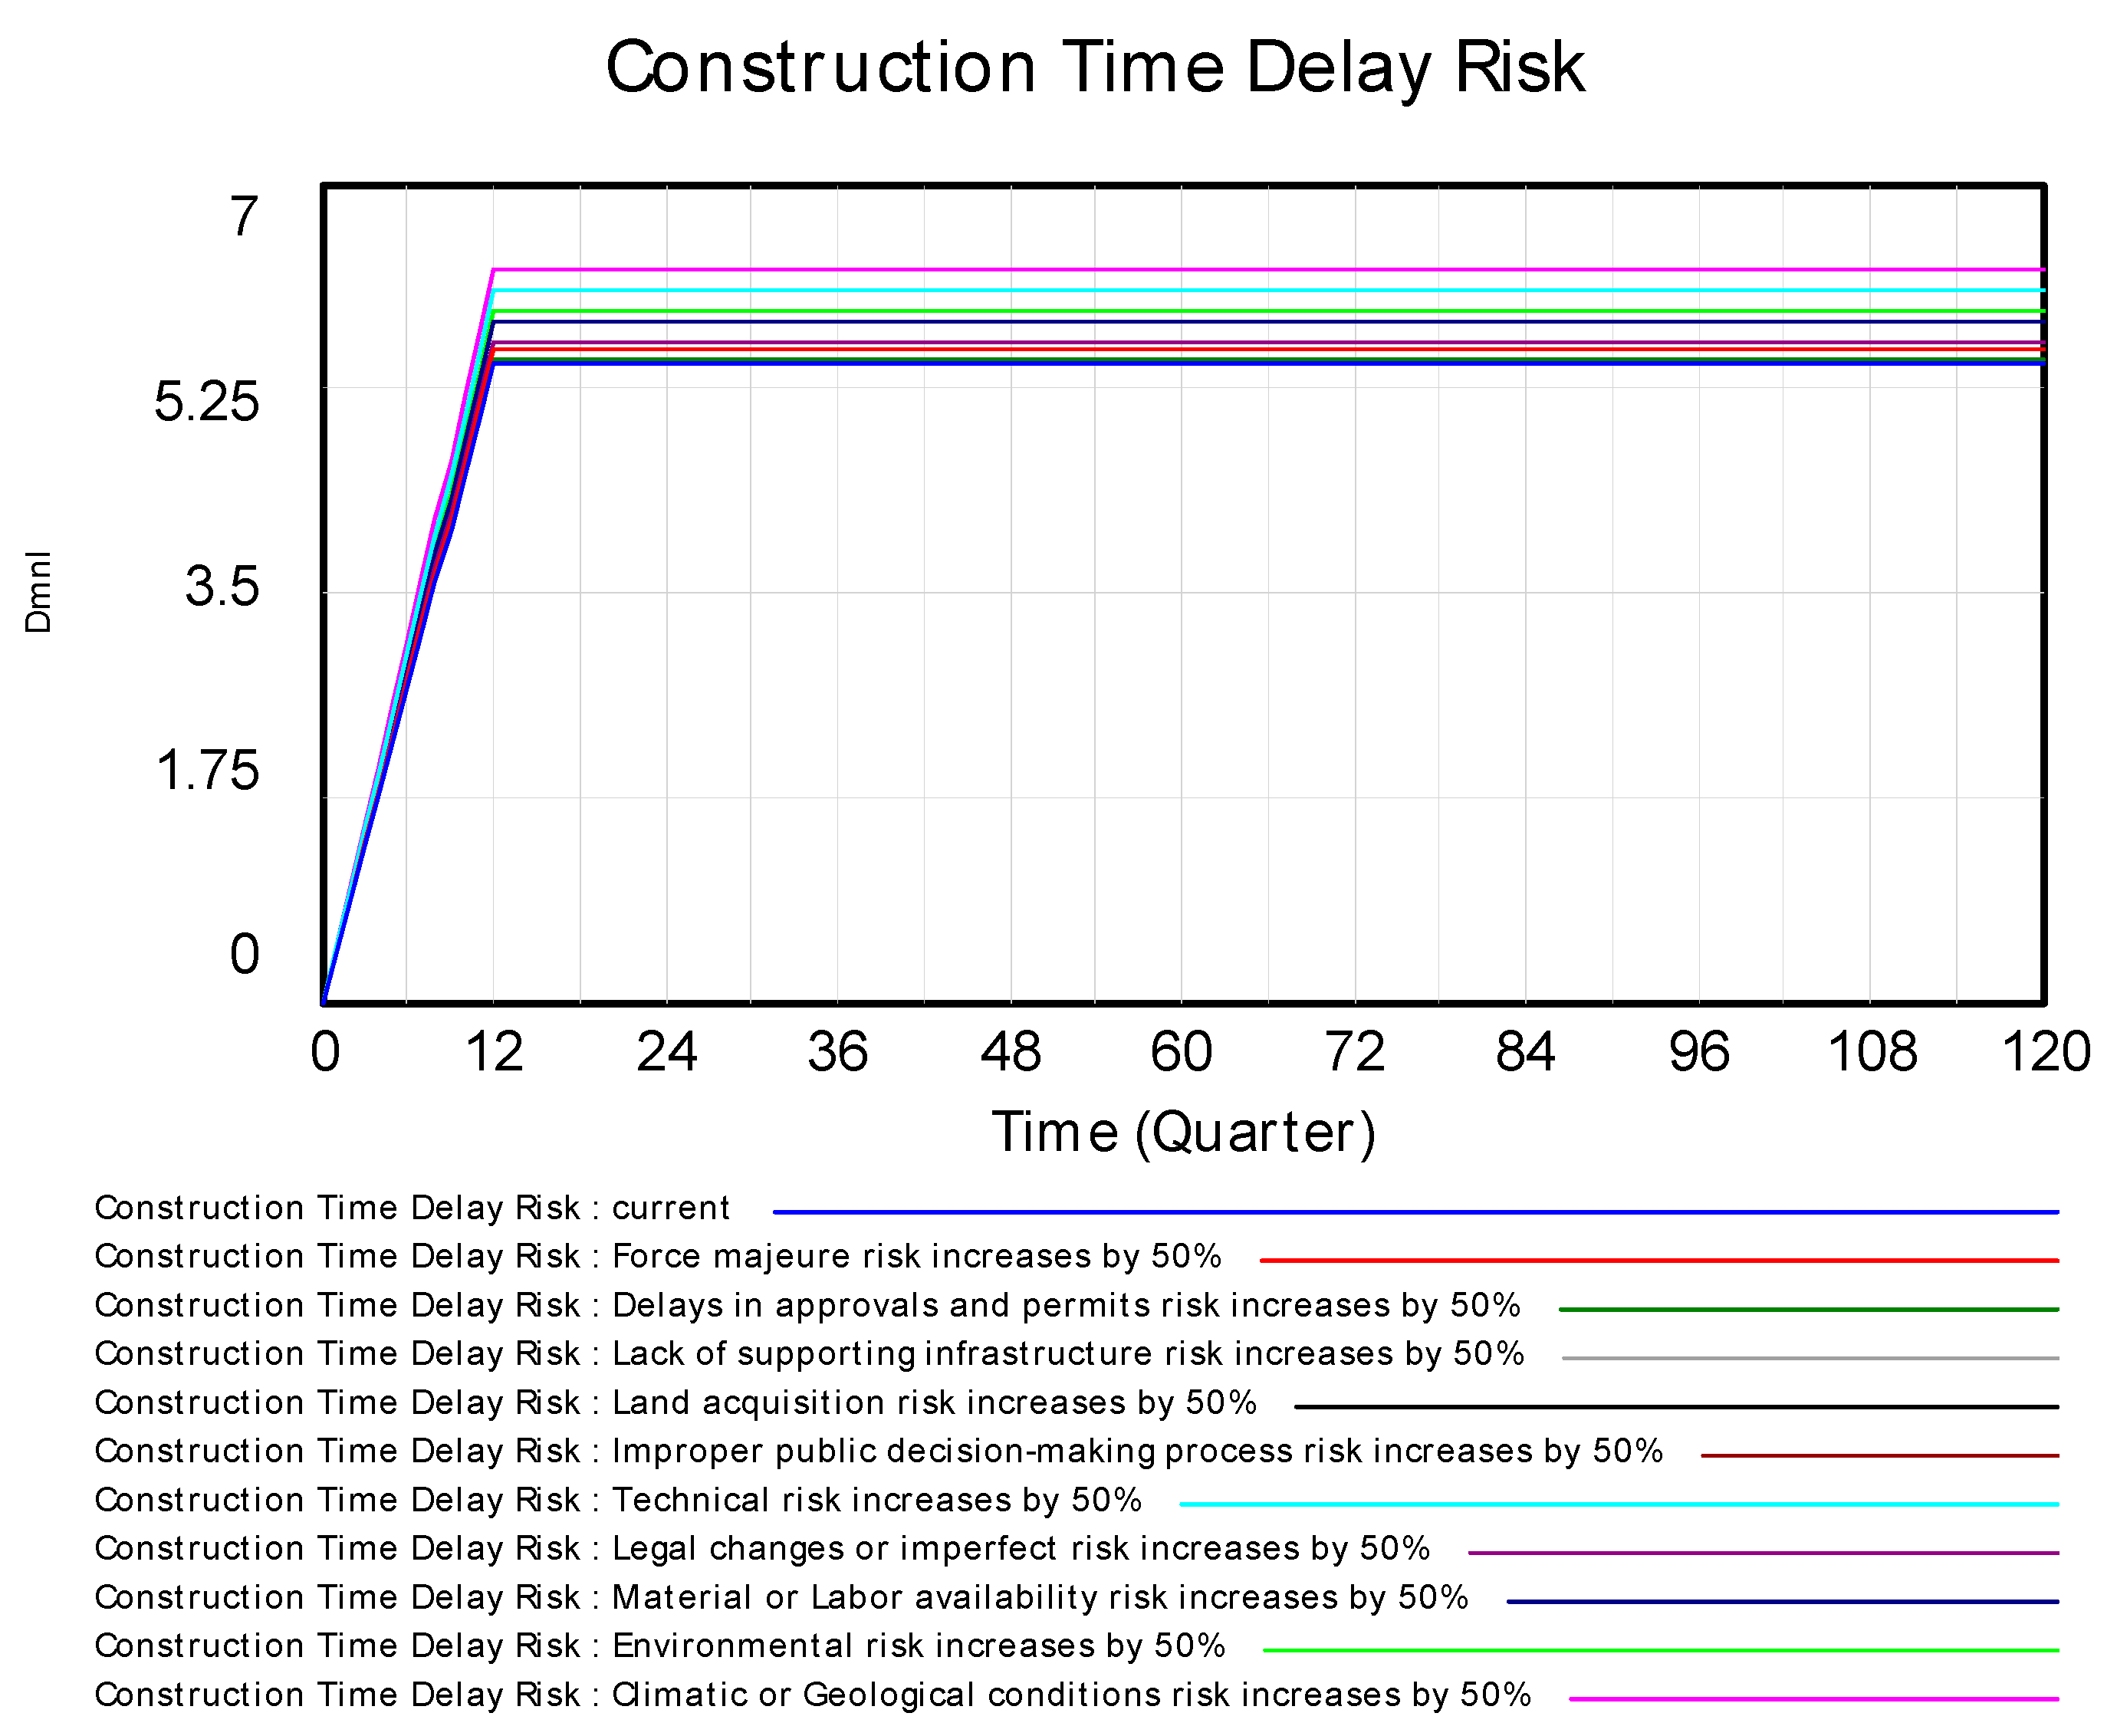
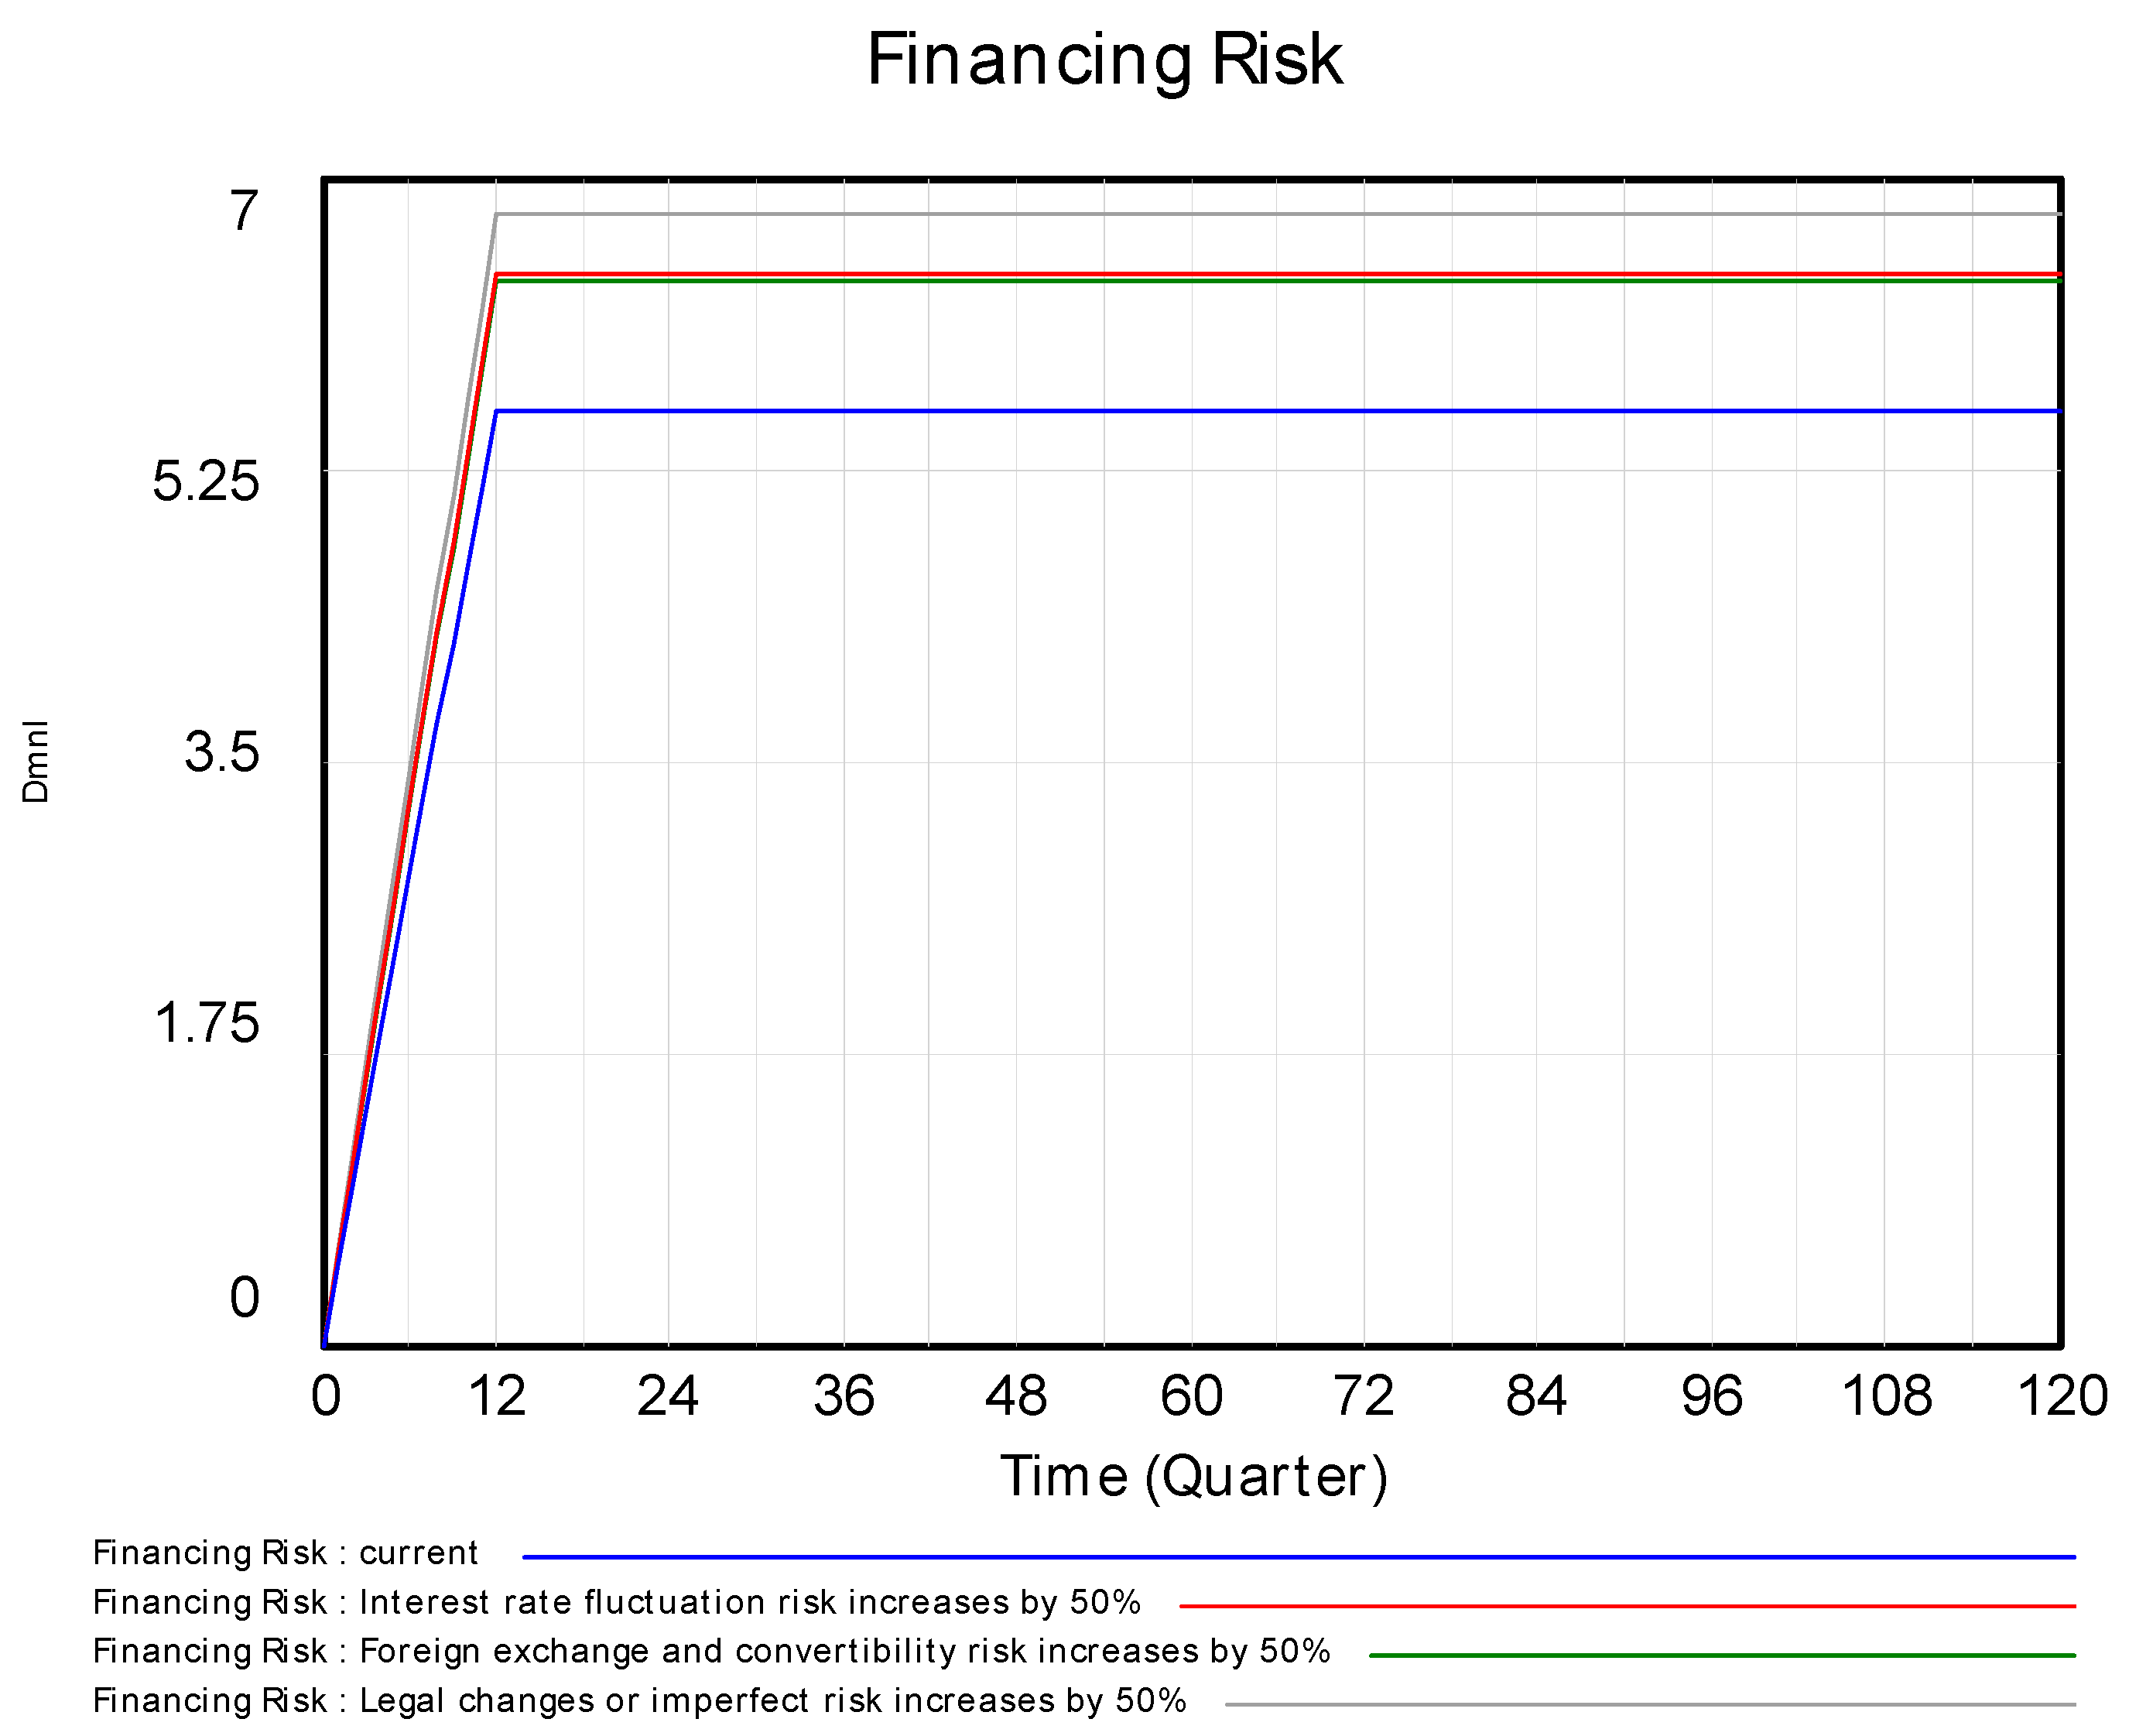
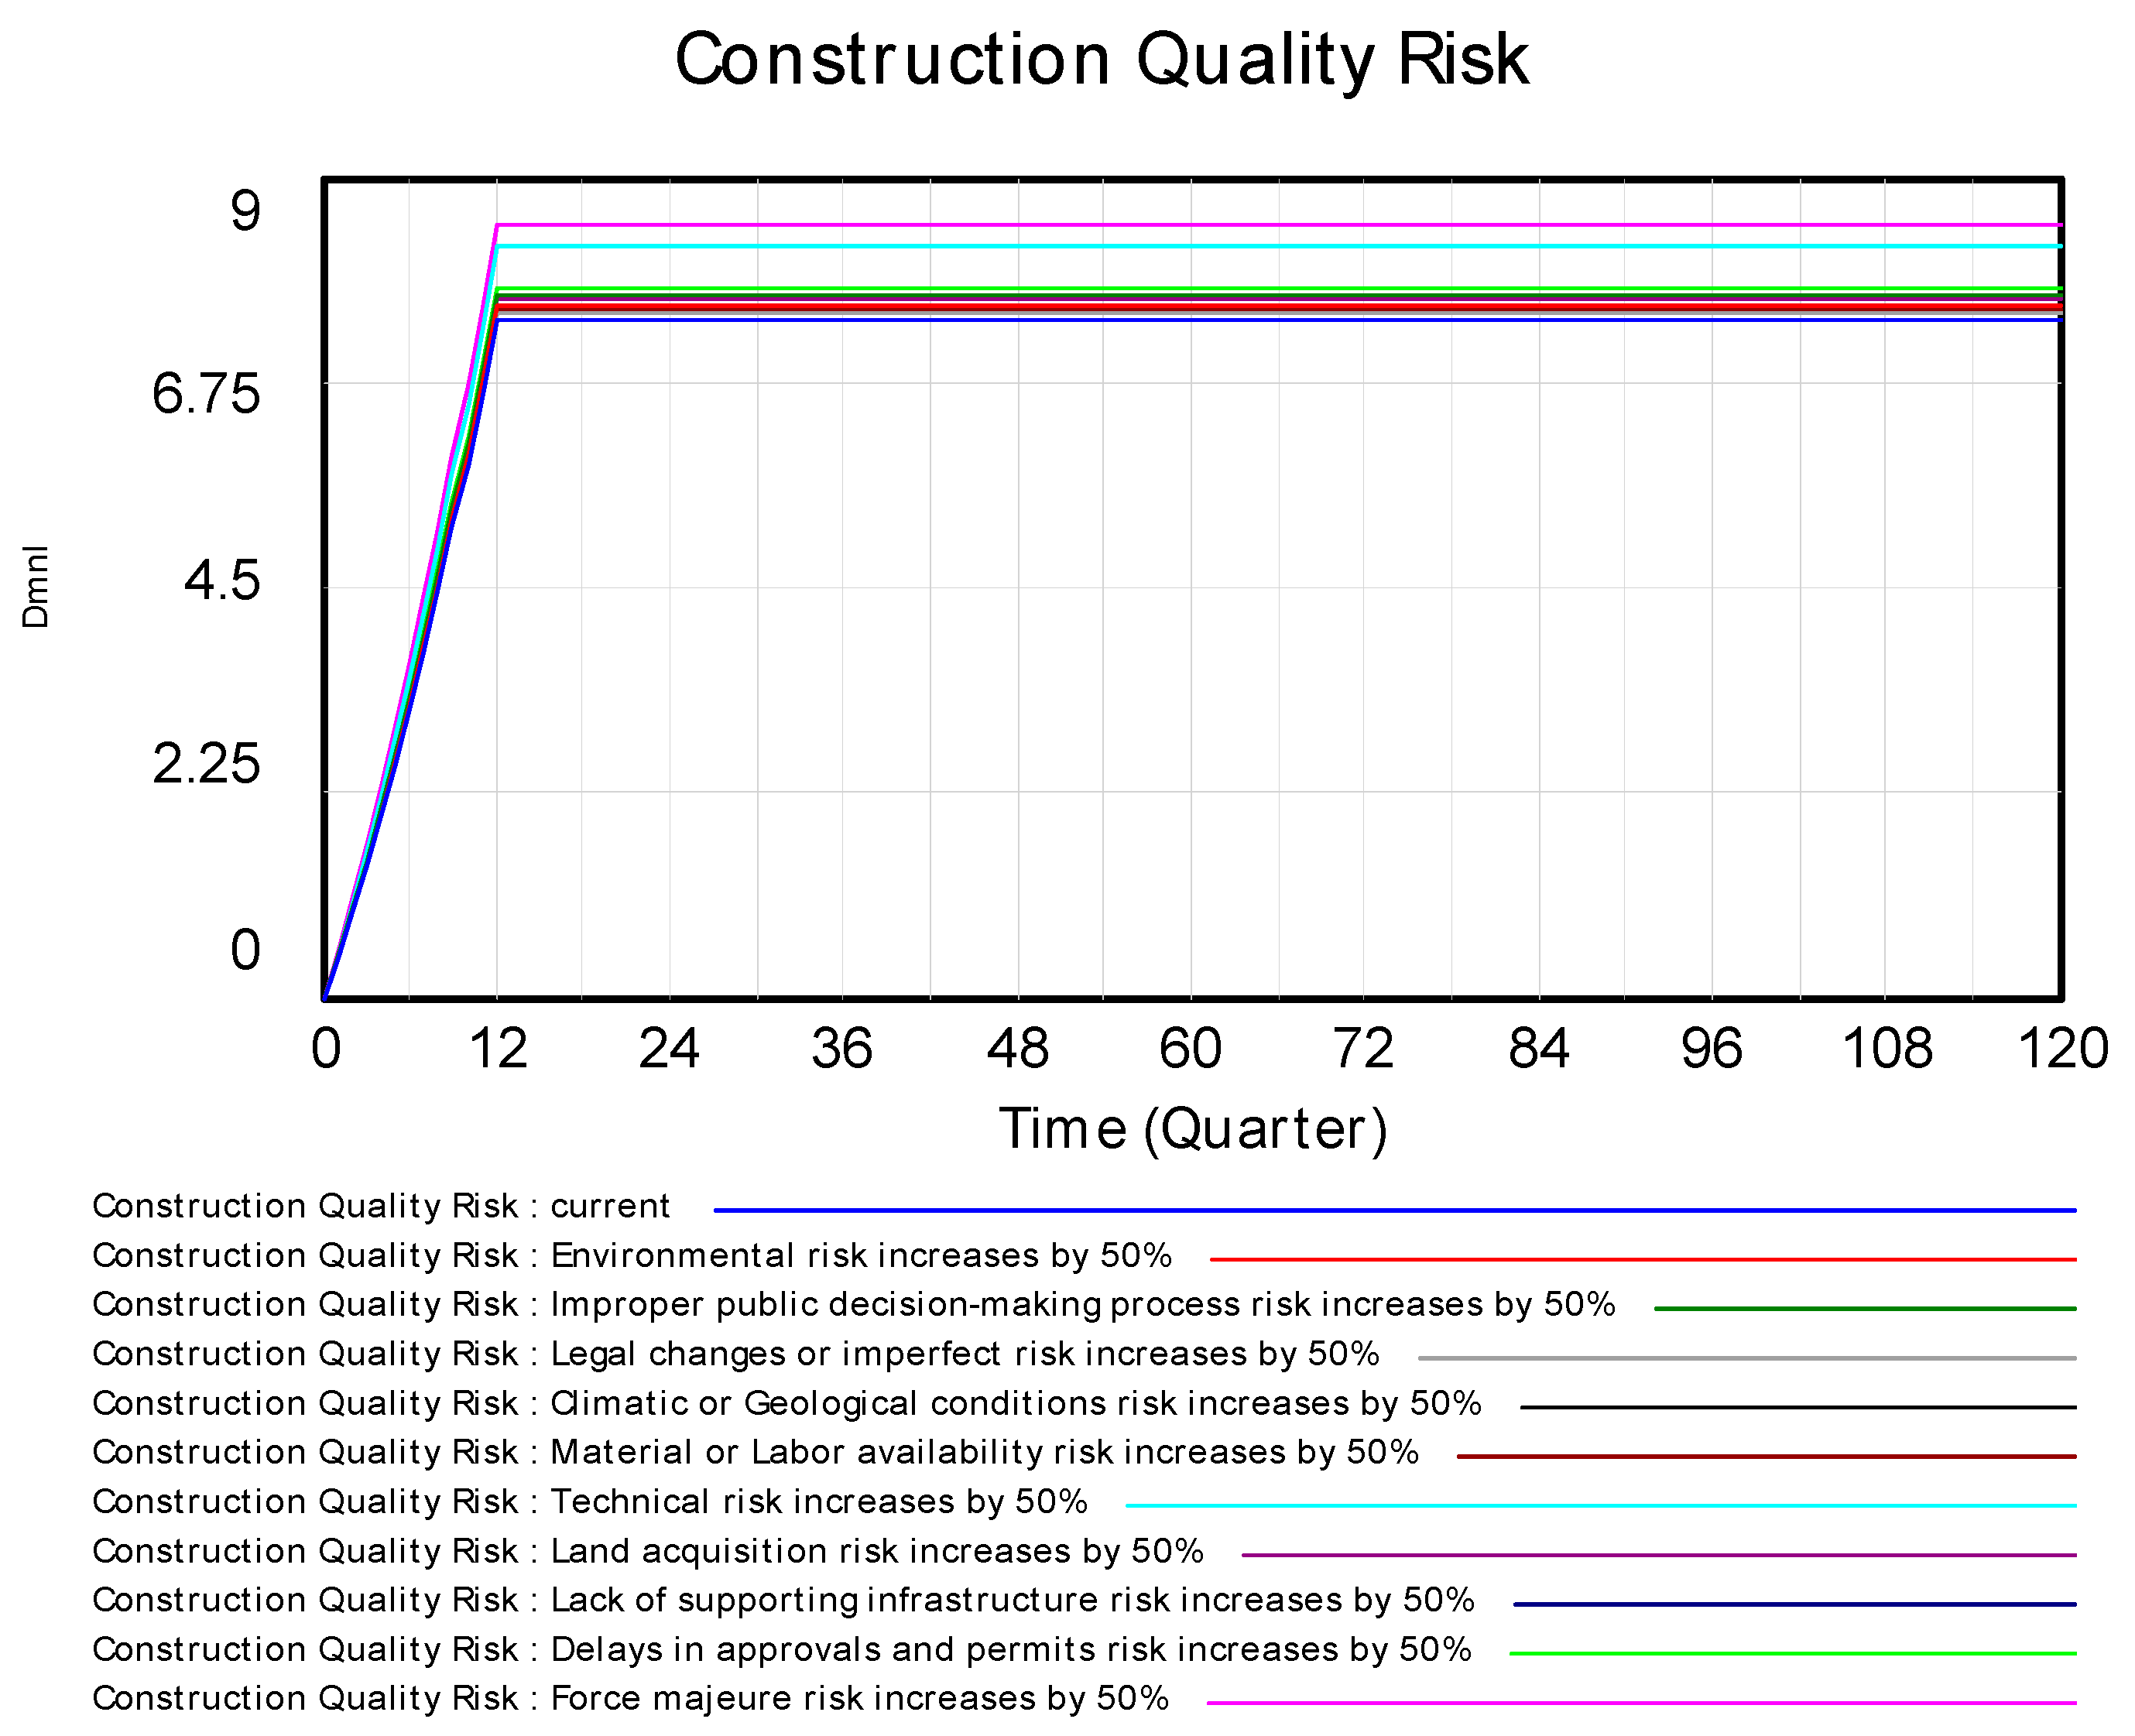
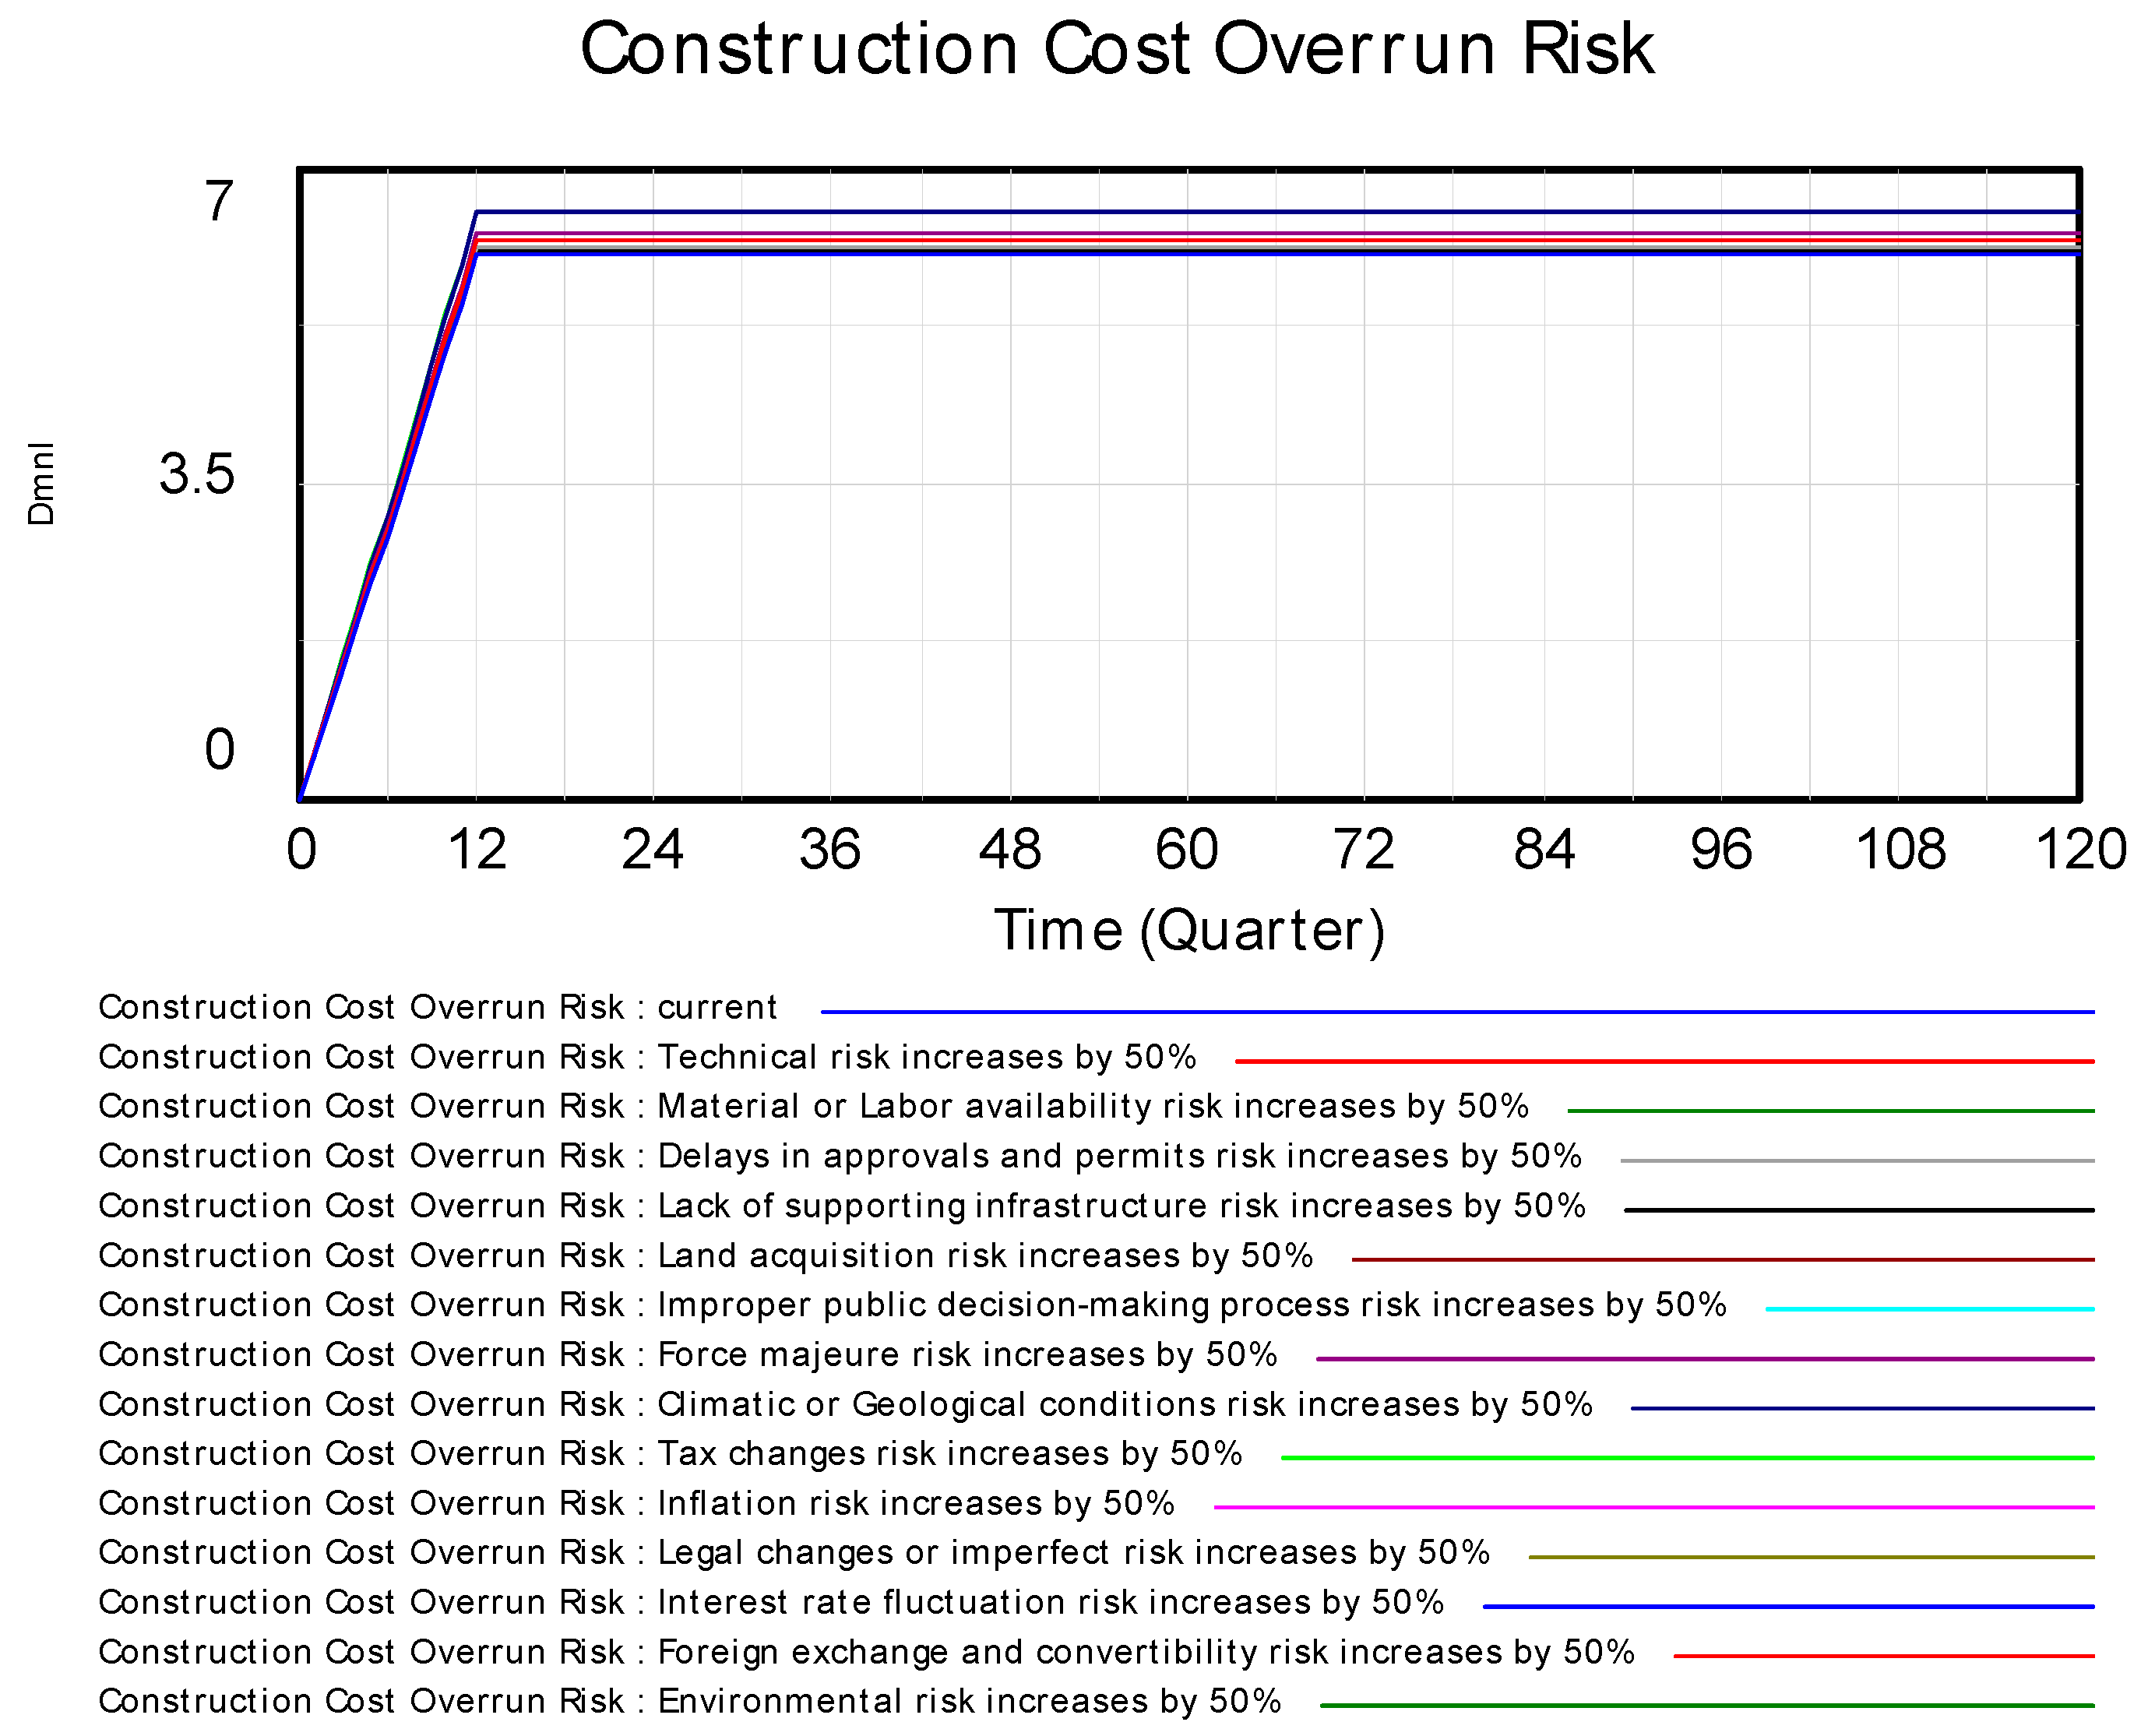
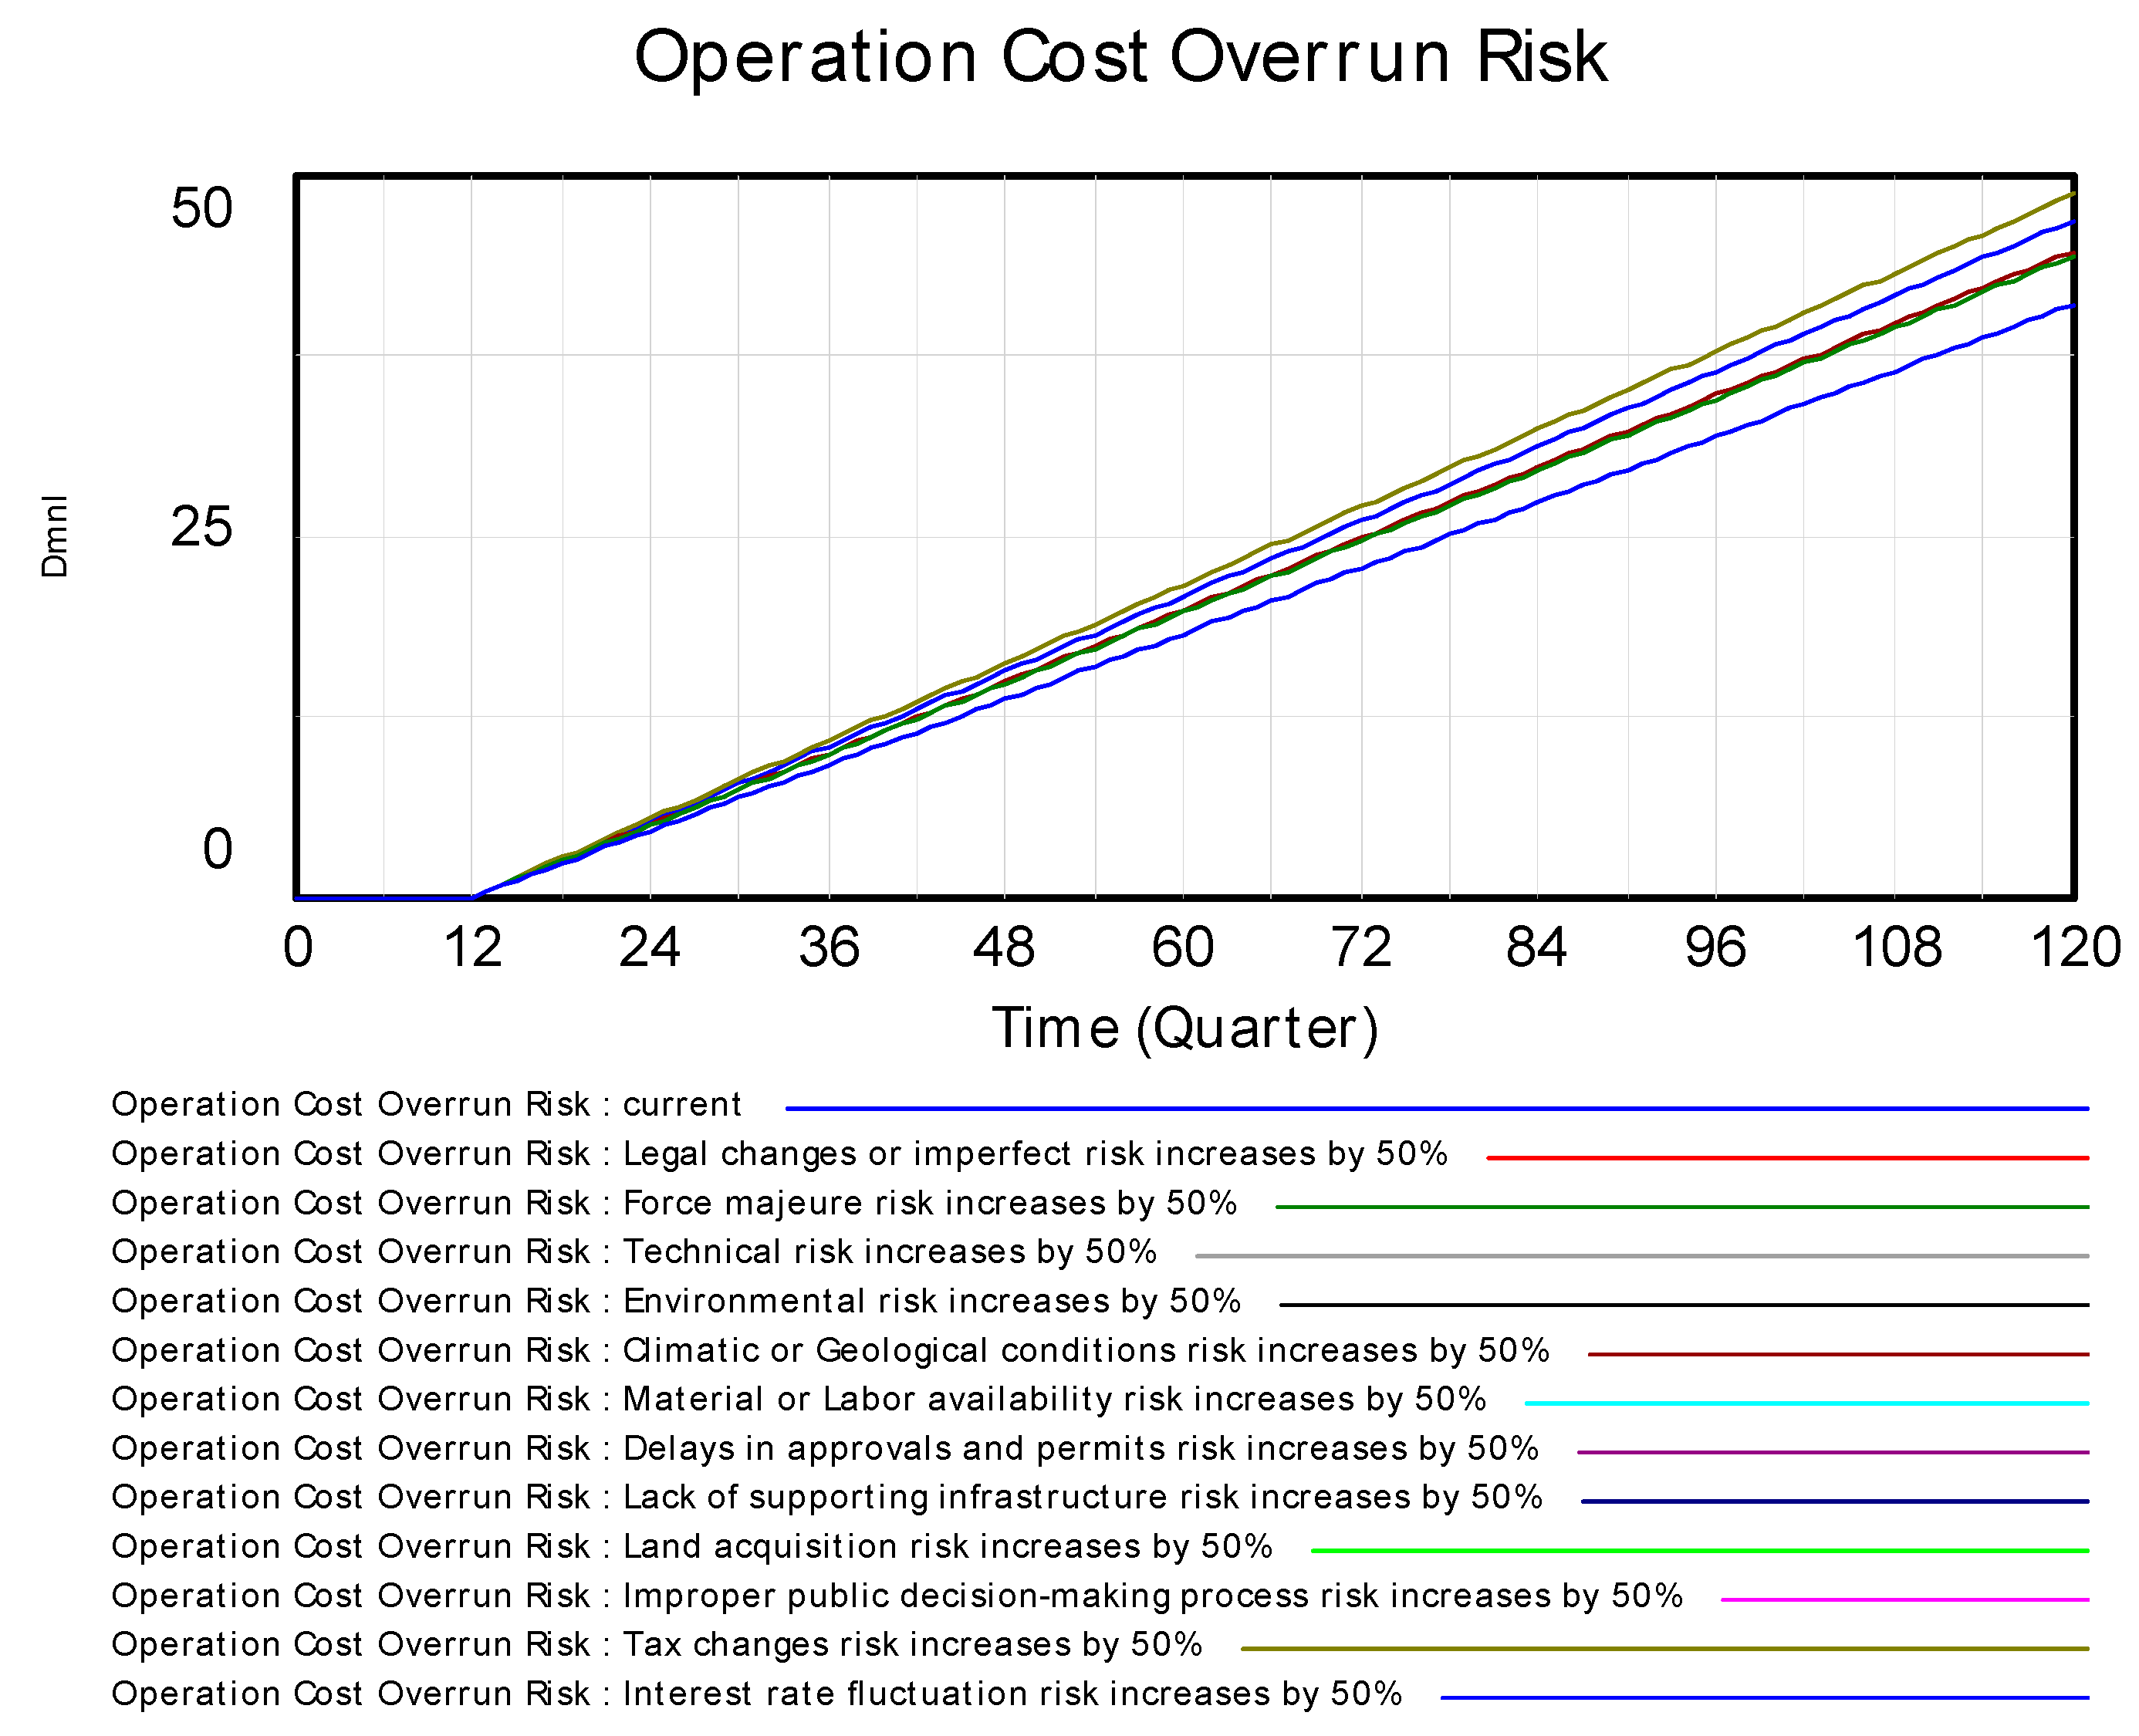
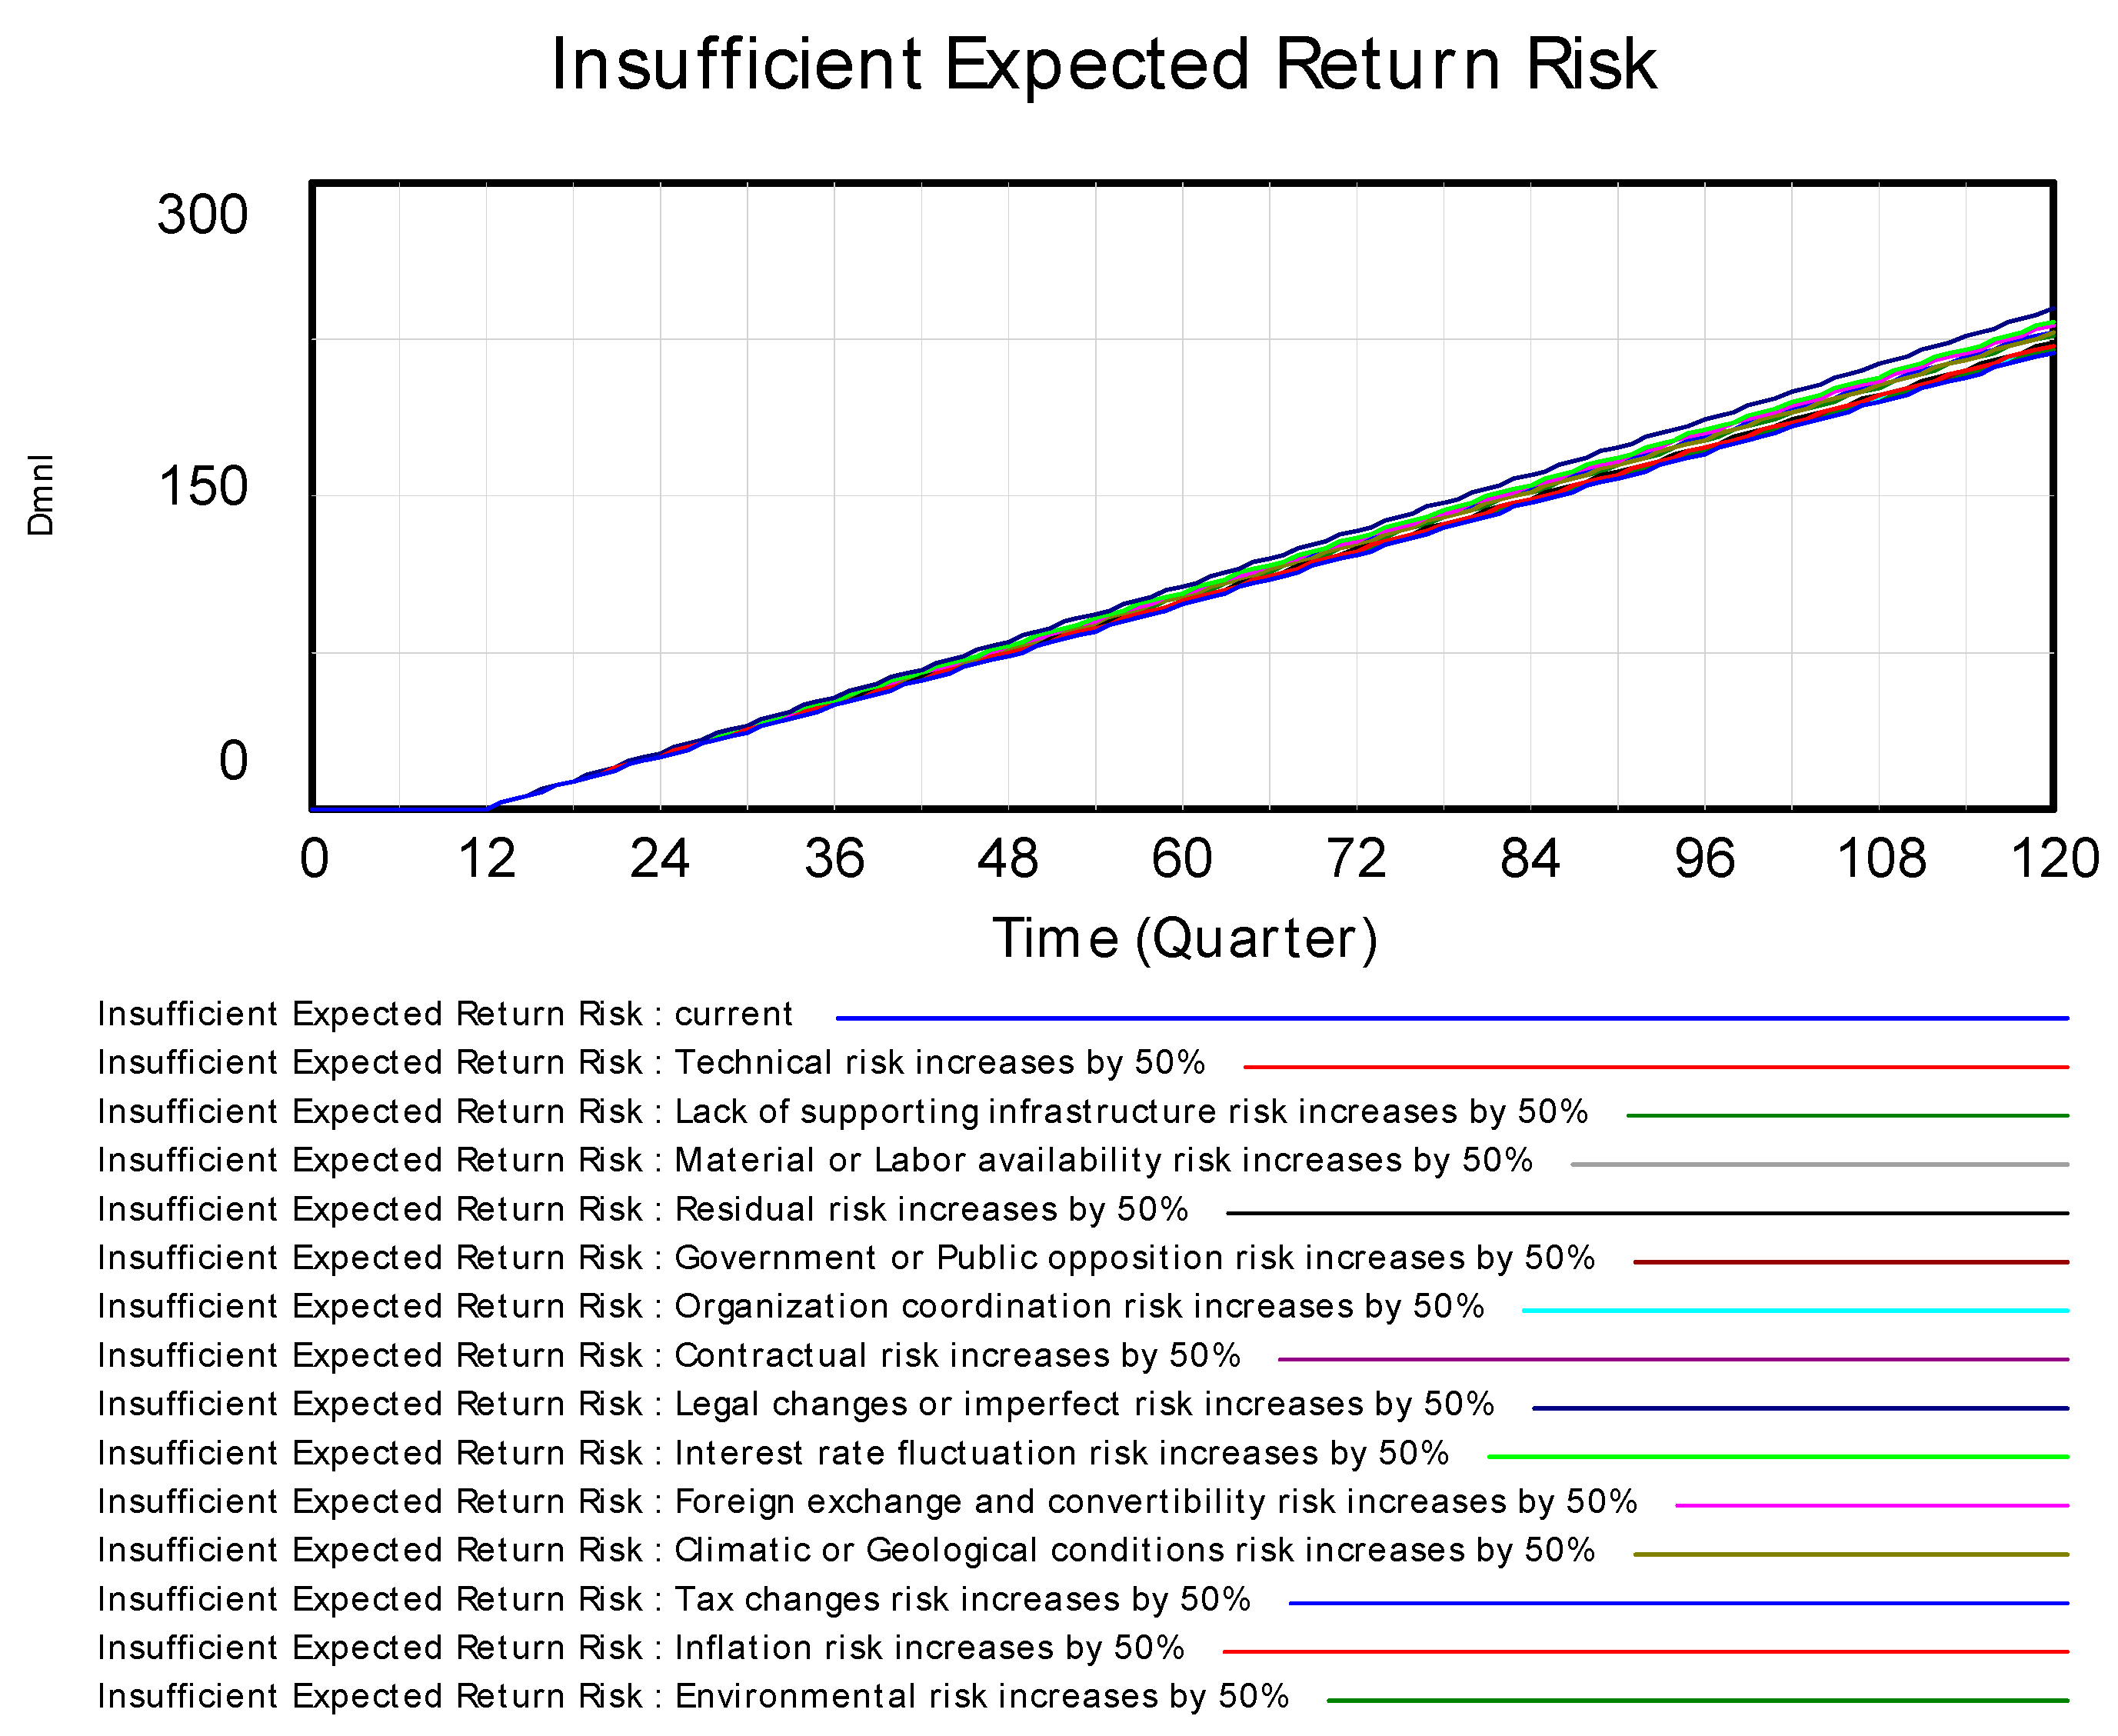
Disclaimer/Publisher’s Note: The statements, opinions and data contained in all publications are solely those of the individual author(s) and contributor(s) and not of MDPI and/or the editor(s). MDPI and/or the editor(s) disclaim responsibility for any injury to people or property resulting from any ideas, methods, instructions or products referred to in the content. |
© 2025 by the authors. Licensee MDPI, Basel, Switzerland. This article is an open access article distributed under the terms and conditions of the Creative Commons Attribution (CC BY) license (https://creativecommons.org/licenses/by/4.0/).