1. Introduction
In today’s business environment, Quality Management has become a cornerstone for organizations striving to remain competitive and deliver products or services that consistently meet customer expectations, particularly when competing in international markets [
1]. Within this context, the ISO 9001 standard has emerged as one of the most widely adopted international standards for the implementation, documentation, and maintenance of Quality Management Systems (QMSs) worldwide [
2]. Developed by the International Organization for Standardization (ISO) at
www.iso.org, this standard not only provides a reference framework to ensure quality but is also grounded in continuous improvement and operational efficiency—key factors that contribute to organizational sustainability and success. Since its initial publication, the standard has undergone multiple revisions and updates (1987, 1994, 2000, 2008, and 2015,
Figure 1) to adapt to the demands of globalized markets. This evolution has positioned ISO 9001 as an indispensable tool in the pursuit of operational and administrative excellence [
3].
The business decision to document, implement, and maintain a QMS based on the ISO 9001 standard has been extensively documented and studied, with numerous articles highlighting its benefits. Siltori [
4] identified quality improvement and defect reduction as some of the primary advantages. Larger companies, in particular, tend to experience more significant benefits, such as enhanced operational efficiency, attributed to the greater maturity of their quality management systems, as noted by [
5]. Fonseca et al. [
6] emphasized that in medium and large companies, ISO 9001 implementation has led to increased cost savings, market share, and sales volumes. The author of [
4] further found that one of the most notable benefits was improved customer satisfaction. Additionally, companies reported enhancements in process quality, reductions in errors and defects, and overall higher customer satisfaction as a direct result of ISO 9001 certification and implementation.
Similarly, the literature has demonstrated that certification can provide a competitive advantage, particularly in international markets where compliance with global standards is a key requirement for accessing new clients [
7]. In another study, Su et al. [
8] noted that adopting the ISO 9001 standard contributes to the optimization of internal processes, leading to greater operational efficiency and, in some cases, significant cost reductions. These outcomes are often part of a sequence of interrelated events.
However, there are also less favorable findings regarding the effectiveness of the ISO 9001 standard in certain areas. Neves et al. found that ISO certifications (9001 and 14001) did not significantly impact the financial performance of Portuguese companies, suggesting that implementation costs may outweigh the perceived benefits [
9]. Similarly, Zimon et al. (2020) observed that implementing ISO 9001 does not always result in significant improvements in supply chain management [
10].
Various studies, including those conducted by Cabecinhas et al., have demonstrated that ISO certifications, including ISO 9001, do not invariably lead to uniform enhancements in organizational performance, thus yielding mixed outcomes [
11]. In China, for example, it has been observed that the adoption of ISO 9001 may not exert a significant positive impact on the short-term performance of manufacturing firms, suggesting that the benefits of certification might be limited [
12]. Despite the advancements and widespread adoption of ISO 9001, the effective evaluation of implemented quality management systems (QMSs) continues to pose a significant challenge [
13].
Although the standard delineates the general minimum requirements for the implementation and certification of a QMS, it lacks detailed guidance on the specific methodologies for measuring implementation effectiveness or the conditions under which such evaluations should be conducted [
5]. This gap has prompted researchers and organizations to devise diverse methodologies aimed at assessing QMS performance and verifying whether organizations are genuinely adhering to the quality principles stipulated by the standard and are deriving the anticipated benefits.
1.1. Quality Management Systems Success Factors
The successful implementation of a Quality Management System based on ISO 9001, as well as the benefits derived from it, is related to a series of factors that interact to ensure the adoption and sustainability of efficient and appropriate quality management practices. These factors not only determine the effectiveness of the system but also its adaptability to the specific needs of each organization and sector. Among them are top management commitment, quality leadership, personnel training, and strategic alignment with business objectives.
Top management commitment is an essential pillar for the implementation of QMSs. Organizational leaders must play an active role in the design, implementation, and monitoring of quality practices, promoting an environment where quality is a strategic priority. This commitment is reflected not only in budgetary decisions but also in the ability to lead by example and motivate all levels of the organization [
14]. According to Ismyrlis et al., companies with greater managerial commitment tend to adopt quality standards, such as ISO 9001, more quickly and effectively [
15].
Effective leadership is crucial to guiding and motivating personnel during QMS implementation. Strong leadership fosters not only the adoption of quality practices but also the cultural transformation toward continuous improvement [
16]. This transformation depends largely on the ability of leaders to communicate the importance of quality and establish a collaborative framework where employees feel involved and accountable.
The creation of a quality culture requires the integration of organizational values that prioritize quality in all operational areas. Studies in companies certified under ISO 9001 indicate that organizational culture is a significant predictor of success in implementing a QMS, especially in highly competitive industries [
15].
It is essential to ensure that all employees understand and apply QMS principles in their daily work. According to Robinson et al. [
17], organizations that invest in quality training and education tend to reduce errors and increase operational efficiency. In addition, a well-defined organizational infrastructure and standardized processes facilitate implementation by providing the necessary tools and structures to manage change and monitor progress [
14].
Another critical factor is related to customer satisfaction, as it ensures that QMSs are aligned with market needs and expectations. This approach not only improves customer satisfaction but also drives innovation and the development of more competitive products and services [
18]. Strategic planning that integrates a QMS with the overall objectives of the organization is vital to ensure that quality efforts contribute to organizational success in a measurable and sustainable manner [
15].
Process improvement and process performance are critical to identifying areas for improvement and ensuring compliance with quality standards. Tools such as internal audits and gap analysis are essential to assessing progress and proactively addressing challenges during implementation [
19]. These practices not only strengthen the QMSs but also create a solid foundation for long-term organizational growth.
QMS maturity is considered a critical success factor (if not the most critical), as it reflects the degree of integration of quality practices into an organization’s processes and strategies. A mature QMS not only meets the basic requirements established by standards such as ISO 9001 but also incorporates elements of continuous improvement, innovation, and adaptability to changes in the business environment. Maturity allows the organization to maintain a balance between operational and strategic objectives, ensuring a sustainable and effective implementation of quality management. In addition, research has shown that QMS maturity is correlated with improved organizational performance, including higher customer satisfaction, reduced costs, and increased competitiveness in the marketplace [
14]. This level of development is achieved through a comprehensive approach that includes committed leadership, a strong quality culture, and well-defined processes, consolidating QMS maturity as a key determinant of organizational success.
1.2. Maturity of Quality Management Systems Based on ISO 9001 and Its Measurement
The maturity of Quality Management Systems (QMSs) refers to the level of integration of quality management practices in an organization, seeking to balance strategic, operational, and market objectives. In the context of ISO 9001 implementation, this concept acts as a key indicator of an organization’s ability to optimize processes and resources in a sustainable manner [
5]. Maturity not only means meeting regulatory requirements but also adopting advanced practices that foster innovation and competitiveness in dynamic markets [
20].
ISO 9004:2018 extends the focus of ISO 9001 by providing guidelines for assessing and achieving sustained organizational success through QMS improvement. This tool allows for measuring key aspects, such as leadership, resource management, and continuous improvement, incorporating elements of innovation and technology of Industry 4.0 [
21]. In the framework of Industry 4.0, the ability to integrate digital technologies into operational processes has become a crucial indicator of maturity [
22].
Although less addressed in recent research, ISO 10014:2021 complements ISO 9004 by detailing how quality management practices can generate tangible economic benefits. These guidelines enable organizations to measure their maturity through financial indicators, linking quality to economic performance [
23]. In particular, this standard is useful for companies seeking to link their quality strategies directly to financial value creation.
In addition to ISO 9004:2018 and 10014:2021, there are other approaches and methodological tools for assessing the maturity of QMSs. For example, gap analysis-based assessment models allow organizations to identify discrepancies between their current state and desired maturity standards. These models include detailed assessments of key processes, performance indicators, and continuous improvement mechanisms [
5]. In addition, structured questionnaires and maturity matrices have been developed that provide a visual framework for measuring progress in specific areas of the QMSs, such as risk management, innovation, and technology integration [
20]. These tools, along with internal and external audits, provide a comprehensive view of the maturity level and areas for potential improvement.
The maturity of QMSs does not depend solely on compliance with standards, but also on organizational factors such as size, implementation time, and sector of operation [
24]. Research has shown that large organizations, due to their ability to allocate resources to complex systems, tend to achieve higher levels of maturity [
5]. In addition, elements such as corporate social responsibility and business ethics remain critical areas where many companies face significant challenges [
22].
Measuring maturity also involves identifying areas of opportunity in leadership and communication within organizations. Effective leadership and active employee involvement in quality processes are crucial factors in moving toward higher levels of maturity [
23]. Likewise, organizational culture plays a fundamental role in fostering collaboration and continuous improvement, contributing directly to a more mature QMS [
21].
In addition to the aforementioned factors, QMS maturity is also influenced by the strategic alignment between quality objectives and the organization’s corporate vision. This alignment ensures that quality initiatives are integrated into strategic decisions, facilitating the more effective adoption of advanced practices [
24]. Another relevant factor is the organization’s ability to adapt to changes in the regulatory and market environment. Companies that can quickly adjust their quality systems to new legal requirements or customer expectations tend to show a higher level of maturity [
22]. In addition, the degree of digitalization and the use of advanced technologies, such as artificial intelligence and big data, contribute significantly to QMS maturity in modern contexts, such as Industry 4.0 [
21].
1.3. Hotelling’s T2 Test
Among these methodologies, statistical analysis has gained prominence as it provides objective, data-driven tools for evaluating quality. Nevertheless, a notable void persists in the application of multivariate statistical techniques to assess the intricate quality systems governed by the ISO 9001 standard [
6].
This scenario underscores the potential for employing advanced statistical methods, such as Hotelling’s T
2 test—a multivariate analytical technique that facilitates the evaluation of quality through the simultaneous comparison of multiple variables [
25]. In contrast to traditional univariate approaches, Hotelling’s T
2 test offers a more robust and comprehensive framework by examining the complex interrelationships among variables that influence quality and, consequently, organizational productivity [
26]. This is particularly critical in the context of QMSs, as these systems comprise a network of interconnected and interdependent processes, wherein the performance of one variable may directly affect others in a non-linear and interactive manner.
Accordingly, the application of Hotelling’s T
2 test represents a holistic and sophisticated methodology [
27], which proves highly effective for evaluating the performance of QMSs in organizations that conform to the ISO 9001 standard.
Over the years, researchers worldwide have explored various methods to assess the benefits and advantages of quality management within the framework of ISO 9001. Numerous studies have employed tools such as Statistical Process Control [
28] or Analysis of Variance (ANOVA) [
29] to identify differences in processes and/or areas for improvement and optimization. However, these statistical approaches often focus on evaluating one variable at a time (or its effect on another dependent variable), which can pose a significant limitation when analyzing complex systems, such as ISO 9001 Quality Management Systems (QMSs).
In contrast, Hotelling’s T
2 test enables the simultaneous evaluation of multiple indicators (as applied in this study to QMSs, see
Figure 2), providing a more precise and comprehensive assessment of a Quality Management System’s performance. While this statistical method has been extensively applied in fields such as biomedicine and statistics, its use in the domain of quality and process management, specifically in evaluating QMSs under the ISO 9001 standard, represents an innovative approach.
The primary objective of this study is to analyze the effectiveness (benefits) of Quality Management Systems (QMSs) implemented and certified under the requirements of the ISO 9001 standard. Specifically, it seeks to evaluate whether significant differences exist in the performance of companies that have adopted this standard, their nature, longevity, sector, etc., and, if so, determine which processes show the greatest deviations in terms of compliance with the requirements established by the standard and the consequent benefits it promises. In this way, the present study not only aims to contribute to the existing knowledge on QMS evaluation but also to provide a more effective tool, based on multivariate analysis, for the field of quality management.
It is expected that the results obtained will not only confirm the utility of this statistical technique in QMS evaluation but also allow organizations to detect whether compliance with the mentioned standard grants the benefits promoted by ISO and, thus, distinguish or detect whether what is expected from the standard aligns with what is achieved.
In the following section (
Section 2), the methodology used is described in detail, including data collection and statistical analysis design.
Section 3 presents the results obtained from the statistical analysis, evaluating the significance of the differences found between the various QMSs analyzed and what is promoted by ISO. In
Section 4, these results are discussed in relation to previous studies, and the practical impact of the findings on the field of quality management is analyzed. Finally, in
Section 5, the conclusions of this study are presented, highlighting the key contributions of this research and suggesting future lines of work for the continuous improvement of QMSs based on the ISO 9001 standard.
2. Materials and Methods
This study adopts a non-experimental, cross-sectional, exploratory research design, as outlined in [
30], which is characterized by the absence of deliberate manipulation of variables, as only the phenomena in their natural environment are observed and subsequently analyzed.
Furthermore, an exploratory scope is established because, to date, no prior research has been found that addresses the current revision of the ISO 9001 standard in relation to measuring its impact using Hotelling’s T2 statistical technique.
Four research questions were defined for this study as follows:
RQ1. What are the benefits derived from ISO 9001 certification (the parametric hypotheses H1, H2, H3, and H4,, and their test values are obtained from the measurement instrument), and do certified organizations achieve the benefits promoted by the standard?
RQ2. As determined through a regression and correlation analysis, which are the main variables that contribute to the success of a QMS and its implicit benefits?
RQ3. To identify sectorial differences (public vs. private) in the perception and results of certification through the applicability of Hotelling’s multivariate T2 test to analyze the results of the QMSs and their differences.
2.1. Research Desing and Data Collection
2.1.1. Instrument Design
For the development of this research, a questionnaire based on the guidelines suggested by ISO was used as the measurement instrument. The questionnaire was adapted from the one proposed in the International Standard ISO 10014:2021, Quality Management. The instrument cited in this standard was employed in the methodology.
The instrument consists of three sections. The first section covers general data, detailing aspects such as the type of organization, the sector it belongs to (public or private), the organization’s age, the age of the QMSs within the organization, the number of employees, and the reason for obtaining certification (internal or external motivation). The second section represents an adaptation of the Comprehensive Assessment Questionnaire found in ISO 10014, presented through a Likert-type scale with a measurement level from 1 to 5, where 1 equals “Strongly Disagree”; 2 equals “Disagree”; 3 equals “Neutral”; 4 equals “Agree”; and 5 equals “Strongly Agree”. The third section of the instrument includes a series of perceptual questions (based on the perception of the quality coordinators/responsible parties/managers of the QMSs when interviewed) regarding specific benefits achieved from the implementation of a Quality Management System. It is important to highlight that the four benefits considered for measurement are increased customer confidence and satisfaction, continuous improvement and process enhancement, increased productivity, and cost savings within the QMSs—these are the same four benefits promoted by ISO [
31] on their official website at
https://www.iso.org/standard/62085.html (accessed on 10 March 2025).
2.1.2. Population
The study population originally consisted of 45 organizations, which were obtained by directly consulting the certifying bodies in the country, resulting in a list of 45 organizations and/or institutions in central Mexico that are certified under the ISO 9001 standard. For this study, no sample size was considered, as the instrument was applied to the entire population, meaning the study is a population-based study (N = 45) rather than a sample-based one.
2.1.3. Scenario
The instrument was applied directly to the coordinators and/or representatives of the Quality Management Systems (QMSs) at their respective facilities (45 organizations). These individuals were selected as they are most familiar with the results of the implementation and maintenance of a QMS. However, it was also deemed appropriate to involve personnel from senior management in completing the instrument to provide a more comprehensive perspective.
2.1.4. Pilot Test
A pilot test was conducted by applying the instrument to six QMS coordinators from six certified organizations located in different geographical areas. On the agreed date, participants were briefed on this study’s objective and the confidential use of their data. Afterward, the data collected were analyzed using various statistical tests.
2.1.5. Pilot Test Data Analysis
Initially, data entry and the calculation of Cronbach’s Alpha coefficient were performed using Excel 2021. The results were subsequently validated with the SPSS software (version 24, Mac OS). To evaluate the reliability of the instrument, the Cronbach’s Alpha test was applied collectively, yielding a value of 0.987 (
Table 1).
Internal consistency is a measure of the correlation between the items that compose any measurement instrument based on a Likert scale. The values are considered acceptable when equal to or greater than 0.70. This coefficient must be calculated whenever the instrument is applied to a population.
For this study, the Cronbach’s Alpha value obtained was deemed acceptable, as [
32] notes that a Cronbach’s Alpha value of 0.70 or higher is commonly recognized as an indicator of good reliability on the scale. The pilot test results demonstrated an adequate level of reliability in the instrument, both collectively and individually. Additionally, the Shapiro–Wilk normality test confirmed a normal data distribution, as shown in
Table 2.
The above confirmations allow us to be certain that the data obtained by applying the instrument follow a compression similar to the normal distribution, which allows for the subsequent statistical analyses described in the following research questions.
2.2. Methodological Verification
To answer the question of what are the benefits derived from ISO 9001 certification (parametric hypotheses, H1, H2, H3, and H4, and their test values are obtained from the measurement instrument), and do certified organizations achieve the benefits promoted by the standard, this study proposed the following hypotheses: H1: organizations certified under ISO 9001 experience an average increase in customer satisfaction greater than 20%. H2: QMS implementation improves process performance by more than 20%. H3: the total sales increase by more than 20% after ISO 9001 certification. H4: organizations’ revenues increase significantly after certification. These hypotheses were tested using a t-test to evaluate the reported benefits and their influencing factors.
Additionally, to address whether certified organizations achieve the benefits promoted by ISO 9001, the data obtained from the questionnaire was compared with the benefits outlined in the standard. This comparative analysis provided a detailed description of how closely the reported benefits align with those promoted by ISO 9001.
To determine the main variables contributing to the success of a QMS and its implicit benefits, this study applied both multiple regression and correlational analysis. The independent variables considered for these analyses include the age of the organization, the economic sector, the age of the QMS, the age of the respondent, and the number of employees. Multiple regression analysis was utilized to identify the predictive power of these variables in explaining QMS performance, while correlational analysis was used to uncover the strength and direction of relationships between variables. These variables were selected based on their theoretical and practical relevance, as highlighted in previous studies [
5]. Additionally, simulation scenarios were performed to optimize the predictive model, enabling the identification of the best strategies to maximize the expected outcomes of QMS certification.
In this study, a multivariate statistical test, known as Hotelling’s T2, test was used to analyze whether there was any significant difference in the perceived benefits amongst the business sectors (RQ3). This test was conducted because it compares the means of several dependent variables simultaneously, and, hence, is ideal for comparing the perceived benefits from ISO 9001 certification in both public and private sector organizations. The analysis focused on key perceived benefits, such as customer satisfaction, process performance, sales growth, and increased revenue, to see if the context of the sector influences such outcomes. This approach ensures a robust examination of potential sectoral differences across a range of metrics.
The results of the T2 test showed significant differences in the perceived benefits of public and private sector organizations. The public sector companies stressed process efficiency and customer satisfaction, while the private sector companies stressed sales growth and revenue generation more. This is understandable because of the nature of their operations and the demands of the marketplace, which would have them more focused on profitability and competitiveness. These findings have important implications for the organizational context in which ISO 9001 certification is implemented.
3. Results
Having established a comprehensive methodological framework in
Section 2, including the design, validation, and pilot testing of the research instrument, we now proceed to present and analyze the results obtained from its application.
Section 3 begins by examining the demographic characteristics and research questions on the participating organizations, offering valuable context for interpreting the data. This analysis serves as a foundation for exploring the broader implications of implementing Quality Management Systems and their measurable impact on organizational performance.
3.1. Demographic Analysis
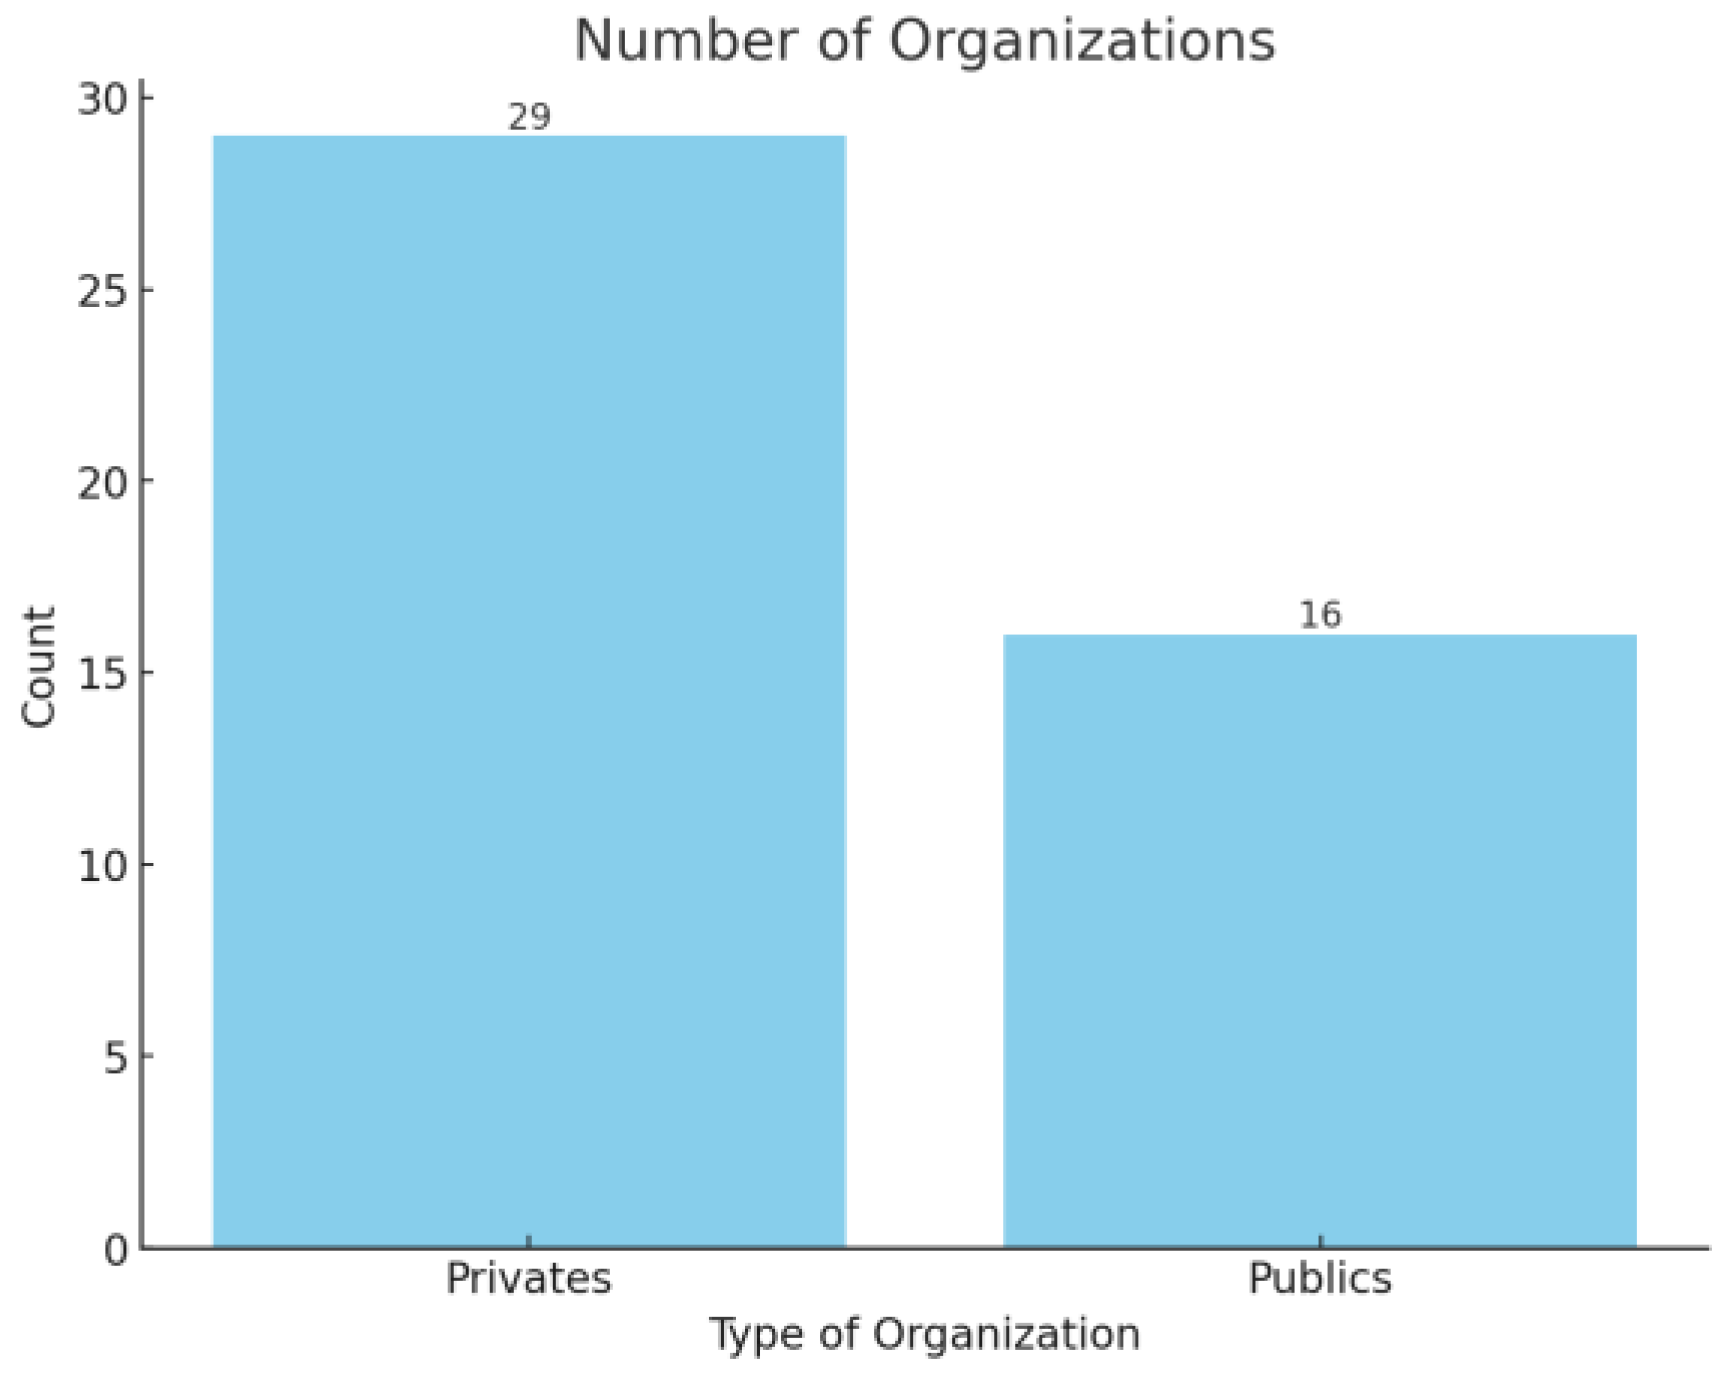
Among the primary demographic variables in the evaluation instrument, the first pertains to the sector to which the organization or institution belongs—specifically, whether the surveyed entity operates in the public or private sector. This distinction is significant, as profit-driven or social objectives influence the priorities for which the QMS (Quality Management System) was designed and implemented. Based on the analysis, out of the 45 instruments applied, the majority—65%—correspond to the private sector, as shown in
Figure 3, which provides descriptive statistics for this variable.
The variable “organization size”, represented in this case by the number of employees, revealed an average of 198 employees, indicating that the certified organizations fall into the category of medium-sized enterprises. This is illustrated in
Figure 4.
As evident, outliers significantly influence the estimators. To address this, a more robust method, the Winsorization technique, was applied to calculate the average. This approach identifies and mitigates potential outliers in normally distributed population samples. For example, for the 45 values representing the number of employees, the mean and standard deviation were 197.356 and 431.292, respectively. The Winsorized estimates, which replace the top and bottom 20.0% of values with interior sample values, were 117.911 and 120.091, respectively.
Regarding the demographic variable “organization age”, measured in years of legal existence, certified organizations under ISO 9001 were found to have an average age of 24 years. This is depicted in
Figure 5, showing an interquartile range of 12 years. This reflects a certain level of maturity when deciding to implement a QMS.
The next variable analyzed pertains to the tenure of the quality coordinator, understood as the experience of the individual responsible for the QMS. On average, QMS coordinators have six years of experience. When compared with the descriptive statistics of the variable “QMS Age”—measuring the years since the certification was obtained—it is observed (see
Figure 6) that organizations generally assign existing staff members to oversee the quality system, as their tenure surpasses the average lifespan of the QMS itself.
The subsequent variable, “Reason for Seeking Certification”, seeks to uncover the motives driving organizations to design and implement a QMS. The distribution of frequencies describing the identified reasons is displayed in
Figure 7.
3.2. What Are the Benefits Derived from ISO 9001 Certification, Specifically in Terms of Customer Satisfaction, Process Performance, Sales, and Revenue (The Parametric Hypotheses H1, H2, H3, and H4,, and Their Test Values Are Obtained from the Measurement Instrument) and Do Certified Organizations Achieve the Benefits Promoted by the Standard?
For this question, the statistical method employed was the Student’s t-test. This method is appropriate for normally distributed populations with small sample sizes, where the sample standard deviation is used instead of the population parameter. Specifically, the one-sample t-test was selected, which tests whether the mean of a population equals a specified value under the null hypothesis.
If the
p-value is less than the significance level (denoted as α or alpha), the null hypothesis can be rejected. This provides evidence that the tested parameter significantly deviates from the hypothesized value. A statistical resume can be seen a
Table 3.
As can be seen, the four hypotheses that make up this question show a positive result when all the alternative hypotheses (H1) are accepted. The above denotes that, in relation to the increase in customer satisfaction, the increase in sales, process improvement, and income, the companies highlight a favorable increase when certifying under the ISO 9001 standard.
3.3. Determine Whether Certified Organizations Achieve the Benefits Promoted by ISO 9001
Table 4 shows a summary conclusion, and each analyzed benefit can be observed and compared with the promoted benefits in the ISO 9001 standard.
3.4. What Are the Main Variables That Contribute to the Success of a QMS and Its Implicit Benefits?
The next step in the results analysis was to determine the degree of relationship between the variable “increase in income” (since it has already been shown to increase) and the potential influencing variables.
To achieve this, a multiple linear regression technique was employed to develop a predictive model identifying the variables with the greatest impact. This statistical test was conducted using the scheme outlined in
Table 5.
Resulting in the following model equation:
Since the
p-value in the ANOVA
Table 6 is less than 0.05, there is a statistically significant relationship between the variables at a 95.0% confidence level.
The R2 statistic indicates that the adjusted model explains 69.8787% of the variability in the increase in income. The adjusted R2, which is more suitable for comparing models with different numbers of independent variables, is 62.1333%. The standard error of the estimate indicates that the standard deviation of the residuals is 11.8691. The Mean Absolute Error (MAE) of 8.60434 represents the average value of the residuals.
To determine if the model can be simplified, the highest
p-value among the independent variables is observed at 0.6971, corresponding to the variable organization tenure. Since the
p-value is greater than or equal to 0.05, this term is not statistically significant at a 95.0% confidence level. Consequently, the variable organization tenure is excluded, resulting in the following simplified model:
The application of the multiple linear regression model revealed that the variable “organization tenure” does not significantly impact income outcomes. Conversely, factors like process improvement, sales growth, and customer satisfaction—closely tied to QMS maturity—emerge as the primary contributors to a QMS’s success. Moreover, the organization’s economic sector also plays a role in shaping the impact of the QMS.
3.4.1. Selection of the Best Regression Model
Statistical rigor requires identifying which regression model explains the highest possible variance, as the model presented above is only one potential option. Thus, the question arises: is there another model that more accurately explains the multiple relationships among all variables?
This question is addressed by analyzing various proposed models and comparing their R2 values and Mallows’ Cp statistic. To do this, the “Model Selection” statistical test was conducted using Statgraphics 17 software, which displays the results of combining between 0 and 10 variables in a single table.
Table 7 presents the results of adjusting several multiple regression models to describe the relationship between the increase in income and 10 predictive variables. The models were adjusted to include all possible combinations of the variables. The tabulated statistics include the Mean Square Error (MSE) and the adjusted and unadjusted R
2 values, as shown below.
Given the above, it is appropriate to perform the complete multiple linear regression test again, now with the mentioned combination of variables, which represents the optimal model among the 1024 derived in the previous step. The model is presented below (the optimal one from
Table 7, 1 of 1024).
Table 8 shows the results of the multiple linear regression between the six predictor variables and the dependent variable.
To verify whether the selected model explains 71.06% of the variance, as indicated in
Table 8, it is necessary to include the results of the variance analysis (ANOVA), which are illustrated below in
Table 9:
With the following complementary results: R2 = 71.0627%, adjusted R2 (for degrees of freedom) = 66.4937%, the standard error = 11.1648, and the Mean Absolute Error (MAE) = 8.44445.
The above shows the results of fitting a multiple linear regression model to describe the relationship between the increase in income and the six mentioned variables. The adjusted model equation is:
The R2 statistic indicates that the adjusted model explains 71.0627% of the variability in the increase in income. The adjusted R2, more suitable for comparing models with different numbers of independent variables, is 66.4937%. The standard error of the estimate indicates that the standard deviation of the residuals is 11.1648. The Mean Absolute Error (MAE) of 8.44445 represents the average residual value.
This result aligns with the model selected. In other words, the previous model is the best of the 1024 possible models to describe the influence of the six variables on the output variable increase in income.
3.4.2. Reduction of the Best Regression Model
To determine if the model can be simplified, the highest
p-value among the independent variables was observed to be 0.3077, corresponding to interviewee tenure. Since the
p-value is greater than or equal to 0.05, this term is not statistically significant at a 95.0% confidence level. Consequently, the option to exclude interviewee tenure from the model is considered, leading to the next step of conducting a multiple linear regression analysis on the reduced optimal model, excluding this variable. The resulting model is presented in
Table 10.
The reduced optimal model presents the results of fitting a multiple linear regression model to describe the relationship between the increase in income and the five independent variables. The adjusted model equation is:
Since the
p-value is less than 0.05, there is a statistically significant relationship between the variables at a 95.0% confidence level, as shown in
Table 11The adjusted model explains 70.25% of the variability in the increase in income (R2), with an adjusted R2 of 66.43%, which is more suitable for comparing models with different numbers of variables. The standard deviation of the residuals is 11.17.
When analyzing the simplification of the model, it is found that the highest p-value corresponds to the variable “QMS maturity” (0.2028). However, excluding this variable causes the R2 to decrease to 68.97%, and the adjusted R2 to 65.87%, reducing the explanatory power of the original model.
3.4.3. Cp Mallows Criteria
To optimize the model, Mallows’ Cp criterion is used, which balances the number of predictors with the model’s precision. A low Mallows’ Cp value, close to the number of variables plus one, indicates a precise model with low variance, allowing for the selection of the optimal number of predictors for the equation. The optimal adjusted result is as follows:
To further understand the above model, the variables are substituted with their minimum, maximum, and average values, derived from the questionnaire as a simulation, to observe the behavior of the optimal adjusted model, which can be seen in
Table 12.
As shown, substituting the maximum values into the model yields an income increase of 71.16% (Row 1: Max), while substituting the average values results in an increase of 43.16% (Row 2: Averages). Similarly, substituting the minimum values gives a result of 39.92% (Row 3: Min). Additionally, a random simulation was performed (Row 4: Random), producing an estimated response variable increase of 54.04%.
3.4.4. Data Homogeneity
The above analysis is the result of the multiple linear regression statistical procedure, which necessitates verifying data homogeneity. This can be observed in
Table 13, which presents the output of the variance homogeneity test conducted using Levene’s statistic. This test determines whether the observed differences in variance can be considered significant or are merely due to random sampling.
Levene’s test evaluates the null hypothesis that population variances are equal (referred to as variance homogeneity or homoscedasticity). If the resulting p-value from Levene’s test is below a certain significance level (typically 0.05), the observed differences in sample variances are unlikely to have arisen from random sampling in a population with equal variances.
In the case of
Table 13, since the significance value is greater than 0.05, it is concluded that the assumption of variance homogeneity is not violated. In other words, the data samples for the variables exhibit similar behavior regarding variability or dispersion.
3.4.5. Correlational Analysis
As shown in
Table 14, the relationships were measured using Pearson’s correlation coefficient (r), which quantitatively expresses the magnitude and direction of the relationship. The coefficient can range from −1 to +1, with its sign indicating the direction (positive or negative). The larger the number, the stronger the relationship between variables. Therefore, Pearson’s r is a measure of the degree to which paired scores occupy the same or opposite position within their respective distributions. However, Pearson’s r coefficient also has a second interpretation, as it can be expressed in terms of the variability of Y explained by X.
Based on the explanation above, the most significant relationships (those with the highest values in Pearson’s correlation coefficient, r) are extracted to implicitly explain the level of the relationship between variables.
The most significant correlation is found between the variables “increment in process performance” and “client satisfaction”, with a value of r = 0.903, indicating that improvements in process performance result in an increase in client satisfaction.
The second correlation worth highlighting is between the variables “maturity level” and “Focus on the client”, showing that the more mature the quality management system (QMS) is, the stronger the tendency to have a greater focus on the client, with a value of r = 0.820.
The third correlation to emphasize is “increment in income”, which is linked to the increase in sales, with a value of r = 0.743. This is evident as higher sales numbers result in higher reported income.
The next notable relationship, with a value of r = 0.541, is between the variables “increment in client satisfaction” and “increment in income”, derived from the effect of improving client satisfaction on increasing income generated from sales.
3.5. Is There a Difference in the Benefits Observed Between Business Sectors?
This research focused on determining whether the benefits obtained from ISO 9001 certification are equivalent between the public and private sectors. To achieve this, a multivariate analysis was conducted using Hotelling’s T2 test, which allows for the simultaneous comparison of multiple related variables. This analysis, implemented in NCSS 2019 software, compared key variables, such as the number of employees, organization tenure, years with the QMS, quality coordinator tenure, certification motivation, and income increase.
Hotelling’s T
2 test enables the simultaneous evaluation of multiple indicators (as applied in this study to QMSs, see
Figure 2), providing a more precise and comprehensive assessment of a Quality Management System’s performance. While this statistical method has been extensively applied in fields such as biomedicine and statistics, its use in the domain of quality and process management, specifically in evaluating QMSs under the ISO 9001 standard, represents an innovative approach.
The results provided statistically significant evidence to confirm whether differences exist between the sectors by evaluating the multivariate means of both economic categories. This approach identified notable variations in the reported benefits, emphasizing the utility of the multivariate method in analyzing the complexity of the collected data. Upon executing the test in the cited software, the descriptive statistics were obtained as outlined in
Table 15.
Table 14 presents the means and standard deviations of the seven main variables in this study. However, unlike the demographic statistics analyzed in
Figure 3,
Figure 4,
Figure 5,
Figure 6 and
Figure 7, the behavior of each variable is stratified by economic sector, as follows.
The comparison between the public and private sectors revealed key differences in the variables analyzed. Regarding the number of employees, the private sector doubles the public sector, representing the majority of certified organizations with an average of 197 employees. Concerning organizational tenure, public entities average 28 years, exceeding the 20 years reported for the private sector. For quality coordinator tenure, the public sector averages 11 years, almost double the 6 years of the private sector.
The reasons for certification show similar behavior across both sectors: client requirements and process improvement predominate, with congruent frequencies in the tabulated averages. Lastly, income increase shows a slight advantage for the private sector (45) compared to the public sector (40), confirming that both sectors experience tangible benefits from implementing Quality Management Systems.
The results of Hotelling’s T
2 test are detailed in
Table 16.
The table presents the results of Hotelling’s T2 test, considering two scenarios: equal and unequal variance–covariance matrices. Although the difference between the T2 values (20.62 and 21.61) is due to the unequal sample sizes (29 and 16), both cases meet the necessary assumptions, as the significance levels (0.016 and 0.022) are below 0.05. This confirms that the mean vectors of the two groups analyzed (public and private sectors) are different, with 95% confidence.
Variables Extraction and Monte Carlo Simulation
Additionally, the randomization test, performed with 10,000 Monte Carlo simulations for greater accuracy, was also significant (0.011 and 0.012), supporting the validity of the results even without fully random sampling.
Explaining Hotelling’s T
2 test model for the previously mentioned group of variables raises the same question as in the previous subsection: is this combination of variables the most optimal for comparing both economic sectors? The answer can be observed in
Table 17, summarized as follows.
As observed, the results of the Hotelling T2 tests for variable extraction exhibit the same behavior as the original test, except for the model where the variable Reason for Certification is removed. In that case, the tested model shows a higher probability level (greater than 0.05), indicating that the sectors align only in the Reason for Certification. Conversely, the optimal model is achieved by removing the variable SGC seniority, as it presents the lowest test values (0.15 and 0.18). This allows us to confidently state, with 95% reliability, that there are differences in the behavior of variables between the two analyzed sectors, concluding that the reason for seeking certification is the primary cause of such variations.
As a summary of this section, it is worth highlighting the verification of the four research hypotheses, where significant statistical evidence was found to support that sales, process performance, income, and customer satisfaction experienced increases greater than 20% in quality management systems certified under the ISO 9001 standard. Additionally, the demographic analysis emphasized the importance of quality system approaches, observing that within economic sectors, the public sector prioritizes improving processes, while the private sector focuses on increasing sales (both considered as benefits identified in this study).
Finally, the relationship between variables is emphasized, with system maturity, process improvement, and satisfaction being the factors that most contribute to the increase in benefits within a system, as opposed to the size of the organization, its longevity, or the quality coordinator.
4. Discussion
Quality systems, introduced in the 1980s, experienced gradual development in their early years, primarily confined to European organizations. Their widespread adoption saw exponential growth with the release of the 1994 ISO 9001 standard, coinciding with the formation of the European Union. This expansion initially occurred in the strongest economies and later reached countries with smaller trade balances. Originating as a standard from England, it has evolved into the most widely applied global standard, with over 1,380,000 certifications issued. The growing influence of the ISO standard is also evident in the increasing number of internationally published articles and studies.
From the beginning, early revisions of the ISO 9000 standard focused on achieving customer satisfaction, which has consistently been its central objective. The 2000 revision marked a pivotal moment with the introduction of a process-based approach, extending its benefits beyond customer satisfaction to include process improvement and enhanced performance. The 2008 update brought only minor adjustments, maintaining the same goals, yet during this period, less tangible benefits became evident, raising questions among organizations about their practical value. Notably, Spanish researchers made substantial contributions to the literature, with most studies concentrated on the Iberian Peninsula. It would be valuable to explore whether this emphasis is connected to European economic crises or other underlying factors.
One notable fact is that the ISO 10014 standard, “Financial Benefits”, has not been widely utilized by quality management systems. Although this may be due to its non-contractual nature (i.e., it does not offer certification), its dissemination and implementation are recommended, as it enables better financial performance for QMSs.
As derived from the above, the global benefits observed can be grouped into four categories: (a) process improvement, (b) customer satisfaction, (c) increased sales, and (d) increased income.
The prioritization of benefits tends to shift over time with revisions to the standards, reflecting changes in their frequency of occurrence. The upcoming 2026 version is expected to enhance these benefits further. By integrating considerations related to global warming, quality systems will likely adopt a broader focus on overall system performance, addressing not just the primary customer but also aligning with the organizational context in which they operate.
The companies included in this study reported conclusive benefits from the implementation and certification of the standard, particularly in the areas of sales growth, customer satisfaction, and process improvement. These areas showed improvements exceeding 20% in the institutions and organizations analyzed, highlighting the importance of the standard in our region. The findings align with international studies and the observations outlined above.
It was also observed that the certified companies have an increase in their RQ4 revenues, and several equations were simulated to answer this question, highlighting the following model:
Reflecting on the question of what drives organizations to seek ISO 9001 certification, and what are the typical benefits and advantages these organizations observe when implementing a QMS under the ISO 9001 standard, the correlational analysis revealed that an organization’s economic sector is not a decisive factor in attaining the reported benefits. However, it does shape the system’s focus. Public institutions emphasized process improvement and customer satisfaction, whereas private organizations prioritized increasing income and sales.
The correlation coefficients showed a strong relationship between “process performance improvement” and “customer satisfaction” (r = 0.903), and between “QMS maturity” and “customer focus” (r = 0.820). These results supported the initial hypotheses and served as the basis for the regression models presented. In addition, the multiple regression model identified the following significant relationships.
“Process performance improvement” has a direct impact on “customer satisfaction”, confirming its relevance as a key variable.
The “increase in sales” is significantly associated with the “increase in revenue” (r = 0.743), showing that higher sales volumes contribute directly to financial success.
The findings show that the success of QMSs depends significantly on system maturity, which drives key variables, such as process improvement, customer satisfaction, and revenue growth. These results, obtained through regression analysis, support the initial hypotheses and provide a clear view of industry differences. In addition, the initial correlation coefficients confirmed the strong relationship between key variables, reinforcing the importance of a holistic approach to quality management.
Opportunities Derived from This Research
The first area of opportunity pertains to the revisions of the standard. Work on ISO 9001:2026 has already begun, yet the consensus benefits from the 2015 version have not been fully published. It would be beneficial to allow these systems to mature and investigate two related aspects: first, whether organizations maintained certification, and second, whether the observed benefits are more impactful than those reported in this study.
The second area concerns the inclusion of risk analysis within QMSs, which generated high expectations by replacing preventive actions with a detailed risk analysis framework. This approach evaluates the effects of uncertainty in a QMS, including probability, severity, and occurrence analyses. However, such studies will also require at least two years for QMSs to mature under this new framework.
5. Conclusions
In the present research, Hotelling’s T2 test was applied to analyze the benefits derived from the implementation and certification of a Quality Management System based on the international standard ISO 9001 in certified organizations in north-central Mexico. The analysis made it possible to evaluate the compliance with the benefits promoted by the international standard and to determine the causal relationship between various variables of interest. The main findings are presented below:
Referring to the research objectives, it was confirmed that the implementation and certification of a QMS fosters the generation of benefits promoted by the ISO 9001 standard, including significant improvements in internal processes, customer satisfaction, and increased sales and revenue. These results highlight the relevance of adopting a structured approach to quality management. Related to the main research question, the factors that drive organizations to achieve ISO 9001 certification and the most common benefits associated with its implementation were explored. The benefits identified included process improvements, increased customer satisfaction, increased sales, and increased revenues, showing a positive correlation between certification and organizational performance.
In relation to RQ1, the general hypothesis stated that certification under ISO 9001 facilitates the increase in the indicators promoted by the standard in organizations in the center of the country. The results confirmed this statement, observing significant quantitative increases in the performance indicators. Specifically, the following were highlighted: Hypothesis 1: the implementation of the QMSs increased the internal performance of processes by an average of 49%. Hypothesis 2: customer satisfaction increased by an average of 37%. Hypothesis 3: the total sales increased by an average of 51%. Hypothesis 4: the overall revenue increased by an average of 43%.
RQ2. Through the regression and correlational analysis of dependent and independent variables, a significant correlation was identified between process performance improvement and customer satisfaction (r = 0.903). In addition, a significant relationship was found between QMS maturity and customer focus (r = 0.820). A predictive model was developed to identify the variables with the greatest impact on revenue growth. The model revealed that increased sales and customer satisfaction are the main factors contributing to this indicator.
RQ3. The analysis using Hotelling’s T2 test was able to identify significant differences between the public and private sectors in terms of motivations for certification and revenue growth. These differences were mainly attributed to organizational motivations, with the search for competitive advantages being more pronounced in the private sector.
As a final reflection, the results of this study underline the importance of ISO 9001 certification as a tool for continuous improvement and obtaining concrete organizational benefits. Organizations that invest in the implementation and certification of a QMS can expect significant increases in their performance. In the present study, the application of Hotelling’s T2 test was determined to analyze the benefits derived from the implementation and certification of a Quality Management System (QMS) based on ISO 9001 in organizations in central Mexico.
This study provides empirical evidence on the benefits of ISO 9001 and establishes a basis for future research that delves into the sectoral and regional impacts of certification. This analysis also emphasizes the need to integrate advanced management and evaluation tools, such as Hotelling’s T2 test, to identify significant patterns in organizational behavior. The application of these methodologies allows for not only the validation of the hypotheses, but also the generation of predictive models useful for strategic decision making.
Finally, this work contributes to the understanding of how sectoral differences can influence the implementation of quality systems and the benefits derived from them. The information obtained constitutes a valuable resource for organizational leaders to design strategies tailored to their specific needs and maximize the return on investment in their quality management systems.


 ,
, 


