


Abstract
Climate variability and growing competition for limited water resources have made the operation of cascade reservoirs increasingly complex. This study develops a comprehensive system-based multi-objective optimization and evaluation framework that simultaneously integrates five goals: power generation, water supply, ecological protection, navigation reliability, and flood control as a constraint. The framework employs the NSGA-III evolutionary algorithm to address the high-dimensional optimization problem and combines Analytic Hierarchy Process (AHP), Entropy Weight Method, and TOPSIS to integrate subjective expertise with objective data in the evaluation of alternatives. Applied to the lower Jinsha River cascade under wet, normal, and dry hydrological scenarios, the model reveals distinct conflicts between hydropower and ecological or navigational requirements, partial synergies between hydropower and water supply, and tension between ecological and supply demands. Hydrological variability alters these relationships, with wet years intensifying conflicts and dry years heightening supply and ecological pressures. Functional differentiation among reservoirs is also evident, with Baihetan and Xiluodu showing pronounced power–ecology tensions, while Xiangjiaba primarily supports supply and navigation. The study not only advances the theory of multi-objective decision-making in water resources systems but also offers actionable guidance for sustainable reservoir governance and regional development.
1. Introduction
1.1. Background
The growing shortage of global freshwater is largely attributed to climate shifts and intensified anthropogenic pressures, necessitating enhanced water resources management [1]. Improper management can lead to crises within river basins and may even push countries to the brink of disaster [2]. Globally, water resources management is primarily implemented through cascade reservoir systems [3]. As a crucial method for regulating water resources, cascade reservoirs facilitate the rational distribution of limited water across multiple demand sectors and optimize their comprehensive benefits. However, these benefits often compete with one another, which poses considerable complexity to achieving coordinated management across multiple operational objectives for cascade reservoirs.
1.2. Literature Review
Flood control and hydropower generation have historically been the dominant objectives in reservoir operation [4,5]. With climate variability intensifying, flood risks have become more frequent and less predictable. Reservoir infrastructure plays a central role in attenuating flood peaks and reducing the likelihood of catastrophic losses [6,7,8]. The allocation of flood storage capacity is particularly critical during the wet season, and recent methods have incorporated Copula functions and multi-objective robust optimization to assess upstream–downstream flood risks systematically [9]. In contrast, during the non-flood season, operational priorities often shift toward maximizing hydropower generation, as reservoirs are essential for meeting regional electricity demand. Machine learning-assisted approaches, such as Gaussian Mixture Models (GMMs) and Gradient Boosting Regression Trees (GBRTs), have been used to better forecast inflows and allocate water for power generation [10]. To explicitly account for uncertainty between flood safety and energy benefits, a two-layer hedging robust optimization (TL-HRO) model has been developed, enabling improved trade-offs under stochastic conditions [11]. These studies illustrate the inherent tension between flood safety and hydropower production, and the necessity of optimization methods that account for uncertainty and risk.
Simultaneously, the operation of reservoirs must also account for downstream navigation demands. Insufficient discharge can compromise the navigability of waterways, whereas excessive discharge may endanger ship safety. The Multiple Uses Water Optimization System (MUWOS) model, which constructs a navigation suitability function and a hydrological scenario library, has proven effective in reducing navigation risks under various water level conditions [12]. Additionally, short-term operation optimization based on the Normalized Normal Constraint Mixed Integer Linear Programming (NNC-MILP) framework, combined with an improved weighted TOPSIS method, has successfully balanced trade-offs conflicts among peak regulation, power output, and navigation objectives [13]. More advanced methods, such as the Integrated Decision-making Method based on Multilevel Subspace Domination (IDMSD) approach, have employed data-driven techniques to achieve intelligent coordination among power generation, ecological protection, and navigation objectives [14]. These developments indicate that navigation has gained increasing attention in reservoir operation research, though integration with other objectives remains methodologically challenging.
Ecological considerations have also emerged as a key concern in reservoir management. Reservoir operations substantially alter natural flow regimes and impact ecological processes, including aquatic habitat maintenance and fish spawning. To address these challenges, recent studies have proposed various approaches that attempt to balance ecological requirements with socio-economic objectives. The introduction of the guarantee rate of ecological water (GREW) index provides a novel approach to addressing the trade-off between socio-economic benefits and ecological water demand [15]. The improved epsilon multi-objective ant colony optimization for continuous domain algorithm (ε-MOACOR) simultaneously optimizes the power output, the maintaining ecological flow standards, and controlling water temperature levels, thereby significantly mitigating the conflict between economic benefits and ecological protection [16]. Empirical studies using the Multi-objective Cooperation Search Algorithm (MOCSA) have further illustrated the dynamic conflict and cooperation between power generation and ecology objectives, with their non-dominated solution set effectively reflecting hydrological dynamics [17]. Ecological conservation efforts have also incorporated fish diversity models into operation optimization frameworks, resulting in a significant reduction in biodiversity loss [18]. Despite this growing body of research, explicit integration of ecological objectives into multi-objective optimization frameworks remains relatively limited, particularly for large cascade reservoir systems where operational complexity and trade-offs among multiple goals are more pronounced.
Water supply further complicates reservoir operation, especially in regions facing water scarcity. Stable provision of irrigation and urban-industrial water is a rigid demand, particularly during drought years. Over-releasing water for power generation may reduce storage required for dry seasons, while overly conservative strategies compromise peak energy supply. As a result, water supply objectives must be carefully balanced against flood control, energy, and ecological requirements. The long-term sustainability of regional water systems depends on effective “storage and replenishment” strategies, and recent studies employing parallel optimization algorithms and fuzzy evaluation methods have highlighted the conflicts and conversion paths among water, energy, and ecological goals in cascade systems [19]. Nevertheless, integrated models that explicitly incorporate water supply alongside other objectives remain relatively limited.
The conflicts between these objectives reflect the complexity of cascade reservoirs operation: flood control requires lowering water levels, but premature discharge can waste power generation resources; power generation may threaten water supply safety; and ecology objectives depend on natural flow fluctuations, while navigation requires stable flow. Hence, operating cascade reservoirs involves more than pursuing a single goal—it demands adaptive coordination across diverse, and often competing, objectives.
Achieving optimal performance in cascade reservoir scheduling under diverse goals entails tackling a complex optimization challenge that is dynamic in nature, nonlinear in structure, and defined over a high-dimensional solution space [20]. Traditionally, multi-objective problems were typically simplified into single-goal models and addressed through mathematical optimization techniques, including linear, nonlinear, and dynamic programming [21,22,23,24]. However, these traditional algorithms perform inadequately in this context. In recent years, Multi-Objective Evolutionary Algorithms (MOEAs) have attracted considerable research interest for their strong performance in convergence behavior and their ability to produce well-distributed Pareto-optimal solutions [25]. Algorithms such as MOEA/D [26], SPEA [27], and NSGA-II [28] have been widely applied in reservoir operation optimization [29,30,31]. There is no lack of improved algorithms that have been proposed and applied to multi-objective operation optimization of reservoirs, such as the adaptive sine cosine algorithm (ASCA) [32], the adaptive differential evolution with particle swarm optimization (A-DEPSO) algorithm [33], the weight optimization framework with Non-dominated Sorting Genetic Algorithm II (WOF-NSGA-II) [34], the improved multi-objective shuffled frog leaping algorithm (IMOSFLA) [35], the improved multi-objective sparrow search algorithm (IMOSSA) [36]. However, as the number of objectives increases, especially with high-dimensional optimization problems (where objectives ≥ 4), these multi-objective evolutionary algorithms show insufficient solution diversity and uniformity in distribution. To address these limitations, the NSGA-III algorithm, which incorporates a reference-point mechanism, enhances the distribution characteristics of solutions, making it particularly suited for high-dimensional multi-objective optimization problems [37].
1.3. Research Contributions
Although these studies contribute useful perspectives and techniques for improving how cascade reservoirs are managed under multiple objectives, their applicability remains limited. Most of the studies only focus on the balance between some of the objectives, failing to comprehensively consider the synergistic operation of the five objectives of flood control, power generation, water supply, ecology and navigation. To address the challenge, this paper proposes a multi-objective optimization and evaluation framework, with the following main contributions:
(1) Comprehensive objective coverage. A unified optimization framework is established to simultaneously incorporate five objectives—flood control, power generation, water supply, ecological protection, and navigation—whereas most existing studies consider only a limited subset.
(2) Consistent integration of optimization and evaluation. The NSGA-III algorithm is adopted to solve the high-dimensional (five-objective) optimization problem, and an AHP–Entropy–TOPSIS evaluation model is integrated to support scheme selection. Although each method is well established, their systematic integration provides a coherent decision-support process from Pareto-solution generation to final alternative identification.
(3) Empirical insights into multi-objective conflicts. The proposed framework is applied to the lower Jinsha River cascade, demonstrating its effectiveness in reconciling economic efficiency, ecological protection, and navigation and water-supply demands. Through Pareto-front analysis and multi-scenario comparisons across wet, normal, and dry years, the framework reveals characteristic conflict patterns and potential synergies among the five objectives, offering reference for practical reservoir management.
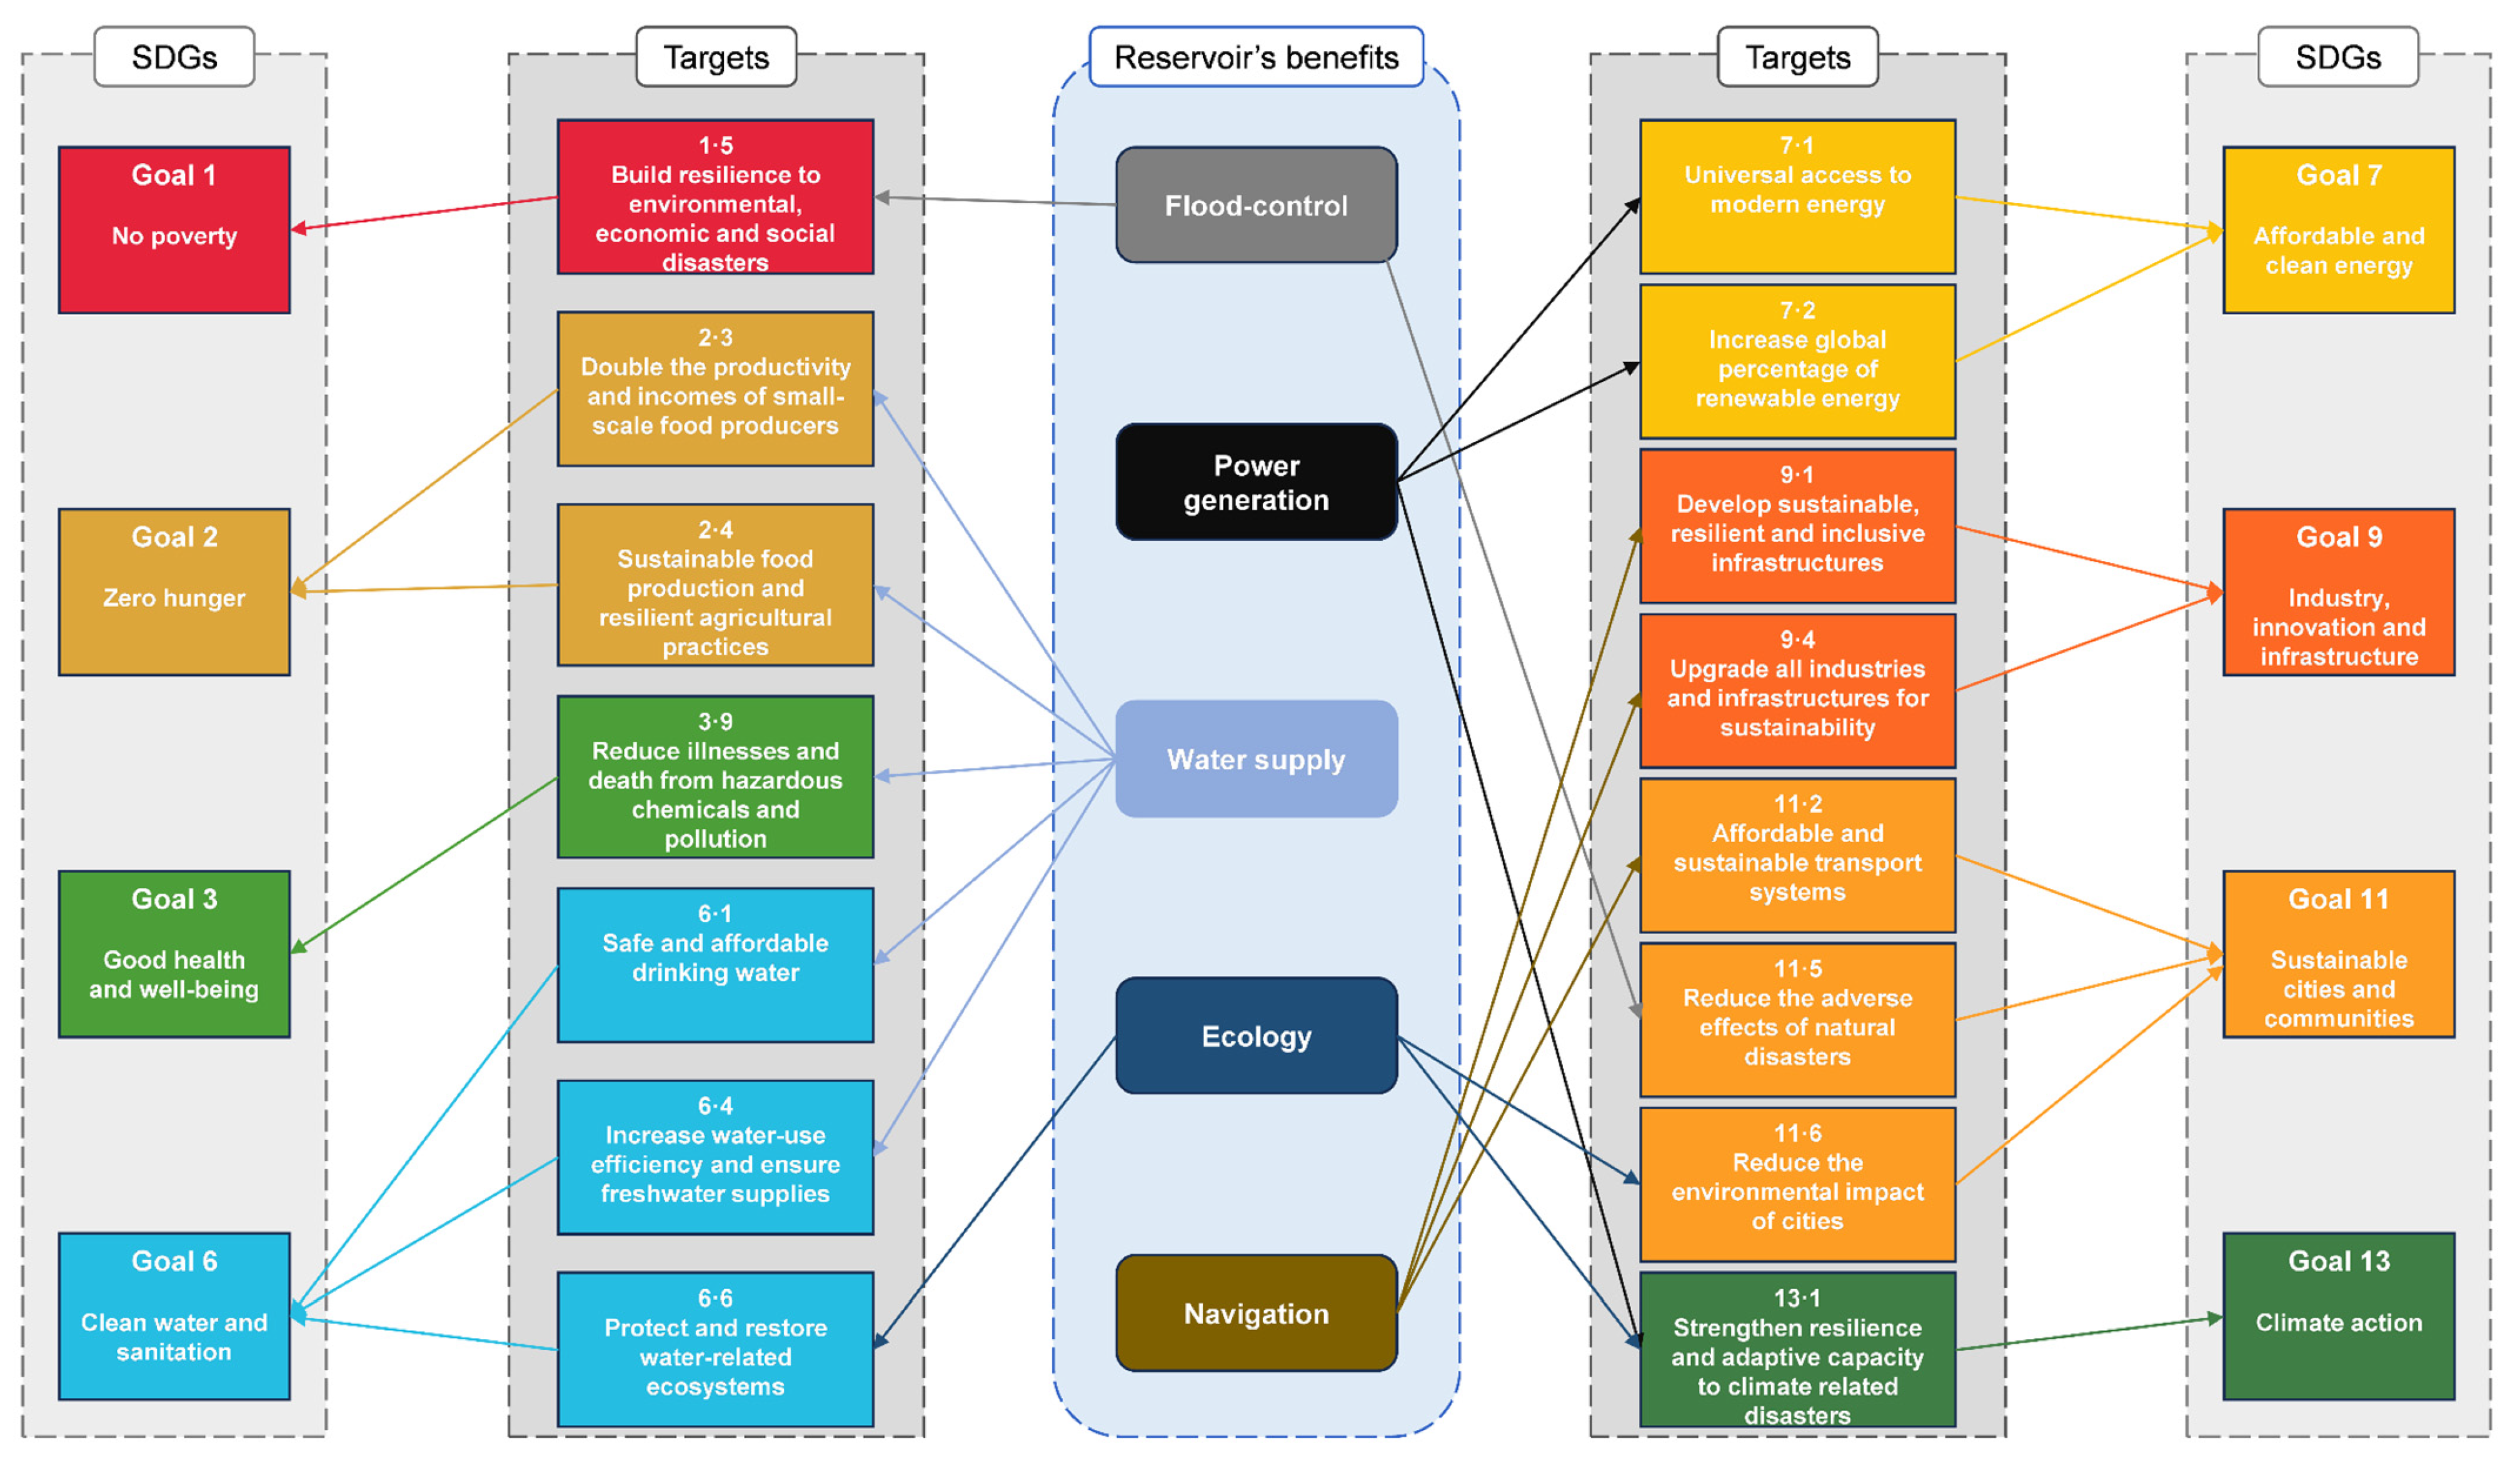
Collectively, these contributions provide actionable decision-making tools for sustainable river basin governance, contributing to sustainable development goals (Figure 1).
Figure 1.
SDGs to which the benefits of reservoir operation contribute.
1.4. Research Design
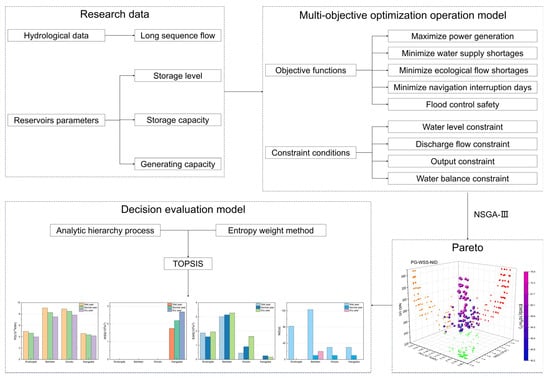
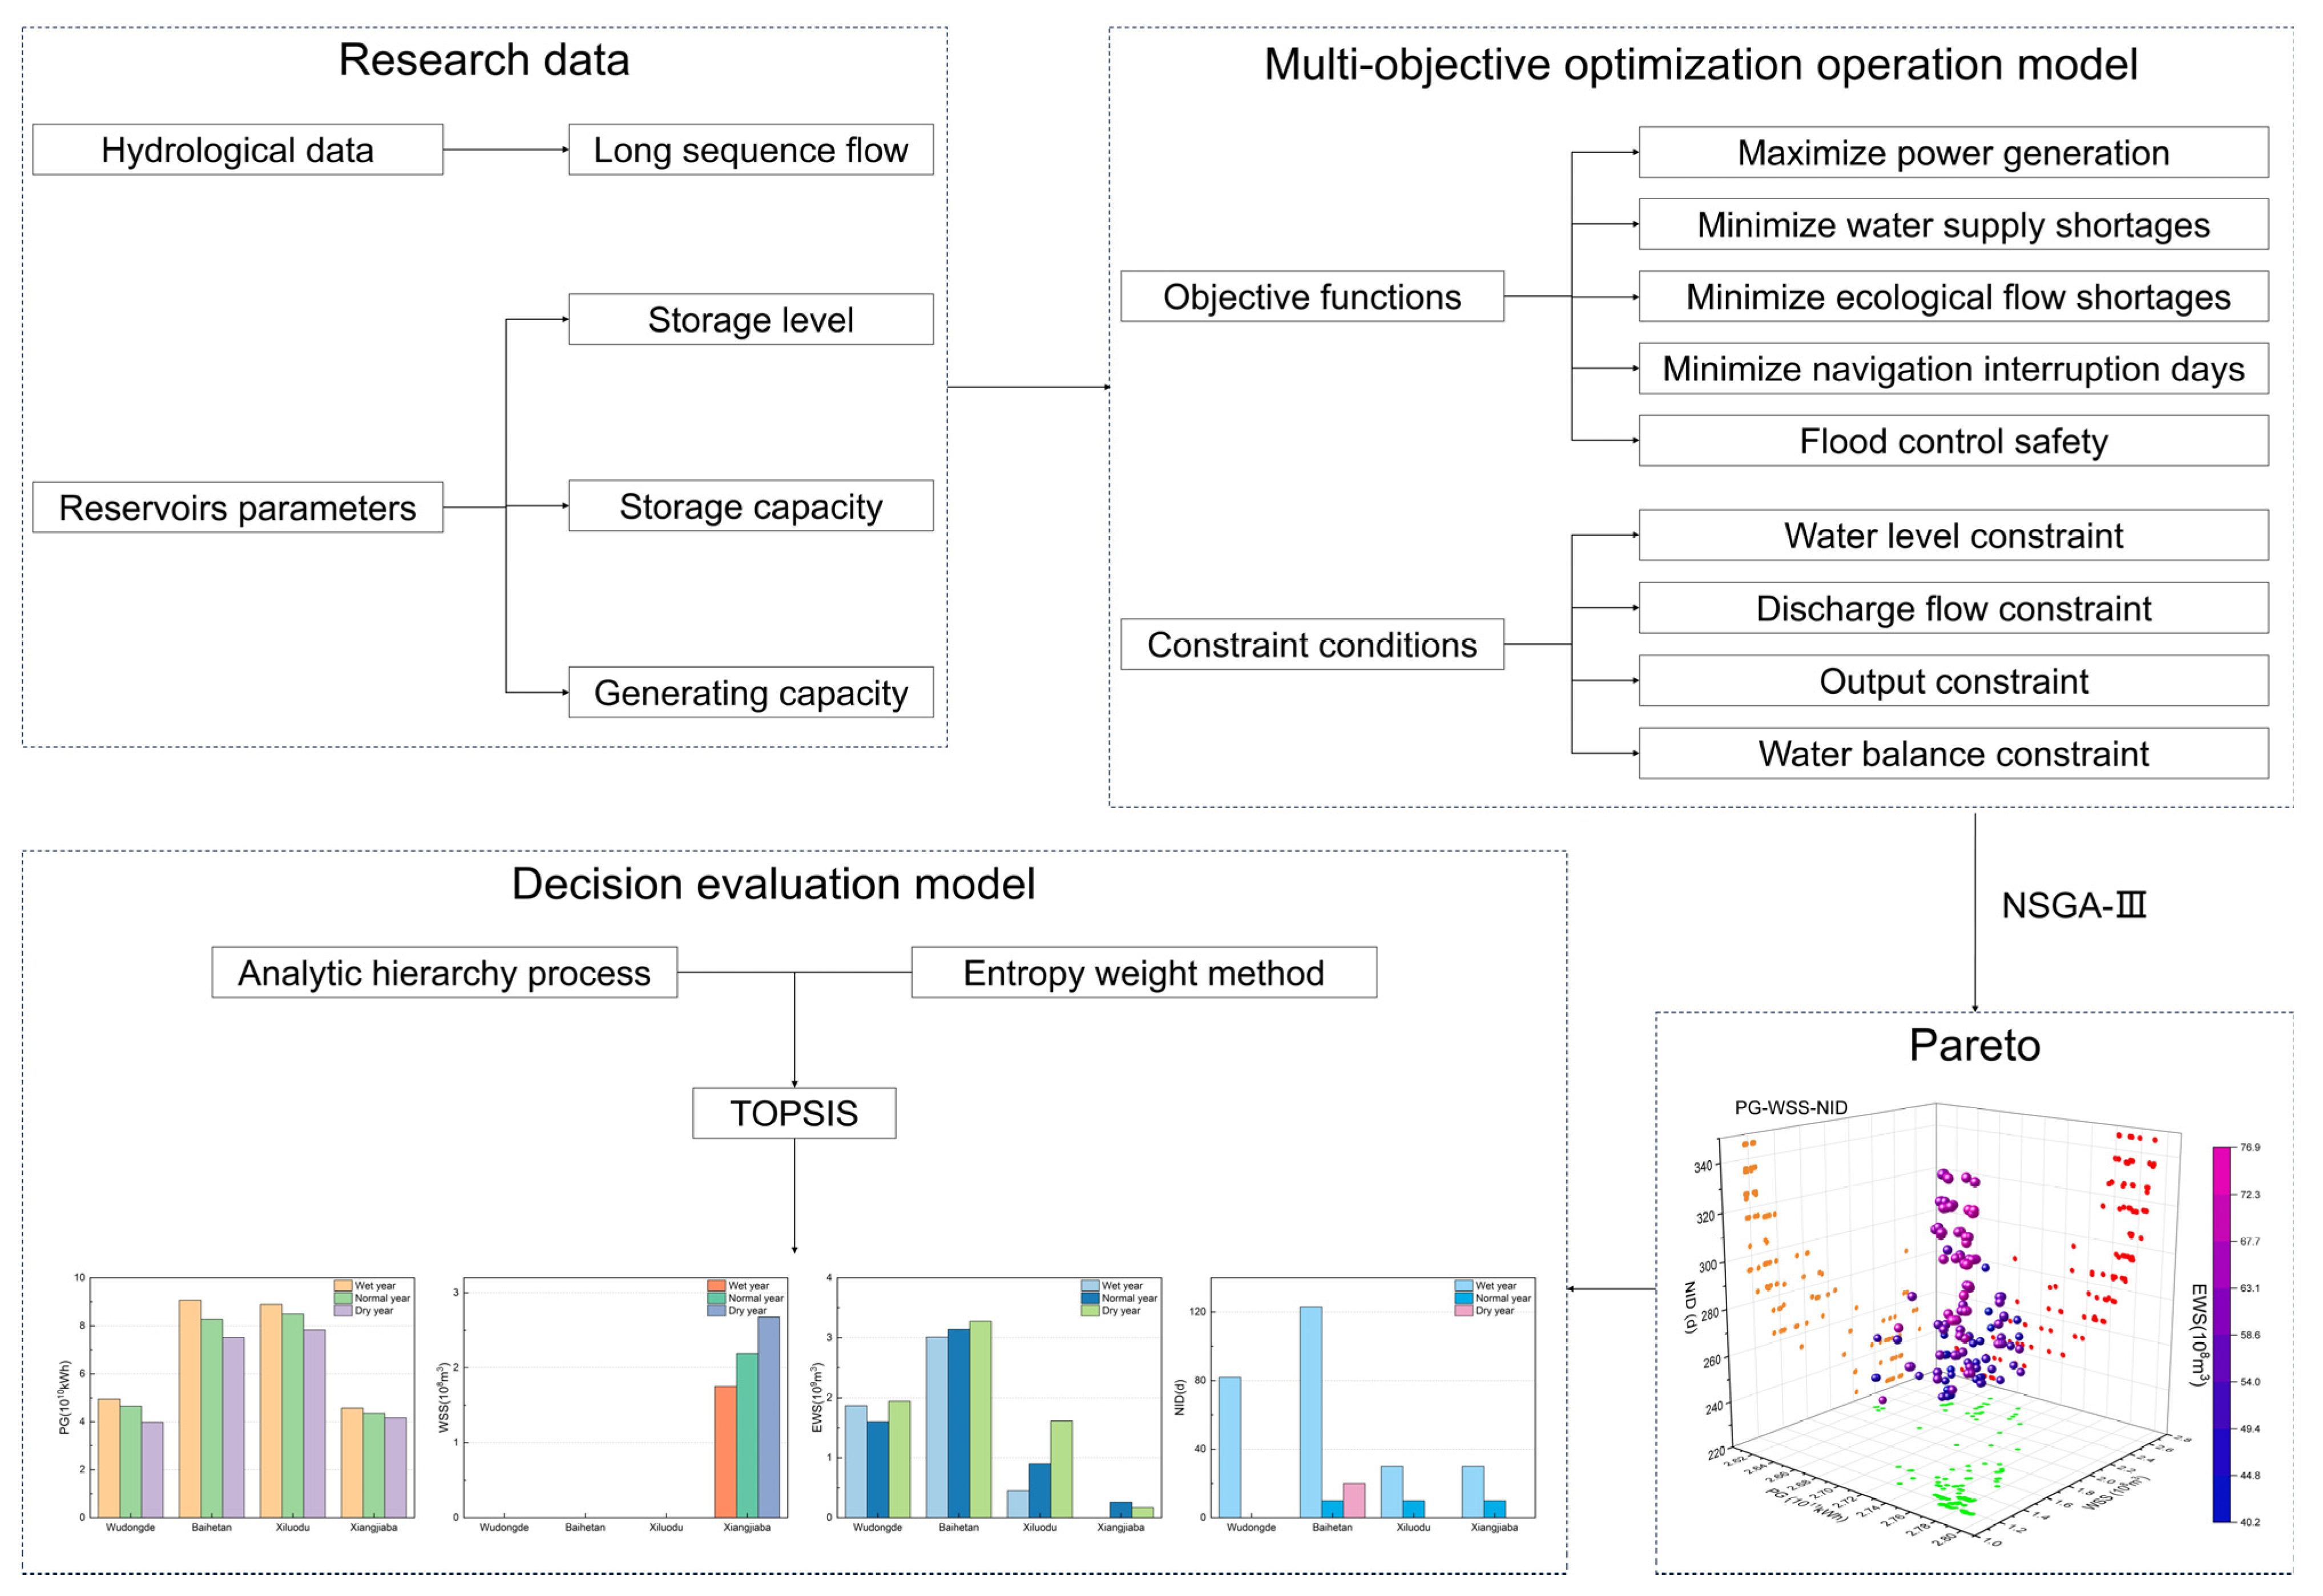
As illustrated in Figure 2, the overall design of this study consists of five main stages: (1) defining the research objectives and identifying the key operational goals of the cascade reservoir system, including power generation, water supply, ecological protection, navigation, and flood control; (2) preparing and processing the multi-source datasets, including hydrological inflows, water demand, ecological flow thresholds, and navigational flow limits; (3) constructing the multi-objective optimization model to represent the trade-offs among competing objectives; (4) employing the NSGA-III evolutionary algorithm to solve the high-dimensional optimization problem and obtain the Pareto-optimal solution set; (5) evaluating and selecting the most balanced operational schemes using a combined AHP–Entropy–TOPSIS decision-making framework. The workflow ensures that the model formulation, computation, and evaluation are closely connected, forming an integrated analytical process for sustainable reservoir operation and decision support.
Figure 2.
Research design and methodological workflow for the multi-objective optimization of the lower Jinsha River cascade reservoirs.
The remainder of this paper is organized as follows. Section 2 presents the multi-objective optimization model, solution algorithm, and evaluation approach. Section 3 introduces the case study and data. Section 4 reports the optimization and comparison results. Section 5 highlights the management implications derived from the findings and future research. Section 6 concludes the paper.
2. Methodology
To maintain a clear logical structure, this section presents the overall methodological framework before the case-specific application. The methodology is organized to establish a generalizable modeling and solution process that can be adapted to different cascade reservoir systems. It begins by formulating a multi-objective optimization model that integrates multiple operational goals, followed by the application of the NSGA-III algorithm for high-dimensional solution search, and finally, the incorporation of a hybrid evaluation approach that combines subjective and objective weighting methods. This structure ensures that the theoretical foundation, computational strategy, and decision evaluation are clearly articulated prior to the demonstration of results.
2.1. Multi-Objective Optimization Model for Cascade Reservoirs
2.1.1. Objective Functions
This study considers multiple goals in the modeling process, covering flood control, power generation, water supply, ecology, and navigation. Fine-grained flood control operation typically requires time steps on a daily or even smaller scale; however, this conflicts with the time step used in this study. Moreover, incorporating fine-grained flood control operation would significantly increase the dimensionality of the variables, substantially raising the computational complexity. To reduce complexity, this study treats flood management requirements as hard constraints, stipulating that each reservoir uphold designated safety levels throughout the flood period. This approach preserves flood defense effectiveness while simplifying the model-solving process.
Objective 1: Power generation (PG)
Power generation is the primary way through which reservoirs contribute to economic growth. Therefore, this model aims to achieve the highest possible hydropower generation efficiency throughout the cascade system.
where M denotes the total number of reservoirs; T represents the total number of periods; is the comprehensive output coefficient of the hydropower station . is the average head of the hydropower station . in time period . is the generation flow of the hydropower station in time period . is the period length.
Objective 2: Water supply shortages (WSSs)
The reservoirs supply water to the water-demanding areas, and the supply may be less than the demand. Therefore, the objective is to minimize the water deficit in the water-demanding areas.
where is the required water supply flow for water-demanding areas from the hydropower station in time period ; is the actual water supply flow from the hydropower station in time period .
Objective 3: Ecological water shortages (EWSs)
Reservoir operations alter the natural habitat of fish, and the discharge flow may be less than the ecological flow threshold required for fish. Therefore, the objective is to minimize the ecological flow deficit.
where is the ecological flow of the hydropower station in time period ; is the discharge flow to downstream of the hydropower station in time period .
Objective 4: Navigation interruption days (NIDs)
The magnitude of the reservoir’s downstream flow affects navigation, with suitable navigable flow having both upper and lower limits. Flows outside this range are considered as navigation interruptions. Therefore, the objective is to minimize the number of days of navigation interruption.
where is the number of days when the discharge flow of the hydropower station exceeds the upper limit of navigable flow and is lower than the lower limit of navigable flow in time period ; is the lower limit of navigable flow of the hydropower station in time period ; is the upper limit of navigable flow of the hydropower station in time period .
2.1.2. Constraints
The model follows the following constraints:
Constraint 1: Water level constraint
where is the lower limit of water level of the reservoir in time period ; is the water level of the reservoir in time period ; is the upper limit of water level of the reservoir in time period .
Constraint 2: Discharge flow constraint
where is the lower limit of discharge flow of the reservoir in time period ; is the discharge flow of the reservoir in time period ; is the upper limit of discharge flow of the reservoir in time period .
Constraint 3: Output constraint
where is the lower limit of power output of the hydropower station in time period ; is the output of the hydropower station in time period ; is the upper limit of power output of the hydropower station in time period .
Constraint 4: Water balance constraint
where is the final storage capacity of the hydropower station in time period ; is the initial storage capacity of the hydropower station in time period ; is the inflow of the hydropower station in time period .
2.2. Algorithm for Solving Multi-Objective Optimization Model
In solving the multi-objective optimization operation problem, a solution strategy based on a multi-objective evolutionary algorithm is adopted due to the complexity of the operation problem itself and its multi-objective nature. In this study, the selected solution algorithm is the Non-dominated Sorting Genetic Algorithm III (NSGA-III), which is particularly suitable for handling high-dimensional optimization problems [37]. The optimization of cascade reservoir systems in this research involves four conflicting objectives—power generation, water supply shortages, ecological water shortages, and navigation interruption days—while flood control is treated as a hard constraint. Such high-dimensional conflicts make it difficult for conventional algorithms like NSGA-II or MOEA/D to maintain both convergence and diversity of solutions.
Compared with NSGA-II, which relies solely on crowding-distance sorting, NSGA-III introduces a reference-point-based selection mechanism that distributes Pareto-optimal solutions more evenly across the objective space, avoiding clustering in low-dimensional subregions. This property is particularly advantageous for exploring trade-offs among multiple non-commensurate objectives in reservoir systems, where balanced and well-dispersed solutions are essential for decision analysis.
Compared with MOEA/D, which decomposes a multi-objective problem into a set of scalar subproblems, NSGA-III does not require prior specification of weight vectors and is therefore less sensitive to weight initialization—a useful feature in problems with heterogeneous objective scales and uncertain hydrological variability.
Consequently, NSGA-III provides both better convergence stability and solution diversity for the high-dimensional, scenario-dependent optimization context of the lower Jinsha River cascade system. The procedural framework of NSGA-III applied herein is detailed below.
(1) Population initialization: A group of N candidate individuals is generated, where each individual in the population represents a feasible solution. These solutions are composed of randomly generated operation schemes that satisfy the constraint conditions.
(2) Objective function calculation: The performance of each candidate solution is assessed using the four established objective functions.
(3) Non-dominated sorting: The individuals are sorted according to the Pareto dominance relationship through non-dominated sorting. Each individual is evaluated by counting how many others dominate it, and ranks are then assigned accordingly, with the lowest-rank group forming the Pareto optimal solutions.
(4) Reference point generation and assignment: To enhance the diversity of solutions, NSGA-III introduces predefined reference points to guide the distribution of solutions during the evolution process. The reference points are generated in a predefined manner and are used to evenly distribute the solution set across the objective space.
(5) Crossover and mutation operations: Simulated binary crossover and polynomial mutation operations are applied to produce a new candidate set of solutions. These operations ensure the diversity of solutions within the search space and also help discover new, better solutions.
(6) Environmental selection: The parent and offspring populations are combined, followed by the application of non-dominated sorting to identify candidates for the next generation. In the selection process, individuals with higher ranks are prioritized, and the reference point distribution is utilized to preserve solution diversity within the population.
(7) Termination condition: The algorithm stops when the maximum number of generations or the convergence condition for the objectives is met. In this study, the maximum number of generations is set to ensure both computational efficiency and solution quality.
2.3. Decision Evaluation Model
In response to the challenges posed by multi-objective optimization, this study adopts a decision evaluation model that combines both subjective and objective weighting. The aim is to balance expert experience with objective data, thereby enhancing the scientific and rational nature of the decision-making process. This method integrates subjective and objective weights through comprehensive calculation, ensuring the rational allocation of decision weights, and is applied in the final evaluation and decision-making process.
2.3.1. Analytic Hierarchy Process
Subjective weighting is determined using the Analytic Hierarchy Process (AHP), which combines both quantitative and qualitative approaches for multi-objective decision-making. AHP fundamentally decomposes a complex decision problem into a hierarchical structure, with each level representing a decision factor. By constructing a judgment matrix, decision-makers can compare objectives in pairs to assess their relative significance, and subsequently derive weight coefficients through the eigenvector method [38]. The AHP method helps integrate expert experience and subjective judgment, making it particularly suitable for addressing subjective factors within decision scenarios that resist straightforward quantification [39].
(1) Construct the judgment matrix: According to expert evaluations regarding the comparative significance of each objective, construct the judgment matrix , where represents the importance of objective relative to objective .
(2) Calculate the weight vector: The judgment matrix is standardized, and the subjective weights of each objective are obtained through the eigenvector approach.
(3) Evaluating the consistency in judgment: To verify the logical coherence of the judgment matrix, the Consistency Ratio (CR) is calculated. A CR below 0.1 indicates that the matrix satisfies the acceptable threshold for consistency.
where denotes the largest eigenvalue of the judgment matrix, represents its dimension, indicates the computed consistency index, and refers to the random consistency index.
2.3.2. Entropy Weight Method
Objective weighting is determined using the Entropy weight method. This technique, grounded in information entropy theory, is commonly used in multi-objective decision-making problems. Information entropy quantifies the degree of uncertainty in data, with a higher entropy value indicating higher uncertainty of the information. The method calculates the entropy values from the distribution characteristics of the objective values, reflecting the importance of each objective. When the data distribution of an objective is more scattered, its entropy increases and the corresponding weight decreases. In contrast, a more aggregated distribution results in lower entropy and greater weight allocation [40].
(1) Data normalization: The objective values in the original decision matrix are processed to make them dimensionless.
where represents the normalized value, is the actual value of alternative for objective , and and are the maximum and minimum values of objective , respectively.
(2) Entropy calculation: For each objective, its entropy value is calculated. A higher entropy indicates greater information dispersion and corresponds to a reduced weight allocation
where represents the proportion of the normalized value of scenario on objective , and is the number of alternatives.
(3) Objective weight allocation: The objective weights for each goal are determined based on the inverse proportional relationship with the entropy values.
where represents the number of objectives.
2.3.3. TOPSIS
TOPSIS (Technique for Order Preference by Similarity to Ideal Solution) serves as an approach for solving problems involving multiple evaluation criteria. The principle of TOPSIS assumes that the best alternative lies nearest to the ideal positive solution while being most distant from the ideal negative one. The positive ideal solution refers to a hypothetical solution that achieves the best value for each objective, whereas the negative ideal solution corresponds to the least favorable hypothetical solution across all objectives [41]. The procedural steps of TOPSIS are listed below:
(1) Standardization of the decision matrix = :
where represents the evaluation value of alternative for objective , and is the total number of alternatives.
(2) Weighted standardized decision matrix: By applying the comprehensive weights to the standardized matrix, the weighted decision matrix is derived.
(3) Identification of ideal solutions: For each objective, the best value and the worst value are selected to represent the positive and negative ideal solutions, respectively.
(4) Calculate the Euclidean distance of each alternative to the positive and negative ideal solutions: The Euclidean distances from each alternative to both the positive and negative ideal solutions are computed.
(5) Calculate the relative closeness: The relative closeness of each alternative to the ideal solution is calculated:
A higher value indicates that the alternative is nearer to the positive ideal solution and therefore has a greater decision-making priority.
(6) Alternative ranking: Based on the relative closeness , all alternatives are ranked, with the alternative having the largest value being prioritized.
This study adopts a multi-objective decision evaluation method that combines AHP, the Entropy Weight Method, and TOPSIS. AHP is used to determine subjective weights, making it suitable for reflecting experts’ practical experience and preferences. The Entropy Weight Method allocates objective weights to each objective, reflecting the information content inherent in the data. Using the TOPSIS approach, each alternative is then evaluated relative to an ideal solution by combining both subjective and objective weights. This process ensures that the final scheme achieves a balanced performance across all objectives.
3. Case Study
3.1. Study Area Overview
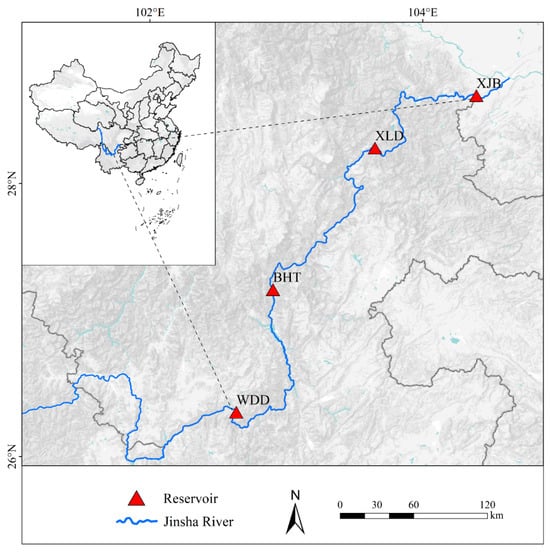
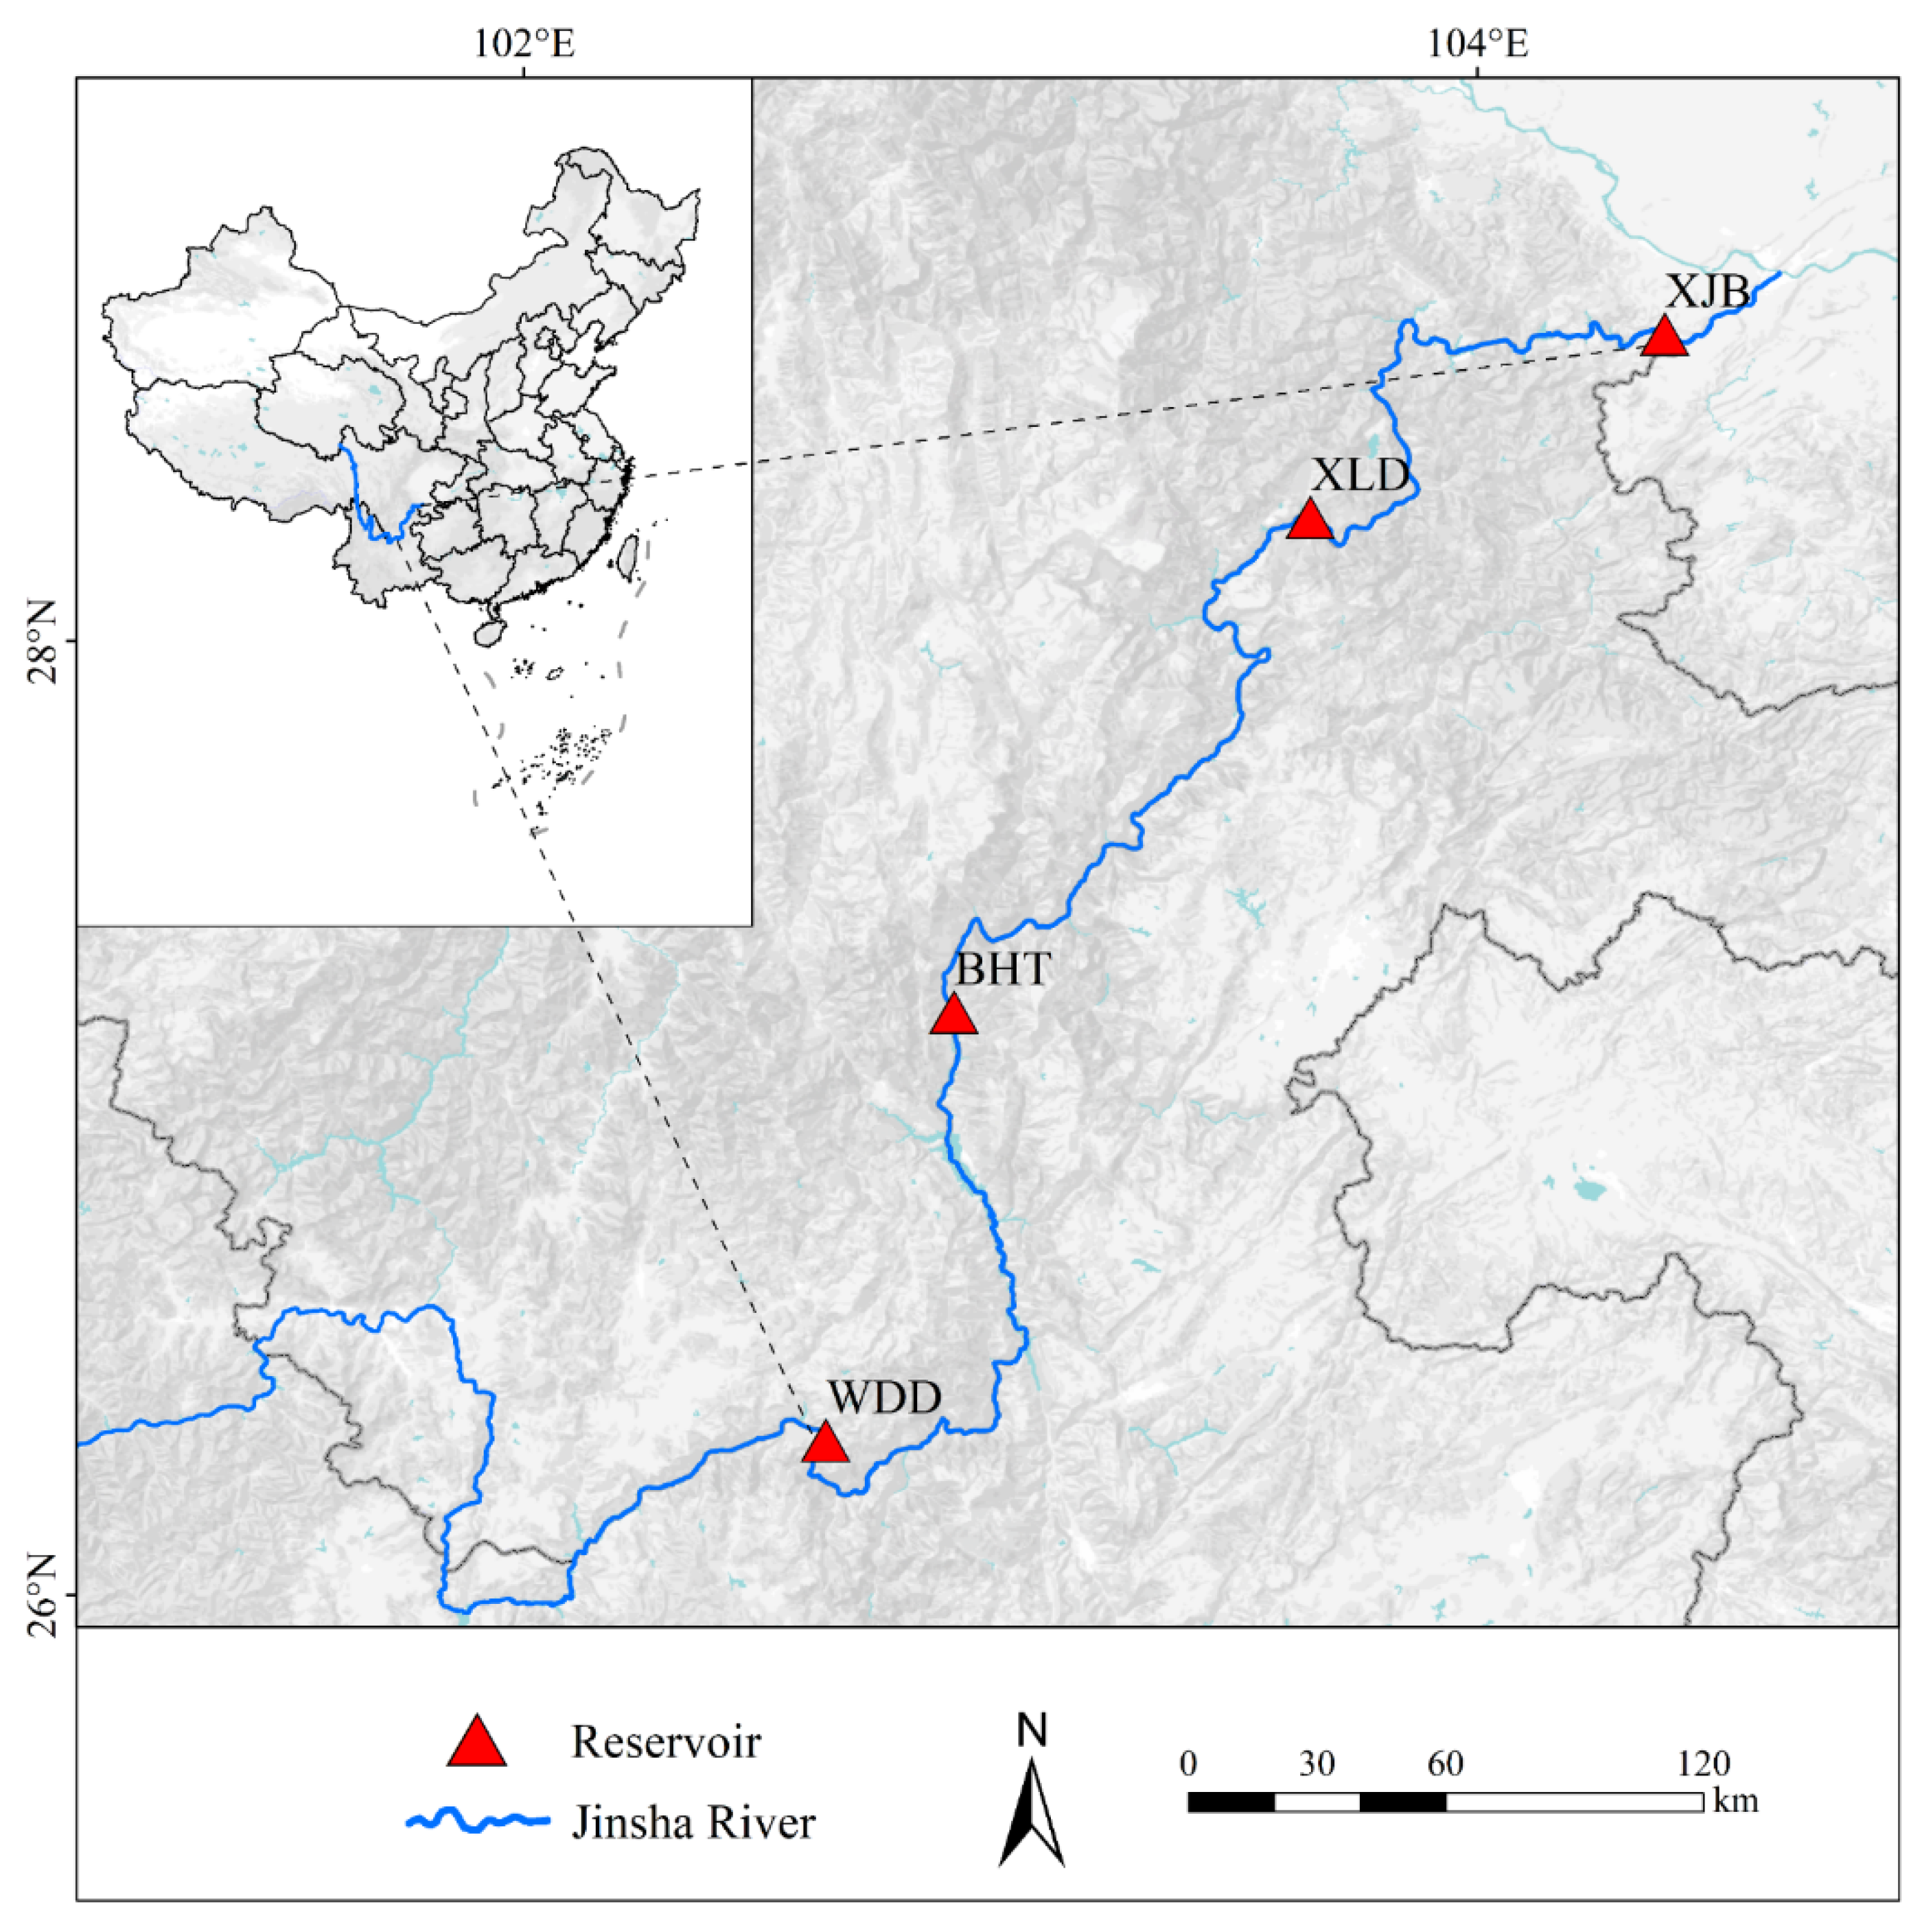
China is the country with the richest hydropower resources in the world. Within the nation, the southwest stands out as the leading area, contributing approximately 70% of the national total. The downstream section of the Jinsha River, stretching 782 km and descending 792 m, possess vast available water resources. Construction of the Xiluodu Hydropower Station began in 2005, and by the end of 2022, all units of the Baihetan Hydropower Station—the world’s second largest in installed capacity—were fully operational. The lower Jinsha River has formed a cascade hydropower system consisting of four massive hydropower stations: Wudongde, Baihetan, Xiluodu, and Xiangjiaba. These four hydropower projects are of immense scale, complex technology, and significant benefits, representing a major national project for the “West-to-East Power Transmission” initiative. Figure 3 illustrates the spatial distribution of the lower Jinsha River cascade hydropower stations
Figure 3.
The geographic distribution of the lower Jinsha River cascade reservoirs.
3.2. Operational Functions and Management Structure
The main development task of the project is power generation, while also considering flood control, navigation, and promoting regional economic and social development. The characteristic parameters are provided in Table 1.
Table 1.
The characteristic parameters of the lower Jinsha River cascade reservoirs.
The total installed capacity reaches 46.46 million kilowatts: this figure is over double that of the world-renowned Three Gorges Dam. On average, it generates approximately 190 billion kilowatt-hours of electricity annually, providing a large amount of clean electricity to the economically developed regions of eastern and southern China, thus contributing to the achievement of carbon neutrality and carbon peak goals.
The total reservoir capacity of the lower Jinsha River cascade hydropower stations is 45.868 billion cubic meters, with a flood control capacity of 15.493 billion cubic meters. These reservoirs are crucial for flood control and disaster reduction, protecting downstream communities and their assets, while also serving as a model for flood control engineering.
Because of the large dam heights and narrow valley morphology, the lower Jinsha River cascade does not adopt conventional fish ladders; instead, ecological protection relies on artificial fish reproduction and release, habitat conservation zones, and ecological flow regulation to sustain downstream aquatic ecosystems.
The lower Jinsha River is navigable, and all four cascade reservoirs—Wudongde, Baihetan, Xiluodu, and Xiangjiaba—are equipped with vertical-lift ship systems to ensure vessel passage through the dams. The construction of the reservoirs has improved navigation conditions, enabling ships to navigate during the dry season by regulating the discharge flow, thus promoting trade development.
The design irrigation area of the Xiangjiaba Irrigation District is 3.4885 million mu, and the cascade reservoirs supply water to this district, primarily for agricultural irrigation, as well as industrial and domestic water supply for urban and rural areas.
Studying the integrated utility of the lower Jinsha River reservoirs allows a comprehensive assessment of their multifunctional roles—enhancing benefits across flood control, power generation, water supply, navigation, and ecological protection. This integrated approach improves water-resource efficiency, promotes coordinated regional development, and supports long-term environmental sustainability.
All four cascade reservoirs—Wudongde, Baihetan, Xiluodu, and Xiangjiaba—are operated under unified management by the China Three Gorges Corporation’s Cascade Dispatching Center, which issues integrated scheduling and release orders to ensure coordinated power generation, flood control, and ecological operation.
3.3. Seasonal Hydrology and Management Priorities
The lower Jinsha River exhibits clear seasonal hydrological variability, with a distinct division between the flood season (June–September) and the non-flood season (October–May). During the flood season, reservoir operations prioritize flood control and ecological protection, maintaining sufficient storage capacity to mitigate downstream flood risk and ensuring higher ecological flows to support fish spawning activities. In contrast, during the non-flood season, water supply and navigation become dominant operational goals, as downstream agricultural, industrial, and municipal water demands increase while river discharge decreases.
3.4. Data Sources and Parameter Setting
Effective management of water resources in reservoirs is typically achieved by adjusting the water level. Variations in reservoir levels directly affects the reservoir’s storage capacity, power generation capacity, irrigation water supply, flood control capacity, and more. Different water levels determine the various services a reservoir can provide. For example, during flood control in the wet season, the reservoir reserves enough flood storage capacity by controlling the water level to ensure that the downstream peak flow does not become too large. A lower water level can provide more flood control space, while a higher water level can provide more water resources for power generation or irrigation. The reservoir water level is a dynamic variable, influenced by factors such as inflow, outflow, and evaporation. Therefore, changes in reservoir levels reflect how the reservoir balances the demands of various objectives (such as flood control, water supply, power generation, etc.) during operation. The 10-day interval was selected as the temporal decision step for reservoir operation optimization. This time scale represents a practical compromise between hydrological variability, operational feasibility, and computational efficiency. Daily steps would generate excessive decision variables and make the multi-objective NSGA-III optimization computationally intractable, whereas monthly steps would oversimplify dynamic flow variations critical for flood control and ecological processes. In China’s hydropower and water resources management practice, the 10-day period is the standard operational unit adopted by the Ministry of Water Resources and regional basin authorities. Correspondingly, most hydrological, water demand, and navigational datasets are compiled at this temporal resolution. Moreover, ecological and navigational flow responses typically occur over a one-to-two-week timescale, which aligns well with the 10-day decision interval. Therefore, using a 10-day time step ensures both representational accuracy and computational tractability in simulating the cascade reservoir operations.
The inflow data for Wudongde, Baihetan, Xiluodu, and Xiangjiaba reservoirs were obtained from the Three Gorges Cascade Dispatch Center, covering more than twenty years of continuous records. Hydrological frequency calculations were carried out using the P-III curve to determine the flow values corresponding to the frequencies of 25%, 50%, and 75% on the curve, and the three years with flow values close to them were selected as typical years for analysis in the historical years, which were the wet year (2018), the normal year (2014), and the dry year (2011).
Among the four reservoirs, only Xiangjiaba Reservoir provides downstream water supply. It serves the Xiangjiaba Irrigation District through two trunk diversion canals: the North Main Canal with a design discharge of 98 m3/s and the South Main Canal with 38 m3/s. These design flow rates represent the maximum water withdrawal capacity of the irrigation system. Actual water consumption in different periods—including agricultural irrigation, domestic use, and industrial supply—was obtained from local statistical yearbooks and the Water Resources Bulletin. The time-varying demand was used to define the target discharge at the downstream control section, and water-supply shortages (WSSs) were evaluated by comparing the required demand with the simulated reservoir outflow.
The ecological flow requirement represents the minimum discharge needed to sustain downstream aquatic habitats, maintain fish spawning grounds, and preserve basic riverine ecological functions. In this study, ecological flow thresholds were determined using the Tennant method, which specifies minimum percentages of the mean annual flow to represent different ecological status levels. According to published studies for the lower Jinsha River [42], 40% of the mean monthly natural flow was adopted as the ecological base flow during the dry season, and 60% during the wet season to reflect seasonal ecological variability. The ecological flow thresholds for Wudongde, Baihetan, Xiluodu, and Xiangjiaba were set at 1514 m3/s, 1633 m3/s, 1748 m3/s, and 1781 m3/s, respectively, during the non-flood season, and at 2271 m3/s, 2450 m3/s, 2622 m3/s, and 2672 m3/s during the flood season to satisfy fish spawning requirements.
The navigational flow requirement defines the discharge range necessary for maintaining safe and continuous navigation in downstream reaches. The lower limit corresponds to the minimum discharge required to maintain navigable water depth and channel width, while the upper limit represents the threshold beyond which excessive velocity or turbulence endangers vessel operation. Both limits were derived from national navigation regulations and local river management standards issued by the Ministry of Transport and the Yangtze River Navigation Administration. Empirical discharge records at key control sections were used to refine these limits, resulting in a navigable flow range of approximately 2000–12,000 m3/s for the lower Jinsha River.
The NSGA-III initialization parameters are set with a population of 200 individuals and limiting the iteration number to 1000.
4. Results and Discussion
4.1. Analysis of Multi-Objective Optimization Results
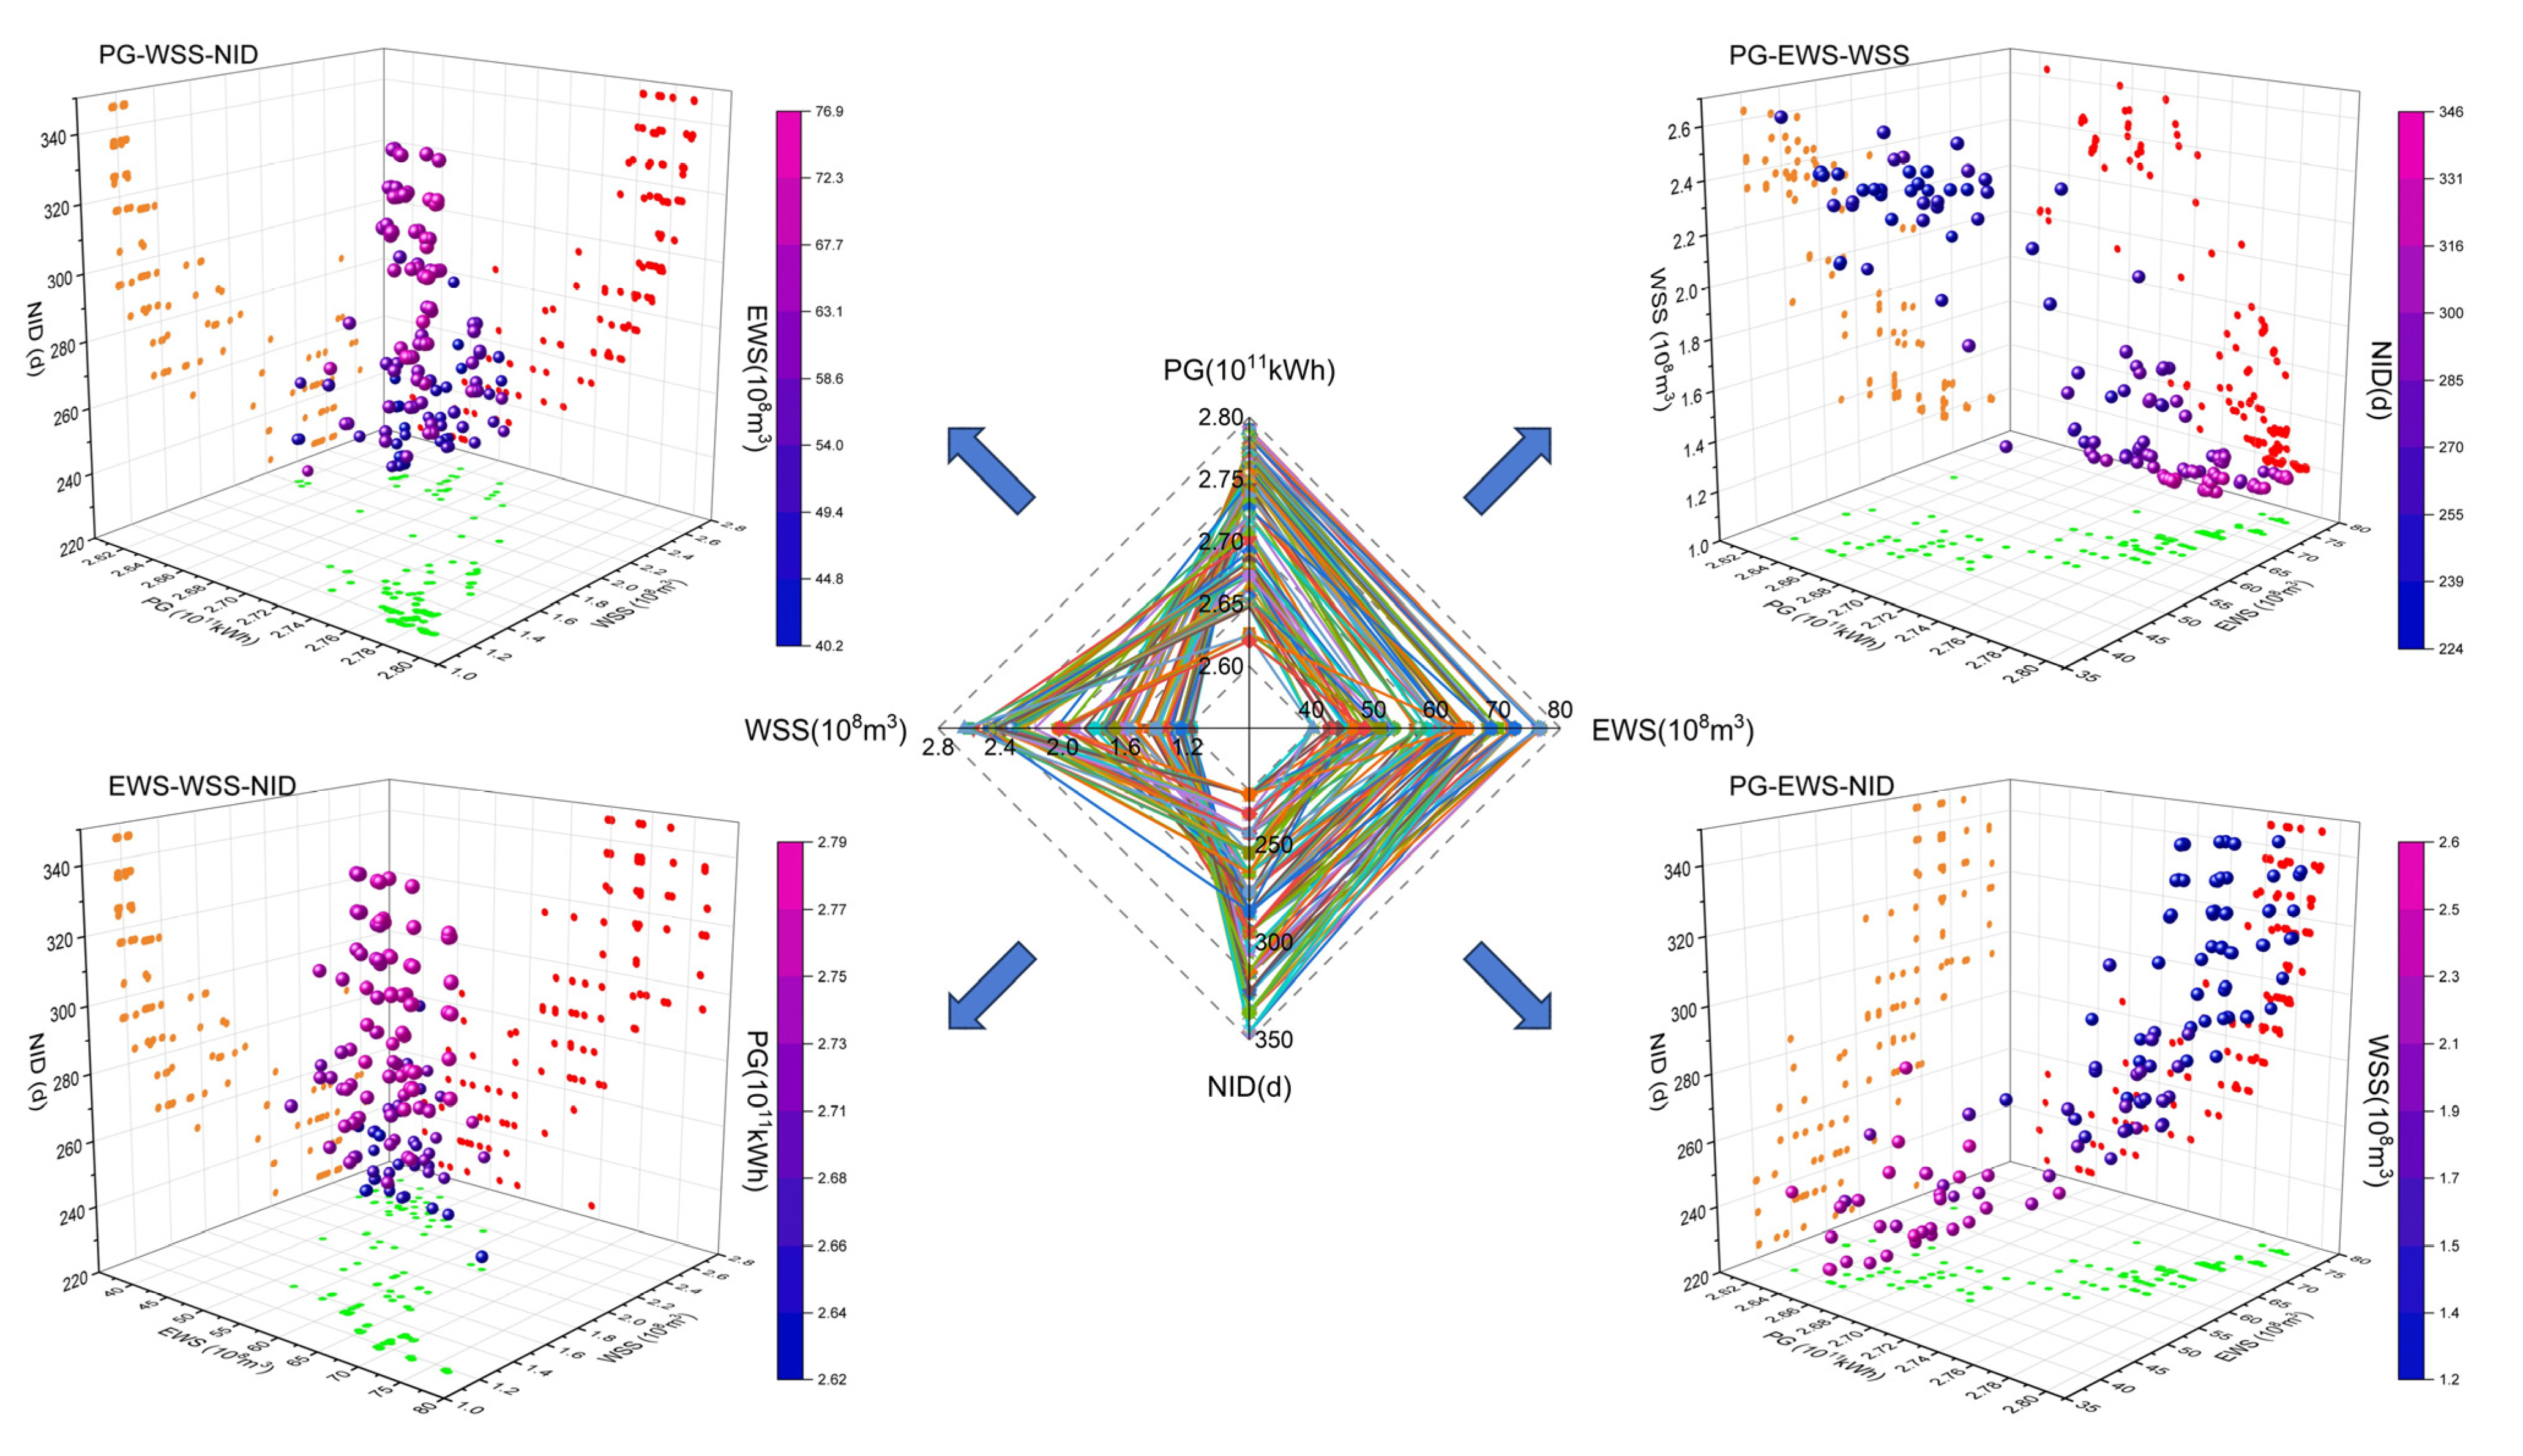
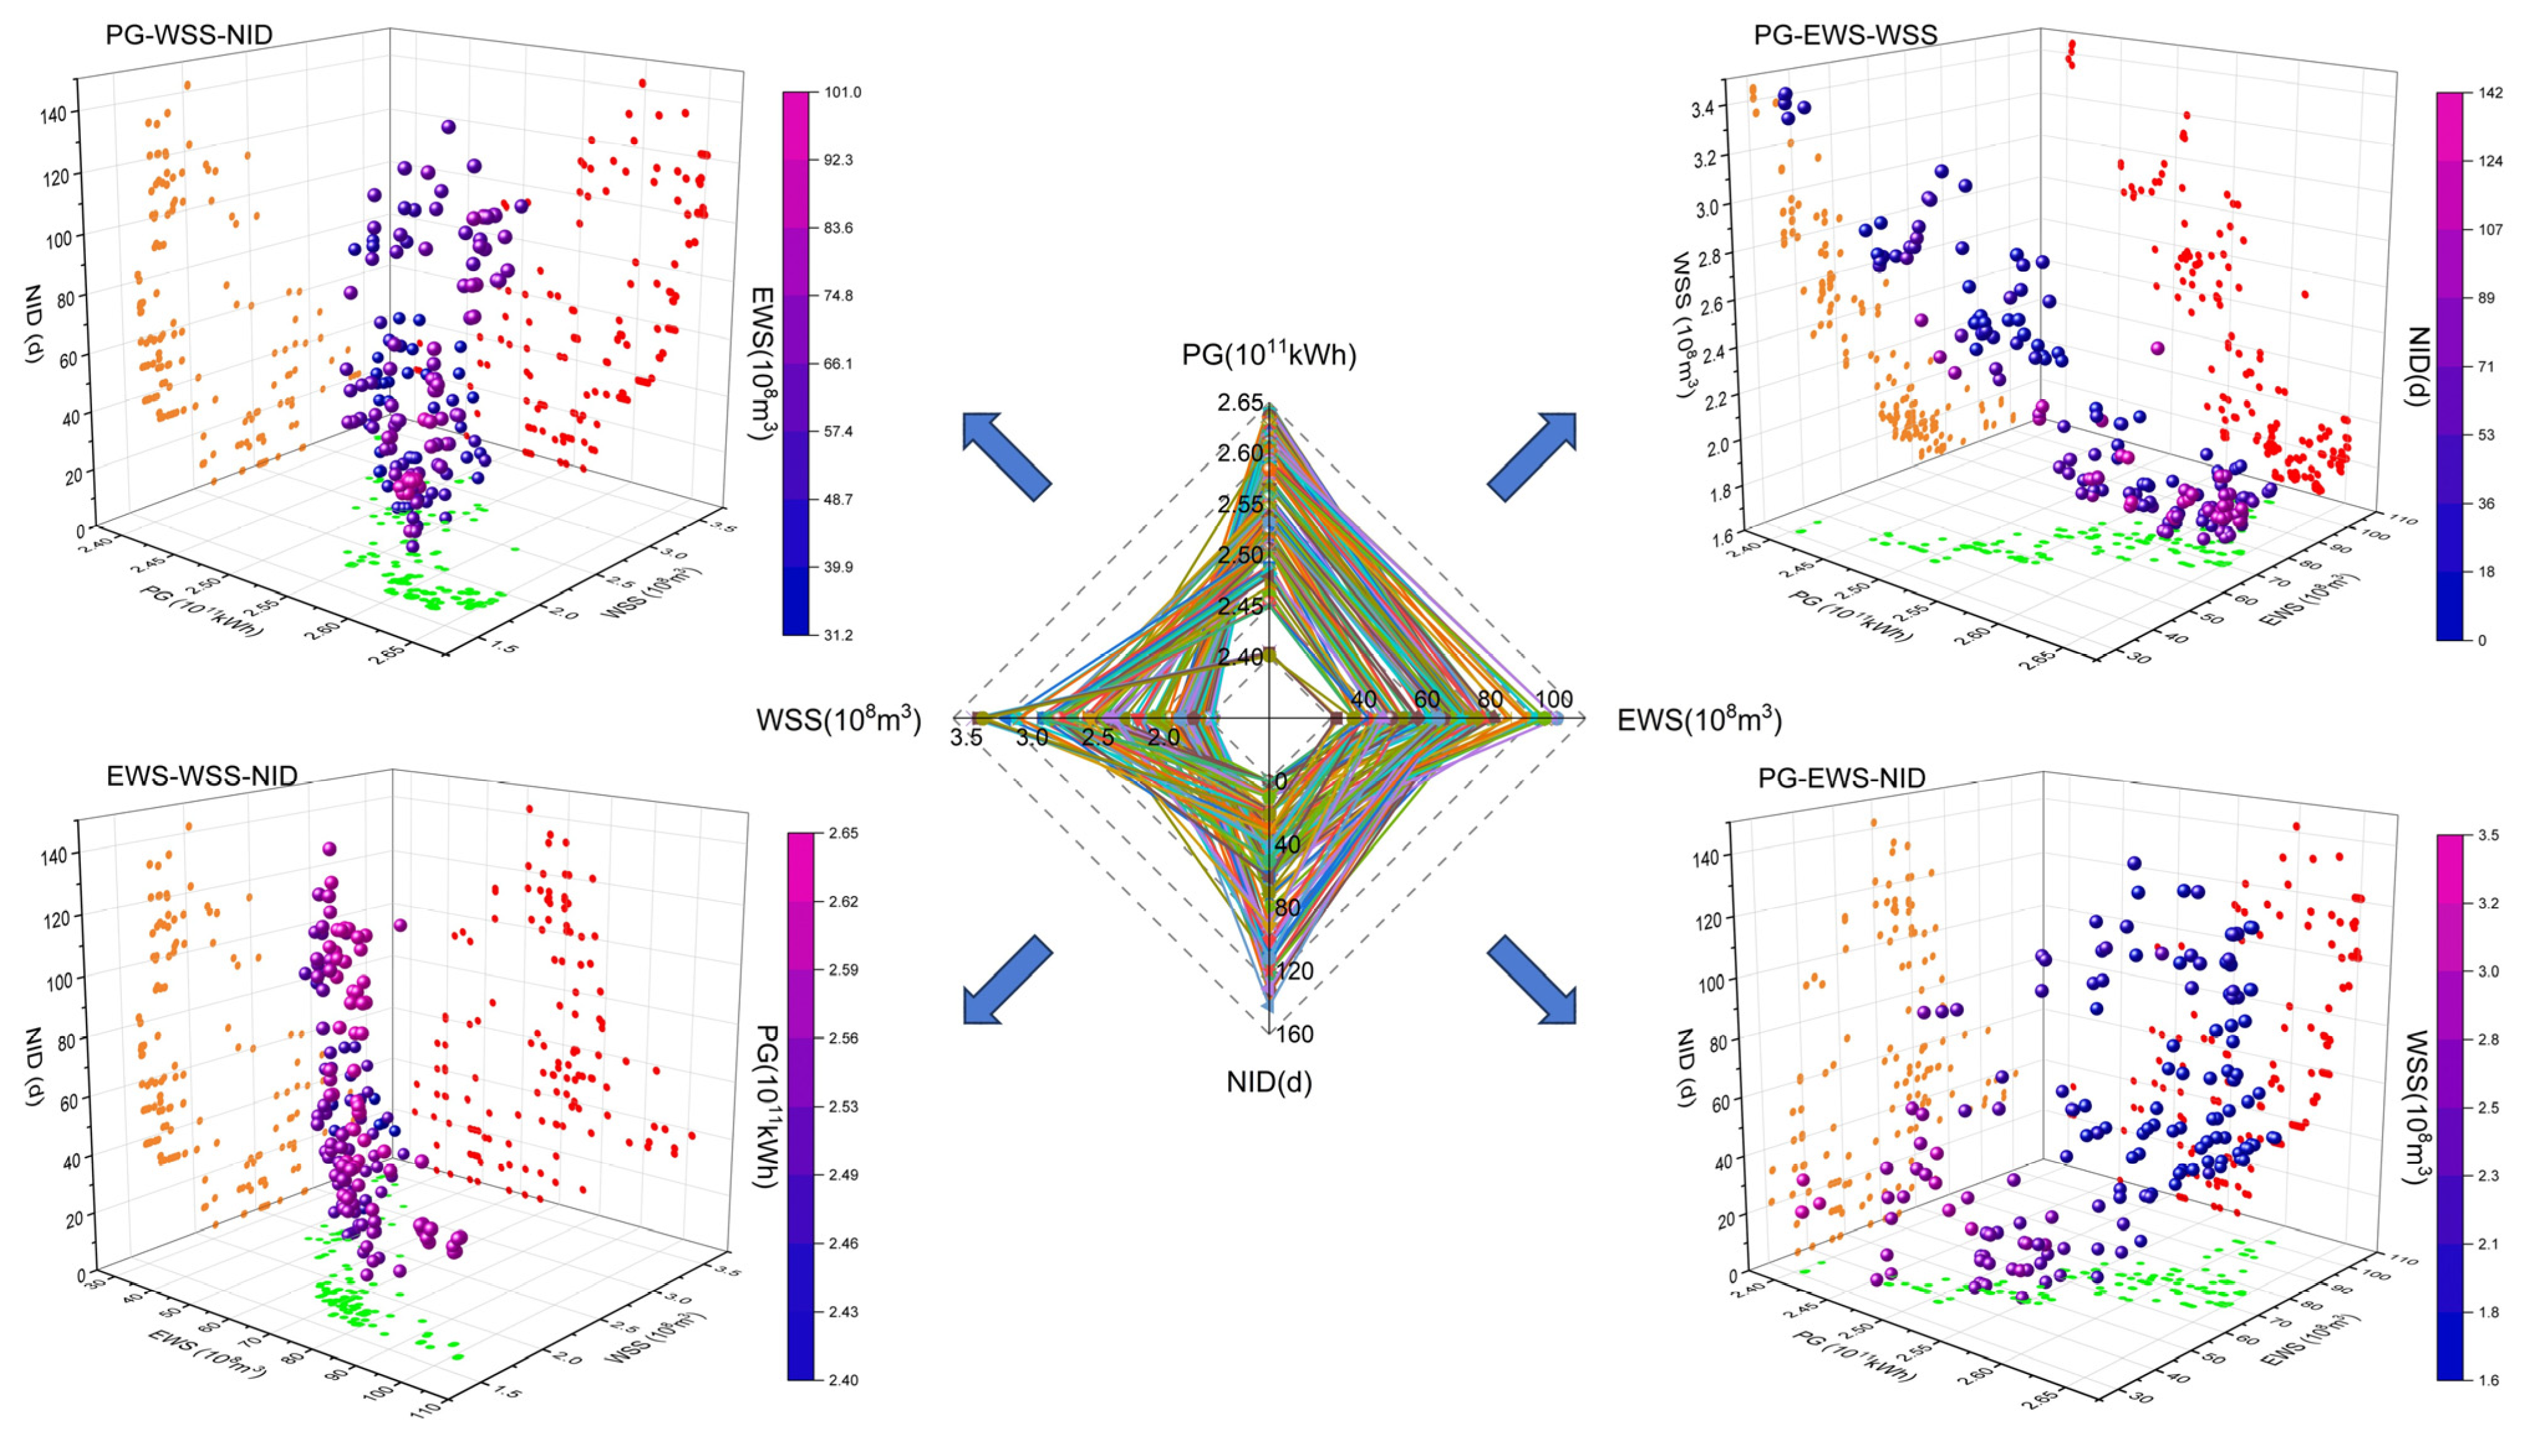
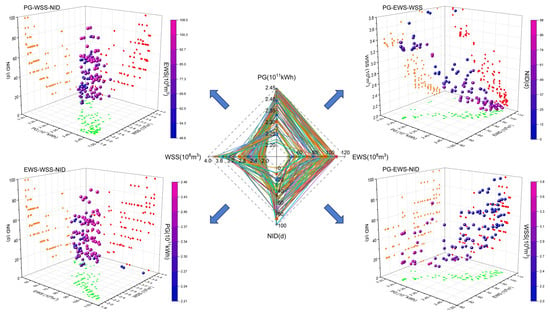
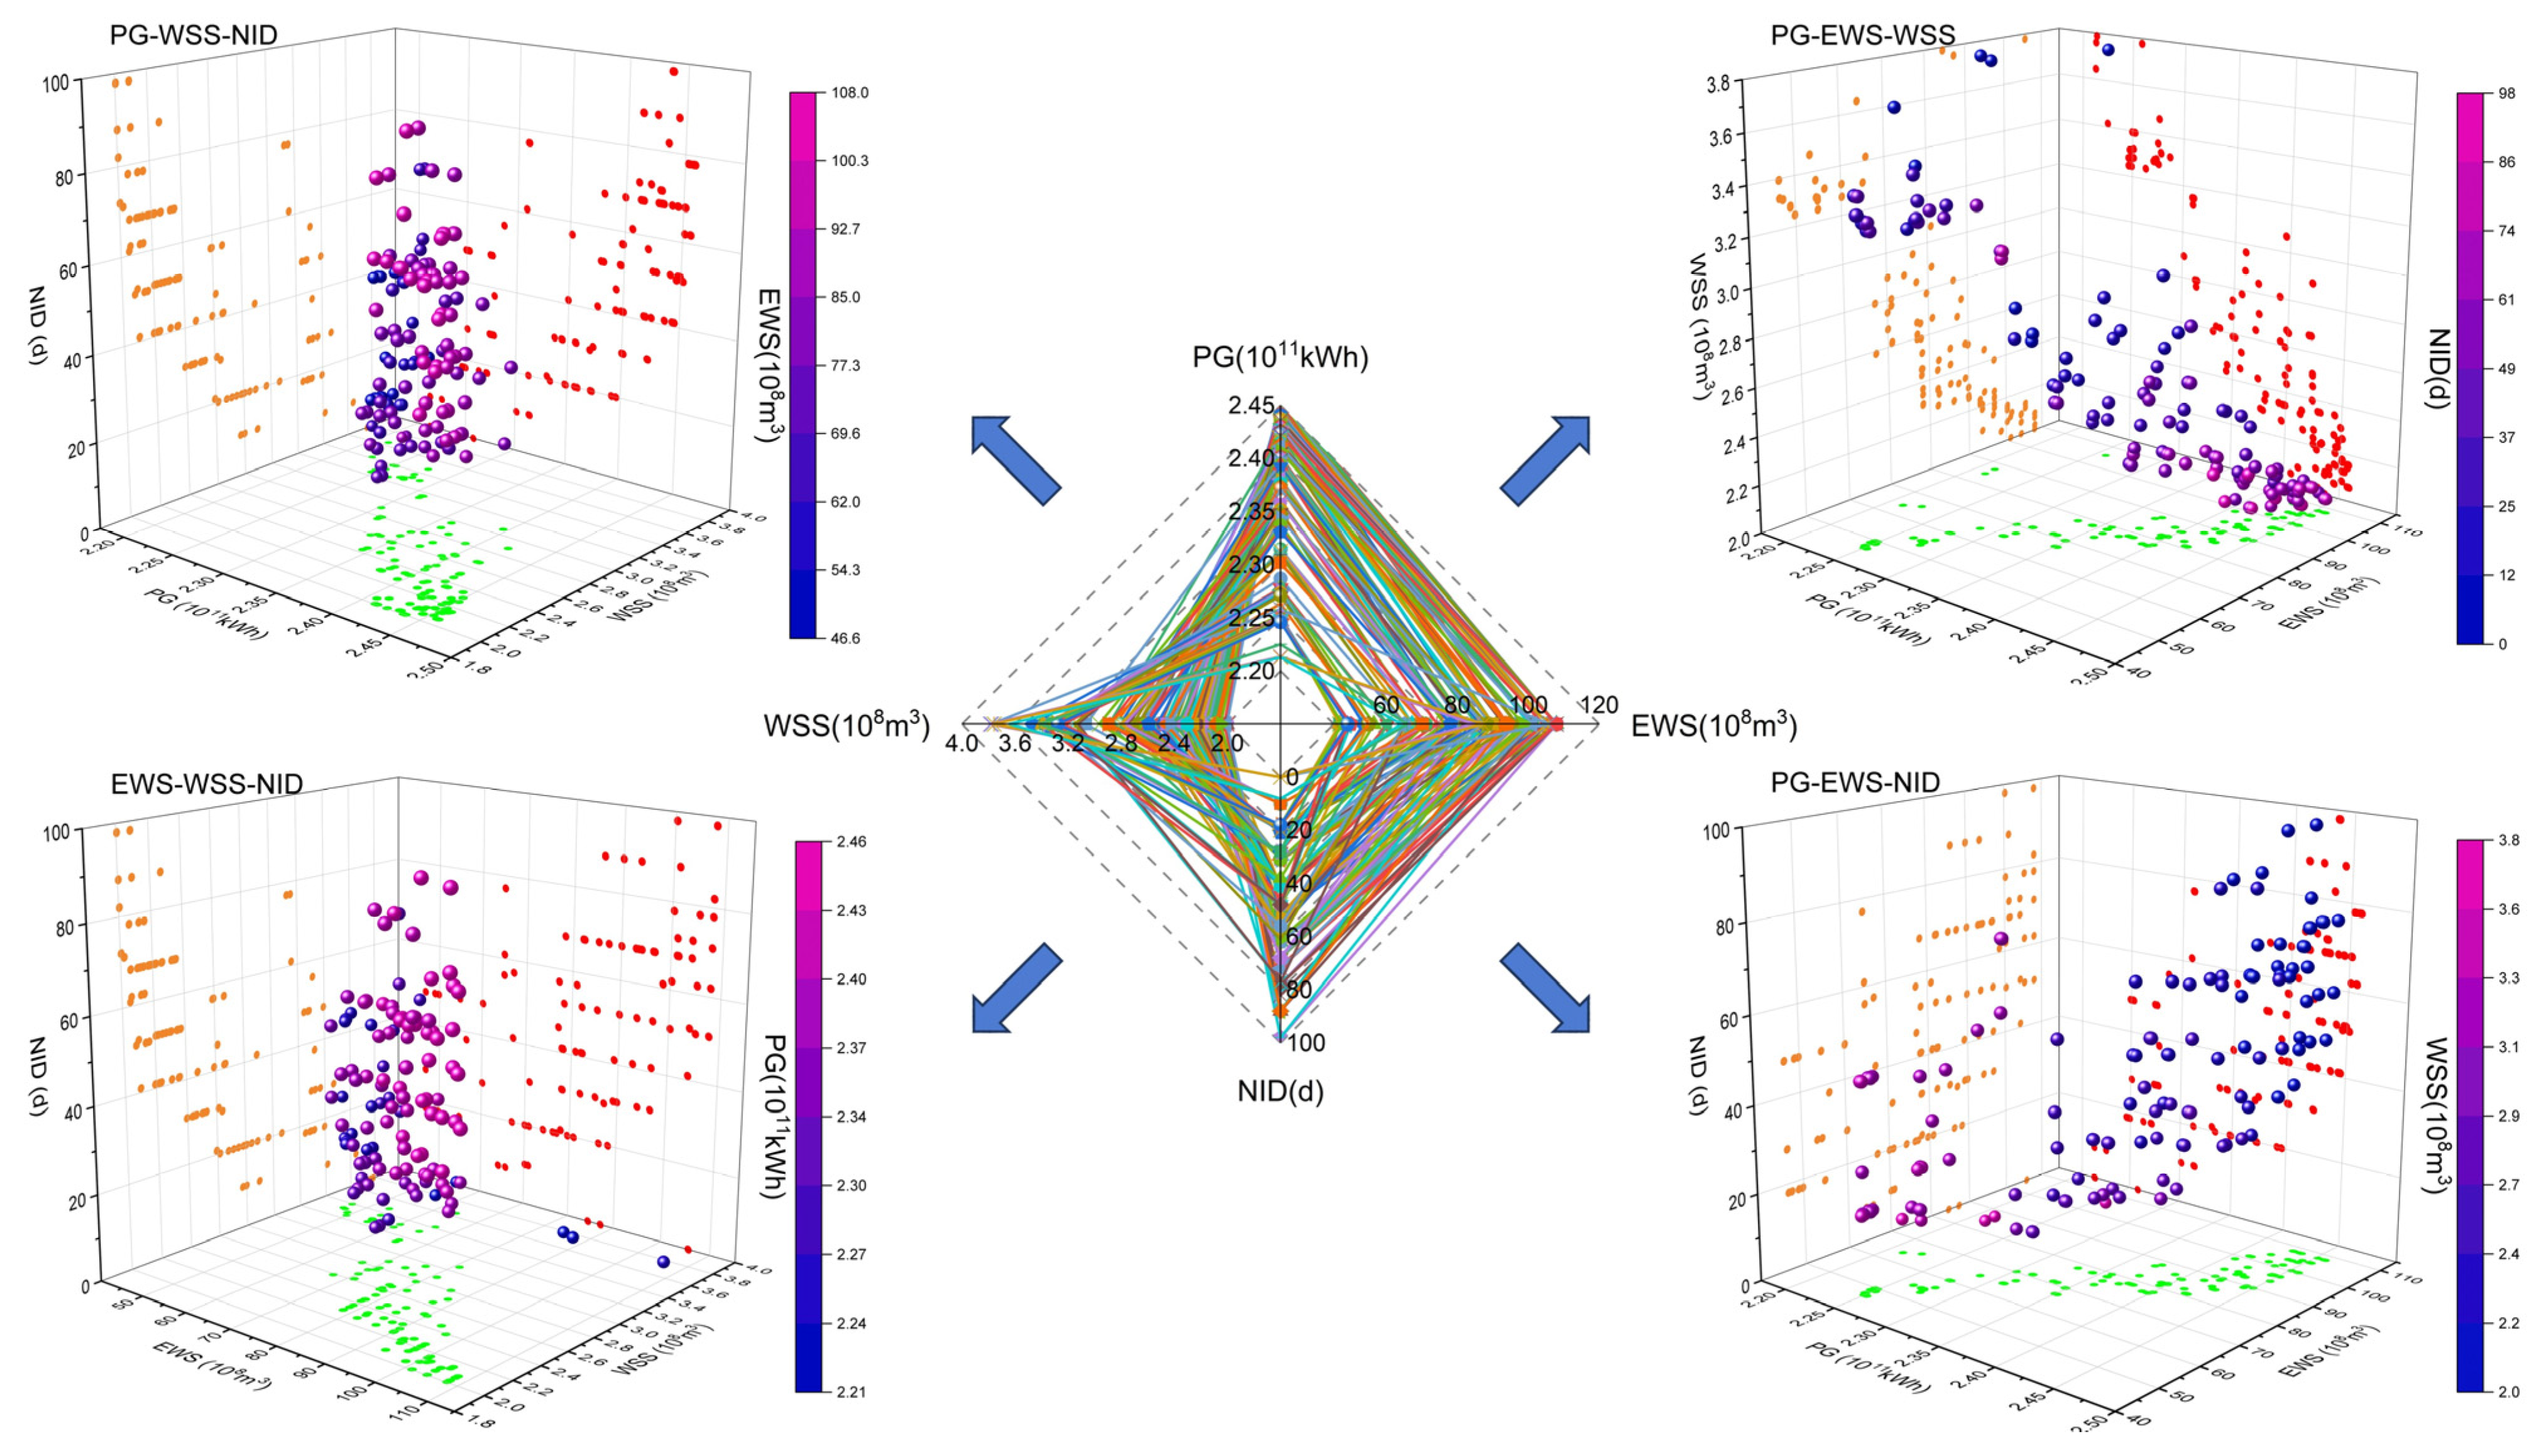
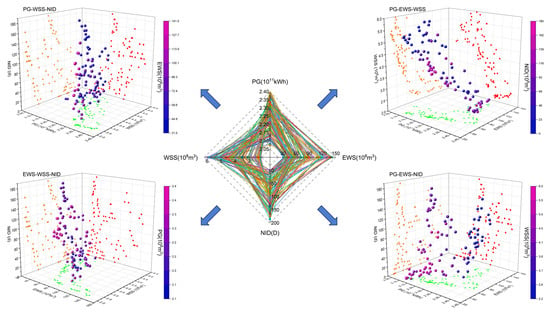
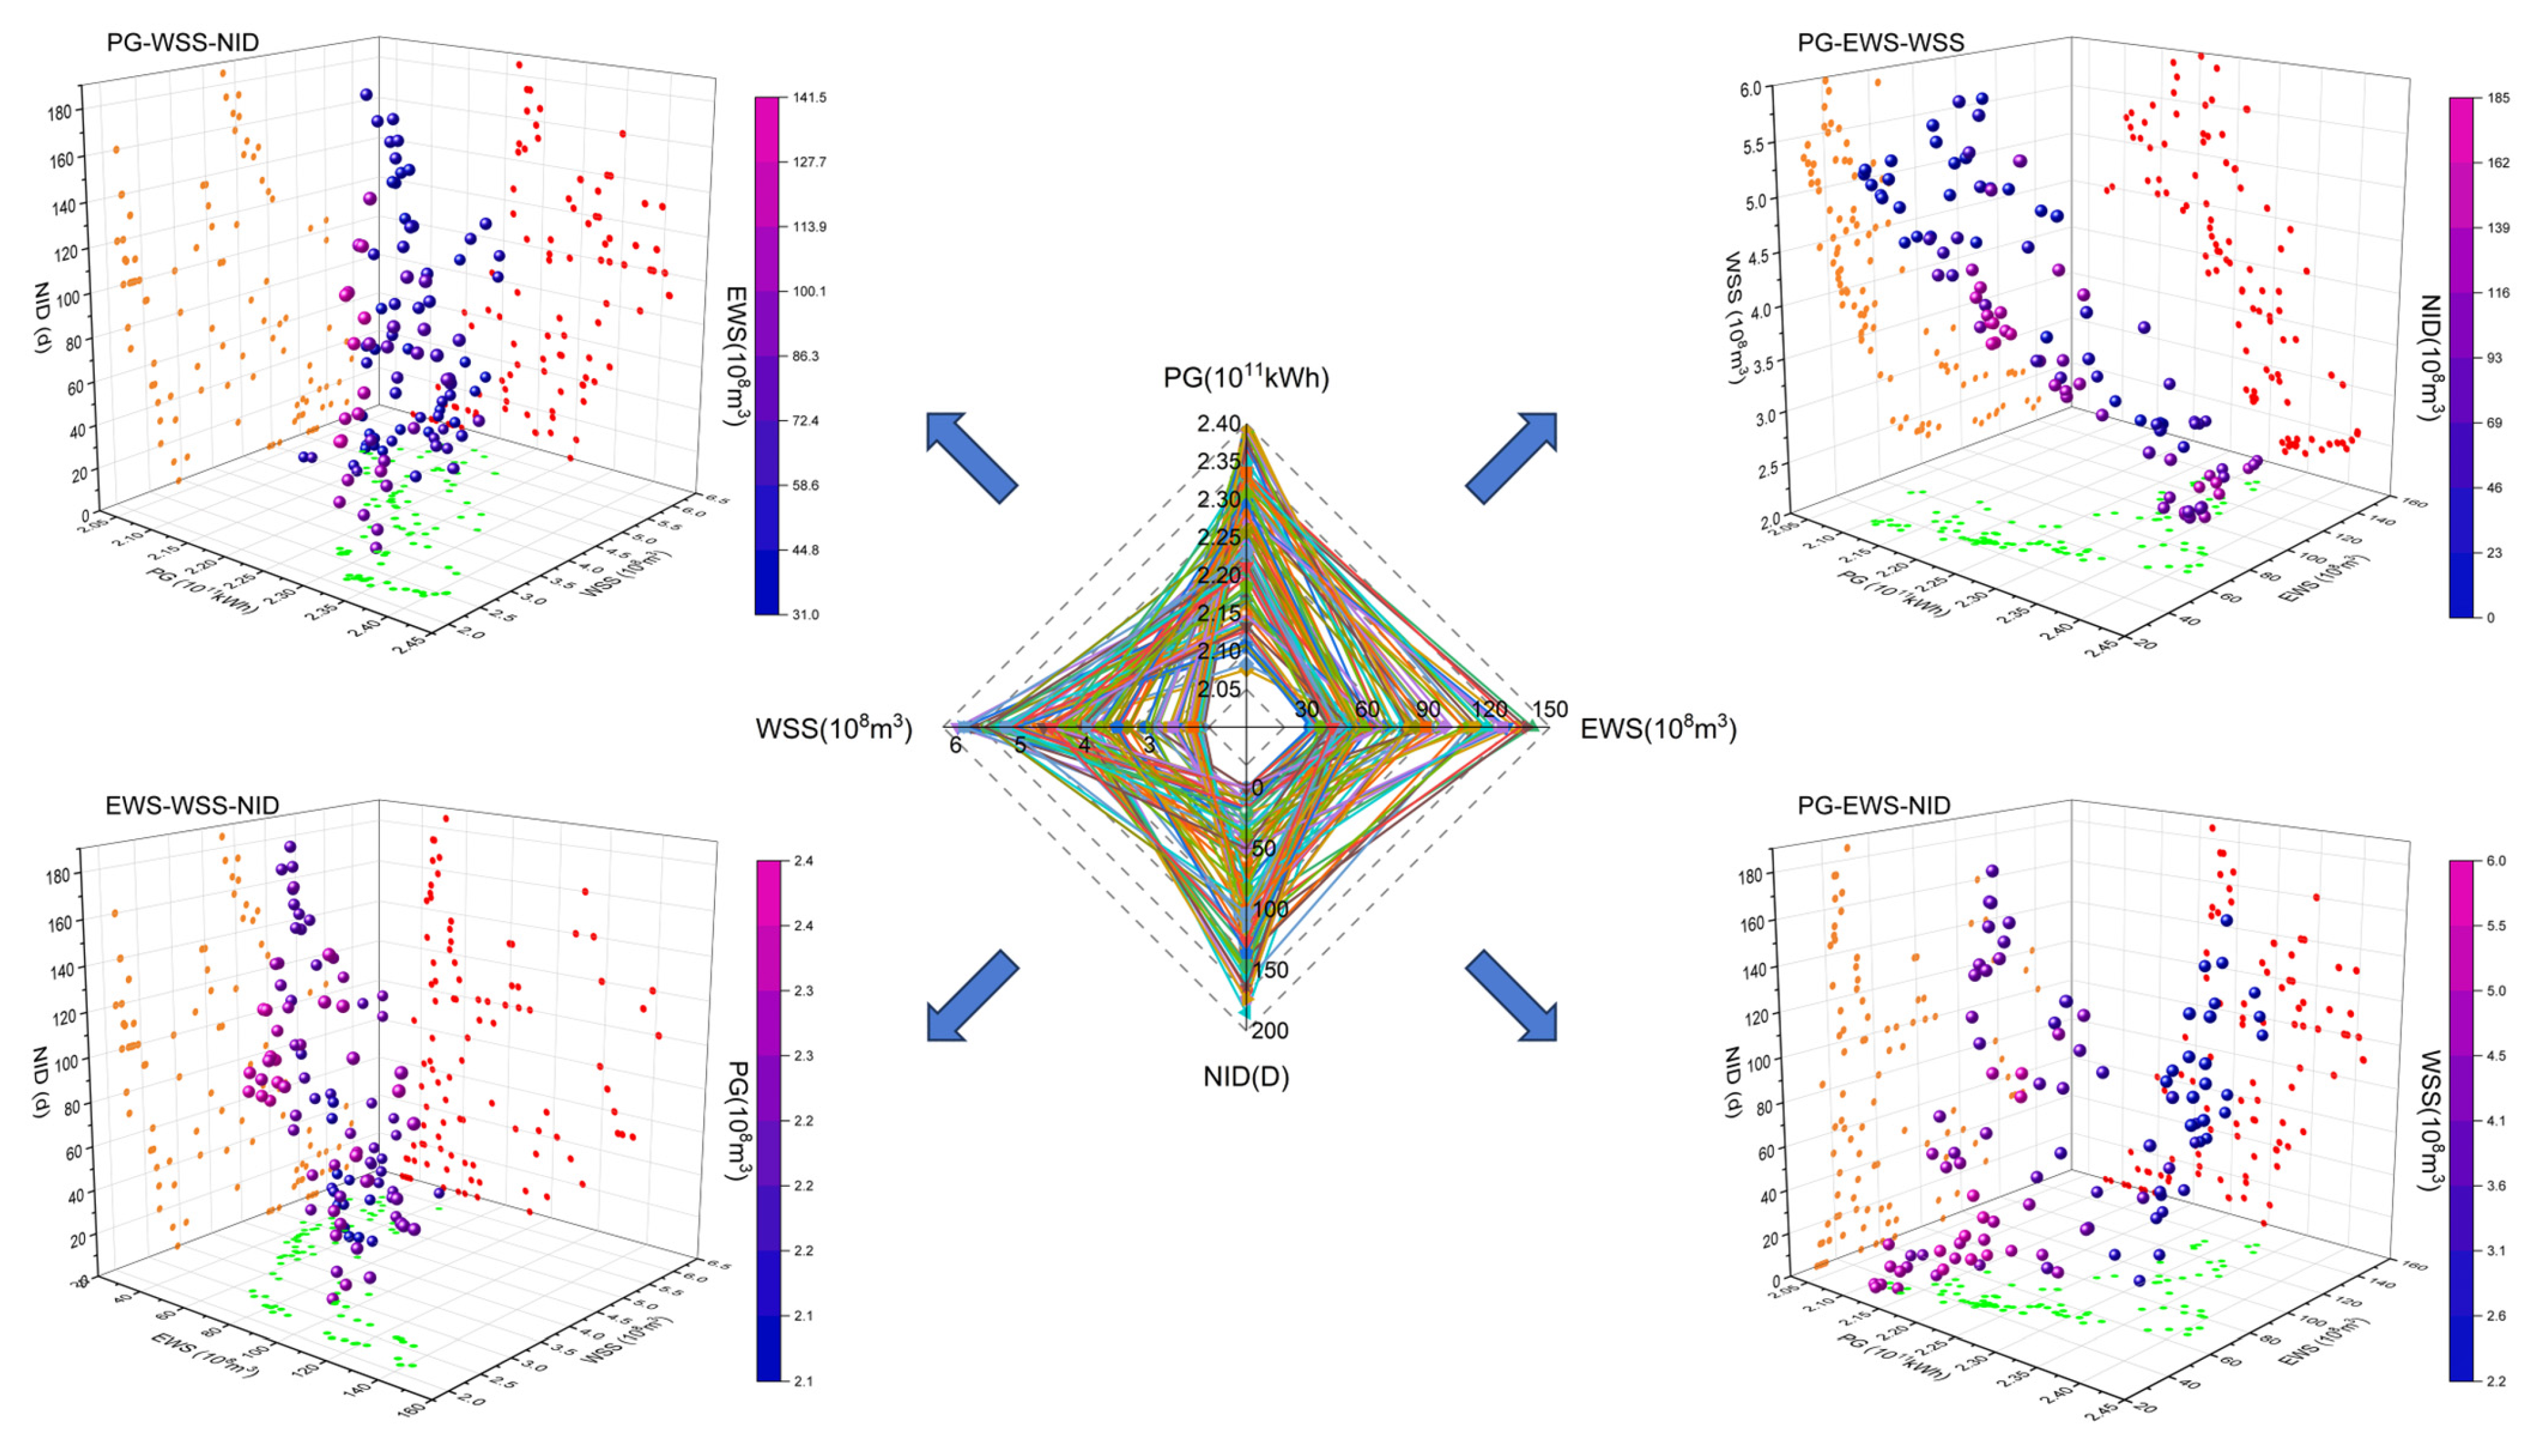
The four-dimensional Pareto front distribution is shown in the radar charts and scatter plots in Figure 4, Figure 5 and Figure 6, where the color intensity of the points in the scatter plots reflects the magnitude of the fourth objective. The results indicate that the NSGA-III algorithm performs well under different hydrological conditions, providing well-distributed solution points. Projecting the Pareto points onto the plane reveals the relationships between the different objectives.
Figure 4.
The Pareto front under the wet year.
Figure 5.
The Pareto front under the normal year.
Figure 6.
The Pareto front under the dry year.
(1) PG is directly proportional to EWSs. The more power generation (PG), the greater the ecological water shortages (EWSs).
(2) PG and WSSs are in a competitive relationship. The more power generation (PG), the smaller the water supply shortages (WSSs).
(3) PG is directly proportional to NIDs. The more power generation (PG), the more navigation interruption days (NIDs).
(4) EWSs and WSSs are in a competitive relationship. The more ecological water shortages (EWSs), the smaller the water supply shortages (WSSs).
(5) EWSs and NIDs are directly proportional in wet years, while this proportional relationship is not significant in normal and dry years.
(6) WSSs and NIDs are in a competitive relationship in wet years, while this competitive relationship is not significant in normal and dry years.
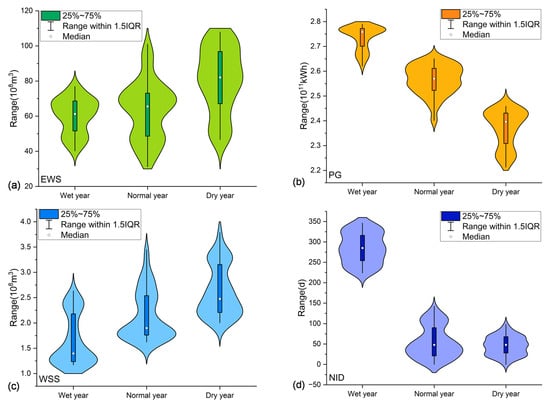
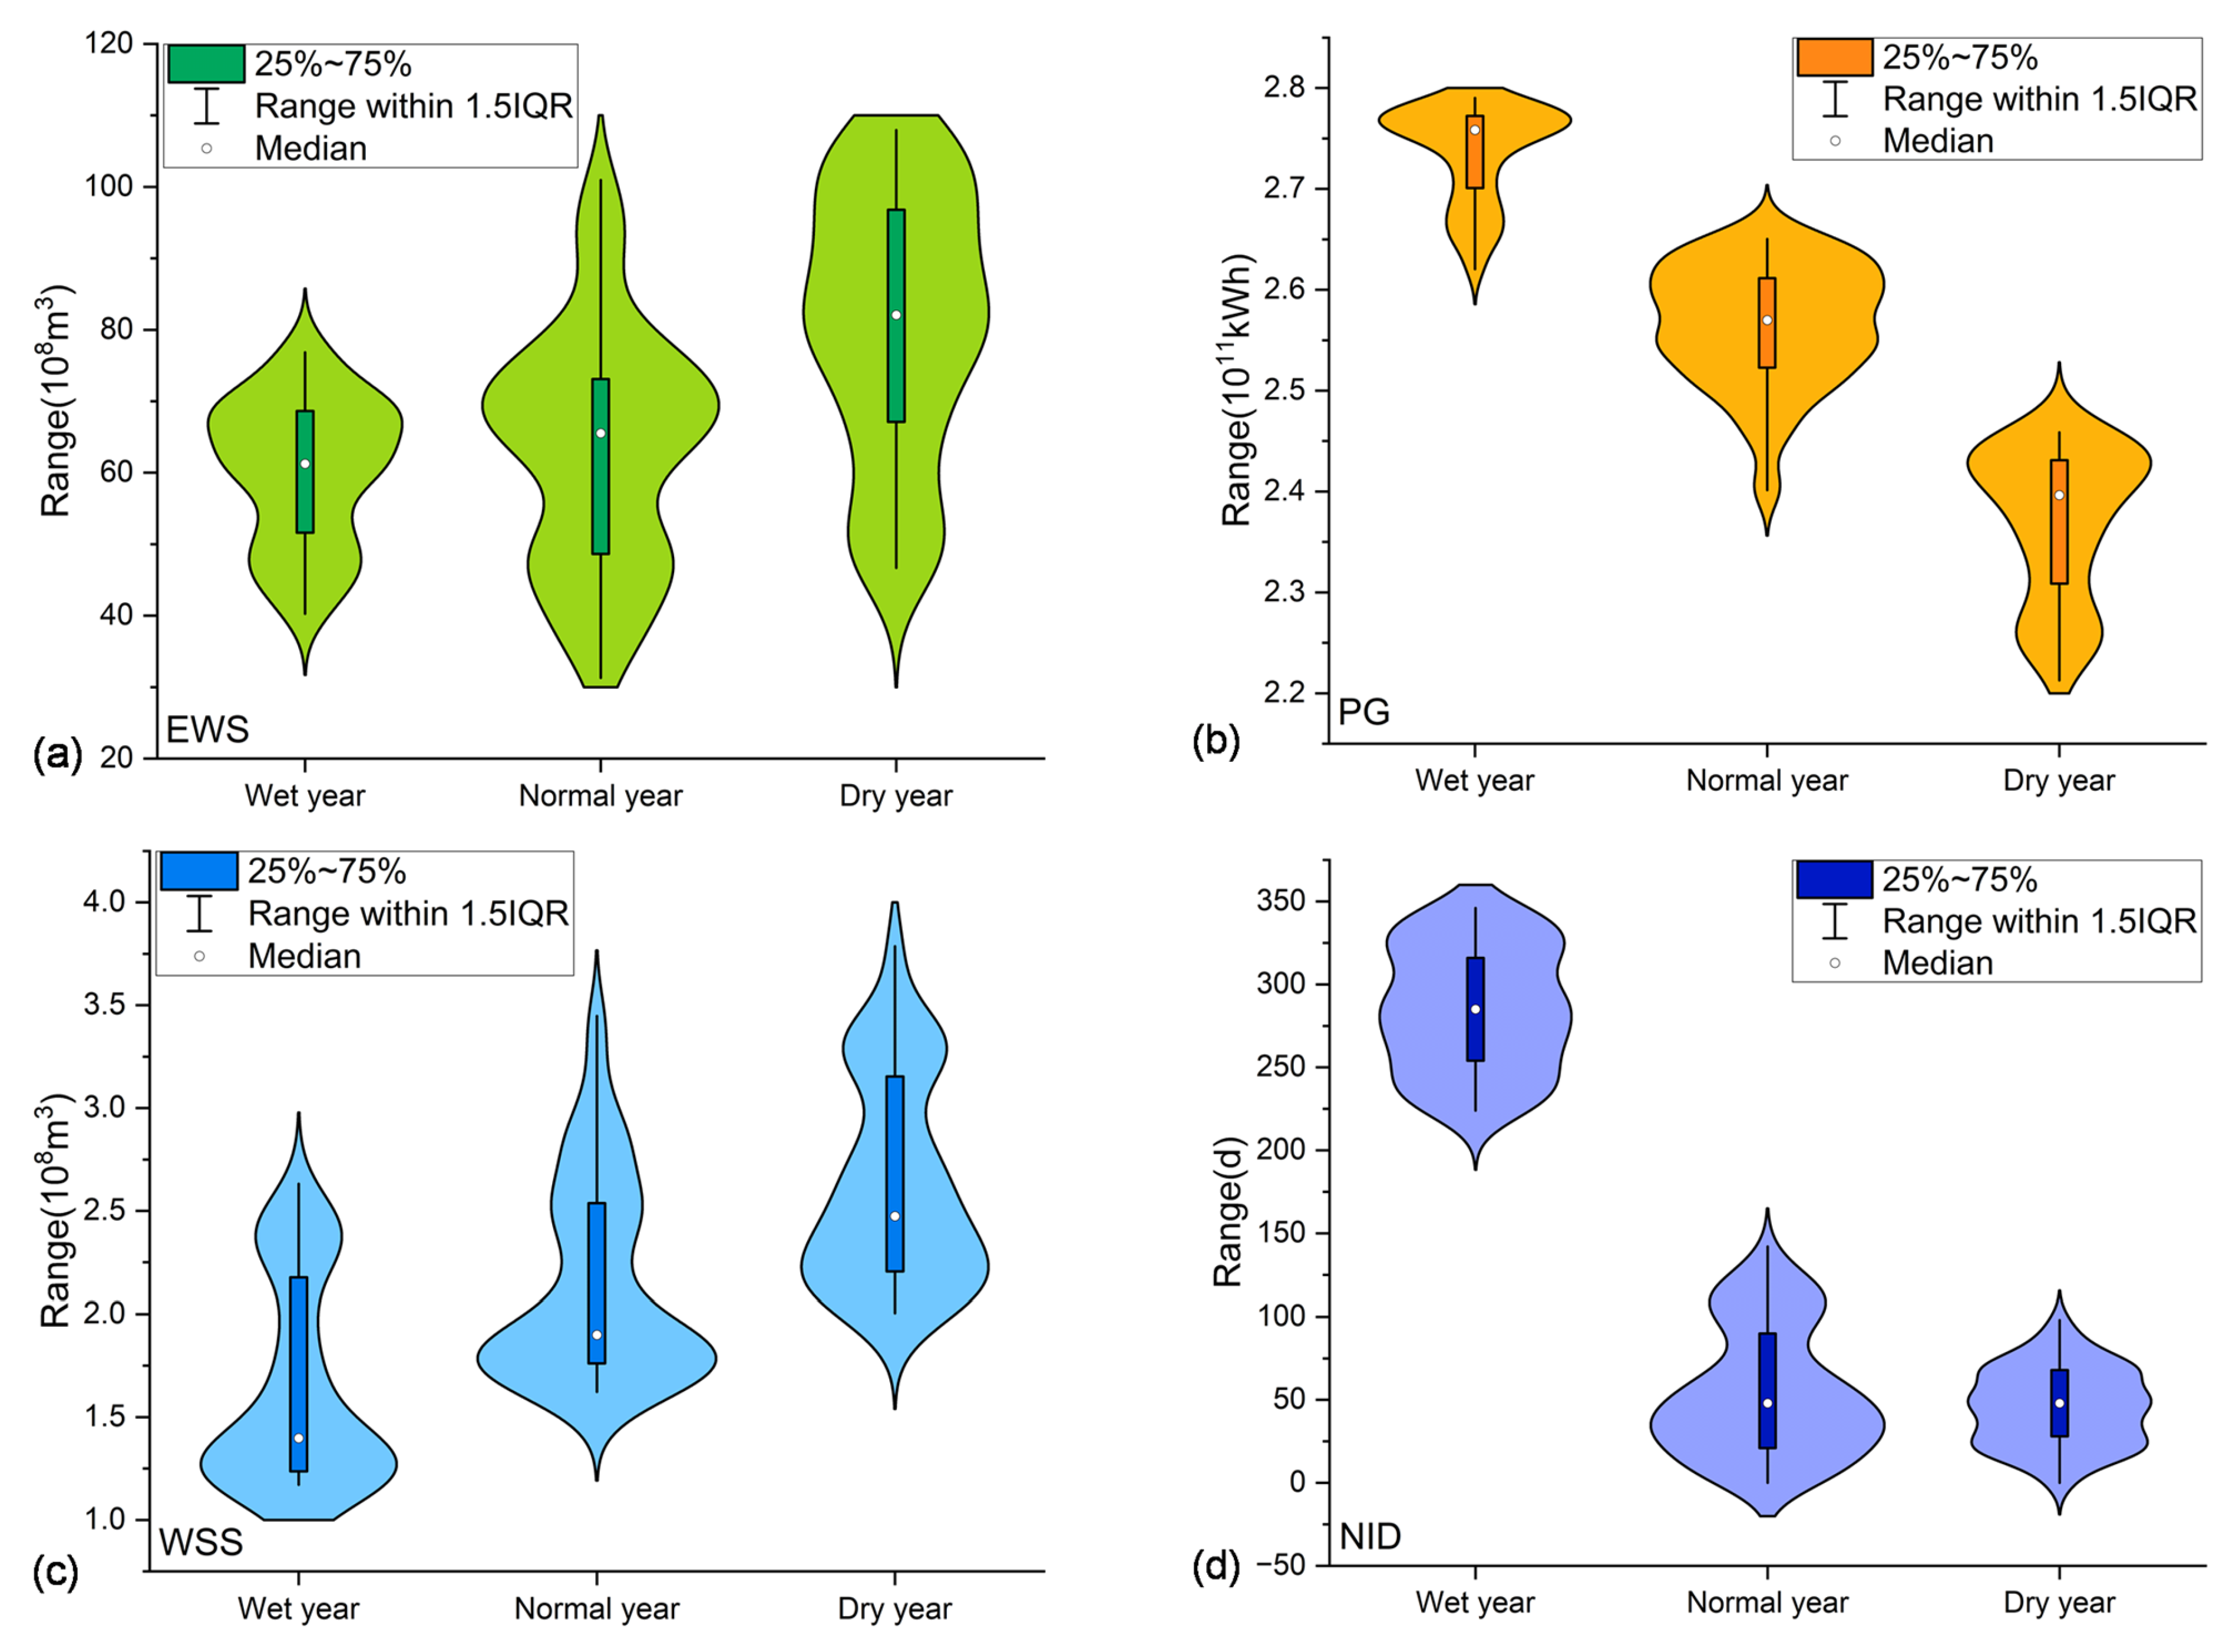
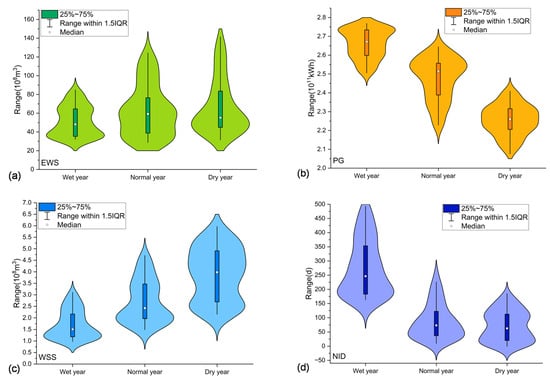
The benefit values of different objectives under typical hydrological years are shown in Figure 7. As inflow increases, the objectives of ecological water shortages (EWSs), water supply shortages (WSSs), and power generation (PG) are optimized, with PG showing the most significant improvement. Conversely, as inflow increases, the performance of navigation interruption days (NIDs) worsens.
Figure 7.
(a) Variation in EWS objective values under different hydrological years; (b) Variation in PG objective values under different hydrological years; (c) Variation in WSS objective values under different hydrological years; (d) Variation in NID objective values under different hydrological years. (IQR is interquartile range).
The relationships among objectives can be understood from the actual allocation and use of water in the cascade system. Power generation (PG) increases with turbine discharge, bringing higher economic benefits but leaving less water for ecological flow releases, which are discharged through dedicated outlets to sustain downstream ecosystems. Therefore, PG is positively correlated with ecological water shortages (EWSs). In contrast, PG and water supply shortages (WSSs) show an inverse relationship because hydropower generation is a non-consumptive use: water passing through turbines returns to the downstream river and can still be used by lower reservoirs or supply stations. Thus, higher PG generally helps reduce WSSs, especially in wet and normal years. However, large turbine releases may increase flow velocity and cause more navigation interruption days (NIDs). In dry years, limited inflows intensify competition among PG, EWSs, and WSSs, as maintaining ecological and supply demands constrains generation and navigation. These physical mechanisms explain the varying trade-off intensity across hydrological conditions.
From the visualization results, it is clear that reducing ecological water shortages and navigation interruption days while simultaneously increasing power generation benefits is challenging. To realize the full potential of cascade reservoirs, it is essential to reconcile competing objective demands.
4.2. Decision Evaluation Result
The principle for determining the subjective weights using AHP is as follows: the power generation objective receives the highest weight, followed sequentially by ecology, water supply, and navigation objectives, with marginal differences between adjacent priorities. The comprehensive weights are calculated using a 1:1 ratio of subjective and objective weights. This 1:1 ratio reflects the intention to give equal importance to the subjective evaluation from experts (AHP) and the objective information derived from data variability (Entropy). Such an approach has been widely employed in multi-criteria decision-making studies to avoid bias toward either human judgment or data-driven computation, thus maintaining methodological neutrality and interpretability. The solutions are then evaluated via TOPSIS, and Table 2 presents the optimal scheme for each typical year.
Table 2.
The result of optimal scheme for each typical year.
In the optimal scheme for each typical year, the PG (power generation) values are 2.75 × 10¹¹ kWh in the wet year, 2.58 × 10¹¹ kWh in the normal year, and 2.35 × 10¹¹ kWh in the dry year, indicating that greater reservoir inflow leads to better power generation performance. The values of WSSs (water supply shortages) and EWSs (ecological water shortages) in the optimal scheme increase from wet to normal to dry year, suggesting that lower inflow results in greater shortages. The NIDs (navigation interruption days) is 265 in the wet year, while in the normal and dry years it is only 30 and 20, respectively. This indicates that NIDs is largely influenced by the upper threshold of the navigable flow range—excessively high flows can make navigation unsuitable.
To verify the realism of the optimized results, the simulated operation of the lower Jinsha River cascade reservoirs was compared with actual annual generation data published by the China Three Gorges Corporation Annual Reports. The designed total annual generation capacity of the cascade is approximately 190 billion kWh. Since the commissioning of each reservoir, the annual generation has varied within reasonable ranges (Table 3). These values demonstrate that the optimized results are physically realistic and reflect actual operational magnitudes.
Table 3.
Annual power generation of cascade hydropower stations.
Furthermore, compared with the optimization results reported in [42], this study achieves clear improvements: under wet-year conditions, power generation (PG) increased by 3.7%, ecological water shortages (EWSs) decreased by 15.3%, and navigation interruption days (NIDs) decreased by 8.6%, demonstrating both enhanced efficiency and ecological performance.
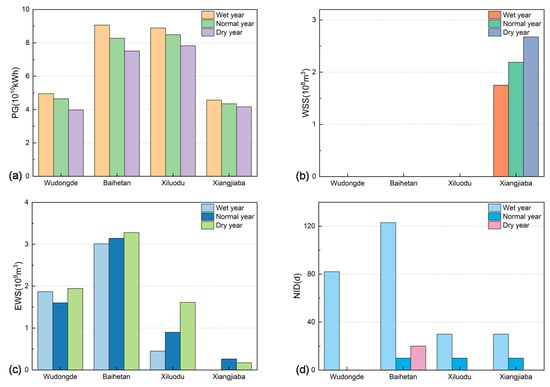
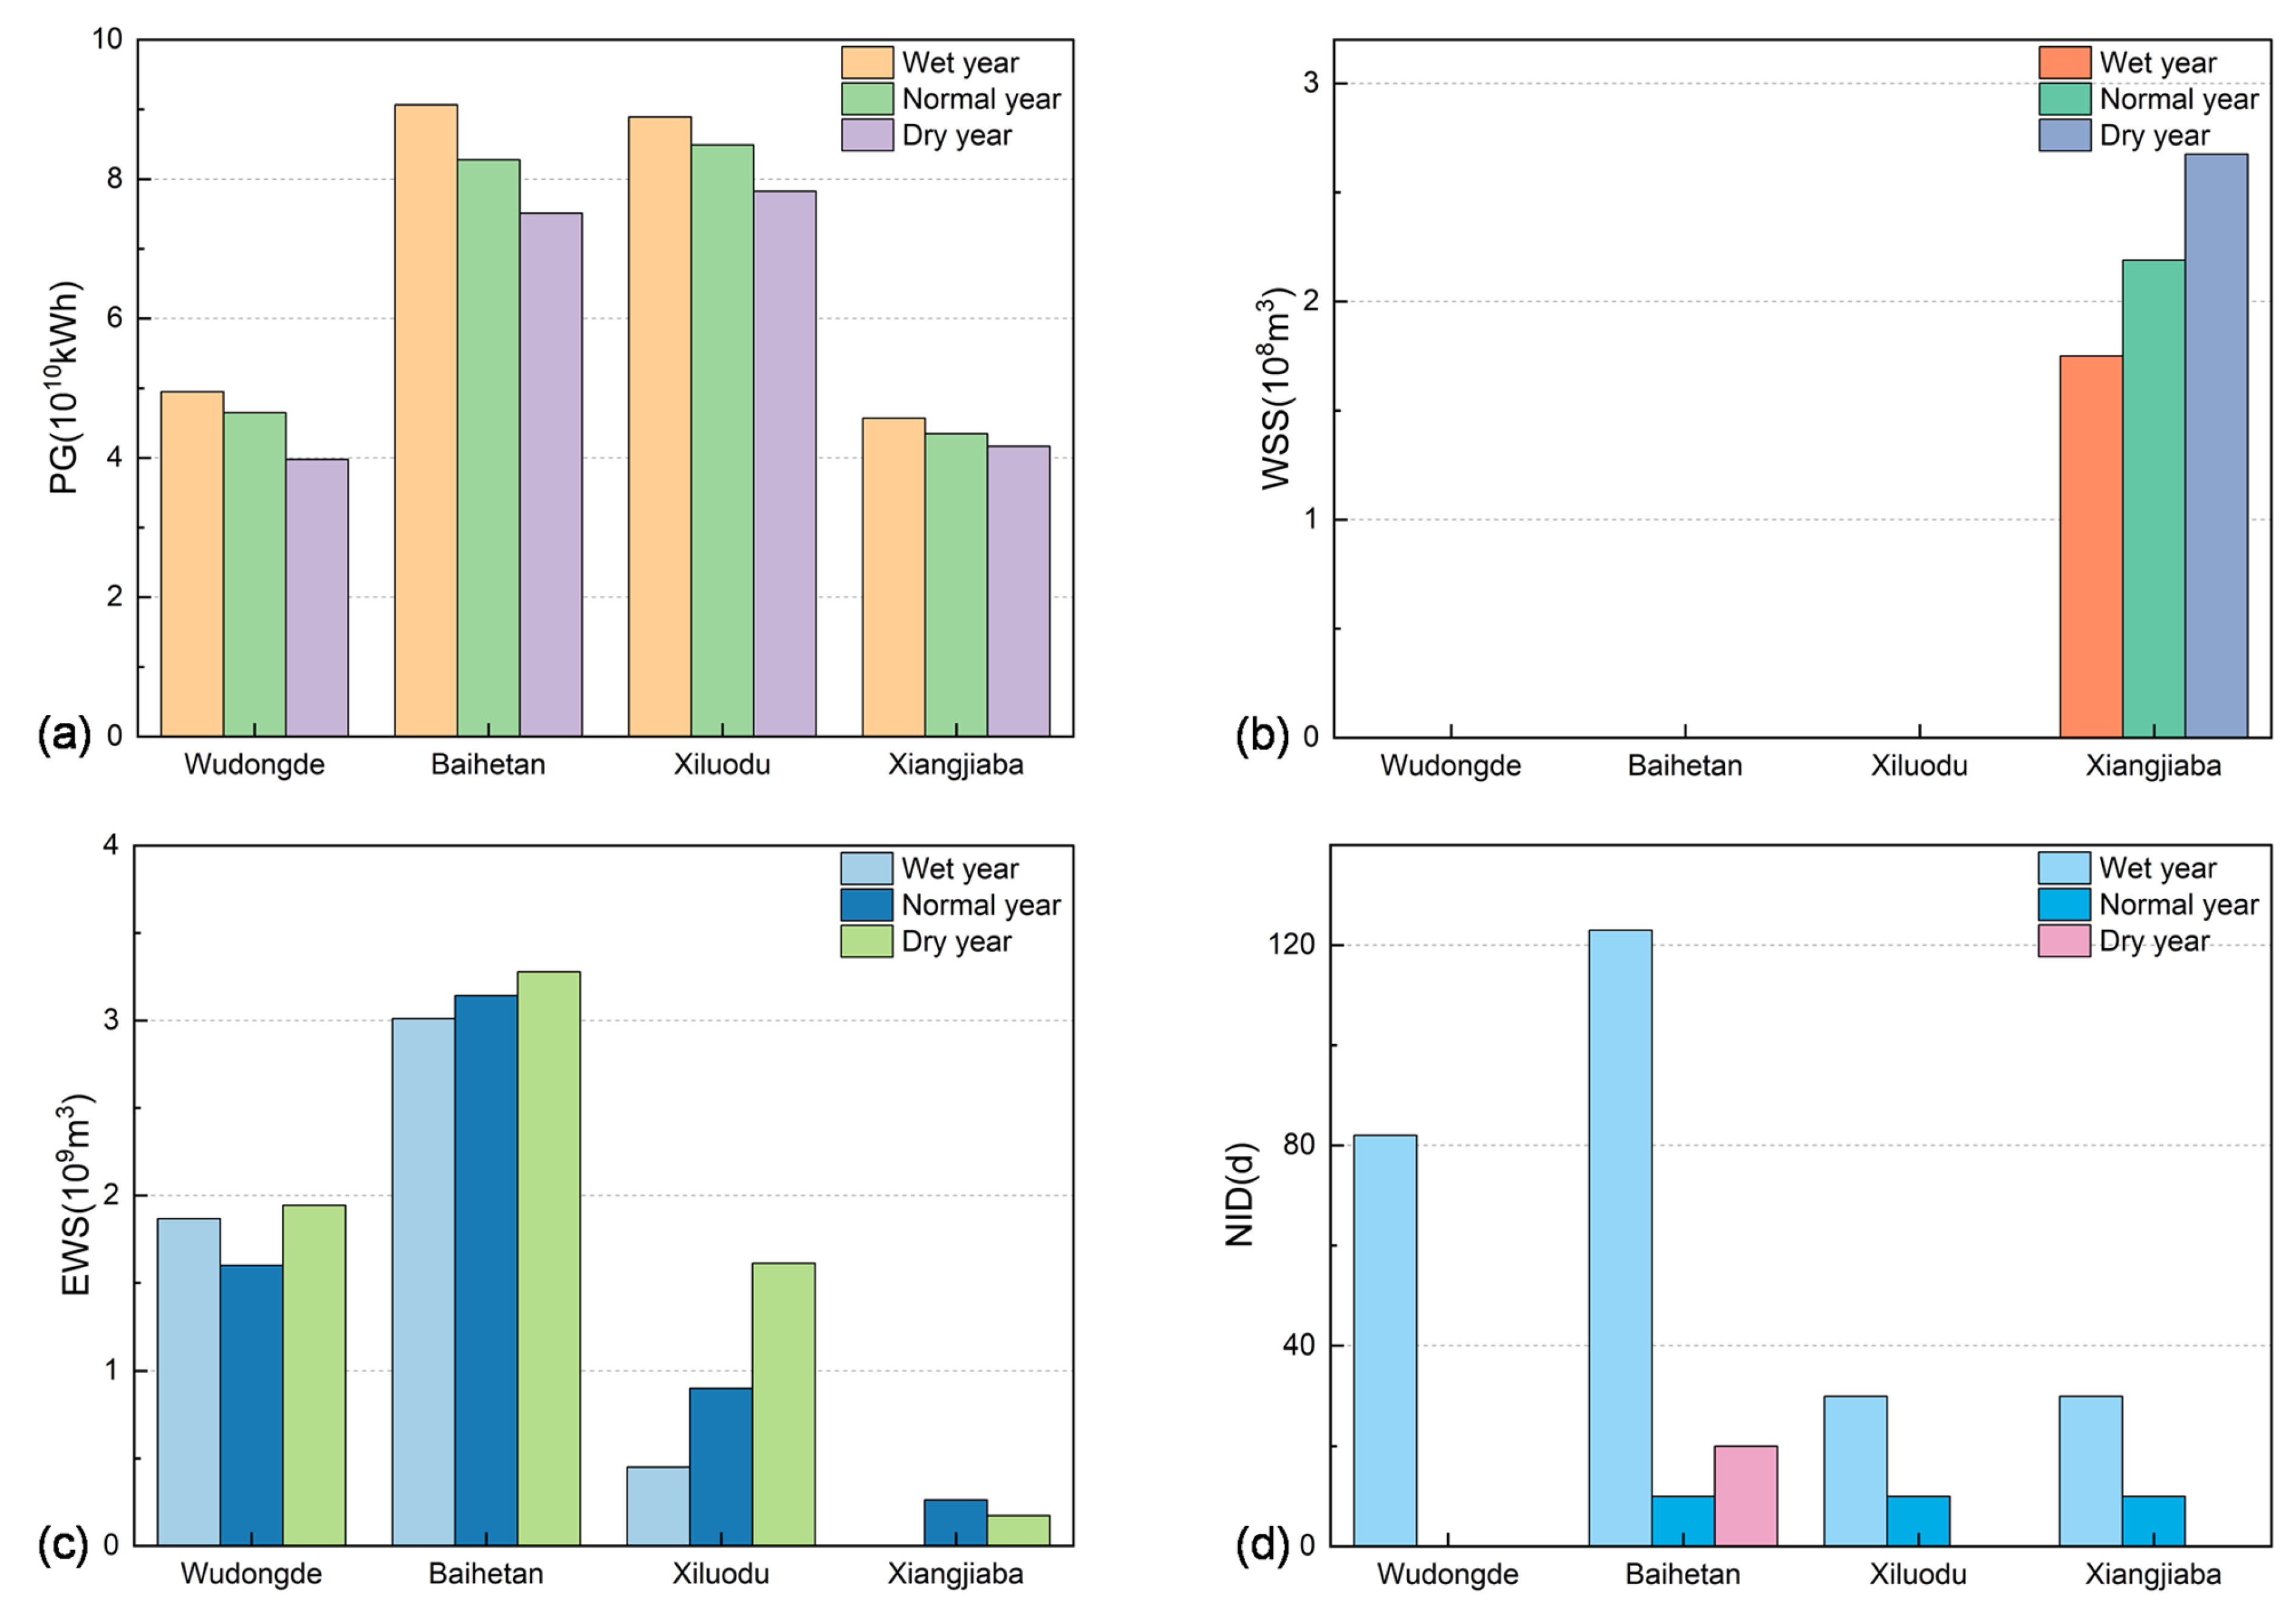
Figure 8 shows the variation in the optimal scheme values for PG, WSS, EWS, and NID across different reservoirs under various typical years. As shown in Figure 8a, the PG values of Baihetan and Xiluodu reservoirs are significantly higher than those of Wudongde and Xiangjiaba, indicating that they are key reservoirs for power generation. Compared with the remaining three reservoirs, Xiangjiaba’s PG value remains comparatively stable over the typical years. As shown in Figure 8b, only the Xiangjiaba Reservoir has a water supply function, and the WSS decreases in typical years with higher inflow. As shown in Figure 8c, the EWS of the Baihetan Reservoir is the highest, indicating a significant conflict between its high power generation (PG) and ecological flow requirements. After allocating most of the inflow for power generation, the downstream ecological flow demand cannot be fully met. As shown in Figure 8d, the NID values for all four reservoirs are highest in the wet year, indicating a significant difference in NIDs across hydrological conditions.
Figure 8.
(a) Optimal scheme outcomes of PG across wet, normal, and dry years; (b) Optimal scheme outcomes of WSS across wet, normal, and dry years; (c) Optimal scheme outcomes of EWS across wet, normal, and dry years; (d) Optimal scheme outcomes of NID across wet, normal, and dry years.
Through the quantitative analysis of power generation (PG), water supply shortages (WSSs), ecological water shortages (EWSs), and navigation interruption days (NIDs), the functional differentiation of the reservoirs becomes evident. Baihetan and Xiluodu exhibit a strong emphasis on power generation, accompanied by notable ecological pressure reflected in higher EWS values. Xiangjiaba mainly serves water supply and navigation regulation, showing the lowest EWS and NID indicators. Wudongde functions primarily as an upstream regulating reservoir, balancing inflow distribution with moderate power generation and smaller fluctuations across objectives. These quantitative distinctions clearly substantiate the differentiated operational roles of the four cascade reservoirs.
4.3. Algorithm Analysis
To evaluate the effectiveness of the NSGA-III algorithm, the NSGA-II algorithm was also applied to solve the same multi-objective scheduling optimization model for comparison. The Pareto fronts obtained in the dry year are shown in Figure 9, while those for the wet and normal years are presented in Figure A1 and Figure A2. Compared with the Pareto front obtained using NSGA-III (Figure 4), the results from NSGA-II are more dispersed and unevenly distributed, whereas NSGA-III produces a more uniform and compact distribution, reflecting improved diversity and overall solution quality.
Figure 9.
The Pareto front under the dry year solved using NSGA-II.
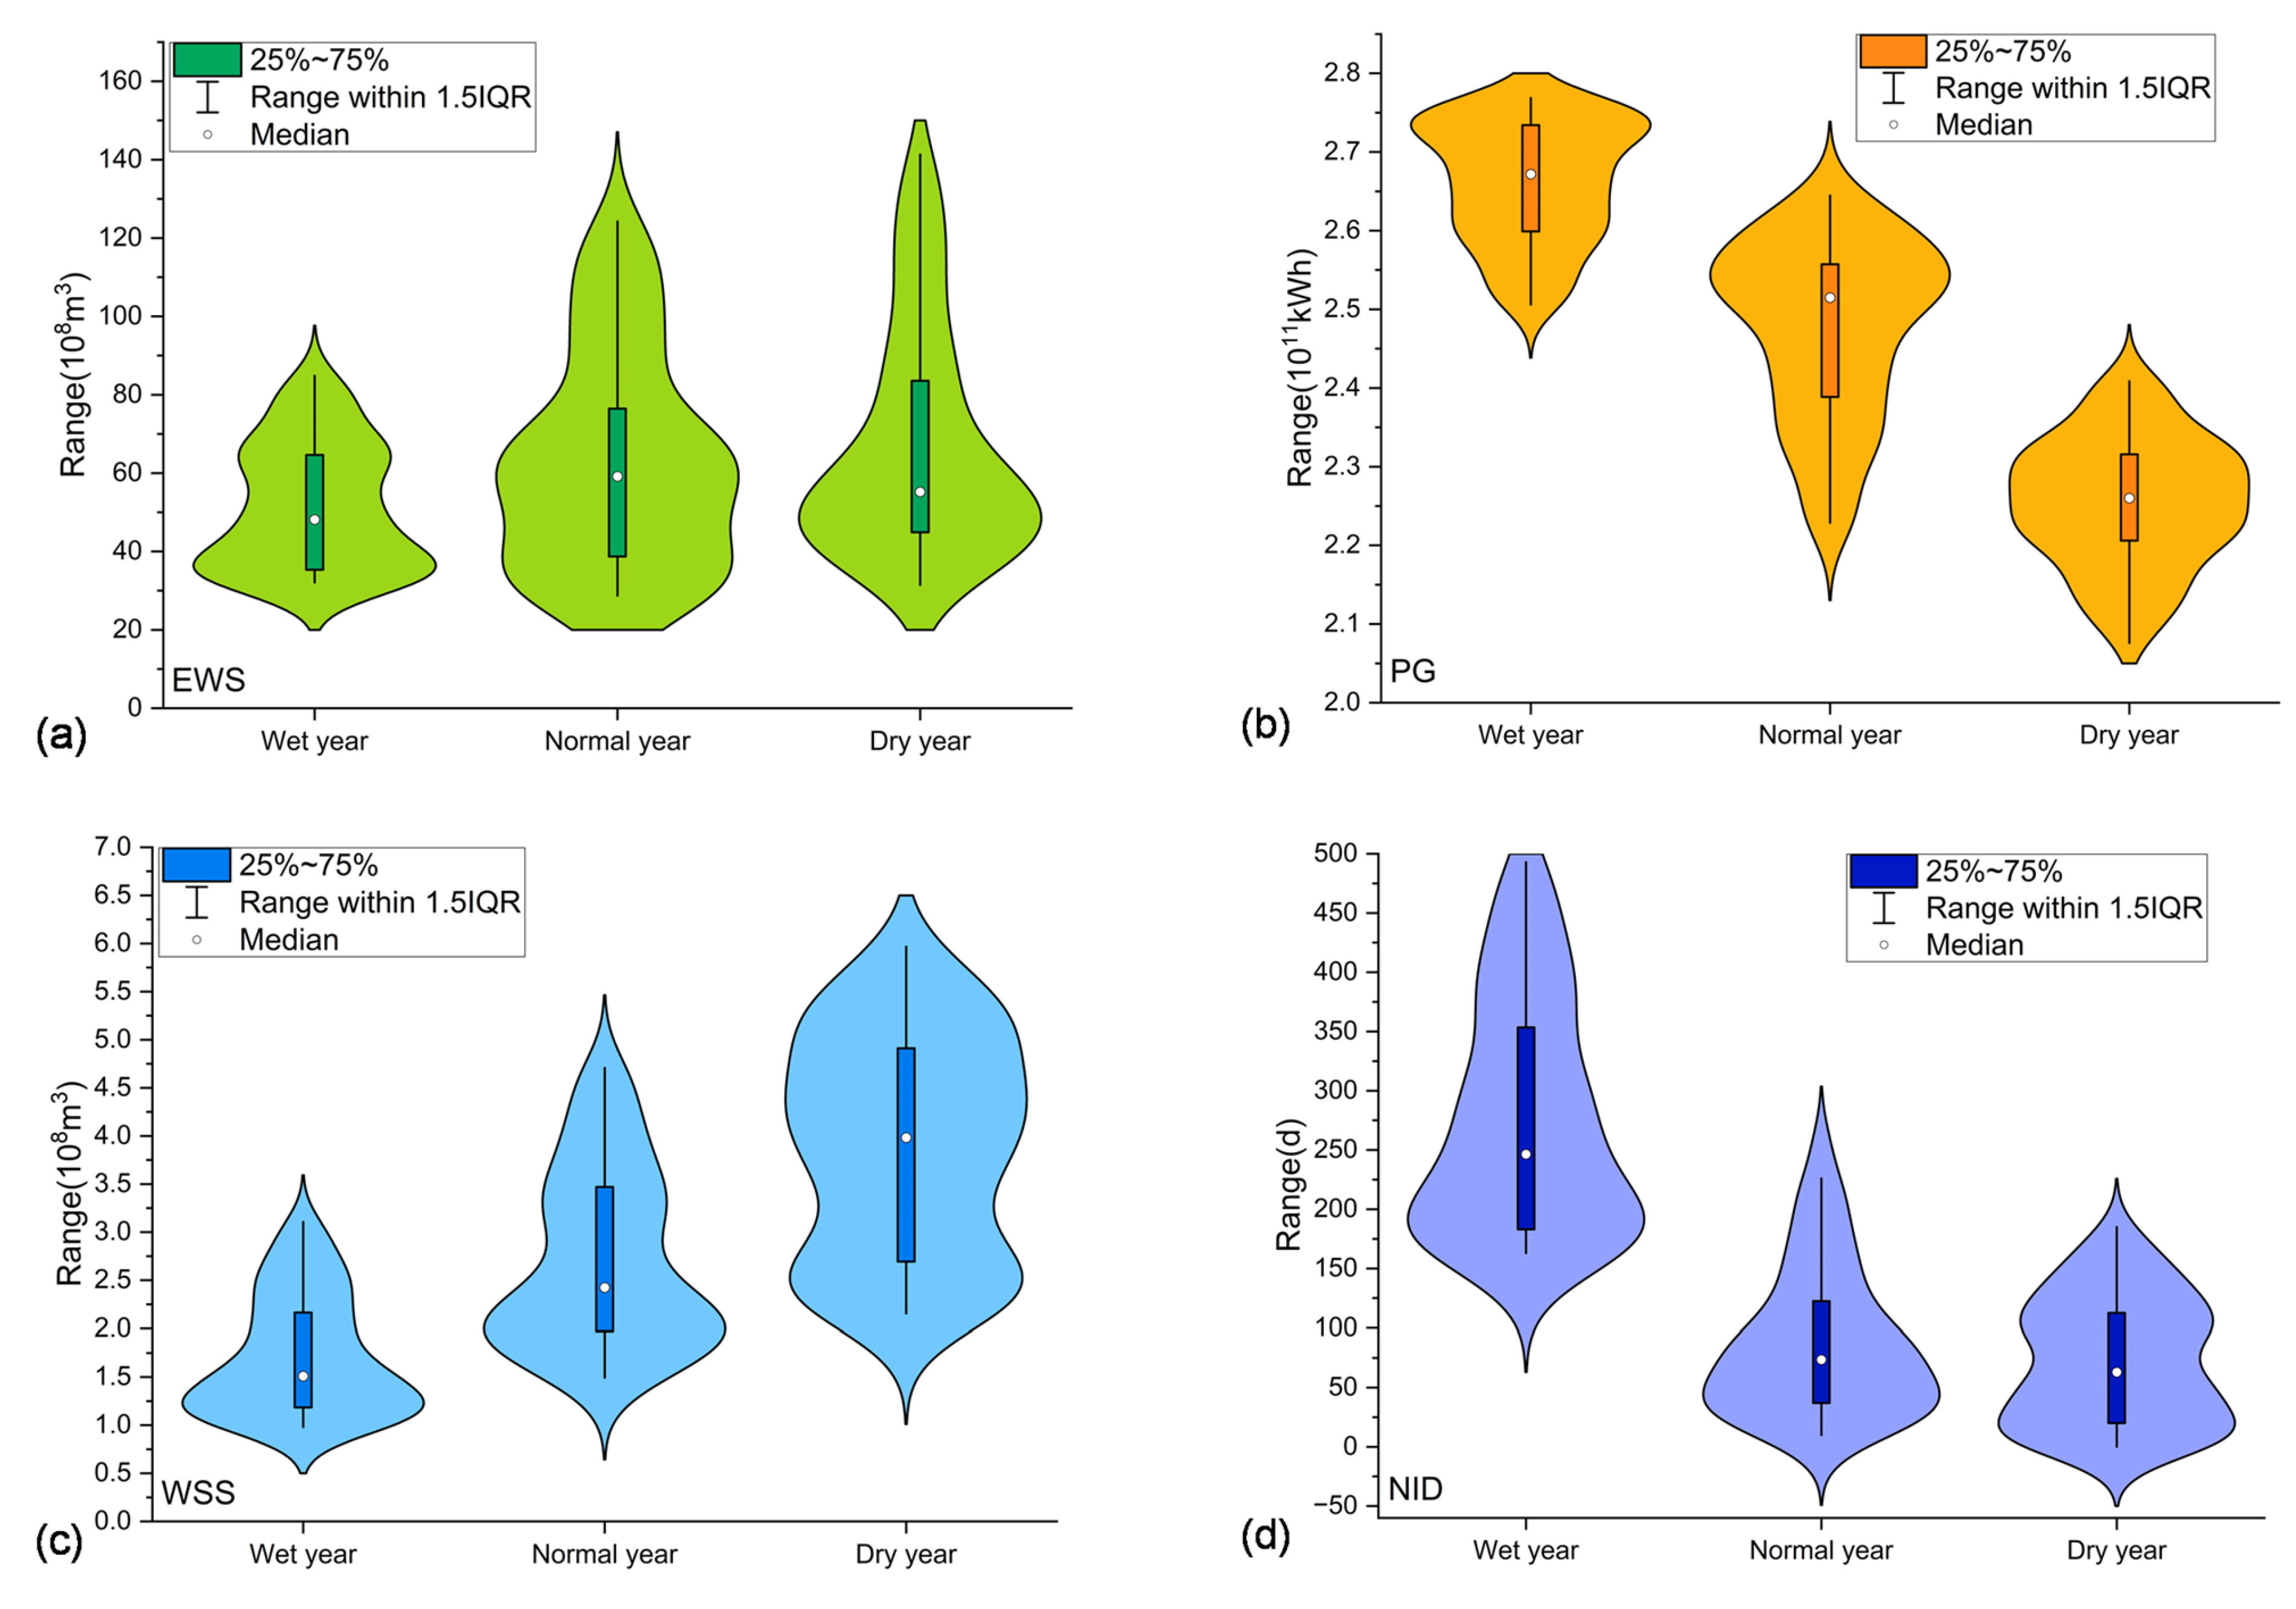
Furthermore, Figure 10 illustrates the ranges of the four objective values (EWS, PG, WSS, and NID) obtained by NSGA-II under three representative hydrological conditions. For instance, in the dry year, the objective ranges for EWS, PG, WSS, and NID under NSGA-II were 31.4–141.3 × 10⁸ m3, 2.0–2.4 × 10¹¹ kWh, 2.1–6.0 × 10⁸ m3, and 0–185 days, respectively. In contrast, the corresponding ranges obtained by NSGA-III (Figure 7) were 46.6–108 × 108 m3, 2.2–2.5 × 10¹¹ kWh, 2.0–3.8 × 10⁸ m3, and 0–98 days. The narrower and more consistent value ranges achieved by NSGA-III demonstrate its stronger robustness against hydrological variability and its ability to maintain balanced performance across objectives.
Figure 10.
(a) Variation in EWS objective values under different hydrological years solved using NSGA-II; (b) Variation in PG objective values under different hydrological years solved using NSGA-II; (c) Variation in WSS objective values under different hydrological years solved using NSGA-II; (d) Variation in NID objective values under different hydrological years solved using NSGA-II. (IQR is interquartile range).
Overall, NSGA-III outperforms NSGA-II in producing more stable and reliable Pareto-optimal solutions, making it more suitable for complex, high-dimensional multi-objective optimization in cascade reservoir operation.
4.4. Water Level Analysis
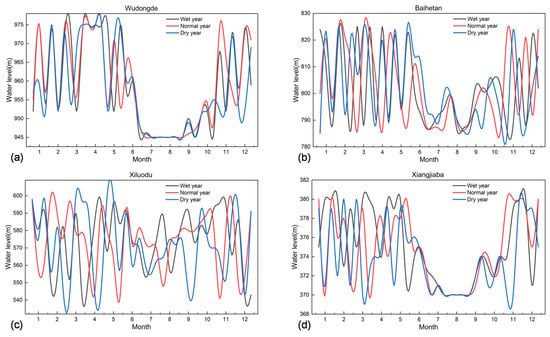
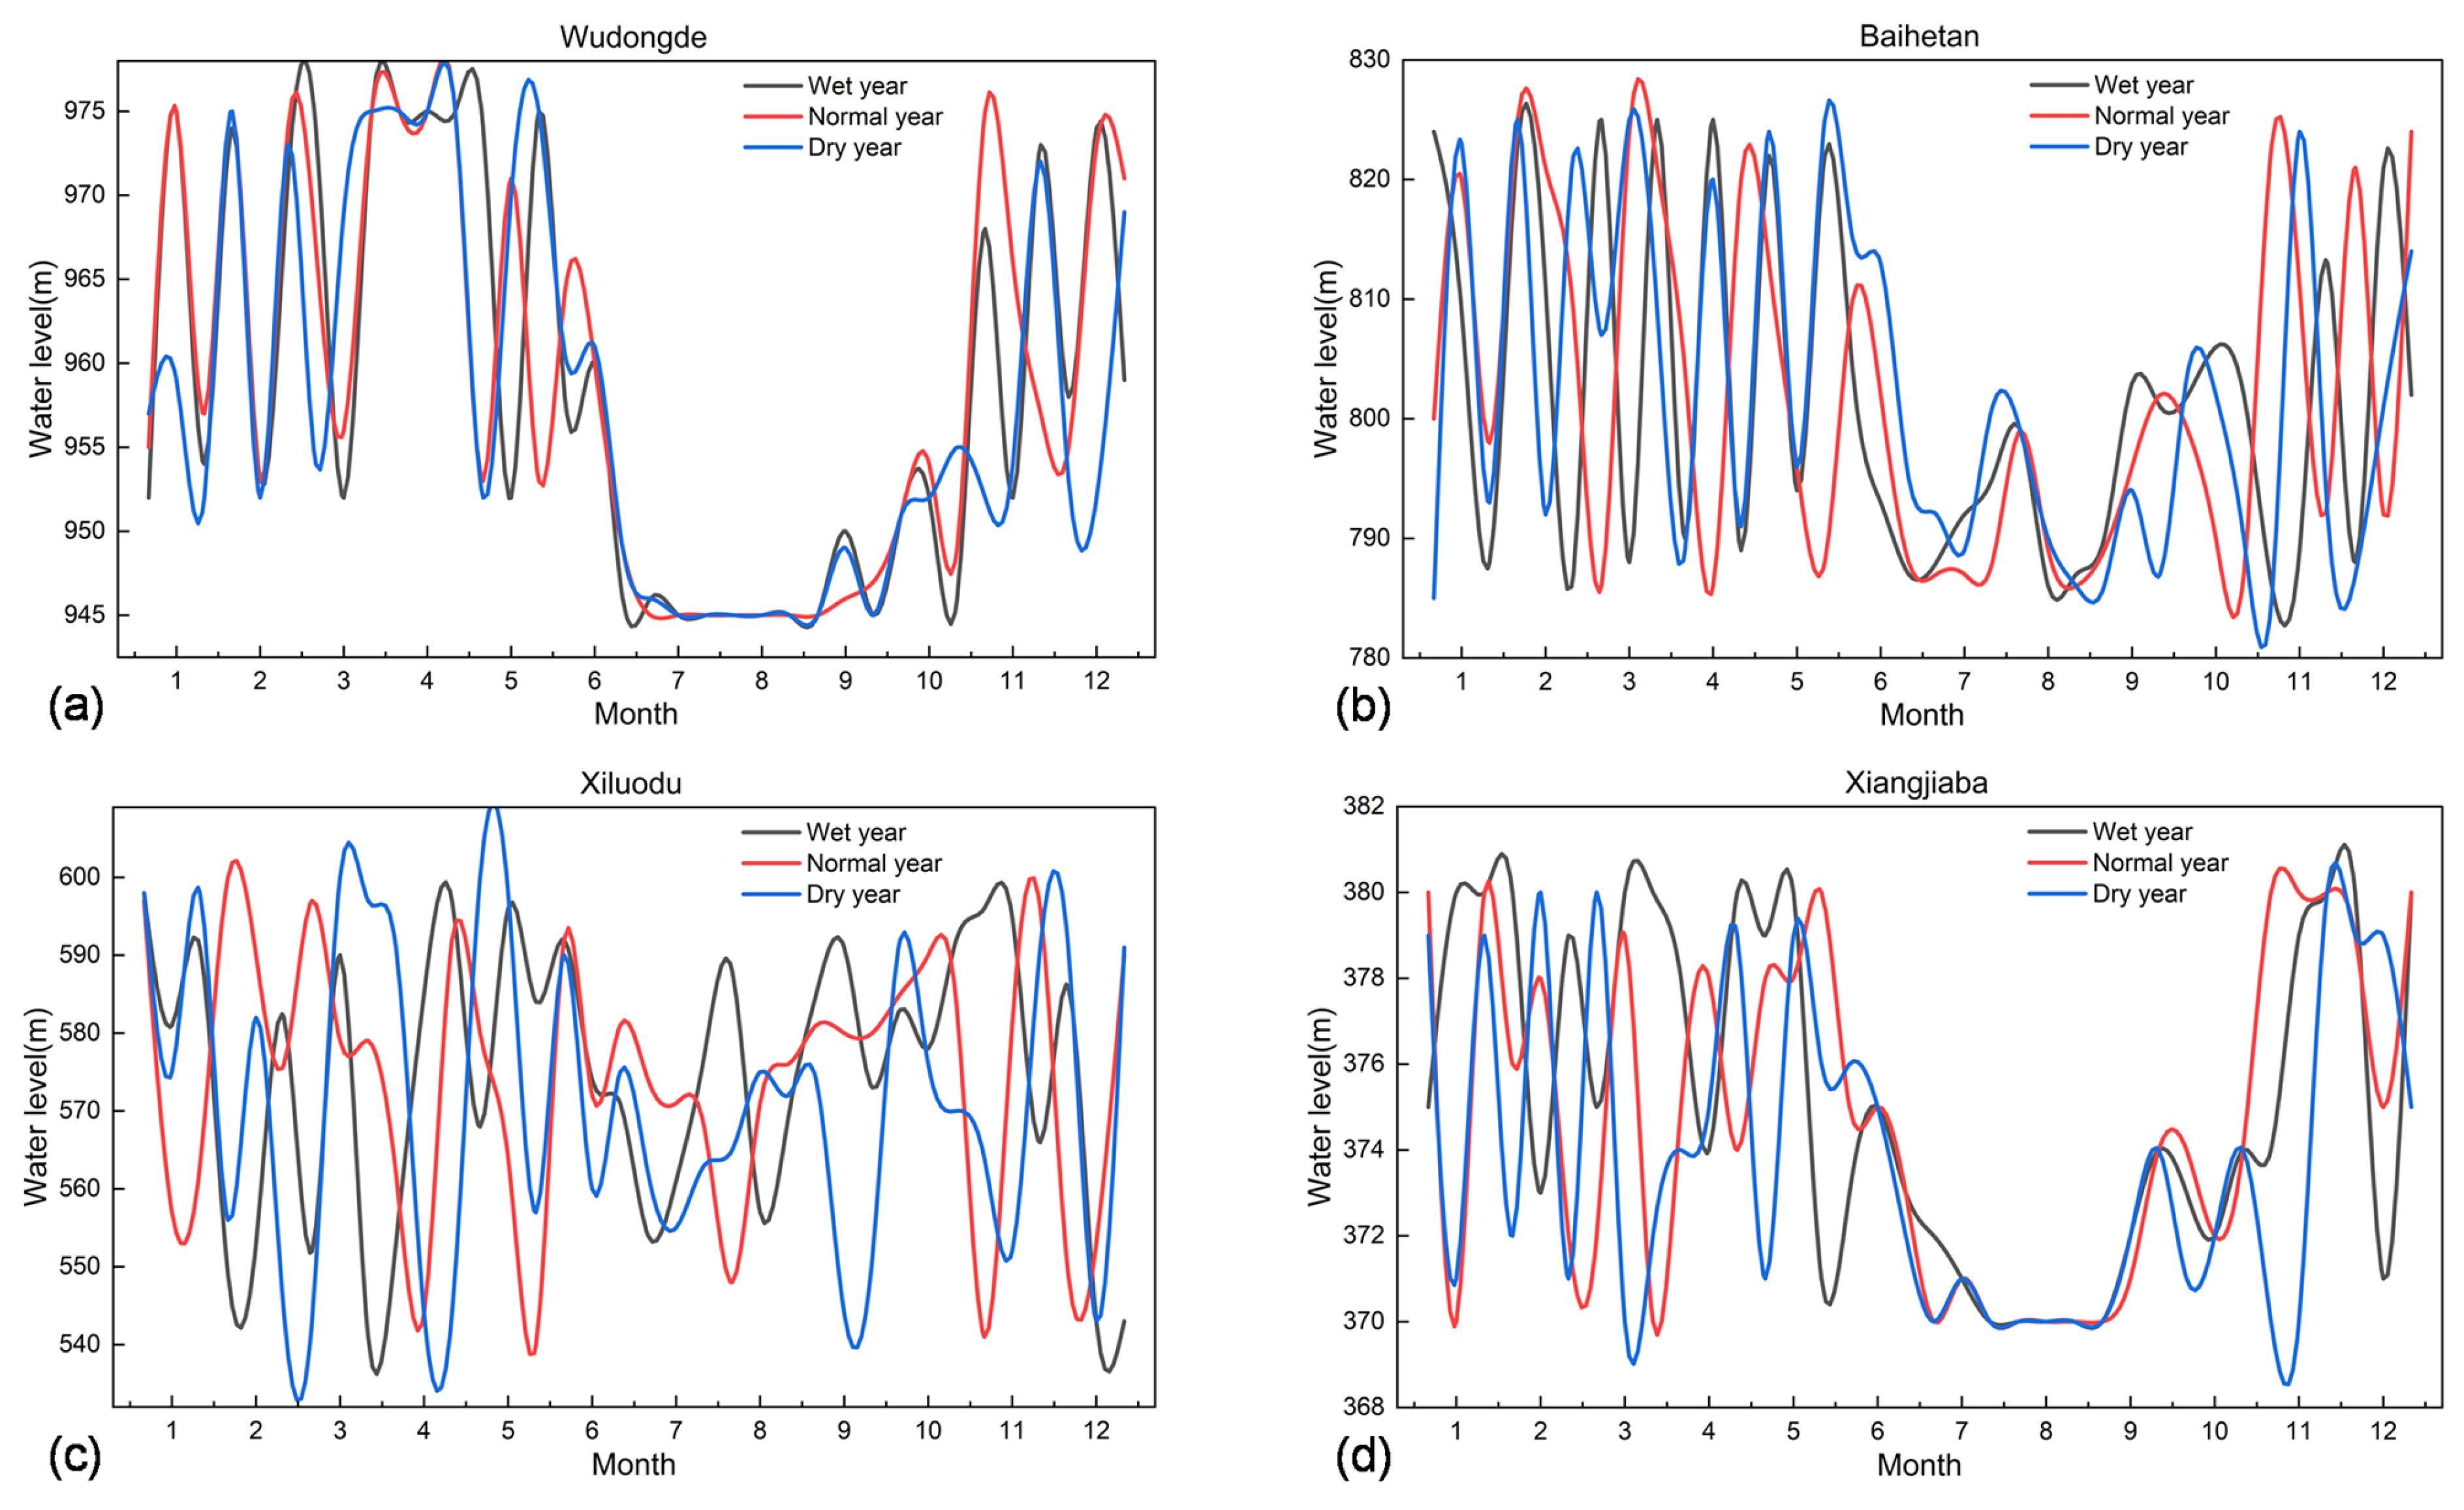
Figure 11 illustrates the operational water levels of the optimal scheme for each reservoir under different representative hydrological years. During the flood season (June to October), the Wudongde and Xiangjiaba reservoirs strictly lower their water levels to the designated flood control limits, thereby maintaining sufficient flood storage capacity and playing a critical role in protecting downstream regions. In contrast, the Baihetan and Xiluodu reservoirs, while ensuring adequate flood control capacity, adopt a more flexible operational strategy to enhance hydropower generation benefits. During the non-flood season (November to May), the reservoirs adjust their water levels dynamically to achieve an optimal balance among multiple competing demands.
Figure 11.
(a) Process curves of optimized water level regulation in typical hydrological years for the Wudongde Reservoir; (b) Process curves of optimized water level regulation in typical hydrological years for the Baihetan Reservoir; (c) Process curves of optimized water level regulation in typical hydrological years for the Xiluodu Reservoir; (d) Process curves of optimized water level regulation in typical hydrological years for the Xiangjiaba Reservoir.
4.5. Outflow and Output
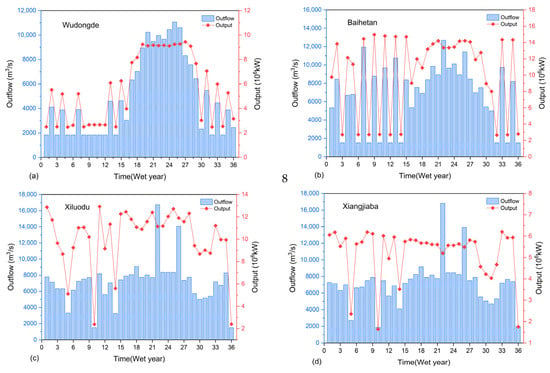
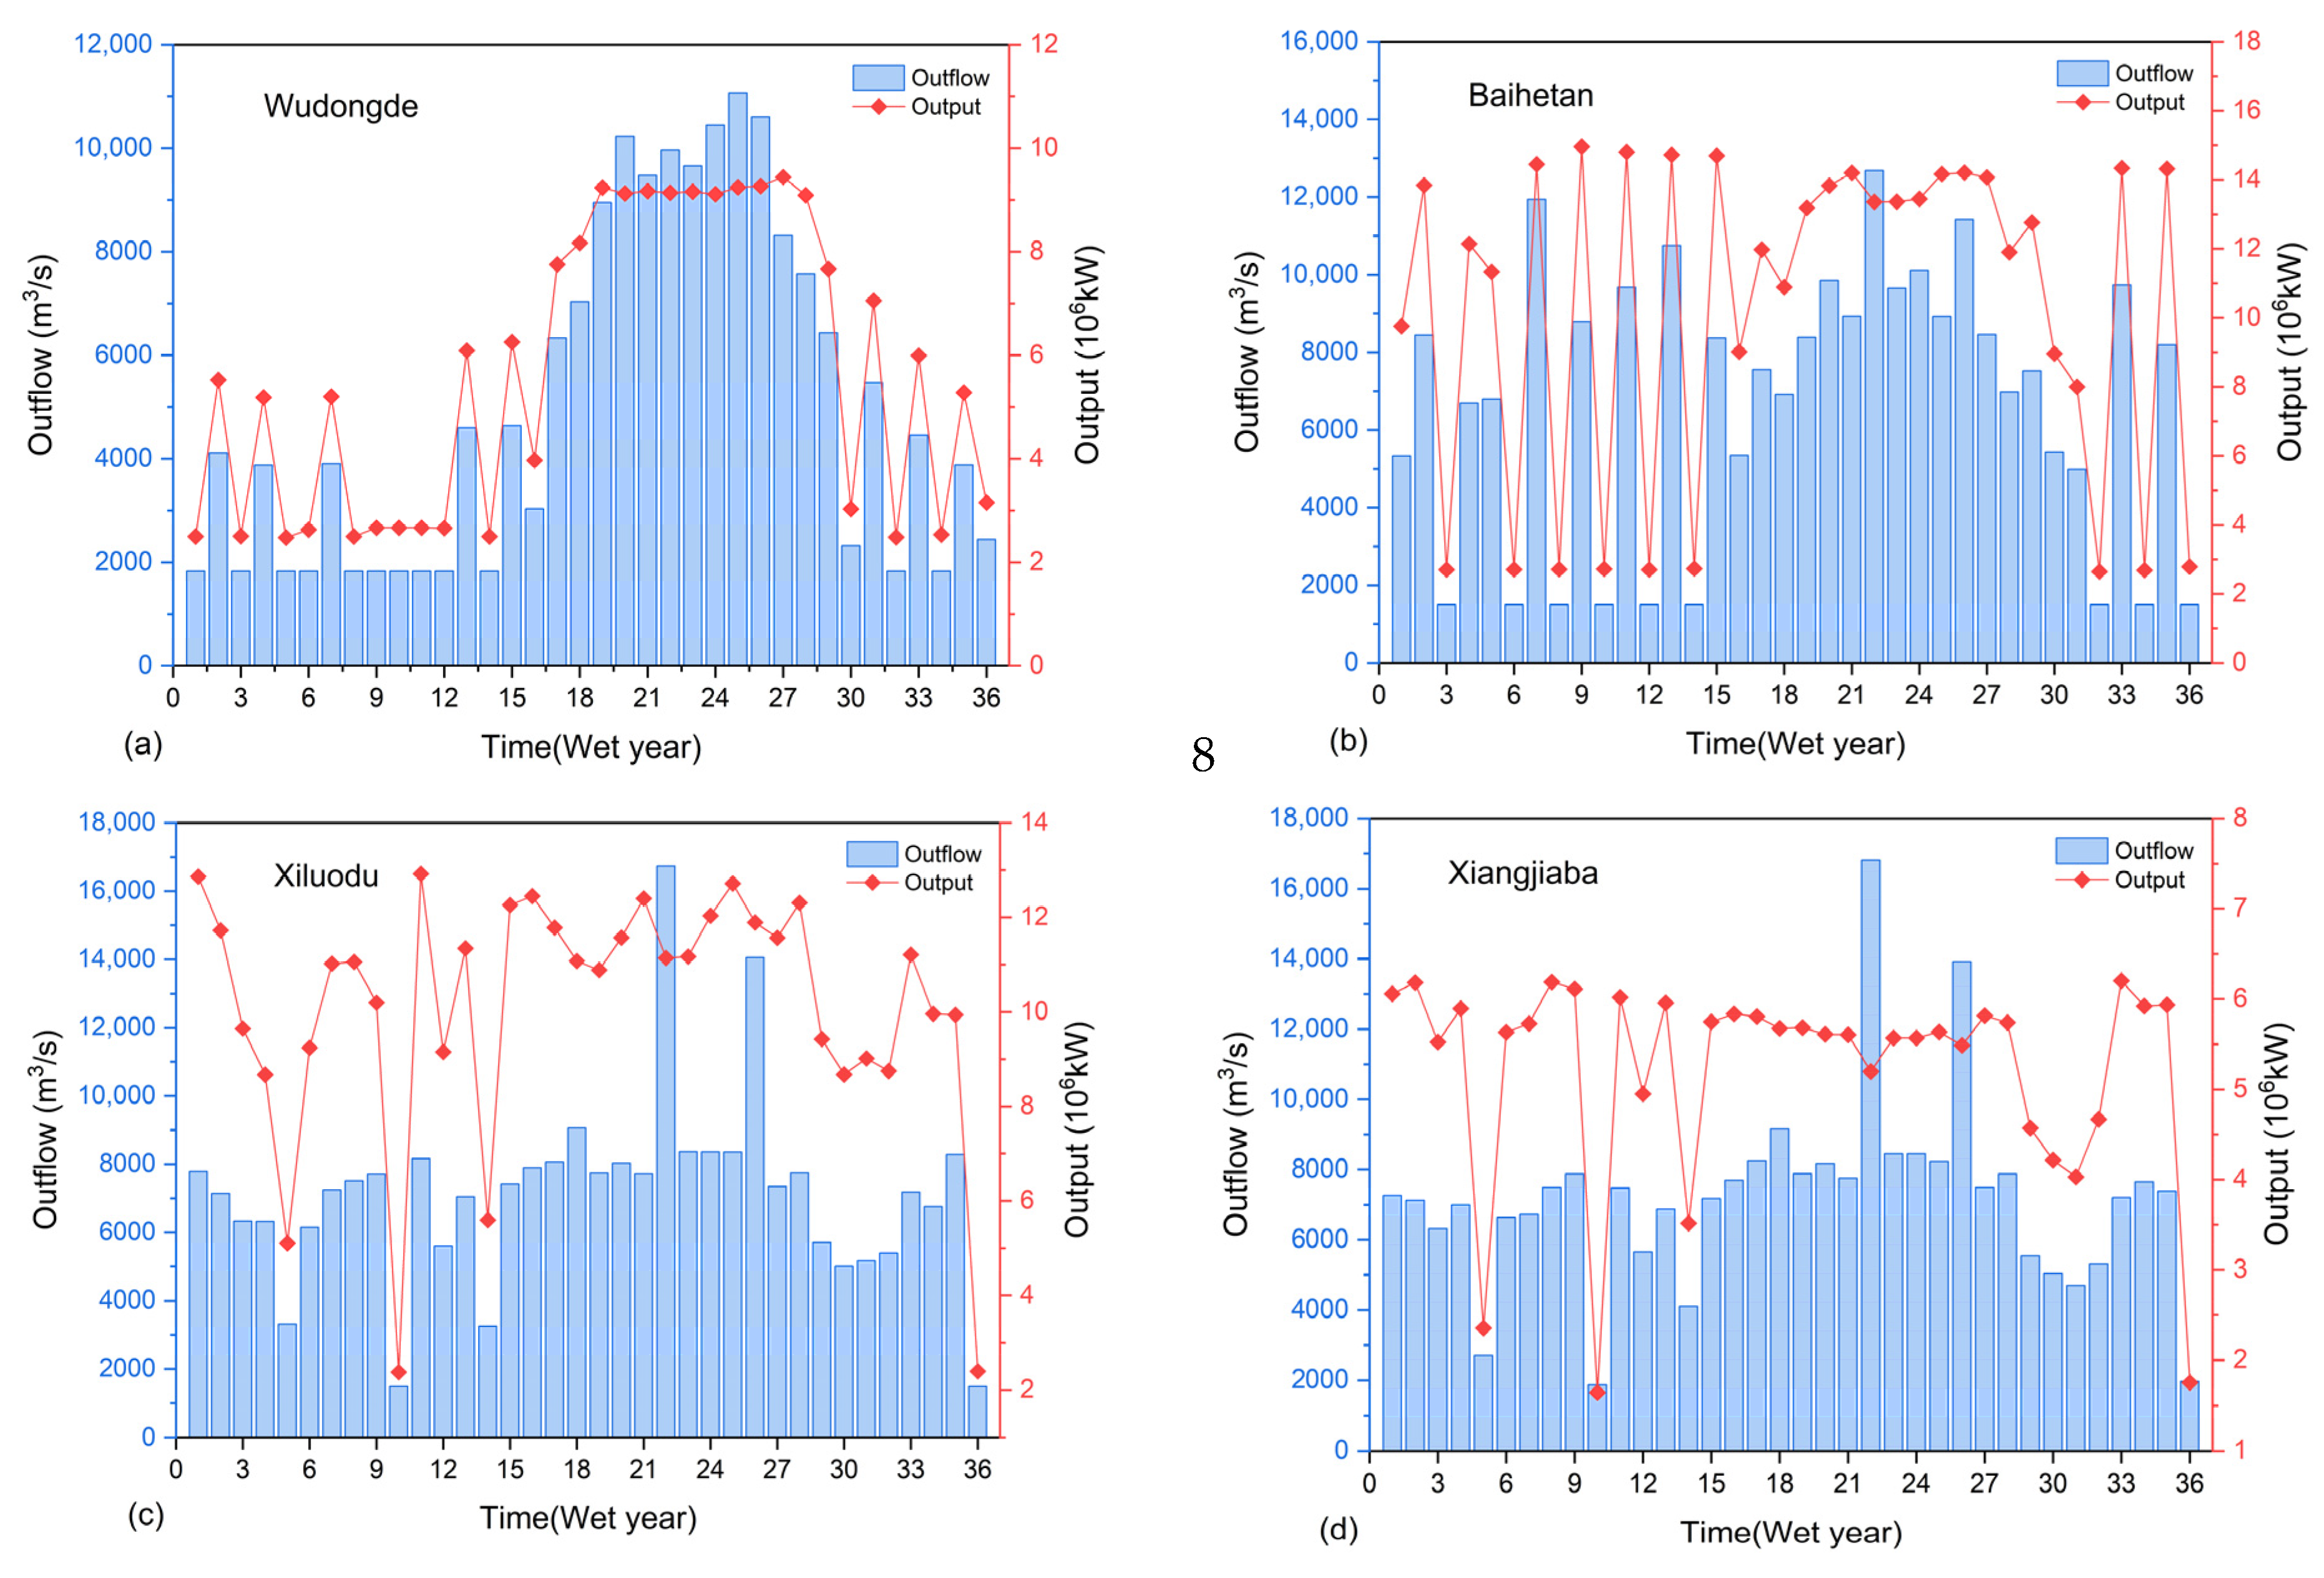
As shown in Figure 12, the trends of outflow and output for each reservoir under the wet year are consistent (the pictures of normal and dry years are provided in Figure A3 and Figure A4 in the Appendix A). During the non-flood season, the upstream inflow is relatively low, so the reservoir discharge is also low, maintaining a high water level for power generation. During floods, enhanced upstream inflow leads to greater discharge. Wudongde Reservoir shows an average discharge exceeding 9800 m3/s, with an average output exceeding 9.2 million kW. The Baihetan Reservoir exhibits notable variability in both outflow and output, with maximum values observed at 12,680 m3/s and 14.95 million kW. Due to the flexible operation strategy, Wudongde takes on more flood control duties, while the Baihetan Reservoir maintains high power generation output even in the non-flood season. Because the algorithm needs to balance multiple objectives during the iteration process, the outflow fluctuates.
Figure 12.
(a) Statistics on the outflow and output of the Wudongde reservoir under the condition of wet year; (b) Statistics on the outflow and output of the Baihetan reservoir under the condition of wet year; (c) Statistics on the outflow and output of the Xiluodu reservoir under the condition of wet year; (d) Statistics on the outflow and output of the Xiangjiaba reservoir under the condition of wet year.
Additionally, in determining the optimal scheme, considering the importance of electricity in economic development, the weight of power generation (PG) is the highest. Therefore, in the actual operation of the hydropower station, in order to pursue the maximum power generation efficiency, the scheduling system will prioritize the rapid increase in the reservoir water level to the optimal power generation zone. This artificial control leads to the reservoir in a short period of time experiencing a sharp rise in water level, which in turn makes the discharge flow produce significant impulse-type fluctuations. This unnatural flow alteration not only disrupts the original hydrological rhythm of the river but also causes rapid fluctuations in downstream flow velocity, water depth, and water level within short time intervals, resulting in pronounced hydraulic oscillations. Especially during the peak power generation hours, this fluctuation effect will be further amplified, causing persistent impacts on the downstream hydrodynamic environment. Consequently, the allocation of weights directly affects the optimal operating scheme of the system, which in turn leads to significant differences in the outflow results. During the flood season, the maximum inlet flow to the Xiludu Reservoir climbed to 16,733 m3/s, while the downstream Xiangjiaba Reservoir was subjected to a peak flow of 16,820 m3/s, which posed a severe test for the joint scheduling of the ladder reservoirs. By mid-April, the power generation capacity of the Xiluodu Reservoir reaches its peak at 12.92 million kW; while by late November, the power generation capacity of the Xiangjiaba Reservoir reaches its peak at 6.2 million kW. The outflow trends of the Xiluodu and Xiangjiaba reservoirs are similar, as both face relatively low inflows during this period and are subject to similar flow restrictions and minimum ecological flow requirements. Therefore, when formulating operation strategies, the coordinated optimization of the Xiluodu and Xiangjiaba reservoirs should be considered.
4.6. Meeting Water Supply, Ecology and Navigation Objectives
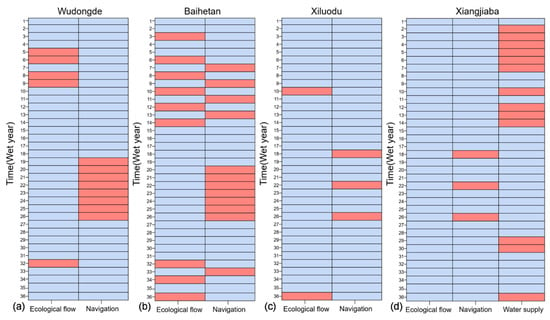
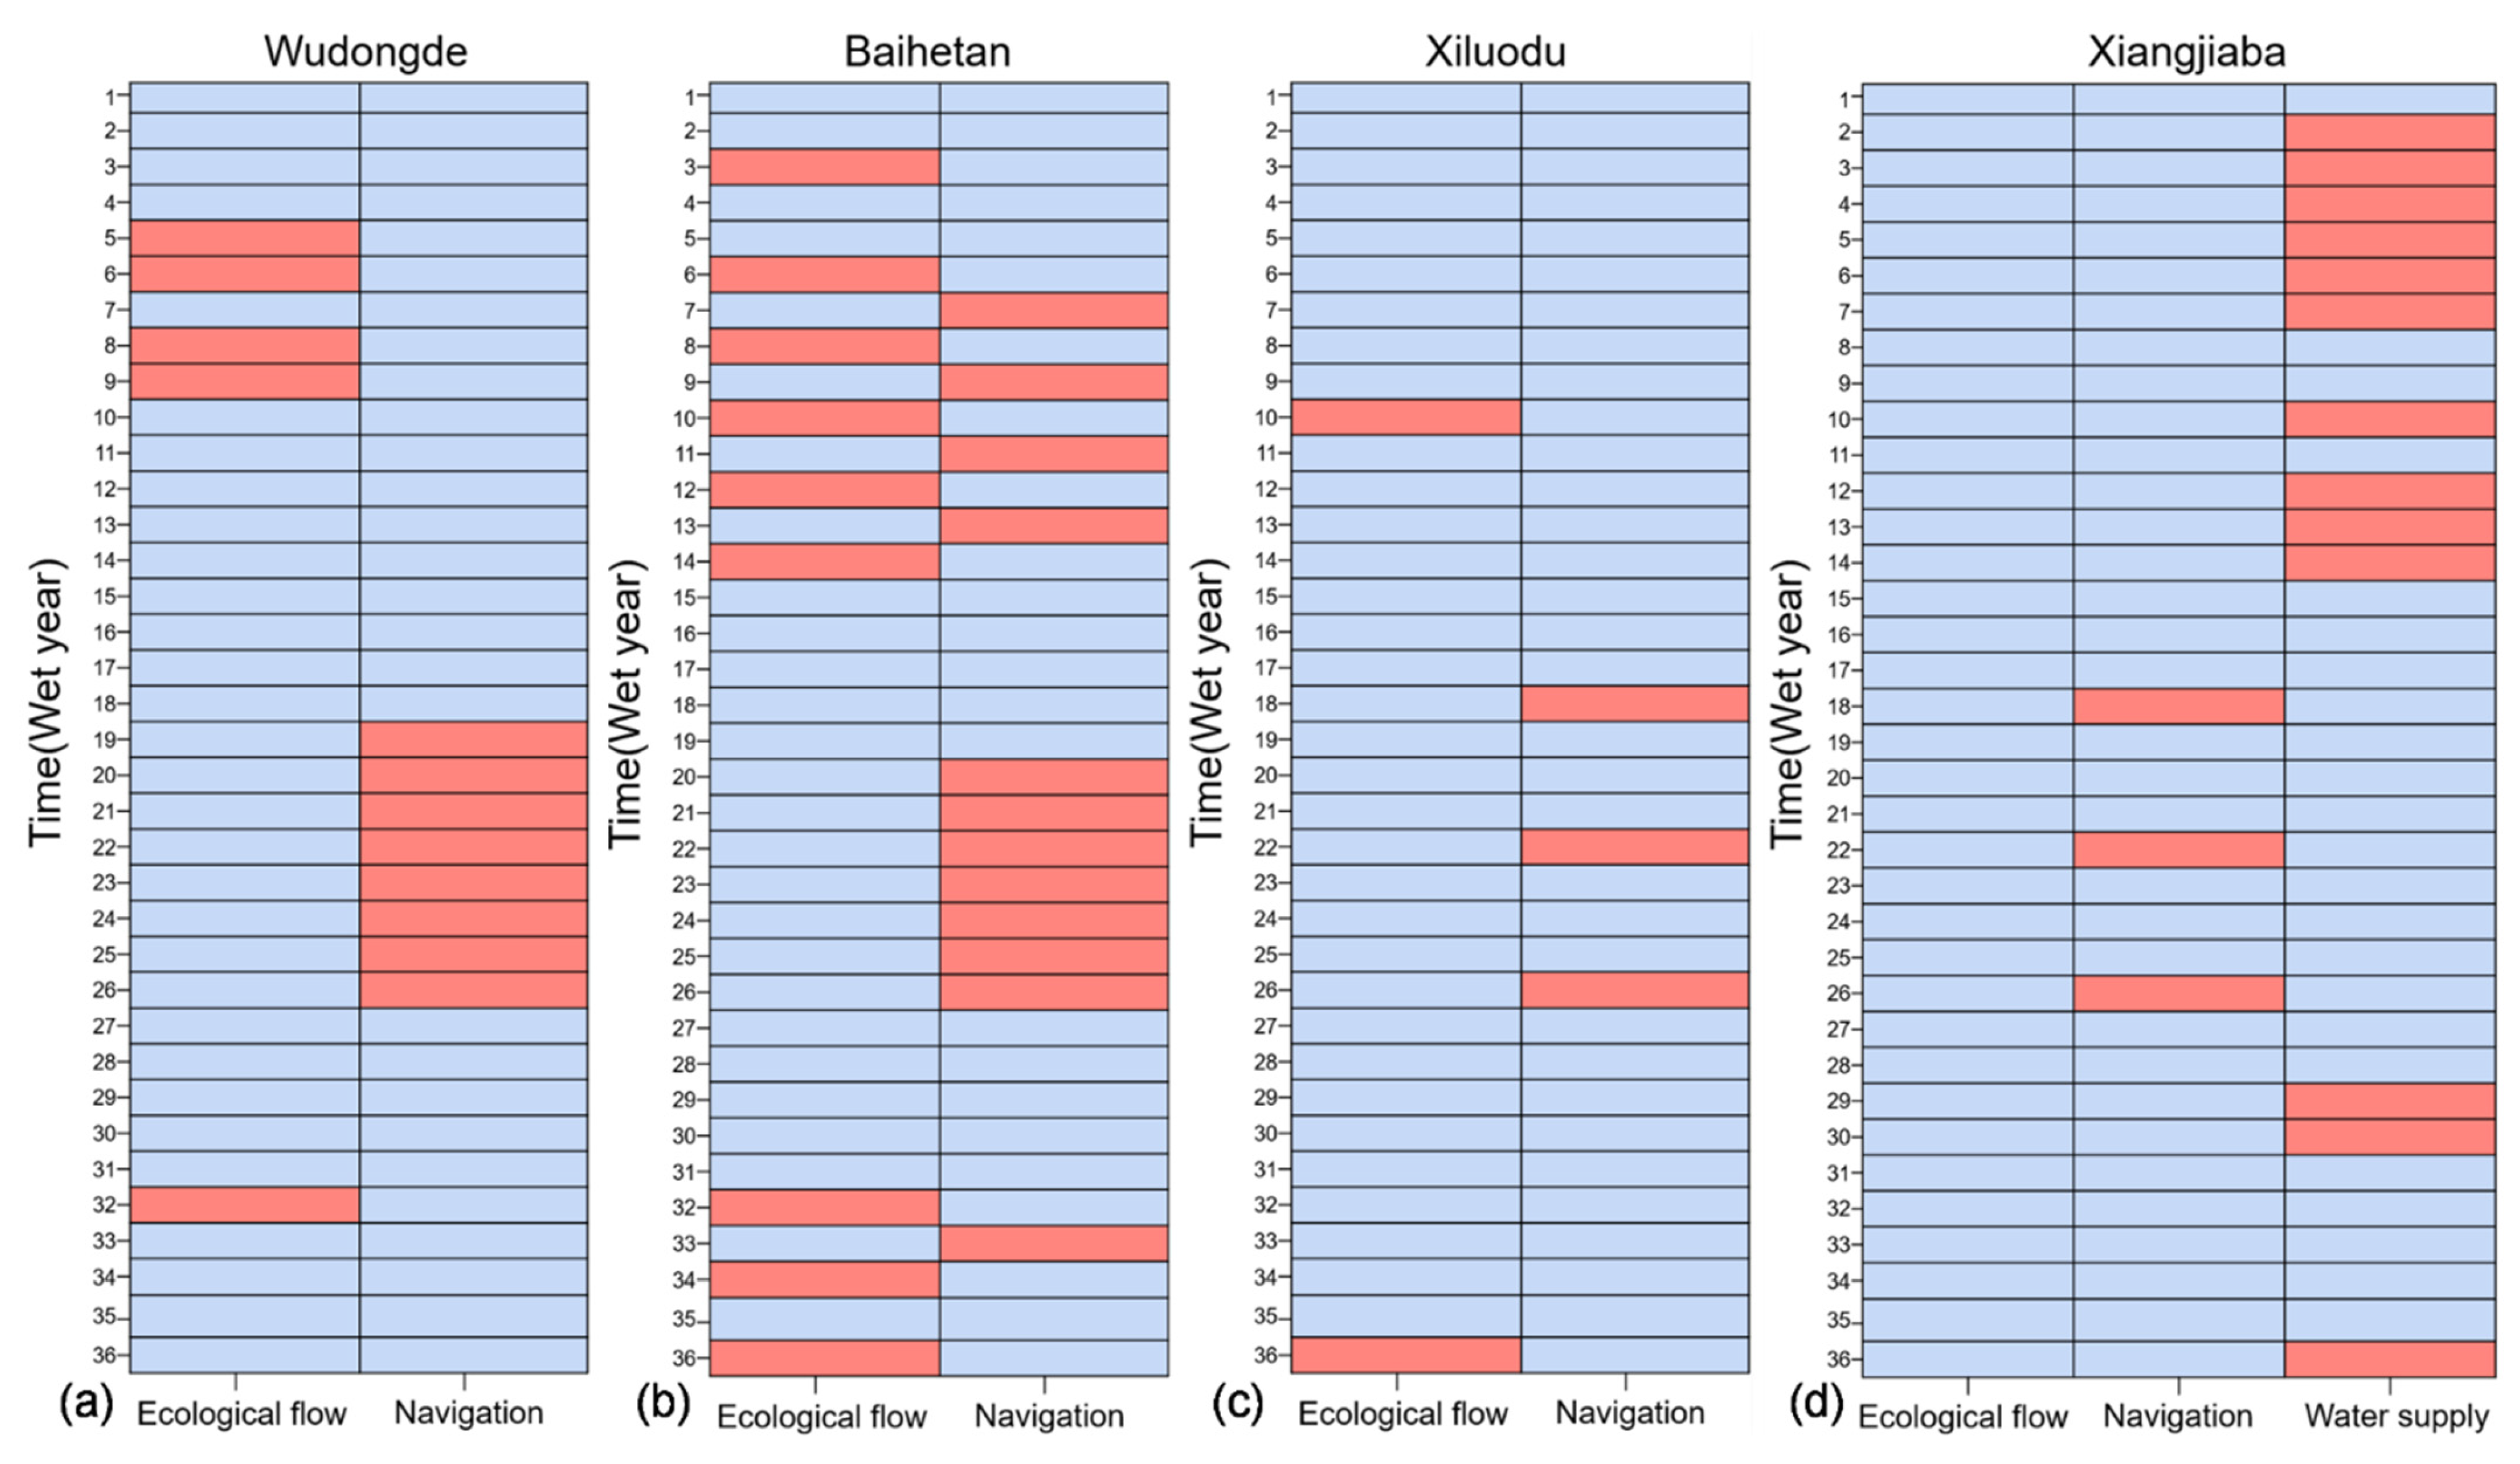
Under the optimized operation scenario in wet year, the achievement of water supply, ecology and navigation goals for the four lower Jinsha River reservoirs (Wudongde, Baihetan, Xiluodu, and Xiangjiaba) is shown in Figure 13, where the orange markers clearly indicate specific time periods during which water supply, ecology, or navigation requirements were not met.
Figure 13.
(a) Satisfaction of objectives for water supply, ecology and navigation during the wet year for the Wudongde Reservoir; (b) Satisfaction of objectives for water supply, ecology and navigation during the wet year for the Baihetan Reservoir; (c) Satisfaction of objectives for water supply, ecology and navigation during the wet year for the Xiluodu Reservoir; (d) Satisfaction of objectives for water supply, ecology and navigation during the wet year for the Xiangjiaba Reservoir.
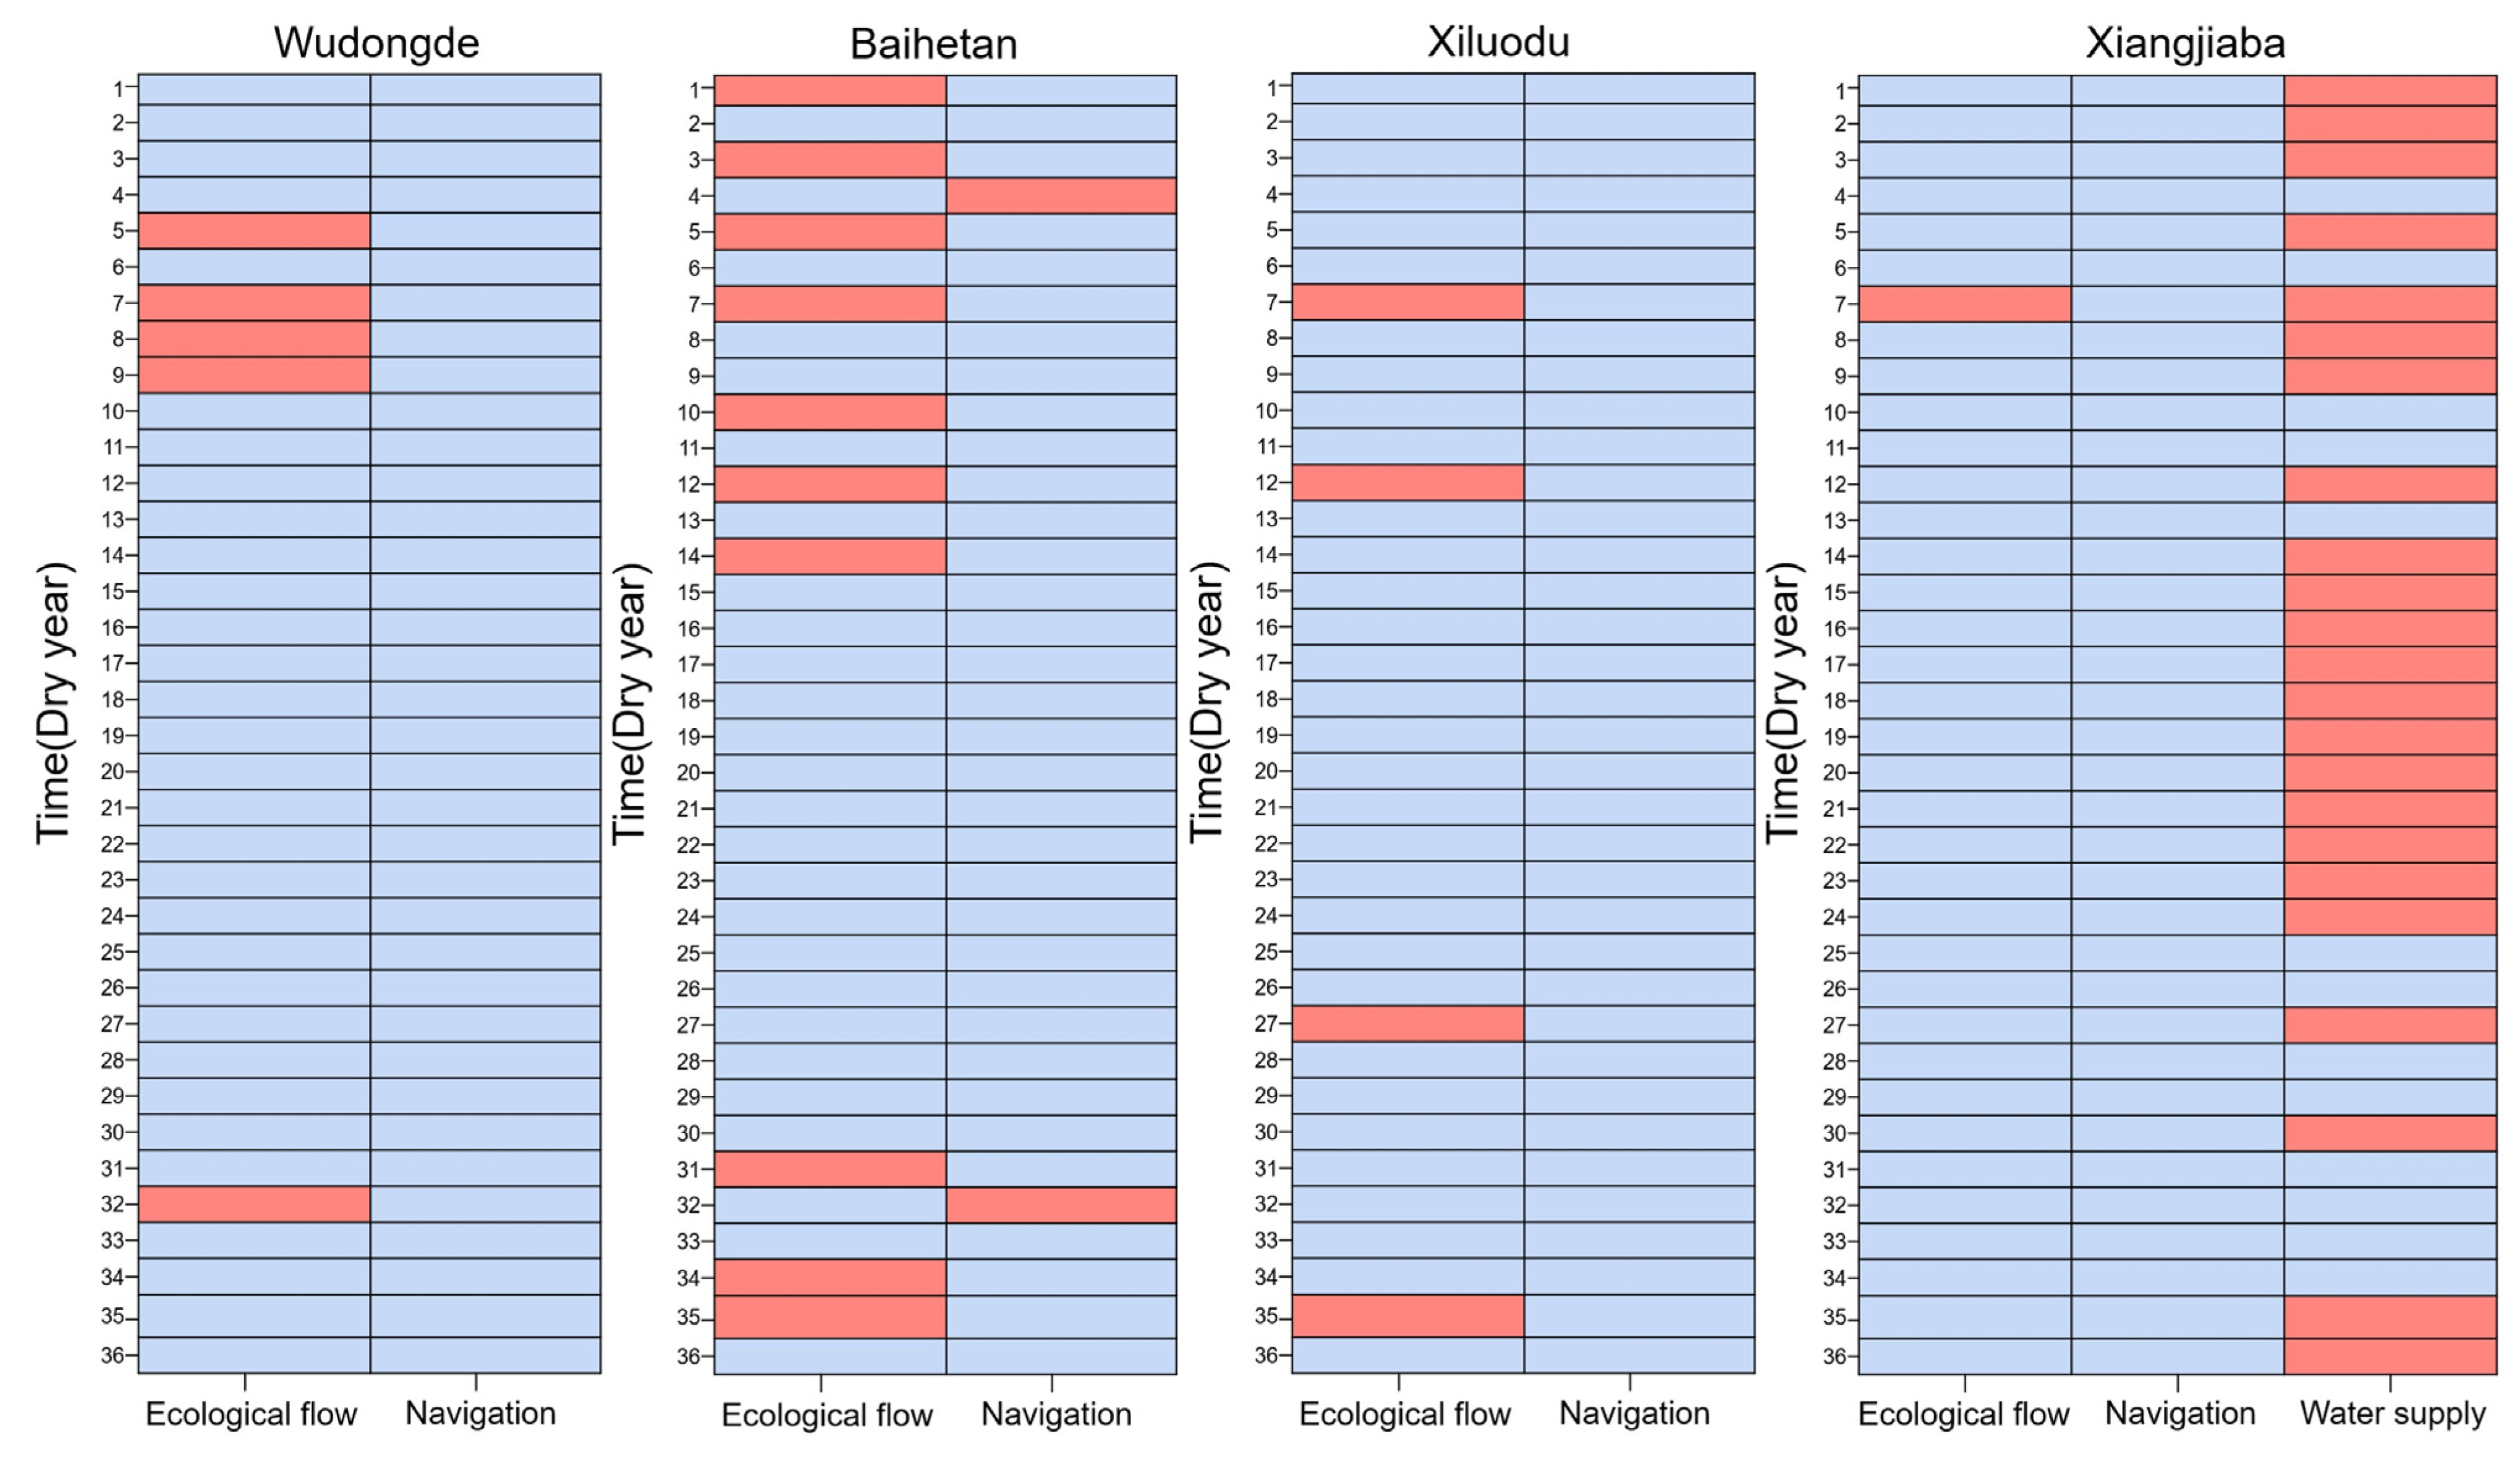
Specifically, the actual discharge flow from Wudongde Reservoir in February, March, and November did not achieve the set ecological flow targets. Baihetan Reservoir also experienced non-compliance with ecological flow standards during multiple consecutive periods, primarily due to significant fluctuations in its outflow, making it difficult to maintain a stable ecological discharge flow during certain periods. The Xiluodu and Xiangjiaba reservoirs also had a few instances where ecological flow targets were not met. In terms of navigation goals, statistical data indicate that most instances of non-compliance with navigation requirements occurred during the flood season. During this period, increased inflow caused reservoir discharge flows to exceed the upper limit required for safe navigation operations, thereby impacting navigation conditions on the waterway. The pictures of normal year and dry year are shown in Figure A5 and Figure A6 in the Appendix A.
However, the Baihetan Reservoir occasionally experienced water shortages in low-flow periods. This situation arises because the optimized operation strategy first focuses on maximizing power generation efficiency and rapidly increasing the reservoir water levels. Subsequently, the strategy temporarily lowers the reservoir elevation at selected times after higher water levels to safeguard downstream navigability. In years with high rainfall, large inflows cause significant fluctuations in the optimal operation scheme. When the flow is too high, it fails to meet navigation needs; when the flow is insufficient, it fails to meet ecological demands. In contrast, in the normal year, the changes in the optimal operation scheme are more stable, which is more conducive to achieving ecology and navigation goals. During the flood season, with sufficient rainfall, the Xiangjiaba Reservoir only needs to deliver a small amount of water to fulfill supply requirements. However, during the non-flood season, many months fail to meet water supply demands due to the relatively small weight given to water supply and the intense conflict for water use.
5. Management Implications and Future Research
5.1. Management Implications
Based on the optimization results and scenario analysis, several regular relationships can be identified. First, power generation is in significant conflict with ecological and navigation objectives: increasing hydropower output generally leads to ecological water shortages and a rise in navigation interruption days. Second, power generation and water supply demonstrate partial synergy: under rational scheduling, enhanced power efficiency can alleviate supply shortages. Third, ecology and water supply are in conflict: guaranteeing higher ecological flows often reduces the water available for agriculture and urban–industrial uses. Fourth, hydrological variability plays a critical role: in wet years, conflicts among objectives are most pronounced, whereas in dry years, ecological and water supply pressures dominate. Finally, the functional division of reservoirs is evident: Baihetan and Xiluodu show the sharpest trade-offs between power and ecology, while Xiangjiaba mainly serves water supply and navigation regulation.
From these regular observations, several policy-oriented implications emerge. First, differentiated scheduling strategies should be adopted across hydrological years: navigation–ecology conflicts should be prioritized in wet years, whereas water supply security should be emphasized in dry years. Second, functional zoning of reservoir roles is recommended: Baihetan and Xiluodu should focus on power generation, while Xiangjiaba should play a leading role in water supply and navigation, thereby forming a coordinated operational pattern. Third, a dynamic weight adjustment mechanism should be established, allowing trade-offs among objectives to be adaptively tuned in real time, incorporating both monitoring data and stakeholder preferences. The dynamic adjustment of trade-off weights aims to flexibly modify the relative importance of objectives such as power generation, ecology, water supply, and navigation in response to real-time conditions. In practice, this can be achieved through an adaptive decision-support system that updates weights based on monitoring data and operational priorities—for example, increasing ecological weight during fish spawning seasons or emphasizing supply security in droughts. Such adaptive weighting enables reservoir operators to continuously align optimization outcomes with changing hydrological conditions and management goals, enhancing both system resilience and decision responsiveness. Together, these implications provide valuable guidance for sustainable and equitable cascade reservoir governance.
The proposed framework has strong potential to support real-time reservoir scheduling applications. By embedding the multi-objective optimization module into an online operation platform, the model can continuously receive updated hydrological and meteorological data, re-optimize decision variables, and generate near real-time operational recommendations. This enables adaptive control under changing inflow or demand conditions, improving system flexibility and resilience.
5.2. Limitations and Future Research Directions
Although the proposed framework effectively coordinates multiple objectives in cascade reservoir operation, two main limitations remain, each suggesting a direction for future enhancement.
(1) Algorithmic limitation and adaptive enhancement.
The current study employs the standard NSGA-III algorithm for multi-objective optimization. While it performs well in generating diverse Pareto-optimal solutions, its convergence speed and adaptability to dynamic inflow conditions can be further improved. Future versions can integrate adaptive reference-vector adjustment, learning-based parameter tuning, or hybrid NSGA-III schemes that combine local search and elitism to improve convergence and stability. Such extensions would further strengthen the methodological robustness of the framework and enable real-time adaptability under dynamic inflow or operational constraints.
(2) Carbon dimension limitation and integration of low-carbon objectives.
The present framework emphasizes hydrological, ecological, and socio-economic objectives but does not explicitly incorporate carbon-related goals. This omission restricts its application to low-carbon or climate-oriented reservoir management. Future research should extend the model to integrate carbon-reduction objectives, enhancing its sustainability relevance and policy applicability [43]. Specifically, the framework can be expanded along three paths:
- Integration of carbon-emission modules: Estimate CO2 and CH4 emissions from reservoir surfaces and turbines, convert them into carbon-equivalent indicators, and incorporate them as an additional carbon-minimization objective.
- Coupling with regional energy systems: Link reservoir scheduling with regional or national power system models to quantify avoided carbon emissions from renewable hydropower relative to fossil-based generation.
- Incorporation of carbon pricing and policy instruments: Introduce carbon prices, emission quotas, and renewable portfolio standards as external policy parameters to evaluate the influence of carbon-trading mechanisms on reservoir operation decisions.
By addressing these two limitations through adaptive algorithmic design and low-carbon integration, the framework’s methodological robustness and sustainability significance will be substantially enhanced, enabling more resilient, climate-responsive, and policy-relevant reservoir governance in future applications.
6. Conclusions
This study developed a comprehensive multi-objective optimization and evaluation framework for the coordinated operation of the lower Jinsha River cascade reservoirs, addressing the simultaneous goals of flood control, power generation, water supply, ecological protection, and navigation. The framework integrates a high-dimensional optimization algorithm with a multi-criteria evaluation model to balance competing objectives and provide decision support for sustainable river basin management. Through the model application and result interpretation, several key insights emerge. First, the trade-offs among economic, ecological, and social objectives are dynamic and strongly influenced by hydrological variability, emphasizing the importance of adaptive operation rules. Second, the functional differentiation of the four reservoirs—upstream regulation, midstream energy production, and downstream navigation support—forms the structural foundation for coordinated scheduling. Third, scenario-based analysis offers a practical means of identifying robust operation strategies across wet, normal, and dry years, enhancing resilience under uncertain inflow conditions. Collectively, these findings provide a foundation for more adaptive, coordinated, and sustainable management of large-scale cascade reservoir systems.
Author Contributions
Conceptualization, Z.Z.; methodology, Z.Z.; software, W.T.; validation, Z.Z.; formal analysis, W.T.; resources, Z.Z.; data curation, W.T.; writing—original draft preparation, W.T.; writing—review and editing, Z.Z.; visualization, W.T.; supervision, Z.Z.; project administration, Z.Z.; funding acquisition, Z.Z. All authors have read and agreed to the published version of the manuscript.
Funding
This research was funded by the National Natural Science Foundation of China, grant number 71971150, and the Project of Research Center for System Sciences and Enterprise Development, grant number Xq16B05.
Institutional Review Board Statement
Not applicable.
Informed Consent Statement
Not applicable.
Data Availability Statement
The authors do not have permission to share data.
Acknowledgments
The authors would like to thank the editors for their encouragement, and the reviewers for their valuable comments and suggestions.
Conflicts of Interest
The authors declare no conflicts of interest.
Appendix A
Figure A1.
The Pareto front under the wet year solved using NSGA-II.
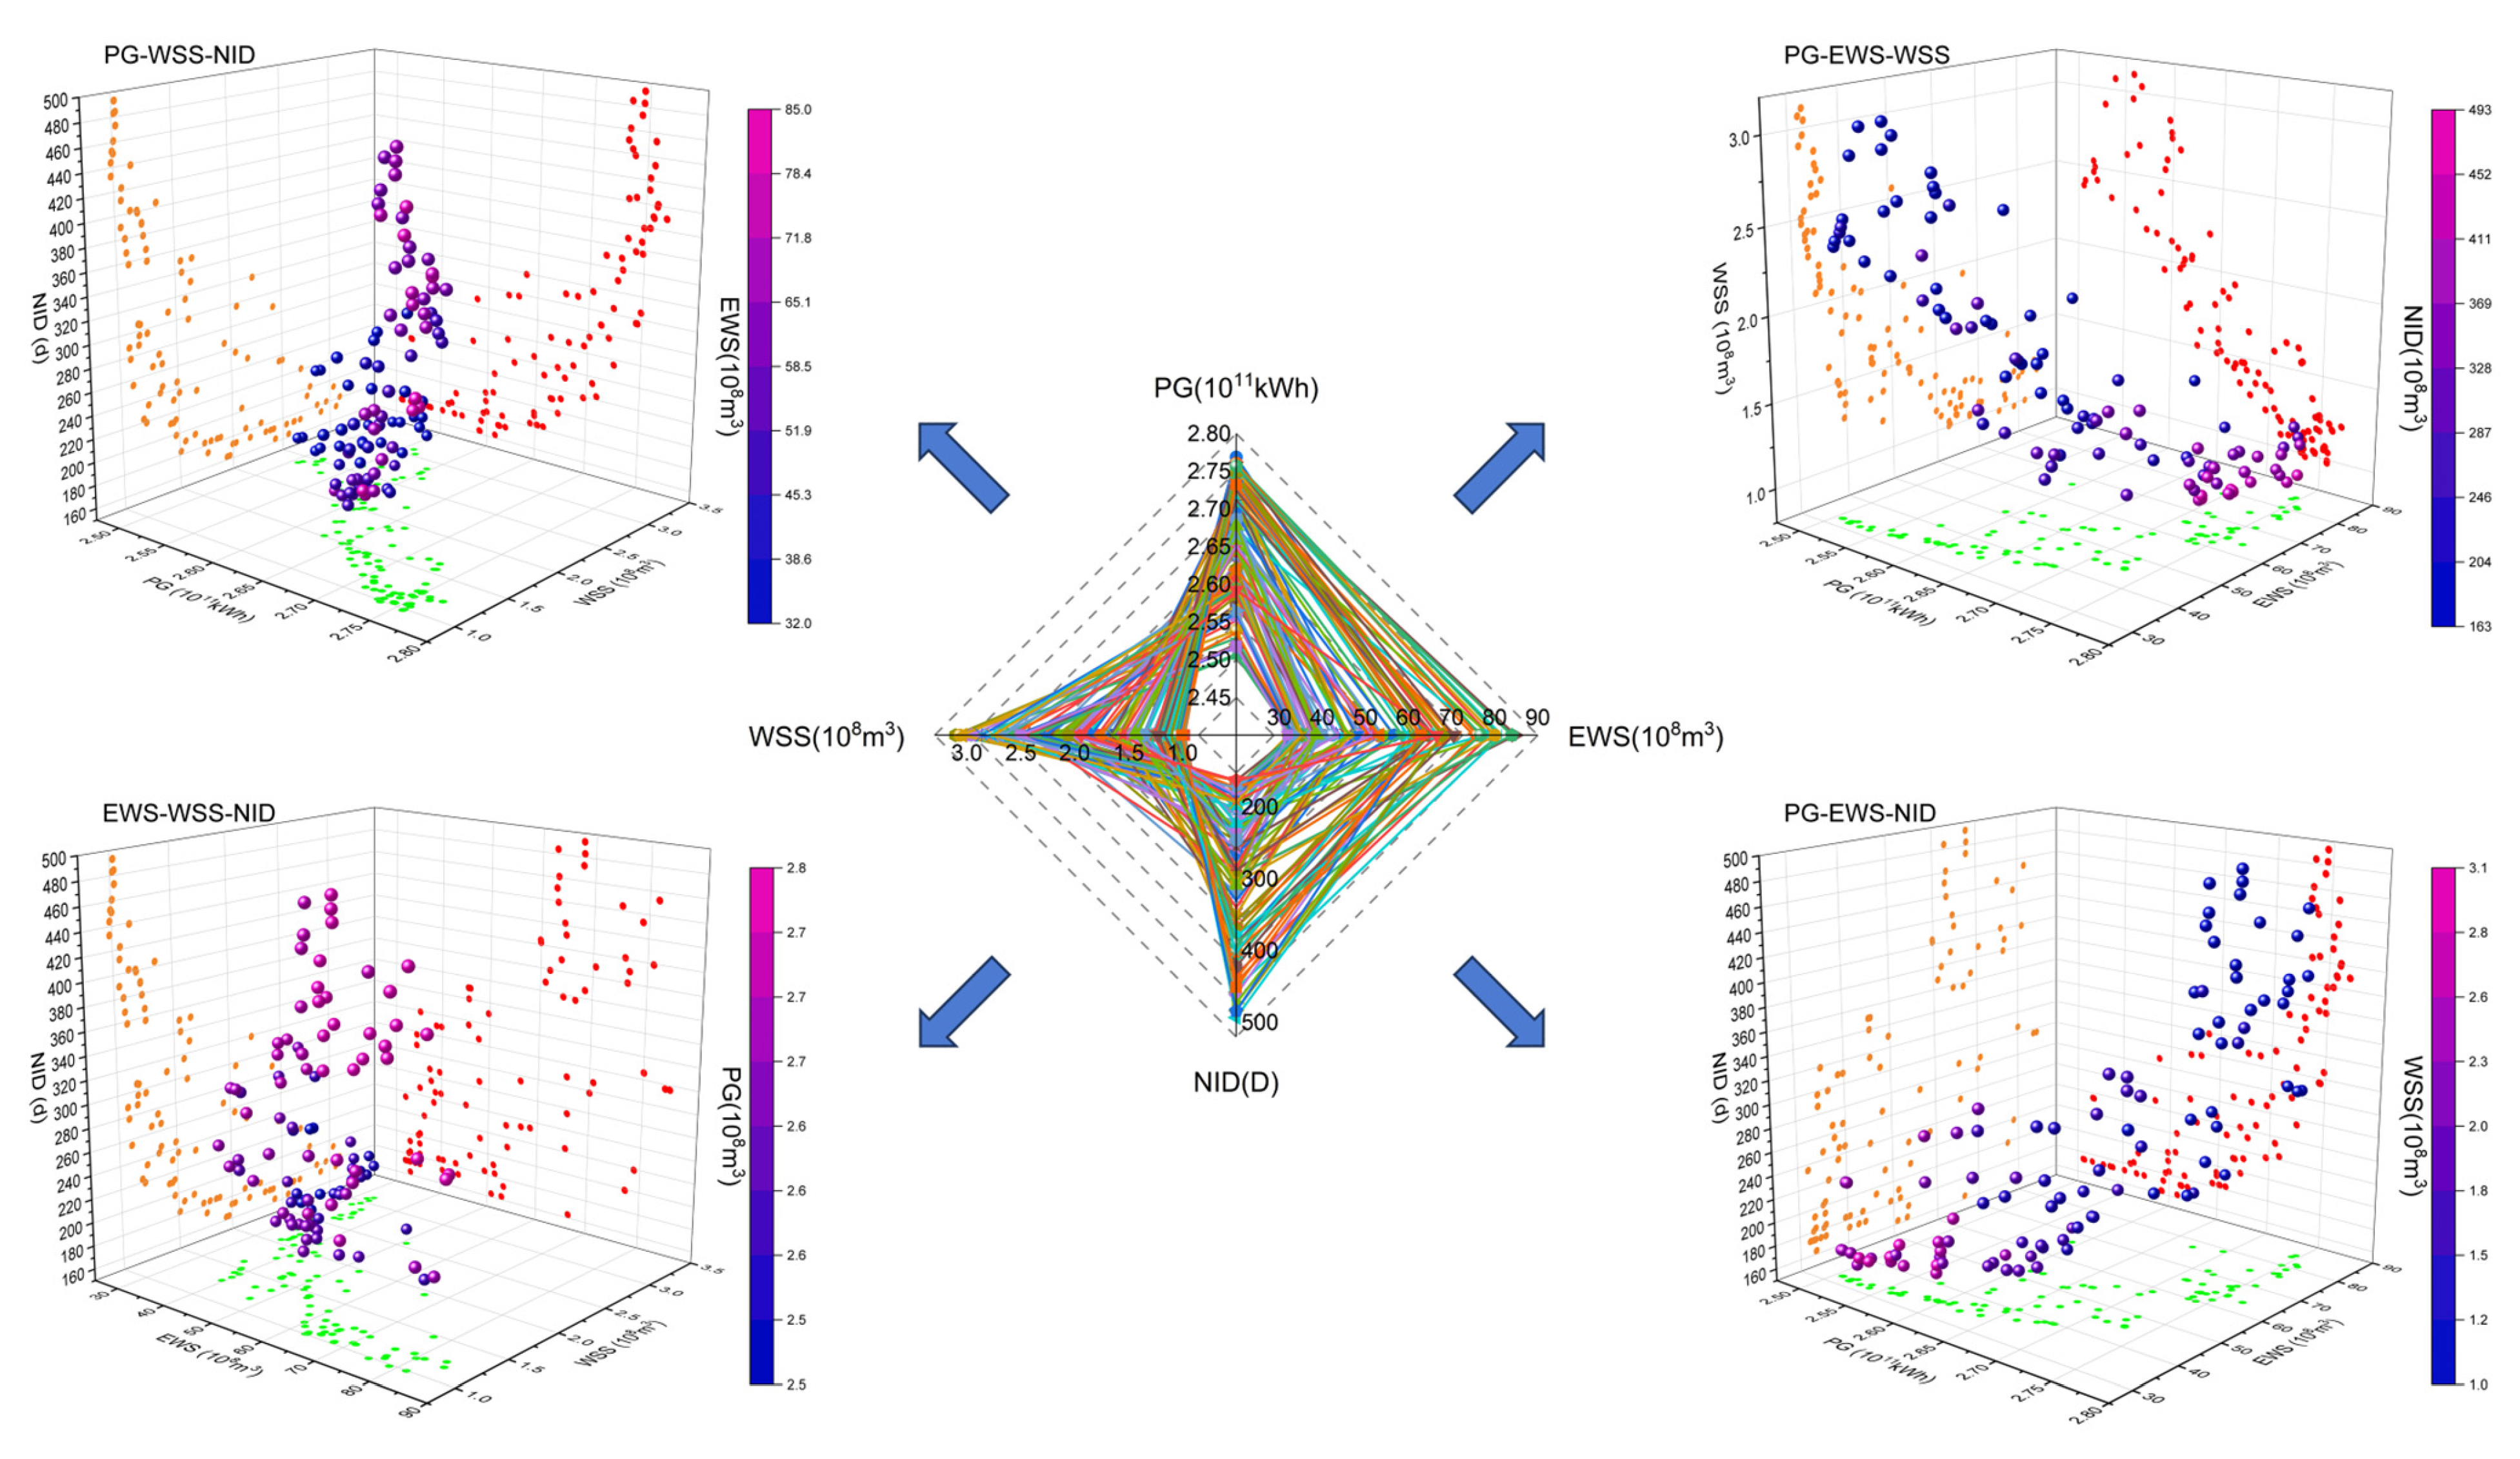
Figure A2.
The Pareto front under the normal year solved using NSGA-II.
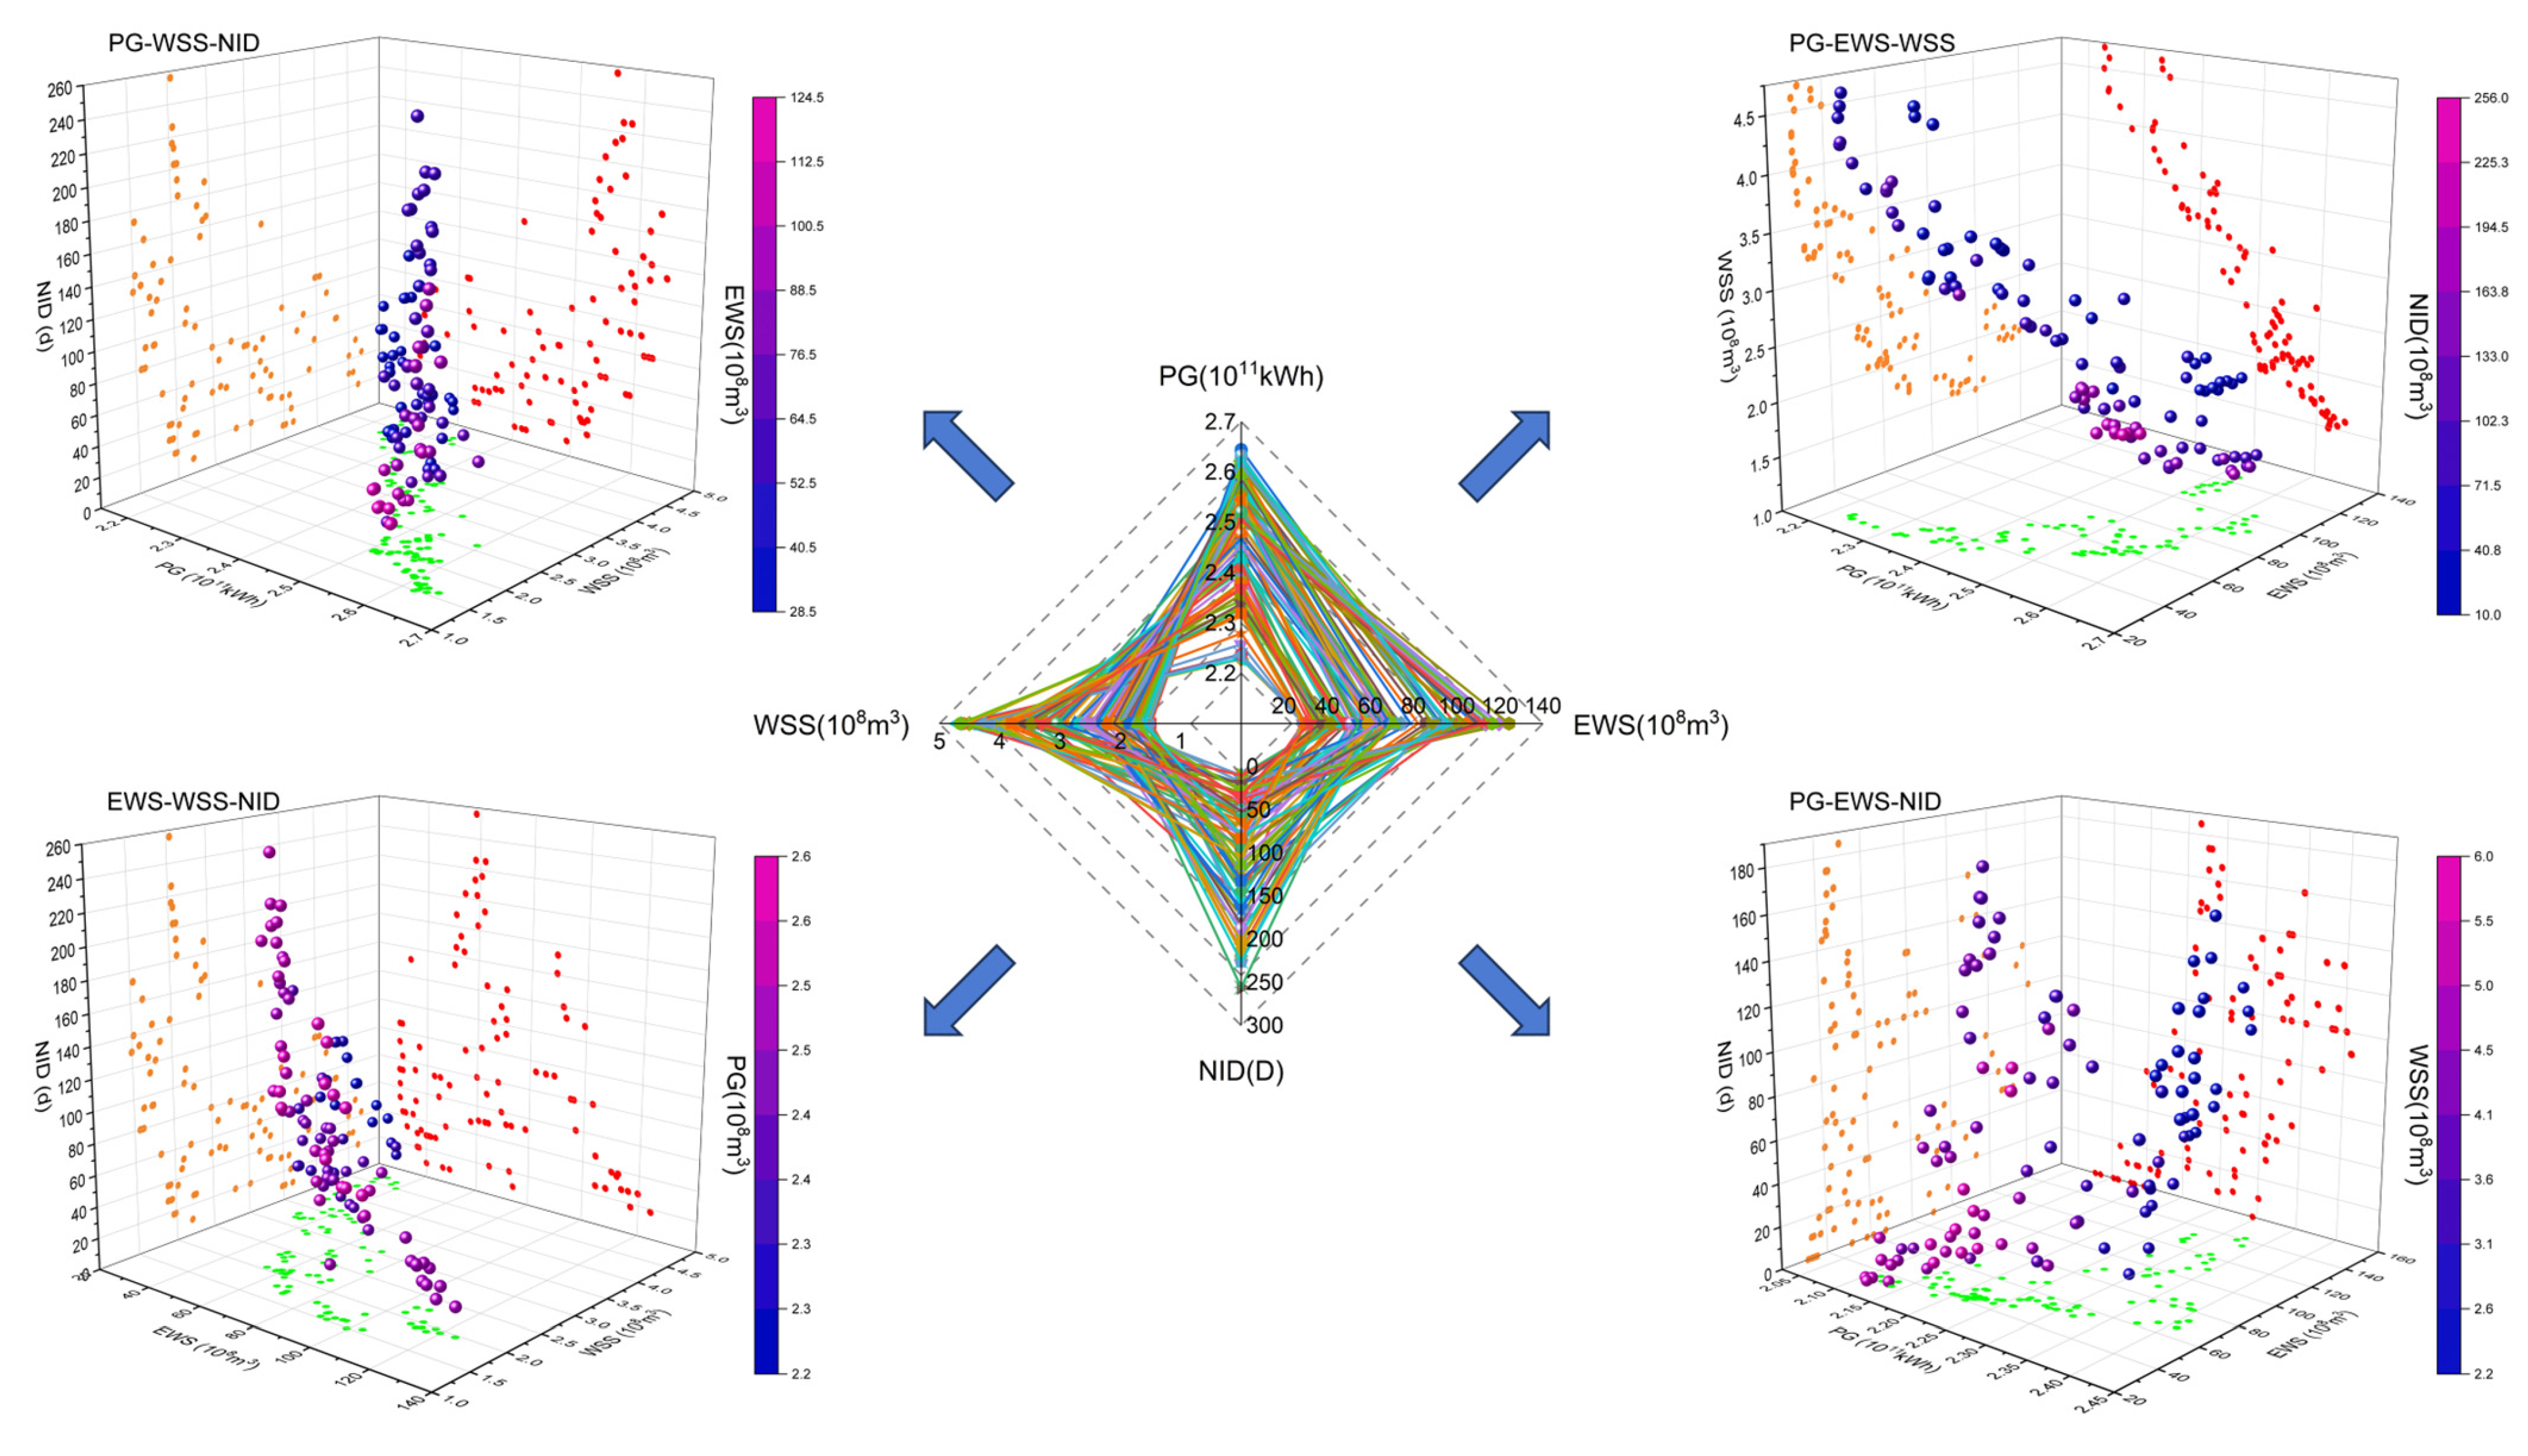
Figure A3.
(a) Statistics on the outflow and output of the Wudongde reservoir under the condition of normal year; (b) Statistics on the outflow and output of the Baihetan reservoir under the condition of normal year; (c) Statistics on the outflow and output of the Xiluodu reservoir under the condition of normal year; (d) Statistics on the outflow and output of the Xiangjiaba reservoir under the condition of normal year.
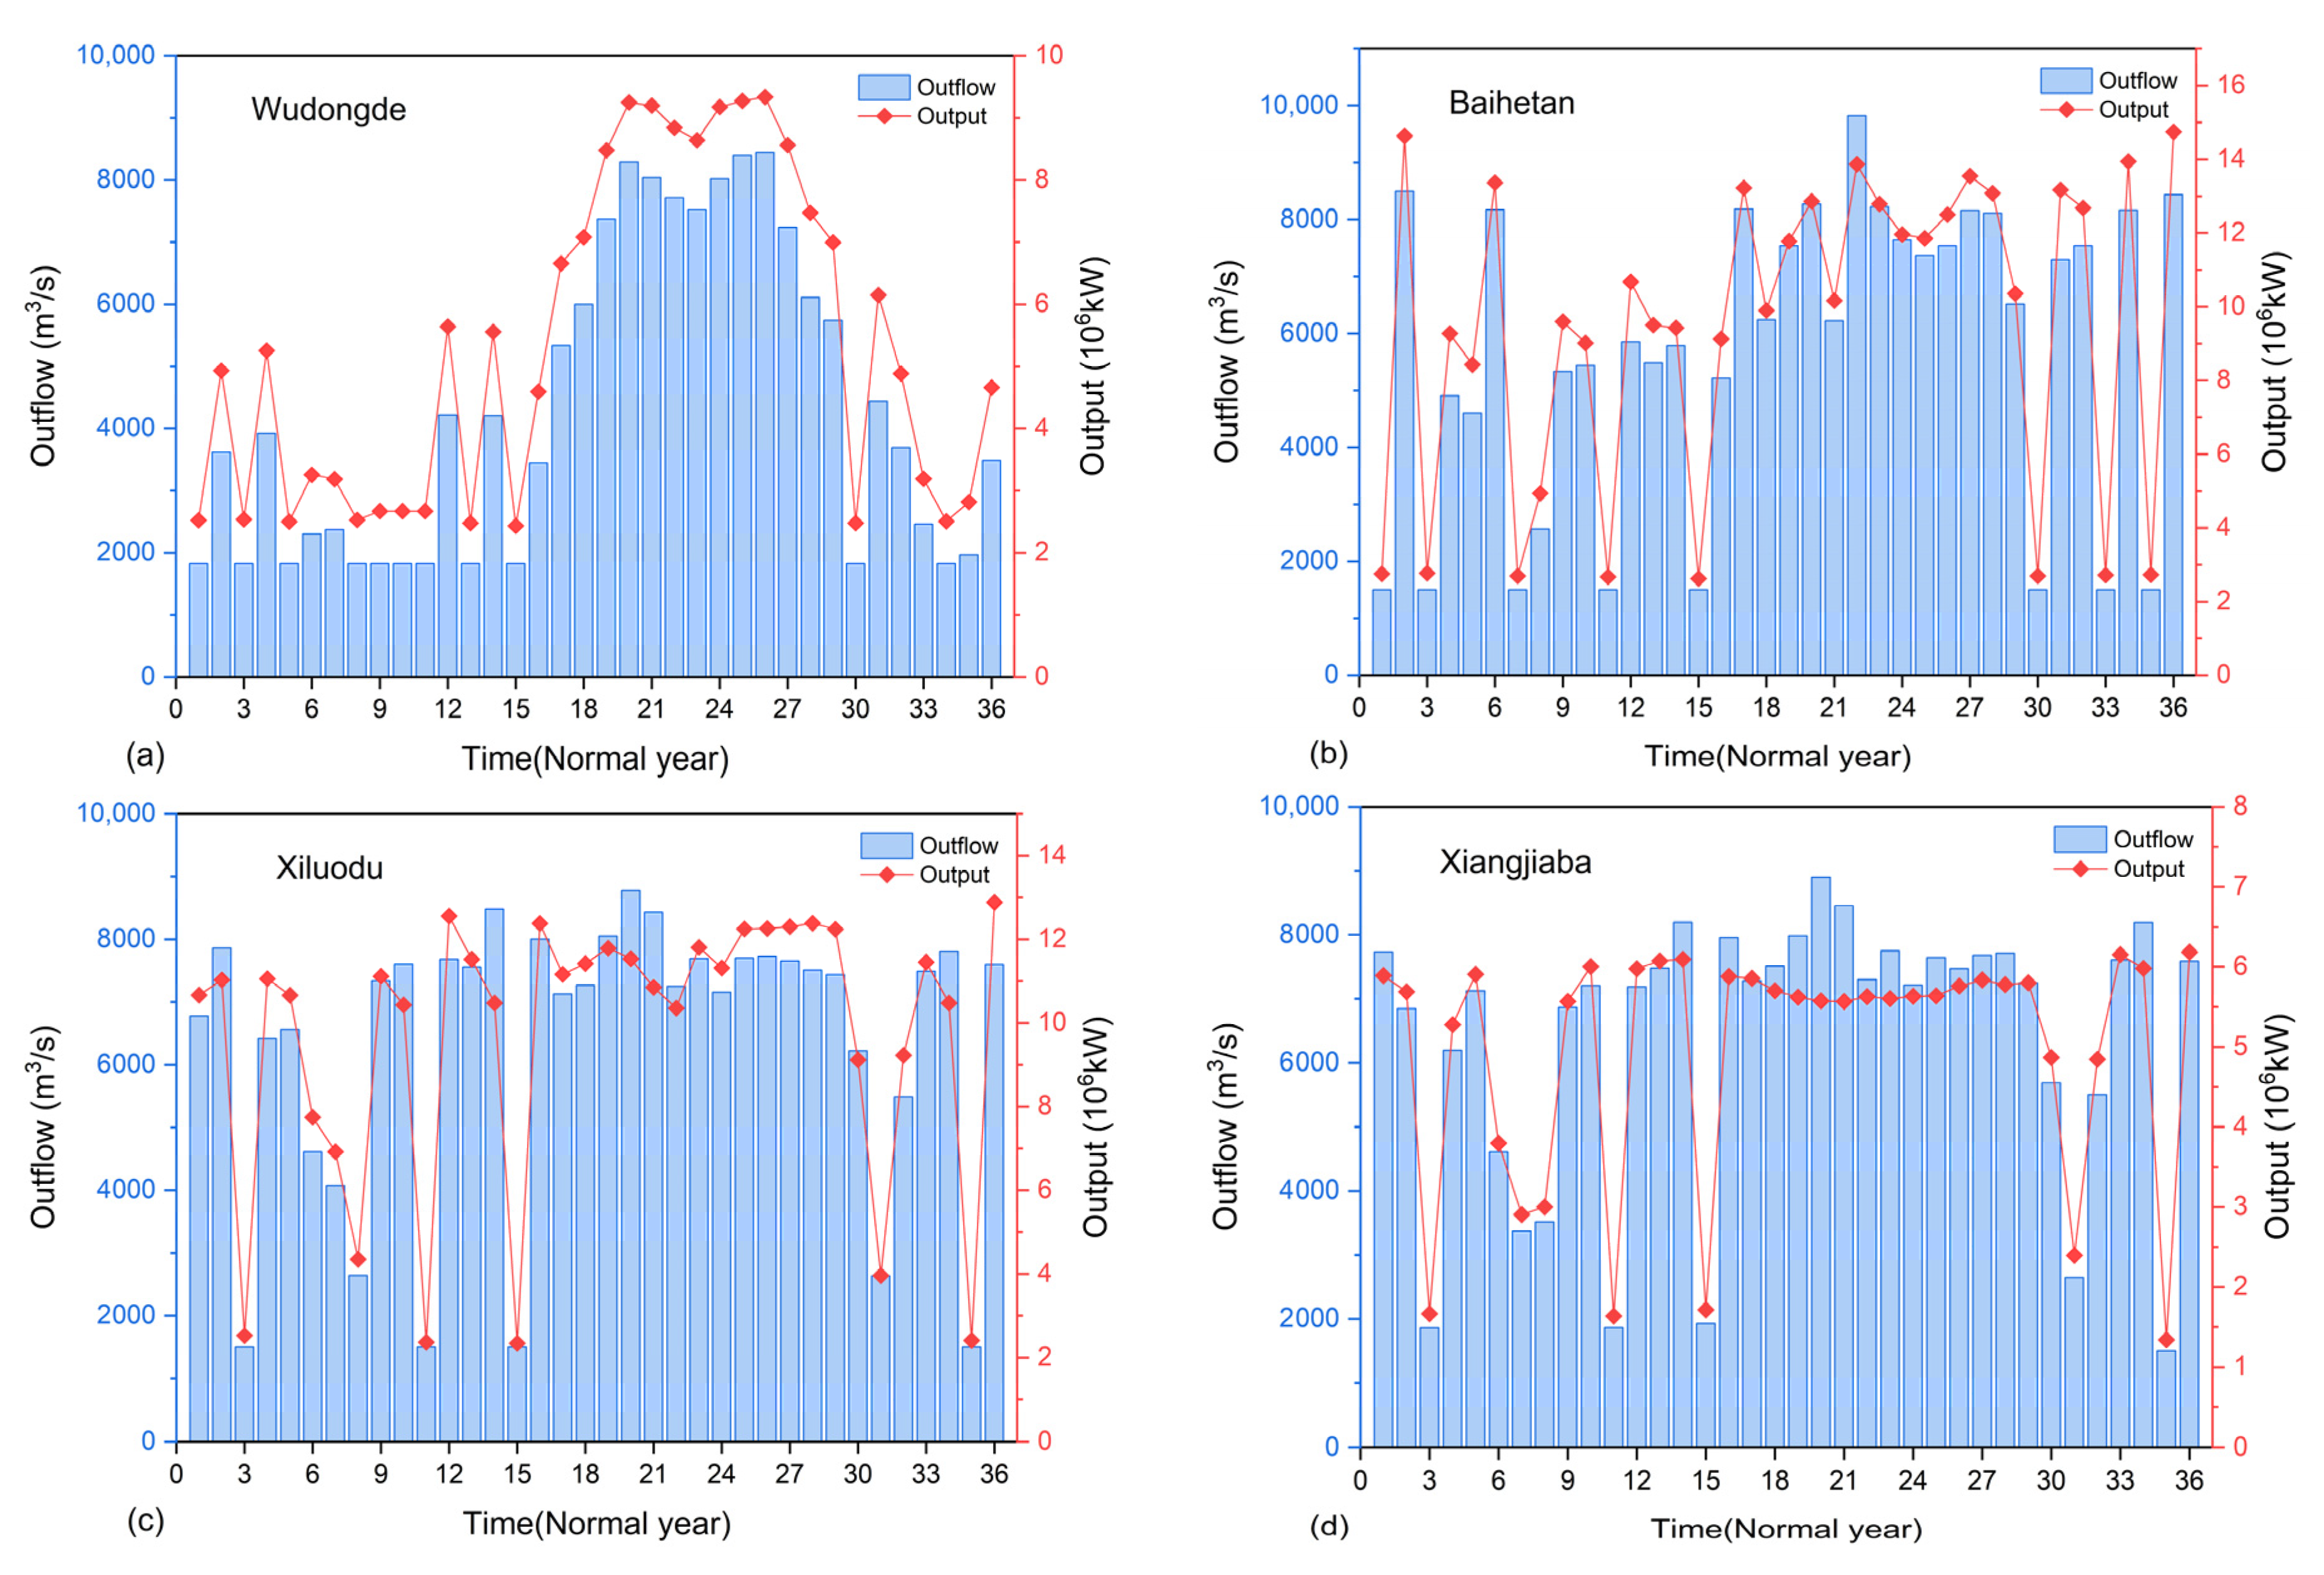
Figure A4.
(a) Statistics on the outflow and output of the Wudongde reservoir under the condition of dry year; (b) Statistics on the outflow and output of the Baihetan reservoir under the condition of dry year; (c) Statistics on the outflow and output of the Xiluodu reservoir under the condition of dry year; (d) Statistics on the outflow and output of the Xiangjiaba reservoir under the condition of dry year.
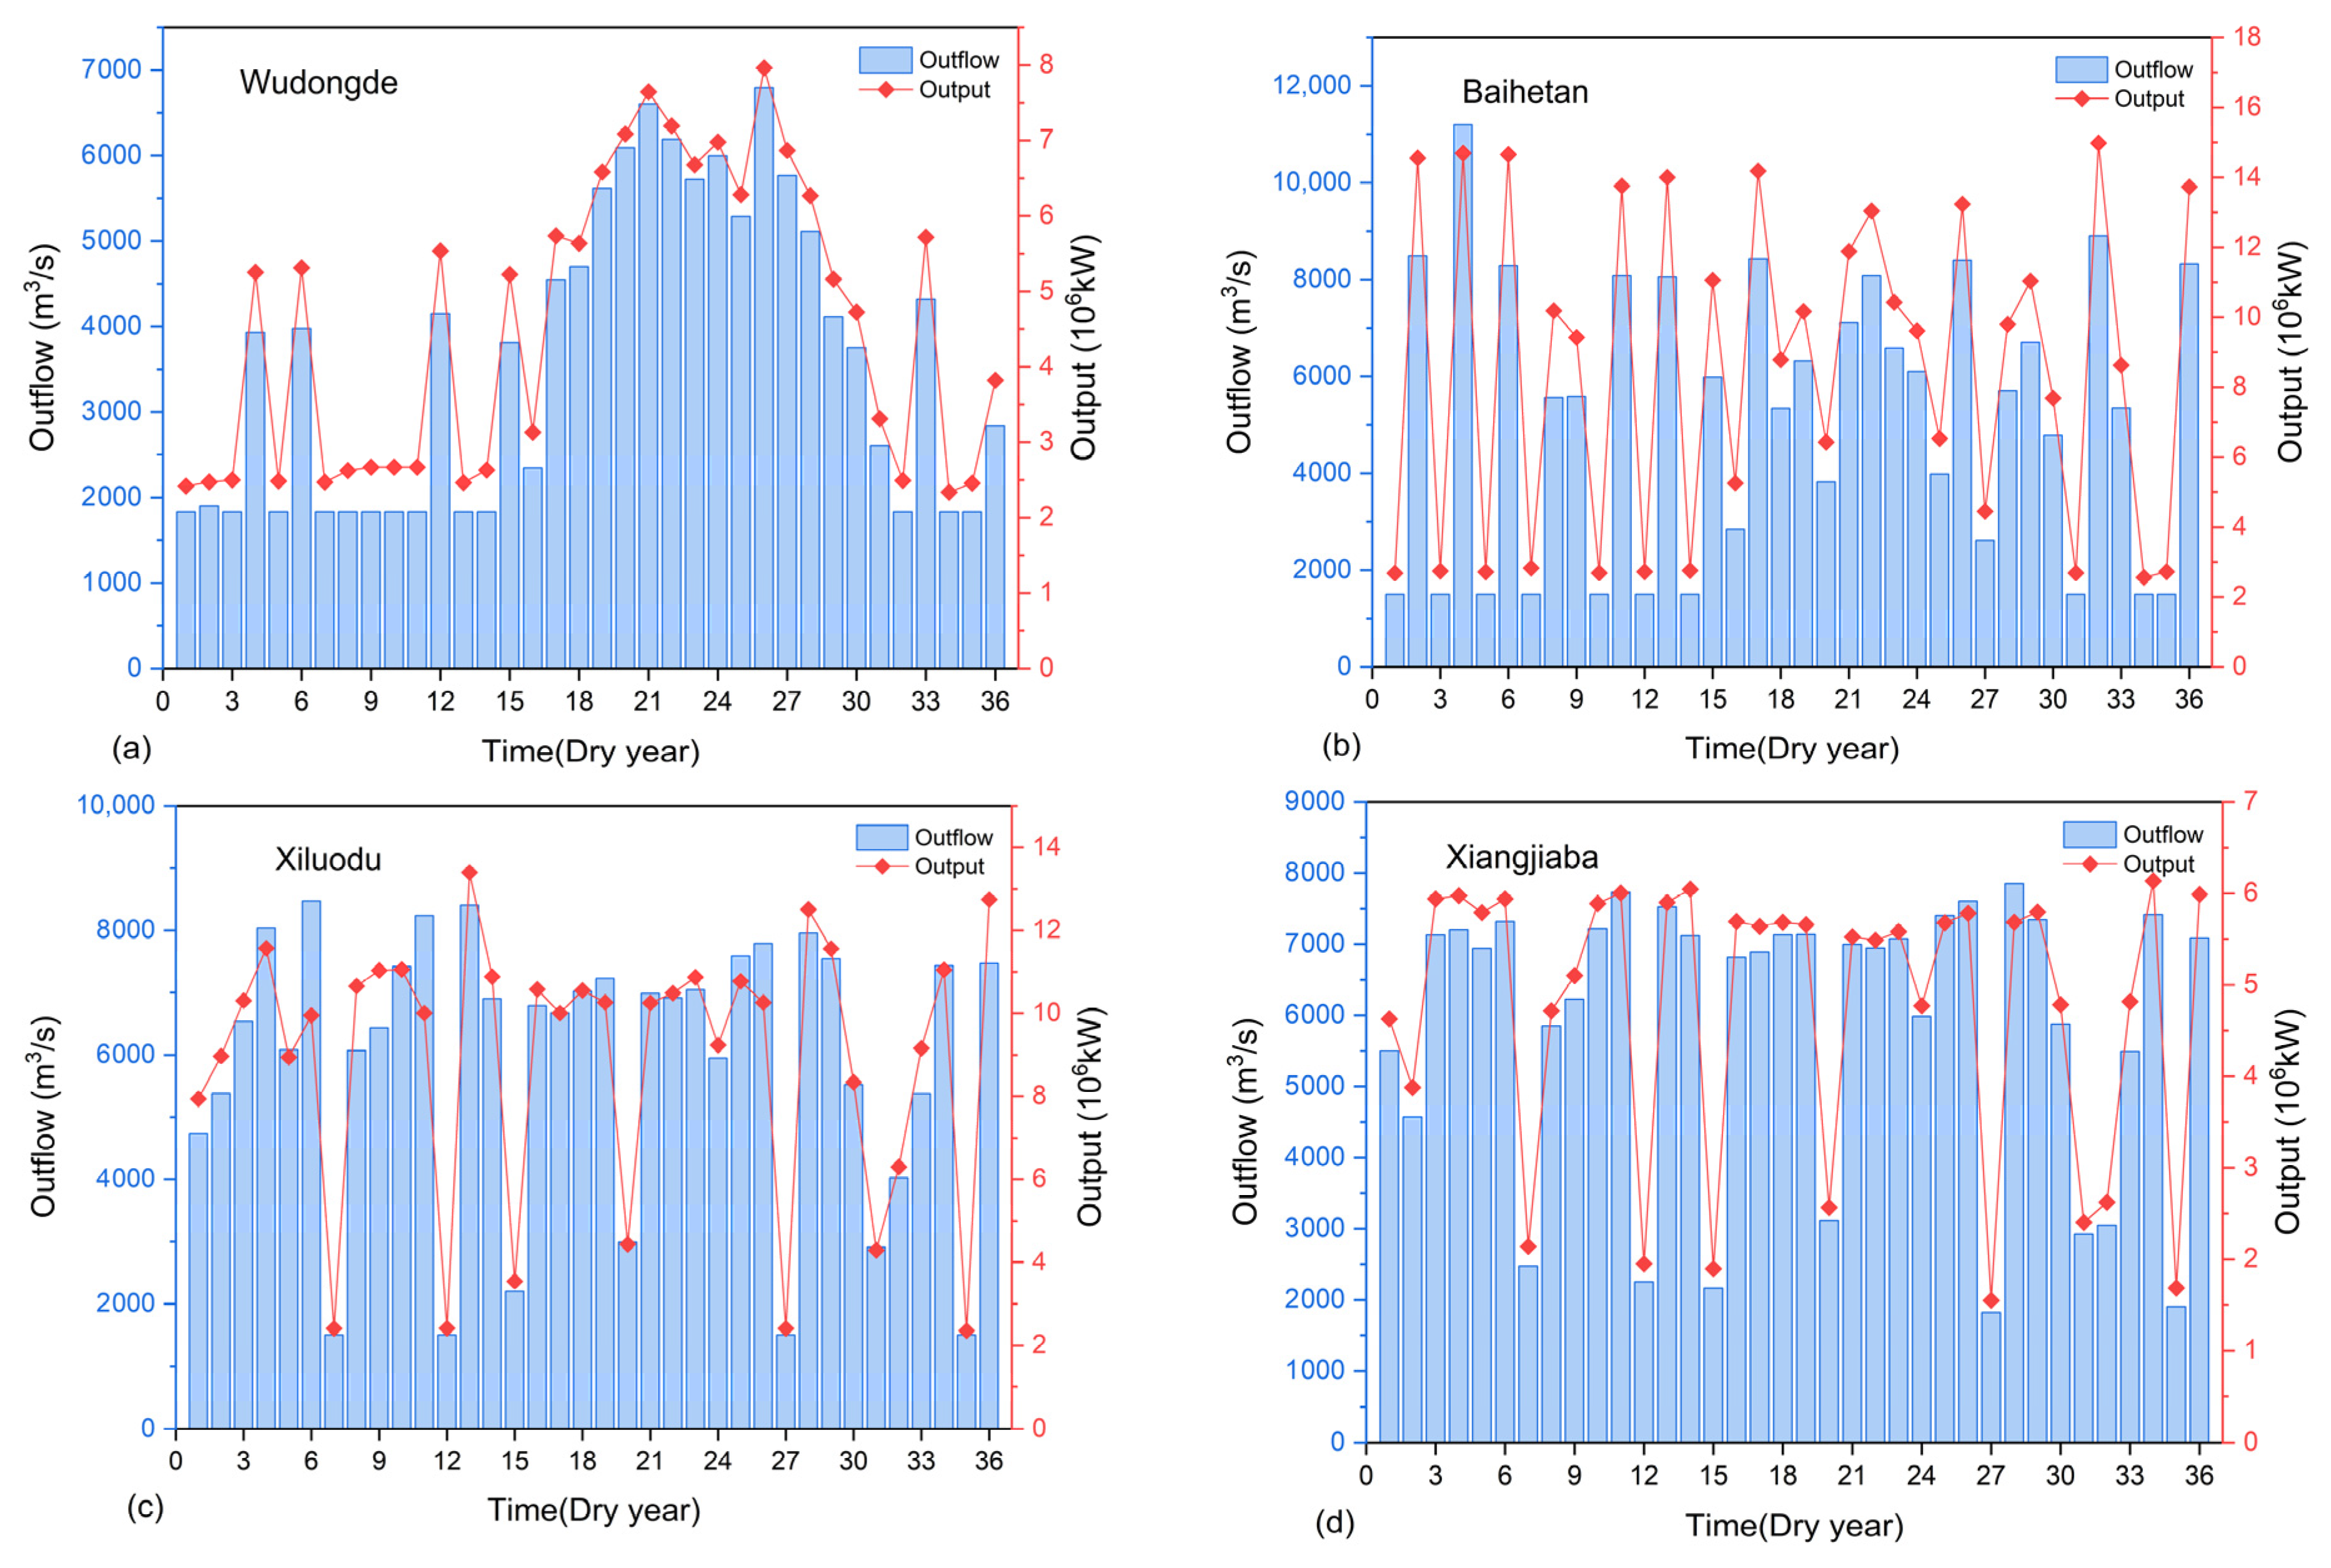
Figure A5.
Satisfaction of water supply, ecology and navigation objectives in the normal year.
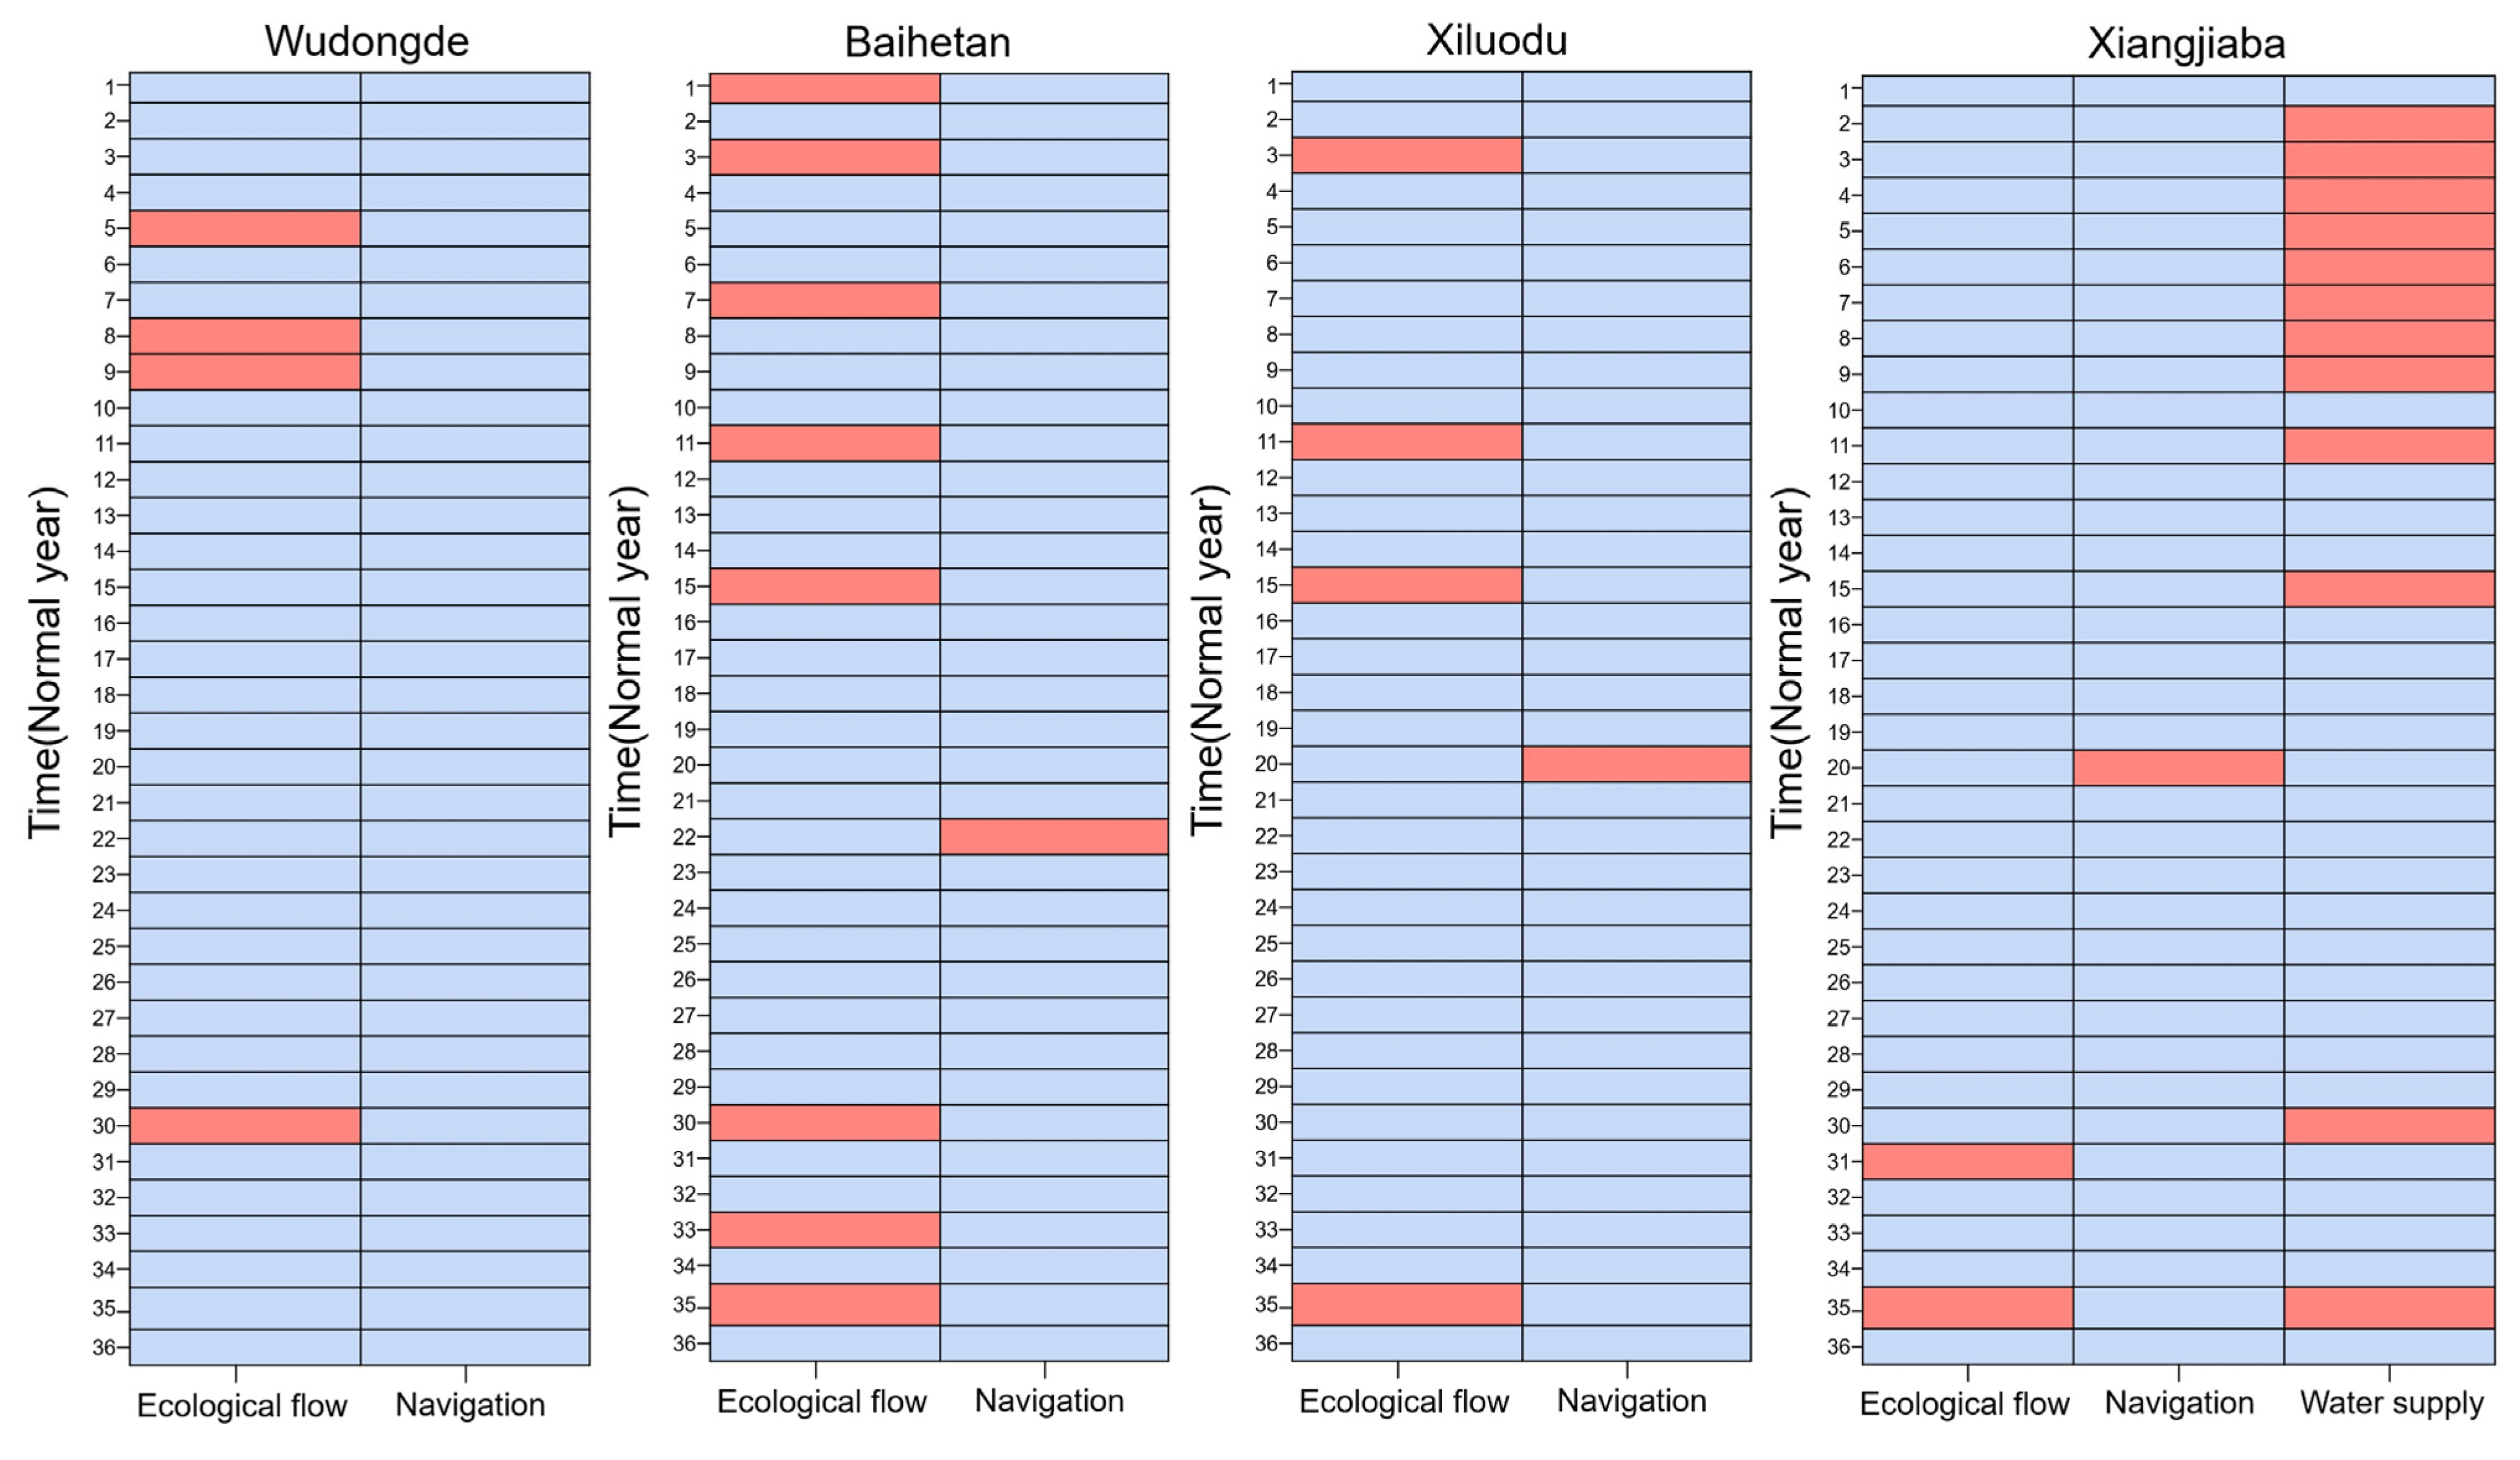
Figure A6.
Satisfaction of water supply, ecology and navigation objectives in the dry year.
References
- Yao, F.; Livneh, B.; Rajagopalan, B.; Wang, J.; Crétaux, J.-F.; Wada, Y.; Berge-Nguyen, M. Satellites reveal widespread decline in global lake water storage. Science 2023, 380, 743–749. [Google Scholar] [CrossRef] [Scilit] [PubMed]
- Salahshoori, I.; Namayandeh Jorabchi, M. Iran’s Zayandeh Rud River basin in crisis. Science 2023, 382, 1369. [Google Scholar] [CrossRef] [Scilit] [PubMed]
- Grill, G.; Lehner, B.; Thieme, M.; Geenen, B.; Tickner, D.; Antonelli, F.; Babu, S.; Borrelli, P.; Cheng, L.; Crochetiere, H.; et al. Mapping the world’s free-flowing rivers. Nature 2019, 569, 215–221. [Google Scholar] [CrossRef] [Scilit] [PubMed]
- Ding, W.; Wei, G.; Zhou, H. Improving flood resilience through optimal reservoir operation. J. Hydrol. 2023, 620, 129494. [Google Scholar] [CrossRef] [Scilit]
- Yang, Z.; Yang, K.; Wang, Y.; Su, L.; Hu, H. Multi-objective short-term hydropower generation operation for cascade reservoirs and stochastic decision making under multiple uncertainties. J. Clean. Prod. 2020, 276, 122995. [Google Scholar] [CrossRef] [Scilit]
- Huang, X.; Swain, D.L. Climate change is increasing the risk of a California megaflood. Sci. Adv. 2022, 8, eabq0995. [Google Scholar] [CrossRef] [Scilit]
- Boulange, J.; Hanasaki, N.; Yamazaki, D.; Pokhrel, Y. Role of dams in reducing global flood exposure under climate change. Nat. Commun. 2021, 12, 417. [Google Scholar] [CrossRef] [Scilit]
- Zhang, F.; Yang, Q.; Wang, J.; Liu, H.; Zeng, Q.; Yan, L.; Zhao, B.; Tang, J.; Zhao, K.; Zang, Y.; et al. Hydropower system in the Yarlung-Tsangpo Grand Canyon can mitigate flood disasters caused by climate change. Commun. Earth Environ. 2025, 6, 323. [Google Scholar] [CrossRef] [Scilit]
- Huang, X.; Xu, B.; Zhong, P.-A.; Yao, H.; Yue, H.; Zhu, F.; Lu, Q.; Sun, Y.; Mo, R.; Li, Z.; et al. Robust multiobjective reservoir operation and risk decision-making model for real-time flood control coping with forecast uncertainty. J. Hydrol. 2022, 605, 127334. [Google Scholar] [CrossRef] [Scilit]
- Xu, Z.; Mo, L.; Zhou, J.; Zhang, X. Optimal dispatching rules of hydropower reservoir in flood season considering flood resources utilization: A case study of Three Gorges Reservoir in China. J. Clean. Prod. 2023, 388, 135975. [Google Scholar] [CrossRef] [Scilit]
- Yu, X.; Xu, Y.-P.; Guo, Y.; Liu, L. Multi-reservoirs joint flood control scheduling using a two-layer hedging robust optimization method under uncertain inflows. J. Hydrol. Reg. Stud. 2025, 58, 102244. [Google Scholar] [CrossRef] [Scilit]
- Moura de Figueiredo, N.; Cavalcante Blanco, C.J.; Pinheiro Campos Filho, L.C.; Amarante Mesquita, A.L. MUWOS—Multiple use water optimization system for the power generation and navigation trade-offs analysis. Renew. Energy 2023, 203, 205–218. [Google Scholar] [CrossRef] [Scilit]
- Ma, X.; Liao, S.; Liu, B.; Zhao, H.; Cheng, C.; Su, H. Multi-objective solution and decision-making framework for coordinating the short-term hydropeaking-navigation-production conflict of cascade hydropower reservoirs. J. Clean. Prod. 2023, 422, 138602. [Google Scholar] [CrossRef] [Scilit]
- Qi, X.; Qin, H.; Jiang, S.; Liu, G.; Wang, H.; Liu, S.; Qu, Y. Cascade reservoirs operation rules derivation using integrated decision-making method and combinatorial evolution network. J. Clean. Prod. 2023, 414, 137608. [Google Scholar] [CrossRef] [Scilit]
- Ai, Y.; Ma, Z.; Xie, X.; Huang, T.; Cheng, H. Optimization of ecological reservoir operation rules for a northern river in China: Balancing ecological and socio-economic water use. Ecol. Indic. 2022, 138, 108822. [Google Scholar] [CrossRef] [Scilit]
- Qiu, R.; Wang, D.; Singh, V.P.; Wang, Y.; Wu, J. Integration of deep learning and improved multi-objective algorithm to optimize reservoir operation for balancing human and downstream ecological needs. Water Res. 2024, 253, 121314. [Google Scholar] [CrossRef] [Scilit]
- Feng, Z.-K.; Zhang, L.; Mo, L.; Wang, Y.-Q.; Niu, W.-J. A multi-objective cooperation search algorithm for cascade reservoirs operation optimization considering power generation and ecological flows. Appl. Soft Comput. 2024, 150, 111085. [Google Scholar] [CrossRef] [Scilit]
- Sedighkia, M.; Abdoli, A. An optimization approach for managing environmental impacts of generating hydropower on fish biodiversity. Renew. Energy 2023, 218, 119283. [Google Scholar] [CrossRef] [Scilit]
- Bai, T.; Li, L.; Yang, W.-W.; Chang, F.-J.; Huang, Q. Optimal dispatching scheme of multi-objective cascade reservoirs by parallel mechanism-optimization algorithms. J. Hydrol. 2022, 612, 128050. [Google Scholar] [CrossRef] [Scilit]
- Coello, C.A.C. Evolutionary multi-objective optimization: A historical view of the field. IEEE Comput. Intell. Mag. 2006, 1, 28–36. [Google Scholar] [CrossRef] [Scilit]
- Cohon, J.L.; Marks, D.H. A review and evaluation of multiobjective programing techniques. Water Resour. Res. 1975, 11, 208–220. [Google Scholar] [CrossRef] [Scilit]
- Hall, W.A.; Butcher, W.S.; Esogbue, A. Optimization of the operation of a multiple—Purpose reservoir by dynamic programming. Water Resour. Res. 1968, 4, 471–477. [Google Scholar] [CrossRef] [Scilit]
- Chang, N.-B.; Wen, C.G.; Chen, Y.L. A fuzzy multi-objective programming approach for optimal management of the reservoir watershed. Eur. J. Oper. Res. 1997, 99, 289–302. [Google Scholar] [CrossRef] [Scilit]
- Cervellera, C.; Chen, V.C.P.; Wen, A. Optimization of a large-scale water reservoir network by stochastic dynamic programming with efficient state space discretization. Eur. J. Oper. Res. 2006, 171, 1139–1151. [Google Scholar] [CrossRef] [Scilit]
- Hu, W.; Yen, G.G. Adaptive Multiobjective Particle Swarm Optimization Based on Parallel Cell Coordinate System. IEEE Trans. Evol. Comput. 2015, 19, 1–18. [Google Scholar] [CrossRef] [Scilit]
- Zhang, Q.; Li, H. MOEA/D: A Multiobjective Evolutionary Algorithm Based on Decomposition. IEEE Trans. Evol. Comput. 2007, 11, 712–731. [Google Scholar] [CrossRef] [Scilit]
- Zitzler, E.; Thiele, L. Multiobjective evolutionary algorithms: A comparative case study and the strength Pareto approach. IEEE Trans. Evol. Comput. 1999, 3, 257–271. [Google Scholar] [CrossRef] [Scilit]
- Deb, K.; Pratap, A.; Agarwal, S.; Meyarivan, T. A fast and elitist multiobjective genetic algorithm: NSGA-II. IEEE Trans. Evol. Comput. 2002, 6, 182–197. [Google Scholar] [CrossRef] [Scilit]
- Wang, H.-R.; Li, F.-F.; Wang, G.-Q.; Qiu, J. Shrinking Pareto Fronts to Guide Reservoir Operations by Quantifying Competition Among Multiple Objectives. Water Resour. Res. 2022, 58, e2021WR029702. [Google Scholar] [CrossRef] [Scilit]
- Zhu, D.; Chen, H.; Zhou, Y.; Xu, X.; Guo, S.; Chang, F.-J.; Xu, C.-Y. Exploring a multi-objective cluster-decomposition framework for optimizing flood control operation rules of cascade reservoirs in a river basin. J. Hydrol. 2022, 614, 128602. [Google Scholar] [CrossRef] [Scilit]
- Yu, L.; Wu, X.; Wu, S.; Jia, B.; Han, G.; Xu, P.; Dai, J.; Zhang, Y.; Wang, F.; Yang, Q.; et al. Multi-objective optimal operation of cascade hydropower plants considering ecological flow under different ecological conditions. J. Hydrol. 2021, 601, 126599. [Google Scholar] [CrossRef] [Scilit]
- Feng, Z.-K.; Niu, W.-J.; Liu, S.; Luo, B.; Miao, S.-M.; Liu, K. Multiple hydropower reservoirs operation optimization by adaptive mutation sine cosine algorithm based on neighborhood search and simplex search strategies. J. Hydrol. 2020, 590, 125223. [Google Scholar] [CrossRef] [Scilit]
- Ahmadianfar, I.; Kheyrandish, A.; Jamei, M.; Gharabaghi, B. Optimizing operating rules for multi-reservoir hydropower generation systems: An adaptive hybrid differential evolution algorithm. Renew. Energy 2021, 167, 774–790. [Google Scholar] [CrossRef] [Scilit]
- Yao, H.; Dong, Z.; Li, D.; Ni, X.; Chen, T.; Chen, M.; Jia, W.; Huang, X. Long-term optimal reservoir operation with tuning on large-scale multi-objective optimization: Case study of cascade reservoirs in the Upper Yellow River Basin. J. Hydrol. Reg. Stud. 2022, 40, 101000. [Google Scholar] [CrossRef] [Scilit]
- Yang, Z.; Wang, Y.; Yang, K. The stochastic decision making framework for long-term multi-objective energy-water supply-ecology operation in parallel reservoirs system under uncertainties. Expert Syst. Appl. 2022, 187, 115907. [Google Scholar] [CrossRef] [Scilit]
- Wang, Z.; Zhu, Z.; Luan, H.; Wu, T. Multi-objective optimal scheduling of cascade reservoirs in complex basin systems: Case study of the Jinsha River-Yalong River confluence basin in China. J. Hydrol. Reg. Stud. 2025, 58, 102240. [Google Scholar] [CrossRef] [Scilit]
- Deb, K.; Jain, H. An Evolutionary Many-Objective Optimization Algorithm Using Reference-Point-Based Nondominated Sorting Approach, Part I: Solving Problems With Box Constraints. IEEE Trans. Evol. Comput. 2014, 18, 577–601. [Google Scholar] [CrossRef] [Scilit]
- Saaty, T.L. A scaling method for priorities in hierarchical structures. J. Math. Psychol. 1977, 15, 234–281. [Google Scholar] [CrossRef] [Scilit]
- Ahadi, P.; Fakhrabadi, F.; Pourshaghaghy, A.; Kowsary, F. Optimal site selection for a solar power plant in Iran via the Analytic Hierarchy Process (AHP). Renew. Energy 2023, 215, 118944. [Google Scholar] [CrossRef] [Scilit]
- Li, Z.; Luo, Z.; Wang, Y.; Fan, G.; Zhang, J. Suitability evaluation system for the shallow geothermal energy implementation in region by Entropy Weight Method and TOPSIS method. Renew. Energy 2022, 184, 564–576. [Google Scholar] [CrossRef] [Scilit]
- Ma, W.; Xiao, C.; Ahmed, S.F.; Feng, T.; Liu, G. Multi-objective carbon neutrality optimization and G1-EW-TOPSIS assessment for renewable energy transition. J. Clean. Prod. 2023, 415, 137808. [Google Scholar] [CrossRef] [Scilit]
- Yuan, L.; Liu, H.; Lu, Y.; Zhou, C.; Zhou, C.; Lu, Y. Multi-objective integrated decision method of cascade hydropower stations based on optimization algorithm and evaluation model. J. Hydrol. 2024, 638, 131533. [Google Scholar] [CrossRef] [Scilit]
- Ning, Z.; Zhou, Y.; He, J.; Tang, C.; Xu, C.-Y.; Chang, F.-J. Balancing water, power, and carbon: A synergistic optimization framework for mega cascade reservoir operations. Renew. Energy 2025, 243, 122567. [Google Scholar] [CrossRef] [Scilit]

Disclaimer/Publisher’s Note: The statements, opinions and data contained in all publications are solely those of the individual author(s) and contributor(s) and not of MDPI and/or the editor(s). MDPI and/or the editor(s) disclaim responsibility for any injury to people or property resulting from any ideas, methods, instructions or products referred to in the content. |
© 2025 by the authors. Licensee MDPI, Basel, Switzerland. This article is an open access article distributed under the terms and conditions of the Creative Commons Attribution (CC BY) license (https://creativecommons.org/licenses/by/4.0/).