3.2.1. Remapping of Emotion Labels
BERT based models have demonstrated superior performance in natural language understanding tasks by evaluating each part of the text in conjunction with other parts, thanks to its bidirectional context modeling [
16]. For emotion detection, transformer-based models were fine-tuned on the GoEmotions dataset [
40].
The GoEmotions dataset originally offers 27 distinct emotion labels and a neutral category. However, for the purposes of this study, it was necessary to convert this broad spectrum of emotions into a more manageable subset. Specifically, to identify clear emotional axes that can be tracked in film scripts and user reviews, similar or overlapping emotions were combined, thus defining nine main emotion categories:
new_emotions = {joy, sadness, anger, fear, surprise, disgust, love, curiosity, neutral}
For example, positively charged labels such as admiration, amusement, approval, excitement, gratitude, optimism, pride, and relief were grouped under joy. Similarly, annoyance and anger were combined under anger, and caring and desire under love. Additionally, confusion and curiosity were grouped under the curiosity label to consolidate states of wonder/perplexity. Likewise, the sadness category includes emotions like disappointment, embarrassment, grief, and remorse. Disapproval and disgust were converted into the disgust category, consolidating more negative, repulsive emotions under a single label. Realization was placed under surprise, which best reflects an unexpected insight or understanding. Finally, the neutral category maintains emotional neutrality. This emotion mapping process facilitates the model’s ability to cope with complex and diverse emotions while bringing the analysis to a more understandable and manageable dimension. The mapping process was automated with functions utilized in this study; the original labels field of the GoEmotions dataset was adapted to the new_emotions set via the map_labels function. Thus, each text sample is represented by a multi-label vector consisting of the newly defined 9 basic emotions. This approach, while reducing the complex emotional texture to a simpler representation, contributes to mitigating data imbalance issues and enabling more stable learning during the model’s training process.
The GoEmotions dataset is loaded via the Hugging Face datasets library. Training, validation, and test splits are managed with the DatasetDict structure. Tokenized data is fed to the model as input_ids, attention_mask, and labels.
3.2.5. Integration with Hybrid Architectures and Sequence Models
Although the BERT model alone is a powerful tool for contextual representations, it can be enriched with layers such as GRU, LSTM, or CNN when processing long sequences like dialogues or scripts. Studies such as [
35,
36] have shown that combining BERT with recurrent or convolutional layers enhances performance. In this study, we evaluated several architectures, including BERT, DistilBERT, RoBERTa, and hybrid extensions (BERT + BiLSTM, BERT + CNN, BERT + SCNN). Among these, the BERT + CNN model was selected, as it provided a strong balance between classification reliability and computational efficiency (described in detail in
Section 4.1, Comparative Model Performance). The CNN layer was incorporated to capture local feature patterns and sentence-level emotional cues, which complemented BERT’s contextual embeddings and enhanced the detection of subtle emotional signals.
Model evaluation indicated that frequent categories such as joy, sadness, and anger were classified with relatively high reliability, while minority categories such as disgust and surprise yielded lower accuracy due to data sparsity and the inherent ambiguity of emotional expression in user-generated texts. This distribution of results is typical in multi-label emotion analysis and reflects the natural imbalance of affective states in real-world systems. Importantly, the overall performance was sufficiently stable to support large-scale comparative analysis, enabling the detection of systemic patterns of alignment and divergence across scripts and audience reviews.
In systems terms, the classifier served as a monitoring instrument capable of capturing both dominant affective signals and weaker, low-frequency emotional states that nonetheless play a role in the adaptive dynamics of the cinematic ecosystem.
3.2.6. Model Training, Hyperparameter Settings, and Performance Evaluation
For emotion detection, we fine-tuned BERT-based models using the GoEmotions dataset [
40]. The performance of these models was evaluated through standard classification metrics, including accuracy, precision, recall, and F1-score. In multi-label emotion classification tasks, micro- and macro-averaged F1-scores are particularly informative, as they provide a balanced view of model performance across emotions with varying frequencies [
40]. Thus, these evaluation metrics are widely adopted in studies utilizing the GoEmotions dataset, enabling consistent benchmarking and meaningful comparison of results across different model architectures [
40]. The detailed performance results for our models are presented in the following sections.
BERT-BASED Model
This section examines the performance values obtained during the training process of our BERT-based emotion analysis model. First, the change in loss values obtained in the training and validation sets per epoch is analyzed. Then, class-based metrics (precision, recall, and F1-score) and confusion matrices are evaluated. Finally, the overall success level of the model is discussed, and the findings are deliberated.
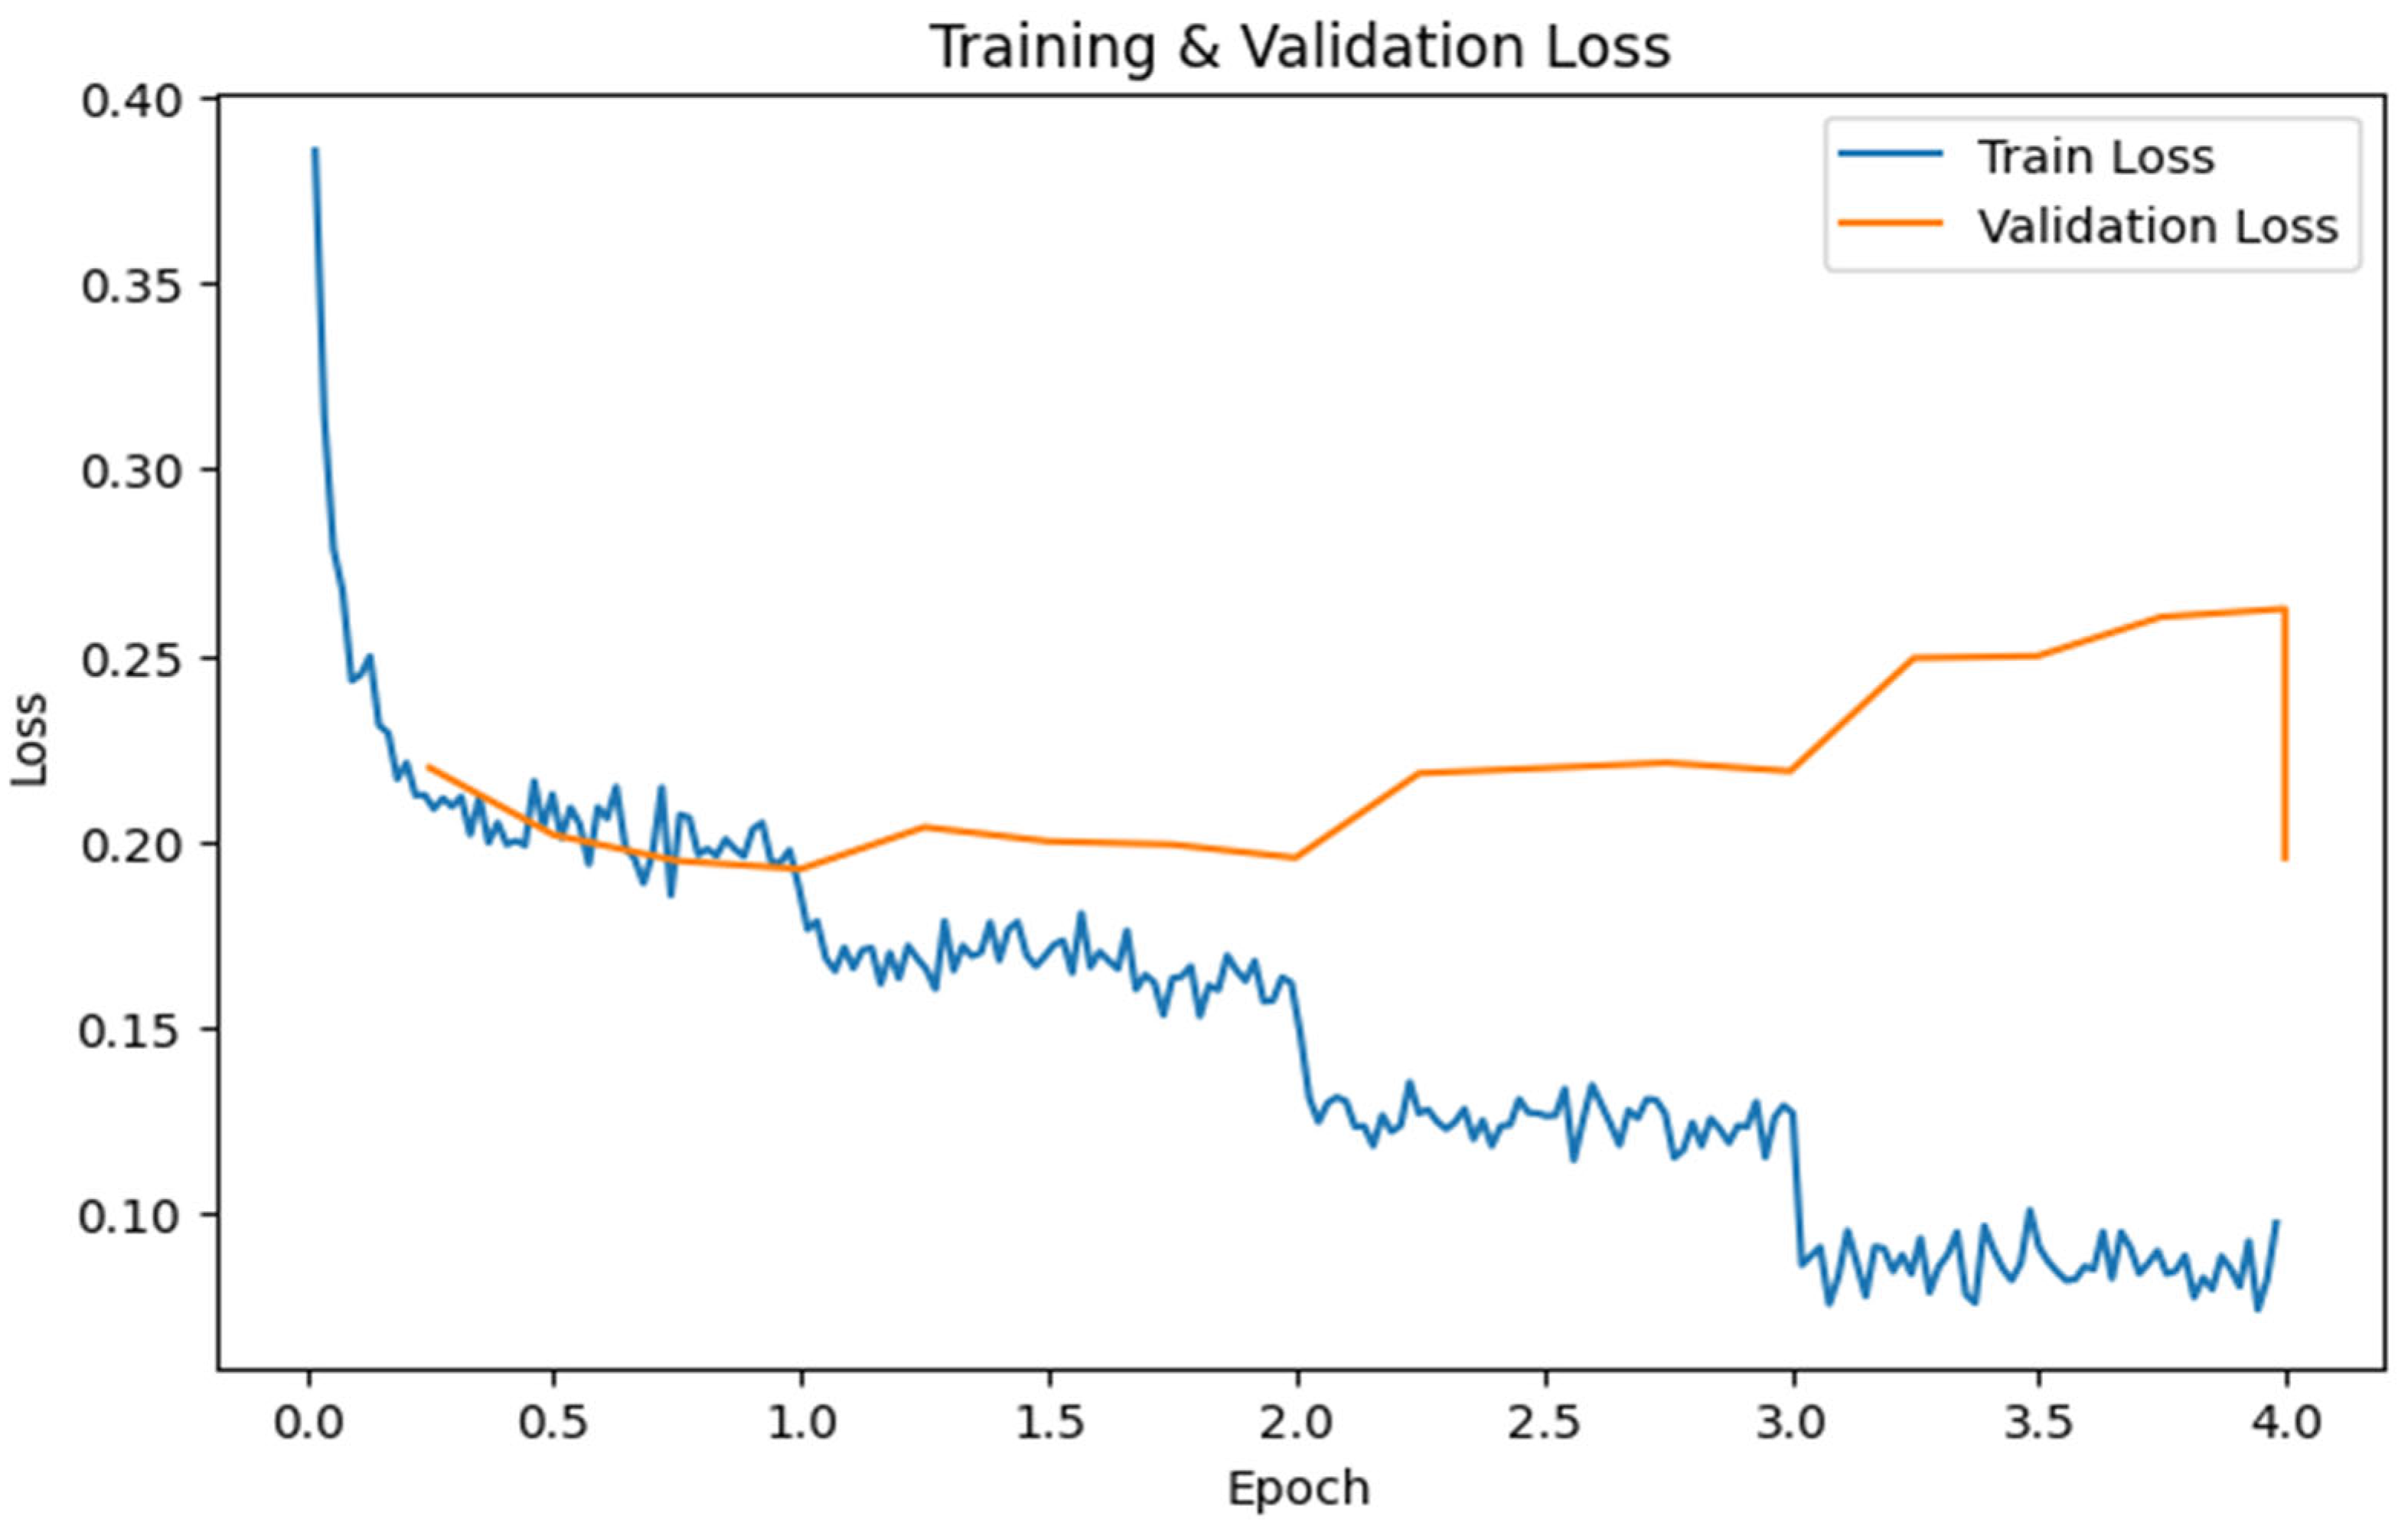
The model training utilized a Bert-base-uncased based network architecture, fine-tuned with the GoEmotions dataset for up to five epochs. As shown in
Figure 4, the training loss rapidly decreases from the first epoch and continues to decrease more slowly thereafter. The validation loss, initially higher than the training loss, shows fluctuations after the second epoch, but the model appears to progress towards the lowest validation loss around the 3rd to 3.5th epoch. The trend of the learning curves indicates that the model is still learning, but an overfitting tendency begins after the 2nd epoch. The early stopping mechanism intervened at 3.5th, terminating the training at the epoch with the best validation loss and F1-score.
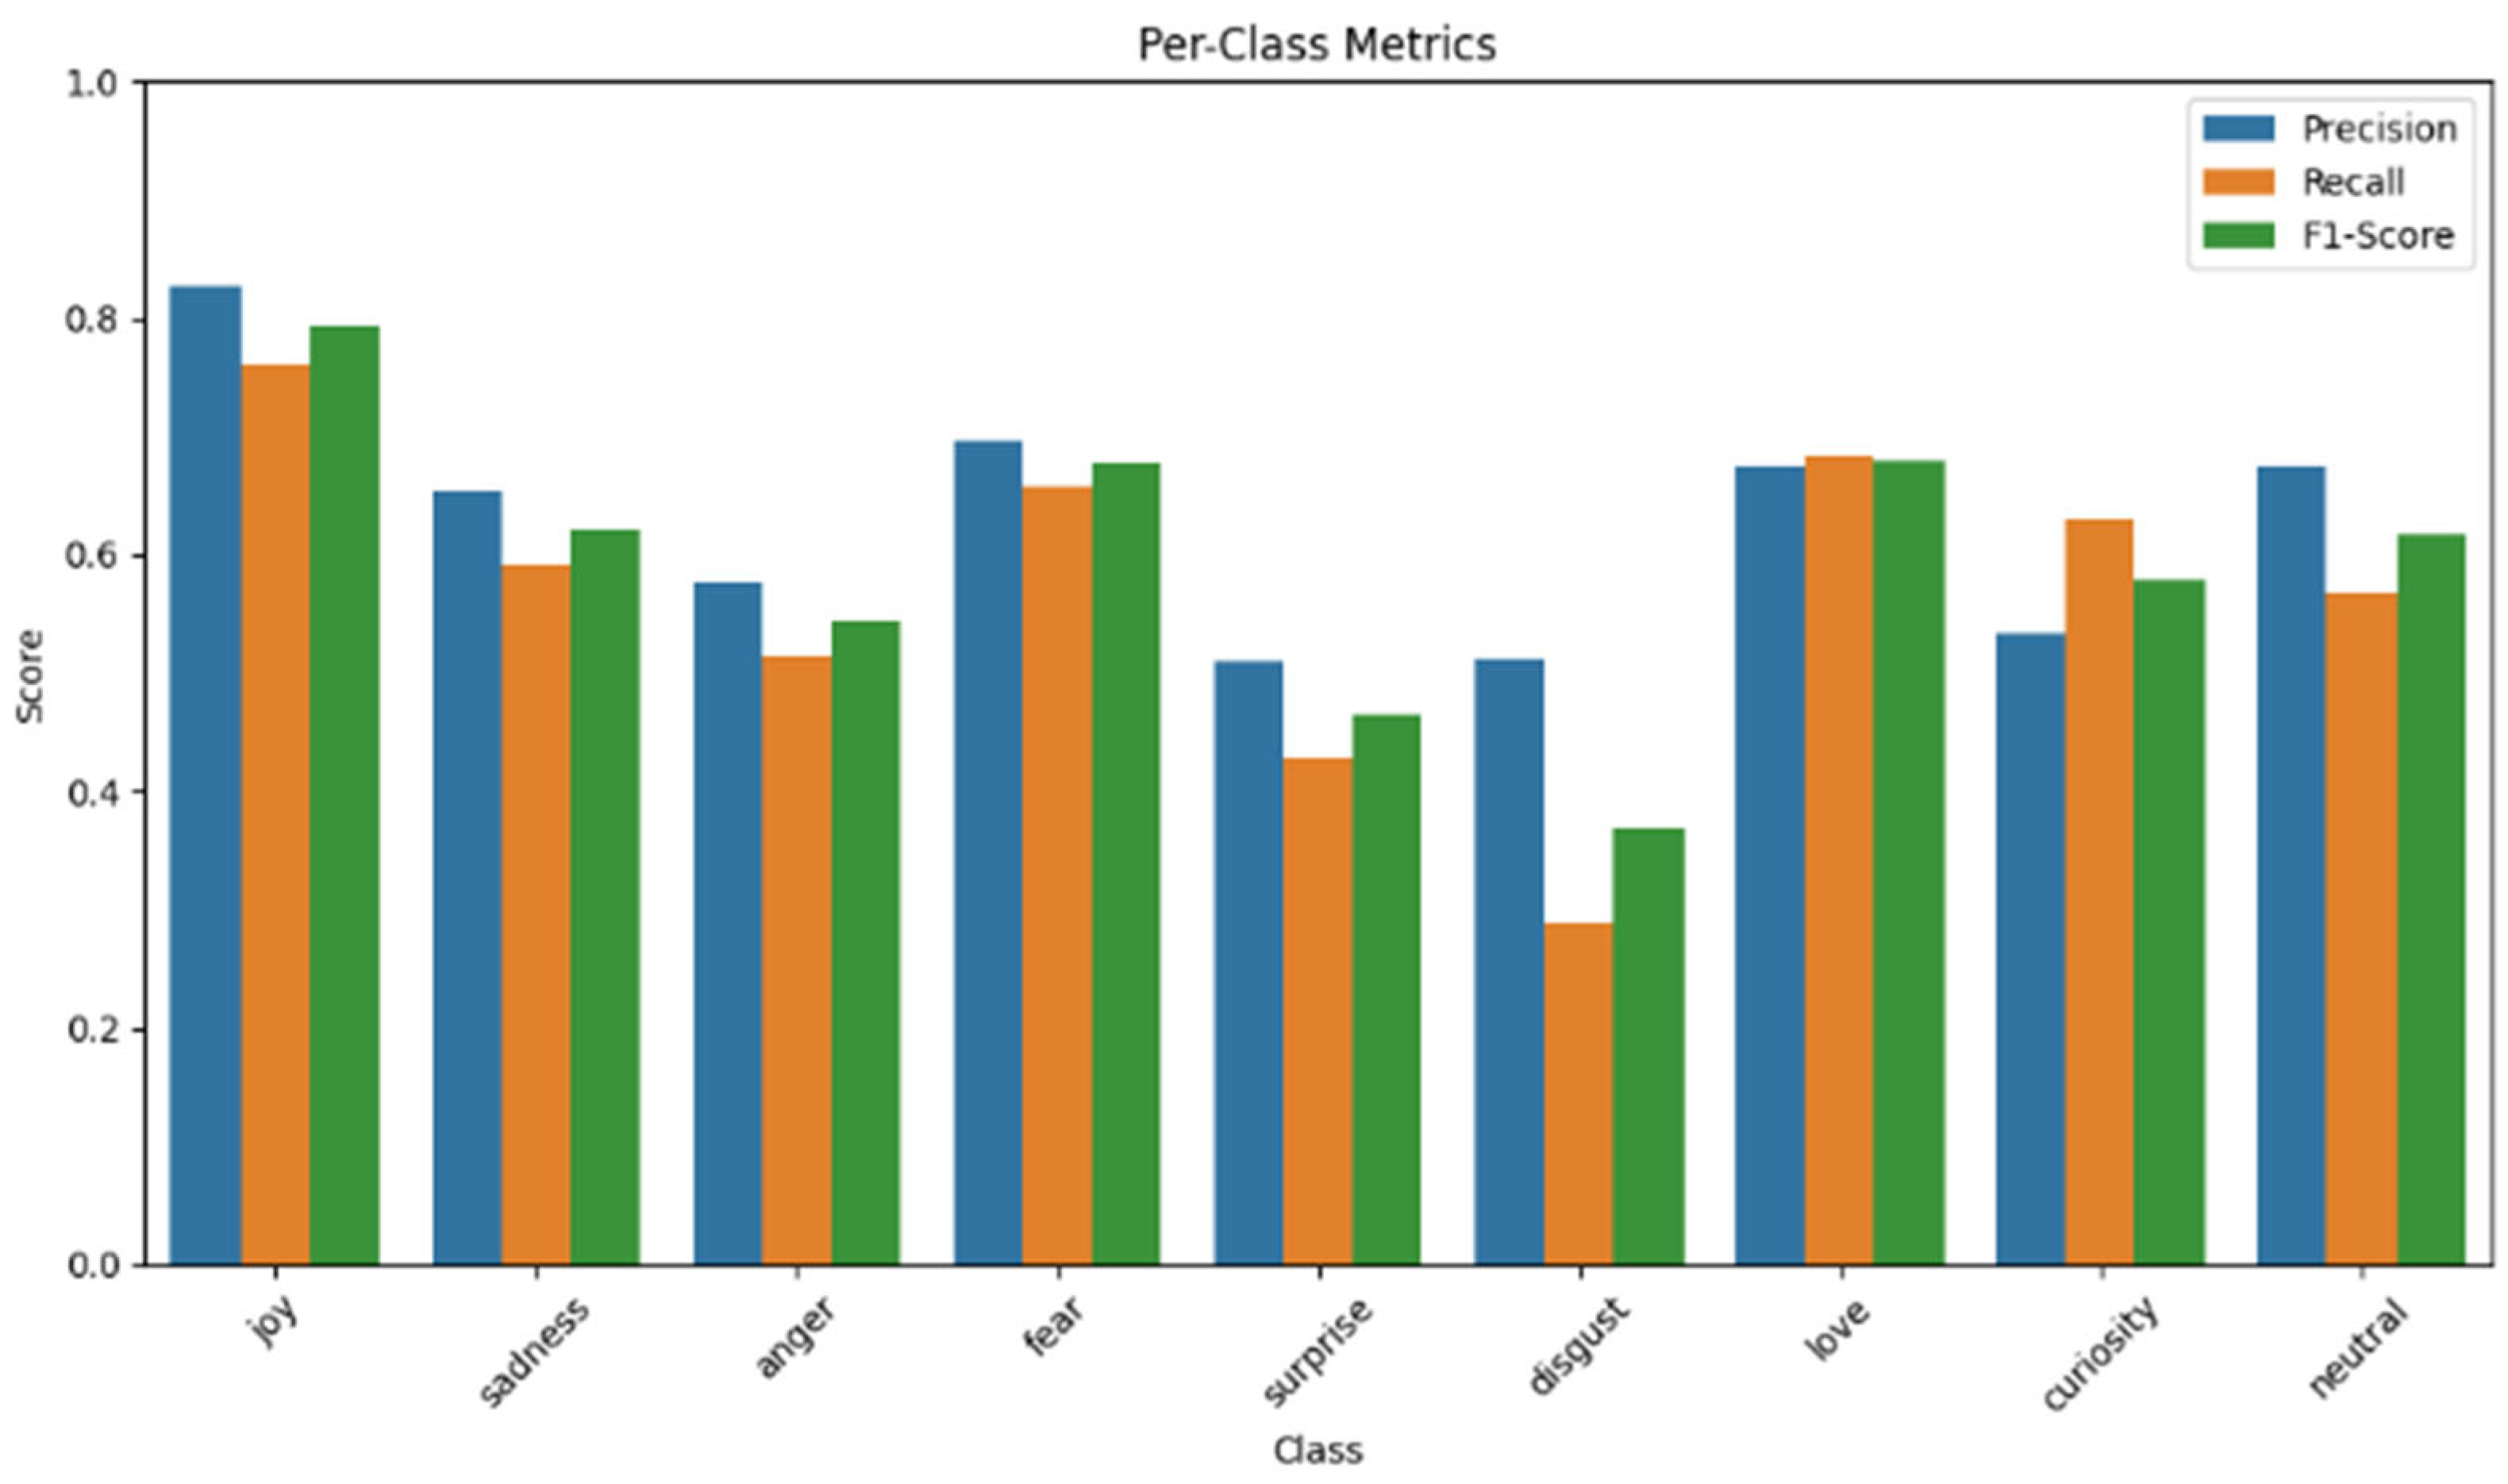
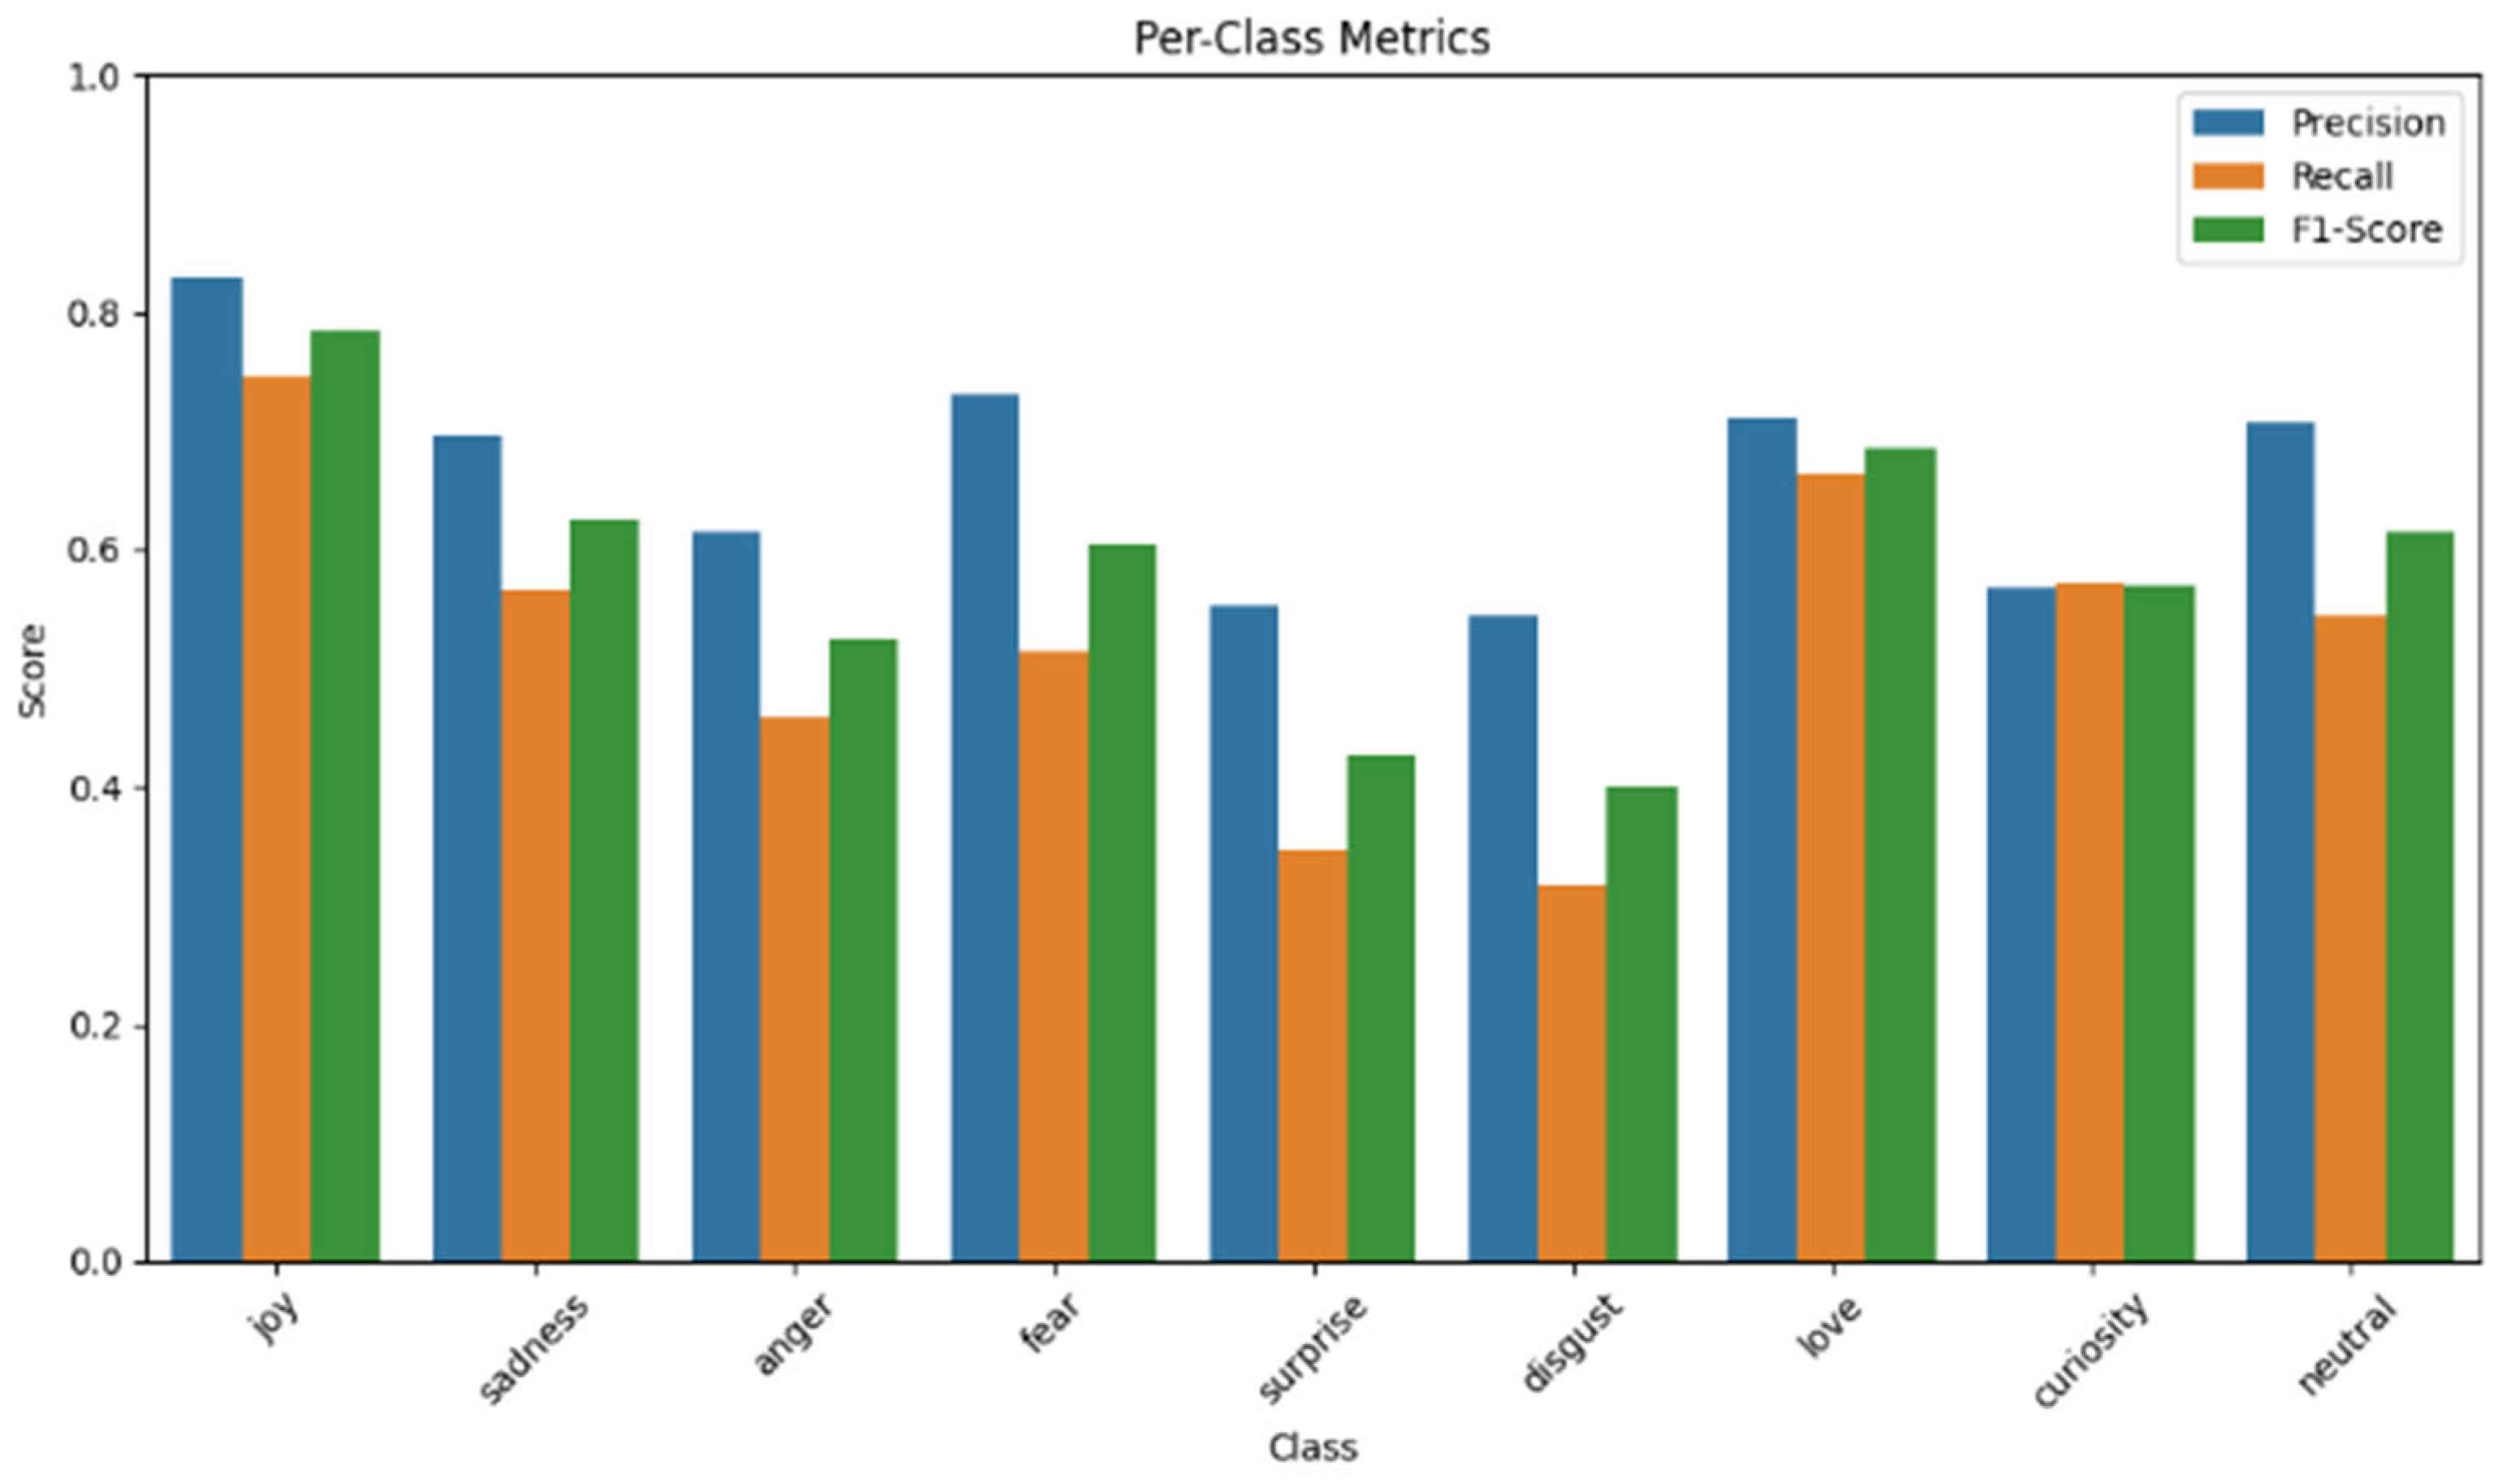
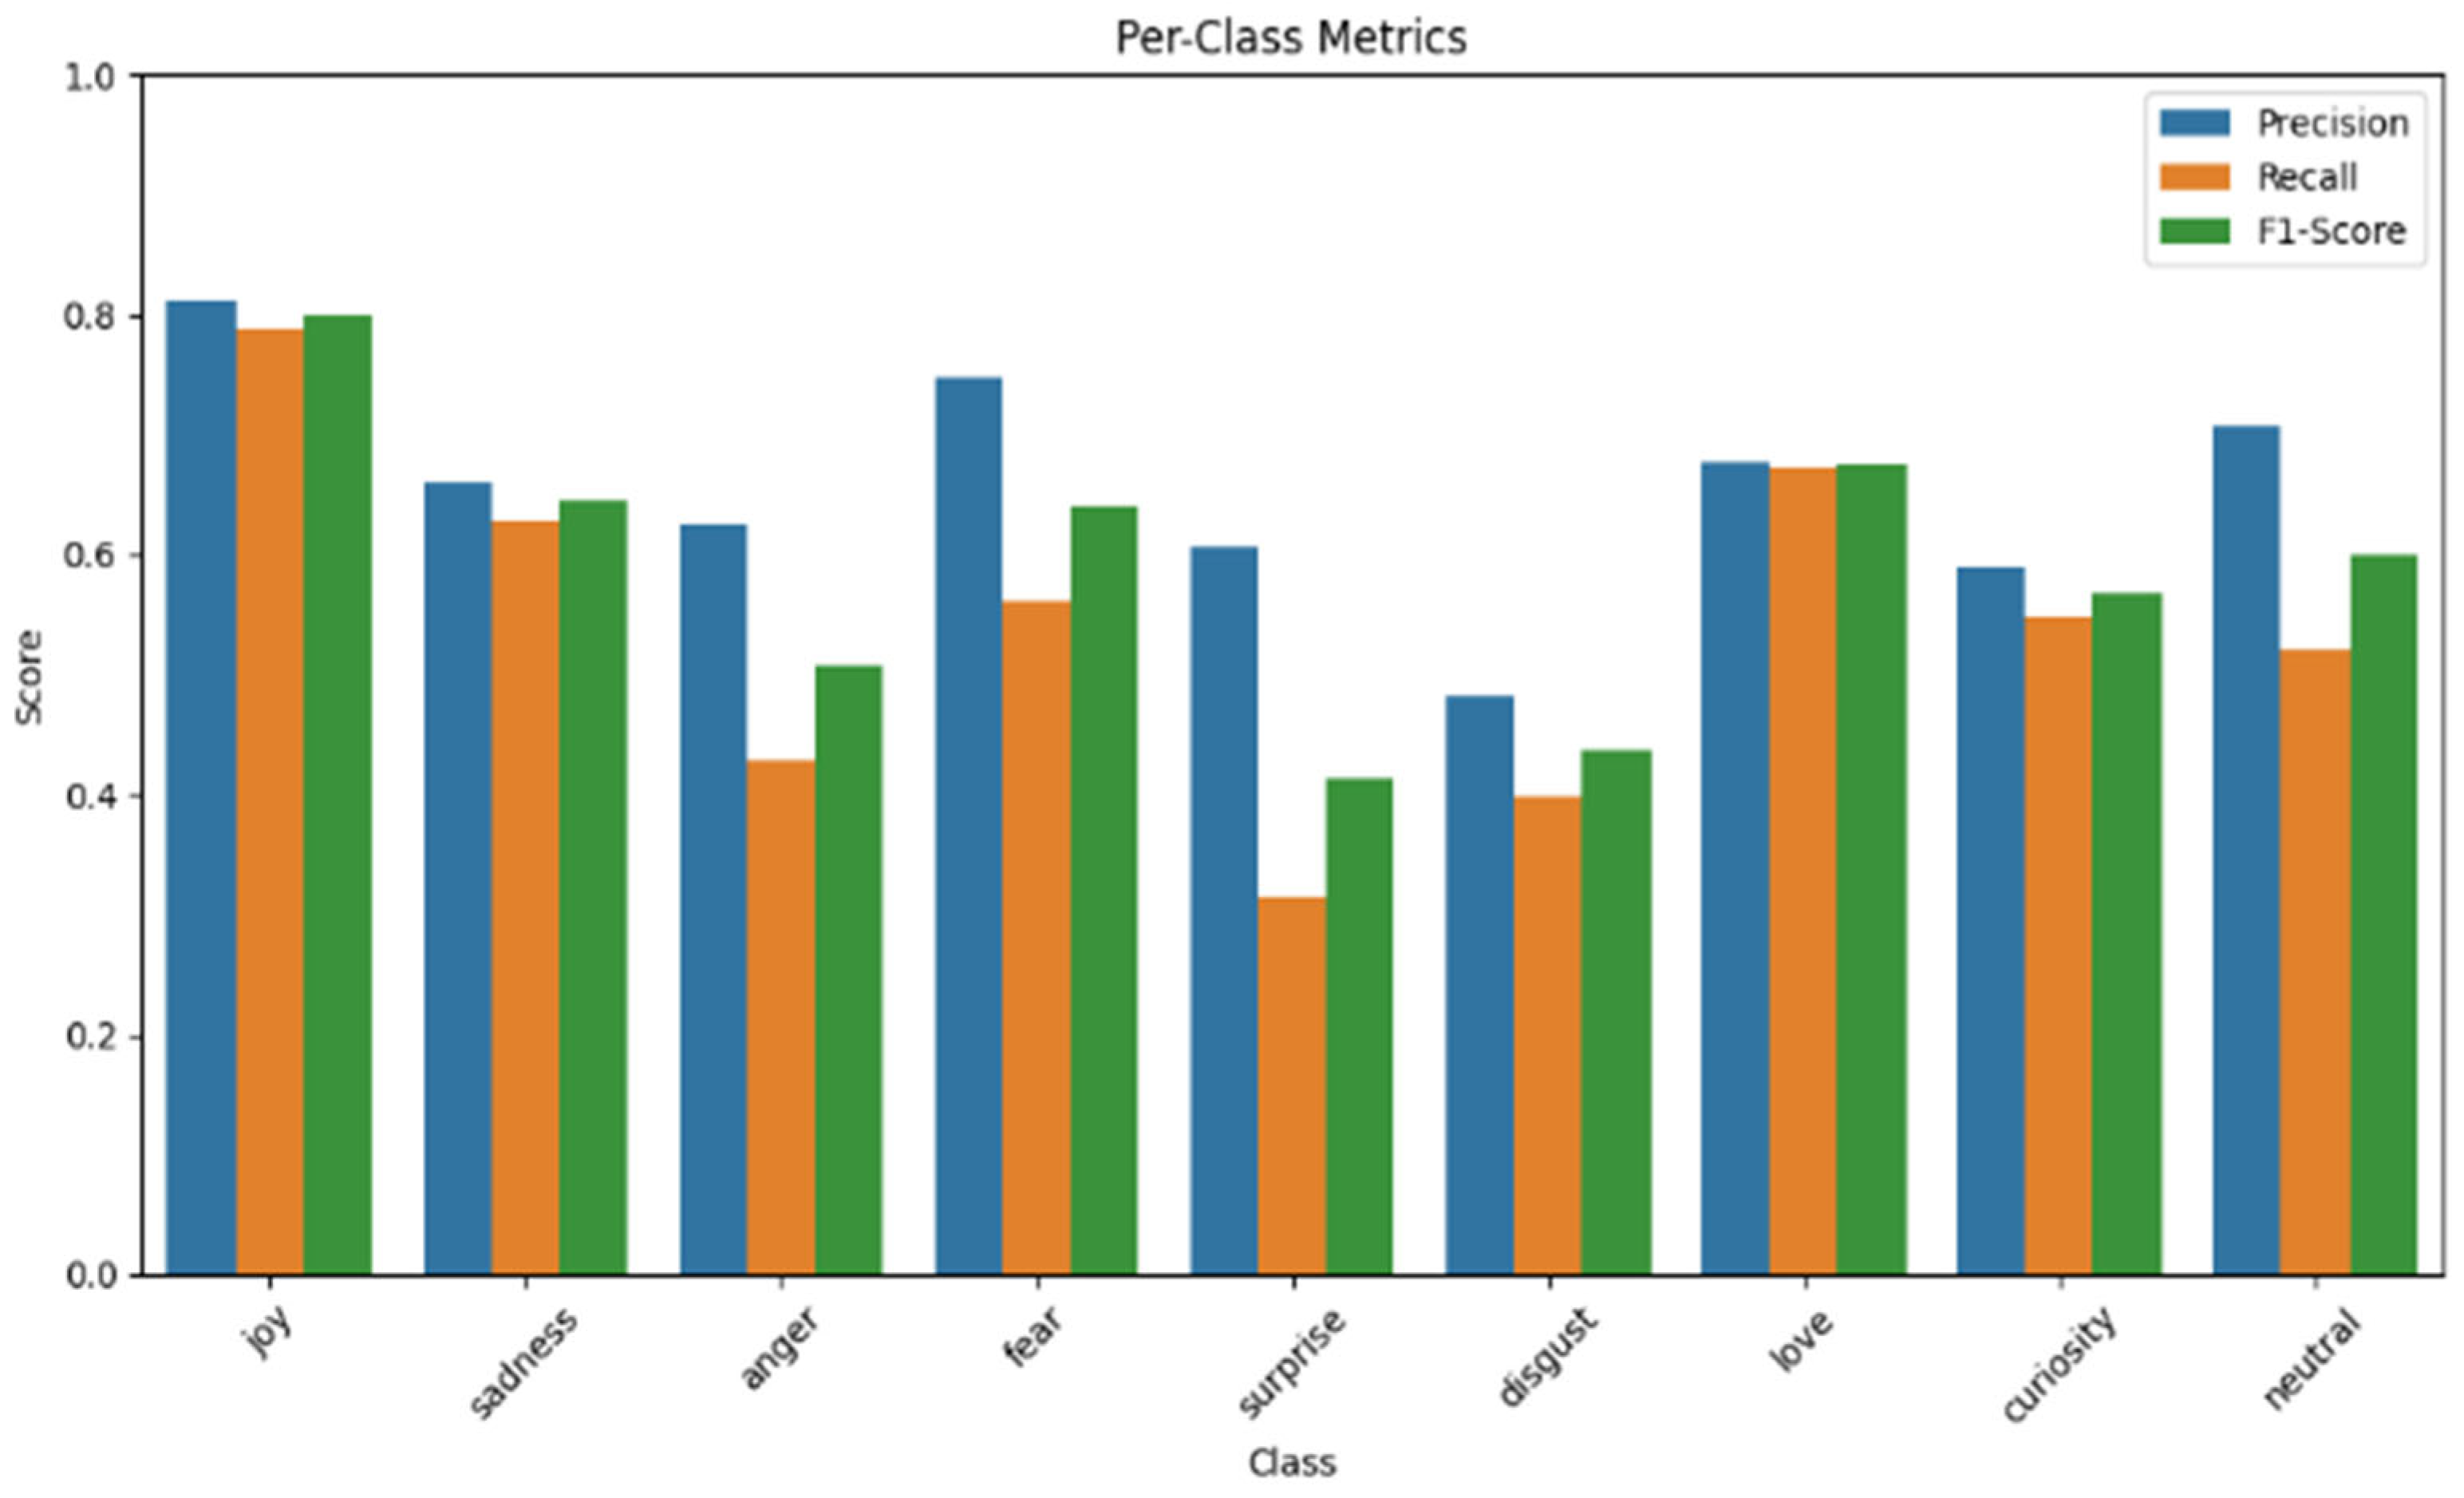
The class-based precision, recall, and F1-scores obtained by the model are graphically summarized in
Figure 5. Some of the numerical values are presented in the classification report in
Table 1. The class-based results are as follows:
joy: One of the emotions with the highest F1-score (79%), with high precision (83%) and recall (76%) values. This can be attributed to the fact that samples labeled joy are more abundant and consistently distributed in the training set compared to other emotions.
sadness: Precision (65%) and recall (59%) are moderate. Data imbalance and multi-label structures in some samples (such as sadness with neutral or sadness with anger) are thought to affect these results.
anger: The model achieved 58% precision and 51% recall for anger. The confusion of anger samples with similar negative emotions (e.g., disgust, fear) relatively reduced success in this class.
fear and surprise: In these classes with relatively few samples, the F1-scores for fear (68% F1) and surprise (47% F1) were more limited. The scarcity of data makes it difficult for the model to detect these emotions.
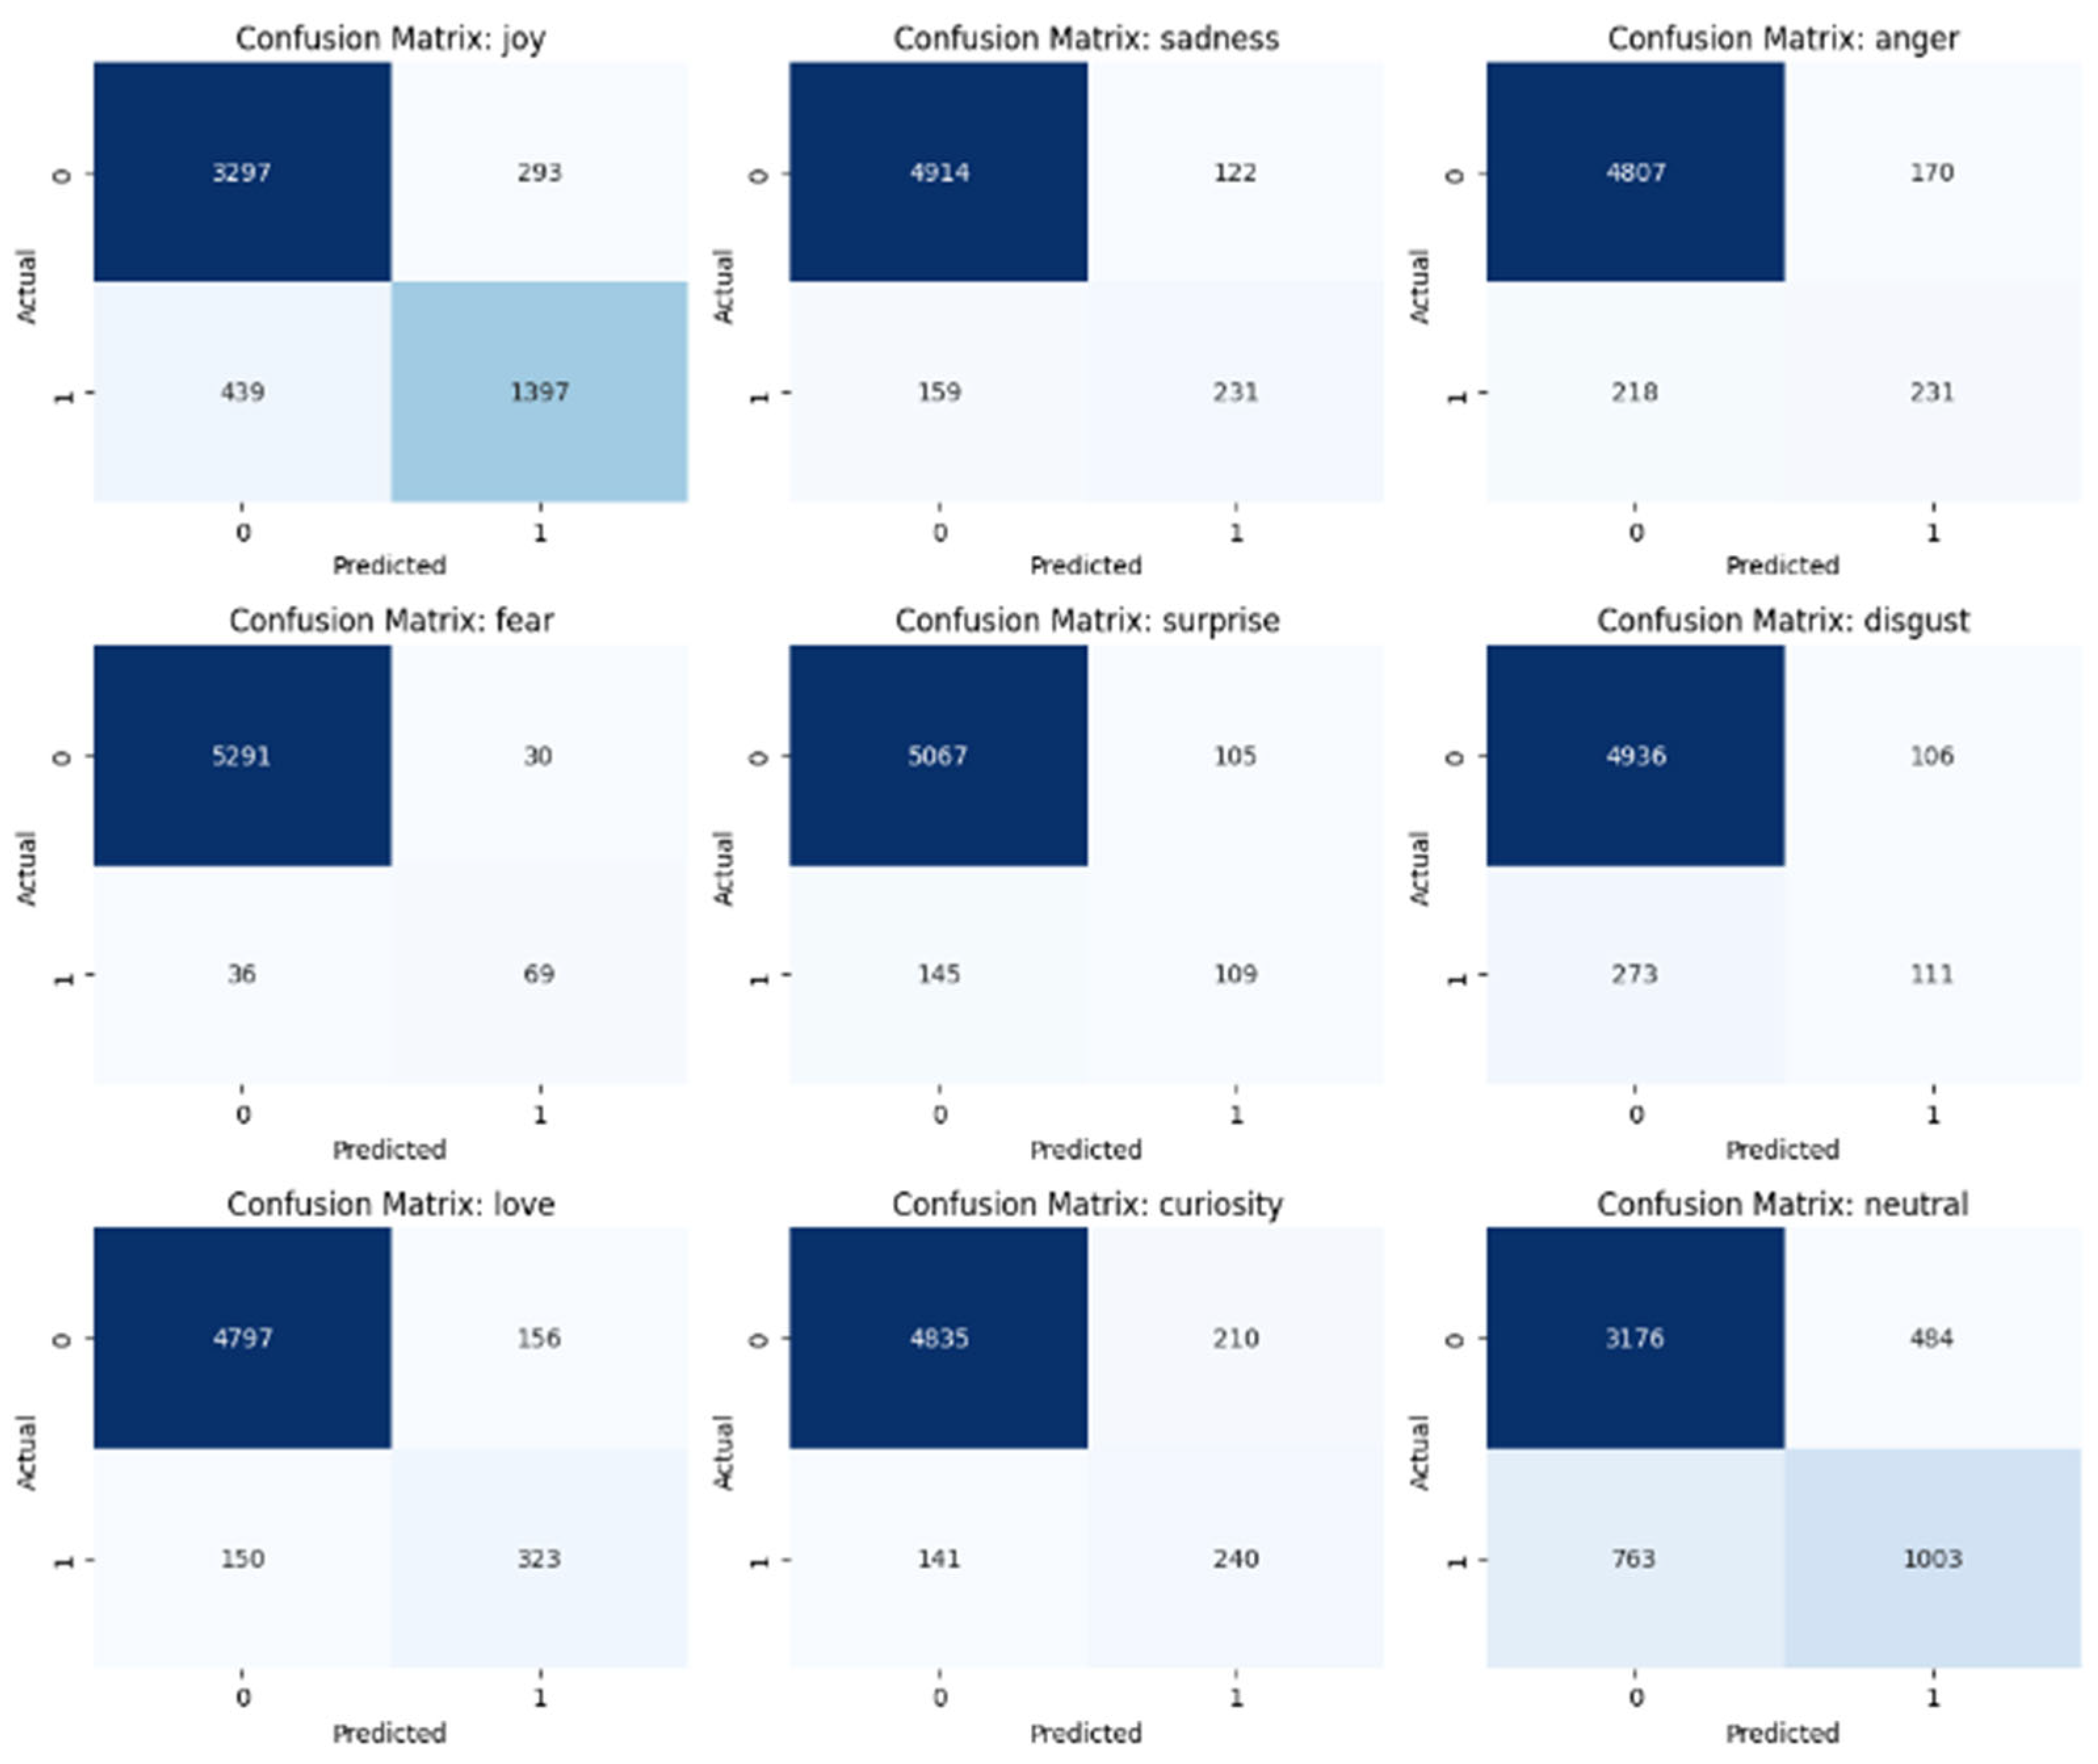
disgust: This class stands out with the lowest F1-score (37%). The disgust label frequently confused with anger or fear classes can also be observed from the confusion matrices in
Figure 6. Although the matrix does not directly show which classes it is confused with, the high number of false negatives (273) for the disgust class suggests that this label is frequently confused with other classes (presumably anger and fear).
love, curiosity, neutral: These three classes have higher complexity as they span both positive and neutral emotions. love exhibits a fairly stable performance with a 68% F1-score, while curiosity (58% F1) and neutral (62% F1) classes are also at reasonable levels.
The binary confusion matrices created for each emotion class show the model’s performance over two classes: the current emotion (1) and all other emotions (0). Each matrix focuses on a single emotion, where the label “1” denotes the presence of the target emotion (such as joy), and “0” aggregates all other emotions into a single opposing class. In this setup, four key outcomes define the model’s success and error rates. A True Positive (TP) occurs when the model correctly identifies an instance of the target emotion as “1.” A False Negative (FN) happens when the model incorrectly predicts “0” for an instance that actually belongs to the target emotion. A True Negative (TN) is recorded when the model correctly classifies instances of other emotions as “0.” Finally, a False Positive (FP) arises when the model incorrectly assigns a “1” label to an instance that does not belong to the target emotion.
Experimental results show that the model is quite successful in majority emotions (e.g., joy, neutral, love). Data imbalance, especially in classes like disgust, surprise, and fear, has led to lower success rates. Looking at the obtained macro F1-score (59%), it can be said that there is a significant performance gap between different classes. The micro F1-score (65%), however, shows that the model exhibits a more balanced overall performance, as the micro average highlights the successes of classes with a high number of samples. This is related to the unequal class distribution in the dataset. In conclusion, our BERT-based emotion analysis model performs well, especially on common emotions, but requires further improvement for minority emotions. The multi-label structure is important for reflecting emotional expressions in cinematic scripts; however, this also makes inter-class label transitions and data imbalances inevitable. In subsequent sections, comparisons with different transformer models and the implementation of hybrid architectures were tested as alternative methods.
DistilBERT Model
In this section, emotion analysis was performed on the GoEmotions dataset using the DistilBERT (Distilbert-base-uncased) model, a lighter and faster version of the BERT architecture. Training parameters were set as follows:
Number of epochs: 5;
Batch size: 16;
Learning rate: ;
Weight decay: 0.01;
Early Stopping: early_stopping_patience = 8.
Evaluation was performed at specific steps (eval_steps) within each epoch, and the best model (best_model) was saved based on the eval_f1 metric.
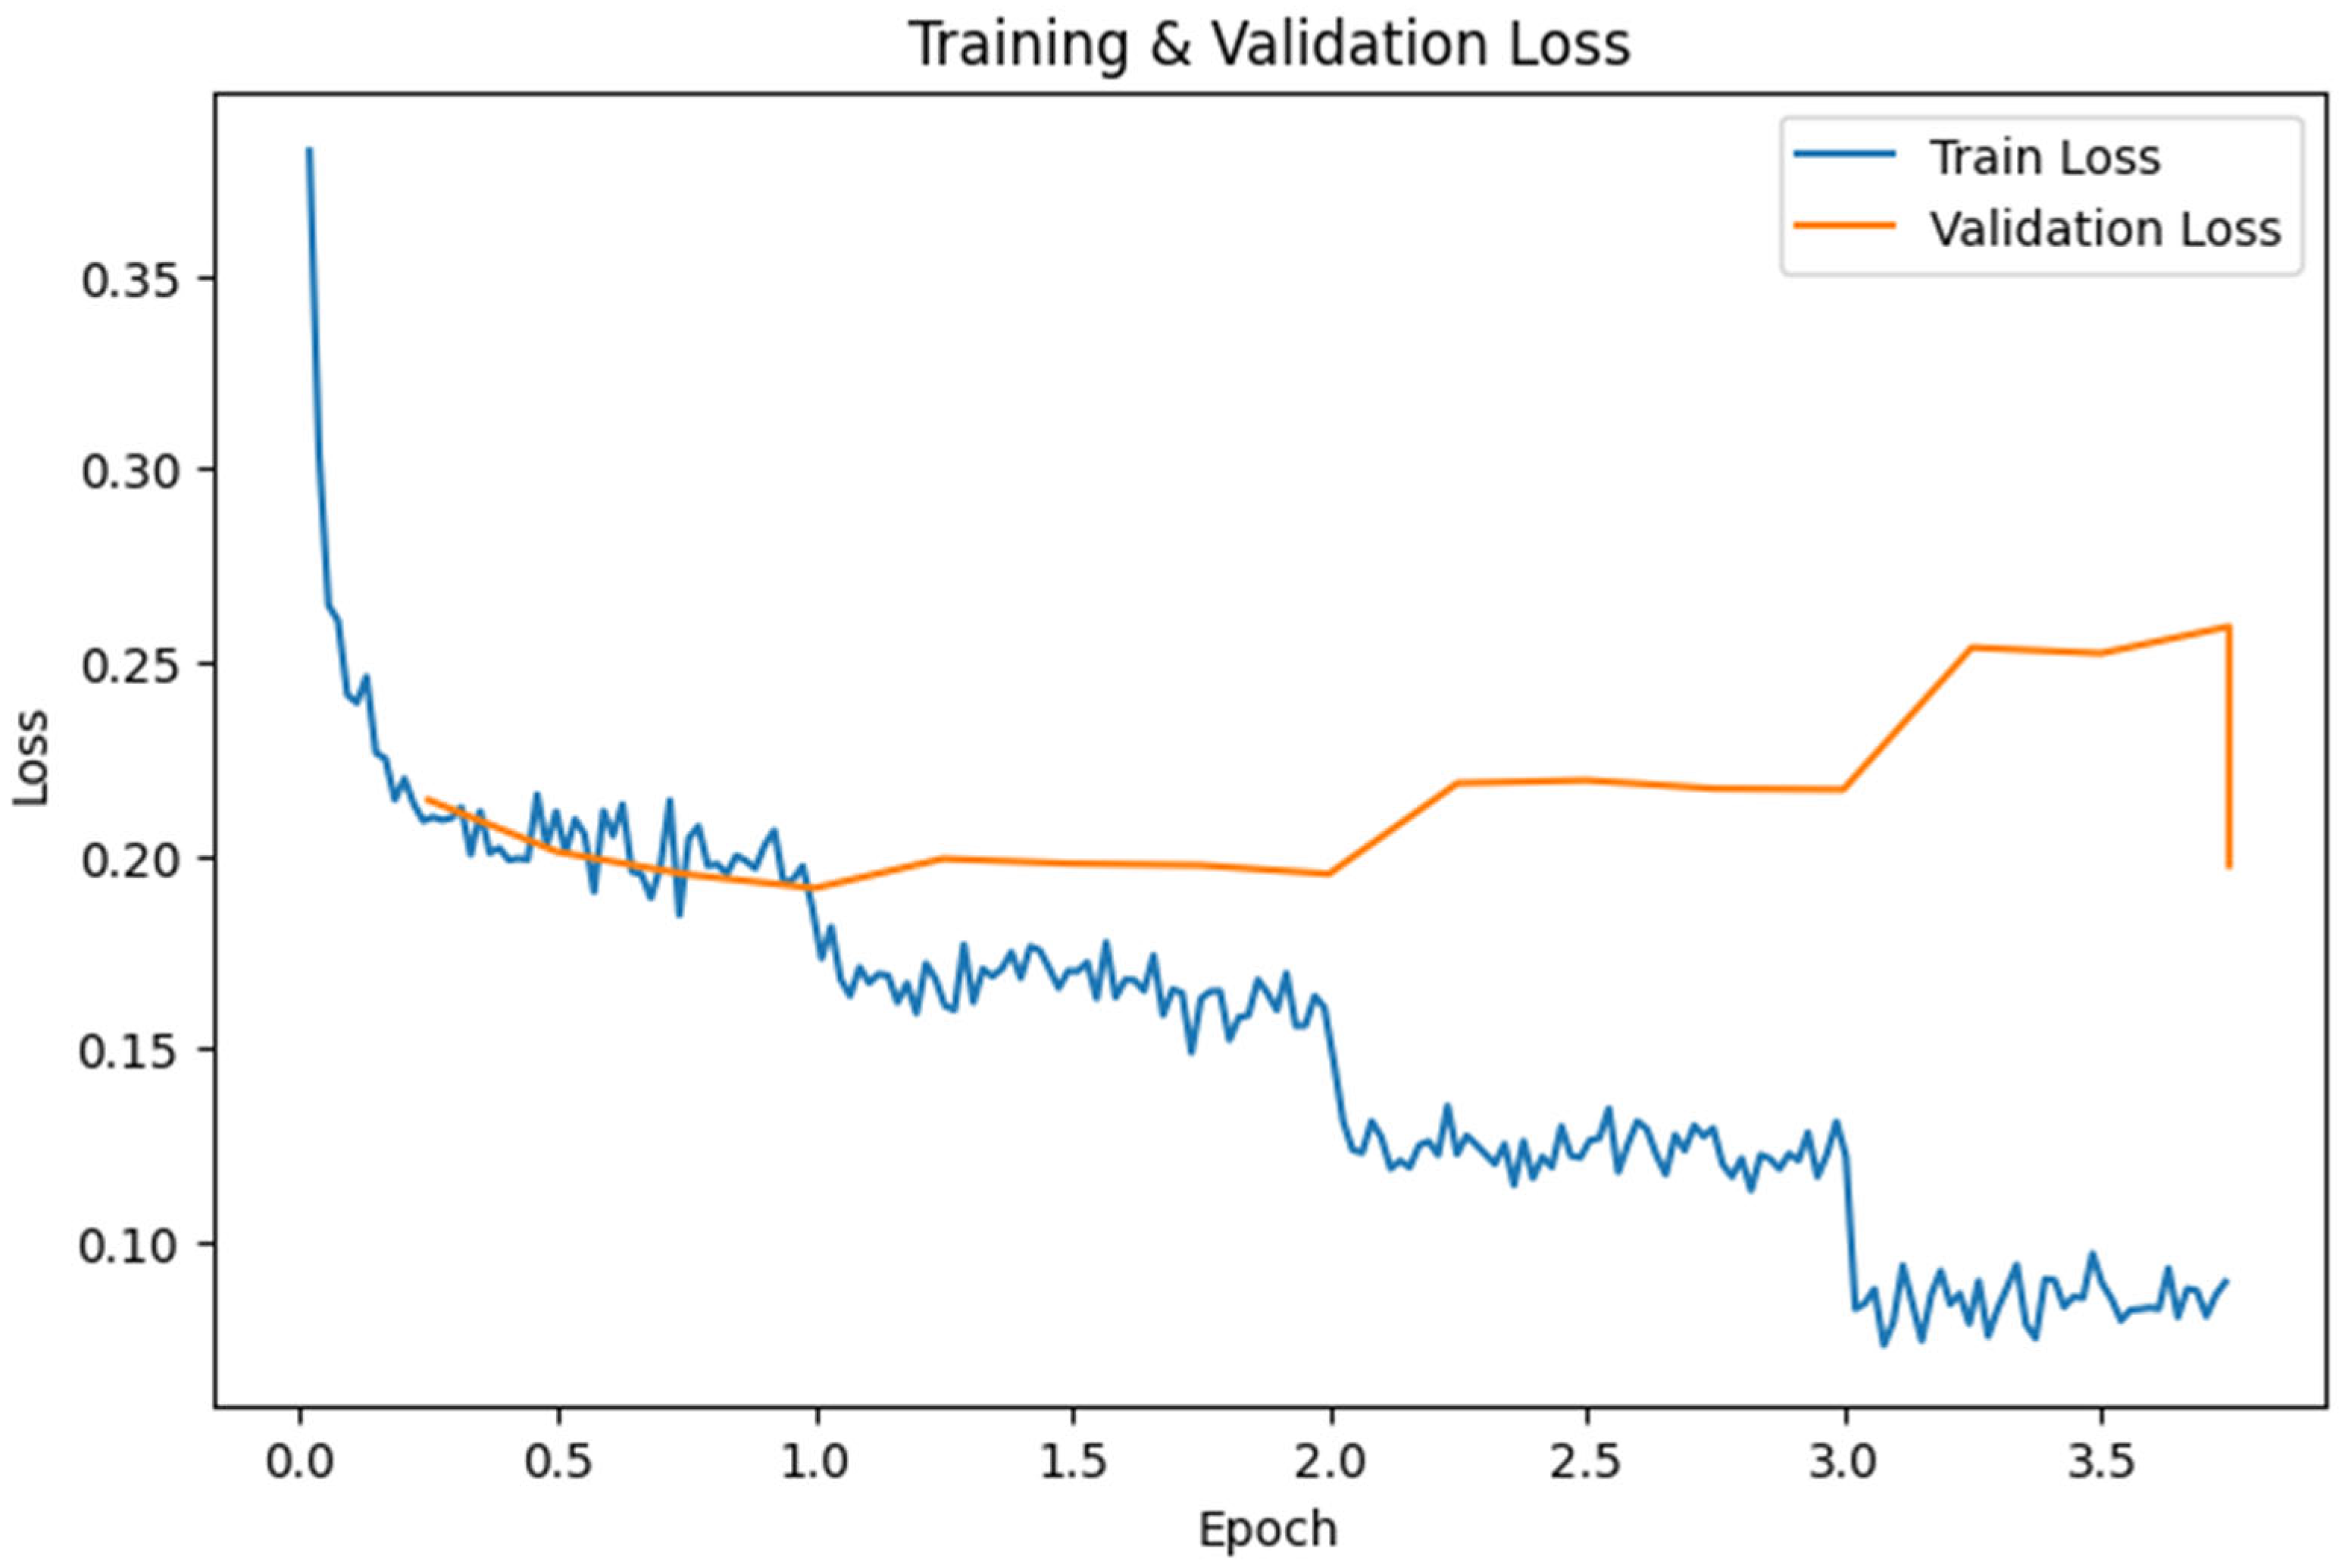
The change in training and validation losses per epoch after DistilBERT training is shown in
Figure 7. As can be seen from the figure, the training loss dropped rapidly from the initial epochs, while the validation loss followed a not-so-similar trend, but fluctuating at moderate levels. The model reached its lowest validation loss and highest F1-score around the 3rd–4th epoch.
Figure 8 presents the precision, recall, and F1 scores of the DistilBERT model on a per-class basis.
The confusion matrices for each emotion class of the model are given in
Figure 9. While acceptable accuracy is achieved in majority classes like joy and neutral, an increased error rate is observed for emotions with fewer samples or high confusability, such as disgust, surprise, and fear.
Table 2 summarizes the class-based precision, recall, and F1-scores obtained by the model.
The DistilBERT model, thanks to its smaller parameter size, offers speed advantages in training and inference processes. However, it may experience some performance loss compared to BERT, especially with imbalanced data or samples where various emotions coexist. While acceptable results are obtained for common labels like Joy, Neutral, and Love, the model appears indecisive for labels like Surprise and Disgust, and the Macro F1 average (58%) lags. Conversely, the micro average value of 65% indicates that the model has considerable performance in majority classes.
RoBERTa Model
In this section, a Roberta-based model was applied to the GoEmotions dataset. Training parameters were set as follows:
Number of epochs: 5;
Batch size: 16;
Learning rate: ;
Weight decay: 0.01;
Early stopping: early_stopping_patience = 8.
Figure 10 shows the change in loss values obtained on the training and validation sets per epoch. After a significant drop in loss from the first epoch, the model’s loss relatively decreased and stabilized in subsequent epochs.
Precision, recall, and F1-scores obtained on the validation dataset are shown in
Figure 11. This graph indicates that the RoBERTa model, similar to other models, exhibits higher success on common labels like joy, but performance is limited for labels like fear, disgust, and surprise.
As shown in
Table 3, the macro F1 value is around 50%. Considering the micro and weighted averages, it is observed that the model experiences a performance loss due to low recall, especially in minority classes.
The macro F1 value (50%) and accuracy (50%) obtained by the RoBERTa model present a picture open to improvement for minority emotions. These results show that the model performs better on common classes like joy and neutral but experiences performance loss due to low recall for minority or complex emotions.
BERT + BiLSTM
In this experiment, a hybrid approach was implemented by combining the bert-base-uncased language model with a BiLSTM layer (CustomHybridModel). The following parameters were used for model training:
Base Model: bert-base-uncased;
lstm_hidden_dim: 256;
Number of epochs: 5;
Batch size: 16;
Learning rate: ;
Weight decay: 0.01;
Early stopping: early_stopping_patience = 8.
The model training took longer (~9 h) than other structures. This is due to the additional parameters of the hybrid architecture. Given the scale and time constraints of this study, long training times presented a disadvantage for practical application.
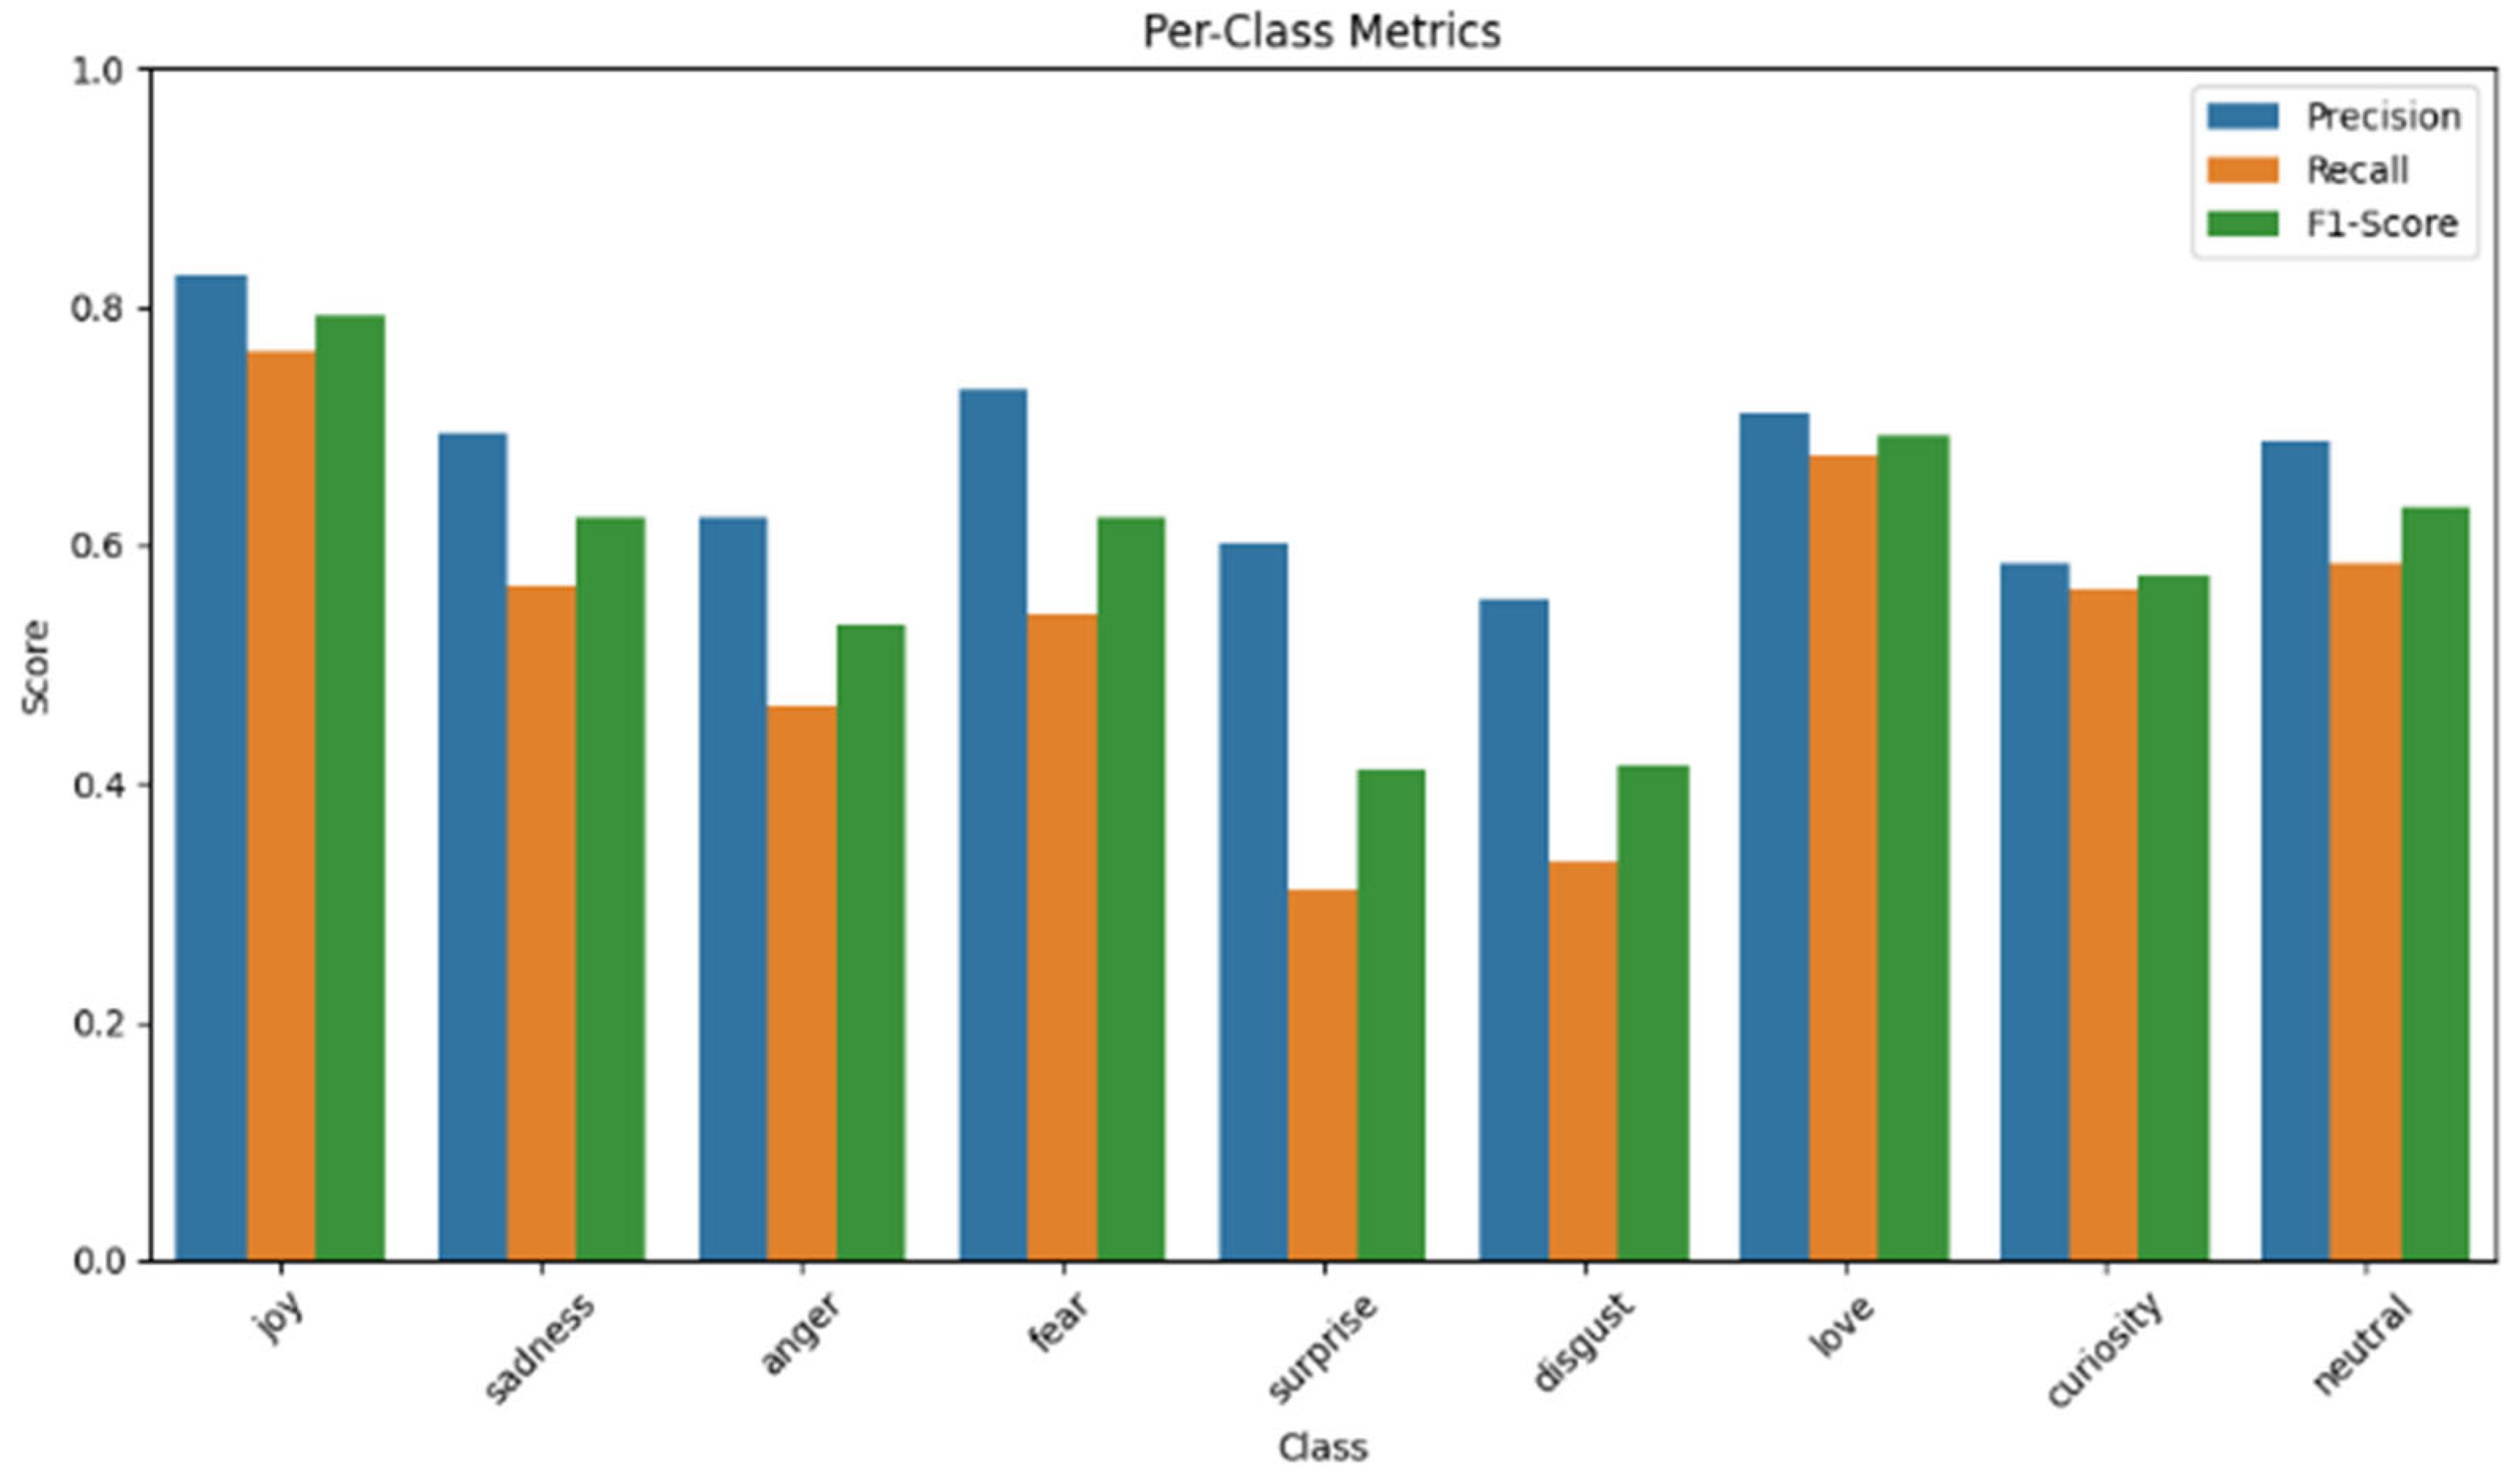
Figure 12 shows the loss values of the hybrid model on the training and validation sets per epoch.
The class-based precision, recall, and F1-scores obtained by the hybrid model on the validation set are summarized in
Figure 13.
The classification report data are summarized in
Table 4. The macro-averaged F1-score is at 59%, while the weighted average is around 65%.
The hybrid model achieved a reasonable macro F1 (59%) and weighted F1 (65%) score compared to other models. However, the training process was longer (~9 h) compared to similar experiments due to the increased number of parameters with the additional BiLSTM layer. From an application perspective, high time cost is a factor to consider in practical usage scenarios. The results indicate that the hybrid architecture brings some improvement to the BERT-based approach in certain classes but extends the training time.
BERT + CNN
In this experiment, a hybrid emotion analysis architecture was designed by combining a BERT-based embedding layer with a single-layer CNN (Conv1D). The components of the model are as follows:
1. BERT Encoder: bert-base-uncased model; configured in multi_label_classification mode.
2. Conv1D + ReLU: Processes the output from BERT’s last layer (format: batch_size, seq_len, hidden_dim) with a Conv1D layer (kernel_size = 3, out_channels = 256) and ReLU activation. In PyTorch (Pytorch 2.5.1), since the Conv1D input format is , the output from BERT in shape needs to be transposed to .
3. Global Max Pooling: A global max pooling is applied to the tensor obtained after convolution , reducing it to dimension.
4. Classifier (Linear Layer): In the final layer, the obtained vector is converted into classification scores (logits) of num_labels dimension through a linear layer.
5. BCEWithLogitsLoss: BCEWithLogitsLoss is used to support the multi-label structure, independently evaluating the presence/absence of each label.
The following basic parameters were used:
Number of epochs: 5;
Batch size: 16;
Learning rate: ;
Weight decay: 0.01;
Early stopping: early_stopping_patience = 8.
Figure 14 shows the change in training and validation losses of the BERT + CNN model per epoch.
The obtained metrics show how the model performed on the GoEmotions validation set.
Eval Loss: 0.196;
Accuracy: 55.8%;
Macro F1: 58.96%;
Precision: 66.27%;
Recall: 53.72%.
Table 5 contains the report summarizing class-based details.
Binary confusion matrices generated for each emotion label are shown in
Figure 15.
The results indicate that the BERT + CNN architecture performs relatively well on common emotions like joy, love, and neutral, while for less frequent emotions like disgust and surprise, the F1-score declines due to the model’s low recall. The convolutional layer provided an advantage in capturing n-gram-like approaches within the sequence, achieving a macro F1 of 59% and a weighted F1 of 65%. This is consistent with the results obtained by BERT + CNN hybrids in [
36]. Although the training time was slightly longer compared to the base BERT model, the CNN layer was observed to be lighter than recurrent networks like BiLSTM. This BERT + CNN based model offers good performance in multi-label emotion analysis tasks with a macro F1 of 59%.
BERT + SCNN
In this experiment, a hybrid architecture for multi-label emotion classification was designed by combining a BERT-based embedding layer with a Sequence-based CNN (SCNN) approach. The designed model comprised several key components. Initially, a Bert-base-uncased model, configured for multi-label classification, served as the BERT encoder; its output was a tensor of size , representing batch_size, sequence_length, and hidden_dimension, respectively. Following the encoder, multiple Conv1D layers were employed, each utilizing different kernel sizes (e.g., 3, 4, 5).
The input to these convolutional layers was the BERT output, first transposed from a shape to . Each convolution layer used a filter size yielding out_channels = 128 and applied a ReLU activation function. Subsequently, Global Max Pooling was performed over the output of each Conv1D layer. The pooled outputs from each convolution layer were then concatenated horizontally, creating a combined feature vector. This concatenation allowed features from different n-gram windows, captured by the multiple convolution filters, to be represented together.
This combined feature vector, with a dimensionality equal to out_channels multiplied by the number of different kernel sizes , was then passed to a fully connected linear layer. The output of this layer produced logits for num_labels = 9 dimensions. Finally, the BCEWithLogitsLoss function was used to support the multi-label structure of the model.
The model includes a Bert-base-uncased based encoder and Conv1D layers. The following basic hyperparameters were used:
Number of epochs: 5;
Train batch size: 16;
Learning rate: ;
Weight decay: 0.01;
Early Stopping Callback: early_stopping_patience = 8.
The total training time is similar to other BERT-based approaches, although the additional parameters of the Conv1D layers can partially extend the training. In the current setup, training approached optimal performance around 3–4 epochs.
Figure 16 shows the change in loss values obtained by the model on the training and validation sets per epoch. While the training loss shows a steady decrease from the first epoch, the validation loss tended to rise and fluctuate after the 2nd–3rd epoch, then suddenly decreased to a certain level, indicating ongoing learning.
Figure 17 shows the per-class precision, recall, and F1-scores for the BERT + SCNN model.
Table 6 contains the report summarizing class-based details.
The SCNN architecture aimed to enrich the embedding layer from BERT by focusing on various n-gram-like information through different kernel sizes. However, the results show more pronounced improvement in majority emotions, while progress for minority emotions remains limited due to the current data distribution and model complexity.

