5.1. Synthetic Sensor Data Generation
Developing and validating process mining frameworks for industrial applications often faces practical constraints due to the limited availability of high-quality, fully annotated real-world datasets. These limitations are particularly evident in safety-critical domains such as food processing, where data access is restricted for confidentiality and traceability reasons, and manually labeled ground truth is seldom available due to the high cost and operational disruption required for data annotation.
To overcome these challenges, we constructed a synthetic dataset grounded in domain knowledge and supported by validated literature on HTST pasteurization dynamics [
4,
15]. This simulation-based approach enables reproducible experimentation in a controlled, parameterized environment that mimics real operational complexity—including multivariate sensor behavior, activity transitions, and regulatory thresholds. By modeling realistic temperature, pH, conductivity, viscosity, turbidity, flow, and pressure signals over full batch cycles, we ensured that the synthetic data reflects not only nominal behavior but also variability and overlaps typical of industrial settings.
Such an approach is common in the study of process mining from sensor data (e.g., [
12,
29]), where synthetic traces serve both to test methodological assumptions and to provide a benchmark for evaluating segmentation and prediction techniques. Moreover, it allows researchers to include additional variables and controlled anomalies that may not be simultaneously accessible in a single installation, thereby supporting generalization across multiple monitoring scenarios.
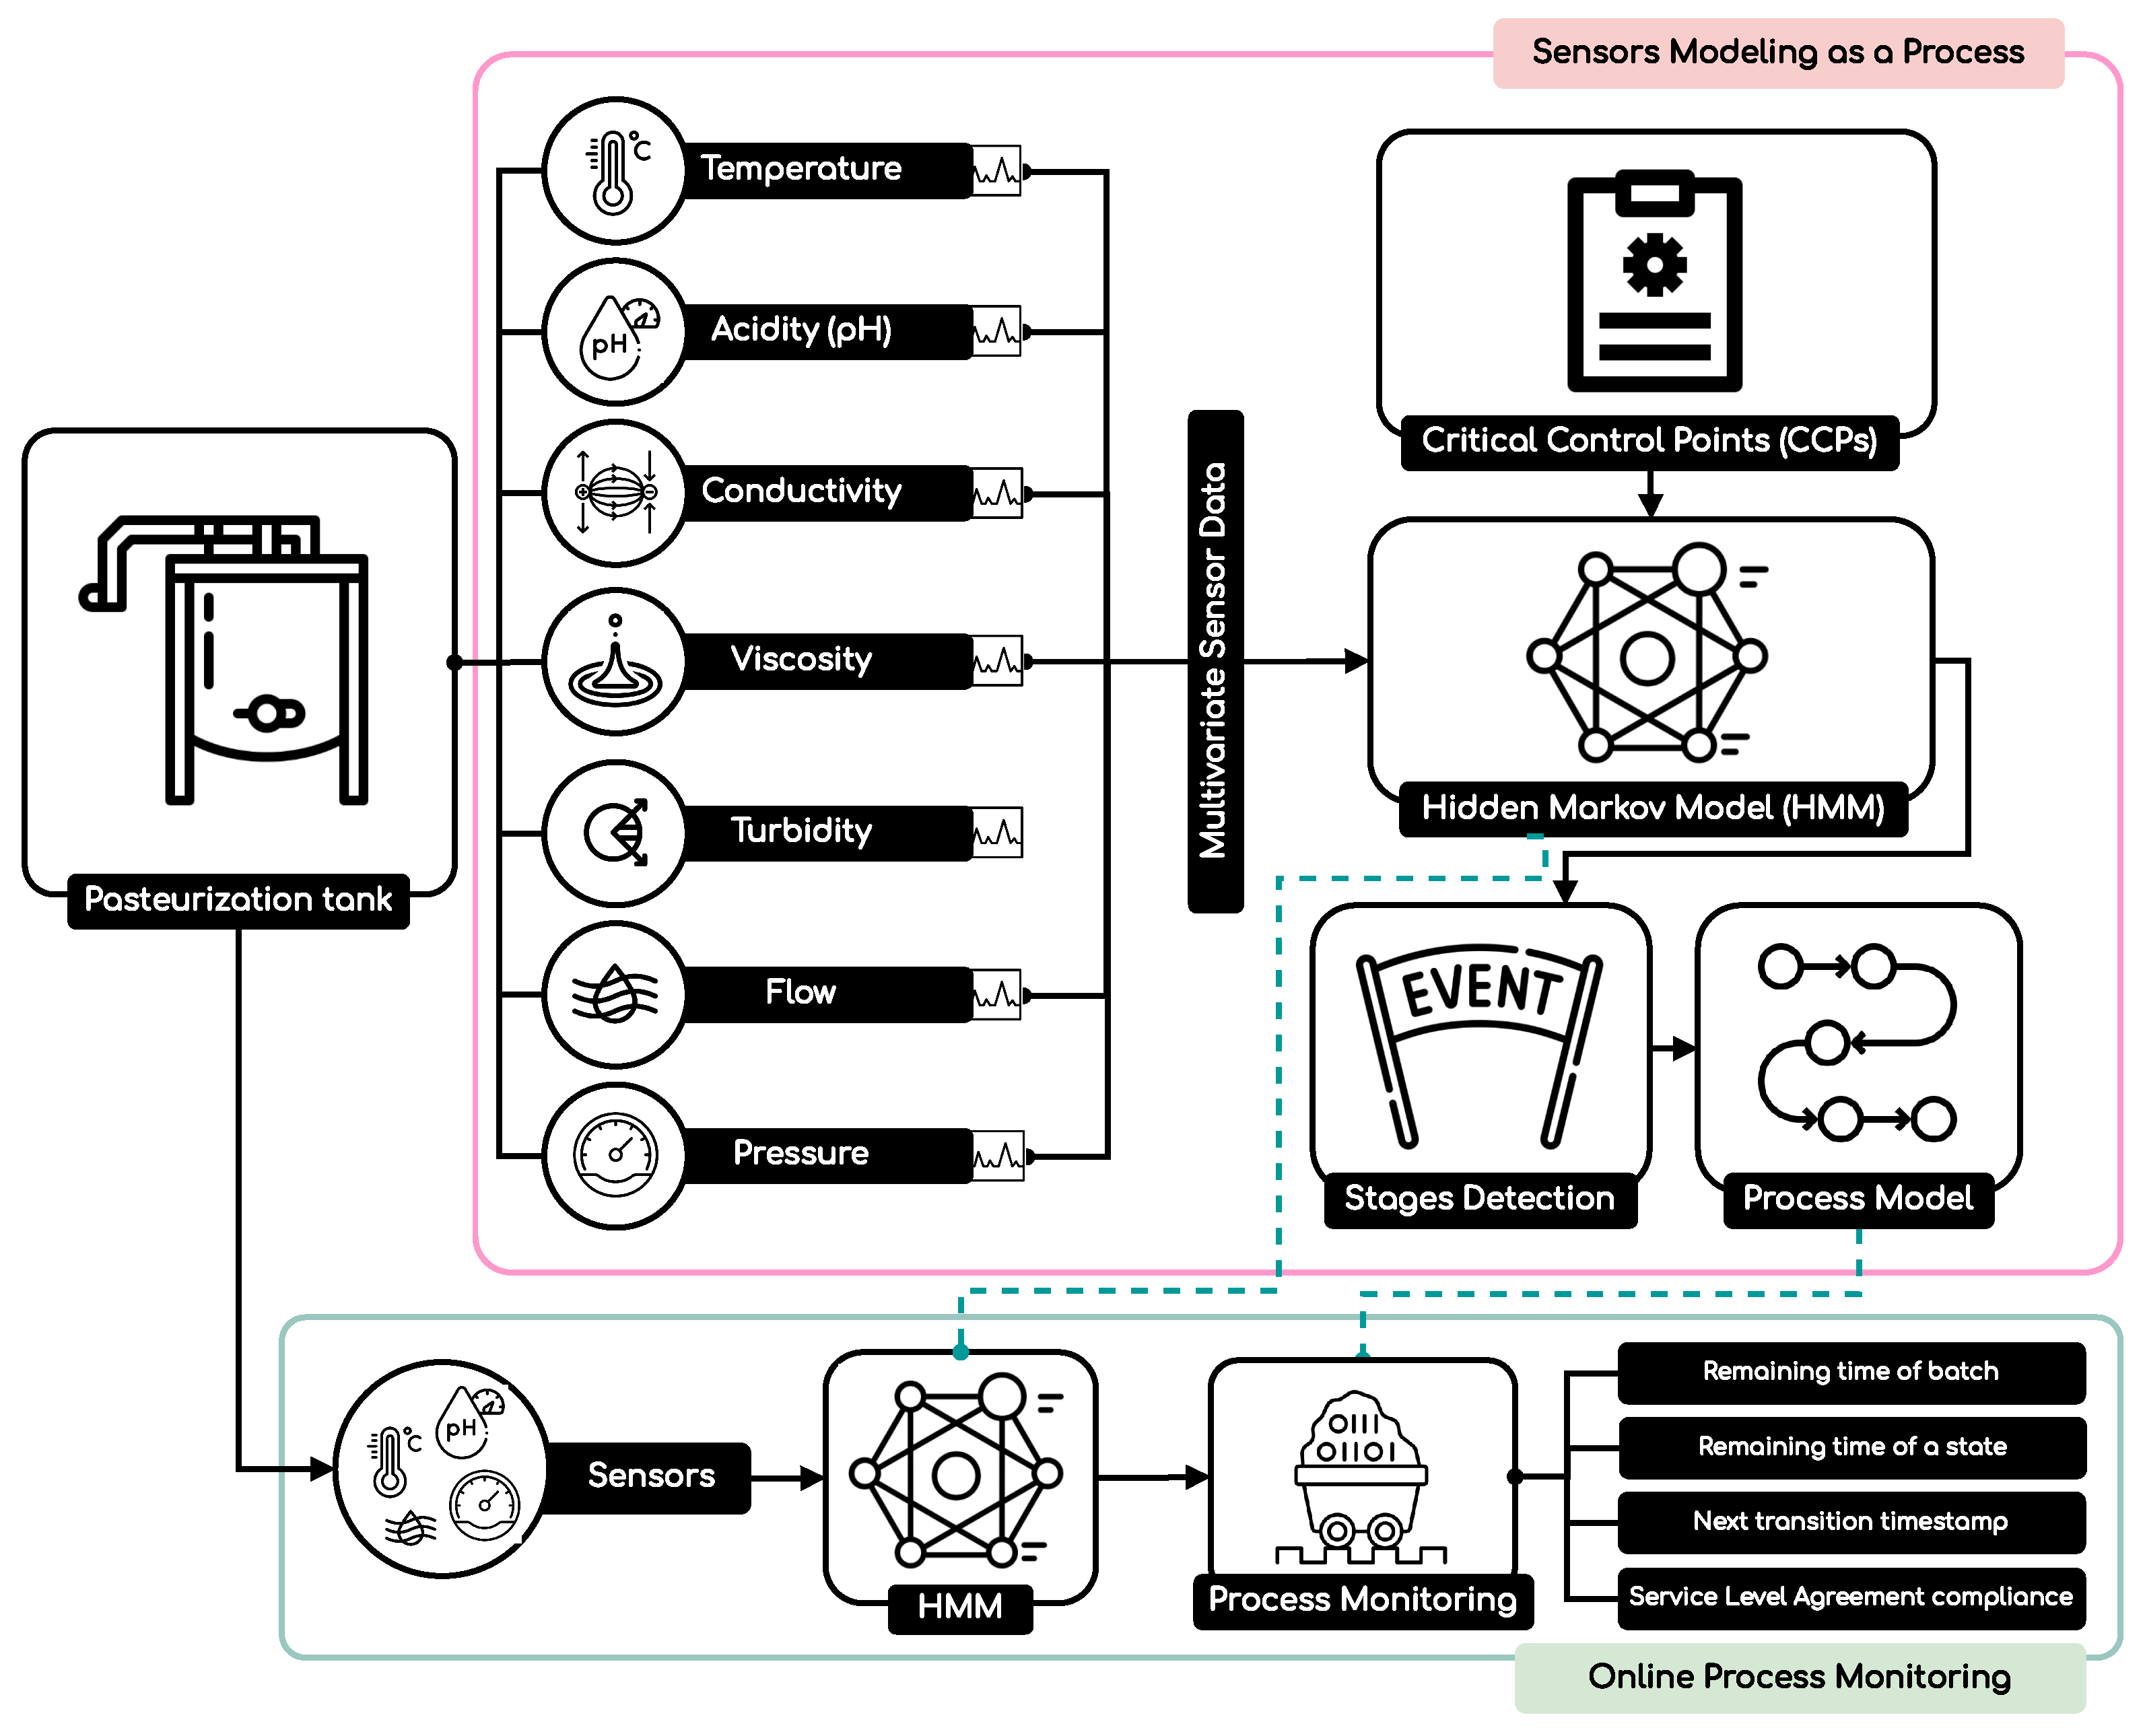
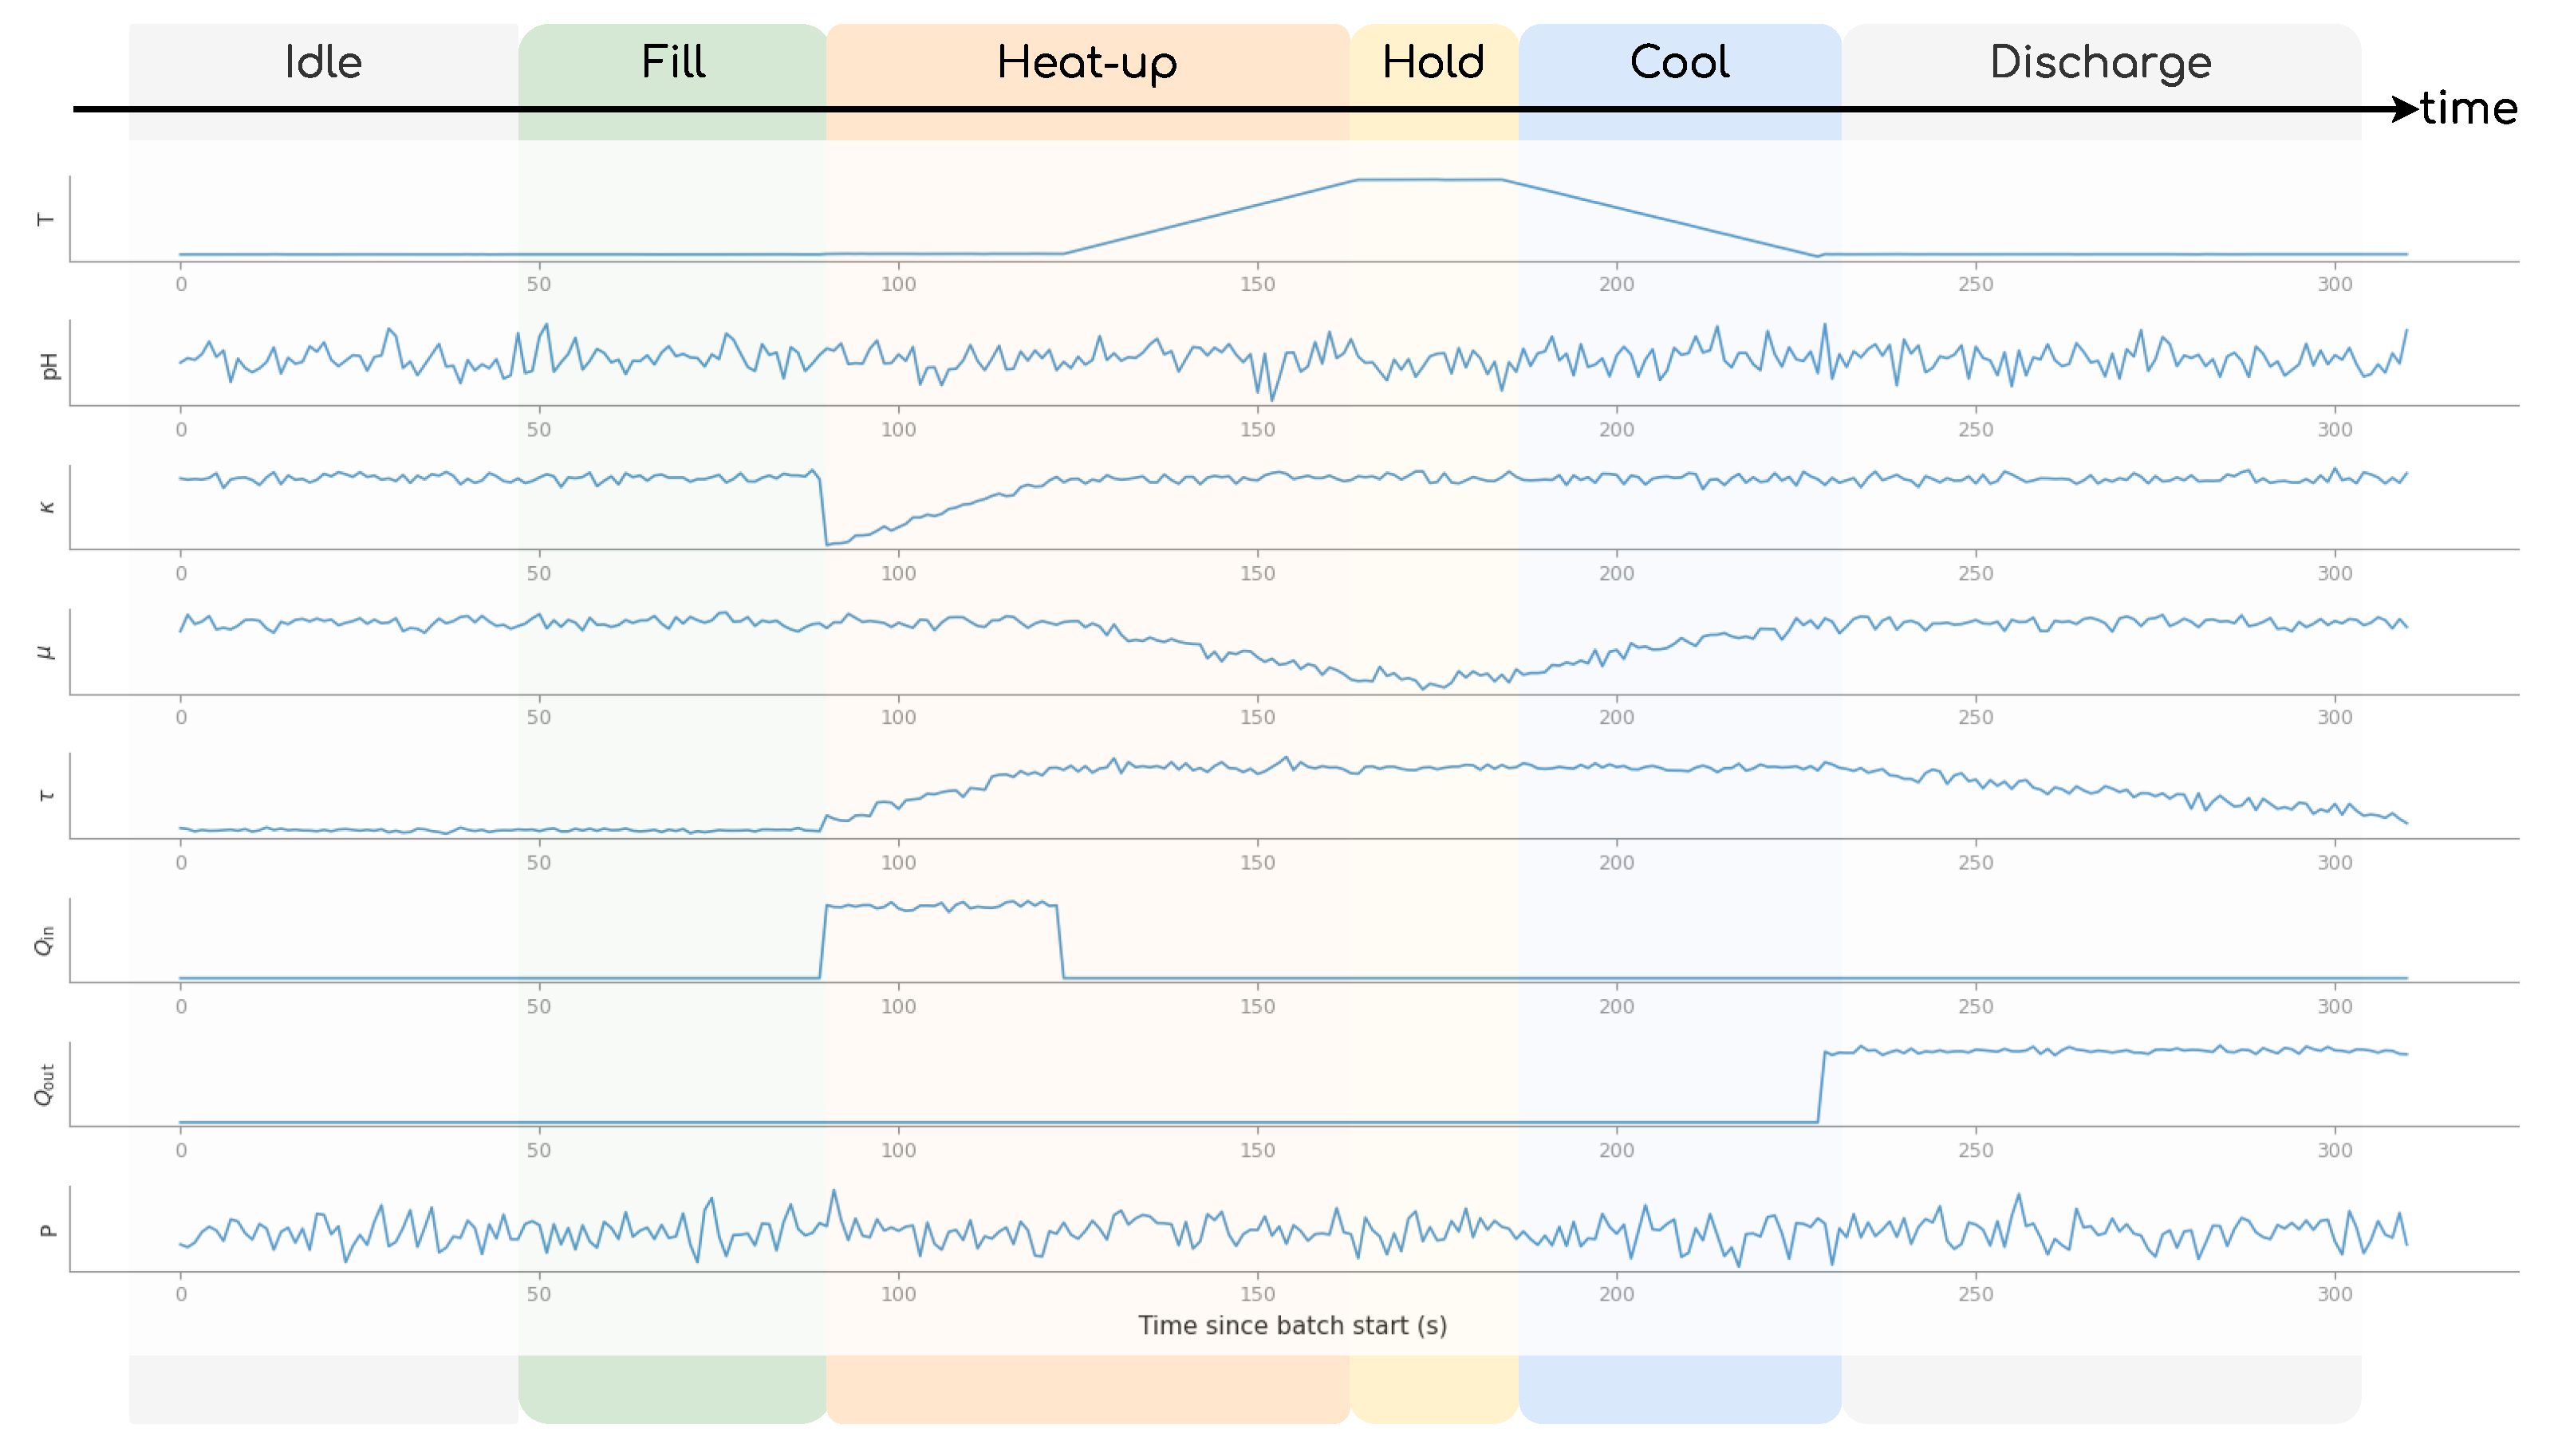
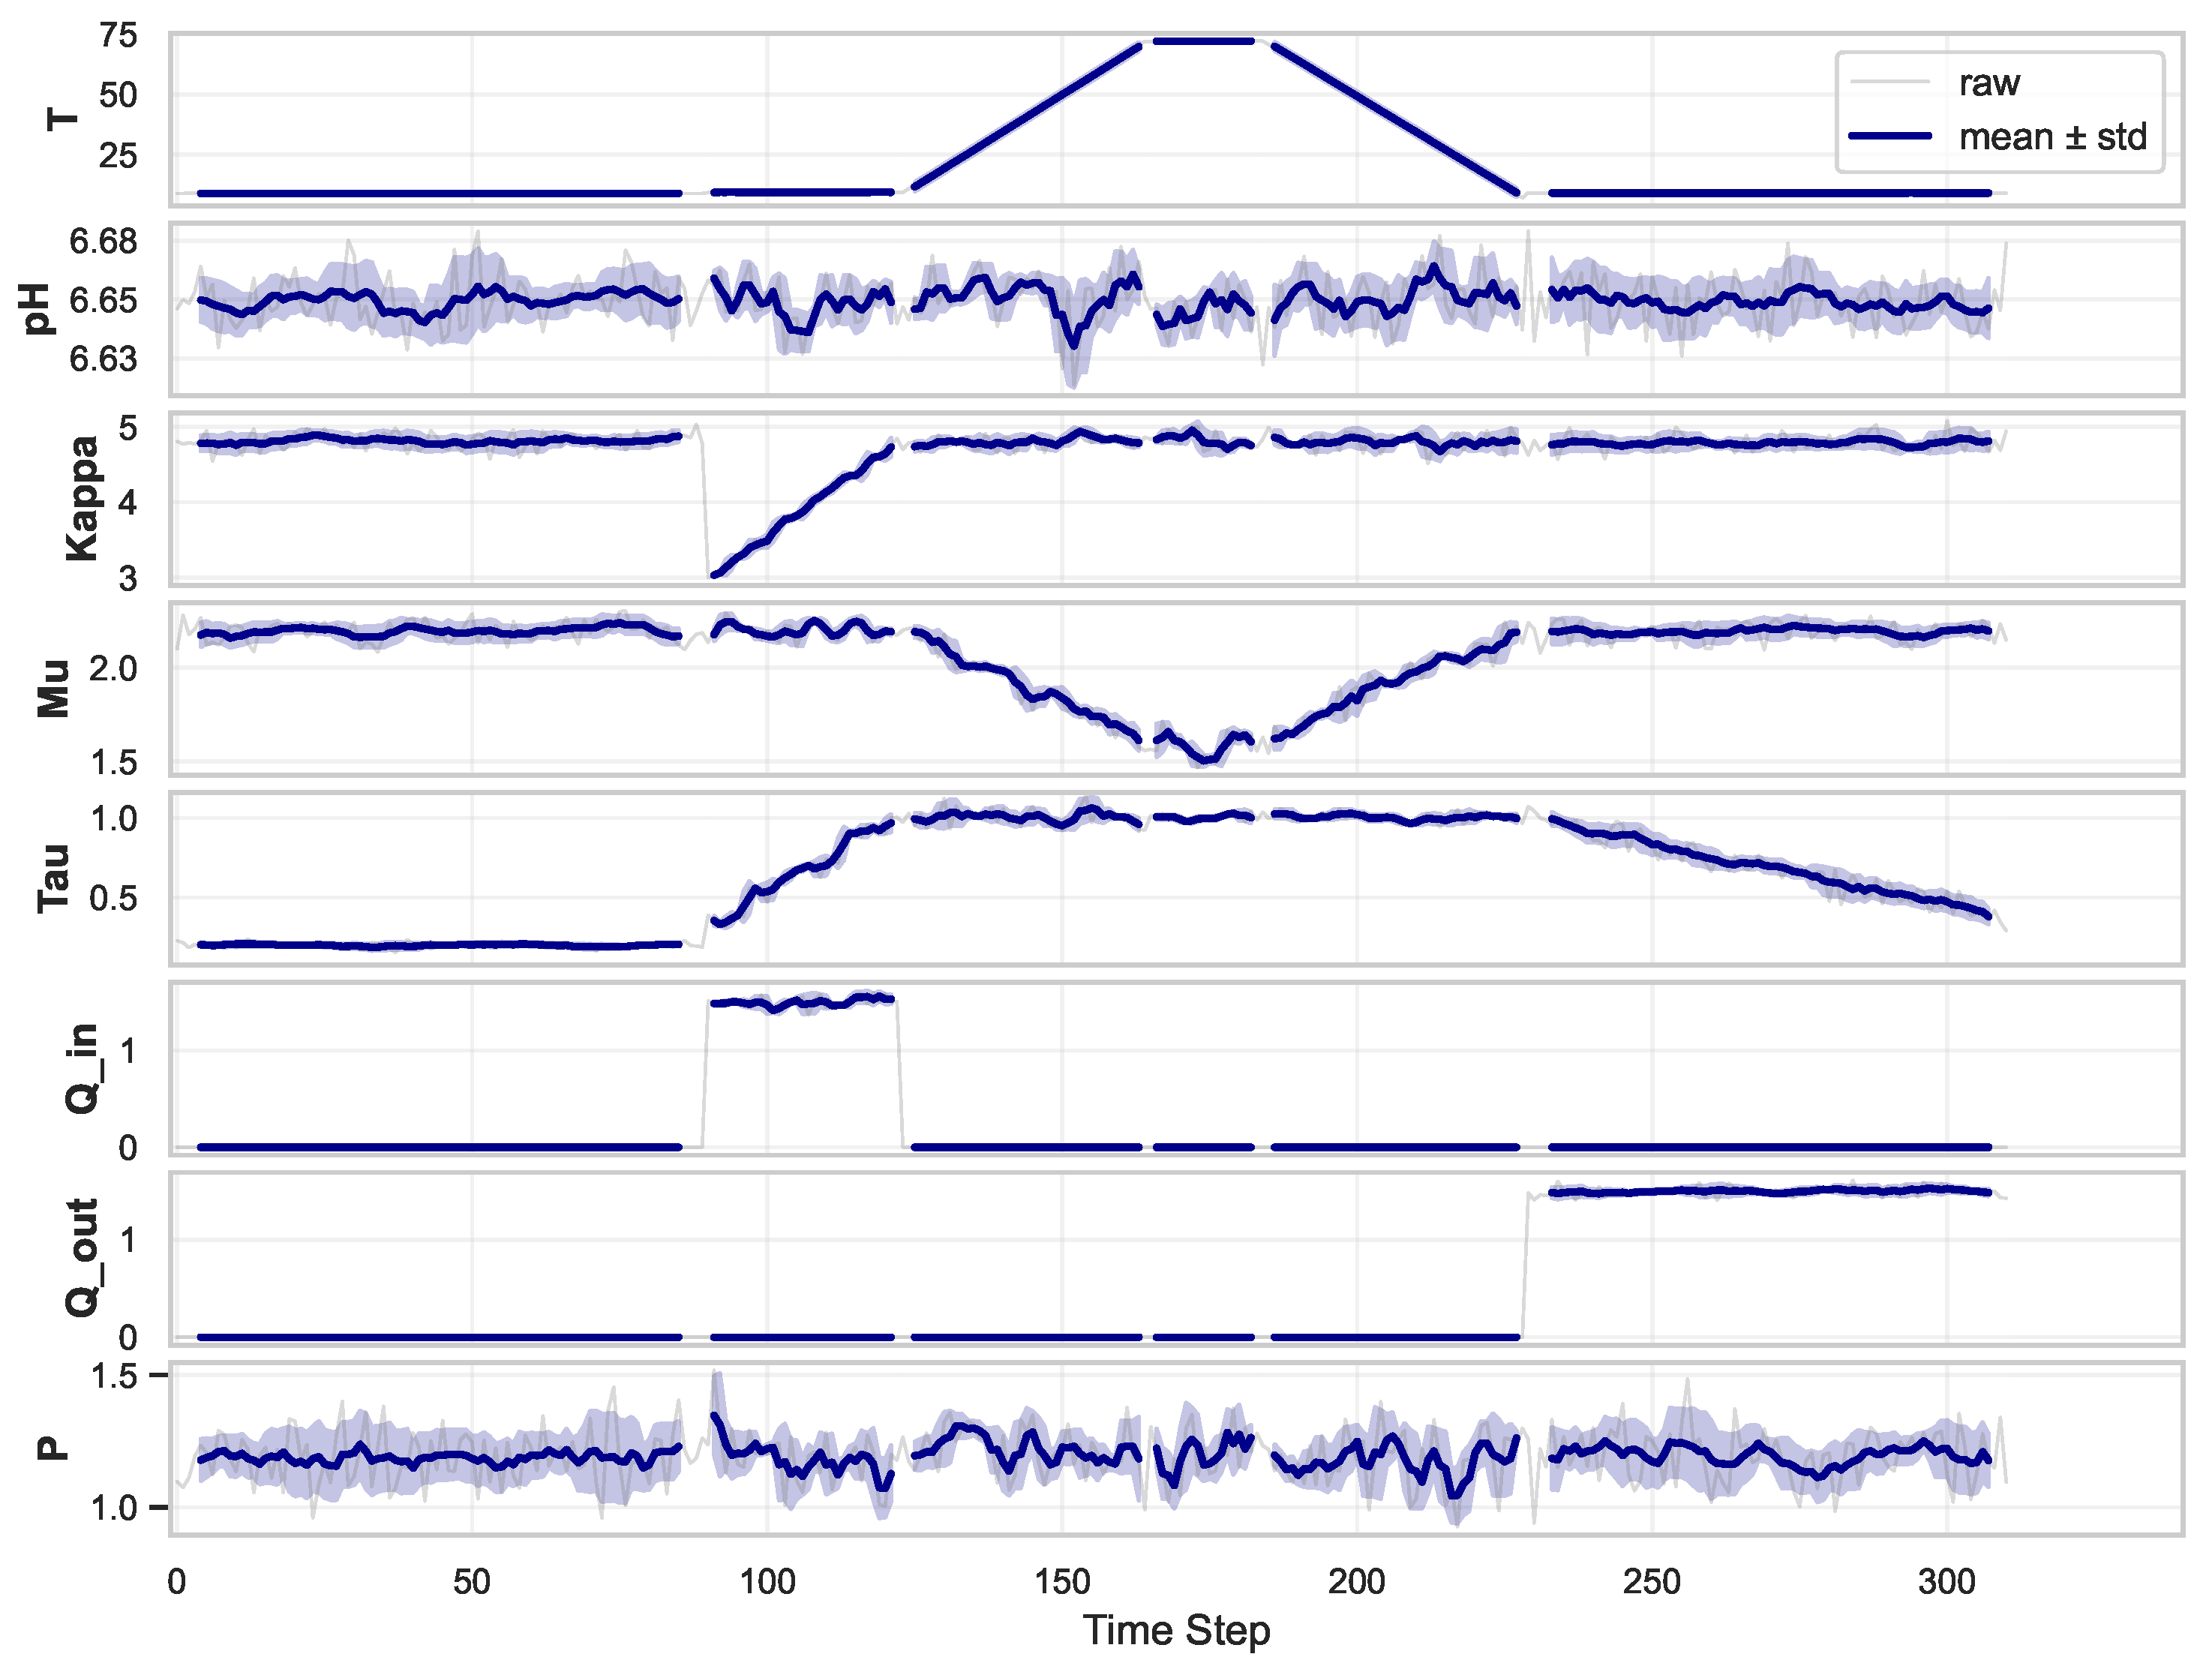
To evaluate the proposed approach, we constructed a synthetic dataset that replicates the batch-based operation of an HTST pasteurizer. The simulator models production cycles, consisting of stages such as Idle, Fill, Heat-up, Hold, Cool, and Discharge. Each stage is associated with specific operational signatures in terms of process variables, including temperature (°C), pH, electrical conductivity (mS/cm), flow rate (L/min), pressure (bar), and viscosity (Pa·s). An illustration of the time series of all sensors, together with the mean behaviour and the standard deviation, is shown in
Figure 3.
The dataset is generated at a temporal resolution of one second, yielding multivariate time series for each batch. A total of 1000 production batches were generated, resulting in approximately 90 h of operation, 324,514 rows, and 2,569,112 sensor readings across all variables. For unsupervised HMM, 60% of the batches were used to estimate the model parameters, while the remaining 40% were reserved for independent evaluation against ground truth labels. From this 40% evaluation subset, we further split 80/20 for predictive PPM.
5.2. From Sensors to Process Discovery (Goal 1 – RQ1)
To address the first research question, we applied an unsupervised HMM on the multivariate dataset, mapping hidden stages to the six operational stages. In the implemented unsupervised HMM, the parameters () are initialized randomly and learned entirely from the unlabeled sequence data via the Expectation-Maximization algorithm. The base input signals to HMM included temperature (T), electrical conductivity (), and the inflow/outflow rates (, ). In the next step, the normalized value of T and , and the logarithmic flow ratio , were introduced to capture nonlinear dependencies between thermal and hydraulic behaviour. From these, we extracted temporal derivatives ( and ) to capture heating and cooling dynamics, which are helpful to distinguish between the Heat-up, Hold, and Cool stages. In the next step, phase-specific indicators were constructed to emphasize stability near the critical threshold of the Hold stage, while binary indicators such as strong heating () and heating phase ( and ) explicitly encoded signatures of the Heat-up phase. Rolling-window statistics (short-term standard deviation of T) and positional features within each batch were also included to capture local variability and process progression.
The model achieved an overall accuracy of 97%, with macro-averaged precision, recall, and F1-score around 0.94–0.95, demonstrating the ability of the HMM to reliably segment continuous signals into discrete activities.
Table 3 reports the performance metrics obtained in the different stages of the test set.
The results show that the model reached a high overall accuracy of 97%. Idle, Fill, and Discharge were classified with very high agreement. Both Heat-up and Cool were classified with strong precision but slightly reduced recall, reflecting their partial overlap with Hold. The Hold stage itself was recalled with perfect sensitivity (recall = 1.0), but precision was lower, since some Heat-up and Cool intervals were conservatively assigned to Hold.
It is worth mentioning that Hold achieved perfect recall (1.0) but lower precision (0.66), as some Heat-up and Cool intervals were misclassified as Hold. Importantly, this conservative misclassification ensures that true Hold intervals were never missed, aligning with HACCP’s safety-critical requirement.
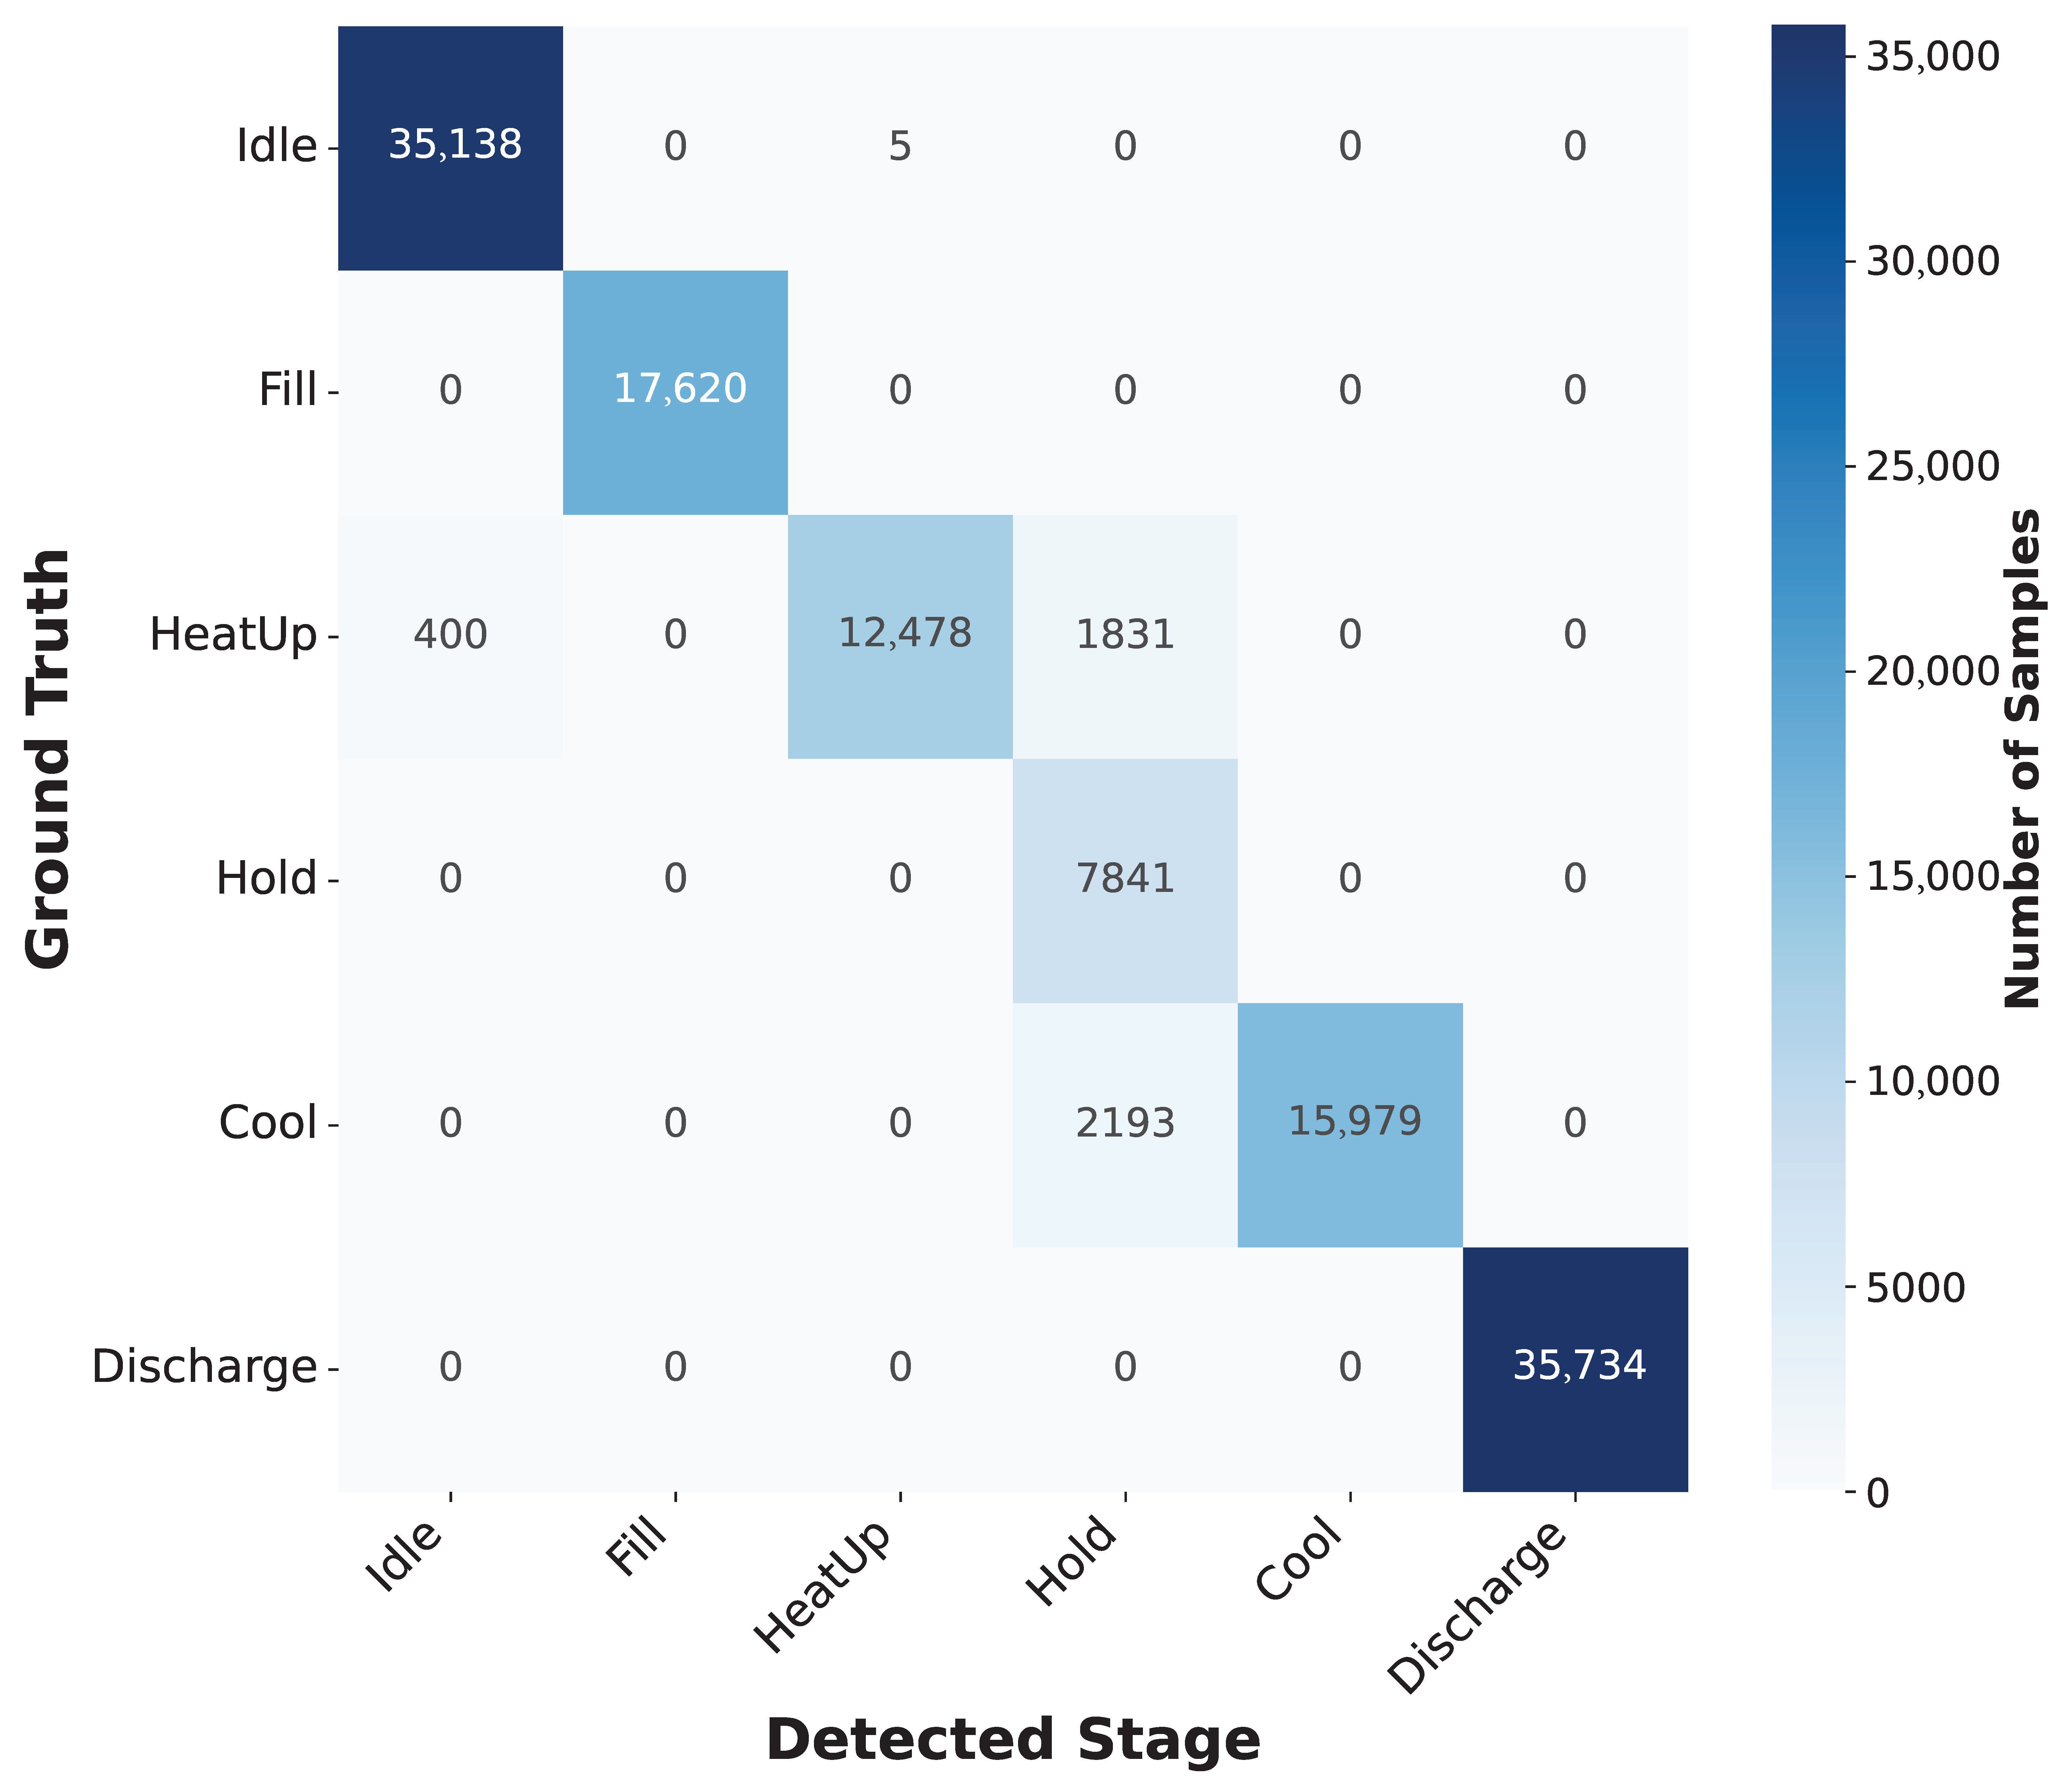
Figure 4 presents the confusion matrix, which makes these patterns explicit. Misclassifications are primarily concentrated around the transitions into and out of the Hold phase, where temperature plateaus at approximately 72 °C and viscosity stabilizes. In contrast, Idle, Fill, and Discharge show virtually no confusion, since their signatures in flow and turbidity are distinct and unambiguous.
Taken together, these results demonstrate that the HMM can reliably segment continuous multivariate sensor streams into discrete pasteurization activities, even in the absence of formally defined stage boundaries, thus positively answering RQ1.
Once the continuous space is segmented and the corresponding time intervals of change are identified, each interval can be associated with a specific activity, thereby enabling the construction of the sensor-based event log. In line with the standard definition of PM, we obtain the event log where each sensor is assigned a unique Case ID. The activities discovered through the HMM are recorded in the Activity column, and the corresponding time intervals are stored in the Timestamp column.
Table 4 presents an illustrative portion of the achieved event log.
A closer inspection of
Table 4 reveals two timestamp columns. This representation remains consistent with the standard event log definition in PM; the explicit distinction between start and end timestamps is necessary to support the application of PPM techniques, which require precise knowledge of activity durations. The column Activity represents the detected stage by HHM.
As previously outlined, the event log obtained from sensor data is used as input for process discovery to derive an interpretable process model. Among the available algorithms, we adopted the Directly-Follows Graph (DFG), a directed graph that represents sequential relationships between activities. In this representation, nodes correspond to activities, edges denote the directly-following relations observed in the log, and edge weights capture their frequency, thus highlighting the most common paths and exposing potential bottlenecks or inefficiencies.
Figure 5 shows the discovered DFG for the pasteurization process. The six rectangles represent the identified activities, which correspond to the six operational stages of the process. The start and end points follow standard DFG notation: a single circle with a central dot for the start, and two concentric circles enclosing a rectangle for the end. Weighted edges illustrate the execution frequencies of activity transitions.
In this case, transition frequencies are largely uniform (except for a single edge), indicating that the workflow is stable and balanced, without evident bottlenecks. Most cases follow the expected path, beginning with Idle and ending with Discharge. However, five cases deviate, starting with Heat-up, followed by Idle and Fill, before returning to Heat-up and continuing along the same trajectory as the majority. This behaviour suggests that the sensor captured a temperature pattern distinct from the standard Idle stage, pointing to a possible anomaly or variation in the initial process conditions.
5.3. Monitoring Pasteurization Using the Discovered Model
Conventional threshold-based monitoring methods rely on predefined static limits to enforce compliance with CCPs. Our proposal is that process mining leverages multivariate sensor data and event logs to capture the temporal dependencies between activities, track compliance across the entire workflow, and support predictive foresight. To demonstrate this added value, we applied PPM using SkPM (
Section 4.5) to event logs derived from the HMM-based activity segmentation. In the predictive component, a Random Forest Regressor (RF) was employed to train a separate model for each of the following tasks: (i) estimating the remaining time of a batch, (ii) estimating the remaining duration of the current activity, and (iii) predicting the timestamp of the next activity transition. All models were trained using the default hyperparameters provided by the scikit-learn implementation.
5.3.1. Remaining Time of the Batch
It was estimated that the remaining duration of an entire pasteurization batch given a partially executed trace. The RF model achieved an score of 0.94 for this task, with a Mean Absolute Error (MAE) of 15.49 s and a Root Mean Square Error (RMSE) of 19.58 s. Considering that batch durations are typically on the order of several minutes, this level of accuracy is sufficient to anticipate completion times and adjust downstream operations such as storage preparation or packaging.
To further analyse prediction quality, we evaluated the remaining batch time predictions conditioned on current activity (
Table 5).
Results show that the model achieved consistent accuracy across all stages, with MAE between 6.24 s and 18.94 s, corresponding to relative mean errors below 12%. These results confirm that the predicted average remaining times were always close to the actual values.
5.3.2. Remaining Time of the Current Activity
The second task focuses on predicting the residual time of the ongoing activity. This is particularly critical for the Hold stage to ensure microbial safety. The model achieved an
score of 0.96, with an MAE of only 3.76 s and an RMSE of 5.45 s. The results of predicting the remaining time of the current activity for different activities are presented in
Table 6.
Based on the results, the RF model achieved high accuracy across all stages, with MAE values ranging from 0.43 s (Idle) to 5.94 s (Discharge). Relative mean errors remain below 10% for all activities except Heat-up and Cool, where the rapid temperature dynamics increase variability. These results demonstrate that predictive monitoring can reliably anticipate the completion time of each activity with sub-second to a few-second precision, enabling proactive assurance that critical stages such as Hold satisfy HACCP time requirements.
5.3.3. Next Activity Transition Timestamp
The final task involved predicting the exact remaining time at which the process transitions from the current stage to the next. The model achieved highly accurate results, with an
score of 0.99, an MAE of 0.41 s, and an RMSE of 0.96 s. This performance enables operators to anticipate critical transitions (e.g., from Heat-up to Hold or from Cool to Discharge) almost in real time. The results for predicting the timestamp of the next activity transition are shown in
Table 7.
Based on the results, the model achieved near-real-time accuracy across all transitions, with MAE values ranging from 0.20 s for the Idle to Fill transition to 1.92 s for the Heat-up to Hold transition, enabling operators to synchronize downstream tasks almost perfectly with actual process execution.
The summary of the results is shown in
Table 8. Taken together, they show that PM not only enforces CCPs but also integrates predictive capabilities that conventional threshold monitoring cannot provide.
5.3.4. Explaining Monitoring Prediction
As the last step, to provide transparency and explainability, and allow the process experts to validate whether the model is based on predictions on semantically meaningful process variables, we applied Decision Predicate Graph (DPG) analysis on the RF modelsn. DPG is a graph-based representation that summarizes the logical decision boundaries extracted from ensemble models [
32].
Table 9 presents the key results of the DPG analysis.
Based on the results, by converting sensor data into a process and implementing PPM, three important interpretations can be achieved (important information, most used features, and decision boundaries). The important information reveals which attributes are first used by the model to guide predictions. The DPG analysis report revealed that the most influential nodes in prediction included the activity_sequence, minute, and event_count features. The most used features section further confirms that the model relied primarily on cumulative process time and execution length to provide a prediction. Finally, the extracted decision boundaries provide concrete thresholds used by the model. For instance, the model often splits on duration_seconds values between 35–120 s and on event_count values in a similar range, reflecting the temporal structure of pasteurization batches. Likewise, stage-specific thresholds such as activity_HeatUp ≤ 0.25 or activity_Hold ≤ 0.14 report the decision threshold frequently used by RF as cut-off points (not rule confidence) and capture the transition signatures between heating, holding, and cooling.
5.4. Predictive Monitoring for Safety, Compliance, and Efficiency (Goal 3 – RQ3)
In our context, two key predictive tasks were implemented: next activity prediction and remaining time estimation. These tasks allow the system to forecast not only the forthcoming operational stage but also the time until its occurrence or completion.
From a safety standpoint, the ability to predict the remaining duration of the Hold stage helps ensure that the legal time–temperature limit for the thermal CCP will be met, enabling pre-deviation interventions when a shortfall is forecast. This contributes to the proactive enforcement of CCPs, reducing the risk of under-processing and contamination.
From a compliance perspective, PPM acts as a complement to conformance checking by identifying potential violations before they manifest. Anticipating abnormal deviations—such as an unexpectedly short Hold duration or skipped transitions—enables early interventions, thereby supporting traceability and regulatory accountability.
From an efficiency viewpoint, accurate estimates of the time to next activity transitions (e.g., from Cool to Discharge) allow for optimized scheduling of downstream operations such as cleaning, packaging, or storage allocation. This reduces idle time, mitigates bottlenecks, and supports better resource planning. These capabilities reinforce food safety, regulatory conformance, and operational performance, thereby addressing RQ3 and demonstrating the added value of our approach.
Building on the foundational elements discussed in
Section 3.1—namely the legal time–temperature requirements, FDV operation, and the maintenance of a positive pressure differential (
)—we demonstrate how PPM can be effectively operationalized within a HACCP framework to support real-time decision-making and regulatory compliance.
5.4.1. Critical Control Point (CCP) Guardrails
When the predicted residual duration of the Hold phase—maintained at or above the validated temperature setpoint—approaches the legally mandated minimum (e.g., 15 s at 72 °C), the system proactively issues an early warning. This pre-deviation alert allows operators to take timely corrective measures, such as diverting or recirculating the product flow, or adjusting the heating profile to reestablish compliance. Conversely, if forecasts indicate unnecessary overprocessing, the system can issue symmetric notifications to optimize energy efficiency and preserve product quality.
5.4.2. Diversion Assistance and Delta P Integrity
Predictive models also assess the likelihood of sanitary barrier failures by analysing FDV behaviour and pressure differential () dynamics. A declining or negative signal, for instance, may indicate a potential cross-contamination risk between pasteurized and raw milk streams. In such cases, the system can preemptively initiate product recirculation and delay discharge to prevent non-compliant product from entering downstream processing or distribution.
5.4.3. Traceability and Auditability (HACCP Principles 4–7)
All predictive inferences, alarms, operator responses, and automated interventions are recorded in structured event logs, which are securely time-stamped and tamper-evident. This logging infrastructure supports multiple HACCP principles: monitoring (Principle 4), corrective action (Principle 5), verification (Principle 6), and record-keeping (Principle 7). Moreover, by linking predictive analytics with conformance checking, the system enhances the traceability and auditability of process executions, facilitating both internal reviews and external inspections.
5.4.4. Limitations
While the proposed framework demonstrates the feasibility and advantages of applying PM to multivariate sensor data in pasteurization, certain limitations must be acknowledged. First, the approach assumes that sensor data are well-calibrated and consistent across batches. In real-world industrial environments, however, sensor drift, noise, and calibration errors can introduce variability that may impact the accuracy of activity recognition and predictive models. Mitigating these effects would require periodic recalibration procedures, signal-preprocessing techniques, or the incorporation of sensor confidence measures.
Second, the generalizability of the framework to other processes or installations depends on the availability and comparability of sensor configurations and process semantics. Although the simulation reflects realistic HTST dynamics based on literature and HACCP requirements, transferability to other equipment, product types, or regulatory regimes may require retraining of models and adaptation of activity definitions. Extending the framework to work across heterogeneous settings—possibly through domain adaptation or transfer learning—remains a promising direction for future work.
Finally, while synthetic data allow for controlled experimentation and reproducibility, they may not fully capture the complexity, noise characteristics, or unexpected behavior present in real industrial environments, which could affect the performance of the proposed methods when deployed in practice.


