Article

An Analysis of Blockchain Adoption Strategies in a Technology-Supported Supply Chain Considering Government Subsidy

by
Xujin Pu
,
Yukun Jiang
and
Wen Zhang
*
School of Business, Jiangnan University, Wuxi 214126, China
*
Author to whom correspondence should be addressed.
Systems 2025, 13(11), 931; https://doi.org/10.3390/systems13110931
Submission received: 21 September 2025 / Revised: 16 October 2025 / Accepted: 21 October 2025 / Published: 22 October 2025

Abstract

This study explores the impact of government subsidy on blockchain traceability leadership (manufacturer vs. retailer) in a technology-supported supply chain including a manufacturer, a retailer, and a technical service firm. Methodology: We built Stackelberg game models for different scenarios (non-blockchain, manufacturer/retailer-led blockchain, and subsidized blockchain) to derive equilibria. Results: First, blockchain adoption is not always optimal unless consumers exhibit low acceptance of non-blockchain products and construction costs are low. Second, a party (manufacturer/retailer) tends to lead blockchain construction if the technical service firm shares more of its costs than the other party. Finally, government subsidies benefit the manufacturer and the retailer, but the technical service firm does not always benefit from subsidies. With suitable rates and lower costs, the manufacturer or the retailer prefers to lead the construction, potentially creating a win–win scenario in the supply chain. Novelty: We quantified leadership-switching conditions via the technical service firm’s cost sharing and took its decision-making licensing fees into account, addressing gaps in multi-stakeholder blockchain adoption research.

1. Introduction

In recent years, there have been global public concerns about the safety, quality, and authenticity of products including fresh foods, pharmaceuticals, and luxury goods. Originating from investigation and research, the lack of reliable and trustworthy product information undermines consumers’ trust in products and reduces their willingness to purchase [1]. Responsively, many manufacturers have adopted different traditional technologies such as barcodes, RFID (radio frequency identification) tags, QR (quick response) codes, etc., to provide consumers with product information. However, these technologies rely solely on a single database for information storage; unfortunately, the information therein can be readily tampered with [2]. Thus, these traditional technologies do not meet consumers’ needs for reliable product information traceability, nor do they resolve the dilemma of the trust crisis concerning manufacturers’ products.
With the rapid development and maturity of information technology, the blockchain has been widely used in the field of traceability and has provided opportunities to solve the above-mentioned problems. Originating from Bitcoin, the blockchain is a ledger of accounts and transactions written and stored by all participants. It offers two core advantages over other traditional technologies, namely decentralization and data tamper resistance, which ensure that data recorded on the blockchain remain reliable, addressing issues of distrust [3]. The blockchain-based product traceability system provides more product information, alleviating consumers’ concerns about the product source and thus enabling consumers to obtain more utility.
The blockchain-technology-supported supply chain involves a manufacturer, a retailer, and a technical service firm. The manufacturer produces products and sells to consumers through the retailer. The operational process of this supply chain commences with the manufacturer or retailer collaborating with a technical service firm to jointly develop a blockchain-based technology system for tracing product information. This approach is often adopted because the technical service firm specializes in technology development and system construction. On the one hand, the technical service firm needs to jointly bear the system construction cost with the leading enterprises, namely the manufacturer or retailer. The former is responsible for the early-stage technological research and development as well as the purchase of hardware, while the latter undertakes the expenses for Internet of Things (IoT) data collection devices. The level of traceability depends on the quality of data. Collection devices with higher precision can improve the accuracy and real-time performance of data, thereby enhancing consumer utility [4,5]. However, the use of such high-precision collection devices also increases the cost of system construction [6]. On the other hand, the technical service firm achieves profitability by charging fees to the manufacturer that accesses the blockchain network no matter who leads the construction of system. In practice, many manufacturers have joined in blockchain construction, such as Louis Vuitton and Christian Dior. They have cooperated with the technical service firm, that is, Microsoft, to develop a blockchain system called Aura. Aura allows consumers to verify whether luxury products are counterfeit and charge these manufacturers to obtain profits. In this supply chain, either the manufacturer or the retailer may become the leader in blockchain construction, and we herein introduce these two situations.
Retailer-led blockchain: Some leading retailers have spearheaded the implementation of a blockchain-based traceability system to enhance consumer trust in products [7,8]. These initiatives have effectively attracted the participation of numerous manufacturers. For example, the Food Trust project was jointly developed by Walmart and IBM [9]. The project licenses its blockchain technology to manufacturers like Dole and Nestlé, offering various traceability modules, including raw material procurement and logistics. Manufacturers that use these different traceability modules at certain levels are required to pay licensing fees to IBM. Under such circumstances, retailers determine the product traceability level based on the system construction costs they bear. For retailers, setting a higher traceability level not only entails bearing more costs but also requires setting a higher retail price due to the increased wholesale price (resulting from higher technical fees), which may reduce consumer demand. Therefore, retailers need to make reasonable decisions on the traceability level.
Manufacturer-led blockchain: Some manufacturers opt to collaborate with technical service firms to construct their own traceability systems. For example, Nestlé has recently disengaged from the Food Trust’s blockchain traceability system and cooperated with OpenSC, a third-party technical service firm [10]. Nestlé anticipates that this system will enable it to disclose more comprehensive information about its supply chain to the market, thereby enhancing transparency for consumers. Moreover, the organic manufacturer Oatman Farms uses the technical support provided by Vechain to carry out blockchain traceability for organic products. Unlike retailers, manufacturers not only face the construction costs of the blockchain system but also have to pay the technical service firm for the unit licensing fee according to the level of product traceability. Therefore, when manufacturers take the lead in the construction of the blockchain, they have to consider the costs they will incur.
The government promotes the application of blockchain technology in actual production and operation processes by providing subsidies [11,12]. For example, the European Union invests in blockchain through Horizon program. This program would subsidize about EUR 1–2 billion in blockchain until 2027 [13]. Moreover, the UK government has committed a six-figure grant via Innovate UK to finance blockchain-related enterprises [14]. In China, the 14th Five-Year Plan and Vision 2035 designates blockchain as one of the seven pivotal industries within the digital economy framework [15]. Additionally, several Chinese cities, such as Shanghai, Fuzhou, and Nanjing, have rolled out innovation subsidy policies for blockchain applications [16]. For instance, the Fuzhou government actively encourages and supports companies in undertaking blockchain applications and offers a 20% subsidy for construction funds. Through these government subsidies, the costs associated with blockchain-based traceability systems for enterprises have been significantly mitigated [17]. When the subsidy rate is high and the blockchain construction cost lower, they would prefer to lead the blockchain because the cost of building the system is relatively low.
Evidently, in order to guarantee product safety, quality, and authenticity, governments have attached significant importance to the adoption of blockchain technology in product information traceability. The product traceability level will affect the blockchain licensing fee as well as the product price (wholesale price and retail price). When the manufacturer has the dominant power over the level of traceability, it can control the unit blockchain licensing fee. When the retailer has the dominant power, it can influence the wholesale price of the product and thus control the retail price of the product. The dominant one needs to jointly bear the cost of building the blockchain with the technical service firm. When any entity intends to become the leader, it has to consider the construction cost that needs to be paid, and this is also the case even when there are government subsidies. Therefore, it is deemed crucial to explore the differences between retailer-led and manufacturer-led blockchain constructions as well as the impacts brought by the government subsidy. This study endeavors to address the following three research questions:
(1)
What factors determine whether the manufacturer and retailer should adopt blockchain?
(2)
When the blockchain is adopted, how do the prices and profits change, and who should lead the blockchain construction?
(3)
When the government utilizes the technology subsidy, what are the corresponding impacts on the manufacturer, retailer, and technical service firm?
To answer the above questions, this study considers a technology-supported supply chain comprising a manufacturer, a retailer, and a technical service firm. The blockchain system leader (either the manufacturer or retailer) determines the product traceability level and shares the construction cost, the blockchain company sets the unit licensing fee, the manufacturer decides the wholesale price, and the retailer sets the selling price. We herein delineate three supply chain scenarios: (a) Scenario N: without blockchain adoption; (b) Scenario MB: the manufacturer is the leader; and (c) Scenario RB: the retailer is the leader. Moreover, this study incorporates the effect of government subsidy and considers (d) Scenario MBS: government subsidizes the manufacturer and (e) Scenario RBS: government subsidizes the retailer to analyze how the preferences of various supply chain members for blockchain system leadership shift before and after subsidy implementation. This supply chain structure aligns with industry practices; for instance, Nestlé collaborates with OpenSC and Walmart with IBM to build blockchain systems, with only a single manufacturer in each collaboration. Moreover, this structure is very common in the literature on blockchain research [18,19,20]. It is herein adopted to focus on the impacts of factors such as the proportion of costs borne by BTC and government subsidies on the manufacturer/retailer leading blockchain construction. Additionally, the decision sequence of the entire supply chain is consistent with that of the Stackelberg game, as the leader makes decisions first, followed by the follower. Therefore, we constructed such a supply chain structure and solved it using the Stackelberg game model.
Our main findings can be summarized as follows. First, the decision to adopt blockchain technology by manufacturers and retailers is not inherently optimal; it hinges on two factors: consumers’ acceptance of non-blockchain products and the construction costs. The entity taking the lead in blockchain adoption—either the manufacturer or retailer—is determined by the proportion of blockchain costs when collaborating with the technical service firm. Second, government subsidies for blockchain implementation consistently yield positive outcomes for both the manufacturer and retailer. Under scenarios with an appropriate subsidy rate and reduced blockchain costs, each party may prefer to spearhead the adoption. Notably, under specific circumstances, there may be a win–win situation in the supply chain.
This research contributes to the novel field of blockchain in supply chain management from the following perspectives. First, we compare the profits when the manufacturer or the retailer acts as the leader in blockchain construction and analyze the impact of the cost-sharing ratio of the blockchain technology firm on the dominance of the leader. Second, different from the existing literature—where blockchain adoption costs are treated merely as exogenous variables—this study sets the unit licensing fee (determined by the blockchain technology firm) based on the traceability level specified by the leader. Third, while previous studies mostly focus on the impact of government subsidies on the manufacturer, we explore the changes in the preferences of different supply chain members for the leadership of the blockchain system before and after government subsidies.
The remainder of this paper is structured as follows. We review the relevant literature in Section 2. In Section 3 and Section 4, we focus on model development, and we derive and discuss optimal solutions using game-theoretic methods in Section 5 and Section 6. Finally, we summarize the research results regarding blockchain adoption, pricing, profit changes, and the impact of government subsidies in Section 7.

2. Literature Review

We mainly review two streams of literature: one is the application of blockchain in supply chain, and the other is government subsidy policy.

2.1. The Blockchain Adoption in the Supply Chain

Owing to blockchain’s immutability, reliability, and other attributes, it has been applied in fields like counterfeit combat, information asymmetry elimination, and product traceability—with its impact on consumer behavior and market issues gaining academic focus. For example, Lu et al. [21] noted consumers have heterogeneous willingness-to-pay due to differing perceived product value, which may be shaped by factors like brand reputation and applied technologies (e.g., blockchain). In blockchain’s key application of counterfeit combat, Pun et al. [18] divided counterfeits into two types, namely non-deceptive and deceptive ones, and explored using blockchain to tackle deceptive counterfeiting, a major issue causing post-purchase regret. Some scholars [22,23] focused on the application in eliminating information asymmetry. Zhang et al. [24] explored the optimal strategy for high-quality manufacturers using price signaling and blockchain technology (BCT) to resolve information asymmetry. Franke et al. [25] investigated the potential and limits of privacy-preserving corporate blockchain applications for information provision. From the perspective of traceability via blockchain, Fan et al. [26] considered consumers’ traceability awareness and explored the conditions for the supply chain to adopt blockchain technology as well as the coordination issues after its adoption. Yang et al. [27] studied the impact of the traceability brought about by blockchain technology on a producer’s decision of whether to outsource the delivery to a third-party logistics company. Tan et al. [28] studied the potential risk of information falsification in the blockchain-based traceability system for agricultural products by using an evolutionary game model.
Additionally, many scholars have paid attention to the investor in the blockchain system. Several previous studies have considered the manufacturer as the blockchain investor. For example, when the quality of counterfeit products or the degree of consumers’ distrust is at a moderate level, it is appropriate to adopt blockchain technology. Naoum-Sawaya et al. [29] explored the strategic significance of blockchain technology in curbing counterfeiters; manufacturers need to strike a balance between product quality and investment in blockchain technology to combat counterfeiting. Iyengar et al. [30] considered a supply chain consisting of a single risk-averse manufacturer, suppliers, and consumers and explored the two major driving factors of manufacturer risk aversion and consumer information asymmetry for the manufacturer to adopt blockchain technology. Some scholars may focus on the impact of the retailer investing in blockchain on supply chain members. Shen et al. [19] found that numerous brand enterprises sell genuine products through retailers utilizing permissioned blockchain technology. They only separately analyzed scenarios where blockchains are built under manufacturer or retailer leadership, with the comparison between the two remaining unclear. Fang et al. [20] explored whether manufacturers or retailers should invest in blockchain technology, focusing on the interaction between retailers’ pricing model choices and supply chain members’ blockchain investor choices. Similar to them, we also investigate who should lead blockchain development; by contrast, we focus on how the technology service firms’ blockchain adoption cost-sharing ratio between the two (manufacturer/retailer) impacts blockchain implementation leadership.

2.2. Government Subsidy Policy

As a lever to regulate or guide the market, government subsidy is often applied to achieve better supply chain performance and social welfare. Government subsidies are usually used in production [31,32]. For example, Fan et al. [33] proposed four types of agricultural subsidies: planting, harvesting, combined, and selective; they found that harvesting subsidies lead to the most efficient resource usage and highest social welfare. Some scholars [34,35] explored the role of government subsidies in green development, such as encouraging firm’s environmental and technological innovation, increasing implementation of green products [36], and enhancing green level [37]. Zolfagharinia et al. [38] studied the impact of government subsidies on the choice between mass marketing and market segmentation for green products. Jin et al. [39] investigated how government support affects the manufacturing output and green investment initiatives of a firm that has financing needs.
Government subsidies are also used to promote and develop emerging technologies. In the emission-reducing field, Bai et al. [40] explored the design of trade-in subsidy programs, specifically optimal budget allocation among multiple products and effective utilization of the budget to incentivize trade-ins. In the electric vehicle field, some scholars [41,42] have explored the impact of government subsidies on the pricing of new energy vehicle manufacturers. As for blockchain technology, Rimba et al. [43] demonstrated the inherent high cost of blockchain’s cost structure through empirical data comparison. Due to high costs, the use of government subsidies is relatively common, and some scholars have also focused on blockchain adoption under subsidies. Pun et al. [18] considered that the government acts as a decision maker to subsidize the unit cost incurred by manufacturers for blockchain adoption. Zhong et al. [44] considered that the government subsidizes manufacturers through two approaches—quantity subsidy and innovation subsidy. Zhang et al. [45] noted that governments mainly use two subsidy modes—one-off subsidy and output subsidy—to support manufacturers and lower their blockchain adoption costs. All these studies only focus on the scenarios where the government subsidizes manufacturers. However, Xu and Duan [46] considered three subsidy scenarios, where the government provides subsidies to manufacturers, retailers, and consumers, respectively. They found that when the government subsidizes manufacturers or consumers, manufacturers are always willing to adopt blockchain. However, when the government subsidizes retailers, whether manufacturers adopt blockchain depends on the degree of uncertainty in consumers’ valuations. They only consider the unit licensing fee of blockchain as an exogenous variable, whereas we treat the unit licensing fee as an endogenous variable determined by the technology firm.
Thus, the contributions of our study lie in two aspects: first, we consider and compare scenarios where the government subsidizes the manufacturer or retailer; second, unlike previous studies where blockchain technology firms do not participate in decision making, we treat technology firms as decision-making entities that determine the unit usage fee of blockchains.

3. Model

Consider a supply chain consisting of a manufacturer (denoted by M ) and a retailer (denoted by R ) and a third-party blockchain technical service firm called BTC (denoted by B ). Such a supply chain structure is very common in the literature on blockchain research [18,20]. This single-manufacturer structure is also adopted to focus on the impacts of factors such as the proportion of costs borne by BTC and government subsidies on the manufacturer/retailer leading blockchain construction. The manufacturer sells products through the retailer. The former sets the unit wholesale price w i , and then, the latter sets the unit selling price p i . As this study does not focus on production costs, we assume that the production cost is zero. This assumption is also commonly used in the mainstream model-building literature [2,18,46]. However, later, we consider the scenario where unit production cost c is non-zero and use numerical simulations to demonstrate the robustness of the results.
We consider that consumers are heterogeneous in product valuation, denoted as v , which follows a uniform distribution on [ 0 ,   1 ] [47]. Without blockchain traceability, consumers lack access to authentic product information (e.g., origin, quality, etc.), which in turn reduces their perceived value of the product. Hence, coefficient θ is introduced to capture discounted acceptance [6,18]. The linear form aligns with the mainstream supply chain literature [19] for simplifying demand derivation while capturing the core trade-off between perceived value, acceptance, and price. Blockchain’s decentralization and tamper resistance eliminate product authenticity doubts, so θ will change to 1. Higher-traceability level l discloses more information (e.g., raw material sources, logistics, etc.), which enhances consumer utility. The linear term α l (where α > 0 is utility sensitivity to traceability) is justified by two aspects: (1) empirical studies have shown a positive linear relationship between traceability information quantity and consumer willingness to pay [5]; (2) it maintains model tractability for deriving equilibrium decisions while capturing the core value of blockchain traceability.
The manufacturer can cooperate with the technical service firm to construct the blockchain trace system and take a leading position in this system, which means he needs to determine the level of product traceability l . In particular, the product traceability level can also influence consumer utility, as the adoption of blockchain technology can disclose more information to enhance the probability of product purchase. Generally, the higher the product traceability level, the greater the utility obtained. We assume the cost of constructing blockchain system is 1 2 k l 2 , where k is the cost coefficient for blockchain construction. The quadratic cost function is commonly employed in the literature [20,45,47,48]. Yenipazarli [47] pointed out that the quadratic cost function is attributed to diminishing returns from blockchain technology investment or diseconomies of scale for innovation. This function indicates that blockchain development costs increase non-linearly with improved traceability levels, consistent with the law of diminishing returns to investment. However, a linear function cannot characterize these properties. Similar to the above studies, we also chose the quadratic function form to depict the cost function. The system authentically records the unique product information, which can be provided to consumers during product purchase and eliminates their doubts regarding product authenticity. Here, we assume that the BTC bears a portion γ 1 of the construction cost.
Additionally, the manufacturer may adopt the blockchain service provided by the retailer, which is constructed through collaboration between the retailer and the BTC. In this partnership, the retailer plays a leading role in determining the product traceability level, with the BTC bearing a proportion γ 2 of the construction cost. Regardless of who constructs the blockchain, the manufacturer needs to pay a unit licensing fee, denoted as b , to the technical service firm. The amount of this fee is determined by the technical service firm.
The summary of parameters and notions mentioned in this paper is presented in the following Table 1. We assume i { N , M B , R B } , which represents the scenarios of no blockchain use, manufacturer-led blockchain, and retailer-led blockchain, respectively.
The sequence of events is as follows. (a) Retailer-led blockchain: The retailer decides the product traceability level, and then, the BTC determines the unit licensing fee in stage 2. In stage 3, the manufacturer determines the unit wholesale price, and the retailer sets the unit selling price in stage 4. (b) Manufacturer-led blockchain: The manufacturer decides the product traceability level, and the remaining stages are the same as those above. When blockchain is not adopted, the manufacturer sets the wholesale price in stage 1, and then, the retailer sets the retail price in stage 2.
We delineate three supply chain scenarios: non-blockchain (N), manufacturer-led blockchain (MB), and retailer-led blockchain (RB). These scenarios, respectively, represent the non-adoption of blockchain technology, blockchain implementation led by the manufacturer, and blockchain implementation led by the retailer.

3.1. Benchmark: Without Blockchain

Without blockchain traceability, consumers are concerned about the authenticity of products, which means consumers have an acceptance degree θ for products. The utility function of consumers is as follows:
U N = θ v p N ,
Consumers will purchase products only if U N 0 . Therefore, the demand under the benchmark scenario is given by
D N = 1 p N θ ,
The expected profit functions of the retailer and manufacturer in the benchmark scenario are as follows:
π M N = ( 1 p N θ ) w N ,
π R N = ( 1 p N θ ) ( p N w N ) ,

3.2. The Manufacturer-Led Blockchain

In this scenario, BTC shares the cost of building the blockchain system with the manufacturer and bears a cost proportion of γ 1 . The manufacturer, in turn, pays BTC a unit blockchain licensing fee of b M B (set by BTC) and then sells products to the retailer at ω M B per unit. Finally, consumers buy these products from the retailer at p M B . Figure 1 illustrates the supply chain structure under this scenario.
With blockchain-recorded traceability information embedded in products, consumers develop full trust in product authenticity. As the traceability level increases, consumers can access more product-related information, such as raw materials, production processes, and logistics, from which they derive additional utility. The consumers’ utility function is shown as follows:
U M B = v p M B + α l M B ,
When consumers’ utility is positive, they will purchase products. Therefore, the demand under Scenario MB is given by
D M B = 1 p M B + α l M B ,
According to the formula and parameters mentioned above, we obtain the profit functions of the manufacturer, the retailer, and the BTC.
π M M B = ( 1 p M B + α l M B ) ( w M B b M B ) 1 2 k l M B 2 ( 1 γ 1 ) ,
π R M B = ( 1 p M B + α l M B ) ( p M B w M B ) ,
π B M B = ( 1 p M B + α l M B ) b M B 1 2 k l M B 2 γ 1 ,
In Equation (7), the first term represents the profit obtained from wholesaling products, while the second term is the blockchain construction cost the manufacturer needs to bear. In Equation (9), the first term is profit derived from the licensing fee, and the second term is the blockchain construction cost the technical firm needs to bear. We summarize the equilibrium solutions, demand, and profits, respectively, in Lemma 1.

3.3. The Retailer-Led Blockchain

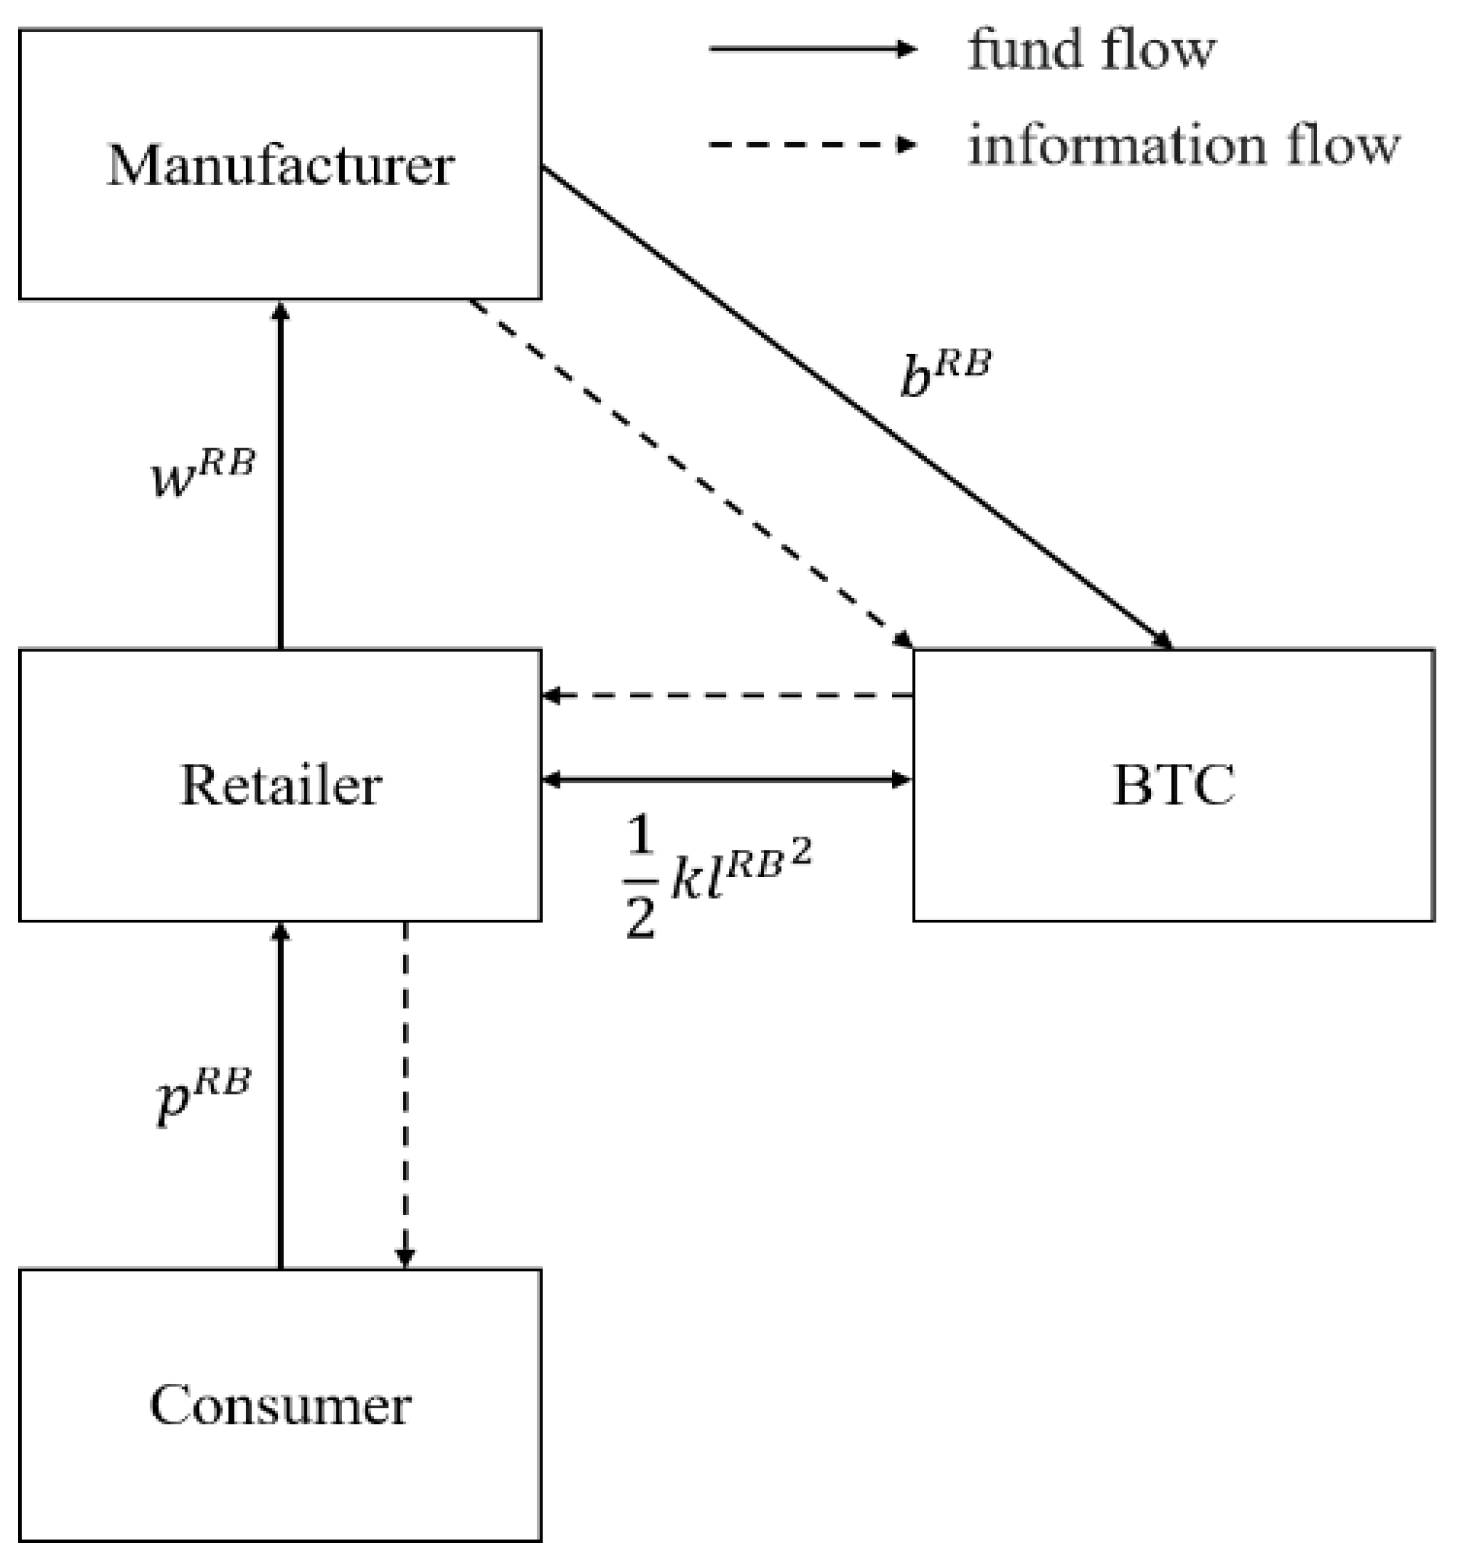
Similar to Scenario MB, the blockchain technology adopted by the retailer eliminates consumers’ doubts regarding product authenticity. At this point, BTC shares the construction costs with the retailer, bearing a proportion of γ 2 . The manufacturer still needs to pay a licensing fee to BTC. Figure 2 depicts the supply chain structure under this scenario.
Thus, the consumers’ utility function is specified as follows:
U R B = v p R B + α l R B ,
We can easily obtain the demand function:
D R B = 1 p R B + α l R B ,
Because the retailer takes the leading role in the blockchain system construction, the profit functions of the manufacturer, the retailer, and the BTC are as follows:
π M R B = 1 p R B + α l R B ( w R B b ) ,
π R R B = 1 p R B + α l R B p R B w R B 1 2 k l R B 2 ( 1 γ 2 ) ,
π B R B = 1 p R B + α l R B b R B 1 2 k l R B 2 γ 2 ,
In Equation (13), the first term represents the profit obtained from retailing products, while the second term is the blockchain construction cost that the retailer needs to bear. Equation (14) is similar to Equation (9). We summarize the equilibrium solutions, demand, and profits, respectively, in Lemma 1.
Lemma 1.
We present the equilibrium decisions (i.e., wholesale price, selling price, product traceability level, and unit licensing fee of blockchain) under different scenarios in Table 2. We summarize the equilibrium profits of the manufacturer, retailer, and BTC and the product demand under different scenarios in Table 3. The equilibrium conditions are identical to those in Table 2.

4. The Effects of Government Subsidy on BT Adoption

In this section, we examine the impact of government subsidies on the leadership in blockchain infrastructure development.

4.1. Blockchain Technology Subsidy Under Manufacturer-Led Scenario

In this scenario, we assume the government provides subsidies to the manufacturer for blockchain technology adoption such that the manufacturer receives financial support to reduce blockchain construction costs. We use the superscript MBS to represent this scenario. We set s as the transaction subsidy ratio, with 0 < s < 1 . BTC plays the same role as in Scenario MB. However, due to the presence of the government subsidy, the costs borne by both the manufacturer and BTC will be reduced to ( 1 s ) of their original amounts, as the government subsidizes the proportion s of the costs.
The consumer utility and demand functions are identical to those in Scenario MB, differing only in superscripts. To avoid redundancy, they are not presented here. According to the utility function and demand mentioned in Scenario MB, we obtain the profit functions of the manufacturer, the retailer, and the BTC as follows:
π M M B S = 1 p M B S + α l M B S ( w M B S b ) 1 2 k l M B S 2 ( 1 γ 1 ) ( 1 s ) ,
π R M B S = 1 p M B S + α l M B S p M B S w M B S ,
π B M B S = 1 p M B S + α l M B S b M B S 1 2 k l M B S 2 γ 1 ( 1 s ) ,
We summarize the equilibrium solutions, demand, and profits, respectively, in Lemma 2.
Lemma 2.
We summarize the equilibrium decisions (i.e., wholesale price, selling price, product traceability level, and unit licensing fee of blockchain) under different scenarios in Table 4 and substitute them into the profit and demand expressions to obtain the equilibrium demands and profits in Table 5.

4.2. Blockchain Technology Subsidy Under Retailer-Led Scenario

Similar to Scenario MBS, the retailer and BTC are eligible for government subsidies covering a proportion s of their respective costs, where 0 < s < 1 . The role of BTC remains unchanged. This scenario is denoted by the superscript RBS.
We also omit the expressions of the utility function and demand and list the profit function of supply chain members below directly:
     π M R B S = 1 p R B S + α l R B S ( w R B S b ) ,
   π R R B S = 1 p R B S + α l R B S p R B S w R B S 1 2 k l R B S 2 ( 1 γ 2 ) ( 1 s ) ,
π B R B S = 1 p R B S + α l R B S b R B S 1 2 k l R B S 2 γ 2 ( 1 s ) ,
We summarize the equilibrium solutions, demand, and profits, respectively, in Lemma 2.

5. Analysis and Discussion

In this section, we compare the wholesale price, retail price, demand of products, and the profits of three supply chain members obtained from different scenarios to understand the impacts of BT and the different conditions of manufacturer-led blockchain and retailer-led blockchain.

5.1. Comparison of Decision Variables

Proposition 1.
The optimal results of decision variables are as follows:
(i) 
If γ 2 > 1 2 and γ 1 < 2 γ 2 1 , l R B * > l M B * . If (1) γ 2 > 1 2 and γ 1 > 2 γ 2 1 ; (2) γ 2 < 1 2 , l M B * > l R B * .
(ii) 
If γ 2 > 1 2 and γ 1 < 2 γ 2 1 , w R B * > w M B * > w N * . If (1) γ 2 > 1 2 and γ 1 > 2 γ 2 1 ; (2) γ 2 < 1 2 , w M B * > w R B * > w N * .
(iii) 
If γ 2 > 1 2 and γ 1 < 2 γ 2 1 , p R B * > p M B * > p N * . If (1) γ 2 > 1 2 and γ 1 > 2 γ 2 1 ; (2) γ 2 < 1 2 , p M B * > p R B * > p N * .
(iv) 
If γ 2 > 1 2 and γ 1 < 2 γ 2 1 , b R B * > b M B * . If (1) γ 2 > 1 2 and γ 1 > 2 γ 2 1 ; (2) γ 2 < 1 2 , b M B * > b R B * .
(v) 
If γ 2 > 1 2 and γ 1 < 2 γ 2 1 , D R B * > D M B * > D N * . If (1) γ 2 > 1 2 and γ 1 > 2 γ 2 1 ; (2) γ 2 < 1 2 , D M B * > D R B * > D N * .
Proof. See Appendix A.
Compared to Scenario N, we find that the supply chain members always decide higher prices with the blockchain adoption. The reason for this result is that while the blockchain makes the product information more transparent, the manufacturer and the retailer need to charge greater fees for the technology. They decide to transfer this cost to the wholesale price and the retail price. This finding was also pointed out by Zhong et al. (2023) [45]. They also suggested that the wholesale and retail price are higher after the blockchain is adopted in the supply chain. The blockchain eliminates the consumers’ doubt of the product, and they are more willing to purchase the product with the transparent blockchain information. This means that the demand under the MB and RB is larger than that under Scenario N. This result is consistent with the empirical findings of [5]; the average premium consumers are willing to pay for products with detailed traceability information is 10% higher than that for products with simplified information.
Considering the different leaders of the blockchain, when the manufacturer or the retailer undertakes a lesser proportion of the blockchain cost, they can set a higher traceability level than the blockchain lead by the other. The higher level also leads the manufacturer and the retailer to decide on a higher price. This is because the high level improves the transparency of products information. It satisfies the consumers’ preference of the products’ quality perception, encouraging the manufacturer and retailer to raise the price. For the BTC, if it undertakes a large proportion of the blockchain cost, it decides a higher licensing fee to compensate for the decrease in profit caused by the rising cost.
Proposition 2.
Comparison of the scenarios under government subsidy:
(i) 
w M B S * > w M B * , p M B S * > p M B * , b M B S * > b M B * , l M B S * > l M B * and D M B S * > D M B * .
(ii) 
w R B S * > w R B * , p R B S * > p R B * , b R B S * > b R B * , l R B S * > l R B * and D R B S * > D R B * .
Proof. See Appendix A.
From Proposition 2, we can conclude that the government subsidy to the blockchain technology can effectively decrease the construction cost of the blockchain leader and the BTC. Leaders can set a higher level of traceability at a lower cost, even if the unit licensing fee of the blockchain increases. Manufacturers (retailers) will also set a higher wholesale price (retail price), which is consistent with the findings of Tao et al. (2023) [49]. Counterintuitively, when the price rises, instead of decreasing, consumer demand increases. This is because consumers can obtain higher utility from products with a high level of traceability. For example, the Shandong provincial government subsidized the construction of a public traceability platform and developed a leek traceability system, documenting and presenting every stage of the leek supply chain from cultivation to consumption. This transparency enables consumers to comprehensively understand the production process. Following the pilot implementation, the unit price of traceable leeks increased by 200%. This also aligns with [50], in which the perceived quality of traceability information was found to positively influence purchase intention toward organic food.

5.2. Comparison of Profits

Proposition 3.
Comparison of Scenarios N and M B :
(i) 
If (1) θ < 1 4 ; (2) θ > 1 4 and k < k 1 , π M M B * > π M N * . If θ > 1 4 and k > k 1 , π M M B * < π M N * , where k 1 = α 2 θ 4 ( 1 γ 1 ) ( 4 θ 1 ) .
(ii) 
If (1) θ < 1 4 ; (2) θ > 1 4 and k < k 2 , π R M B * > π R N * . If θ > 1 4 and k > k 2 , π R M B * < π R N * , where k 2 = ( 2 θ + θ ) α 2 8 ( 1 γ 1 ) ( 4 θ 1 ) .
Proof. See Appendix A.
By comparing Scenario N with Scenario MB, we can learn that the manufacturer does not always benefit from the blockchain adoption and the leadership of the blockchain. When the consumers’ acceptance of the product without the blockchain traceability information is low, or the cost coefficient of the blockchain construction is relatively small when θ > 1 4 , the manufacturer prefers to lead the construction of the blockchain. Fan et al. [43] also reached the same conclusion: the blockchain can only exert a positive impact when consumers’ awareness of product traceability exceeds a certain threshold. The reason for this condition is that the blockchain adoption will increase the price of the product, and when the acceptance of the product decreases, the price declines. After eliminating the consumers’ doubt, the manufacturer can gain the extra profit from the price increase. Additionally, when the cost coefficient is low, the traceability level will increase such that the manufacturer decides a higher price. The retailer has the same condition as the manufacturer. Whether it can benefit from the application of blockchain depends on consumers’ acceptance and the cost coefficient.
For example, in the luxury goods and diamond industry, consumers are often concerned about the authenticity, quality, and origin of products. Specifically, De Beers collaborates with Sarine, a diamond traceability technical service firm, and focuses on recording the traceability of diamonds from rough diamonds to polished diamonds, without the need for further physical verification [51]. Many luxury goods manufacturers such as Louis Vuitton, Gucci, and Hermes have cooperated with Aura, a company using blockchain technology, to trace their products [52].
Proposition 4.
Comparison of Scenarios N and R B :
(i) 
If (1) θ < 1 4 ; (2) θ > 1 4 and k < k 3 , π M R B * > π M N * . If θ > 1 4 and k > k 3 , π M R B * < π M N * , where k 3 = ( 2 θ + θ ) α 2 16 ( 1 γ 2 ) ( 4 θ 1 ) .
(ii) 
If (1) θ < 1 4 ; (2) θ > 1 4 and k < k 4 , π R R B * > π R N * . If θ > 1 4 and k > k 4 , π R R B * < π R N * , where k 4 = α 2 θ 8 ( 1 γ 2 ) ( 4 θ 1 ) .
Proof. See Appendix A.
From Proposition 4, it is intuitive that the retailer is not always willing to build blockchain system to provide trace service to the manufacturer. It is similar to the manufacturer-led scenario. When consumers have significant doubts about the products without traceability, adopting blockchain can enable the retailer to obtain more profit. If the consumers are more receptive to the products without traceability, there exists a threshold of cost coefficient of the blockchain construction, affecting the retailer’s blockchain strategy decision. The retailer will adopt blockchain only when the cost is low. Whether the manufacturer can obtain more profits depends on conditions similar to those of the retailer.
According to Gartner, a global research and consulting firm, by 2025, 20% of the top food retailers by revenue will use blockchain for food traceability to add transparency to production and ensure better quality of goods [53]. Some retailers like Walmart, Alibaba, and JD have utilized blockchain technology to track sources for food. JD has partnered with the Australian startup InterAgri to develop a blockchain platform for tracking beef imports from overseas suppliers. The platform will record information related to activities such as the breeding of cattle, processing, and transportation for the final consumers [54]. Carrefour has become a blockchain pioneer that integrates the technology into its organic product and textile lines.
Proposition 5.
Comparison between Scenarios M B and R B :
(i) If γ 1 > γ 2 , π M M B * > π M R B * ;
If 2 γ 2 1 < γ 1 < γ 2 , there exists a threshold k 5 . When k < k 5 , π M M B * > π M R B * and when k > k 5   π M M B * < π M R B * , where k 5 = ( 1 γ 1 ) a 2 64 ( 1 γ 2 ) ( γ 2 γ 1 ) ;
If γ 1 < 2 γ 2 1 , π M M B * < π M R B * .
(ii) If γ 2 > γ 1 + 3 4 , π R R B * > π R M B * ;
If γ 1 + 1 2 < γ 2 < γ 1 + 3 4 , there exists a threshold k 6 . When k < k 6 , π R R B * > π R M B * and when k > k 6 , π R R B * < π R M B * , where k 6 = ( 1 γ 2 ) a 2 8 ( 1 γ 1 ) ( γ 1 4 γ 2 + 3 ) ;
If γ 2 < γ 1 + 1 2 , π R R B * < π R M B * .
Proof. See Appendix A.
Proposition 5 shows that under certain conditions, the profit of the manufacturer or the retailer under either M B or R B is greater than the profit under the other scenario. The condition is related to the share of the blockchain cost undertaken by the leader and the cost coefficient of blockchain. The lower proportion of the cost or the lower cost coefficient makes the blockchain leader prefer to construct the blockchain. Conversely, it would be preferable for the other party to take the lead. With the lower cost, the leader can set a higher traceability level to satisfy the consumers’ information preference and stimulate consumption. Therefore, under Scenario MB, the manufacturer will raise the wholesale price, while under Scenario RB, the retailer will increase the retail price to obtain more profit. Unlike Fang et al. [20], we conclude that the proportion of costs borne by BTC is a key factor affecting the leadership in blockchain construction, whereas their determinant is the commission rate.
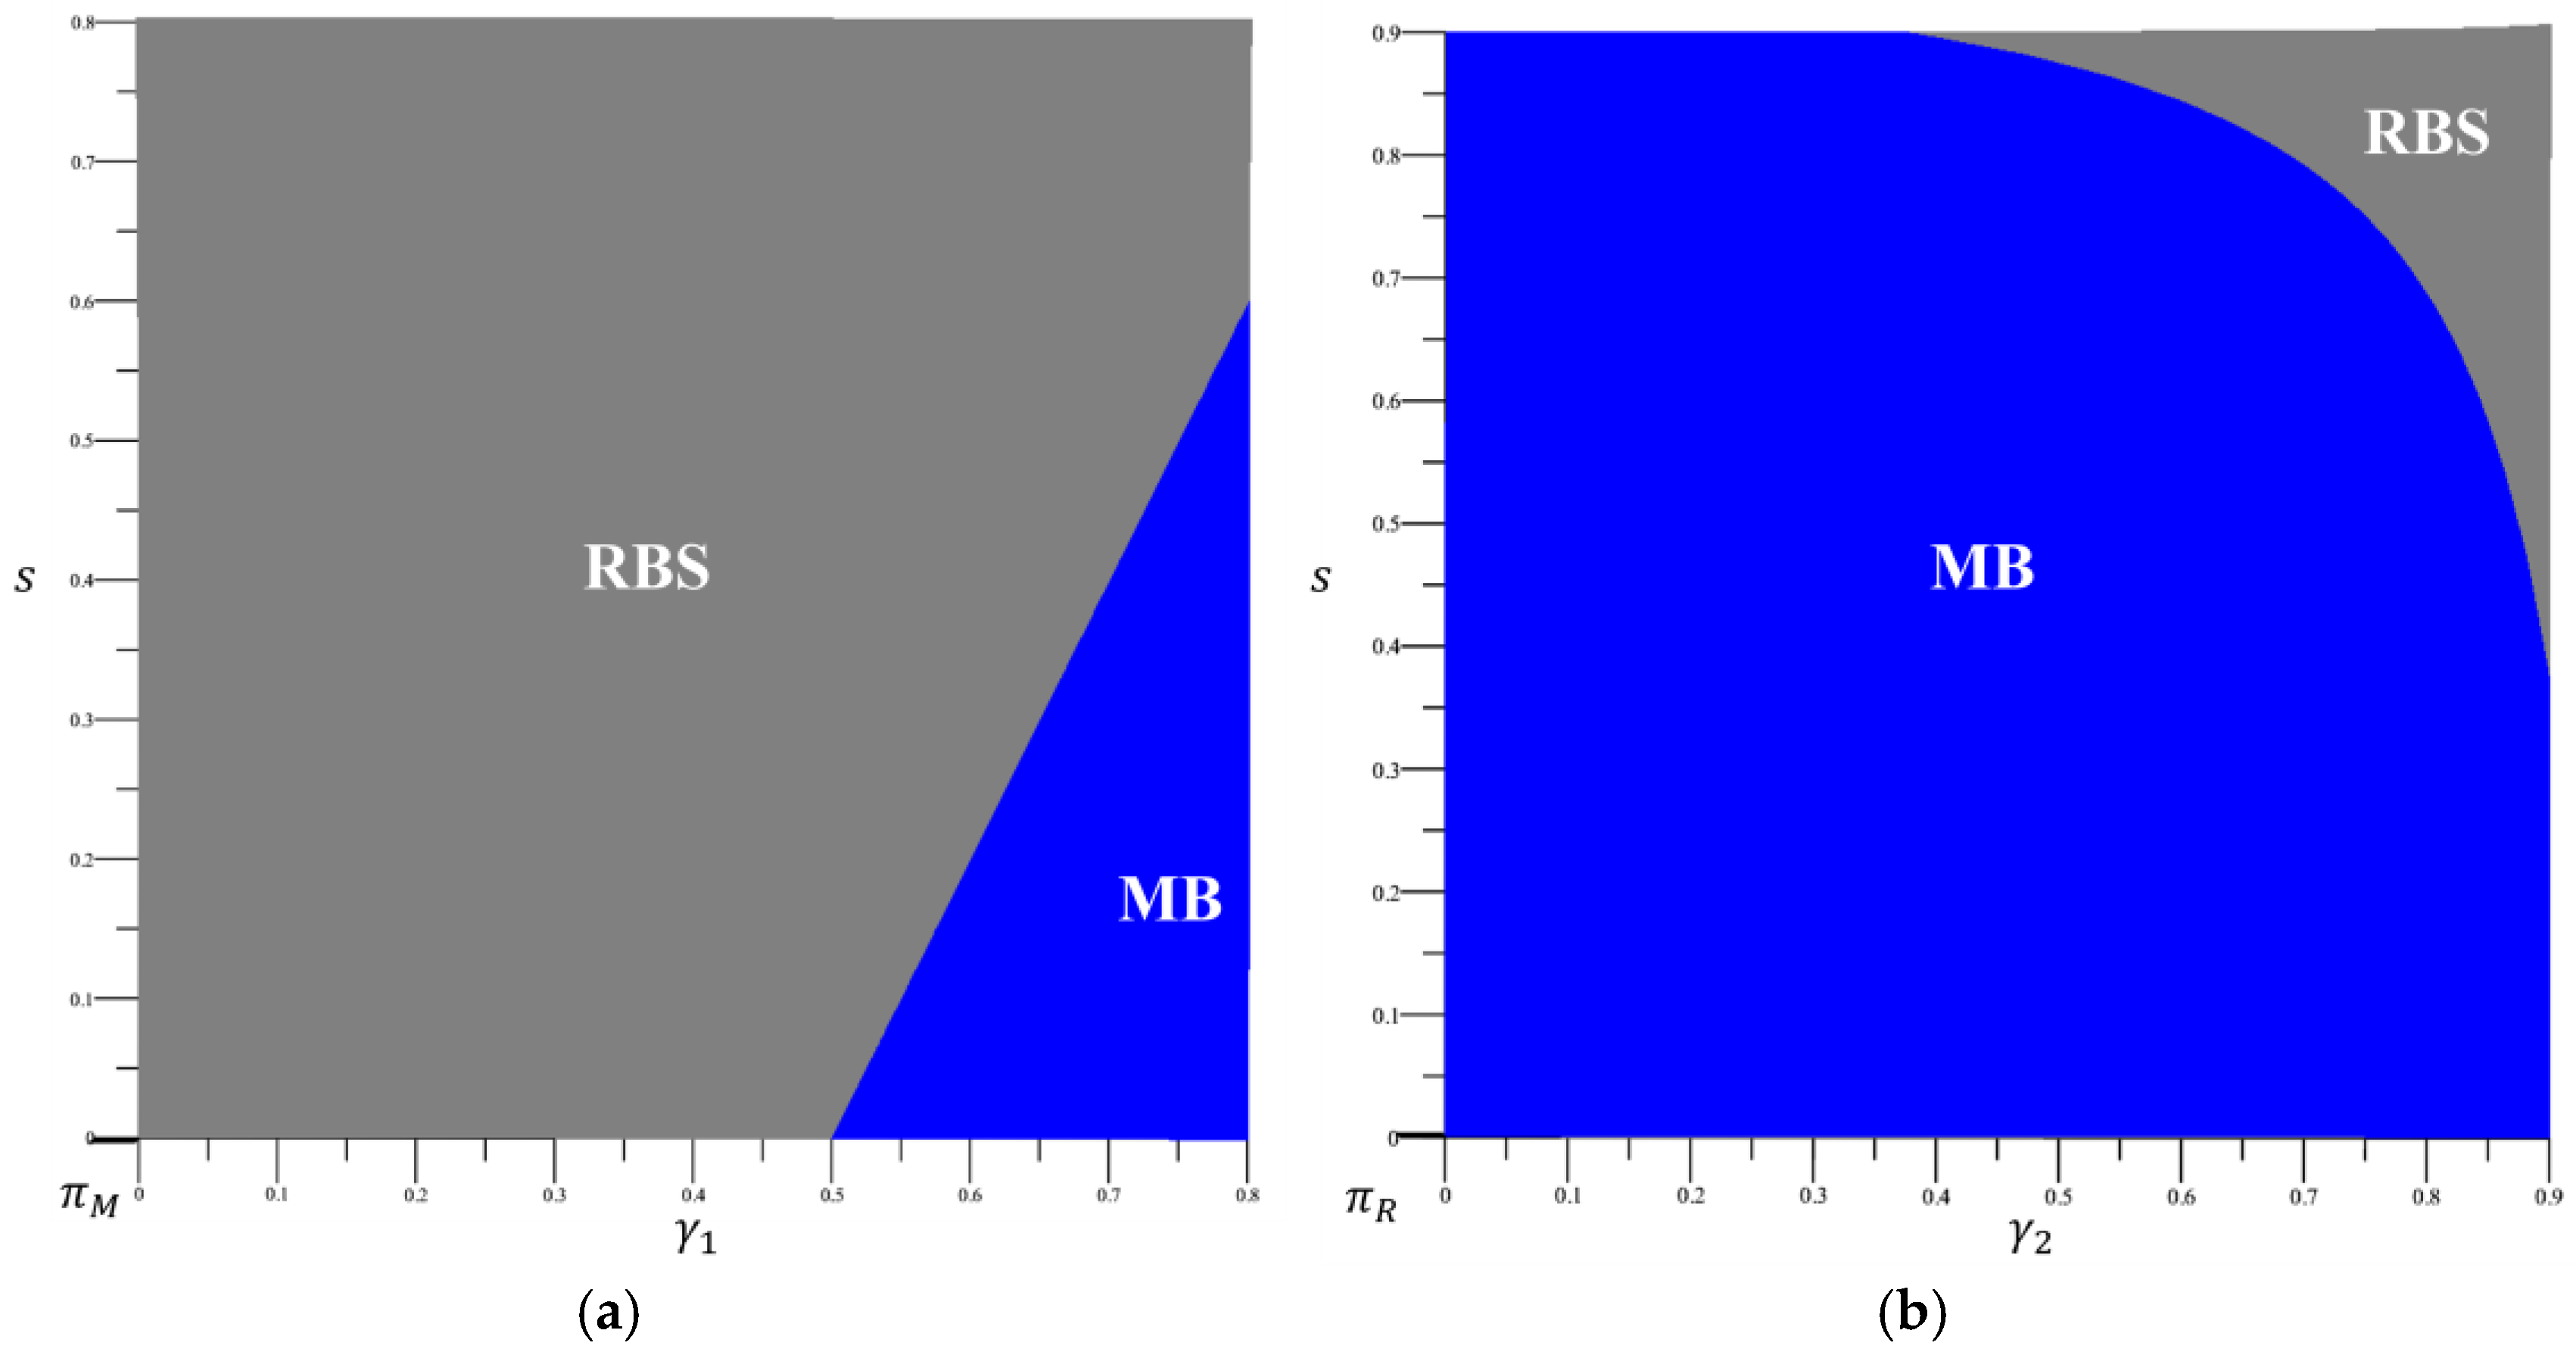
To facilitate understanding of Proposition 5, we present Figure 3, where k = 1 and α = 0.5 , and Figure 3, where α = 0.5 ,   γ 1 = 0.3 , and γ 2 = 0.3   (see Figure 4a) and α = 0.8 ,    γ 1 = 0.4 , and γ 2 = 0.3   (see Figure 4b). As illustrated in Figure 3a, manufacturers will only take the lead in blockchain construction (i.e., leading the effort yields higher profits) when the cost-sharing ratio provided by the technology firm for manufacturers ( γ 1 ) is greater than that for the retailer. Similarly, in Figure 3b, the retailer will only opt to lead blockchain construction when the technology firm assumes a relatively larger share of the costs. This finding aligns with the results regarding the technology firm’s cost-sharing ratios as outlined in Proposition 5. As can also be observed in Figure 4, the two thresholds of the construction cost coefficient k exert an influence on the dominance of blockchain construction. When the construction cost is excessively high, both the manufacturer and the retailer will give up dominance.
Given that the deployment of blockchain entails a substantial fixed cost as well as significant variable operational expenses [55], manufacturers and retailers need to carefully consider their blockchain adoption strategies. According to Maticz, a blockchain technical service firm, the cost of developing a simple blockchain system is approximately between USD 40,000 and USD 60,000; for a moderately complex system, it ranges from USD 60,000 to USD 150,000; and a highly complex one exceeds USD 300,000 [56]. Therefore, manufacturers (retailers) will only adopt blockchain technology when they can afford it or when the construction cost is not prohibitively high.
Proposition 6.
Comparison between Scenarios M B ( R B ) and M B S ( R B S ) :
(i) 
π M M B S * > π M M B * ,   π M R B S * > π M R B * .
(ii) 
π R M B S * > π R M B * , π R R B S * > π R R B * .
(iii) 
If (1) 0 < γ 1 < 2 3 ; (2) 2 3 < γ 1 < 4 5 and k > k 7 , π B M B S * > π B M B * . If (1) 2 3 < γ 1 < 4 5 and α 2 16 ( 1 γ 1 ) ( 1 s ) < k < k 7 ; (2) 4 5 < γ 1 < 1 , π B M B S * < π B M B * .
(iv) 
If (1) 0 < γ 2 < 4 5 ; (2) 4 5 < γ 2 < 8 9 and k > k 8 , π B R B S * > π B R B * . If (1) 4 5 < γ 2 < 8 9 and k < k 8 ; (2) 8 9 < γ 2 < 1 , π B R B S * < π B R B * .
Proof. See Appendix A.
With the government subsidy, the manufacturer and the retailer would prefer to adopt blockchain, and the other party can also obtain extra profit in this case. However, the BTC does not always benefit from the subsidy. The subsidy raises the blockchain fee but also decreases the blockchain construction cost, which encourages the manufacturer (retailer) to increase the blockchain traceability level. If the proportion undertaken is high or the cost coefficient of blockchain small, the manufacturer (retailer) will decide on a higher level, and the BCT will undertake more cost. When the proportion is low enough or the cost coefficient high, which also means the cost will decrease, the BTC prefers to cooperate with manufacturer (retailer).
Governments globally provide diverse subsidies to enterprises to promote blockchain technology application in product traceability [57]. Specifically, Australia’s Blockchain Roadmap leverages blockchain to ensure the integrity of agricultural supply chains [58]. From 2016–2019, the European Commission provided some EUR 180 million in prizes and grants through Horizon 2020. A significant budget for further grants is expected in the follow-up Horizon program known as Horizon Europe. Currently funded projects have been grouped under a cluster of topics and technologies: privacy and cybersecurity, industrial technologies, environment and circular economy, etc. [14].
Proposition 7.
Comparison between Scenarios M B and R B S :
(i) If γ 1 < 2 γ 2 1 , or γ 1 > 2 γ 2 1 and 1 2 γ 2 + γ 1 2 1 γ 2 < s < 1 , π M R B S * > π M M B * ;
If γ 1 > γ 2 , γ 1 γ 2 1 γ 2 < s < 1 2 γ 2 + γ 1 2 1 γ 2 or 2 γ 2 1 < γ 1 < γ 2 , 0 < s < 1 2 γ 2 + γ 1 2 1 γ 2 , there exists a threshold k 9 when k < k 9 , π M R B S * < π M M B * and when k > k 9 , π M R B S * > π M M B * ;
If γ 1 > γ 2 and 0 < s < γ 1 γ 2 1 γ 2 , π M R B S * < π M M B * .
(ii) If γ 2 > 3 + γ 1 4 , or γ 2 < 3 + γ 1 4 and 3 4 γ 2 + γ 1 4 1 γ 2 < s < 1 , π R R B S * > π R M B * ;
If 1 + γ 1 2 < γ 2 < 3 + γ 1 4 , 0 < s < 3 4 γ 2 + γ 1 4 1 γ 2 or γ 2 < 1 + γ 1 2 , 1 2 γ 2 + γ 1 2 1 γ 2 < s < 3 4 γ 2 + γ 1 4 1 γ 2 , there exists a threshold k 10 when k < k 10 , π R R B S * > π R M B * and when k > k 10 , π R R B S * < π R M B * ;
If γ 2 < 1 + γ 1 2 and 0 < s < 1 2 γ 2 + γ 1 2 1 γ 2 , π R R B S * < π R M B * .
Proof. See Appendix A.
Proposition 7 shows that the government subsidy can lead to the transfer of blockchain leadership. If the proportion of the cost is relatively low or the subsidy ratio high, it will give up constructing the blockchain and participate in the retailer-led blockchain. Additionally, the cost coefficient of blockchain is another important factor. If the cost coefficient is high, even if the proportion of the cost is low or the subsidy high, the manufacturer prefers to choose the retailer-led blockchain. For the retailer, if it has a low proportion of blockchain cost, obtains a high subsidy ratio, or gains a low cost coefficient of blockchain construction, it will benefit from the government subsidy and will not give up the leadership of the blockchain. To better understand Proposition 7, we present Figure 5, where k = 1 ,   a = 0.5 , and γ 2 = 0.5 (see Figure 5a) and k = 1 ,    a = 0.5 , and γ 1 = 0.5 (see Figure 5b). This is consistent with our conclusion: in the presence of government subsidies, manufacturers/retailers will only take the lead in blockchain construction when both the subsidy ratio and the cost-sharing ratio borne by technology companies are high.
Proposition 8.
Comparison between Scenarios R B and M B S :
(i) If γ 1 > γ 2 or γ 1 < γ 2 and γ 2 γ 1 1 γ 1 < s < 1 , π M M B S * > π M R B * .
If 2 γ 2 1 < γ 1 < γ 2 , 0 < s < γ 2 γ 1 1 γ 1 or γ 1 < 2 γ 2 1 , 2 γ 2 γ 1 1 1 γ 1 < s < γ 2 γ 1 1 γ 1 , there exists a threshold k 11 when k < k 11 , π M M B S * > π M R B * , and when k > k 11 , π M M B S * < π M R B * , where k 11 = α 2 16 ( 1 γ 1 ) ;
If γ 1 < 2 γ 2 1 and 0 < s < 2 γ 2 γ 1 1 1 γ 1 , π M M B S * < π M R B * .
(ii) If γ 2 < 1 2 γ 1 + 1 2 , or γ 2 > 1 2 γ 1 + 1 2 and 2 γ 2 γ 1 1 1 γ 1 < s < 1 , π R M B S * > π R R B * ;
If  1 2 γ 1 + 1 2 < γ 2 < 1 4 γ 1 + 3 4 , 0 < s < 2 γ 2 γ 1 1 1 γ 1 or γ 2 > 1 4 γ 1 + 3 4 , 4 γ 2 γ 1 3 1 γ 1 < s < 2 γ 2 γ 1 1 1 γ 1 , there exists a threshold k 12 . When k < k 12 , π R M B S * < π R R B * , and when k > k 12 , π R M B S * > π R R B * , where k 12 = α 2 32 1 γ 2 1 s ;
If  γ 2 > 1 4 γ 1 + 3 4 and 0 < s < 4 γ 2 γ 1 3 1 γ 1 , π R M B S * < π R R B * .
Proof. See Appendix A.
Proposition 8 implies that under certain conditions, the government can make the manufacturer or the retailer choose the other’s leading blockchain. The conditions are related to the proportion of the blockchain cost, the cost coefficient of blockchain construction, and the subsidy ratio. When the proportion is small, the subsidy is high, or the cost coefficient is low, the manufacturer decides to lead the blockchain compared to the retailer-led case. When the retailer undertakes more blockchain construction cost, it prefers the manufacturer-led case under the government subsidy.
The underlying reasons for Propositions 7 and 8 share commonalities. The lower blockchain cost proportion, higher subsidy cost, and lower construction cost coefficient lead to the increase in the blockchain construction cost. They result in an increase in the traceability level determined by the leader of the blockchain. These further increase consumer preference for the product and encourage the supply chain to increase the price to earn more profit.

6. Extensions

In this chapter, we relax the previous assumption that production is zero and verify the robustness of the results we have obtained.
When the manufacturer’s production cost is non-zero, only the manufacturer’s profit function changes, with the unit product net profit shifting from w i b i to w i b i c . Therefore, we still derive and calculate the equilibrium profits of each entity based on the specific conditions in different scenarios. We present the equilibrium profits of all parties when production costs are non-zero in Table 6 and Table 7. By comparing with the previous Table 3 and Table 5, we find that the profit structure remains unchanged, with all profits scaled by a factor of ( c 1 ) 2 . Thus, their relative magnitudes do not change, and therefore, the results we obtained remain applicable when production costs are non-zero.

7. Conclusions and Discussion

In this paper, we examine what the impact of blockchain adoption in the supply chain is and who should be the leader of the blockchain construction. Additionally, we also explore the effect of the government subsidy on the blockchain technology. We consider a manufacturer, a retailer, and a third-party blockchain company that can offer the blockchain service, if the supply chain is willing to use blockchain to trace the products’ information. In this supply chain model, we examine manufacturer-led blockchain and retailer-led blockchain with or without the government subsidy, respectively. As a result, we can summarize our accomplishments and several major findings in response to the proposed research questions as follows.
(1)
For the manufacturer and retailer, blockchain adoption in the supply chain is not always optimal and is contingent on consumers’ acceptance of non-blockchain products and blockchain construction costs. When consumer acceptance of non-blockchain products is low, blockchain effectively mitigates concerns and boosts trust. Conversely, at moderate acceptance levels, high construction costs significantly deter adoption;
(2)
The manufacturer and retailer invariably benefit from government subsidies, which lower blockchain construction costs. This enables them to raise product prices and enhance traceability level, thereby boosting profits. Conversely, the technical service firm will only collaborate with the manufacturer or retailer to establish blockchain traceability systems when their cost-bearing ratio is sufficiently low or the construction cost coefficient high;
(3)
A win–win situation may exist for the manufacturer, retailer, and technical service firm. Under this scenario, the technical service firm shoulder a smaller proportion of blockchain construction cost. If the manufacturer or retailer aims to shift more blockchain cost onto the service firm, the manufacturer must increase the licensing fee payment.
The above conclusions can provide several managerial insights to help the government and supply chain members develop the associated action plans for supply chain under the background of BT application.
Firstly, when evaluating the feasibility of applying blockchain and determining the level of product traceability, enterprises need to focus on two core elements: the degree of acceptance of products traced without blockchain and the construction cost of the blockchain system. Specifically, when consumers have a low acceptance of products without traceability information (e.g., maternal and infant products, luxury goods, fresh food, etc.), or the construction cost is low, enterprises can introduce blockchain technology. This aligns with real-world practices. In the organic food industry, consumers pay great attention to the origin of products (e.g., place of production, processing method, transportation, etc.). When the construction cost is relatively low, many companies may adopt blockchain technology. Nestlé has utilized the IBM Food Trust blockchain ledger to help users trace the origin of products like its Mousline purée and Zoégas coffee brands; Walmart and IBM partner to maintain the retailer’s Food Traceability Initiative, which lets officials trace the lifespan of their products to ensure food safety and reduce waste [59]. Second, both manufacturers and retailers can take the lead in building blockchains for food traceability, provided that either the construction cost of such blockchains is low or the proportion of costs borne by the leading enterprises is low. https://global.jd.com/, a leading retailer in China, is a typical example: it has developed the JD Zhizhen Chain, which has now attracted over 100 brand manufacturers—including Yanghe, Moutai, Wyeth, and Arawana—to join. After these manufacturers adopted the chain, they saw significant positive outcomes, including higher operational efficiency and lower product return rates. Specifically, within a certain period after implementation, the repurchase rate of seafood and fresh produce on the platform rose by 47.5%; sales of nutritional and health products increased by 29.4%, while their return rate dropped by 4.5%. Third, the government should invest funds to strongly support the application of blockchain technology in the field of product traceability. This aligns with global policy practices and our study’s verified “subsidy effect” (i.e., targeted subsidies significantly boost enterprise adoption). For instance, the European Commission provided some EUR 180 million in prizes and grants through Horizon 2020. Several Chinese cities, such as Shanghai, Fuzhou, and Nanjing, have rolled out innovation subsidy policies for blockchain applications. For instance, the Fuzhou government actively encourages and supports companies in undertaking blockchain applications and offers a 20% subsidy for construction funds. Moreover, the UK government has committed a six-figure grant via Innovate UK to finance blockchain-related enterprises.
This study has several limitations, and the unresolved issues provide avenues for future research. First, in terms of demand setting, this study assumes that product demand is linear and deterministic. However, real-world market demand is often affected by random factors (e.g., seasonal fluctuations in fresh food demand) or nonlinear consumer responses (e.g., dynamic changes in demand elasticity across price tiers), and this simplified assumption may underestimate the uncertainty of firms’ investment returns after adopting blockchain technology. Second, regarding supply chain structure, the study’s model only includes a single manufacturer and does not incorporate inter-manufacturer competition (e.g., blockchain adoption games between two brands) or multi-retailer scenarios. In practice, competitive dynamics may alter the strategic preferences of supply chain leaders (e.g., manufacturers may adopt blockchain to avoid competitive disadvantages) and the effectiveness of government subsidies; thus, expanding the model to a scenario with two competing manufacturers and exploring their blockchain adoption decisions will be of great research value. Additionally, this study’s discussion of government subsidies is limited to basic incentives and does not address the collaborative optimization of subsidies and supply chain cooperation models. Future exploration of differentiated subsidy designs (e.g., performance-based tiered subsidies or multi-agent linked subsidies) to guide the formation of efficient supply chain cooperation models and enhance the application value of blockchain technology also holds significant research merit.

Author Contributions

Conceptualization, W.Z. and Y.J.; methodology, W.Z.; writing—original draft preparation, Y.J.; writing—review and editing, W.Z. and X.P.; supervision, W.Z.; project administration, X.P. All authors have read and agreed to the published version of the manuscript.

Funding

This research received no external funding.

Data Availability Statement

The original contributions presented in this study are included in the article. Further inquiries can be directed to the corresponding author.

Conflicts of Interest

The authors declare no conflicts of interest.

Abbreviations

The following abbreviations are used in this manuscript:
RFIDRadio frequency identification
QRQuick response
IoTInternet of Things
IBMInternational Business Machines Corporation
UKUnited Kingdom
JDJD.com, Inc.

Appendix A

Appendix A.1. Proof of Lemmas 1 and 2

In Scenario N, we use the backward induction. First, we derive the profit of the platform with the parameter p N . The first- and second-order derivatives of π R N with respect to p N are π R N p N = p N w N θ + 1 p N θ and 2 π R N ( p N ) 2 = 2 θ < 0 . Thus, the expected profit of retailer is concave in its selling price, and its selling price response satisfies p N = θ + w N 2 according to the first-order condition. Substituting p N into π w N , we derive the profit of the platform with the parameter w N . Then, the first- and second-order derivatives are π M N w N = 2 w N + θ 2 θ and 2 π M N ( w N ) 2 = 1 θ < 0 . Therefore, we can obtain the optimal wholesale price w N * = 1 2 θ . By substituting it into p N , π R N , π M N , and D N , we can obtain p N * = 3 4 θ , D N * = 1 4 , π M N * = 1 8 θ , and π R N * = 1 16 θ .
In Scenario MB, we use the same method as above. First, we derive the profit of the platform with the parameter p M B . The first- and second-order derivatives of π R M B with respect to p M are π R M B p M B = α l M B 2 p M B + w M B + 1 and 2 π R M B ( p M B ) 2 = 2 < 0 . Thus, the expected profit of retailer is concave in its selling price, and its selling price response satisfies p M B = α l M B + w M B + 1 2 according to the first-order condition. Substituting p M B into π M M B , we derive the profit of the platform with the parameter w M B . Then, the first- and second-order derivatives are π M M B w M B = 2 w M B + b M B + α l M B + 1 2 and 2 π M M B ( w M B ) 2 = 1 < 0 . Therefore, its wholesale price response satisfies w M B = 1 + b M B + α l M B 2 . Substituting p M B and w M B into π B M B , π B M B b M B = 2 b M B + α l M B + 1 4 , and 2 π B M B ( b M B ) 2 = 1 2 < 0 . The licensing fee response satisfies b M B = 1 + α l M B 2 . We substitute p M B , w M B , and b M B into π M M B . π M M B l M B = l M B ( α 2 + 16 k ( 1 + γ 1 ) ) + α 16 , and 2 π M M B ( l M B ) 2 = α 2 16 1 γ 1 k < 0 . We obtain k > α 2 16 ( 1 γ 1 ) and l M B * = α 16 k 1 γ 1 α 2 . By substituting it into p M B , w M B , b M B , π R M B , π M M B , π B M B , and D M B , we can obtain w M B * = 12 k ( 1 γ 1 ) 16 k 1 γ 1 α 2 , p M B * = 14 k ( 1 γ 1 ) 16 k 1 γ 1 α 2 , b M B * = 8 k ( 1 γ 1 ) 16 k 1 γ 1 α 2 , D M B * = 2 k ( 1 γ 1 ) 16 k 1 γ 1 α 2 , π M M B * = k ( 1 γ 1 ) 32 k 1 γ 1 2 α 2 , π R M B * = 4 k 2 1 γ 1 2 ( 16 k 1 γ 1 2 α 2 ) 2 , and π B M B * = k ( 32 k ( 1 γ 1 ) 2 γ 1 α 2 ) 2 ( 16 k 1 γ 1 + α 2 ) 2 .
In Scenario RB, the calculations of p R B , w R B , and b R B are the same as in Scenario MB. We substitute them into π R R B . π R R B l R B = l R B ( α 2 + 32 k ( 1 + γ 2 ) ) + α 32 , and 2 π R R B ( l R B ) 2 = α 2 32 1 γ 2 k < 0 . We obtain k > α 2 32 ( 1 γ 2 ) and l R B * = α 32 k 1 γ 2 α 2 . By substituting into p R B , w R B , b R B , π R R B , π M R B , π B R B , and D R B , we can obtain w R B * = 24 k ( 1 γ 2 ) 32 k 1 γ 2 α 2 , p R B * = 28 k ( 1 γ 2 ) 32 k 1 γ 2 α 2 , b R B * = 16 k ( 1 γ 2 ) 32 k 1 γ 2 α 2 , D R B * = 4 k ( 1 γ 2 ) 32 k 1 γ 2 α 2 , π M R B * = 32 k 2 ( 1 γ 2 ) 2 ( 32 k 1 γ 2 α 2 ) 2 , π R R B * = k 1 γ 2 64 k 1 γ 2 2 α 2 , and π B R B * = k ( 128 k ( 1 γ 2 ) 2 γ 2 α 2 ) 2 ( 32 k 1 γ 2 + α 2 ) 2 .

Appendix A.2. Proof of Lemmas 3 and 4

In Scenarios MBS and RBS, the sequences of events are the same as in M B and R B . Therefore, the proof of this part is similar to that above.

Appendix A.3. Proof of Proposition 1

(i)
w M B * w N * = 16 θ 3 2 1 γ 1 k θ α 2 32 γ 1 1 k + 2 α 2 > 0 , w R B * w N * = 32 θ 3 2 1 γ 2 k θ α 2 64 γ 2 1 k + 2 α 2 > 0 , w R B * w M B * = 12 k α 2 ( γ 1 2 γ 2 + 1 ) ( 16 γ 1 1 k + 2 α 2 ) ( 32 γ 2 1 k + 2 α 2 ) . If 1 2 < γ 2 < 1 and γ 1 < 2 γ 2 1 , w R B * w M B * > 0 . If 1 2 < γ 2 < 1 and γ 1 > 2 γ 2 1 or 0 < γ 2 < 1 2 , w R B * w M B * < 0 ;
(ii)
p M B * p N * = 48 θ 7 6 1 γ 1 k 3 θ α 2 64 γ 1 1 k + 4 α 2 > 0 , p R B * p N * = 96 θ 7 6 1 γ 2 k 3 θ α 2 128 γ 2 1 k + 4 α 2 > 0 , p R B * p M B * = 14 k α 2 ( γ 1 2 γ 2 + 1 ) ( 16 γ 1 1 k + 2 α 2 ) ( 32 γ 2 1 k + 2 α 2 ) . The result of this equation, p R B * p M B * , is the same as w R B * w M B * ;
(iii)
b R B * b M B * = 8 k α 2 ( γ 1 2 γ 2 + 1 ) ( 16 γ 1 1 k + 2 α 2 ) ( 32 γ 2 1 k + 2 α 2 ) . The result of this equation, b R B * b M B * , is the same as w R B * w M B * ;
(iv)
l R B * l M B * = 16 k α ( γ 1 2 γ 2 + 1 ) ( 16 γ 1 1 k + 2 α 2 ) ( 32 γ 2 1 k + 2 α 2 ) . The result of this equation, l R B * l M B * , is the same as w R B * w M B * ;
(v)
D M B * D N * = 8 γ 1 1 k α 2 64 γ 1 1 k + 4 α 2 > 0 , D R B * D N * = 16 γ 2 1 k α 2 128 γ 2 1 k + 4 α 2 > 0 , D R B * D M B * = 2 k α 2 ( γ 1 2 γ 2 + 1 ) ( 16 γ 1 1 k + 2 α 2 ) ( 32 γ 2 1 k + 2 α 2 ) . The result of this equation, D R B * D M B * , is the same as w R B * w M B * .

Appendix A.4. Proof of Proposition 2

(i)
w M B S * w M B * = 12 k s 1 γ 1 α 2 16 1 γ 1 1 s k + α 2 16 1 γ 1 k + α 2 > 0 , p M B S * p M B * = 14 k s 1 γ 1 α 2 16 1 γ 1 1 s k + α 2 16 1 γ 1 k + α 2 > 0 , b M B S * b M B * = 8 k s 1 γ 1 α 2 16 1 γ 1 1 s k + α 2 16 1 γ 1 k + α 2 > 0 , l M B S * l M B * = 16 k s α 1 γ 1 16 1 γ 1 1 s k + α 2 16 1 γ 1 k + α 2 > 0 , D M B S * D M B * = 2 k s 1 γ 1 α 2 16 1 γ 1 1 s k + α 2 16 1 γ 1 k + α 2 > 0 ;
(ii)
w R B S * w R B * = 24 k s 1 γ 1 α 2 32 1 γ 2 1 s k + α 2 32 1 γ 2 k + α 2 > 0 , p R B S * p R B * = 28 k s 1 γ 1 α 2 32 1 γ 2 1 s k + α 2 32 1 γ 2 k + α 2 > 0 , b R B S * b R B * = 16 k s 1 γ 1 α 2 32 1 γ 2 1 s k + α 2 32 1 γ 2 k + α 2 > 0 , l R B S * l R B * = 32 k s α 1 γ 1 32 1 γ 2 1 s k + α 2 32 1 γ 2 k + α 2 > 0 , D R B S * D R B * = 4 k s 1 γ 1 α 2 32 1 γ 2 1 s k + α 2 32 1 γ 2 k + α 2 > 0 .

Appendix A.5. Proof of Proposition 3

(i) π M M B * π M N * = 16 1 γ 1 θ 1 4 k θ α 2 8 ( 16 1 γ 1 k α 2 ) .
When k = a 2 16 ( 1 γ 1 ) , 16 1 γ 1 θ 1 4 k θ α 2 = α 2 4 < 0 .
If θ < 1 4 , π M M B * π M N * > 0 (i.e., π M M B * > π M N * ).
If θ > 1 4 ,there exists k 1 = α 2 θ 4 ( 1 γ 1 ) ( 4 θ 1 ) which makes when a 2 16 ( 1 γ 1 ) < k < α 2 θ 4 ( 1 γ 1 ) ( 4 θ 1 ) , π M M B * π M N * > 0 (i.e., π M M B * > π M N * ) and when k > α 2 θ 4 ( 1 γ 1 ) ( 4 θ 1 ) , π M M B * π M N * < 0 (i.e., π M M B * < π M N * );
(ii) π R M B * π R N * = 256 1 γ 1 2 θ 1 4 k 2 + 32 α 2 θ 1 γ 1 k θ α 4 16 ( 16 γ 1 1 k + α 2 ) 2 .
When k = a 2 16 ( 1 γ 1 ) , 256 1 γ 1 2 θ 1 4 k 2 + 32 α 2 θ 1 γ 1 k θ α 4 = α 2 4 > 0 .
If θ < 1 4 , π R M B * π R N * > 0 (i.e., π R M B * > π R N * ).
If θ > 1 4 , there exists k 2 = ( 2 θ + θ ) α 2 8 ( 1 γ 1 ) ( 4 θ 1 ) which makes when k a 2 16 ( 1 γ 1 ) < ( 2 θ + θ ) α 2 8 ( 1 γ 1 ) ( 4 θ 1 ) , π R M B * π R N * > 0 (i.e., π R M B * > π R N * ) and when k > ( 2 θ + θ ) α 2 8 ( 1 γ 1 ) ( 4 θ 1 ) , π R M B * π R N * < 0 (i.e., π R M B * < π R N * ).

Appendix A.6. Proof of Proposition 4

(i) π M R B * π M N * = 1024 θ 1 4 1 γ 2 2 k 2 + 64 θ 1 γ 2 α 2 k θ α 2 8 ( 32 γ 2 1 k + α 2 ) 2 .
When k = a 2 32 ( 1 γ 2 ) , 1024 θ 1 4 1 γ 2 2 k 2 + 64 θ 1 γ 2 α 2 k θ α 2 = α 2 4 > 0 .
If θ < 1 4 , π M R B * π M N * > 0 (i.e., π M R B * > π M N * ).
If θ > 1 4 , there exists k 3 = ( 2 θ + θ ) α 2 16 ( 1 γ 2 ) ( 4 θ 1 ) which makes when a 2 32 ( 1 γ 2 ) < k < ( 2 θ + θ ) α 2 16 ( 1 γ 2 ) ( 4 θ 1 ) , π M R B * π M N * > 0 (i.e., π M R B * > π M N * ) and when k > ( 2 θ + θ ) α 2 16 ( 1 γ 2 ) ( 4 θ 1 ) , π M R B * π M N * < 0 (i.e., π M R B * < π M N * );
(ii) π R M B * π R N * = 32 1 γ 2 θ 1 4 k θ α 2 16 ( 32 γ 2 1 k + α 2 ) .
When k = a 2 32 ( 1 γ 2 ) , 32 1 γ 2 θ 1 4 k θ α 2 = α 2 4 < 0 .
If θ < 1 4 , π R R B * π M N * > 0 (i.e., π R R B * > π R N * ).
If θ > 1 4 , there exists k 4 = α 2 θ 8 ( 1 γ 2 ) ( 4 θ 1 ) which makes when a 2 32 ( 1 γ 2 ) < k < α 2 θ 8 ( 1 γ 2 ) ( 4 θ 1 ) , π R R B * π R N * > 0 (i.e., π R R B * > π R N * ) and when k > α 2 θ 8 ( 1 γ 2 ) ( 4 θ 1 ) , π R R B * π R N * < 0 (i.e., π R R B * < π R N * ).

Appendix A.7. Proof of Proposition 5

(i) π M R B * π M M B * = 32 k 2 ( 1 γ 2 ) 2 ( 32 k 1 γ 2 α 2 ) 2 k 1 γ 1 32 k 1 γ 1 2 α 2 = k α 2 ( 64 1 γ 2 γ 2 γ 1 k α 2 ( 1 γ 1 ) ) ( 32 k 1 γ 2 α 2 ) 2 ( 32 k 1 γ 1 2 α 2 )
We assume d k = 64 1 γ 2 γ 2 γ 1 k α 2 ( 1 γ 1 ) .
If γ 2 γ 1 < 0 (i.e., γ 1 > γ 2 ), d k < 0 . We can obtain π M R B * π M M B * < 0 (i.e., π M R B * < π M M B * ).
If γ 2 γ 1 > 0 (i.e., γ 1 < γ 2 ), we have k > a 2 16 ( 1 γ 1 ) or k > a 2 32 ( 1 γ 2 ) . If k = a 2 16 ( 1 γ 1 ) , d k = a 2 1 2 γ 2 + γ 1 2 1 γ 1 < 0 . If k = a 2 32 ( 1 γ 2 )   d k = a 2 1 2 γ 2 + γ 1 . Therefore, when 1 2 γ 2 + γ 1 > 0 (i.e., γ 1 > 2 γ 2 1 ), we can obtain there exist a threshold k 5 = ( 1 γ 1 ) a 2 64 ( 1 γ 2 ) ( γ 2 γ 1 ) such that π M R B * π M M B * < 0 , when k < k 5 and π M R B * π M M B * > 0 , when k > k 5 . When 1 2 γ 2 + γ 1 < 0 (i.e., γ 1 < 2 γ 2 1 ), π M R B * π M M B * > 0 .
We can obtain (1) if γ 1 > γ 2 , π M R B * < π M M B * ; (2) if 2 γ 2 1 < γ 1 < γ 2 , there exists a threshold k 5 . When k < k 5 , π M R B * < π M M B * and when k > k 5   π M R B * > π M M B * ; (3) if γ 1 < 2 γ 2 1 , π M R B * > π M M B * ;
(ii) π R R B * π R M B * = k 1 γ 2 64 k 1 γ 2 2 α 2 4 k 2 ( 1 γ 1 ) 2 ( 16 k 1 γ 1 α 2 ) 2 = k α 2 ( 8 1 γ 1 γ 1 4 γ 2 + 3 k α 2 ( 1 γ 2 ) ) ( 16 k 1 γ 1 α 2 ) 2 ( 64 k 1 γ 2 2 α 2 )
We assume z k = 8 1 γ 1 γ 1 4 γ 2 + 3 k α 2 ( 1 γ 2 ) .
If γ 1 4 γ 2 + 3 < 0 (i.e., γ 2 > γ 1 + 3 4 ), z k < 0 . We can obtain π R R B * π R M B * > 0 .
If γ 1 4 γ 2 + 3 > 0 (i.e., γ 2 < γ 1 + 3 4 ), we have k > a 2 16 ( 1 γ 1 ) or k > a 2 32 ( 1 γ 2 ) . If k = a 2 16 ( 1 γ 1 )   z k = a 2 1 2 γ 2 + γ 1 2 .If k = a 2 32 ( 1 γ 2 )   z k = a 2 1 2 γ 2 + γ 1 2 ( 1 γ 2 ) < 0 . Therefore, when 1 2 γ 2 + γ 1 < 0 (i.e., γ 2 > γ 1 + 1 2 ), there exist a threshold k 6 = ( 1 γ 2 ) a 2 8 ( 1 γ 1 ) ( γ 1 4 γ 2 + 3 ) such that π R R B * > π R M B * , when k < k 6 and π R R B * < π R M B * , when k > k 6 . When 1 2 γ 2 + γ 1 > 0 (i.e., γ 2 < γ 1 + 1 2 ), π R R B * π R M B * < 0 .
We can obtain (1) if γ 2 < γ 1 + 1 2 , and π R R B * < π R M B * ; (2) if γ 1 + 1 2 < γ 2 < γ 1 + 3 4 , there exists a threshold k 6 .
When k < k 6 , π R R B * > π R M B * ,   and when k > k 6 , π R R B * < π R M B * ; (3) if γ 2 > γ 1 + 3 4 , π R R B * > π R M B * .

Appendix A.8. Proof of Proposition 6

(i) π M M B S * π M M B * = k s 1 γ 1 α 2 32 1 γ 1 1 s k + 2 α 2 16 1 + γ 1 k + α 2 > 0 ;
(ii) π R M B S * π R M B * = 4 s α 2 k 2 1 γ 1 2 32 1 γ 1 1 s k + s 2 α 2 16 1 γ 1 1 s k + α 2 2 16 1 + γ 1 k + α 2 2 > 0
a 2 16 ( 1 γ 1 ) a 2 16 1 γ 1 1 s = a 2 s 16 1 γ 1 1 s < 0 . We have k > a 2 16 1 γ 1 1 s . When k = a 2 16 1 γ 1 1 s , 32 1 γ 1 1 s k + s 2 α 2 = a 2 s > 0 ;
(iii) π B M B S * π B M B * = s k α 2 1280 4 5 γ 1 1 s 1 γ 1 2 k 2 + 32 α 2 1 γ 1 2 s 2 k + γ 1 α 4 2 16 1 γ 1 1 s k + α 2 2 16 1 + γ 1 k + α 2 2 .
When k = a 2 16 1 γ 1 1 s , 1280 4 5 γ 1 1 s 1 γ 1 2 k 2 + 32 α 2 1 γ 1 2 s 2 k + γ 1 α 4 = a 4 s ( 3 γ 1 2 ) s 1 .
If 0 < γ 1 < 2 3 , we can obtain 1280 4 5 γ 1 1 s 1 γ 1 2 k 2 + 32 α 2 1 γ 1 2 s 2 k + γ 1 α 4 > 0 , which means π B M B S * π B M B * > 0 (i.e., π B M B S * > π B M B * ).
If 2 3 < γ 1 < 4 5 , there exits k 7 ; according to which, when a 2 16 1 γ 1 1 s < k < k 7 , π B M B S * < π B M B * , and when k > k 7 , π B M B S * > π B M B * .
If 4 5 < γ 1 < 1 , we can obtain 1280 4 5 γ 1 1 s 1 γ 1 2 k 2 + 32 α 2 1 γ 1 2 s 2 k + γ 1 α 4 < 0 , which means π B M B S * π B M B * < 0 (i.e., π B M B S * < π B M B * ).

Appendix A.9. Proof of Proposition 7

(i) π M R B S * π M R B * = 32 s α 2 k 2 1 γ 2 2 64 1 γ 2 1 s k + s 2 α 2 32 1 γ 2 1 s k + α 2 2 32 1 + γ 2 k + α 2 2 > 0 .
a 2 32 ( 1 γ 2 ) a 2 32 1 γ 2 1 s = a 2 s 32 1 γ 2 1 s < 0 . We have k > a 2 32 1 γ 2 1 s . When k = a 2 32 1 γ 2 1 s , 3264 1 γ 2 1 s k + s 2 α 2 = a 2 s > 0 ;
(ii) π R R B S * π R R B * = k s 1 γ 2 α 2 2 32 1 γ 2 1 s k + 2 α 2 32 1 + γ 2 k + α 2 > 0 ;
(iii) π B R B S * π B R B * = s k α 2 9216 8 9 γ 2 1 s 1 γ 2 2 k 2 + 128 α 2 1 γ 2 2 s 2 k + γ 2 α 4 2 32 1 γ 2 1 s k + α 2 2 32 1 + γ 2 k + α 2 2 .
When k = a 2 32 1 γ 2 1 s , 9216 8 9 γ 2 1 s 1 γ 2 2 k 2 + 128 α 2 1 γ 2 2 s 2 k + γ 2 α 4 = a 4 s ( 5 γ 2 4 ) s 1 .
If 0 < γ 2 < 4 5 , we can obtain 9216 8 9 γ 2 1 s 1 γ 2 2 k 2 + 128 α 2 1 γ 2 2 s 2 k + γ 2 α 4 > 0 , which means π B R B S * π B R B * > 0 (i.e., π B R B S * > π B R B * ).
If 4 5 < γ 2 < 8 9 , there exits k 8 ; according to which, when a 2 32 1 γ 2 1 s < k < k 8 , π B R B S * < π B R B * , and when k > k 8 , π B R B S * > π B R B * .
If 8 9 < γ 2 < 1 , we have 9216 8 9 γ 2 1 s 1 γ 2 2 k 2 + 128 α 2 1 γ 2 2 s 2 k + γ 2 α 4 < 0 . π B R B S * < π B R B * .

Appendix A.10. Proof of Proposition 8

(i) π M R B S * π M M B * = 32 k 2 ( 1 γ 2 ) 2 ( 1 s ) 2 ( 32 k 1 γ 2 ( 1 s ) α 2 ) 2 k 1 γ 1 32 k 1 γ 1 2 α 2 = k α 2 ( 64 1 γ 2 1 s γ 1 s + 1 + s γ 2 k α 2 ( 1 γ 1 ) ) ( 32 k 1 γ 2 ( 1 s ) α 2 ) 2 ( 32 k 1 γ 1 2 α 2 )
We assume f s = γ 1 s + 1 + s γ 2 = 1 + γ 2 s + γ 1 γ 2 .
If f s > 0 , we can obtain γ 1 γ 2 > 0 (i.e., γ 1 > γ 2 ) and 0 < s < γ 1 γ 2 1 γ 2 . We have 64 1 γ 2 1 s γ 1 s + 1 + s γ 2 k α 2 1 γ 1 < 0 and π M R B S * π M M B * < 0 (i.e., π M R B S * < π M M B * ).
If f ( s ) < 0 , we can obtain two conditions: (1) γ 1 γ 2 < 0 (i.e., γ 1 < γ 2 ); (2) γ 1 γ 2 > 0 (i.e., γ 1 > γ 2 ) and γ 1 γ 2 1 γ 2 < s < 1 .
When k = α 2 16 ( 1 γ 1 ) or k = α 2 32 1 γ 2 1 s , we have 64 1 γ 2 1 s γ 1 s + 1 + s γ 2 k α 2 1 γ 1 = α 2 ( 1 2 γ 2 + γ 1 ) 2 1 γ 1 < 0 or 64 1 γ 2 1 s γ 1 s + 1 + s γ 2 k α 2 1 γ 1 = α 2 2 1 γ 2 s 1 + 2 γ 2 γ 1 . Therefore, if 2 γ 2 γ 1 1 > 0 (i.e., γ 1 < 2 γ 2 1 ), α 2 2 1 γ 2 s 1 + 2 γ 2 γ 1 > 0 . Then, we have π M R B S * π M M B * > 0 . If 2 γ 2 γ 1 1 < 0 (i.e., γ 1 > 2 γ 2 1 ); we can obtain this when 1 2 γ 2 + γ 1 2 1 γ 2 < s < 1 , α 2 2 1 γ 2 s 1 + 2 γ 2 γ 1 > 0 and π M R B S * π M M B * > 0 . When 0 < s < 1 2 γ 2 + γ 1 2 1 γ 2 , α 2 2 1 γ 2 s 1 + 2 γ 2 γ 1 < 0 , and there exists a threshold k 9 = ( 1 γ 1 ) α 2 64 ( 1 s ) ( 1 γ 2 ) ( 1 s γ 2 + s γ 1 ) such that π M R B S * π M M B * < 0 when k < k 9 , and π M R B S * π M M B * > 0 when k > k 9 .
We can obtain the following: (1) if γ 1 < 2 γ 2 1 , π M R B S * > π M M B * ; (2) if γ 1 > 2 γ 2 1 and 1 2 γ 2 + γ 1 2 1 γ 2 < s < 1 , π M R B S * > π M M B * ; (3) if γ 1 > γ 2 , γ 1 γ 2 1 γ 2 < s < 1 2 γ 2 + γ 1 2 1 γ 2 or 2 γ 2 1 < γ 1 < γ 2 , 0 < s < 1 2 γ 2 + γ 1 2 1 γ 2 , and there exists a threshold k 9 that when k < k 9 , π M R B S * < π M M B * , and when k > k 9 , π M R B S * > π M M B * ; (4) if γ 1 > γ 2 and 0 < s < γ 1 γ 2 1 γ 2 , π M R B S * < π M M B * ;
(ii) π R R B S * π R M B * = k 1 γ 2 1 s 64 k 1 γ 2 1 s 2 α 2 4 k 2 1 γ 1 2 ( 16 k 1 γ 1 2 α 2 ) 2 = k α 2 ( 32 1 + γ 1 1 4 γ 1 + 3 4 s + ( 1 + s ) γ 2 k + α 2 ( 1 s ) ( 1 γ 2 ) ) ( 64 k 1 γ 2 1 s 2 α 2 ) ( 16 k 1 γ 1 2 α 2 ) 2
We assume F s = 1 4 γ 1 + 3 4 s + ( 1 + s ) γ 2 = 1 + γ 2 s + 1 4 γ 1 γ 2 + 3 4 .
If F s < 0 , we can obtain (1) γ 2 > 1 4 γ 1 + 3 4 (2) γ 2 < 1 4 γ 1 + 3 4 and 3 4 γ 2 + γ 1 4 1 γ 2 < s < 1 . We can obtain 32 1 + γ 1 1 4 γ 1 + 3 4 s + ( 1 + s ) γ 2 k + α 2 1 s 1 γ 2 > 0 . This means π R R B S * π R M B * > 0 (i.e., π R R B S * > π R M B * ).
If F s > 0 , we can obtain γ 2 < 1 4 γ 1 + 3 4 and 0 < s < 3 4 γ 2 + γ 1 4 1 γ 2 . When k = α 2 16 ( 1 γ 1 ) or k = α 2 32 1 γ 2 1 s , we have 32 1 + γ 1 1 4 γ 1 + 3 4 s + ( 1 + s ) γ 2 k + α 2 1 s 1 γ 2 = α 2 2 1 γ 2 s 1 + 2 γ 2 γ 1 2 or 32 1 + γ 1 1 4 γ 1 + 3 4 s + ( 1 + s ) γ 2 k + α 2 1 s 1 γ 2 = α 2 ( 1 2 γ 2 + γ 1 ) 2 ( 1 γ 2 ) ( 1 s ) > 0 . If α 2 2 1 γ 2 s 1 + 2 γ 2 γ 1 2 > 0 , we can obtain (1) 2 γ 2 γ 1 1 > 0 (i.e., γ 2 > 1 2 γ 1 + 1 2 ); (2) 2 γ 2 γ 1 1 < 0 (i.e., γ 2 < 1 2 γ 1 + 1 2 ) and 1 2 γ 2 + γ 1 2 1 γ 2 < s < 1 . There exists a threshold k 10 = ( 1 γ 2 ) ( 1 s ) α 2 8 ( 1 γ 1 ) ( 4 γ 2 1 s + γ 1 4 γ 2 + 3 ) such that when k < k 10 , π R R B S * π R M B * > 0 (i.e., π R R B S * > π R M B * ), and when k > k 10 , π R R B S * π R M B * < 0 (i.e., π R R B S * < π R M B * ). If α 2 2 1 γ 2 s 1 + 2 γ 2 γ 1 2 < 0 , we can obtain 2 γ 2 γ 1 1 < 0 (i.e., γ 2 < 1 2 γ 1 + 1 2 ) and 0 < s < 1 2 γ 2 + γ 1 2 1 γ 2 . We have π R R B S * π R M B * < 0 (i.e., π R R B S * < π R M B * ).
We can obtain the following: (1) if γ 2 < 1 2 γ 1 + 1 2 and 0 < s < 1 2 γ 2 + γ 1 2 1 γ 2 , π R R B S * < π R M B * ; (2) if 1 2 γ 1 + 1 2 < γ 2 < 1 4 γ 1 + 3 4 , 0 < s < 3 4 γ 2 + γ 1 4 1 γ 2 , or γ 2 < 1 2 γ 1 + 1 2 , 1 2 γ 2 + γ 1 2 1 γ 2 < s < 3 4 γ 2 + γ 1 4 1 γ 2 , and there exists a threshold k 10 such that when k < k 10 , π R R B S * > π R M B * , and when k > k 10 , π R R B S * < π R M B * ; (4) if γ 2 > 1 4 γ 1 + 3 4 , π R R B S * > π R M B * , and (5) if γ 2 < 1 4 γ 1 + 3 4 and 3 4 γ 2 + γ 1 4 1 γ 2 < s < 1 , π R R B S * > π R M B * .

References

  1. Wang, Y.; Lin, J.; Choi, T.-M. Gray market and counterfeiting in supply chains: A review of the operations literature and implications to luxury industries. Transp. Res. Part E Logist. Transp. Rev. 2020, 133, 101823. [Google Scholar] [CrossRef]
  2. Yao, S.; Zhu, K.; Yang, R. Combating counterfeit products: Anti-counterfeiting technology and law enforcement. Prod. Oper. Manag. 2025. [Google Scholar] [CrossRef]
  3. Babich, V.; Hilary, G. OM Forum—Distributed ledgers and operations: What operations management researchers should know about blockchain technology. Manuf. Serv. Oper. Manag. 2020, 22, 223–240. [Google Scholar] [CrossRef]
  4. Dai, H.; Tseng, M.M.; Zipkin, P.H. Design of traceability systems for product recall. Int. J. Prod. Res. 2015, 53, 511–531. [Google Scholar] [CrossRef]
  5. Jin, S.; Zhang, Y.; Xu, Y. Amount of information and the willingness of consumers to pay for food traceability in China. Food Control 2017, 77, 163–170. [Google Scholar] [CrossRef]
  6. Wu, X.Y.; Fan, Z.P.; Cao, B.B. An analysis of strategies for adopting blockchain technology in the fresh product supply chain. Int. J. Prod. Res. 2023, 61, 3717–3734. [Google Scholar] [CrossRef]
  7. Wang, J.; Shi, Y.; Zhao, C.; Venkatesh, V.G.; Chen, W. Impact of pricing leadership on blockchain data acquisition efforts in a circular supply chain. Int. J. Prod. Res. 2023, 61, 7248–7262. [Google Scholar] [CrossRef]
  8. Xu, X.; Chen, J.; Liu, S.; Yu, Y.; Cheng, T.C.E. Should a manufacturer adopt blockchain when its competitor discloses blockchain-enabled product quality information? Int. J. Prod. Res. 2025, 63, 5217–5237. [Google Scholar] [CrossRef]
  9. Šilenskytė, A.; Butkevičienė, J.; Bartminas, A. Blockchain-based connectivity within digital platforms and ecosystems in international business. J. Int. Manag. 2024, 30, 101109. [Google Scholar] [CrossRef]
  10. Nestlé Joins WWF’s OpenSC Blockchain for Sustainable Supply Chains. Available online: https://www.ledgerinsights.com/nestle-wwf-opensc-blockchain-sustainable-supply-chains-food-traceability/ (accessed on 9 July 2025).
  11. Guo, X.; Cheng, L.; Yu, Y. Government subsidy policy for green and efficient raw materials considering farmer heterogeneity. Prod. Oper. Manag. 2022, 31, 4095–4112. [Google Scholar] [CrossRef]
  12. Bian, J.; Zhang, G.; Zhou, G. Manufacturer vs. consumer subsidy with green technology investment and environmental concern. Eur. J. Oper. Res. 2020, 287, 832–843. [Google Scholar] [CrossRef]
  13. Blockchain Funding and Investment. Available online: https://digital-strategy.ec.europa.eu/en/policies/blockchain-funding (accessed on 9 July 2025).
  14. UK Government Invests in TAG TrustNet’s Blockchain Initiative to Make Digital Advertising More Accountable, Responsible and Efficient. Available online: https://www.prnewswire.com/news-releases/uk-government-invests-in-tag-trustnets-blockchain-initiative-to-make-digital-advertising-more-accountable-responsible-and-efficient-301460609.html (accessed on 9 July 2025).
  15. The Blockchain Industry Demonstrates Robust Growth, Emerging as a New Engine for the Development of the Digital Economy. Available online: http://www.xinhuanet.com/tech/20220624/ef94413abefb4893b72447e2bfe453e9/c.html (accessed on 9 July 2025).
  16. Thirty-Three Provinces and Cities in China Have Promulgated Special Blockchain Policies, with Some Regions Offering household Registration (Hukou) and One-Million-Yuan Bonuses as Talent Attraction Incentives. Available online: https://finance.sina.com.cn/blockchain/coin/2021-07-13/doc-ikqcfnca6659392.shtml (accessed on 9 July 2025).
  17. Notice of the Fuzhou Big-Data Development Administration and the Fuzhou Finance Bureau on Issuing Three Measures to Promote the Development of Fuzhou’s Blockchain Industry. Available online: https://sjglj.fuzhou.gov.cn/zwgk/tzgg/202305/t20230511_4601730.htm (accessed on 9 July 2025).
  18. Pun, H.; Swaminathan, J.M.; Hou, P. Blockchain Adoption for Combating Deceptive Counterfeits. Prod. Oper. Manag. 2021, 30, 864–882. [Google Scholar] [CrossRef]
  19. Shen, B.; Dong, C.; Minner, S. Combating copycats in the supply chain with permissioned blockchain technology. Prod. Oper. Manag. 2022, 31, 138–154. [Google Scholar] [CrossRef]
  20. Fang, C.; Chi, M.; Fan, S.; Choi, T.M. Who should invest in blockchain technology under different pricing models in supply chains? Eur. J. Oper. Res. 2024, 319, 777–792. [Google Scholar] [CrossRef]
  21. Lu, L.; Fang, X.; Gao, S.Y.; Kazaz, B. Converting counterfeiters in emerging markets to authorized suppliers: A new anti-counterfeiting measure. Prod. Oper. Manag. 2025. [Google Scholar] [CrossRef]
  22. Cai, Y.J.; Choi, T.M.; Zhang, J. Platform supported supply chain operations in the blockchain era: Supply contracting and moral hazards. Decis. Sci. 2021, 52, 866–892. [Google Scholar] [CrossRef]
  23. Choi, T.-M.; Feng, L.; Li, R. Information disclosure structure in supply chains with rental service platforms in the blockchain technology era. Int. J. Prod. Econ. 2019, 221, 107473. [Google Scholar] [CrossRef]
  24. Zhang, Q.; Li, Y.; Hou, P.; Wang, J. Price signal or blockchain technology? Quality information disclosure in dual-channel supply chains. Eur. J. Oper. Res. 2024, 316, 126–137. [Google Scholar] [CrossRef]
  25. Franke, B.; Fritz, Q.G.; Stenzel, A. The (limited) power of blockchain networks for information provision. Manag. Sci. 2024, 70, 971–990. [Google Scholar] [CrossRef]
  26. Fan, Z.P.; Wu, X.Y.; Cao, B.B. Considering the traceability awareness of consumers: Should the supply chain adopt the blockchain technology? Ann. Oper. Res. 2022, 309, 837–860. [Google Scholar] [CrossRef]
  27. Yang, L.; Ni, Y.; Ng, C.T. Blockchain-enabled traceability and producer’s incentive to outsource delivery. Int. J. Prod. Res. 2023, 61, 3811–3828. [Google Scholar] [CrossRef]
  28. Tan, Y.; Huang, X.; Li, W. Does blockchain-based traceability system guarantee information authenticity? An evolutionary game approach. Int. J. Prod. Econ. 2023, 264, 108974. [Google Scholar] [CrossRef]
  29. Naoum-Sawaya, J.; Elhedhli, S.; De Carvalho, P. Strategic blockchain adoption to deter deceptive counterfeiters. Eur. J. Oper. Res. 2023, 311, 373–386. [Google Scholar] [CrossRef]
  30. Iyengar, G.; Saleh, F.; Sethuraman, J.; Wang, W. Blockchain adoption in a supply chain with manufacturer market power. Manag. Sci. 2024, 70, 6158–6178. [Google Scholar] [CrossRef]
  31. Alizamir, S.; Iravani, F.; Mamani, H. An Analysis of Price vs. Revenue Protection: Government Subsidies in the Agriculture Industry. Manag. Sci. 2019, 65, 32–49. [Google Scholar] [CrossRef]
  32. Chen, Y.H.; Chen, M.X.; Mishra, A.K. Subsidies under uncertainty: Modeling of input-and out-put-oriented policies. Econ. Model. 2020, 85, 39–56. [Google Scholar] [CrossRef]
  33. Fan, T.; Feng, Q.; Li, Y.; Shanthikumar, J.G.; Wu, Y. Output-oriented agricultural subsidy de-sign. Manag. Sci. 2024, 70, 1448–1464. [Google Scholar] [CrossRef]
  34. Joo, H.Y.; Seo, Y.W.; Min, H. Examining the effects of government intervention on the firm’s environ-mental and technological innovation capabilities and export performance. Int. J. Prod. Res. 2018, 56, 6090–6111. [Google Scholar] [CrossRef]
  35. Bigerna, S.; Wen, X.; Hagspiel, V.; Kort, P.M. Green electricity investments: Environmental target and the optimal subsidy. Eur. J. Oper. Res. 2019, 279, 635–644. [Google Scholar] [CrossRef]
  36. Huang, J.; Leng, M.; Liang, L.; Liu, J. Promoting electric automobiles: Supply chain analysis under a government’s subsidy incentive scheme. IIE Trans. 2013, 45, 826–844. [Google Scholar] [CrossRef]
  37. Yu, Y.; Han, X.; Hu, G. Optimal production for manufacturers considering consumer environmental awareness and green subsidies. Int. J. Prod. Econ. 2016, 182, 397–408. [Google Scholar] [CrossRef]
  38. Zolfagharinia, H.; Zangiabadi, M.; Hafezi, M. How much is enough? Government subsidies in supporting green product development. Eur. J. Oper. Res. 2023, 309, 1316–1333. [Google Scholar] [CrossRef]
  39. Jin, W.; Ding, W.; Yang, J. Impact of financial incentives on green manufacturing: Loan guarantee vs. interest subsidy. Eur. J. Oper. Res. 2022, 300, 1067–1080. [Google Scholar] [CrossRef]
  40. Bai, J.; Hu, S.; Gui, L.; So, K.C.; Ma, Z.J. Optimal subsidy schemes and budget allocations for government subsidized trade-in programs. Prod. Oper. Manag. 2021, 30, 2689–2706. [Google Scholar] [CrossRef]
  41. Luo, C.; Leng, M.; Huang, J.; Liang, L. Supply chain analysis under a price-discount incentive scheme for electric vehicles. Eur. J. Oper. Res. 2014, 235, 329–333. [Google Scholar] [CrossRef]
  42. Fan, Z.P.; Cao, Y.; Huang, C.Y.; Li, Y. Pricing strategies of domestic and imported electric vehicle manufacturers and the design of government subsidy and tariff policies. Transp. Res. Part E Logist. Transp. Rev. 2020, 143, 102093. [Google Scholar] [CrossRef]
  43. Rimba, P.; Tran, A.B.; Weber, I.; Staples, M.; Ponomarev, A.; Xu, X. Quantifying the cost of distrust: Comparing blockchain and cloud services for business process execution. Inf. Syst. Front. 2020, 22, 489–507. [Google Scholar] [CrossRef]
  44. Zhong, Y.; Yang, T.; Yu, H.; Zhong, S.; Xie, W. Impacts of blockchain technology with government subsidies on a dual-channel supply chain for tracing product information. Transp. Res. Part E Logist. Transp. Rev. 2023, 171, 103032. [Google Scholar] [CrossRef]
  45. Zhang, F.; Huang, H.; Cao, C.; Tan, Z. Blockchain adoption strategies for combating deficient personal protective equipment in major public health emergencies. Ann. Oper. Res. 2025, 348, 1745–1797. [Google Scholar] [CrossRef]
  46. Xu, J.; Duan, Y. Pricing and greenness investment for green products with government subsidies: When to apply blockchain technology? Electron. Commer. Res. Appl. 2022, 51, 101108. [Google Scholar] [CrossRef]
  47. Yenipazarli, A. Incentives for environmental research and development: Consumer preferences, competitive pressure and emissions taxation. Eur. J. Oper. Res. 2019, 276, 757–769. [Google Scholar] [CrossRef]
  48. Cheng, F.; Chen, T.; Shen, Y.; Jing, X. Impact of green technology improvement and store brand introduction on the sales mode selection. Int. J. Prod. Econ. 2022, 253, 108587. [Google Scholar] [CrossRef]
  49. Tao, F.; Wang, Y.Y.; Zhu, S.H. Impact of blockchain technology on the optimal pricing and quality decisions of platform supply chains. Int. J. Prod. Res. 2023, 61, 3670–3684. [Google Scholar] [CrossRef]
  50. Wu, X.; Xiong, J.; Yan, J.; Wang, Y. Perceived quality of traceability information and its effect on purchase intention towards organic food. J. Mark. Manag. 2021, 37, 1267–1286. [Google Scholar] [CrossRef]
  51. Top 20 Supply Chain Startups That Are Using Blockchain Technology. Available online: https://fortunescrown.com/top-20-supply-chain-startups-that-are-using-blockchain-technology/ (accessed on 9 July 2025).
  52. Choi, T.M. Blockchain-technology-supported platforms for diamond authentication and certification in luxury supply chains. Transp. Res. Part E Logist. Transp. Rev. 2019, 128, 17–29. [Google Scholar] [CrossRef]
  53. Blockchain in Retail Industry: Benefits and Use Cases. Available online: https://www.bitdegree.org/crypto/tutorials/blockchain-in-retail (accessed on 9 July 2025).
  54. Blockchains in Supply Chain Management: A Deeper Look (Part 1). Available online: https://themerkle.com/blockchains-in-supply-chain-management-a-deeper-look-part-1/ (accessed on 9 July 2025).
  55. Choi, T.M.; Luo, S. Data quality challenges for sustainable fashion supply chain operations in emerging markets: Roles of blockchain, government sponsors and environment taxes. Transp. Res. Part E Logist. Transp. Rev. 2019, 131, 139–152. [Google Scholar] [CrossRef]
  56. Blockchain Development Cost in 2025: Comprehensive Guide. Available online: https://clutch.co/developers/blockchain/pricing (accessed on 9 July 2025).
  57. Cao, Y.; Shen, B. Adopting blockchain technology to block less sustainable products’ entry in global trade. Transp. Res. Part E Logist. Transp. Rev. 2022, 161, 102695. [Google Scholar] [CrossRef]
  58. Exploring Government Funding for Blockchain: Driving Innovation and Transformation. Available online: https://dev.to/vitalisorenko/exploring-government-funding-for-blockchain-driving-innovation-and-transformation-4ica (accessed on 9 July 2025).
  59. Blockchain for Food: 10 Examples to Know. Available online: https://builtin.com/blockchain/food-safety-supply-chain (accessed on 9 July 2025).
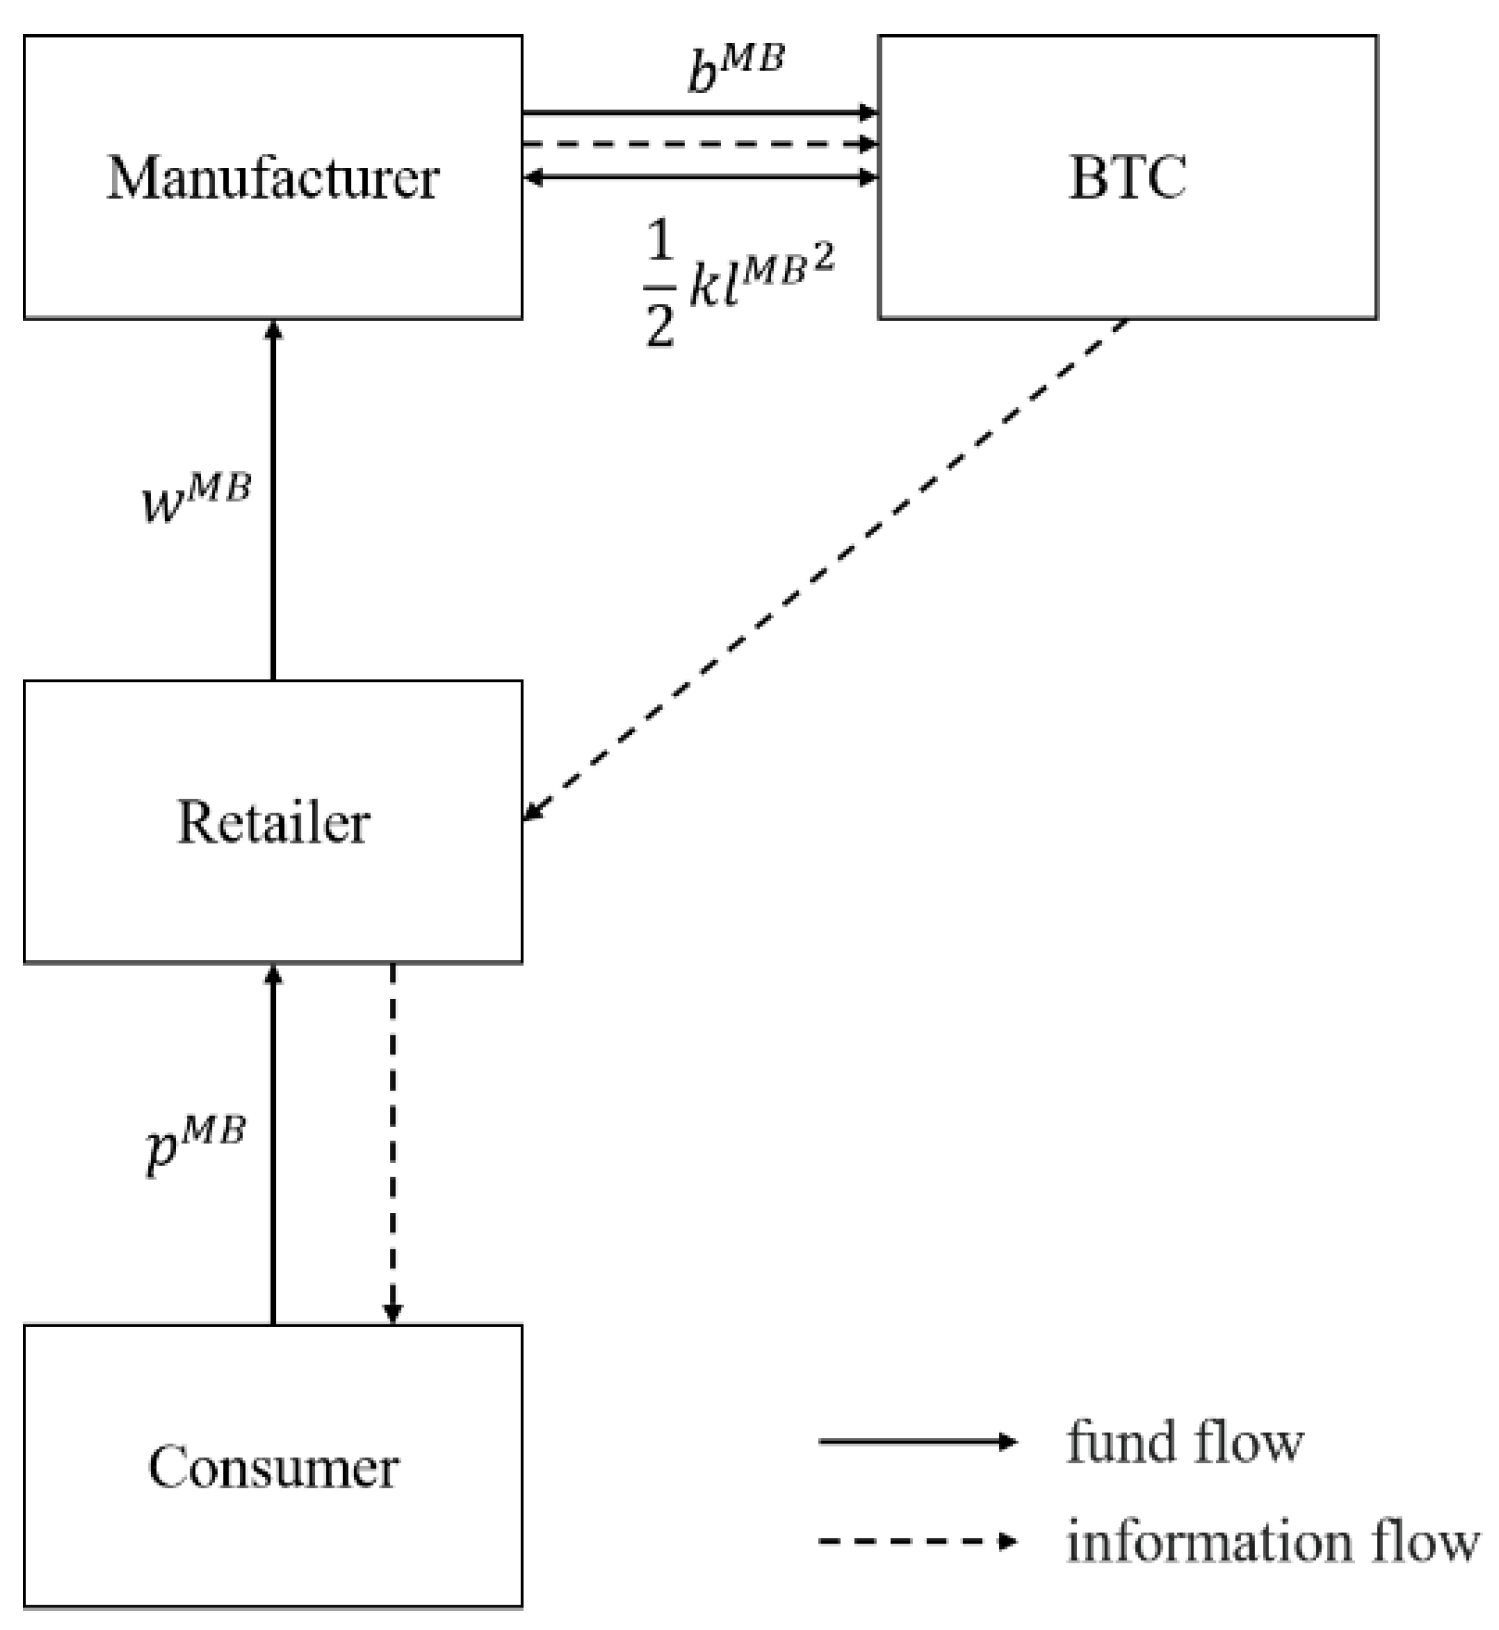
Figure 1. The supply chain structure of M B .
Systems 13 00931 g001
Figure 2. The supply chain structure of R B .
Systems 13 00931 g002
Figure 3. Optimal choices of manufacturer and retailer change with γ 1 and γ 2 without subsidies: (a) optimal choice of manufacturer; (b) optimal choice of retailer.
Systems 13 00931 g003
Figure 4. Manufacturer’s/retailer’s profit changes with k under Scenarios MB and RB: (a) the profit of manufacturer; (b) the profit of retailer. “*”represents the profit under equilibrium conditions.
Systems 13 00931 g004
Figure 5. Optimal choices of manufacturer and retailer change with γ 1 ( γ 2 ) and s with subsidies: (a) optimal choice of manufacturer; (b) optimal choice of retailer.
Systems 13 00931 g005
Table 1. Main notations and description.
Main NotationsDescriptions
i Superscripts for different scenarios, i { N , M B , R B , M B S , R B S }
c Manufacturer’s unit product production cost, c ( 0,1 )
v The perceived value of consumers; it follows uniform distribution in [ 0 , 1 ]
θ Consumers’ acceptance degree for products, θ [ 0 , 1 ]
α The consumer’s sensitivity of product’s blockchain traceability level, α > 0
l The product’s blockchain traceability level (decision variable)
k The cost coefficient of blockchain construction, k > 0
b i The unit licensing fee of adopting of blockchain technology (decision variable)
γ 1 , γ 2 The proportion of blockchain construction costs undertaken by BTC, γ 1,2 [ 0 , 1 ]
s Government subsidy ratio for blockchain technology
p n i The retail price of products (decision variable)
w n i The wholesale price of products (decision variable)
U i The utility of consumers when purchasing the products
D i The demand of products
π n i The profit of supply chain members
Table 2. The equilibrium decisions of Scenarios N, MB, and RB.
ScenarioWholesale PriceSelling PriceProduct Traceability LevelLicensing Fee
of Blockchain
N θ / 2 3 θ / 4
M B 12 k ( 1 γ 1 ) 16 k 1 γ 1 α 2 14 k ( 1 γ 1 ) 16 k 1 γ 1 α 2 a 16 k 1 γ 1 α 2 8 k ( 1 γ 1 ) 16 k 1 γ 1 α 2
R B 24 k ( 1 γ 2 ) 32 k 1 γ 2 α 2 28 k ( 1 γ 2 ) 32 k 1 γ 2 α 2 a 32 k 1 γ 2 α 2 16 k ( 1 γ 2 ) 32 k 1 γ 2 α 2
Table 3. The equilibrium demand and profits of Scenarios N, MB, and RB.
ScenarioDemandManufacturer’s ProfitRetailer’s ProfitBTC’s Profit
N 1 / 4 θ / 8 θ / 16
M B 2 k ( 1 γ 1 ) 16 k 1 γ 1 α 2 k ( 1 γ 1 ) 32 k 1 γ 1 2 α 2 4 k 2 1 γ 1 2 ( 16 k 1 γ 1 2 α 2 ) 2 k ( 32 k ( 1 γ 1 ) 2 γ 1 α 2 ) 2 ( 16 k 1 γ 1 + α 2 ) 2
R B 4 k ( 1 γ 2 ) 32 k 1 γ 2 α 2 32 k 2 ( 1 γ 2 ) 2 ( 32 k 1 γ 2 α 2 ) 2 k 1 γ 2 64 k 1 γ 2 2 α 2 k ( 128 k ( 1 γ 2 ) 2 γ 2 α 2 ) 2 ( 32 k 1 γ 2 + α 2 ) 2
Table 4. The equilibrium decisions of Scenarios MBS and RBS.
ScenarioWholesale PriceSelling PriceProduct Traceability LevelLicensing Fee
of Blockchain
M B S 12 k ( 1 γ 1 ) ( 1 s ) 16 k 1 γ 1 ( 1 s ) α 2 14 k ( 1 γ 1 ) ( 1 s ) 16 k 1 γ 1 ( 1 s ) α 2 α 16 k 1 γ 1 ( 1 s ) α 2 8 k ( 1 γ 1 ) ( 1 s ) 16 k 1 γ 1 ( 1 s ) α 2
R B S 24 k ( 1 γ 2 ) ( 1 s ) 32 k 1 γ 2 ( 1 s ) α 2 28 k ( 1 γ 2 ) ( 1 s ) 32 k 1 γ 2 ( 1 s ) α 2 α 32 k 1 γ 2 ( 1 s ) α 2 16 k ( 1 γ 2 ) ( 1 s ) 32 k 1 γ 2 ( 1 s ) α 2
Note: The equilibrium decisions of Scenario MBS are restricted by the constraints k > α 2 16 ( 1 γ 1 ) ( 1 s ) , and those of scenario RB are restricted by k > α 2 32 ( 1 γ 2 ) ( 1 s ) .
Table 5. The equilibrium demands and profits of Scenarios MBS and RBS.
ScenarioDemandManufacturer’s ProfitRetailer’s ProfitBTC’s Profit
M B S 2 k ( 1 γ 1 ) ( 1 s ) 16 k 1 γ 1 ( 1 s ) α 2 k ( 1 γ 1 ) ( 1 s ) 32 k 1 γ 1 ( 1 s ) 2 α 2 4 k 1 γ 1 2 ( 1 s ) 2 ( 16 k 1 γ 1 ( 1 s ) α 2 ) 2 k ( 1 s ) ( 32 k ( 1 γ 1 ) 2 ( 1 s ) γ 1 α 2 ) 2 ( 16 k 1 γ 1 1 s α 2 ) 2
R B S 4 k ( 1 γ 2 ) ( 1 s ) 32 k 1 γ 2 ( 1 s ) α 2 32 k 2 ( 1 γ 2 ) 2 ( 1 s ) 2 ( 32 k 1 γ 2 ( 1 s ) α 2 ) 2 k 1 γ 2 ( 1 s ) 64 k 1 γ 2 ( 1 s ) 2 α 2 k ( 1 s ) ( 128 k ( 1 s ) ( 1 γ 2 ) 2 γ 2 α 2 ) 2 ( 32 k 1 γ 2 1 s α 2 ) 2
Table 6. The equilibrium profits of Scenarios N, MB, and RB when considering the production cost.
ScenarioManufacturer’s ProfitRetailer’s ProfitBTC’s Profit
N ( c θ ) 2 / 8 θ ( c θ ) 2 / 16 θ \
M B k ( 1 γ 1 ) ( c 1 ) 2 32 k 1 γ 1 2 α 2 4 k 2 1 γ 1 2 ( c 1 ) 2 ( 16 k 1 γ 1 2 α 2 ) 2 k ( 32 k ( 1 γ 1 ) 2 γ 1 α 2 ) ( c 1 ) 2 2 ( 16 k 1 γ 1 α 2 ) 2
R B 32 k 2 ( 1 γ 2 ) 2 ( c 1 ) 2 ( 32 k 1 γ 2 α 2 ) 2 k 1 γ 2 ( c 1 ) 2 64 k 1 γ 2 2 α 2 k ( 128 k ( 1 γ 2 ) 2 γ 2 α 2 ) ( c 1 ) 2 2 ( 32 k 1 γ 2 α 2 ) 2
Table 7. The equilibrium profits of Scenarios MBS and RBS when considering the production cost.
ScenarioManufacturer’s ProfitRetailer’s ProfitBTC’s Profit
M B S k ( 1 γ 1 ) ( 1 s ) ( c 1 ) 2 32 k 1 γ 1 ( 1 s ) 2 α 2 4 k 1 γ 1 2 ( 1 s ) 2 ( c 1 ) 2 ( 16 k 1 γ 1 ( 1 s ) α 2 ) 2 k ( 1 s ) ( 32 k ( 1 γ 1 ) 2 ( 1 s ) γ 1 α 2 ) ( c 1 ) 2 2 ( 16 k 1 γ 1 1 s α 2 ) 2
R B S 32 k 2 ( 1 γ 2 ) 2 ( 1 s ) 2 ( c 1 ) 2 ( 32 k 1 γ 2 ( 1 s ) α 2 ) 2 k 1 γ 2 ( 1 s ) ( c 1 ) 2 64 k 1 γ 2 ( 1 s ) 2 α 2 k ( 1 s ) ( 128 k ( 1 s ) ( 1 γ 2 ) 2 γ 2 α 2 ) ( c 1 ) 2 2 ( 32 k 1 γ 2 1 s α 2 ) 2
Disclaimer/Publisher’s Note: The statements, opinions and data contained in all publications are solely those of the individual author(s) and contributor(s) and not of MDPI and/or the editor(s). MDPI and/or the editor(s) disclaim responsibility for any injury to people or property resulting from any ideas, methods, instructions or products referred to in the content.