Article

China’s Energy Risk Spillover Networks Under Major Events and External Uncertainty Shocks: An Analysis Based on LASSO-VAR-DY and TVP-SV-VAR Models

1
School of Economics and Management, Nanjing Tech University, Nanjing 211816, China
2
School of Economics and Management, University of Chinese Academy of Sciences, Beijing 100190, China
*
Author to whom correspondence should be addressed.
These authors contributed equally to this work. They are co-first authors.
Systems 2025, 13(11), 1037; https://doi.org/10.3390/systems13111037
Submission received: 13 September 2025 / Revised: 17 November 2025 / Accepted: 18 November 2025 / Published: 19 November 2025
(This article belongs to the Section Systems Practice in Social Science)

Abstract

Major events and external uncertainty shocks have made energy risk connectedness increasingly complex. This paper applies a LASSO-regularized VAR combined with the Diebold-Yilmaz connectedness framework (LASSO-VAR-DY) to trace how China’s energy risk spillover effects evolve under major event shocks and to quantify sectoral risk spillover inflows. We then employ a TVP-SV-VAR model to further examine the impulse responses of energy sectors to external uncertainties. The results show that the energy system exhibits a high overall level of risk connectedness with pronounced stage-wise variation and is sensitive to different external uncertainty shocks. Major-event shocks intensify sector-level risk connectedness—the clean-energy sector consistently acts as a net risk receiver. In contrast, other sectors switch between net transmitters and net receivers across shocks. Different major events operate through heterogeneous mechanisms—the COVID-19 pandemic and the official launch of the national carbon market primarily strengthen node-to-node connectedness. In contrast, the Russia-Ukraine conflict chiefly amplifies spillover intensity between nodes. The effects of uncertainty index shocks differ markedly: economic policy uncertainty (EPU) has the most substantial impact, followed by climate policy uncertainty (CPU), while geopolitical risk (GPR) is the weakest.

1. Introduction

Global energy systems are accelerating toward a low-carbon transition. This transition is driving multidimensional transformations—technological innovation, market restructuring, and shifts in energy demand composition—while tightening the linkages and interactions among energy firms [1,2,3,4]. At the same time, the increasing frequency of major disruptive events—such as the global COVID-19 pandemic, escalating geopolitical conflicts, and heightened uncertainty over energy policy—has persistently jolted firms’ individual operating conditions and the networks connecting them, thereby markedly strengthening co-movement across the energy-firm cohort. As a leading global energy consumer and emitter of carbon, China is a pivotal player in the global energy landscape [5,6]. Against this backdrop, a systematic investigation of the mechanisms of risk connectedness among Chinese energy firms—and of the dynamic evolution of their risk connectedness under major events and external uncertainty shocks—has substantial theoretical significance for deepening our understanding of the complex relational logic of the energy system during the transition.
Scholars have sought to unpack the energy system’s complex interdependencies from multiple vantage points. Existing work can be grouped into three dimensions: first, the macro level, which reveals spillover effects across national energy markets at the global scale [7,8,9]. For example, Wang et al. [7] use a spillover index based on TVP-VAR together with wavelet coherence analysis to study price-volatility spillovers between global energy markets and China’s energy market. Second, the meso-level, which examines spillovers across energy submarkets within the energy market itself [10,11,12,13]. For instance, in Zhang and Chen [13], a DCC-GARCH approach is applied to evaluate volatility and evolving correlations between crude oil, renewable energy, and aggregate commodities. Third, the micro level, which identifies firm-level risk spillovers among energy firms [14,15]. For example, Chen et al. [15] apply exponential quantile regression and a tail-risk spillover model to construct a dynamic network of tail-risk transmission among China’s petroleum and petrochemical firms. However, existing studies lack a systematic comparison and integrated analysis of the linkages across the macro, meso, and micro levels, making it difficult to comprehensively depict the overall risk transmission process within the energy system. Consequently, the interactive effects and heterogeneous characteristics of risk spillovers across different levels remain to be further explored. To address this gap, we measure the inter-firm risk connectedness using the LASSO-VAR-DY framework and then extend the analysis to the industry and system levels, yielding a multi-layer “system-industry-firm” analytical framework. This constitutes the first contribution of the paper.
External uncertainty shocks to the energy system have increasingly become a focal concern in the literature. The research can be grouped into three strands: firstly, studies that rely on a single uncertainty index [16,17,18,19]. For example, An et al. [18] construct a DAGM-CPU model from a dual-domain perspective to uncover the dual asymmetric features of climate policy uncertainty—driven risk spillovers in China’s energy markets. Additionally, analyze energy risk connectedness under the interaction of multiple uncertainty indices [20,21,22], as seen in Dong et al. [20], who employ a quantile vector autoregression to assess how extreme weather and policy uncertainty shape spillovers; and thirdly, event-based approaches [23,24,25,26], exemplified by Jia and Dong [23], who use TVP-VAR-DY and TVP-SVAR-SV models, and partition COVID-19 into four phases, examine phase-specific spillover effects and determinants for clean-energy stocks. However, most studies treat indices and events in isolation rather than within a unified framework. To bridge this gap, we select representative events within the sample period to trace the evolution of internal risk connectedness in the energy system, develop a dual-track qualitative-quantitative research design, and further analyze how heterogeneity in sectors’ net risk-receiving positions conditions their impulse responses to uncertainty indices; together, these elements constitute the paper’s second contribution.
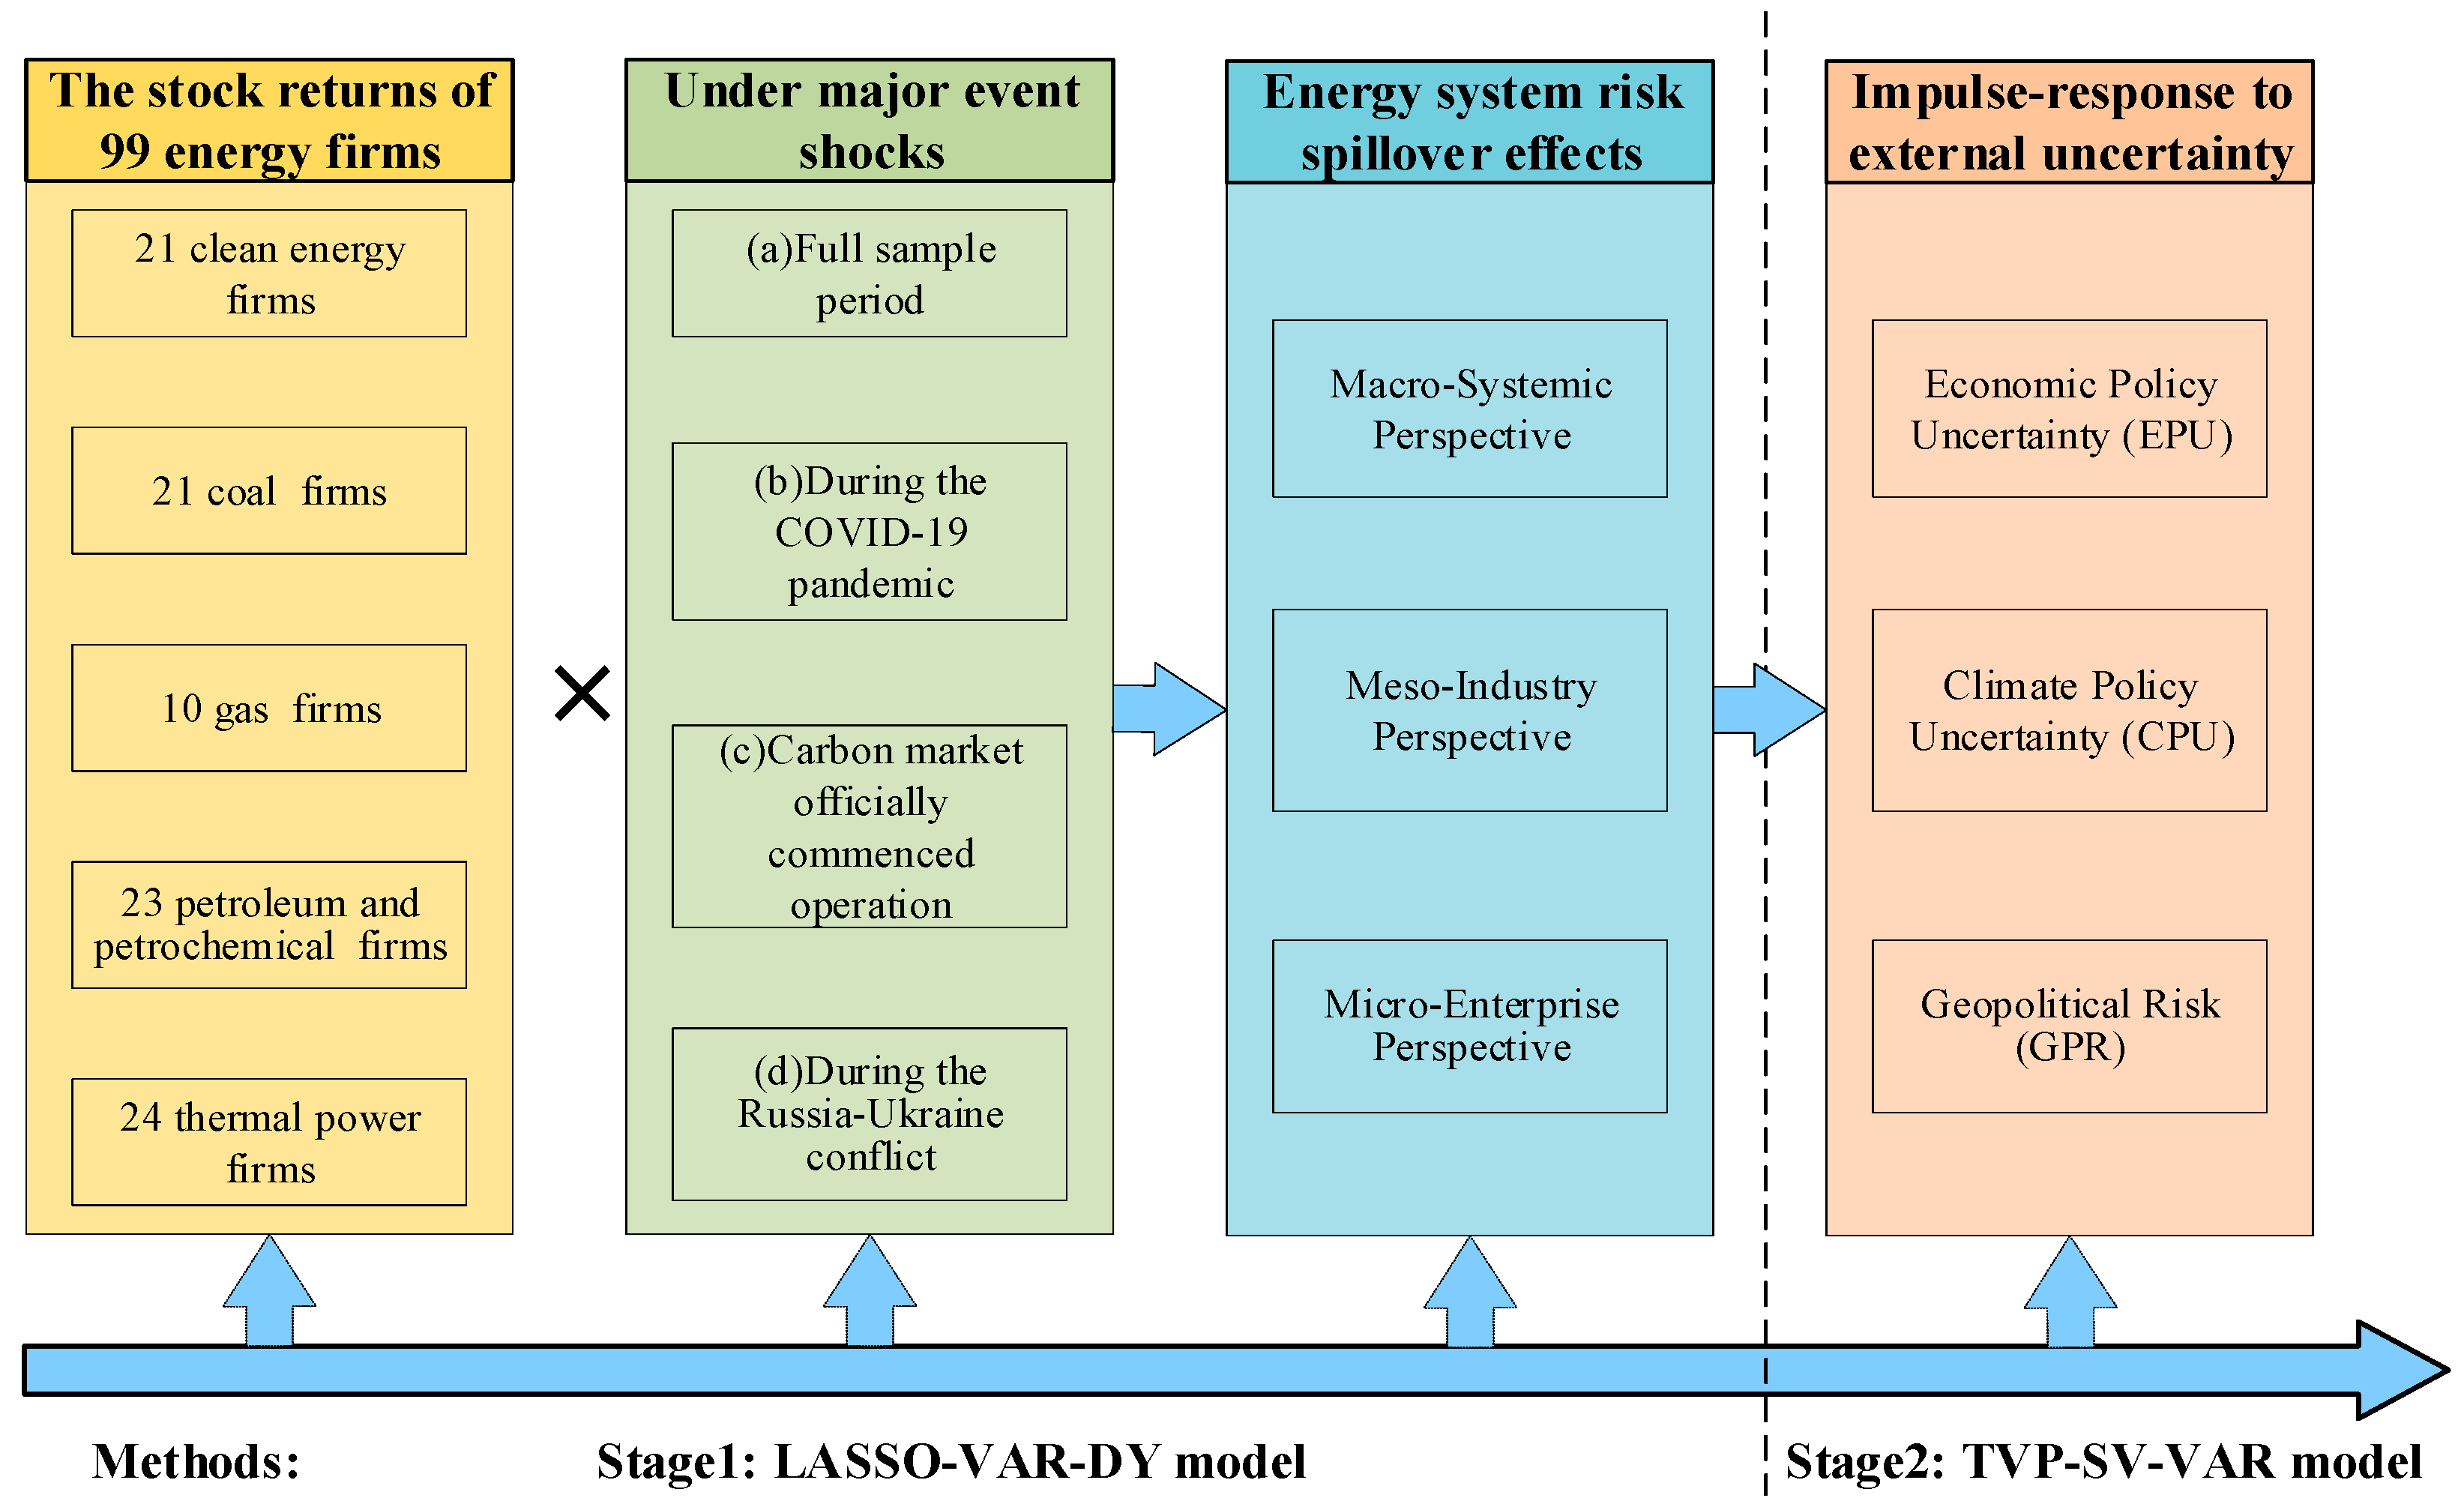
Taken together, this paper first employs the LASSO-VAR-DY approach to investigate the risk connectedness among 99 listed energy firms. Using multiple major events as the analytical framework, it identifies the dynamic changes in the energy system’s risk connectedness under event shocks. Further, it generalizes these effects to the industry level for analysis. Finally, we incorporate economic policy uncertainty (EPU), climate policy uncertainty (CPU), and geopolitical risk (GPR) as external uncertainty shocks and analyze the impulse responses of sectoral net risk-spillover inflows to these uncertainties (the research framework is shown in Figure 1). The potential contributions of this paper are threefold: (1) It extends the existing literature, which has primarily analyzed energy risk interconnections from single dimensions such as the market or the firm, leading to a fragmented understanding of the overall energy system. This study advances the analysis from the firm level to the industry level and constructs a multi-level comprehensive analytical framework of “system-industry-firm,” thereby providing a holistic view of energy risk spillover effects across multiple layers. (2) It qualitatively investigates the linkage mechanisms of the energy system under external uncertainty shocks and further conducts quantitative analysis based on major events and uncertainty indices, establishing a dual-track “qualitative-quantitative” research framework. This approach offers deeper insights into the dynamic evolution of energy system risk connectivity under external uncertainty shocks. (3) It yields several novel and policy-relevant findings: different major events affect inter-firm risk connectedness through heterogeneous mechanisms—the global COVID-19 pandemic and official launch of the national carbon market primarily intensify node-to-node connectedness, whereas the Russia-Ukraine conflict mainly amplifies spillover intensity between nodes. In addition, the effects of uncertainty index shocks differ markedly: economic policy uncertainty (EPU) has the most substantial impact, followed by climate policy uncertainty (CPU), while geopolitical risk (GPR) is the weakest.
This paper has six sections. After the introduction, Section 2 discusses the mechanisms and theoretical analysis; Section 3 presents the methodology; Section 4 analyzes the risk connectedness under major-event shocks; Section 5 examines impulse responses under uncertainty shocks; Section 6 concludes.

2. Mechanism and Theoretical Analysis

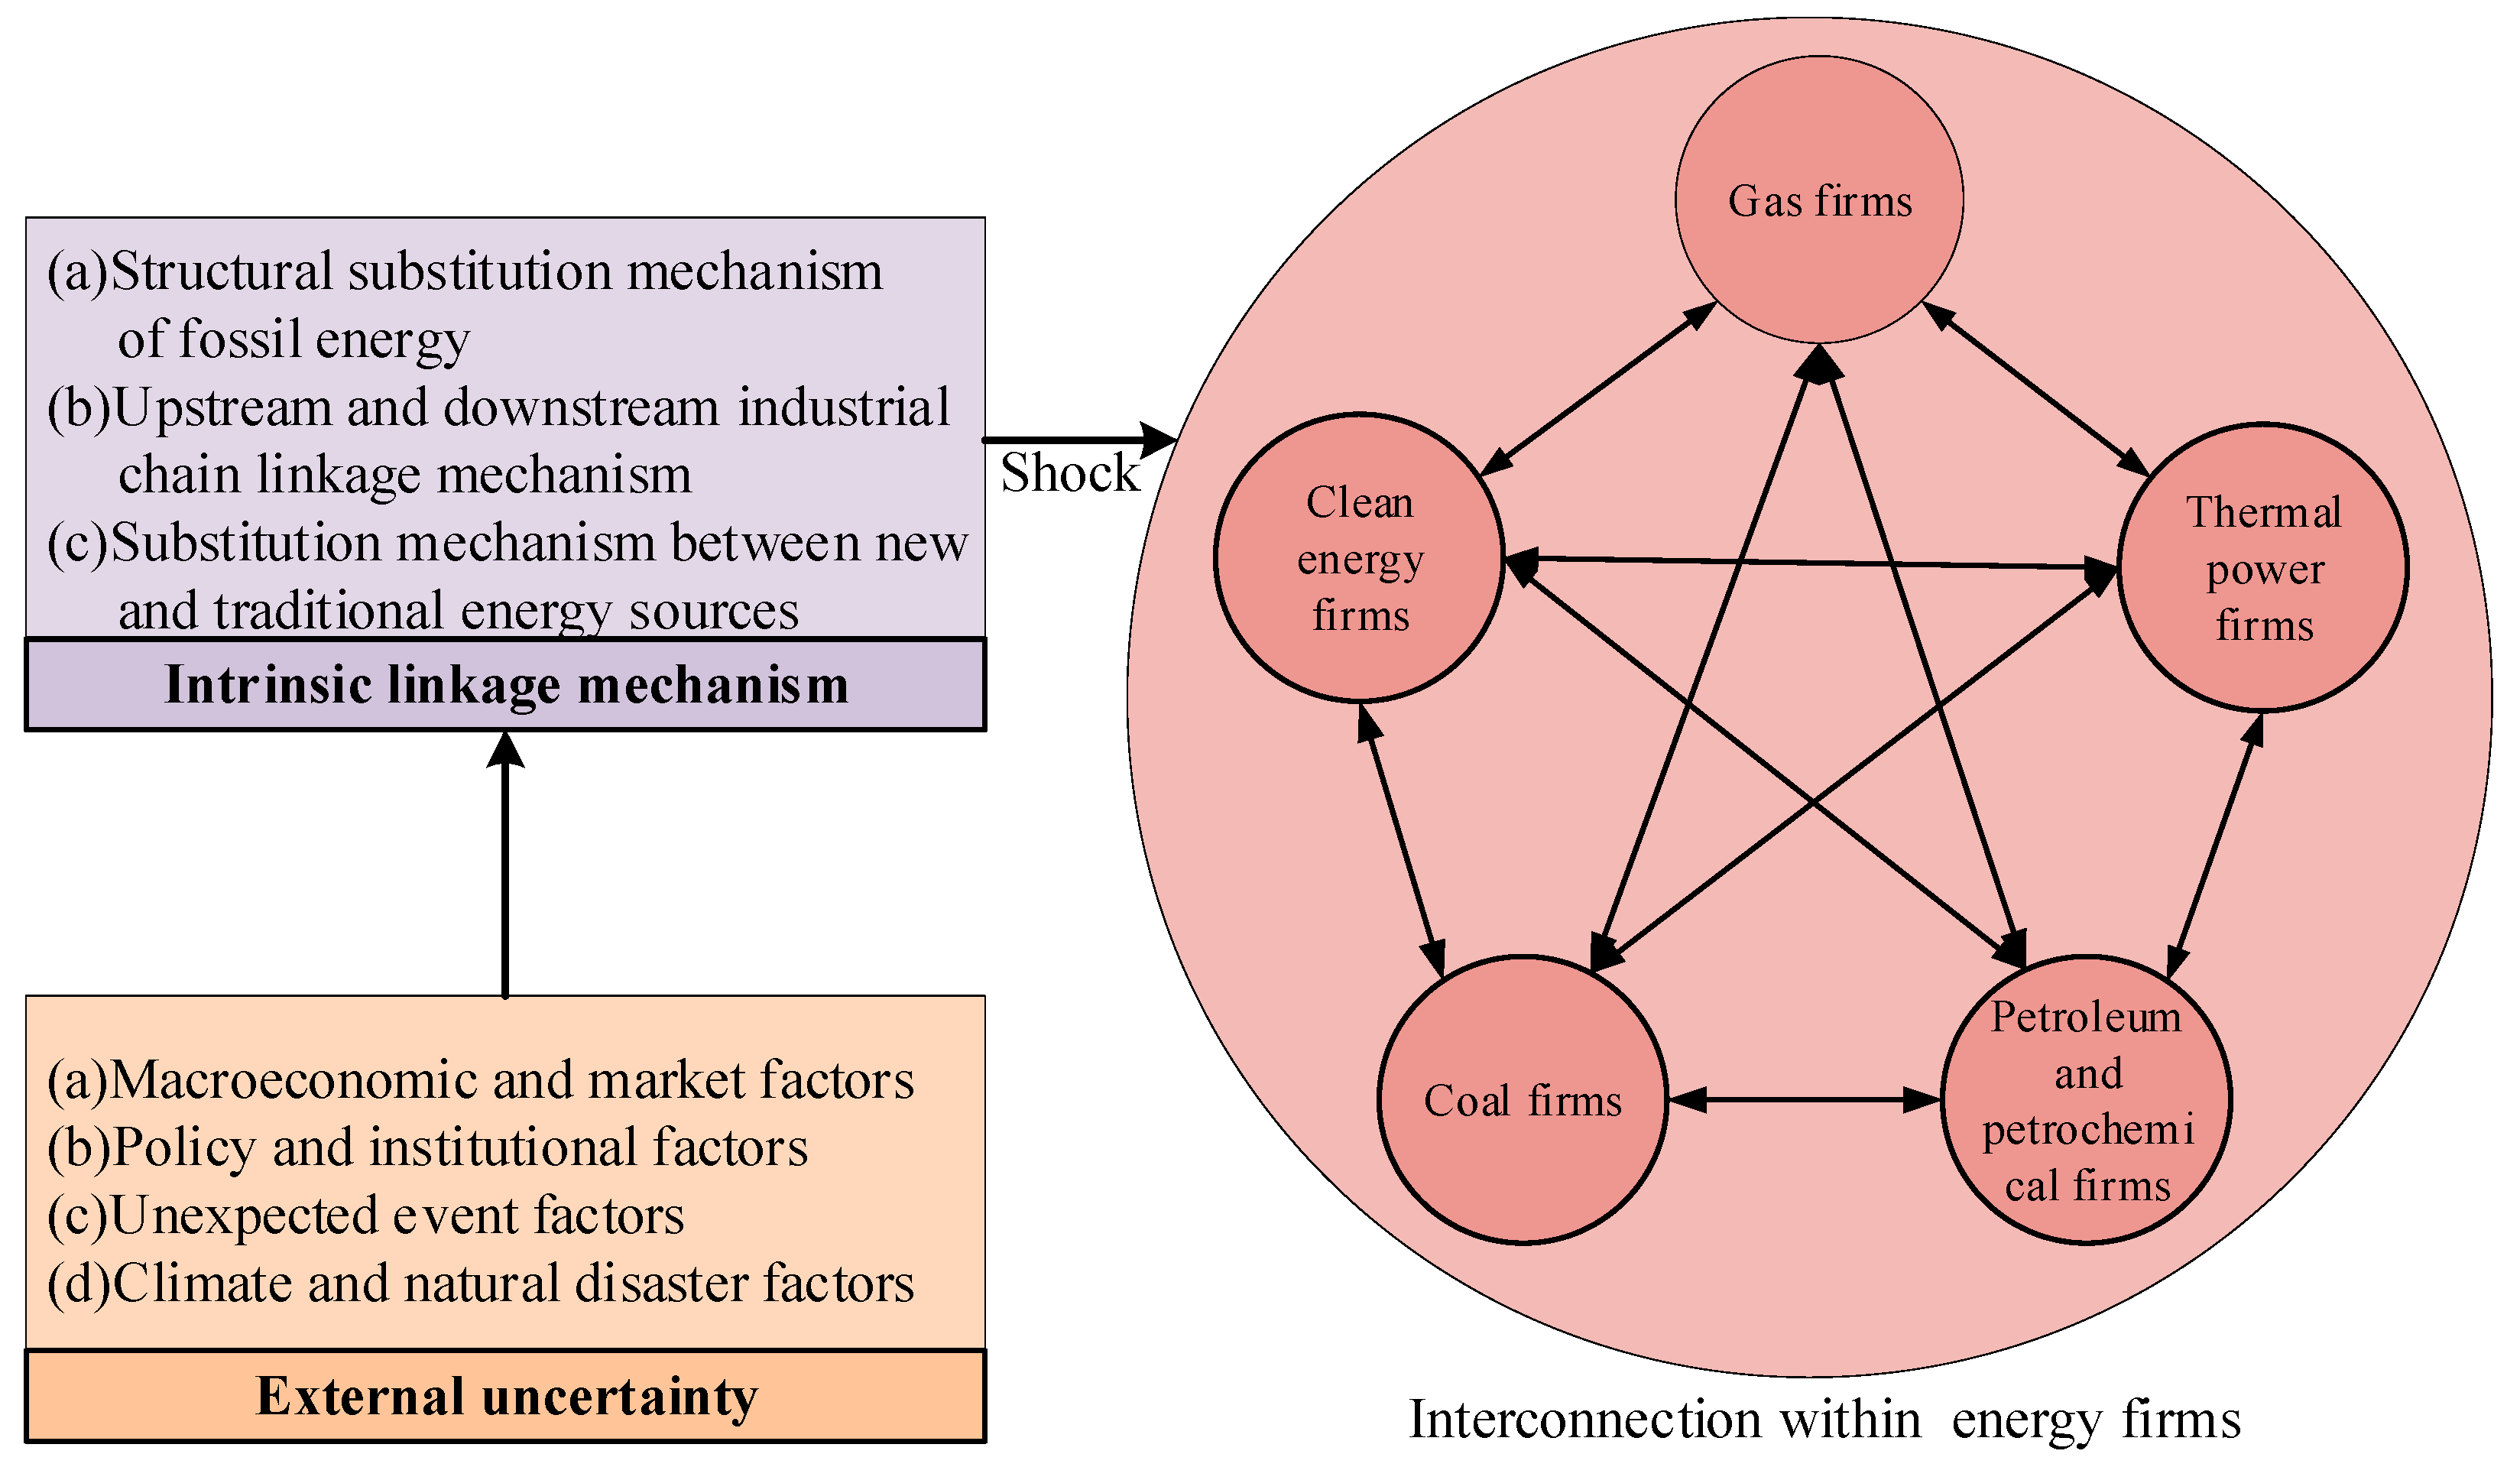
The energy system is a complex structure composed of multiple types of energy firms, diverse energy forms, and various transmission channels, characterized by a typical multi-layer coupling pattern [27,28]. These elements are interwoven across multiple channels, including energy industry chains, energy markets, and government policies. This section systematically analyzes the intrinsic linkage mechanisms within the energy system and the impact mechanisms of external uncertainty shocks on risk spillovers among energy firms, thereby providing theoretical support for the subsequent empirical analysis. The impact mechanisms are illustrated in Figure 2.

2.1. Intrinsic Mechanisms of Energy-System Interconnectedness

Within the energy system, various types of firms are interconnected through the structural substitution mechanism of fossil energy, the upstream–downstream industrial chain linkage mechanism, and the substitution mechanism between traditional and new energy sources, forming a complex network of relationships that intensifies risk spillovers among energy firms [29,30]. Firstly, the fossil energy structural substitution mechanism. At this stage, constrained by China’s resource endowment of “abundant coal, scarce oil, and limited gas,” the national energy structure remains coal-dominated. Compared with coal, oil, and natural gas, they are cleaner fossil fuels. Thus, substitution occurs within fossil fuels themselves, as natural gas replaces petroleum and oil replaces coal. This internal substitution strengthens the interconnections among gas, coal, and oil-petrochemical firms. Secondly, the upstream-downstream industrial chain linkage mechanism. As an upstream sector, the coal industry supplies key inputs for thermal power generation, forming a “coal-power” core chain. Consequently, fluctuations in coal prices or supply volumes are directly transmitted along the industrial chain to downstream firms. With the ongoing energy transition, oil and gas have also become important inputs for thermal power generation, further tightening the relationships among oil-petrochemical, gas, and thermal power firms. Thirdly, the substitution mechanism between traditional and new energy sources. Energy substitution drives the continual evolution of the energy system. Under China’s dual-carbon goals, the system is transitioning toward low-carbon development, with clean energy firms forming a fundamental substitution relationship with thermal power firms—renewables such as wind, solar, and hydropower directly erode coal-fired generation’s market share. Moreover, the electrification of transportation and industry accelerates the substitution of electricity for oil, gas, and coal.

2.2. Mechanisms of Energy-System Interconnectedness Under External Uncertainty Shocks

In addition to the intrinsic linkages within the energy system, external uncertainty factors also influence the interconnections among energy enterprises. These external factors can be categorized into four types. First, macroeconomic and market factors. Expansionary monetary or fiscal policies help clean energy firms accelerate infrastructure construction and technological research and development, thereby speeding up the substitution of clean energy for traditional fossil energy [31]. Energy market prices also affect the interconnections among energy enterprises [32,33]. For instance, when international oil prices rise, the prices of refined oil products from oil and petrochemical companies increase, generating spillover effects that drive up the prices of other energy sources such as natural gas and coal. Second, policy and institutional factors. Policies directly shape the energy landscape. Strict environmental policies significantly increase production costs for high-energy-consuming enterprises such as thermal power plants, encouraging clean energy and gas companies to accelerate the substitution of traditional fossil energy. Meanwhile, subsidy policies or preferential tax measures directly enhance the market competitiveness of clean energy firms, speeding up the replacement of thermal power enterprises [34]. Third, unexpected event factors. The current energy market is highly susceptible to unexpected events [9]. For example, wars or international sanctions involving major oil-producing countries can cause drastic fluctuations in global oil and gas prices, even leading to supply disruptions. This forces oil, petrochemical, and gas firms to seek alternative sources at sharply increased costs. Downstream thermal power enterprises may be compelled to rely more heavily on coal, temporarily strengthening their linkages with coal companies. Fourth, climate and natural disaster factors. Extreme weather events affect energy production, particularly clean energy, which tends to be more vulnerable to such conditions. For instance, extreme heat can hinder hydropower generation, while typhoons may disrupt photovoltaic power generation, necessitating increased output from thermal power enterprises. At the same time, global climate warming promotes the low-carbon transition of the energy system, directly fostering the development of clean energy firms while constraining the capacity expansion of fossil energy enterprises.

3. Research Methodology

3.1. Construction of the LASSO-VAR-DY Model

Define a k dimensional time series { x t R k } t = 1 T of length T that follows the process VAR p as having the following form:
x t = i = 1 p Φ i x t i + ε t
where Φ i is a k × k dimensional coefficient matrix, ε t ( 0 , ) denotes a k × 1 dimensional error vector, and denotes the variance—covariance matrix of ε t . The number of parameters to be estimated increases quadratically with the number of endogenous variables; therefore, when the model includes many variables, using ordinary least squares can lead to degrees-of-freedom problems and, in turn, inaccurate parameter estimates.
To address the non-estimability of VAR models caused by high-dimensional data, this paper uses the LASSO method to estimate model parameters. LASSO introduces a regularization penalty that shrinks coefficients, setting smaller ones exactly to zero, thereby achieving variable selection. Following [35], we apply LASSO to estimate high-dimensional VAR models. The matrix representation of the LASSO-VAR model’s estimating equation is:
min { X Φ Z F 2 + λ Φ 1 }
where X = ( x 1 , x 2 x T ) , denotes k × T dimensional matrices composed of all observations of the k dimensional time series { x t } across all periods, Φ = ( Φ 1 Φ 2 Φ p ) , denotes k × k p dimensional parameter matrices to be estimated. Define z t = ( x t 1 T x t 2 T x t P T ) T ; then Z = ( z 1 z 2 z T ) denotes a k p × T dimensional matrix consisting of all lagged values of the matrix X . λ is the penalty parameter that controls the degree of shrinkage on the coefficients—the larger its value, the greater the shrinkage of the regression coefficients, the fewer the model’s degrees of freedom, and the simpler its form. As [35] notes, a grid depth of λ max 25 and a length of 10 are generally sufficient for stable estimation in the grid search of the LASSO penalty parameter λ. We compute a decreasing grid of λ values via a grid search and use rolling cross-validation to select the optimal λ .
Building on this, ref. [36] proposed the LASSO-VAR-DY model and estimated the connectedness of the global banking network. Following that approach, this paper constructs the risk spillover network of Chinese energy firms using a generalized forecast-error variance decomposition. The VAR p process in Equation (1) can be written equivalently as the following moving-average representation:
x t = i = 0 A i ε t i
where A i is a k × k dimensional parameter matrix, and A i = Φ 1 A i 1 + Φ 2 A i 2 + + Φ p A i p , A 0 denotes the k × k dimensional identity matrix. The generalized forecast-error variance of variable j attributable to variable i at horizon H is:
θ i j g ( H ) = σ j j 1 h = 0 H 1 [ ( e i ) A h e j ] 2 h = 0 H 1 [ ( e i ) A h ( A h ) e j ]
where σ j j is the element in the j row and j column; e i and e j respectively denote vectors whose i and j elements are one and all others are zero. θ i j g ( H ) represents the spillover effect from institution j to institution i . To ensure comparability, the results are normalized, yielding Equation (5) as follows:
θ ˜ i j g ( H ) = θ i j ( H ) j = 1 N θ i j ( H )
Drawing on [37], define the risk spillover received by the institution i and the risk spillover transmitted to all other institutions, respectively, as:
C i H = j = 1 j i N θ ˜ i j g ( H ) N
C i H = j = 1 j i N θ ˜ j i g ( H ) N
Equation (6) represents the risk spillover received by the firm i , which measures its level of external risk exposure. Equation (7) represents the risk spillover transmitted by the firm i , which measures its ability to transfer risk outward.
Define the overall level of risk connectedness among energy firms as:
C H = i , j = 1 i j N θ ˜ i j g ( H ) N
Equation (8) represents the average level of risk spillover in the entire energy system.
At this point, the net spillover index can be expressed as:
C i H = C i H C i H
Equation (9) represents the net risk spillover level received by firm i . C i H > 0 indicates that the firm’s outward risk spillover exceeds its inward risk exposure, and vice versa.
The above spillover indices reflect risk spillovers at the firm level. Following [38], we further process the firm-level risk inflow and outflow values to obtain each firm’s cross-industry risk inflow and outflow. The specific calculation is as follows:
C i j , j A H = j A θ ˜ i j g ( H ) j A i = 1 N θ ˜ j i g ( H )
C j i , j A H = j A θ ˜ j i g ( H ) j A i = 1 N θ ˜ j i g ( H )
where A denotes the sector to which i belongs. Equation (10) represents the risk spillover received by the firm i from outside its own sector, measuring its exposure to cross-sector risks. Equation (11) represents the risk spillover transmitted by firm i to other sectors, measuring its ability to transfer risks across sectors.
To further analyze the risk spillover network connectedness at the industry level, for each pair of industries, we compute the simple arithmetic mean of the pairwise direct connectedness indices across all firm pairs spanning the two industries, and take this mean as the measure of inter-industry connectedness:
C A B H = j B i A θ ˜ i j g ( H ) [ i A j = 1 N θ ˜ i j g ( H ) ] × [ i B j = 1 N θ ˜ i j g ( H ) ]
Equation (12) represents the risk spillover from sector B to sector A; therefore, the net inter-sector risk spillover is:
C A B H = C A B H C B A H
C A B H > 0 indicates that the risk spillover from sector B to sector A is greater than that from sector A to sector B.

3.2. Construction of the TVP-SV-VAR Model

The basic VAR model is specified as in Equation (14):
A y t = F 1 y t 1 + + F s y t s + μ t , t = s + 1 , , n
where y t denotes a k × 1 dimensional vector; A , F 1 , …, F s are all k × k dimensional coefficient matrices; μ t is an k × 1 dimensional structural shock term, assuming μ t N ( 0 , ) . Moreover, σ 1 0 0 σ k , the triangular matrix under structural shocks is A = 1 0 0 a 21 1 0 a k 1 a k 2 1 . At this point, Equation (14) can be rewritten as follows:
y t = B 1 y t 1 + + B s y t s + A 1 ε t
where ε t N ( 0 , I k ) , B i = A 1 F i , i = 1 , , s . Stacking B i to form a k 2 s × 1 dimensional vector and defining X t = I k ( y t 1 , , y t s ) , is Kronecker products, Equation (15) can be further written as a TVP-SV-VAR model with time-varying coefficients:
y t = X t β t + + A t 1 t ε t , t = s + 1 , , n
When the parameters β t , A t , and t in Equation (16) vary over time, following [39], the elements of the lower-triangular matrix A t are re-stacked into a vector a t = ( a 21 , , a k , k 1 ) . Let h t = ( h 1 t , , h k t ) denote the matrix of log stochastic volatilities, where h j t = log σ j t 2 , j = 1 , , k , and t = s + 1 , , n . In the TVP-SV-VAR model, all parameters follow random-walk processes, i.e.,:
β t + 1 = β t + μ β t
α t + 1 = α t + μ α t
h t + 1 = h t + μ h t
ε t μ β t μ α t μ h t N 0 , I 0 0 0 0 β 0 0 0 0 α 0 0 0 0 h
where β t + 1 N ( μ β 0 , β 0 ) , α t + 1 N ( μ α 0 , α 0 ) , h t + 1 N ( μ h 0 , h 0 ) . Assume that the shocks to the time-varying parameters are mutually uncorrelated.

4. Risk Spillover Network Connectedness of China’s Energy System Under Major-Event Shocks

4.1. Firms Data Selection and Processing

To systematically examine risk spillover network connectedness at both the firm and industry levels in China’s energy sector, we select listed companies in coal, Petroleum and Petrochemicals, and, within utilities, the electric power and natural gas industries according to the Shenwan industry classification. To further distinguish thermal from clean-energy generation, the power sector is split into a thermal-power industry and a clean-energy industry. Data on listed energy firms were obtained from the CSMAR database. First, ST and *ST firms were excluded to avoid potential distortions arising from price fluctuation limits, financial abnormalities, or delisting risks. The suspension standard follows the stock exchange announcements, with a suspension day defined as a trading day on which a firm has no recorded transaction price or trading volume. Firms experiencing trading suspensions of fewer than 20 consecutive trading days during the sample period were retained [40]. To investigate how major events affect risk connectedness, we take COVID-19, the official launch of the national carbon market, and the Russia-Ukraine conflict as the focal events and set the sample period from January 2018 to December 2024; the sample period is set from 2018 to 2024 mainly because many gas firms were listed around 2017. A longer sample period would yield too few valid gas firm samples, while a shorter one would yield insufficient observations, making it challenging to capture spillover network dynamics during major events at key time points. Accordingly, energy firms listed after 2018 have been dropped. The final sample comprises 99 energy firms, with their distribution reported in Table 1.

4.2. Energy Risk Connectedness Under Major-Event Shocks

Following [15,41,42], we use the listed firms’ weekly closing prices to compute weekly log returns, given by R t = ln P t ln P t 1 , where P t and P t 1 denote the closing prices at time t and the previous week, respectively; we then perform ADF tests on the log returns of the 99 energy firms. The results show that all series are stationary, and most firms’ log returns exhibit leptokurtic, heavy-tailed characteristics. To capture the dynamic evolution of inter-firm risk connectedness, we employ a rolling-regression approach to construct the risk spillover network connectedness for each trading day. Following [43], the rolling window is set to 26 weeks, corresponding to a half-year trading cycle, and the forecast horizon is set to 2 weeks.

4.2.1. Overall Risk Connectedness of the Energy System

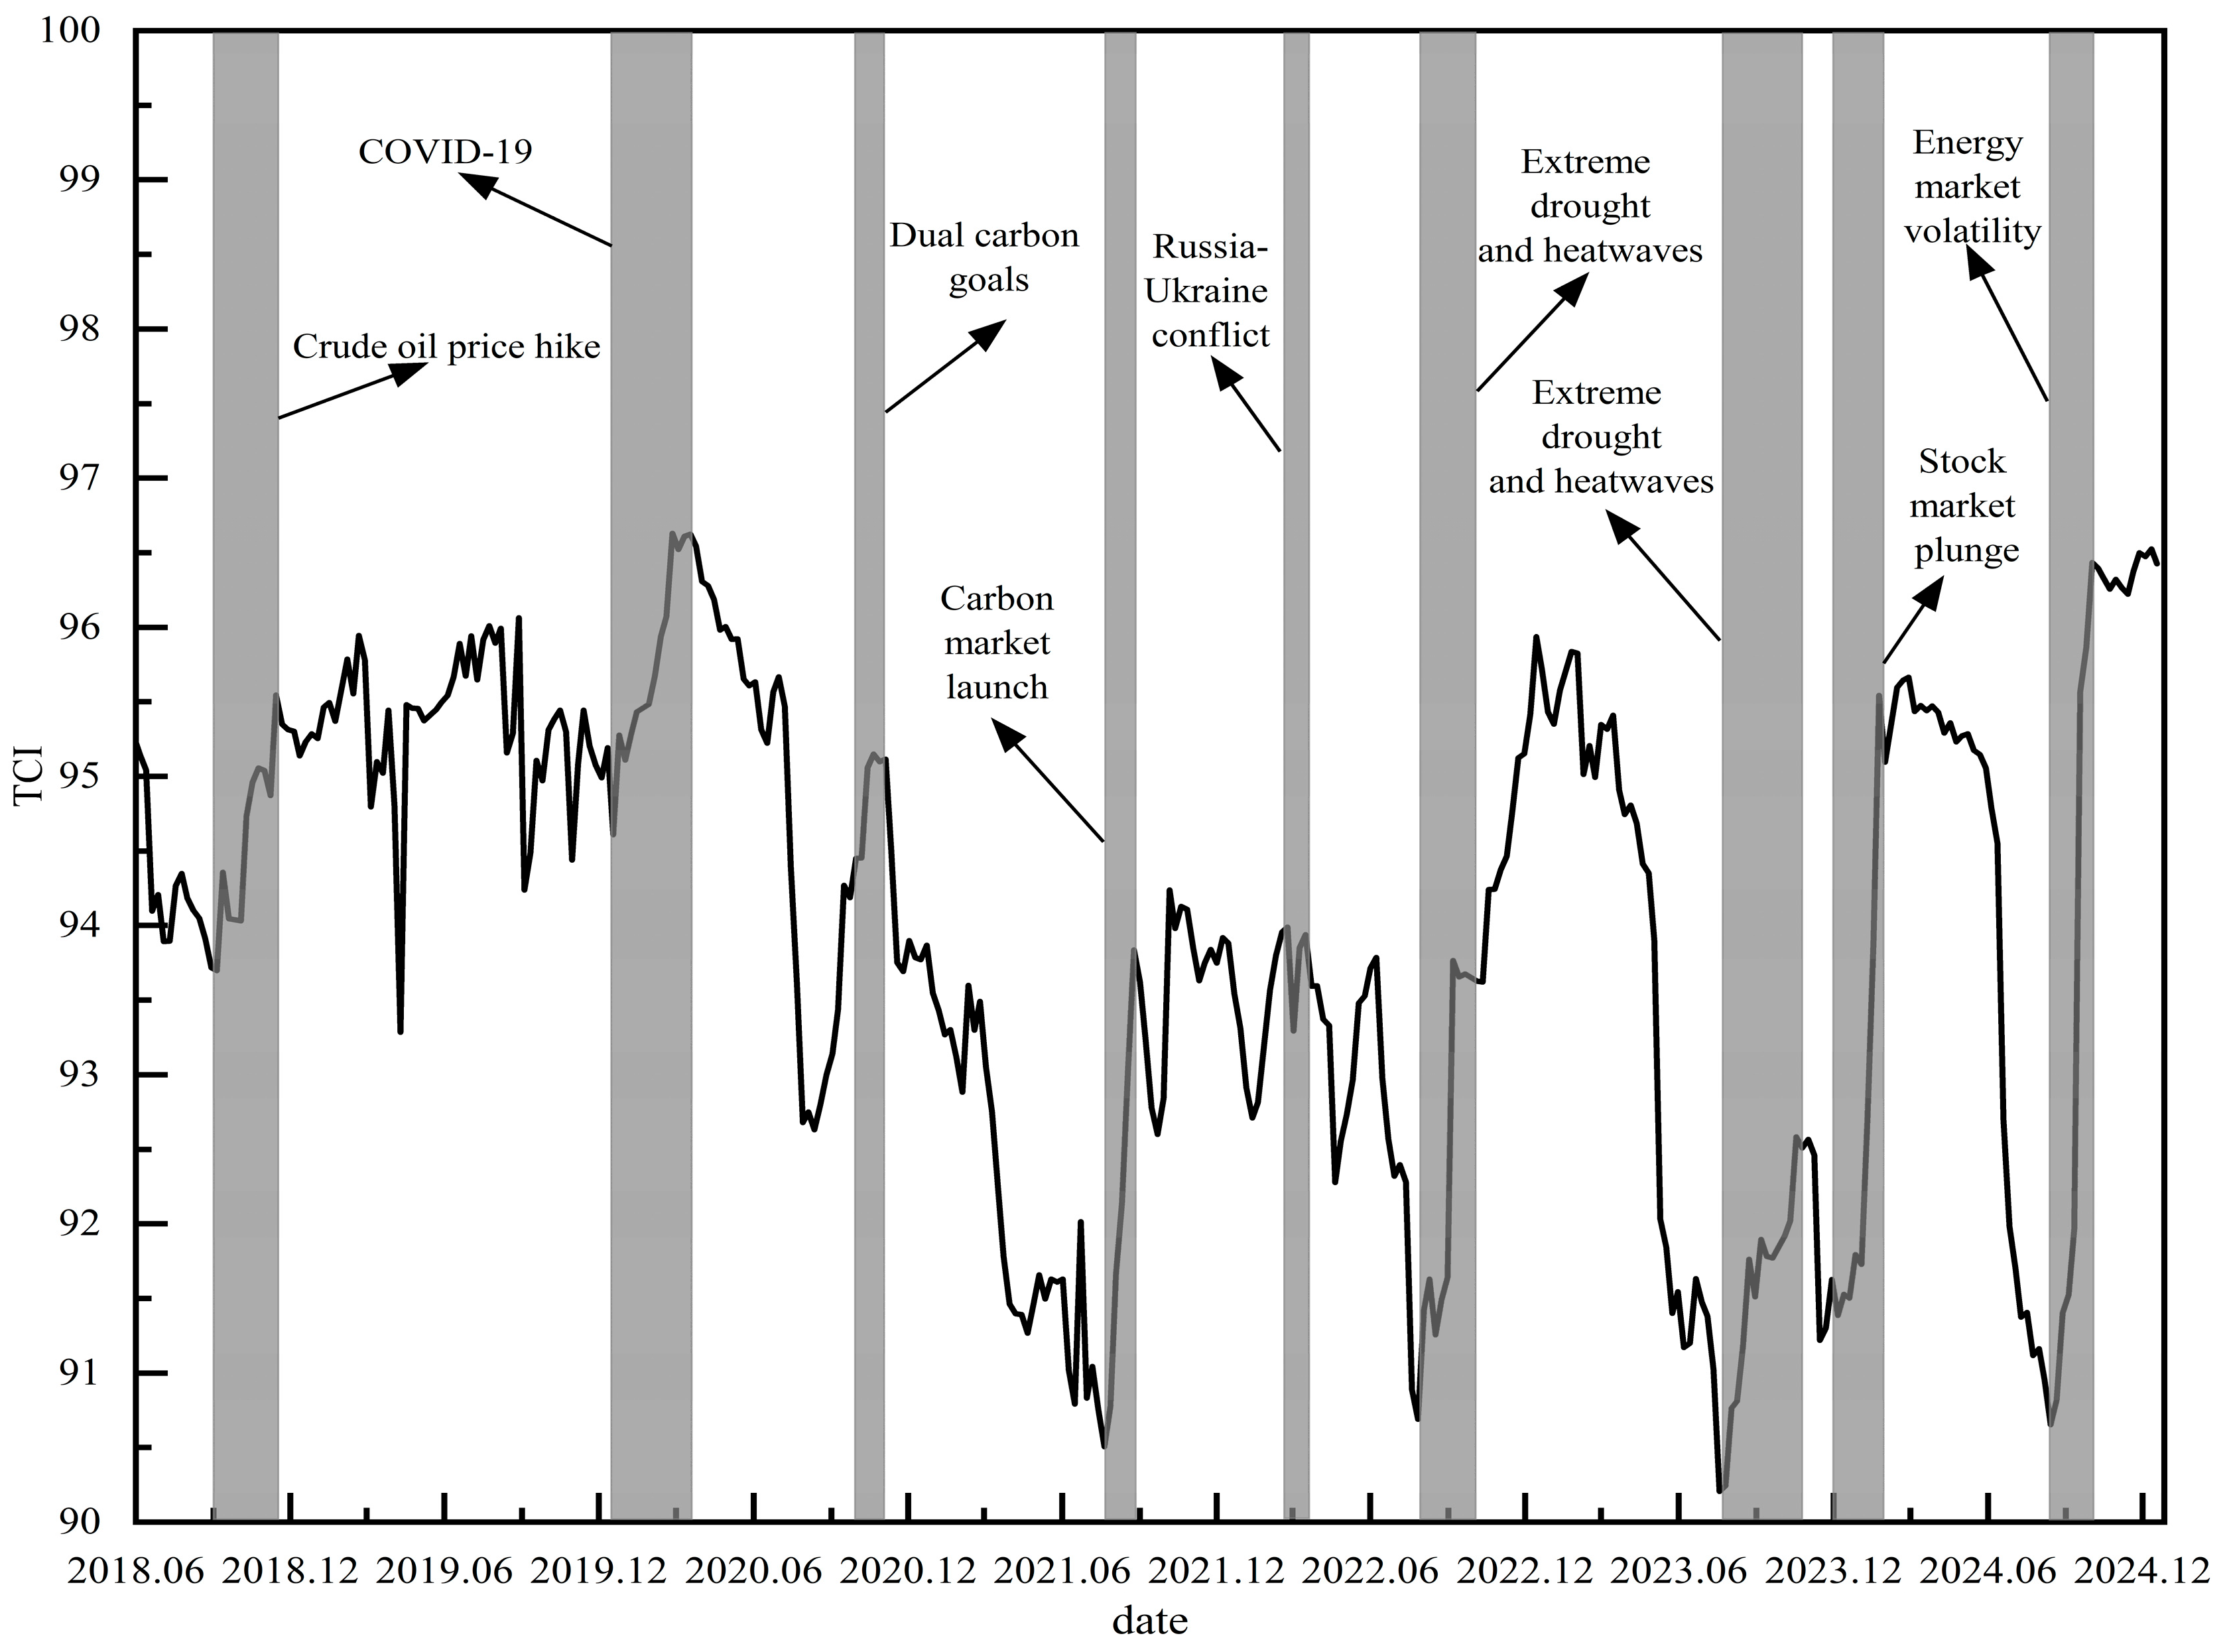
Computing the overall risk spillover index for the 99 energy firms across trading days yields the results shown in Figure 3. From Figure 3, it is evident that the energy system exhibits a high level of overall risk connectedness with stage-wise variation. In general, before 2019, the system’s overall connectedness fluctuated relatively steadily. In contrast, after the global COVID-19 pandemic, the interweaving of multiple factors intensified overall connectedness in the energy system, highlighting its vulnerability and sensitivity. In addition, the influencing factors are categorized in accordance with the classification used in the theoretical analysis section, they can be grouped into four layers: first, macroeconomic and market factors—for example, volatility in international crude oil prices in 2018, the stock market plunge from late 2023 to early 2024, and sharp energy-market turbulence in the second half of 2024 all markedly raised the system’s connectedness; second, policy and institutional factors—for instance, after China announced the “dual-carbon” targets in September 2020, overall connectedness increased, and official launch of the national carbon market in 2021 further heightened it; third, major unexpected events—these are typically unforeseeable yet impose substantial shocks on energy markets and firms, with the global COVID-19 pandemic and the Russia-Ukraine conflict being prominent examples; comparatively, because Russia is a key energy producer, the escalation of the Russia-Ukraine conflict accelerated the increase in system connectedness more rapidly; and fourth, climate and natural-disaster factors—global warming has increased the frequency of extreme weather, and during the summers of 2022 and 2023, extreme heat constrained generation in regions highly dependent on hydropower in Southwest China, severely undermining the stability of energy supply.

4.2.2. Energy-Industry Risk Spillover Network Connectedness Under Major-Event Shocks

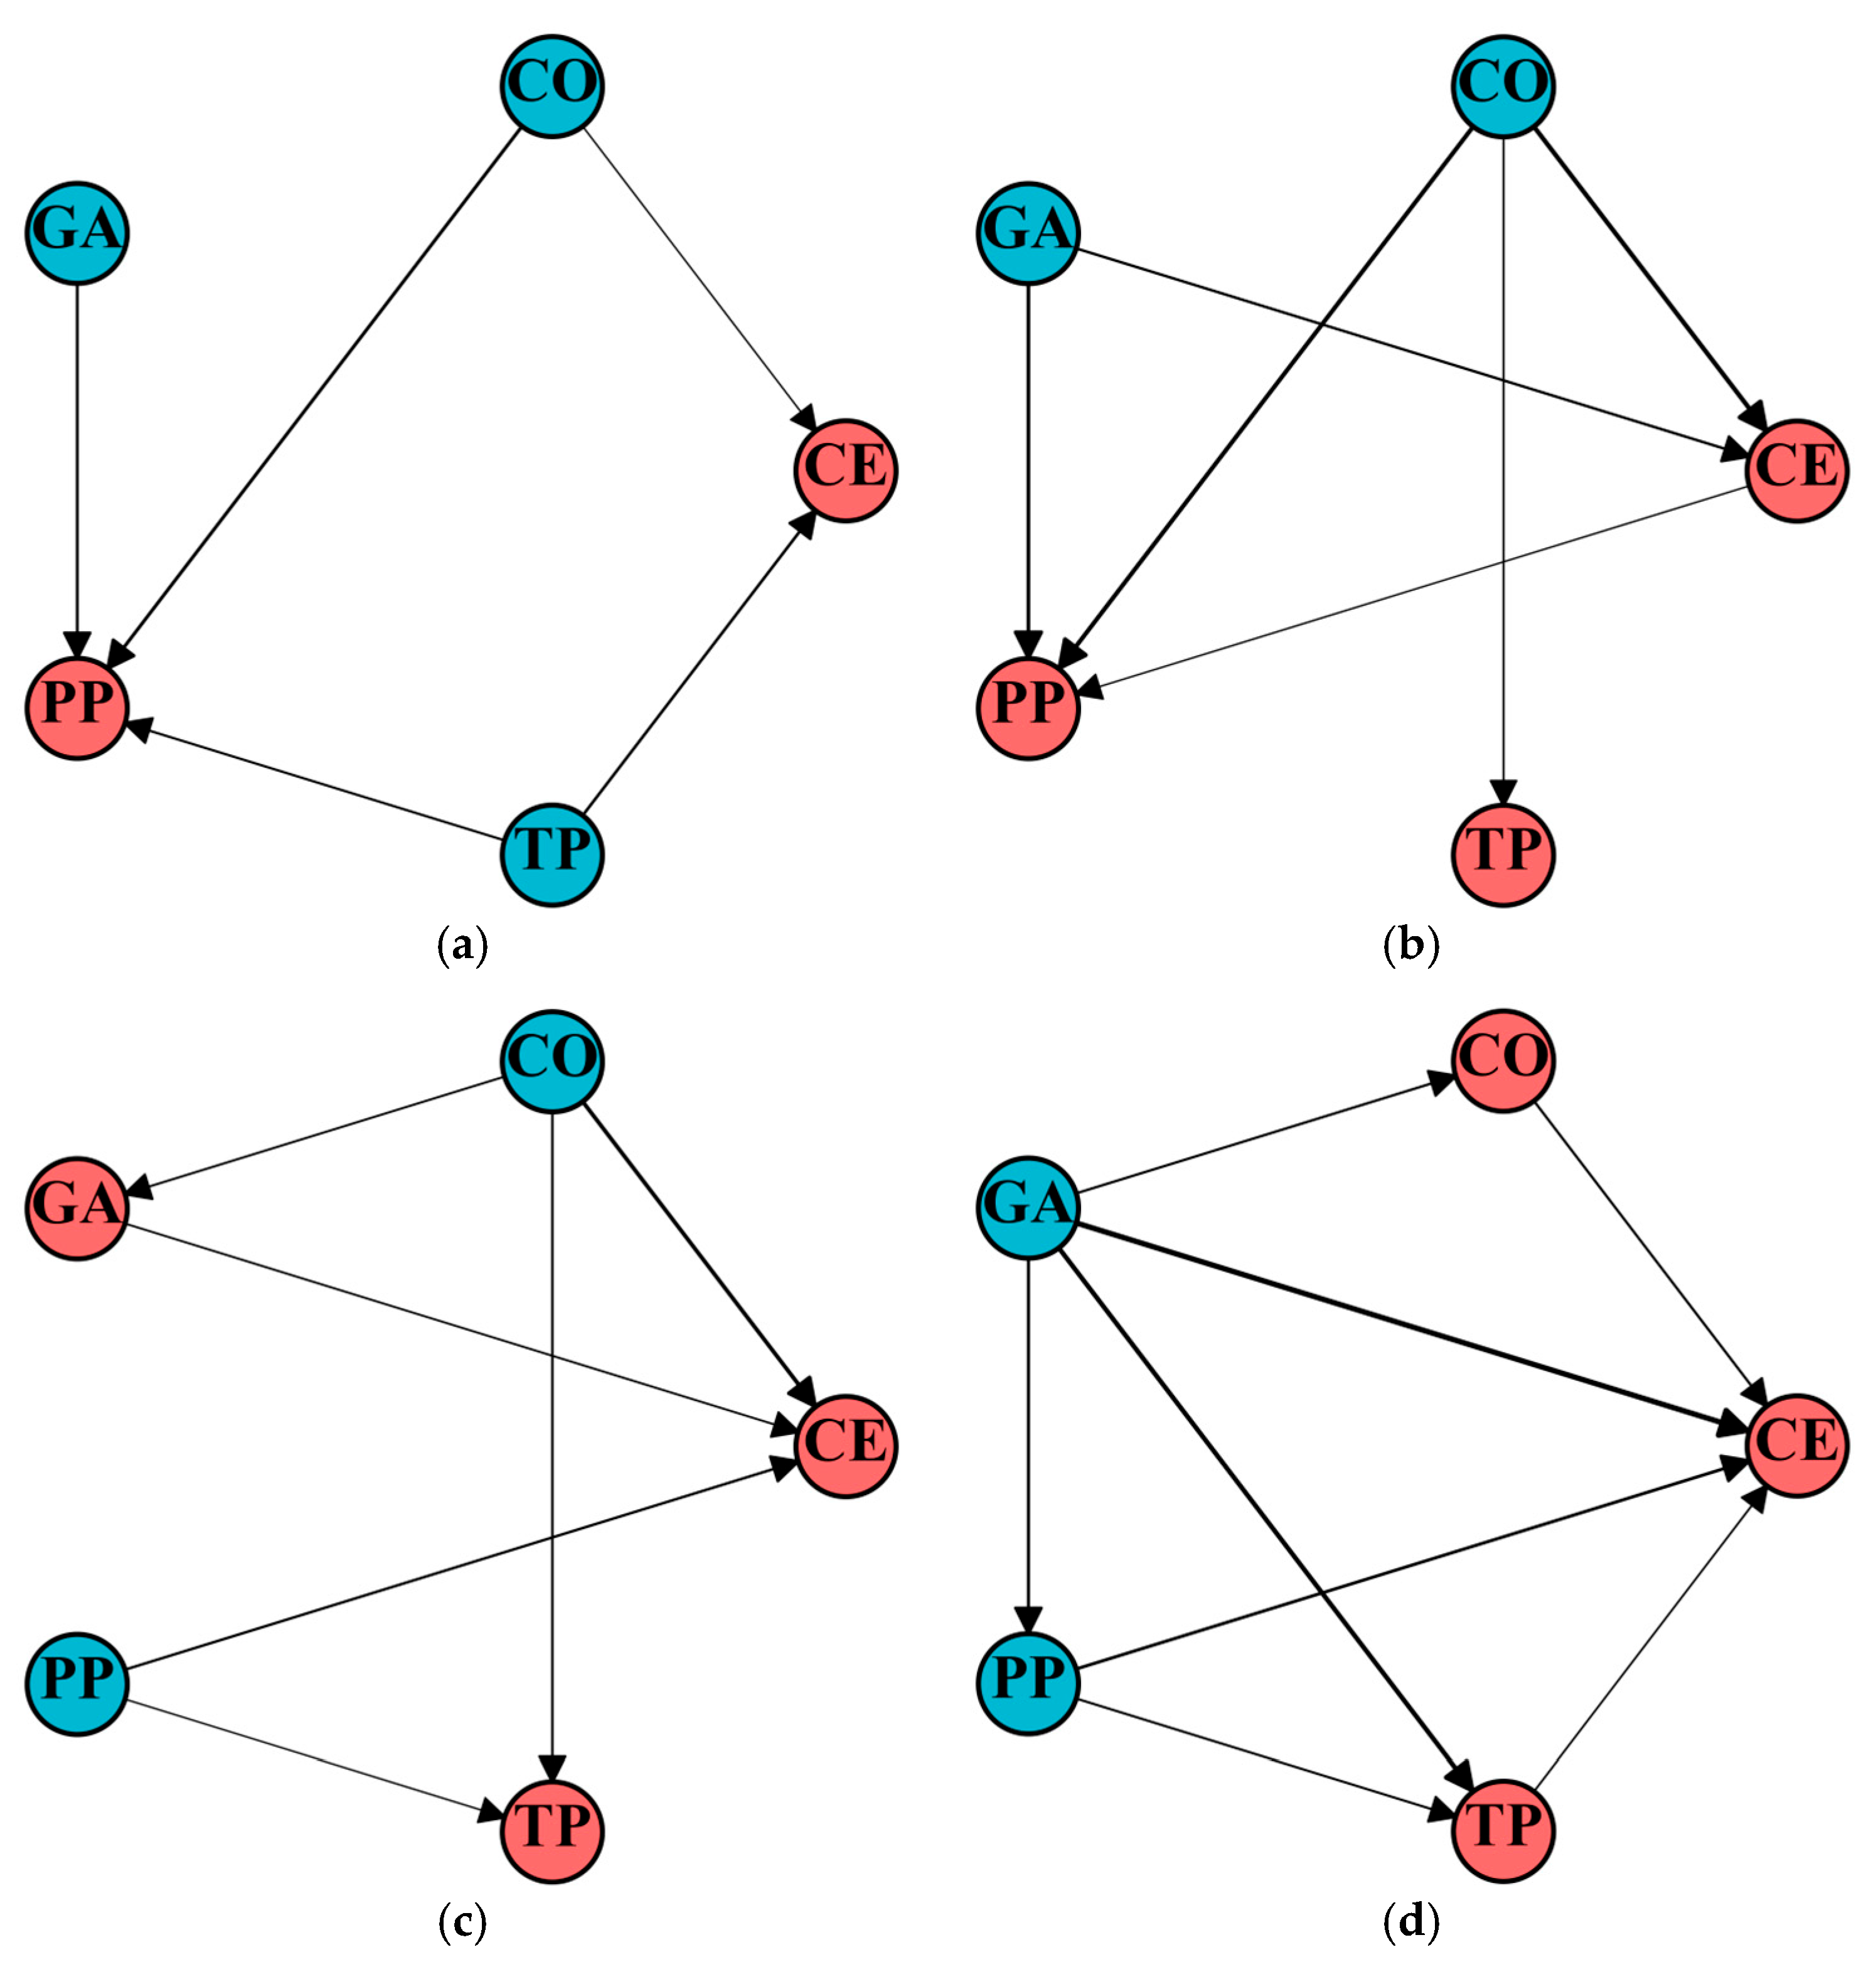
The inter-industry net spillovers calculated using Equation (13) are used to construct a directed weighted network. Since the number of industries is relatively small, the spillover intensity threshold is set at the 50th percentile of the full-sample period, which equals 0.125. According to [44,45], the two-month trading period following the occurrence of each selected event is defined as the event sample. This section analyzes three major events within the sample period: the global COVID-19 pandemic (20 January 2020–30 March 2020), the official launch of the national carbon market (26 July 2021–27 September 2021), and the outbreak of the Russia-Ukraine conflict (28 February 2022–2 May 2022). For each event, we define the event week and the subsequent two months as the event window, and then evaluate the specific impacts of the event on the industry-level risk spillover network connectedness.
Figure 4a–d present the risk spillover network connectedness among the five energy industries for, respectively, the full sample period, the global COVID-19 pandemic, the official launch of the national carbon market, and the Russia-Ukraine conflict. Table 2 presents the directions and intensities of risk spillovers among energy industries under major event shocks. By examining Figure 4a–d and Table 2, the following observations can be made: First, during the full sample period the spillover network is relatively sparse, with concentrated transmission paths and clear directionality; the Petroleum and Petrochemical industry and the clean-energy industry are the primary risk receivers, coal and thermal power are the main risk transmitters, and the spillover from the gas industry to Petroleum and Petrochemicals is relatively small. This suggests that coal still plays a dominant role in China’s energy system. Second, when major events strike, the inter-industry spillover network changes markedly: the complexity of the risk spillover network connectedness among the energy industries rises, and it is especially high during the Russia-Ukraine conflict, when industry co-movements are most complex. The study [46] supports this view. This indicates that major-event shocks significantly amplify inter-industry linkage effects and raise systemic risk. Third, in terms of industry roles, the clean-energy industry consistently acts as a risk receiver; when facing major shocks, the magnitude of inflows increases significantly and the number of inflow channels expands markedly, consistent with [11], highlighting the vulnerability of the clean-energy industry to external uncertainty during the energy transition. By contrast, coal is primarily a risk transmitter, becoming a risk receiver only during the Russia-Ukraine conflict, which indicates that when a major producer of natural gas and oil is embroiled in geopolitical conflict, the outward spillover capacity of the gas, petroleum and petrochemical industries is significantly strengthened, which is consistent with [42].

4.2.3. Risk Spillover Network Among Energy Firms Under Major-Event Shocks

Risk Spillover Network of All Energy Firms
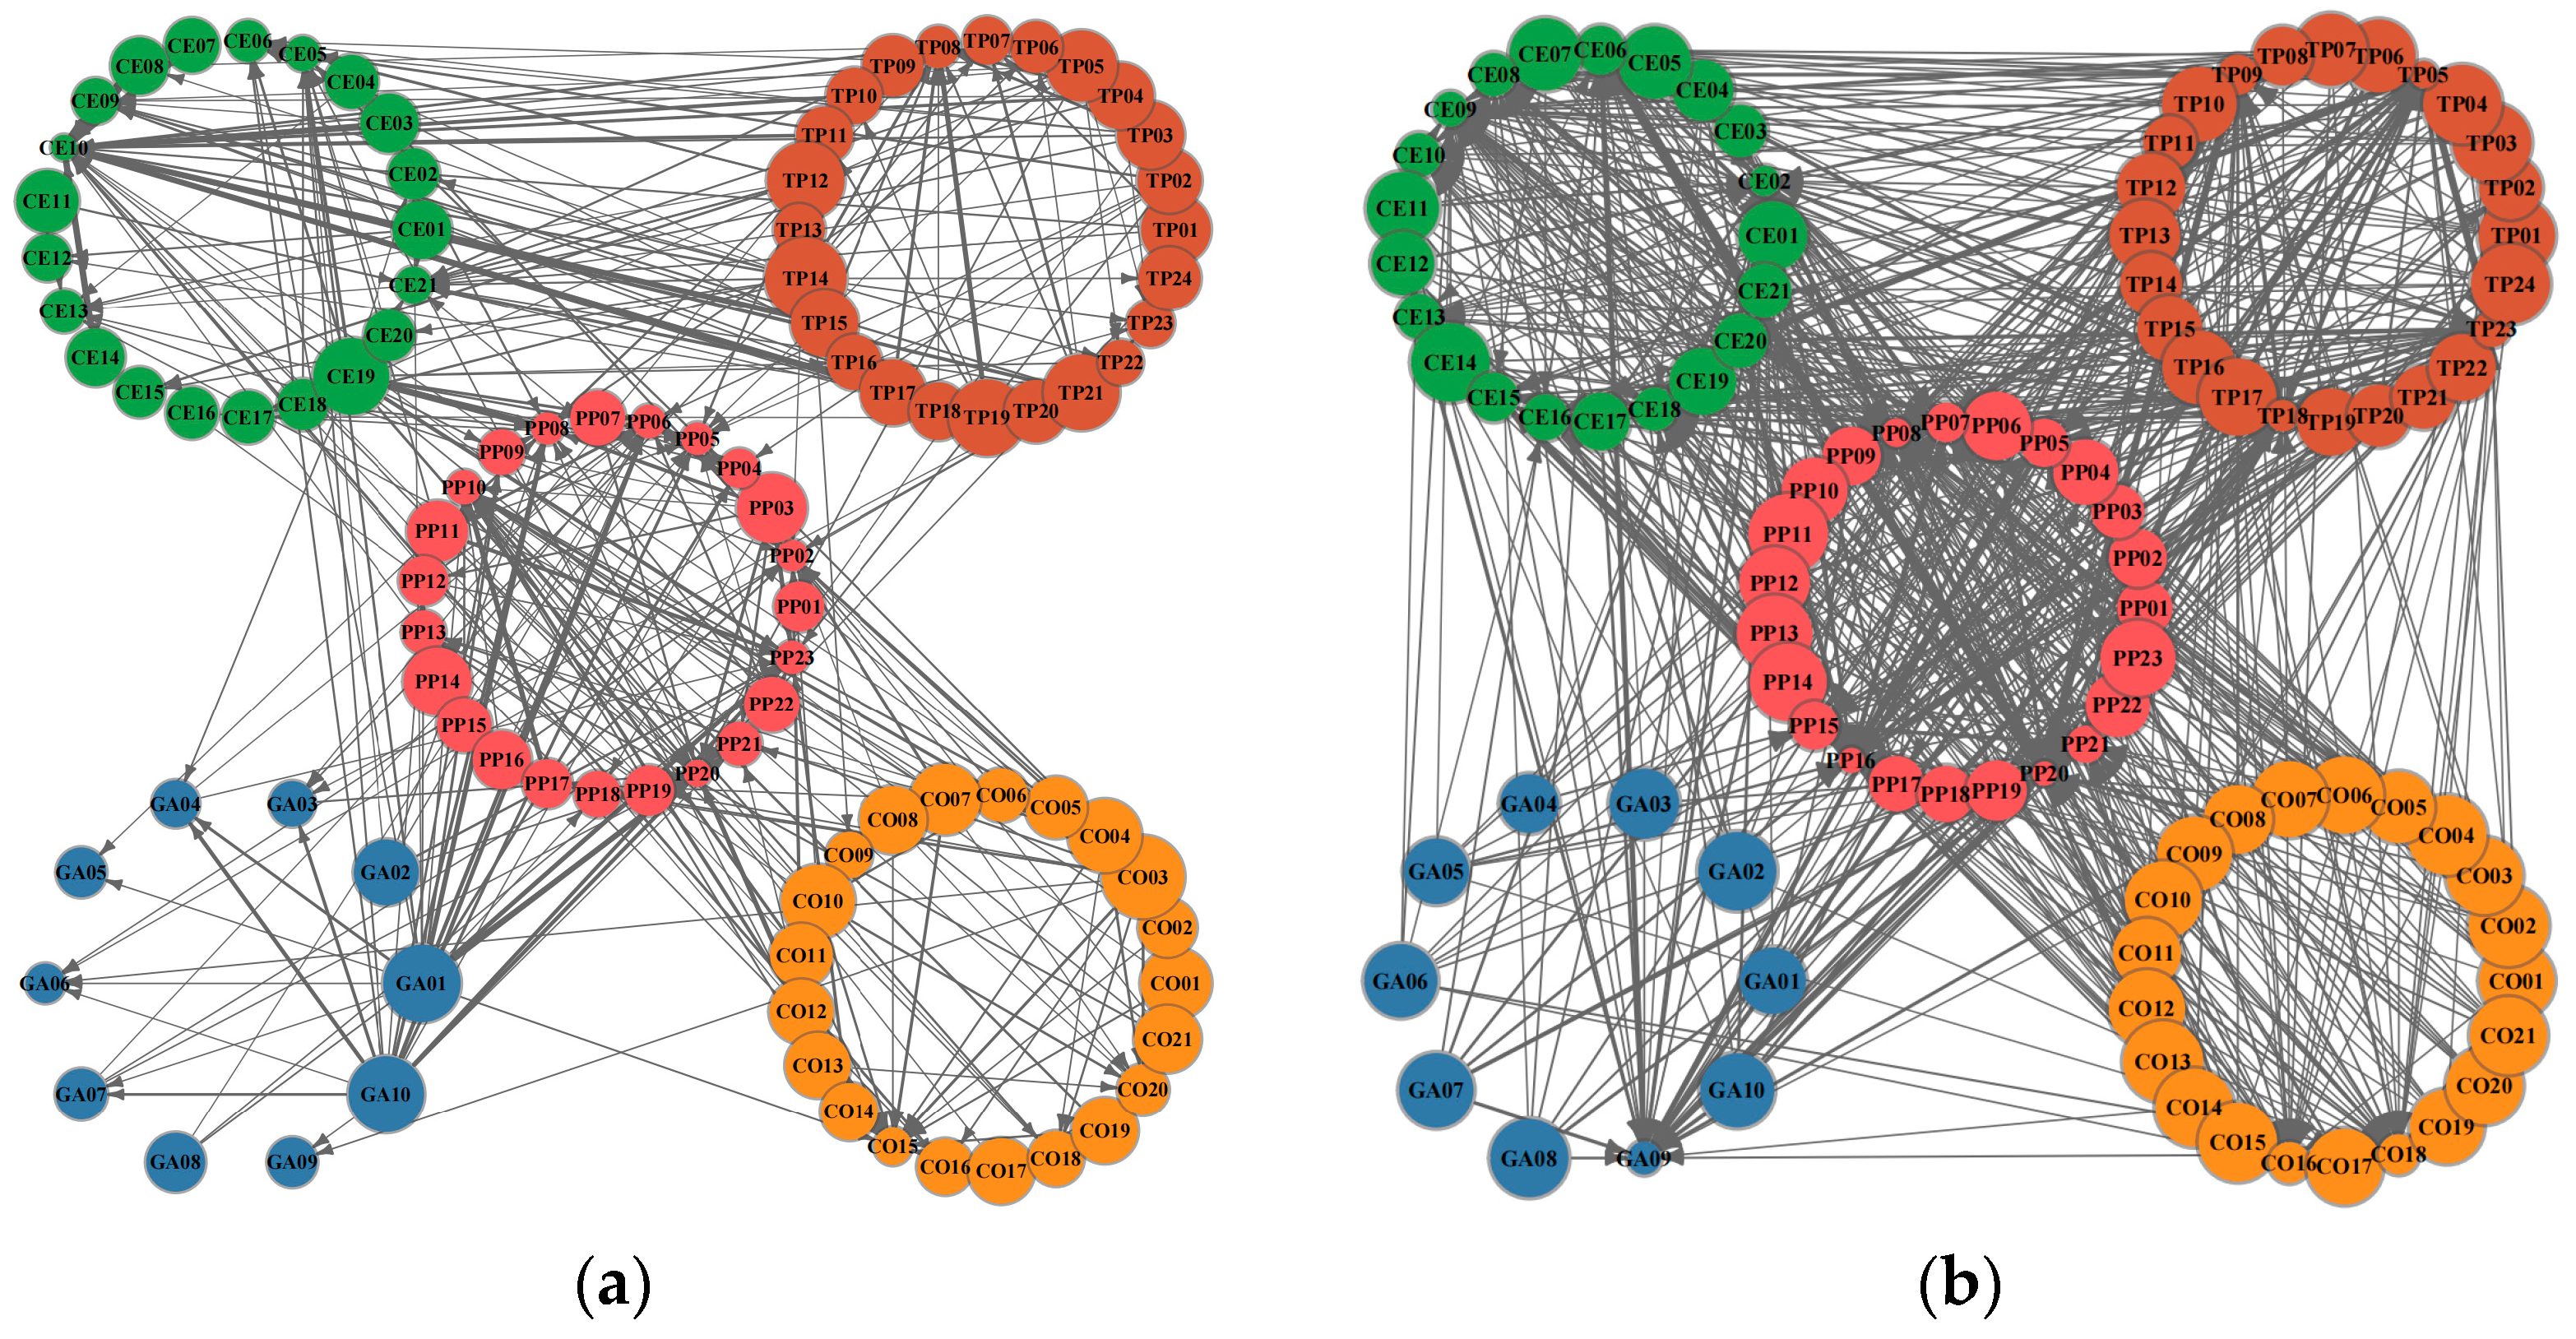
Figure 5a–d respectively present the risk spillover network of all energy firms for the full sample period and under the three major-event shocks. Because risk spillovers exist to varying degrees among the vast majority of firms, not imposing a threshold would produce an extremely complex network that would make it difficult to identify the impact of major events on inter-firm connectedness. Following [47,48], we therefore apply a threshold when examining the network. The threshold is set to the 90th percentile of inter-firm connectedness over the full sample—approximately 0.788—and the same threshold is used for the event windows.
From Figure 5a–d, the energy-firm network exhibits pronounced dynamic evolution across scenarios. In the full-sample period, the overall network density is relatively low: although inter-firm risk links are present, the structure is loose, indicating that risk mainly propagates along a few leading industries and that the system is relatively stable. After major-event shocks, the number of edges increases markedly relative to the full-sample network, density rises significantly, and risk-diffusion channels expand substantially, indicating a sharp elevation in systemic risk. Moreover, the impacts differ across events: the COVID-19 outbreak and the official launch of the national carbon market mainly increase the number of network edges, consistent with the conclusion of [49], whereas the Russia-Ukraine conflict primarily strengthens the intensity of inter-firm risk connections. Accordingly, compared with Figure 5b,c, the network in Figure 5d has fewer edges but thicker ones.
Table 3 presents the top 10 energy firms with the highest levels of risk spillover and spillover reception under different conditions. It also reports the industry distribution of these top-ranked firms. As shown in Table 3, coal firms exhibit strong risk spillover capacity during the full-sample period, the global COVID-19 outbreak, and the official launch of the national carbon market, while gas firms demonstrate stronger spillover capacity during the Russia-Ukraine conflict. In contrast, thermal power and clean energy firms act mainly as net risk receivers. These results are consistent with the findings at the industry level.
Comparing the firm distributions across different scenarios in Table 4 reveals that, relative to the full-sample period, the number of oil and petrochemical firms among both risk transmitters and receivers increased significantly during the global COVID-19 outbreak. During the launch of the national carbon market, coal and oil-petrochemical firms were more sensitive, jointly dominating both the spillover and spill-in lists. When the Russia-Ukraine conflict broke out, significant structural changes occurred across all five energy industries. Notably, no coal firms appeared among the top 10 rankings, whereas gas firms accounted for the largest share of both risk transmitters and receivers. This pattern reflects Russia’s crucial role as a major natural gas producer—especially in the European market—where the conflict heightened uncertainty in the global gas sector.
Table 5 presents the top 10 energy firms with the highest levels of cross-sector risk spillover and spillover reception under different scenarios. As shown in Table 5, gas and thermal power firms exhibit strong cross-industry risk spillover capacity in most cases, while clean energy and oil-petrochemical firms are generally net risk receivers. Table 6 reports the industry distribution of the top 10 cross-sector firms under each scenario. During the global COVID-19 outbreak, oil-petrochemical firms ranked highest in terms of received risk, as the pandemic suppressed global energy demand and reduced the spillover capacity of oil-petrochemical firms. When the national carbon market was officially launched, clean energy firms received the most cross-sector risks. Combined with the findings in Table 4, this indicates that coal firms primarily experienced intra-industry risk transmission under this scenario. During the Russia-Ukraine conflict, gas firms served as the main cross-sector risk transmitters, while thermal power firms were the primary receivers. This pattern reflects the impact of the conflict on fossil energy markets, as thermal power firms, being downstream in the fossil energy supply chain, were more vulnerable to such shocks.
Intra-Industry Risk Spillover Network Among Energy Firms
To further investigate the risk spillover network among firms within the energy industry, we classify energy firms and separately analyze inter-firm networks within the clean-energy, coal, gas, Petroleum, and Petrochemical, and thermal-power industries, as well as how these network structures evolve under major-event shocks.
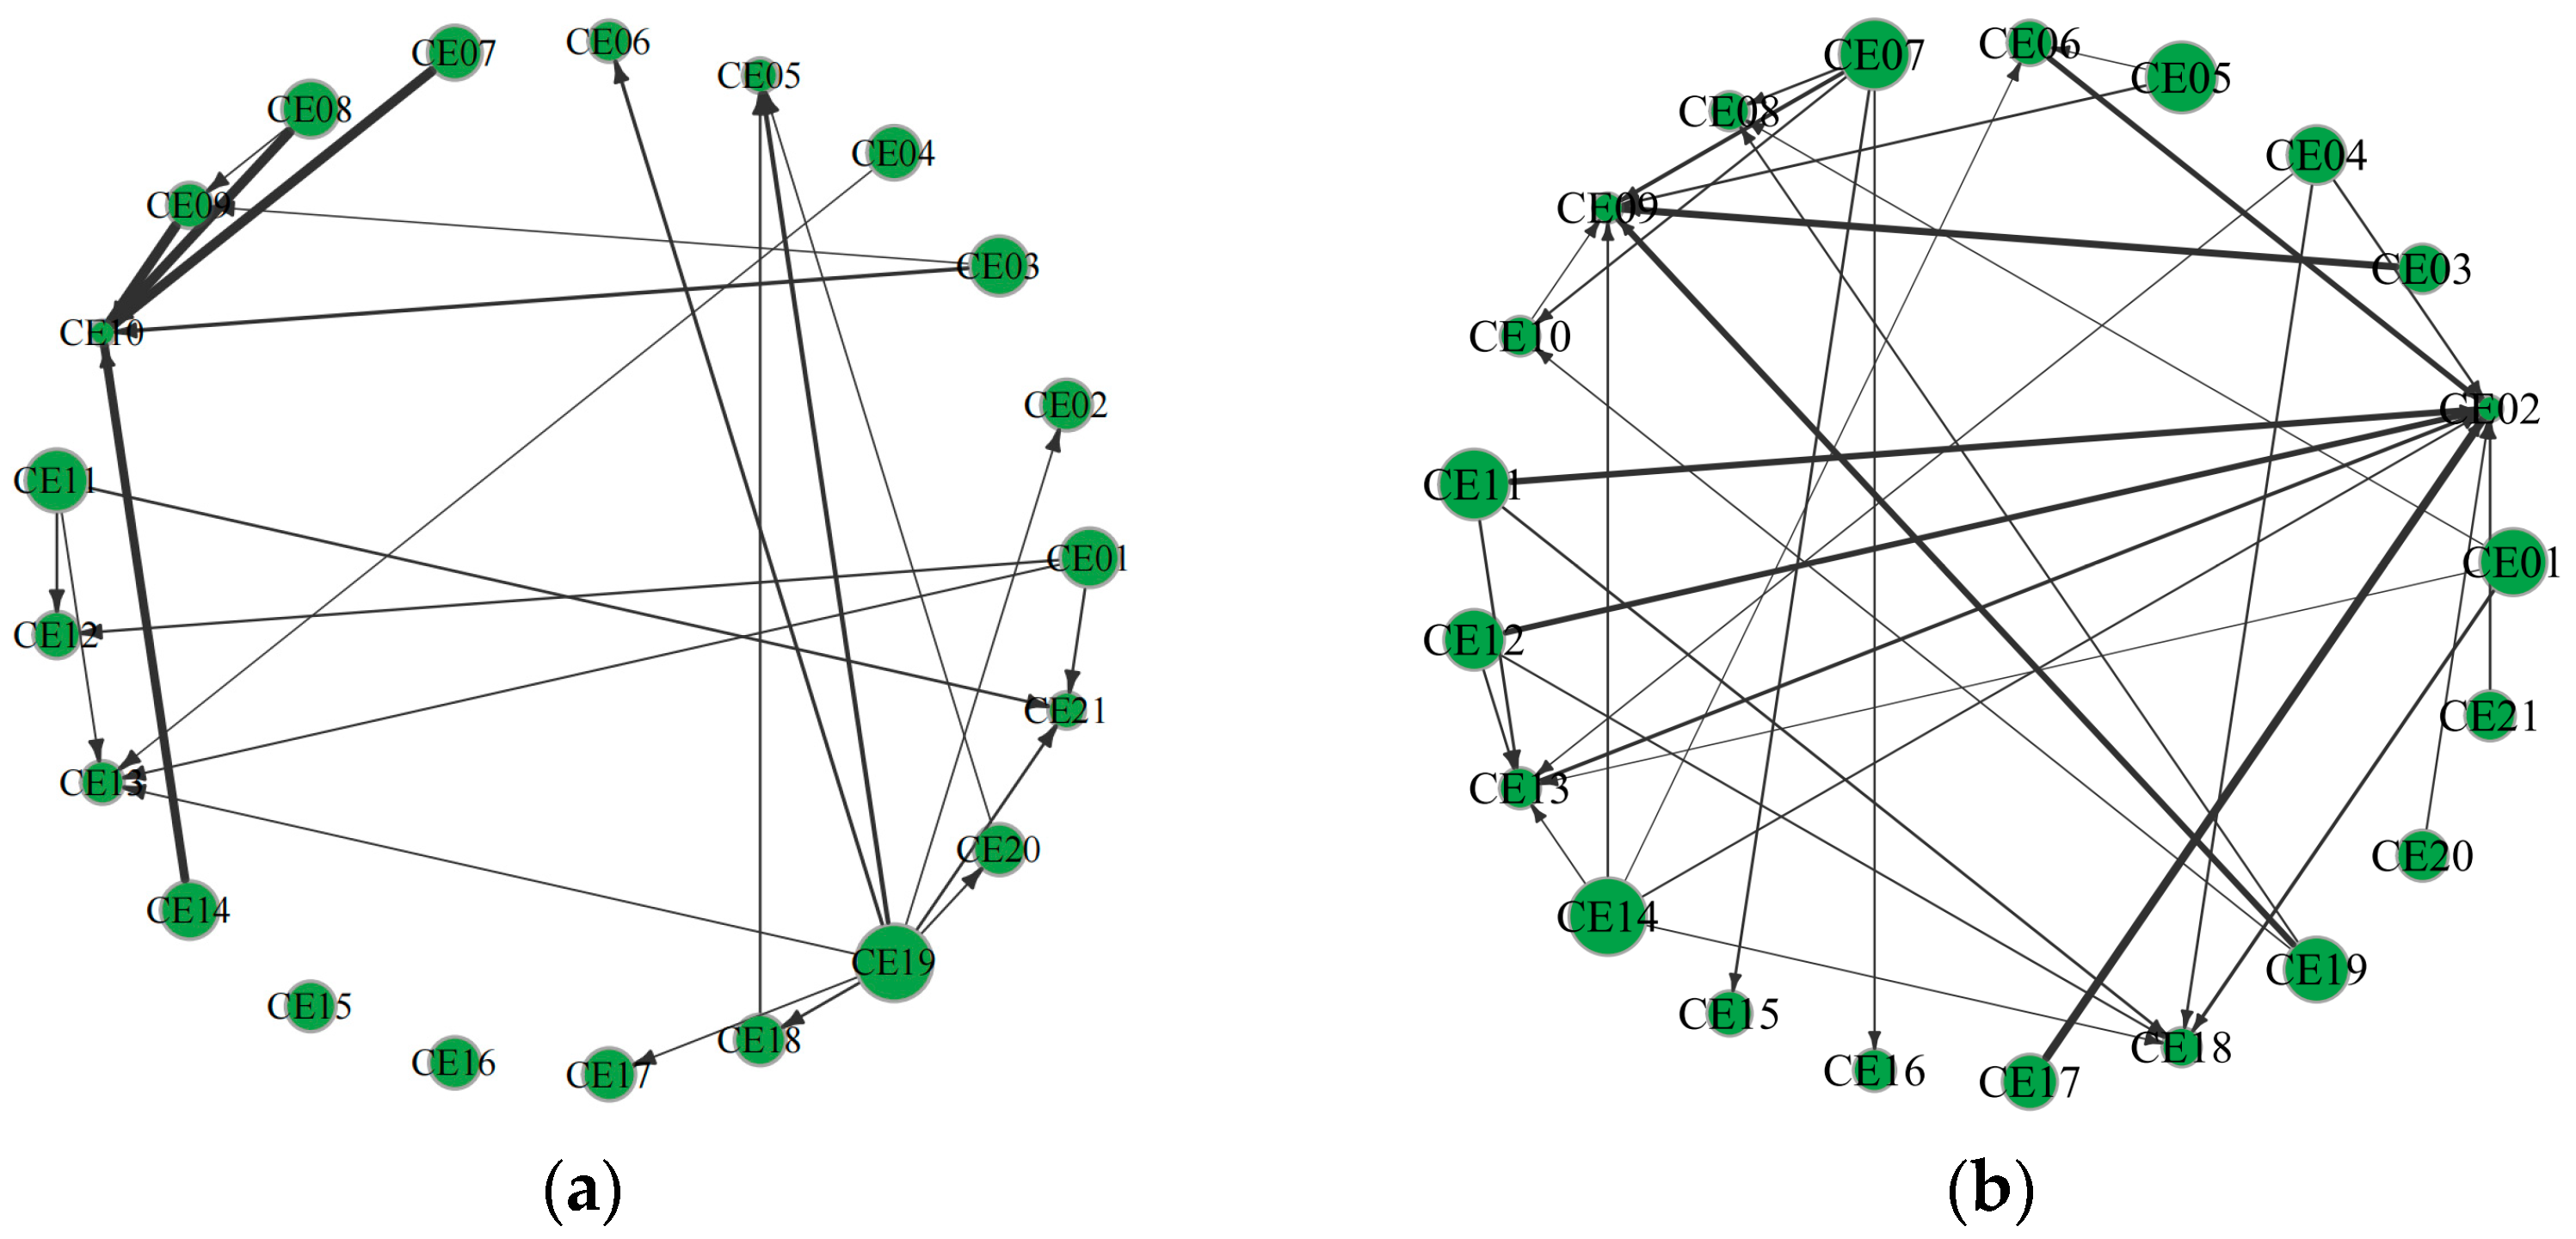
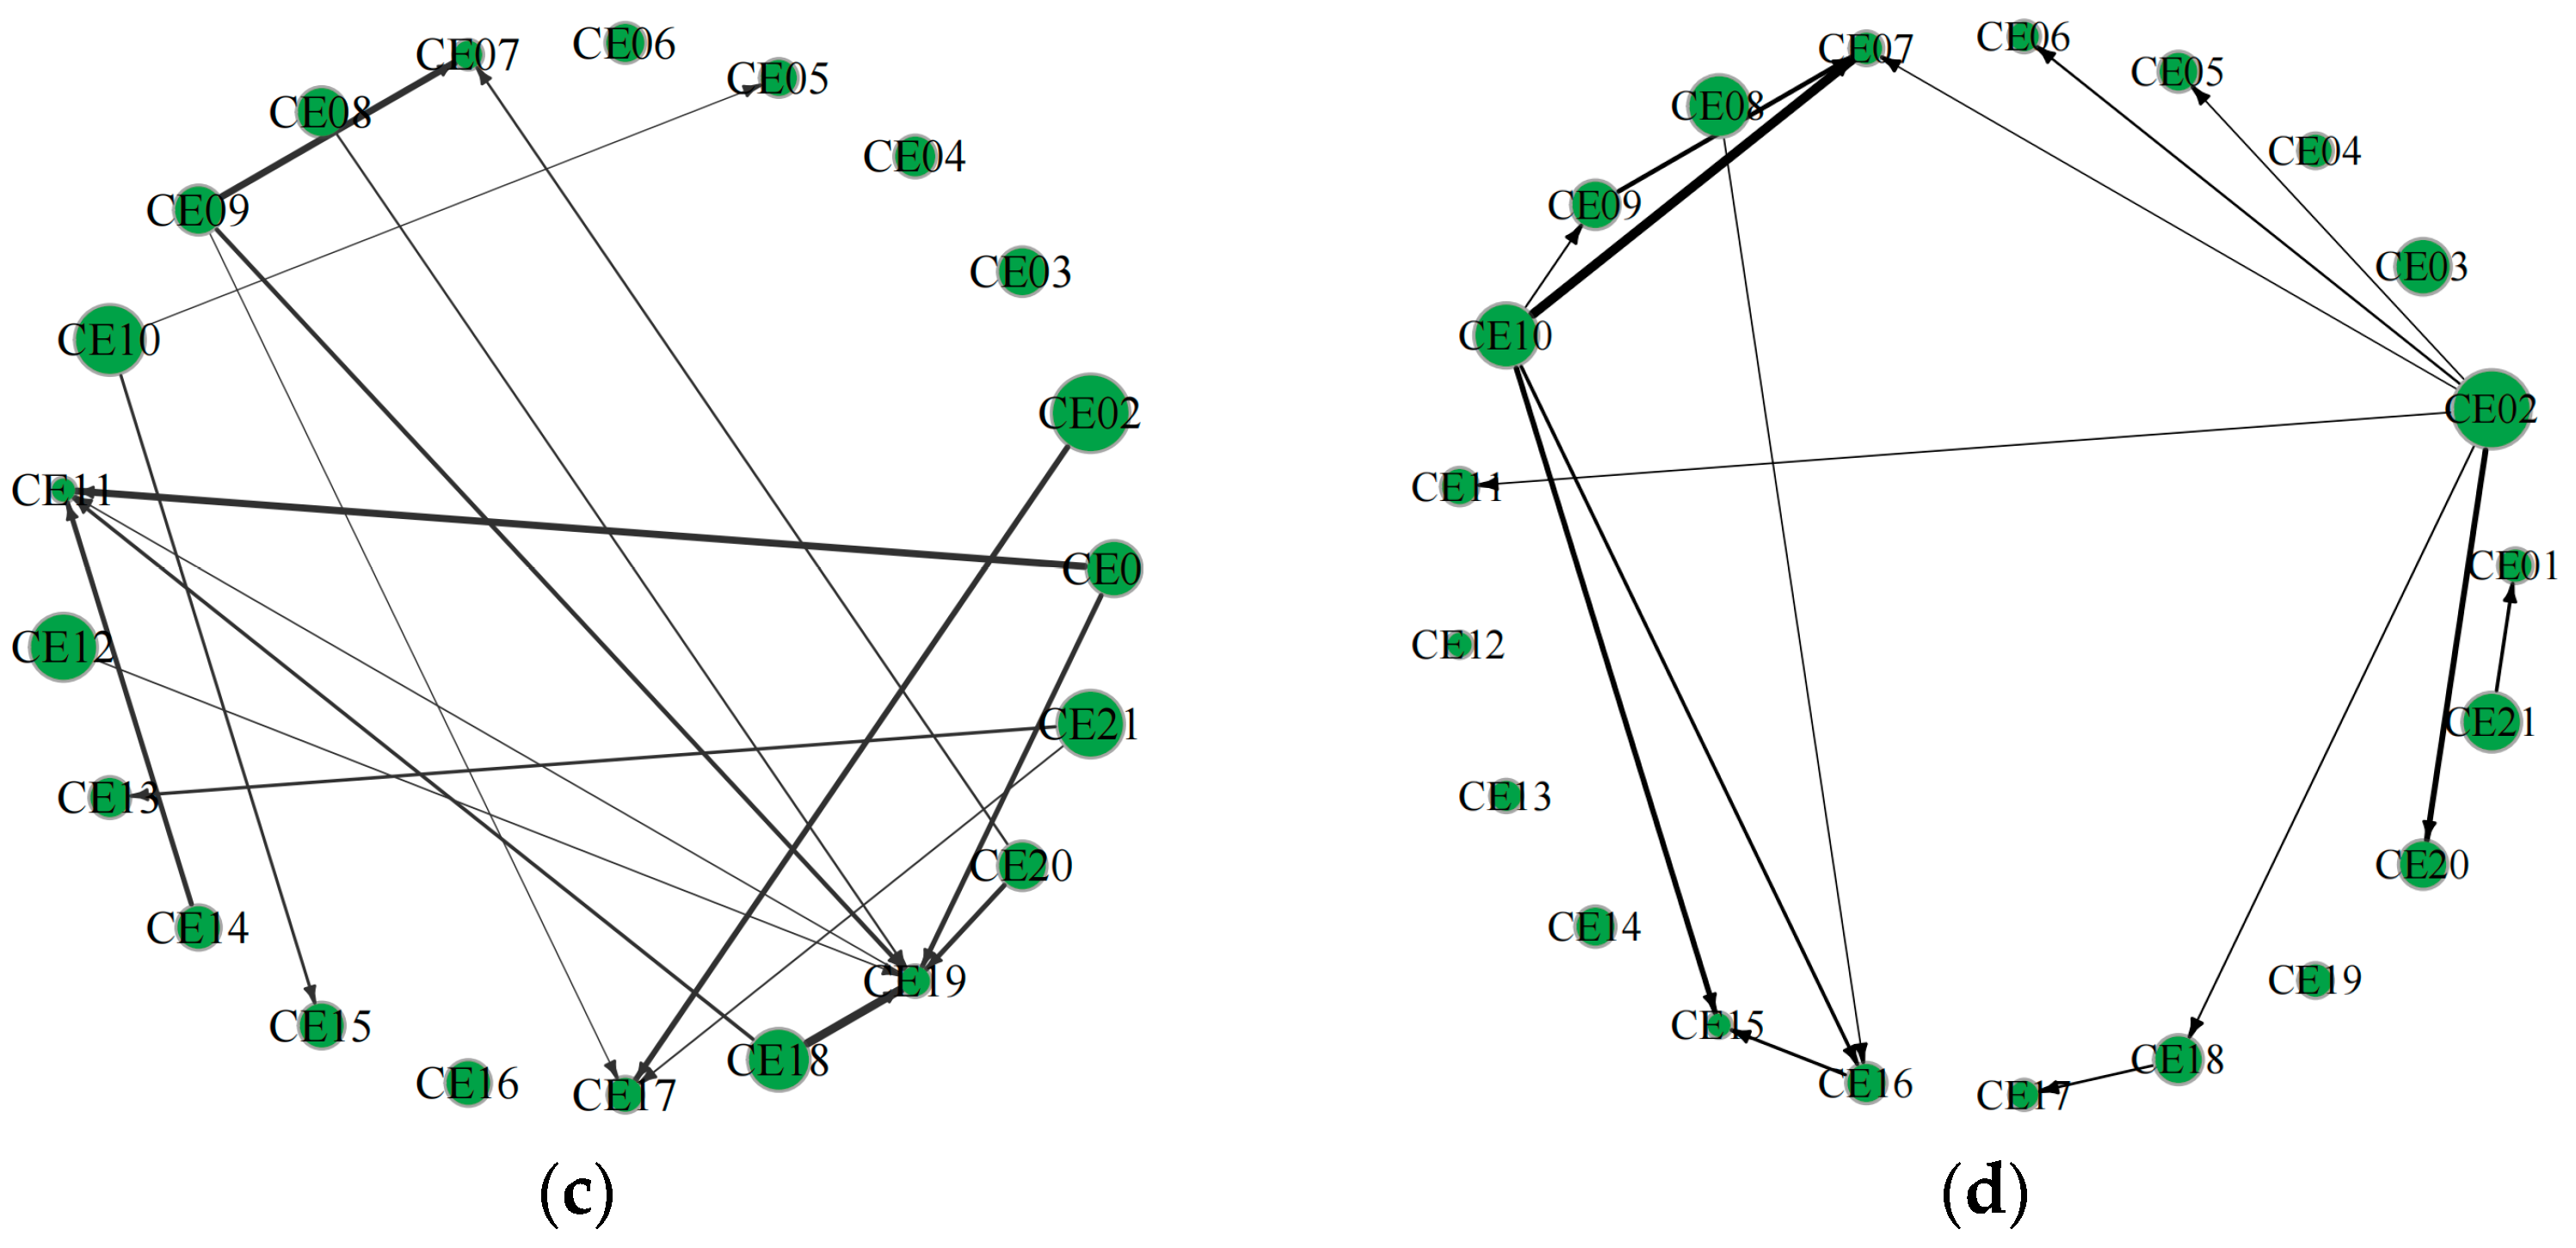
Figure 6a–d present the risk spillover network among clean-energy firms for the full sample period and under the three major-event shocks. During the full sample, risk-transmission relationships among clean-energy firms are already present. Still, the number of edges is limited, link strengths vary widely, and the overall network remains relatively diffuse. During the pandemic, inter-firm connectedness rises markedly, network density increases significantly, and several nodes form multiple strong ties, indicating rapid accumulation and diffusion of systemic risk. In the carbon-market launch phase, the network exhibits a degree of convergence: some redundant links fade, transmission paths become more streamlined, yet concentration remains pronounced. During the Russia-Ukraine conflict, the network again appears simplified. Still, a few core firms—notably CE02 and CE08—assume clearly central positions in risk transmission, indicating that risk is concentrated at key nodes.
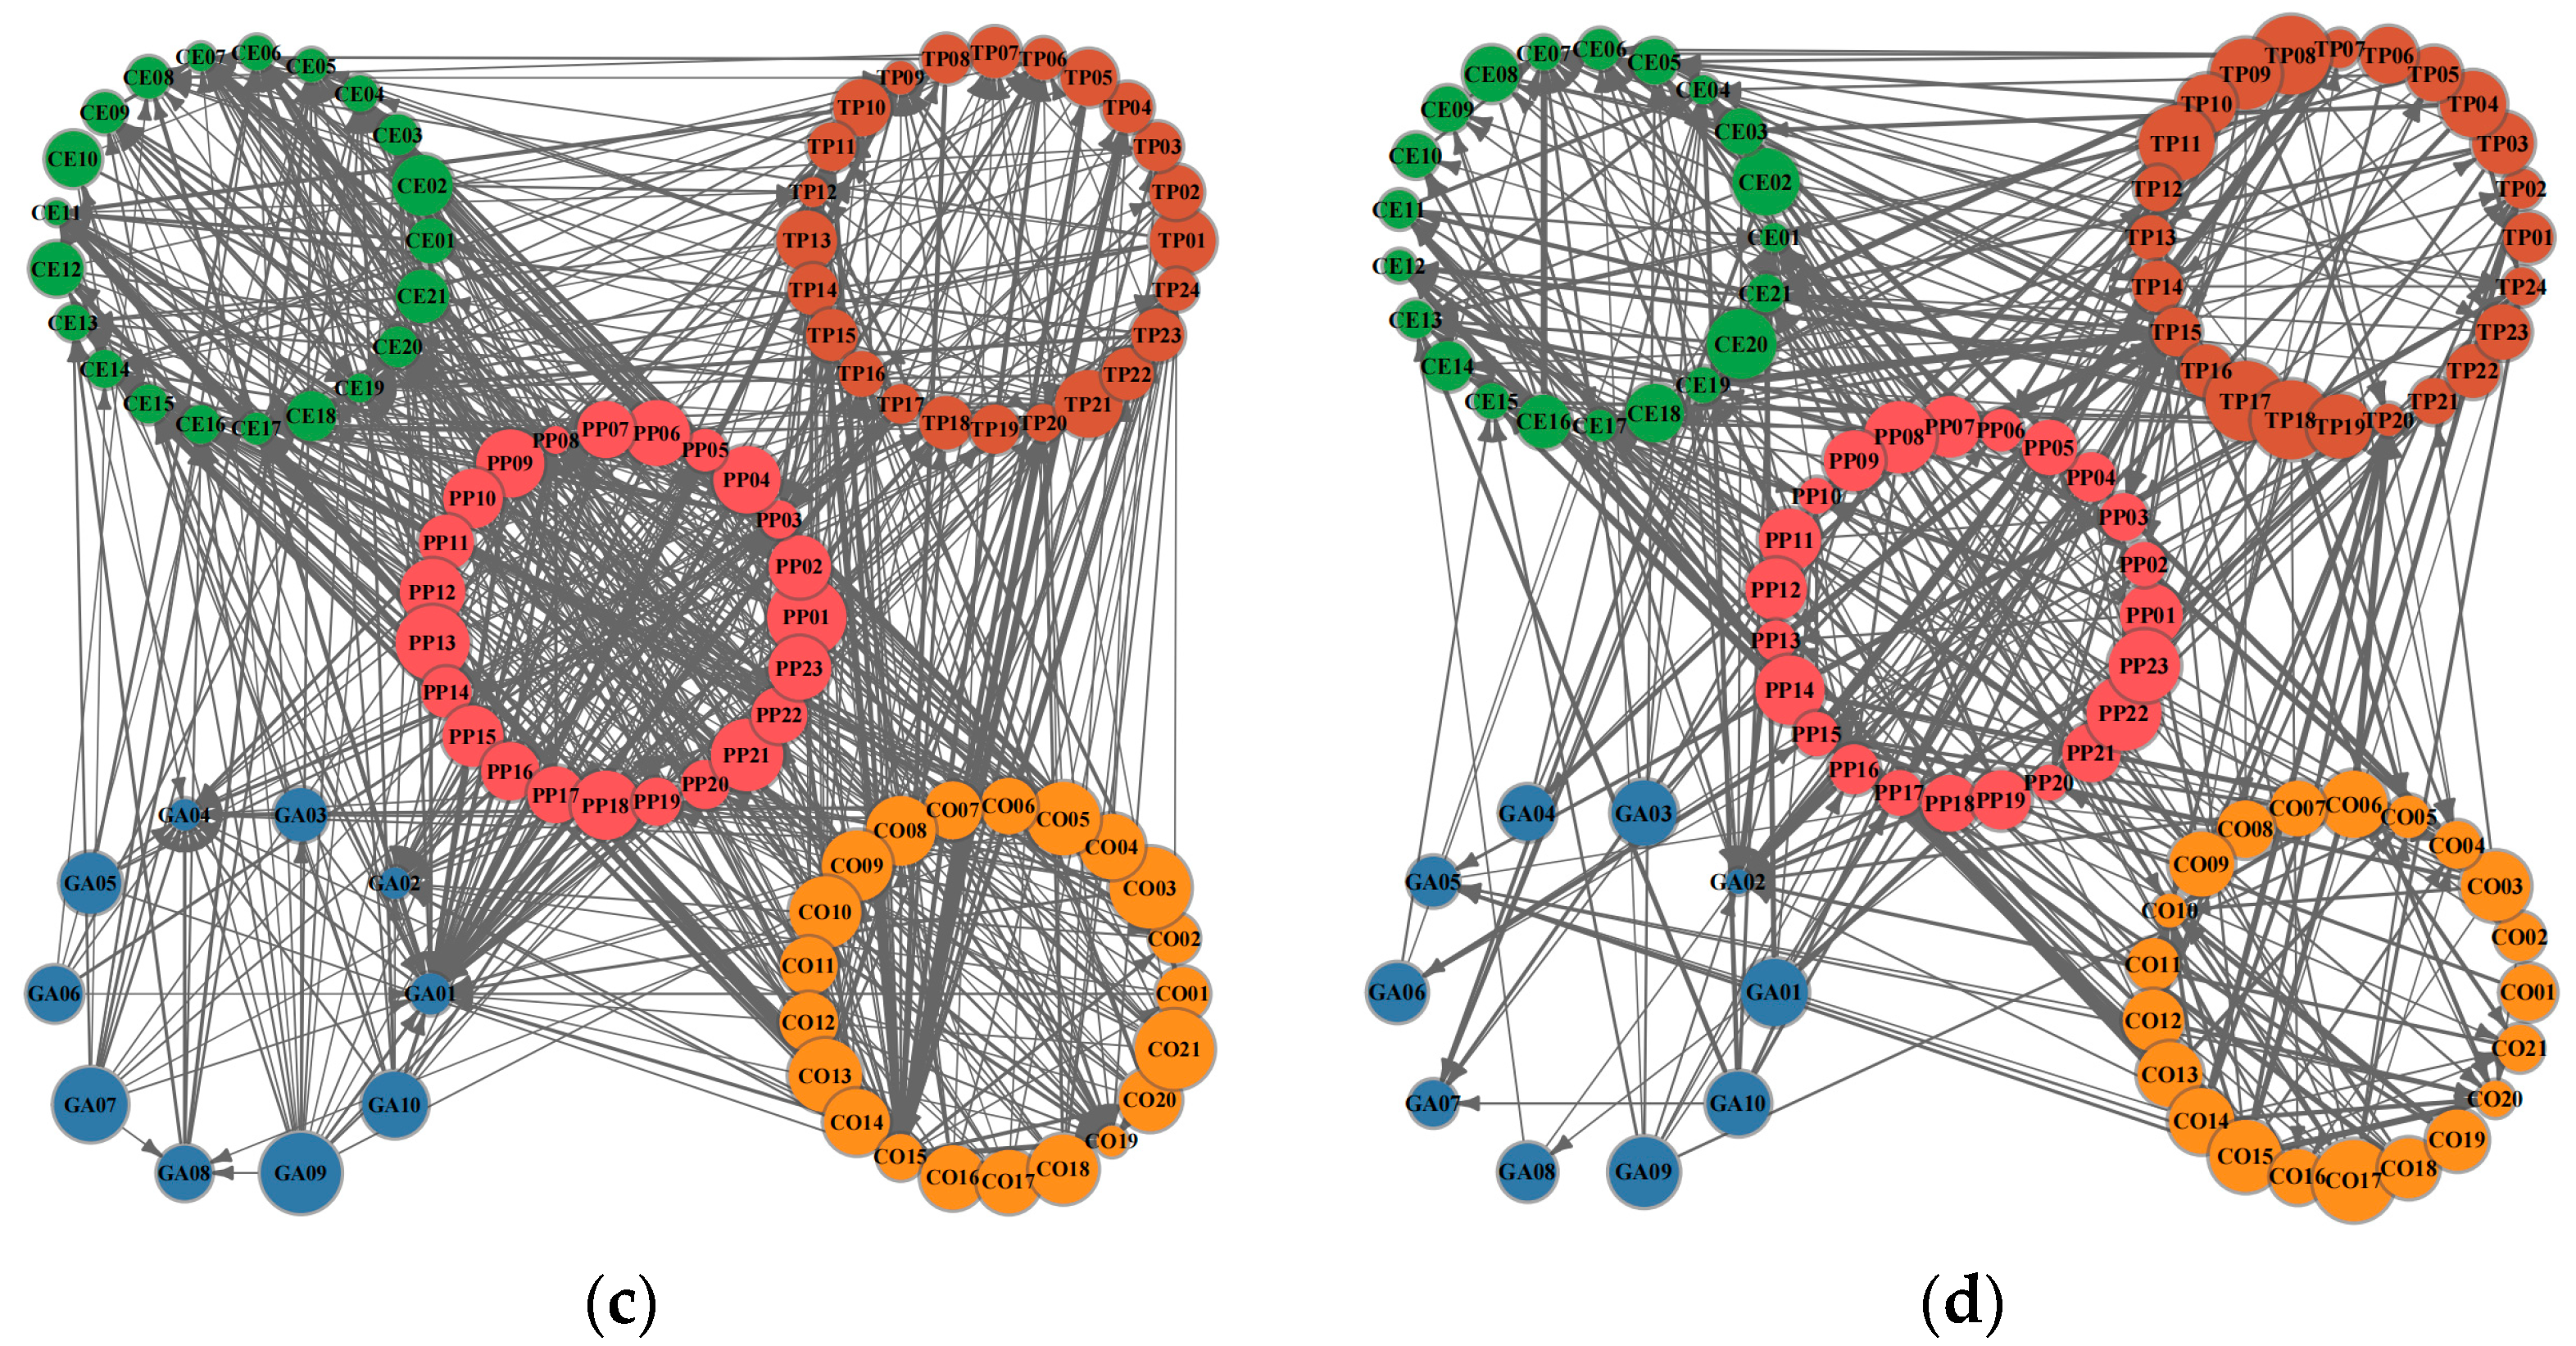
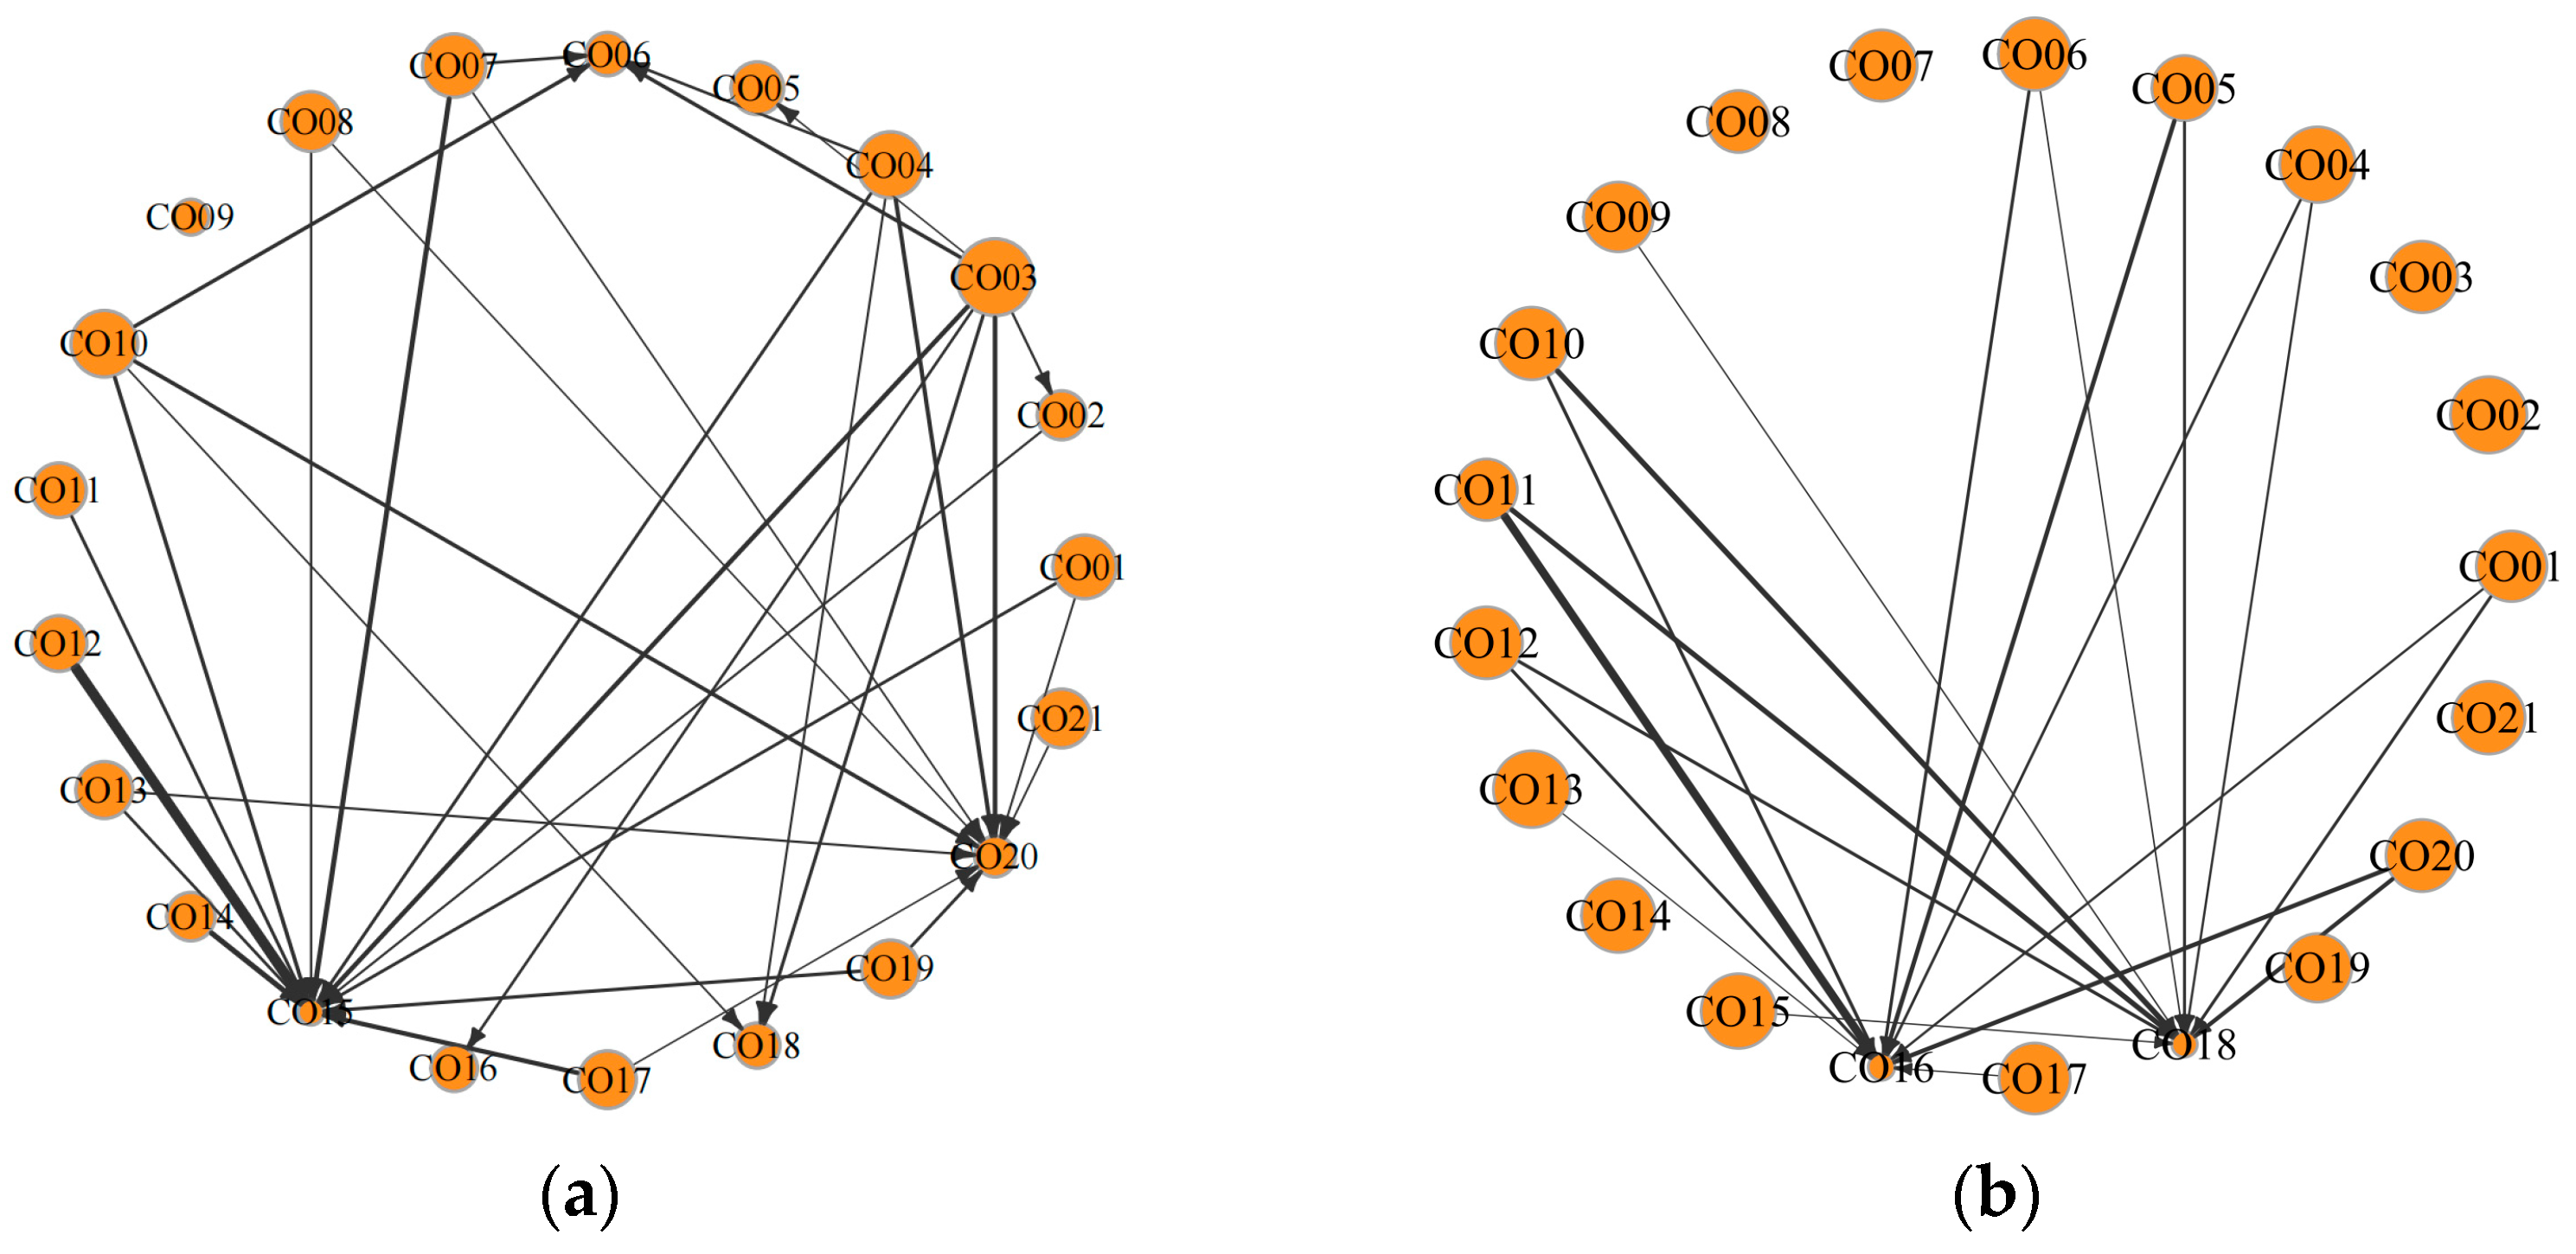
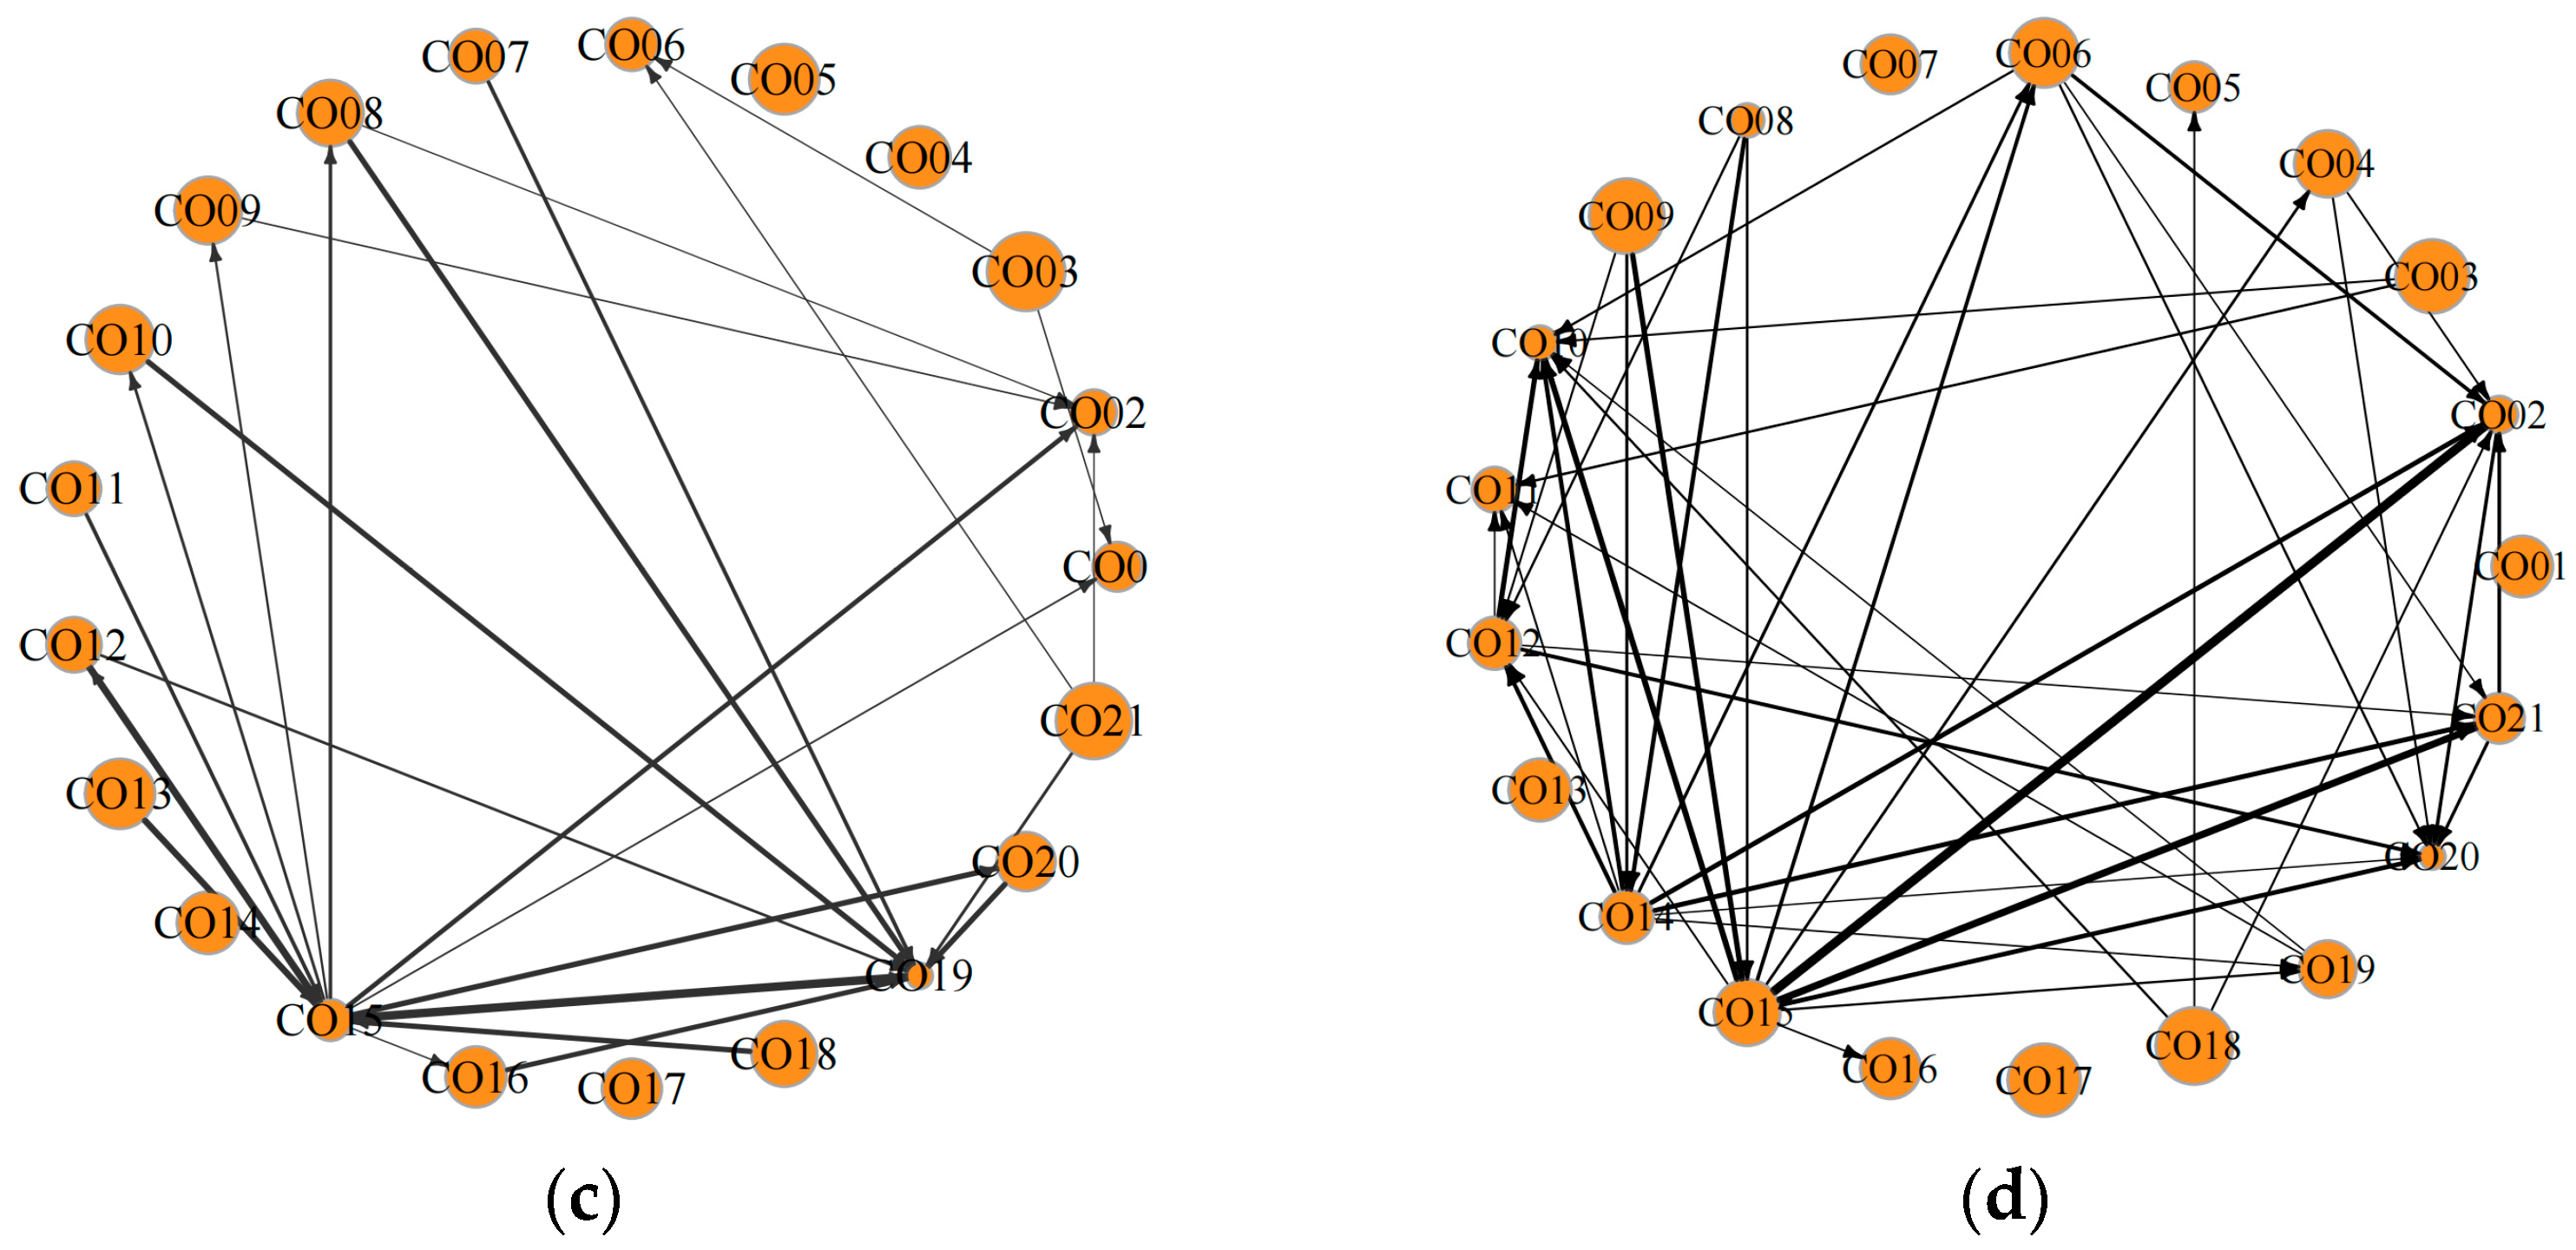
Figure 7a–d present the risk spillover network among coal firms for the full sample period and under the three major-event shocks. In the full sample, risk linkages among coal firms are relatively tight, with more edges, higher network density, and a typical clustering effect, indicating strong long-run co-movement and pronounced within-industry diffusion. During the global COVID-19 pandemic, the network simplifies markedly: the number of connections declines and risk transmission concentrates in a few firms, such as CO16 and CO18, implying that external demand shocks weakened some inter-firm linkages while reinforcing the central positions of certain firms. When the national carbon market officially launched, network complexity recovered to some extent but remained relatively diffuse overall, with several core firms (CO02, CO15, CO19) standing out in risk transmission. During the Russia-Ukraine conflict, network density and risk spillover intensity rose sharply, connections became near universal, and diffusion channels expanded significantly, reflecting a more substantial systemic impact of geopolitical shocks on the coal industry and widespread inter-firm risk co-movement.
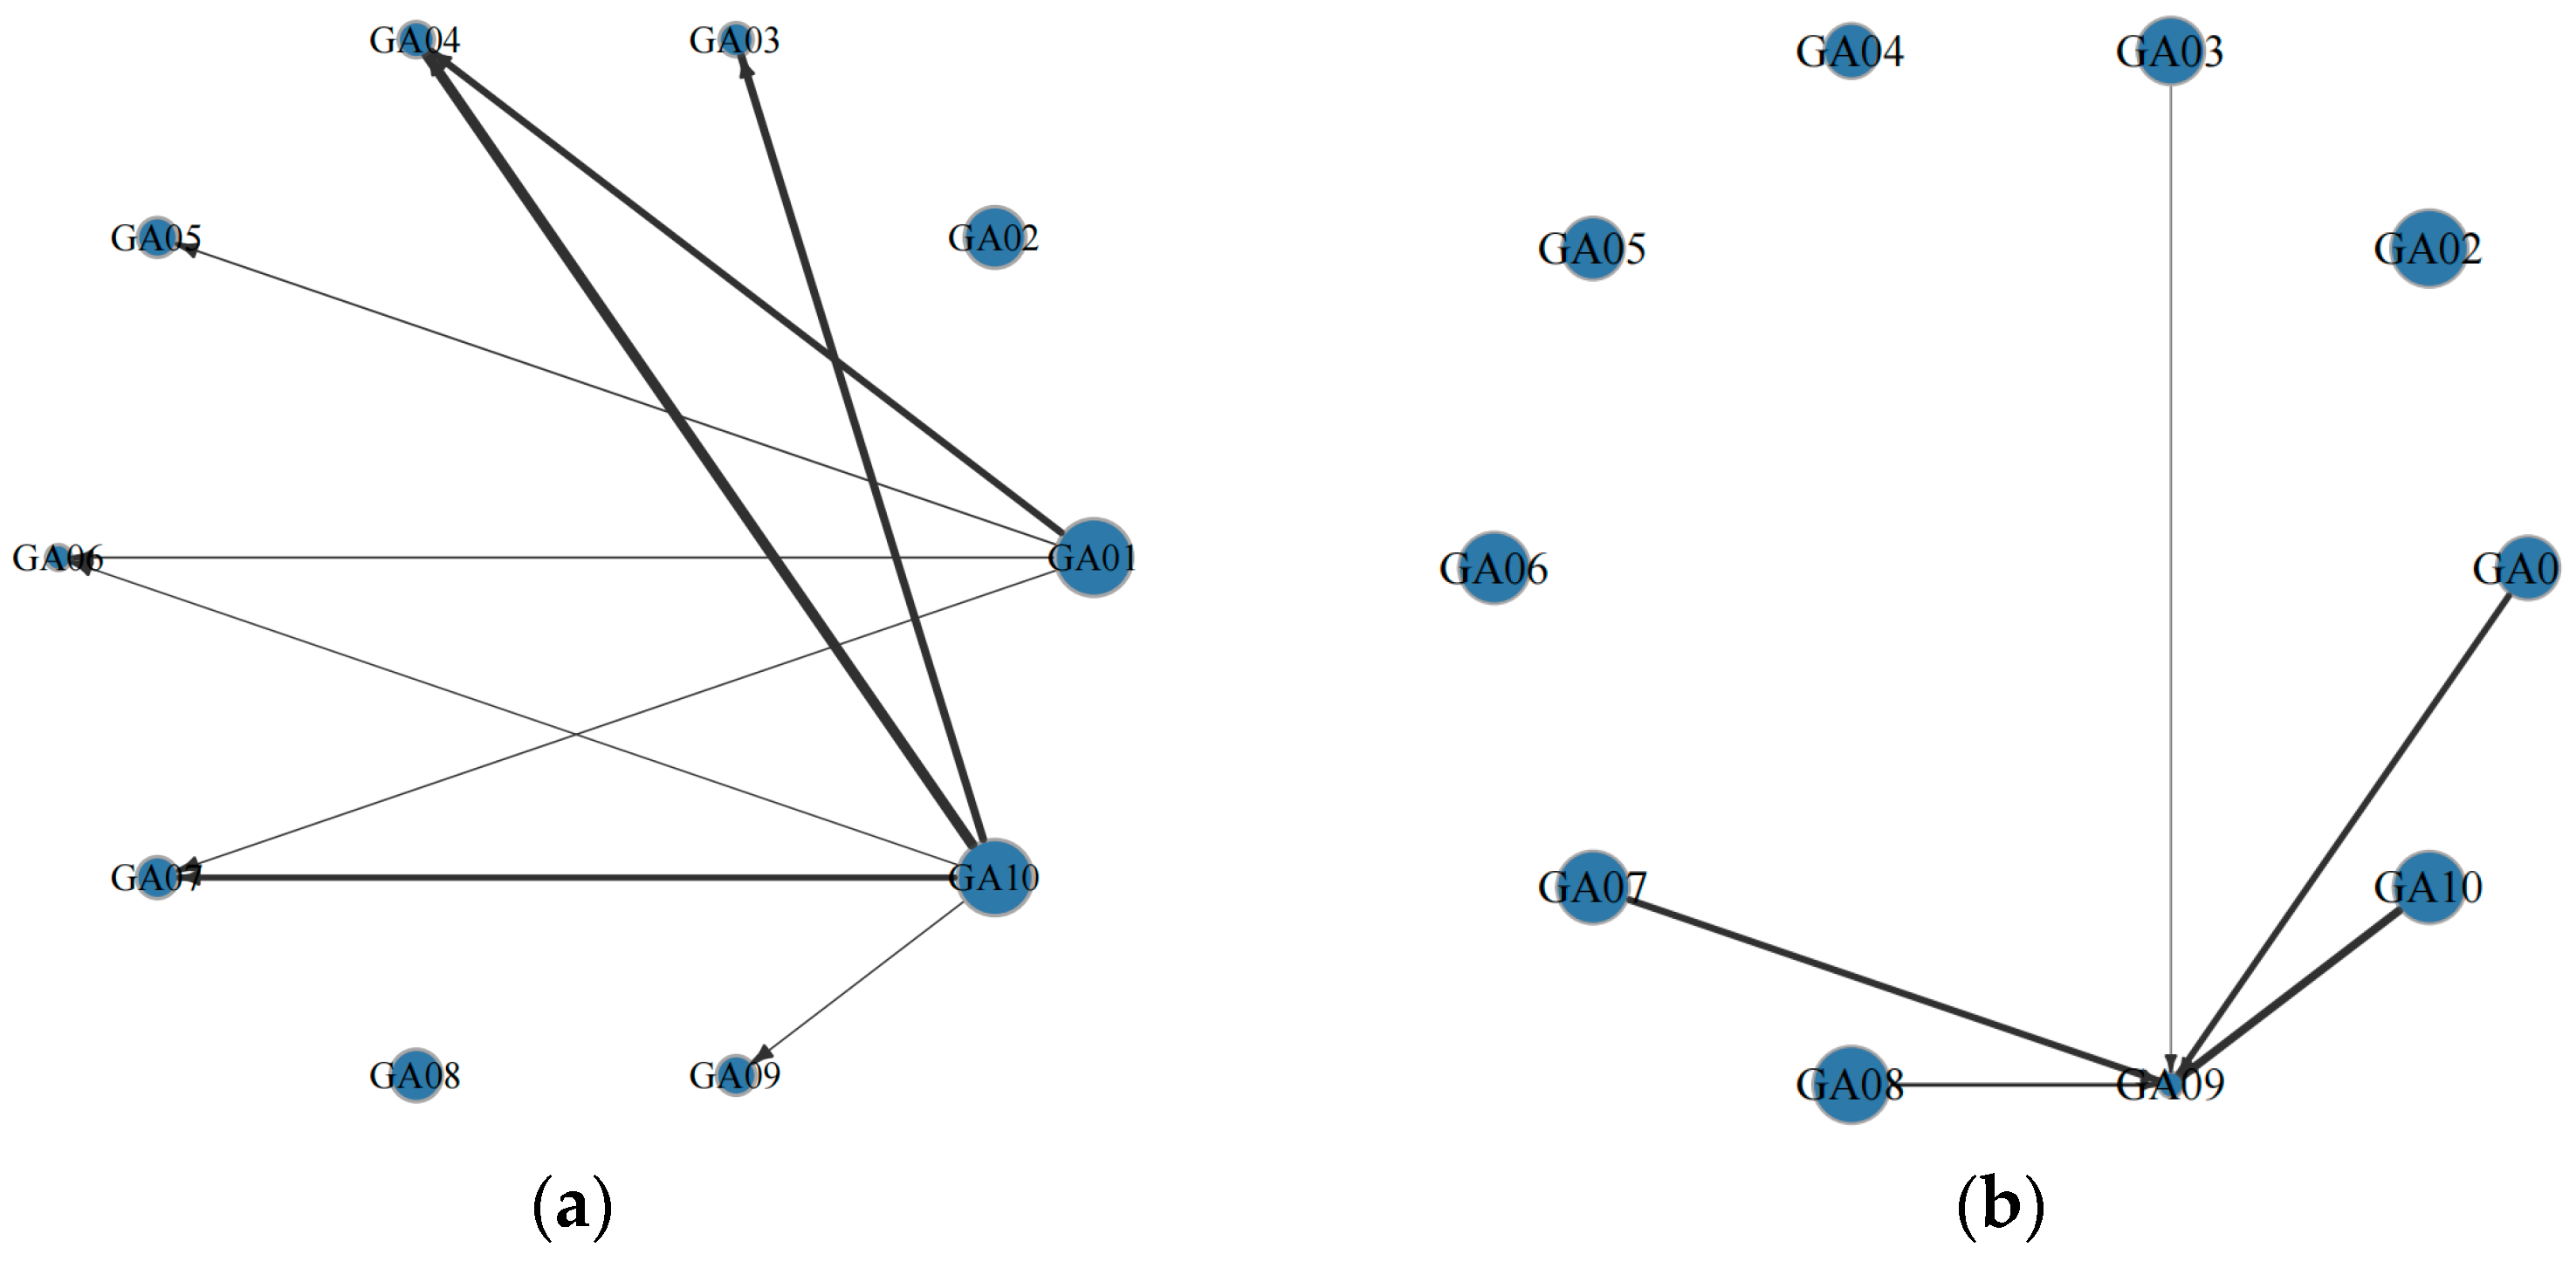
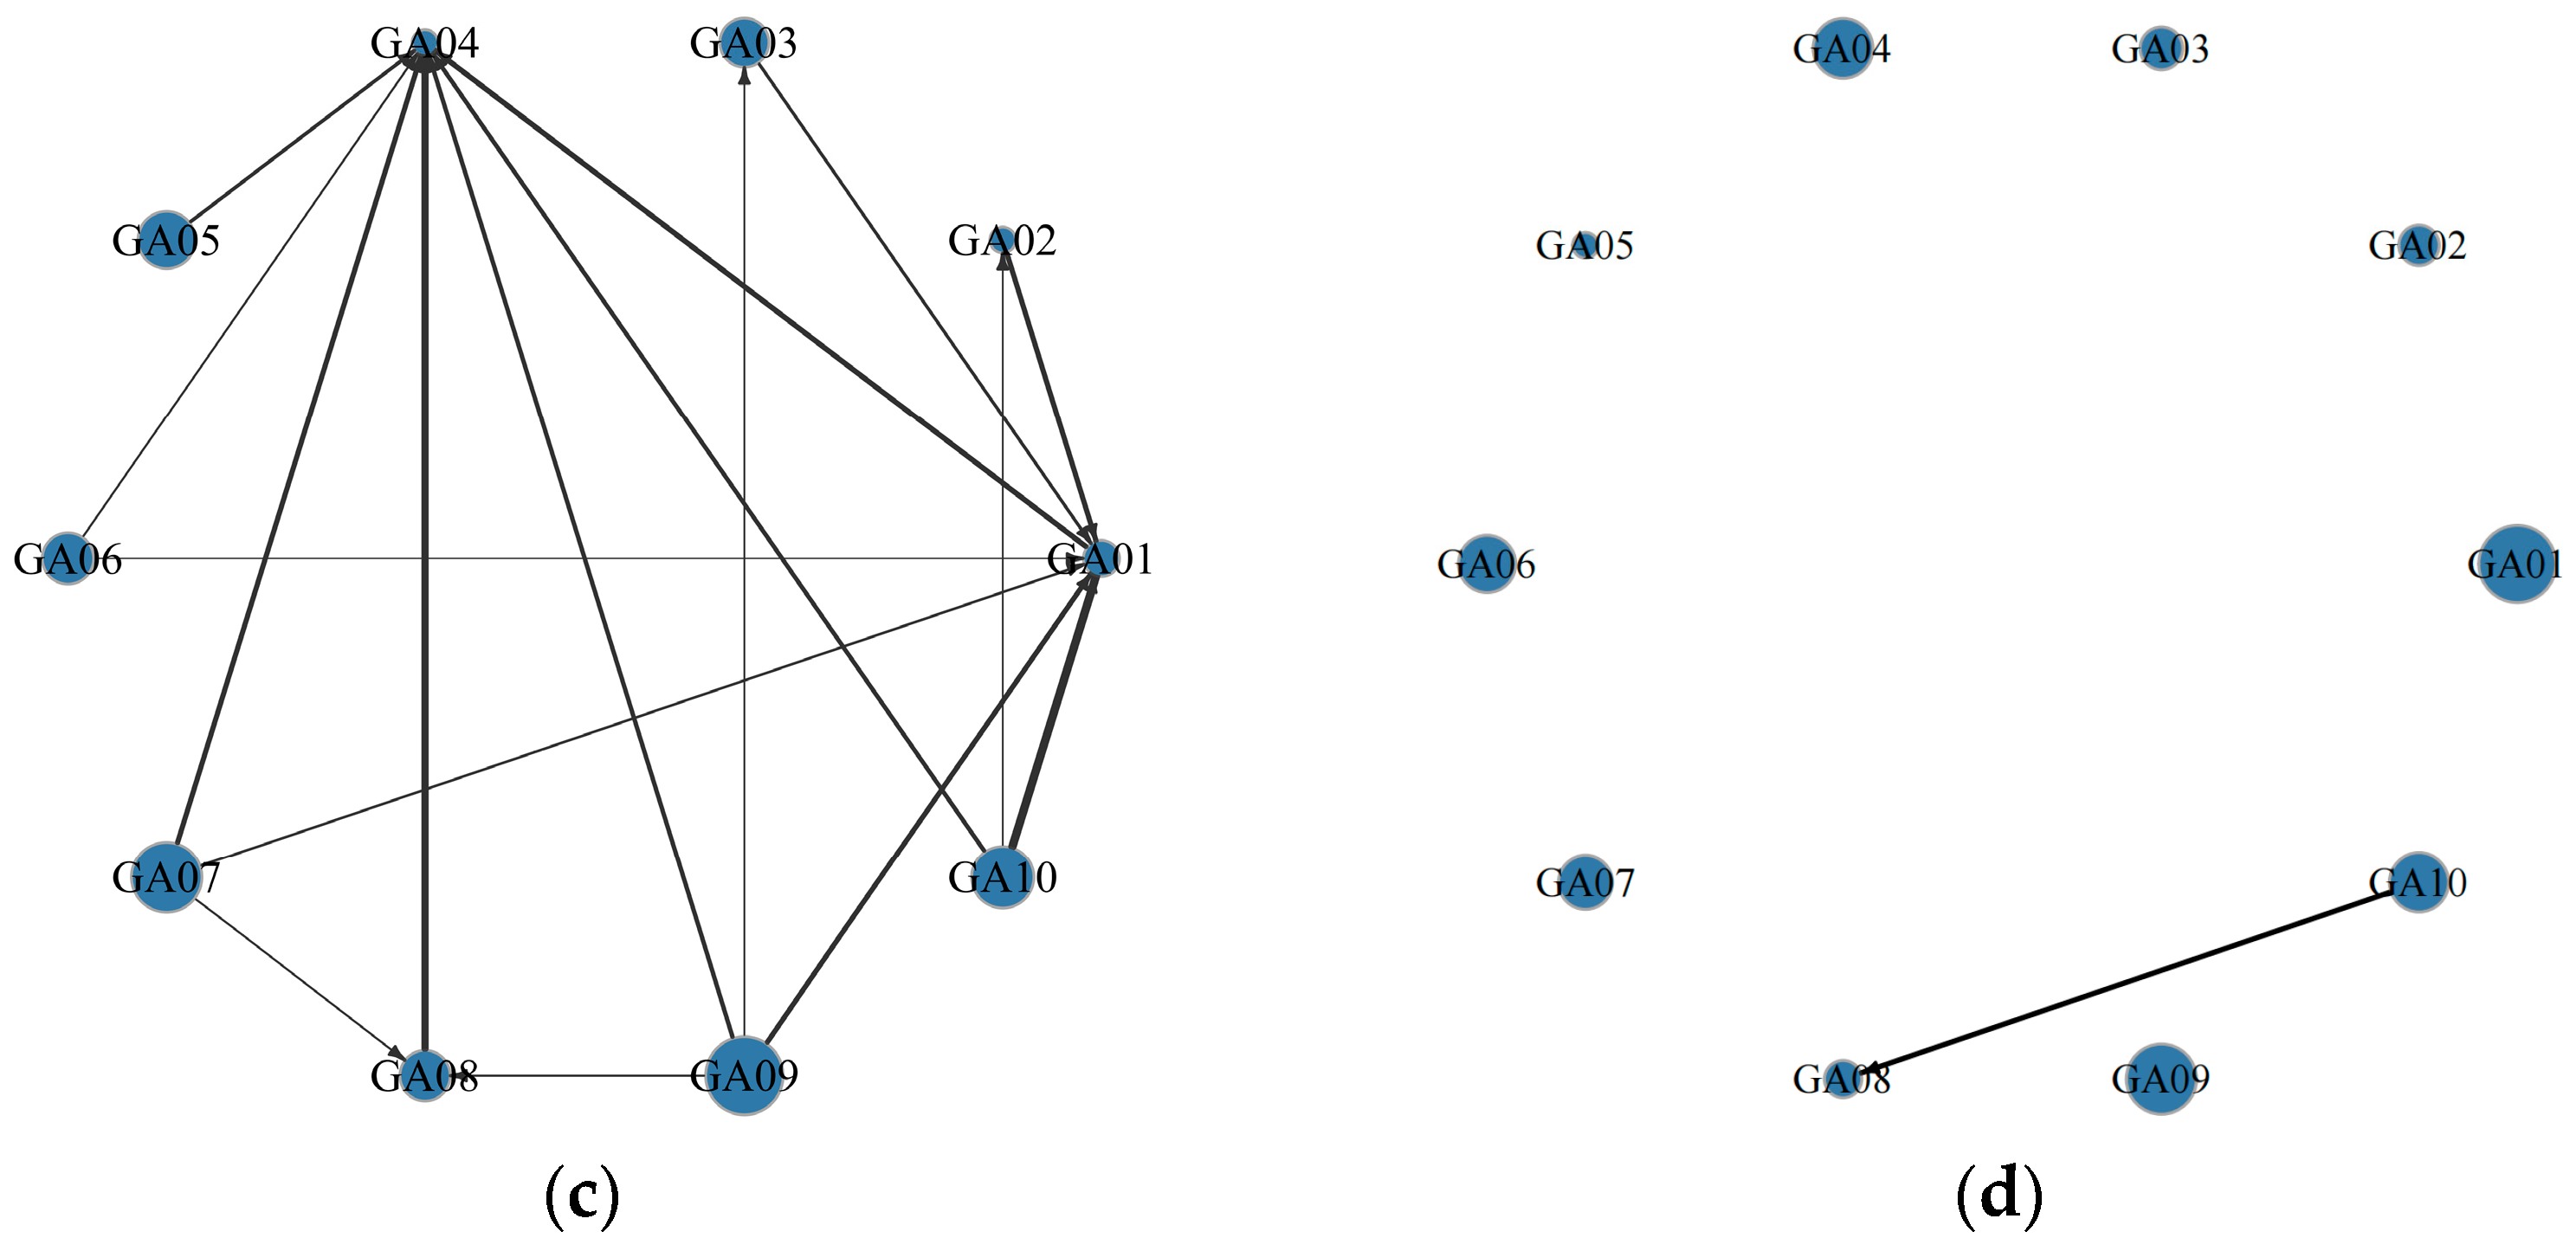
Figure 8a–d present the risk spillover network among gas firms for the full sample period and under the three major-event shocks. In the full sample, some risk linkages exist among gas firms, but the overall network is limited in scale; GA01 and GA10 act as central nodes, forming several stronger transmission edges. Network density is relatively low, indicating weaker intra-industry co-movement than in coal or clean energy. During the global COVID-19 pandemic, the network became markedly sparser, with only a few weak ties remaining; GA09 emerges as a relatively central node, and risk transmission becomes highly concentrated. This suggests that, amid collapsing demand and constrained economic activity, internal linkages among gas firms diminished and risk became concentrated in a few firms. When the national carbon market officially launched, network complexity rose sharply; GA01 and GA04 became key hubs of risk inflow (net receivers), the structure tightened relative to the full sample, and the range of connections broadened—evidence that institutional policy shocks strengthened co-movements among gas firms. During the Russia-Ukraine conflict, the network simplifies to an extreme: only GA10 spills over to GA08, while most inter-firm transmission paths disappear, indicating that geopolitical shocks impacted natural-gas firms in a highly uneven way, with risk concentrating in a small number of nodes.
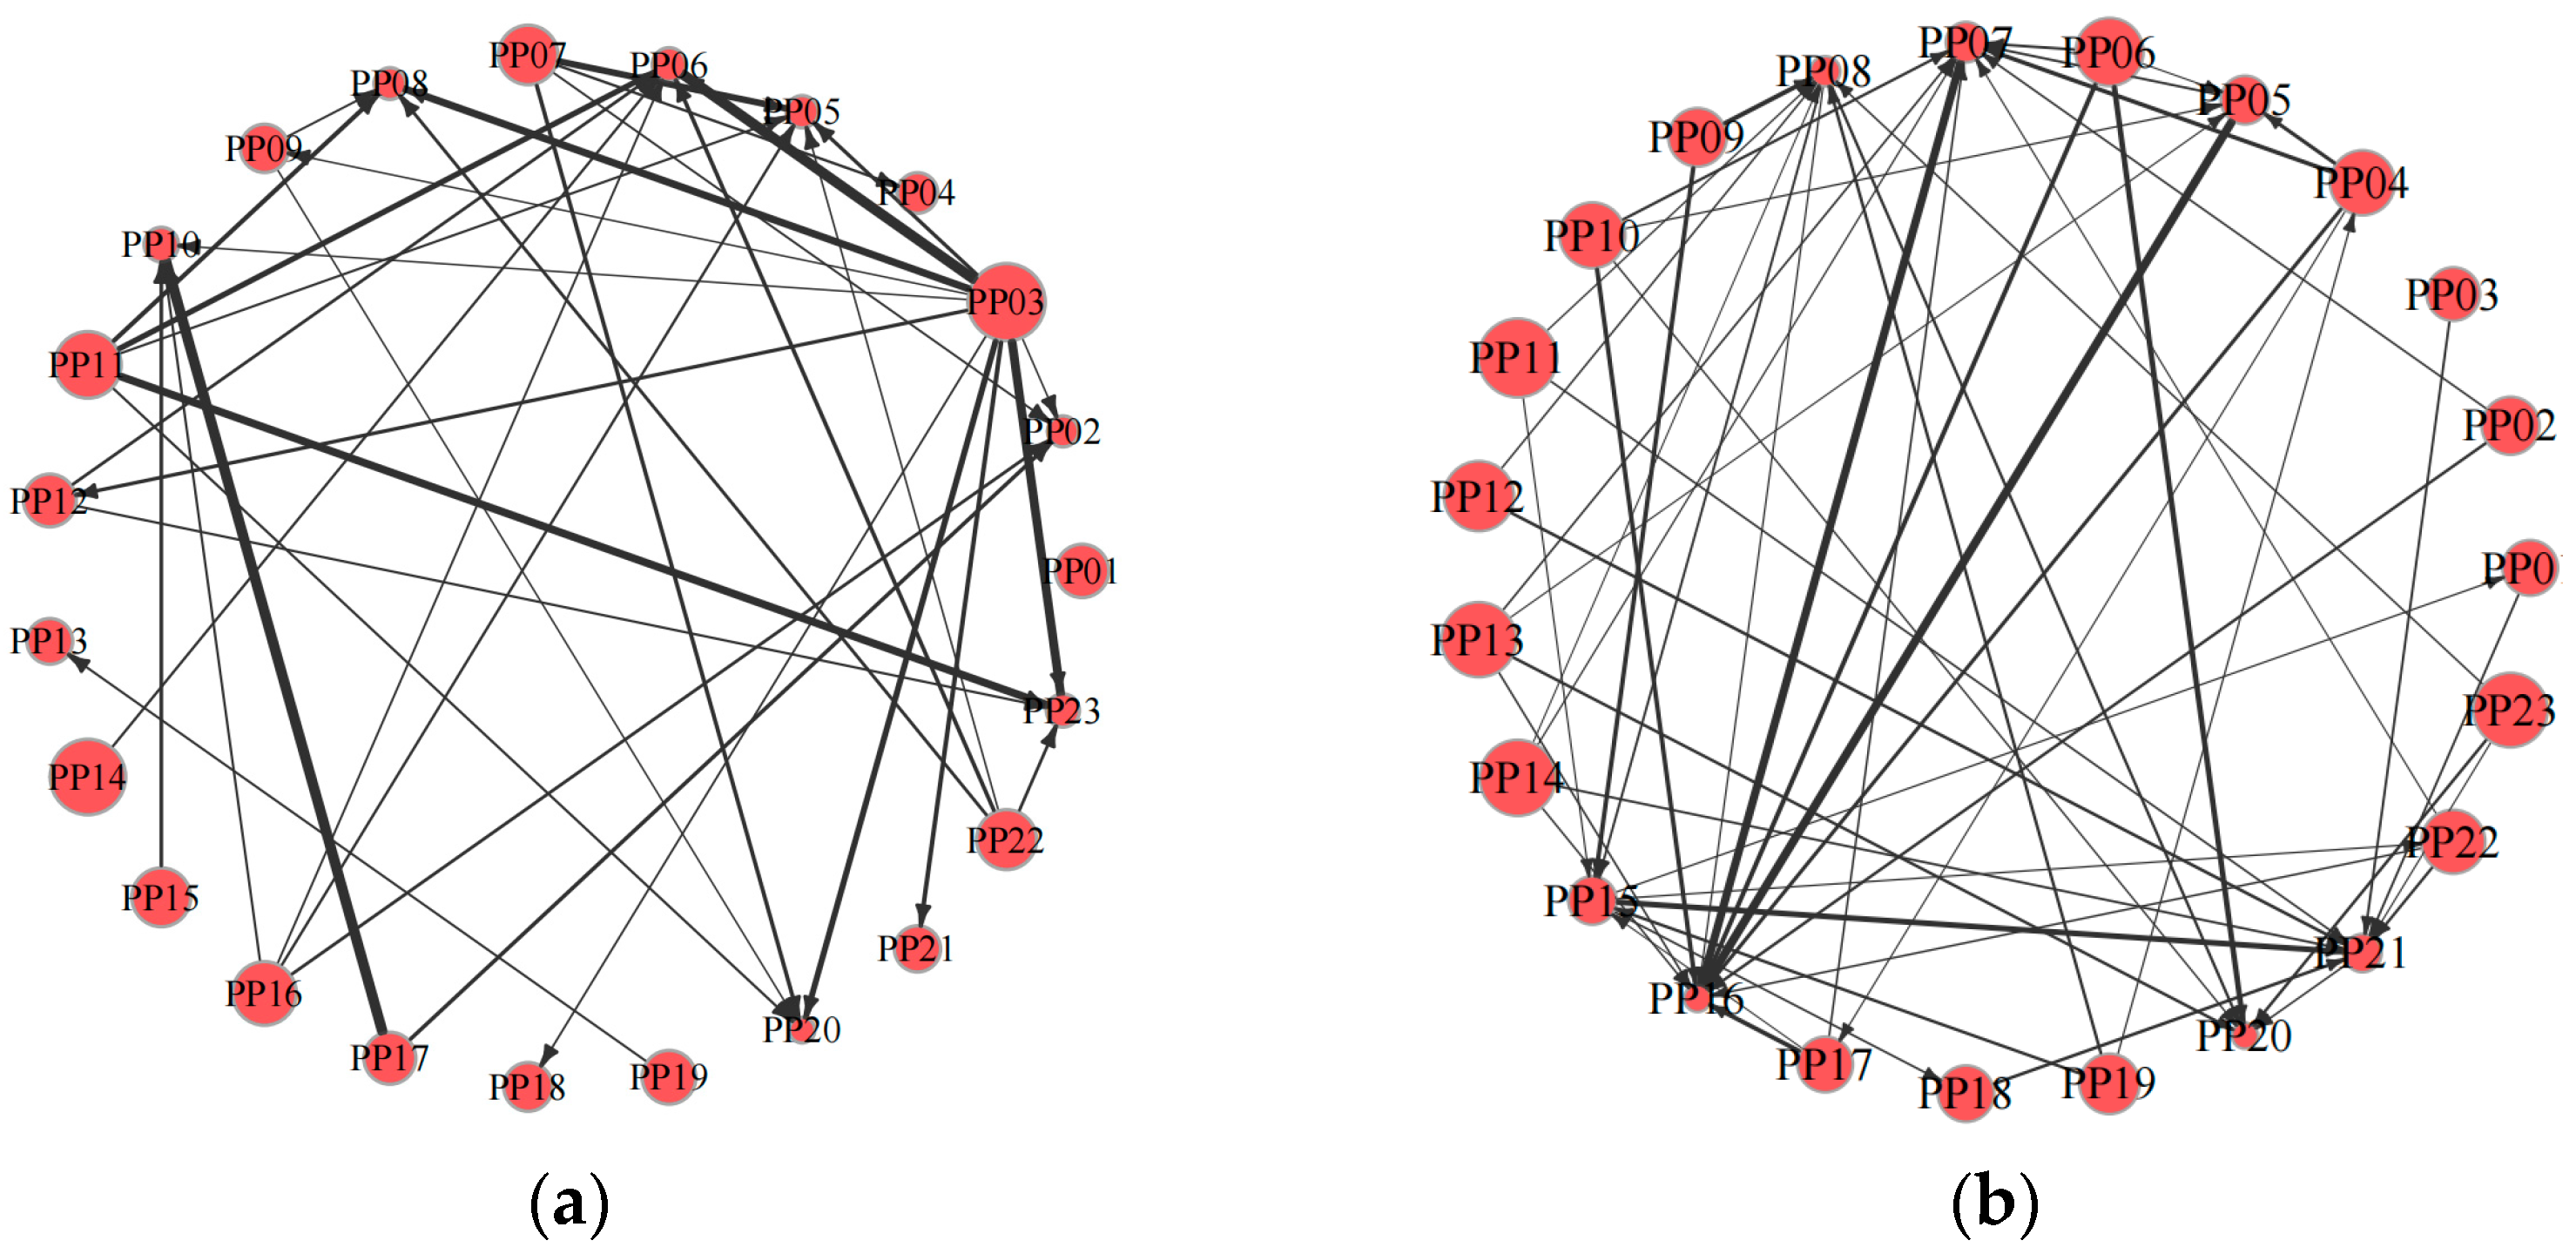
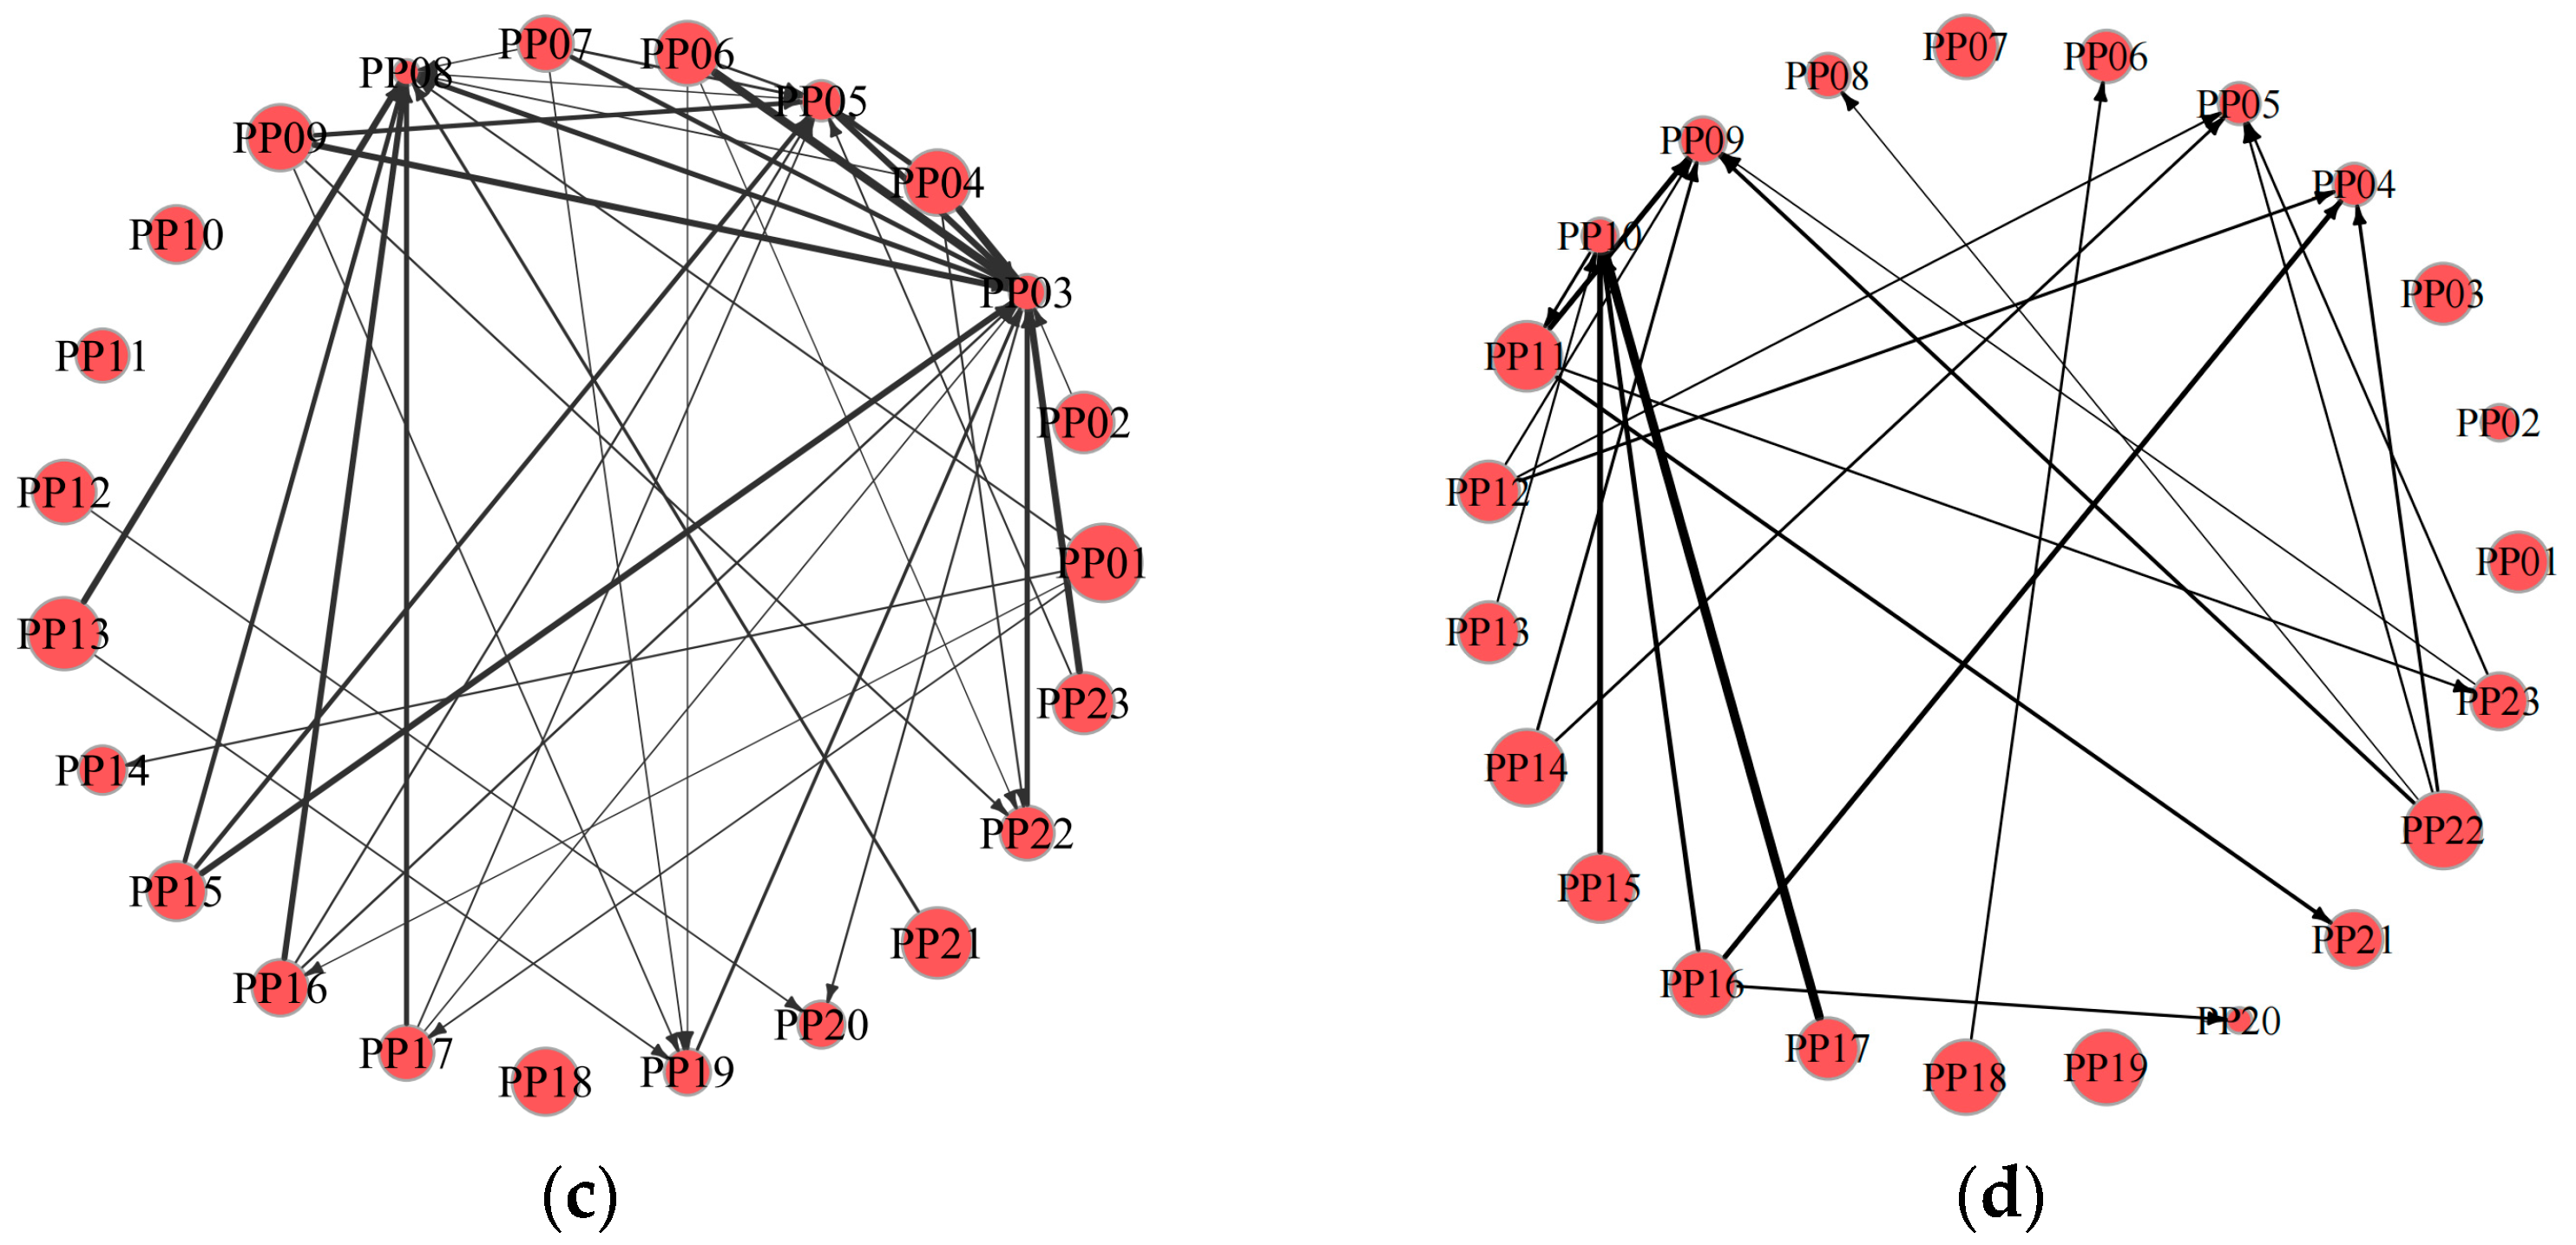
Figure 9a–d present the risk spillover network among Petroleum and Petrochemical firms for the full sample period and under the three major-event shocks. In the full sample, linkages are dense and the network is highly complex, with many bidirectional or strong ties, indicating widespread within-industry risk transmission. During the global COVID-19 pandemic, the network structure strengthened further, connections among nodes became more diverse, and diffusion channels increased markedly, showing that under the pandemic shock, the industry is susceptible to demand fluctuations and systemic risk accumulated rapidly. When the national carbon market was officially launched, complexity eased slightly relative to the pandemic period but remained strongly connected. During the Russia-Ukraine conflict, network density declined noticeably, the number of links fell, and some strong ties disappeared, suggesting that amid sharp swings in international energy prices, risk did not diffuse broadly across the industry but concentrated among a small set of firms.
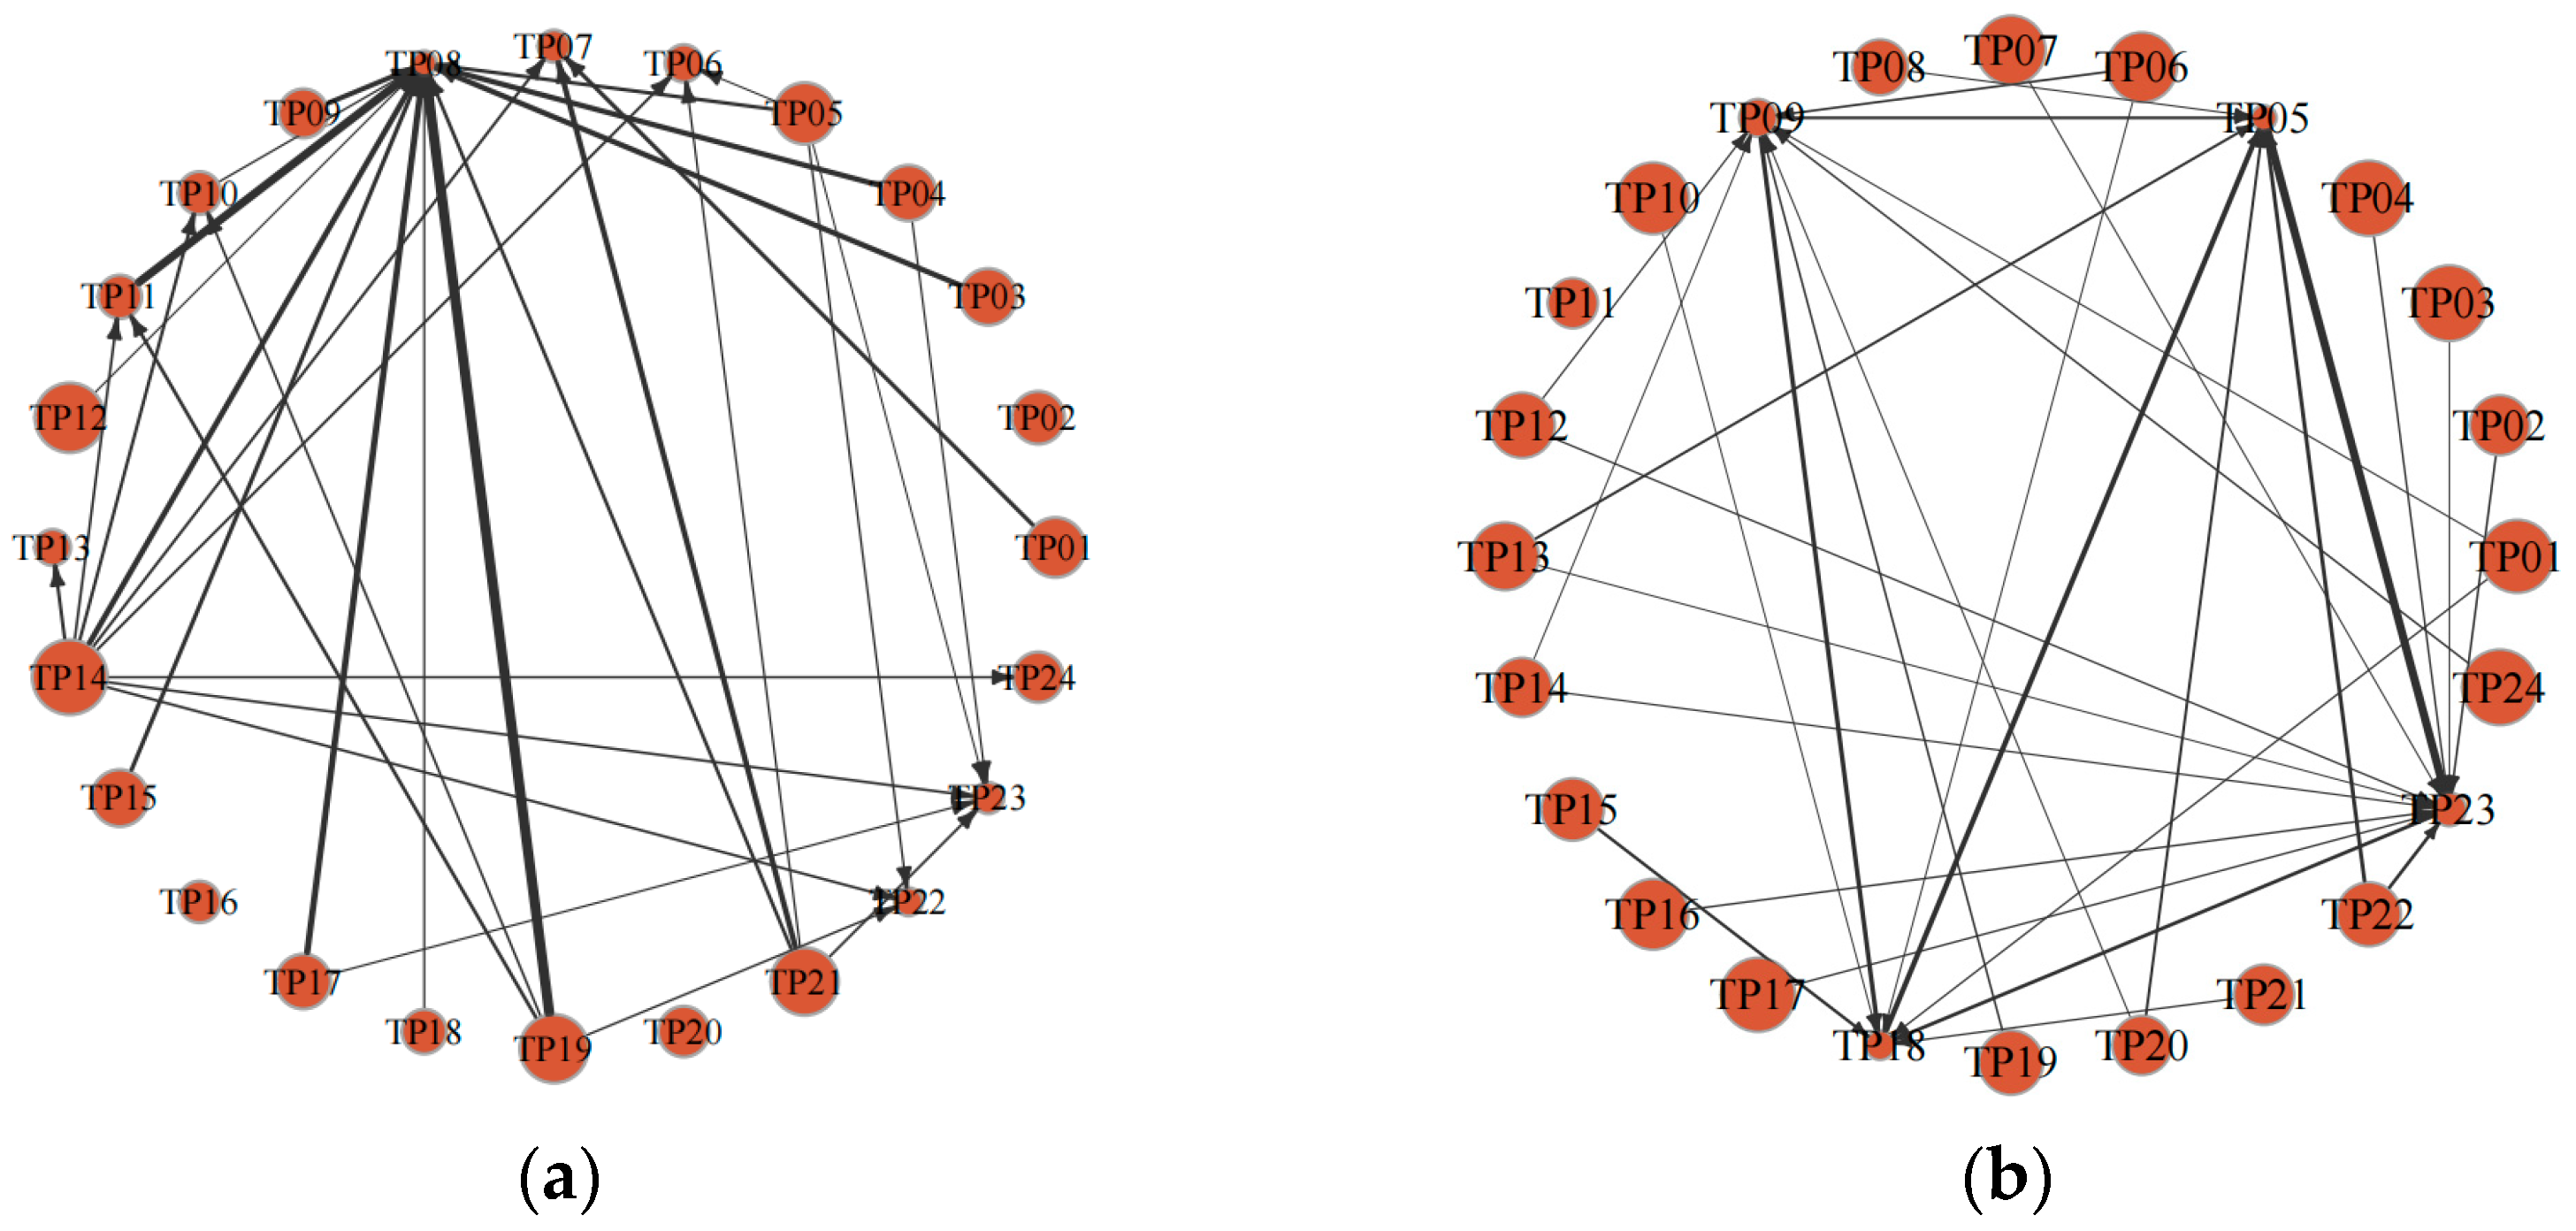
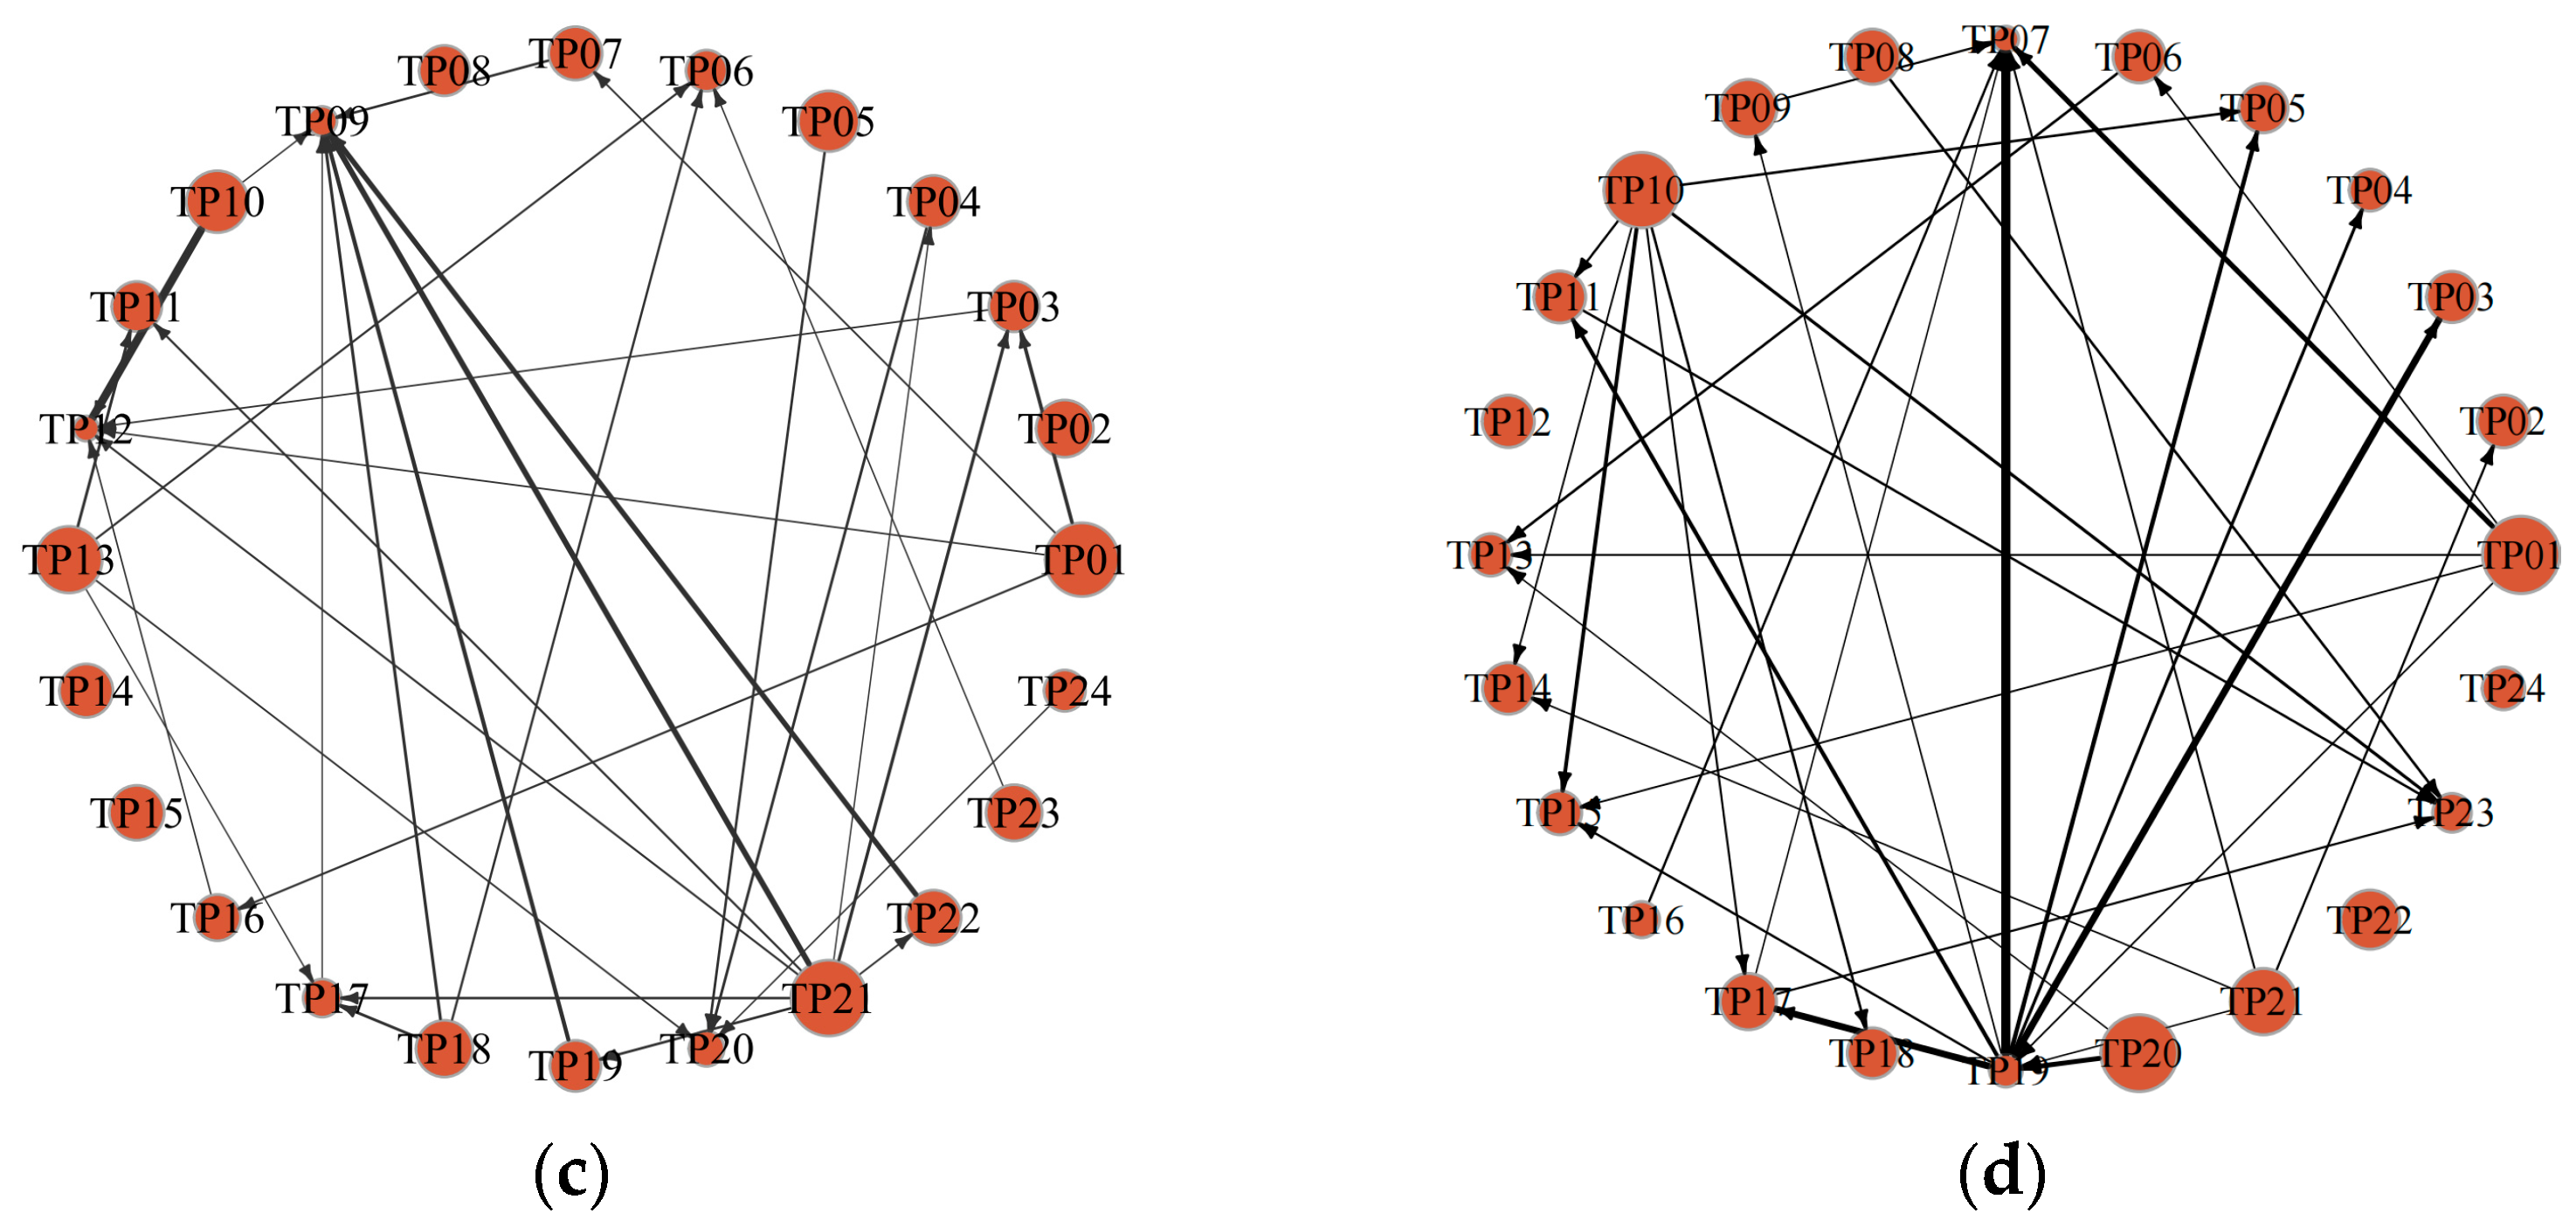
Figure 10a–d present the risk spillover network among thermal-power firms for the full sample period and under the three major-event shocks. In the full sample, the network has many edges, with firms such as TP08 and TP14 occupying core positions and bearing strong risk-inflow and risk-outflow roles, respectively. During the global COVID-19 pandemic, the network expanded further; nodes such as TP05 and TP23 emerged as new centers, indicating broad co-movement among thermal-power firms under a demand shock. When the national carbon market was officially launched, the network contracted, but firms such as TP02 and TP09 maintained high centrality. During the Russia-Ukraine conflict, network density rose again, and firms such as TP07 and TP01 became new core nodes, suggesting that geopolitical shocks intensified risk resonance among thermal-power firms. Overall, thermal-power firms exhibit highly dynamic and concentrated risk transmission under external shocks, with certain core firms consistently serving as critical hubs at different stages.

5. Impulse-Response Analysis Under External Uncertainty Shocks

5.1. Data Selection and Processing

The preceding analysis compared the internal spillover networks of the energy system during the full-sample period and major event periods. Although this comparison reveals changes in the risk spillover network during major events, it cannot capture the dynamic impacts on the energy industries. Therefore, this section further employs impulse-response analysis to examine the dynamic effects of external shocks on risk transmission across the energy industries. As mentioned in the theoretical analysis section, four principal drivers were identified—macroeconomic and market factors, policy and institutional factors, major unexpected events, and climate and natural disasters—so, to remain consistent, this section uses China’s economic policy uncertainty (EPU), climate policy uncertainty (CPU), and the China’s geopolitical risk (GPR) index as the uncertainty shocks, with the sample spanning 2018–2024. The CPU index adopts the U.S. climate policy uncertainty index constructed by [50]; following [51], because the United States is the world’s largest economy, the U.S. CPU can proxy global climate-policy risk. We sum the cross-industry risk inflows computed from Equation (12) to obtain a monthly series of total inflows from other industries, which serves as the dependent series for analysis. Data on China’s EPU and CPU are drawn from the database developed by [52]. The China geopolitical risk index comes from [53], which is constructed from counts of newspaper articles discussing geopolitical tensions.
The time series of cross-industry risk inflow levels computed for the five energy industries are non-stationary, so we take first differences. First differencing not only yields a stationary series but also captures period-to-period changes in risk inflows, which have a clear economic meaning. Descriptive statistics for all variables are reported in Table 7. All variables have VIF values below 5, indicating that there is no multicollinearity among the variables.

5.2. Parameter Estimation of the TVP-SV-VAR Model

Random-walk priors are adopted because risk connectedness in the energy sector evolves smoothly over time; this specification flexibly captures gradual parameter drift consistent with real-world energy markets. Before estimating the parameters, we determine an appropriate lag order; based on the AIC criterion, we set the lag to 1. Following [54], parameters are estimated via a Markov chain Monte Carlo (MCMC) algorithm using Gibbs sampling, implemented in MATLAB R2023b. The MCMC algorithm employs Gibbs sampling to simulate the posterior distribution of economic variables. To ensure that the sampling distribution closely approximates the true posterior distribution, 20,000 iterations are conducted, with the first 2000 iterations discarded as burn-in. The posterior means of the parameters in the TVP-SV-VAR model fall within the 95% confidence intervals, the Geweke diagnostic values are below 1.96, and the inefficiency factors are all less than 100. These results indicate that the parameter estimates are valid. The estimation results are shown in Table 8.

5.3. Impulse-Response Analysis of the Energy Industry Under Uncertainty Shocks

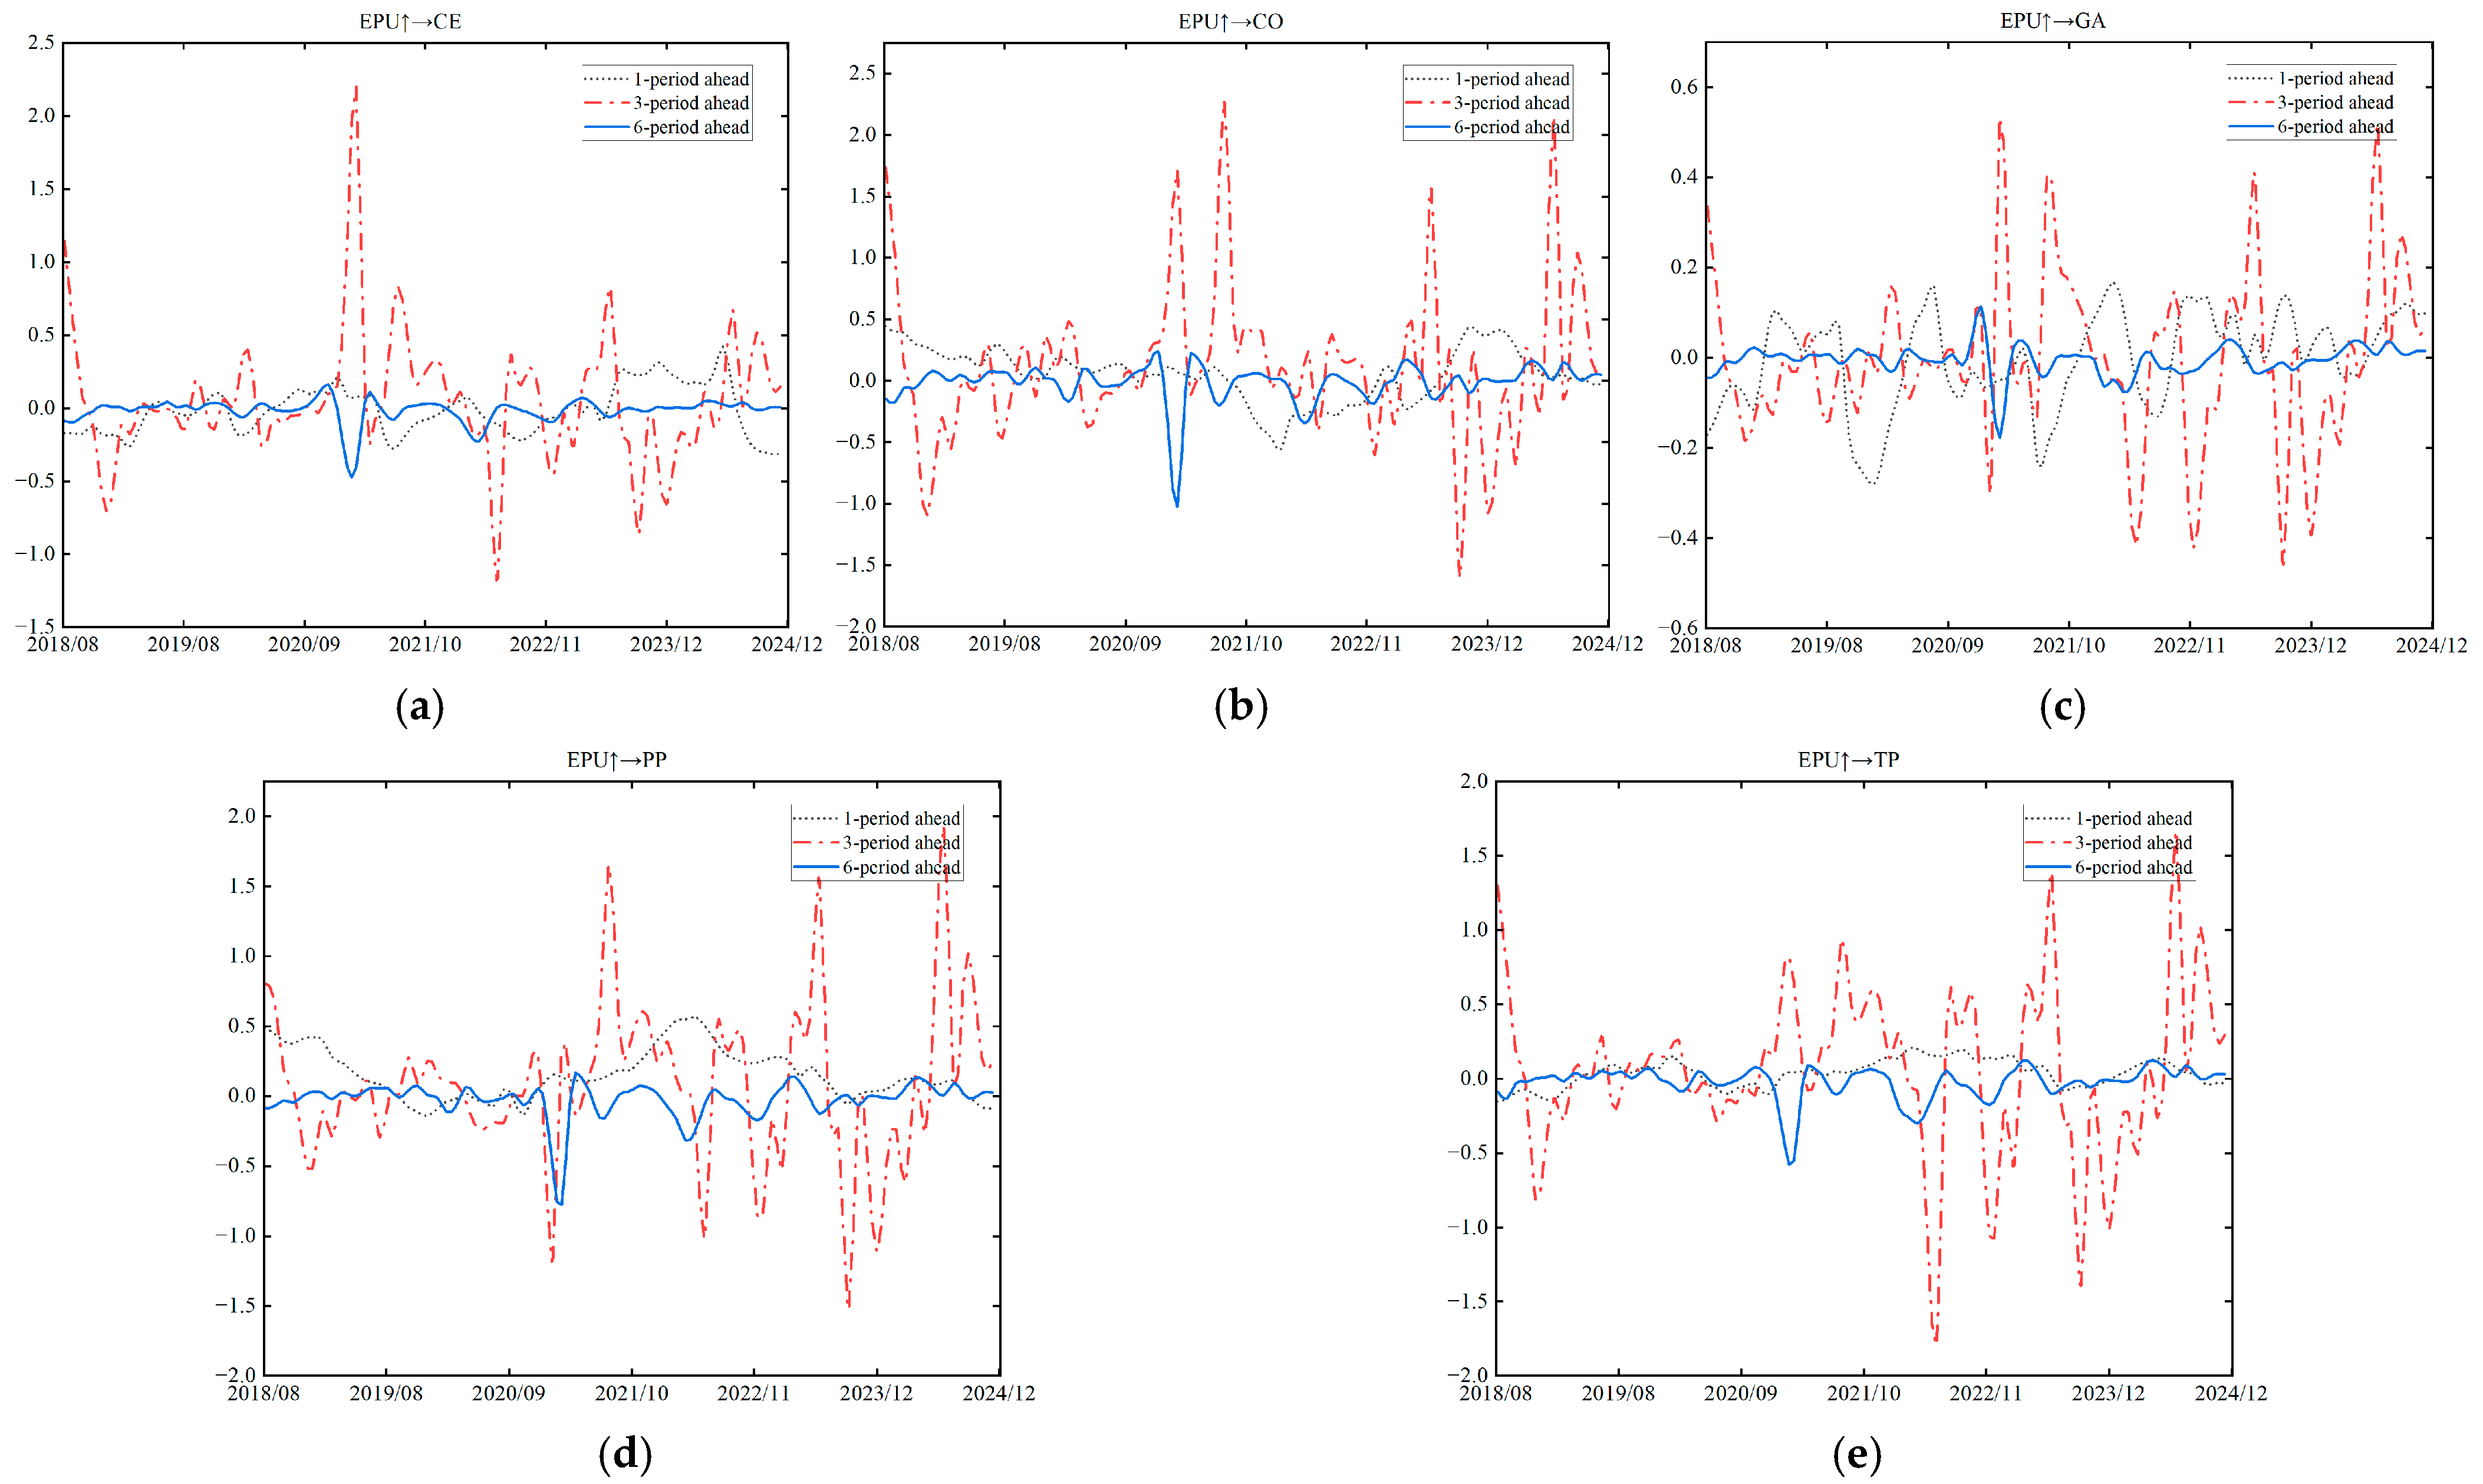
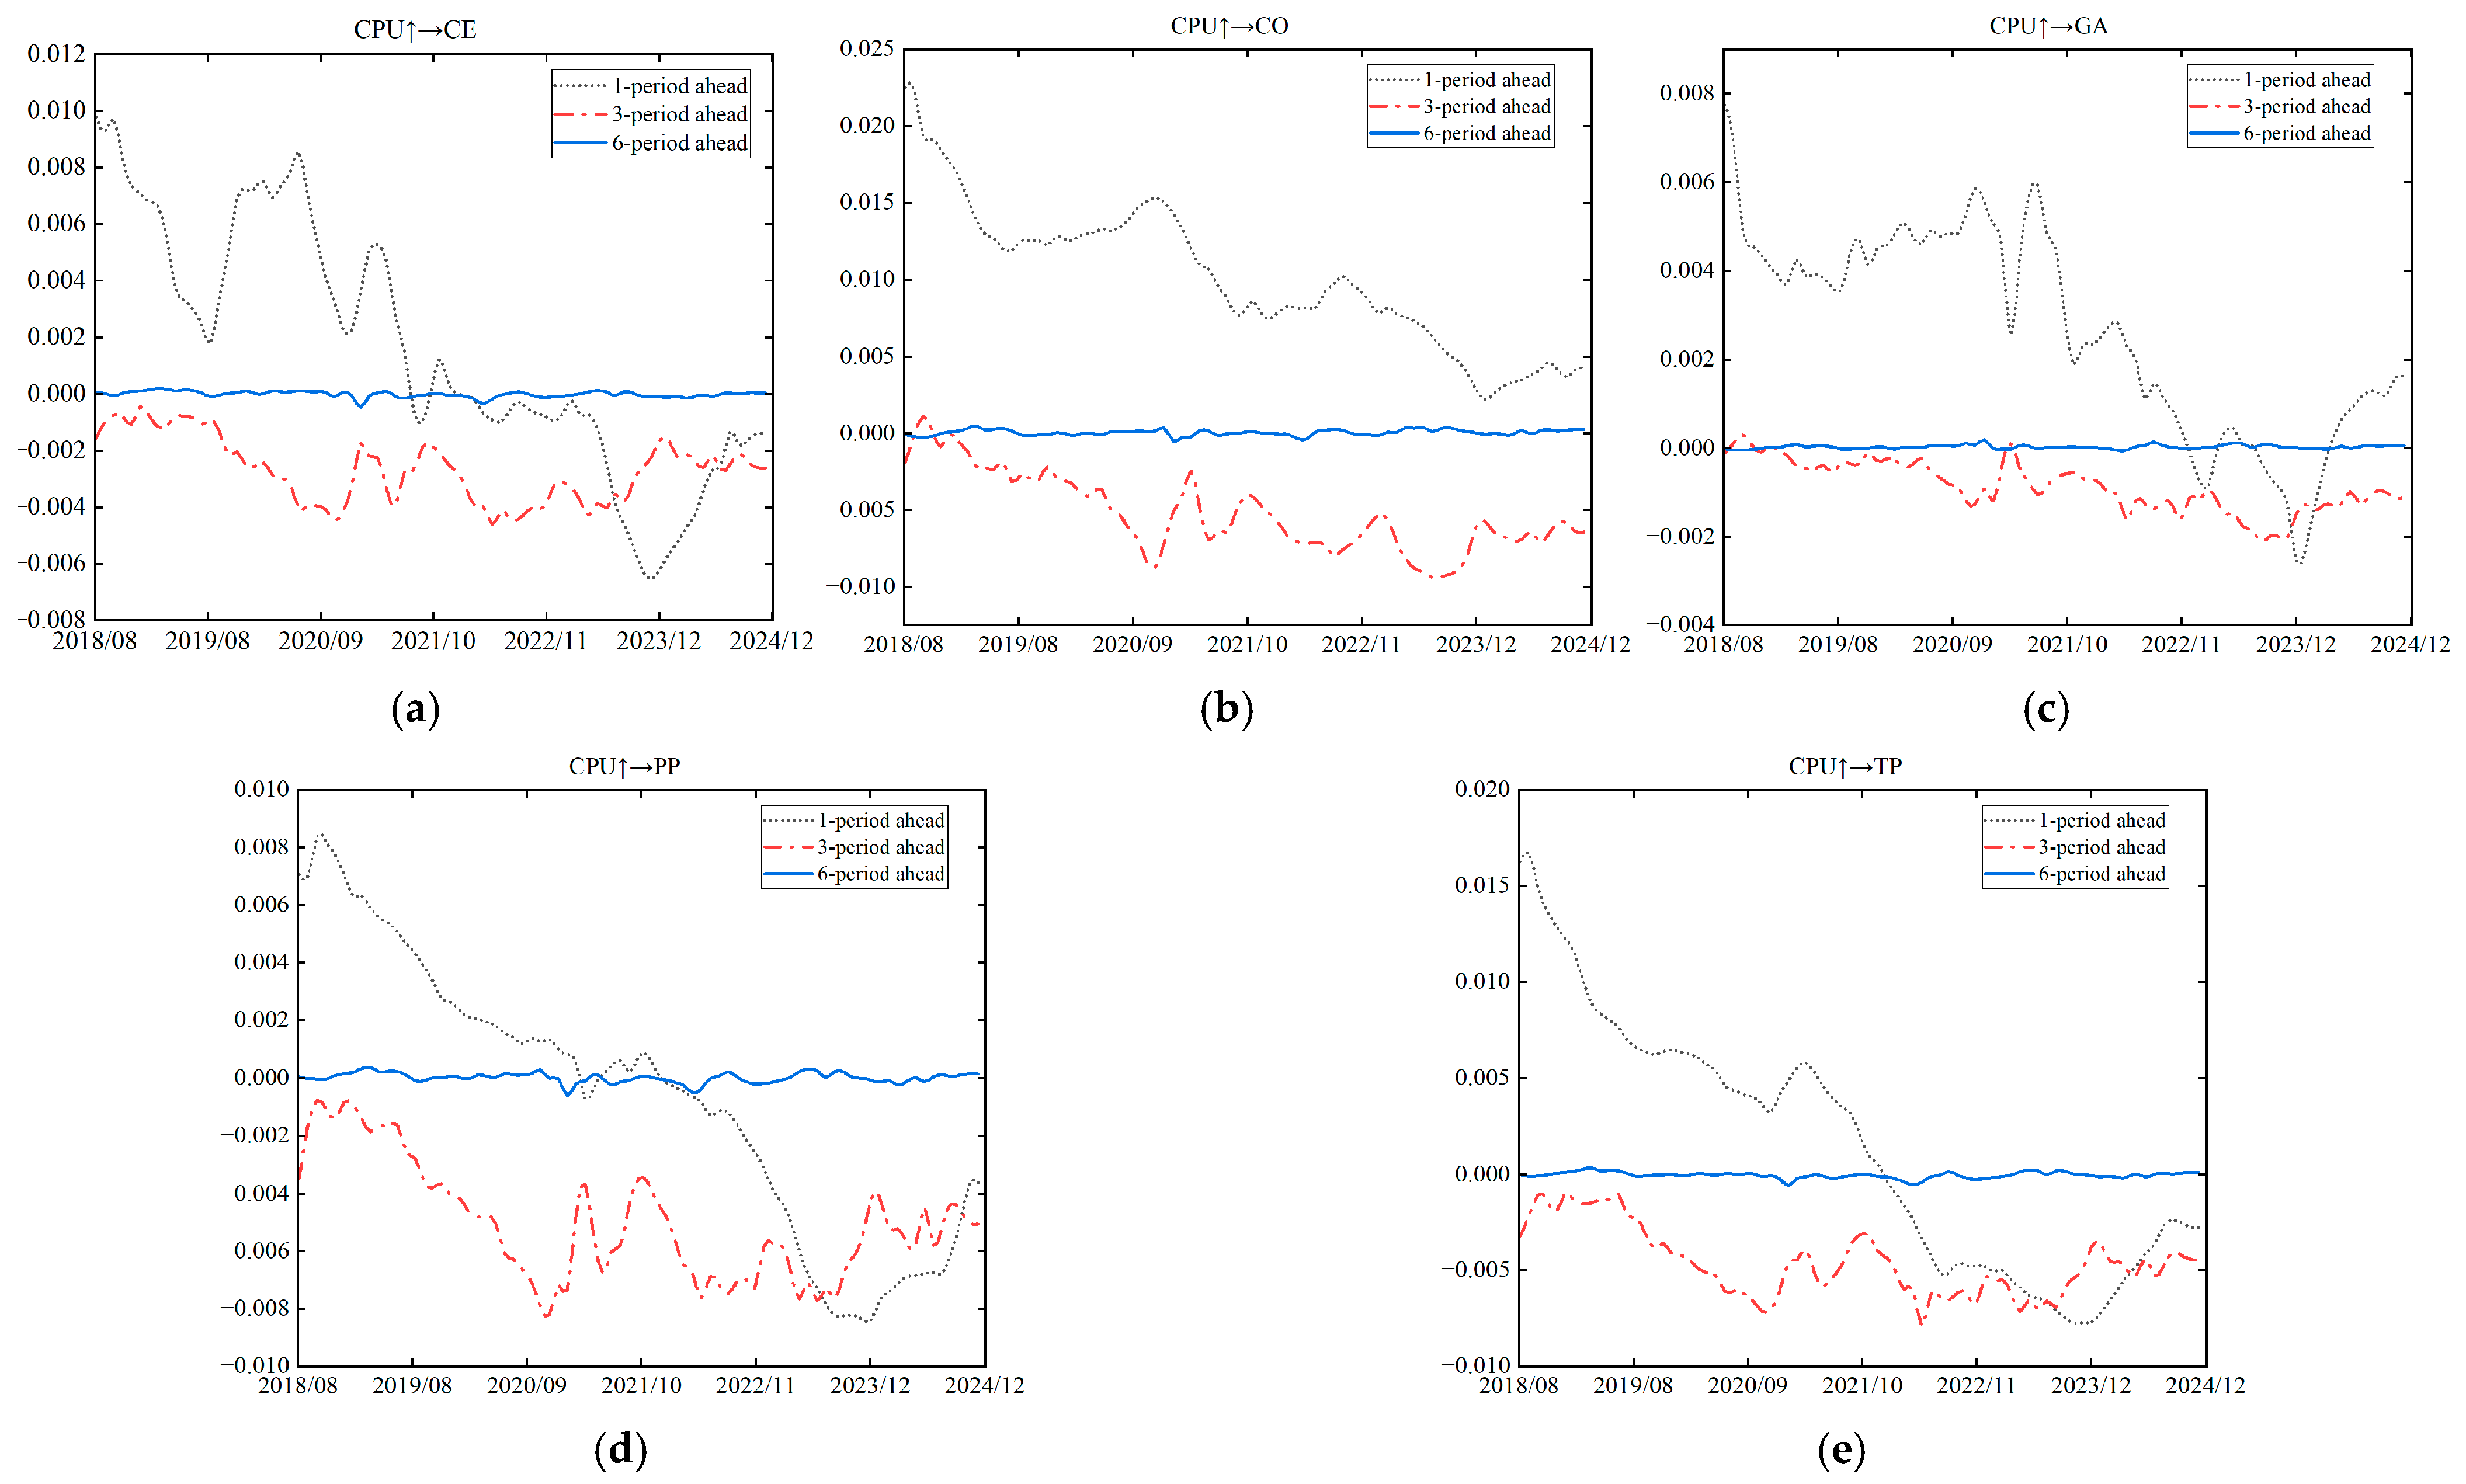
This section depicts the impulse responses of the five energy industries to economic policy uncertainty, climate policy uncertainty, and geopolitical risk. Forecast horizons are set to 1, 3, and 6 periods, corresponding to short-, medium-, and long-term windows at the monthly, quarterly, and semiannual scales. The impulse responses are shown in Figure 11, Figure 12 and Figure 13; in each figure, the horizontal axis indicates the number of periods after the shock, and the vertical axis shows the standardized response of the energy industry to the uncertainty shock.
Figure 11a–e show that the five energy sub-industries exhibit marked dynamic differences following an economic policy uncertainty shock. Overall, volatility is stronger in the short to medium term, consistent with [55]. With mid-horizon responses exceed short-horizon responses, indicating transmission lags in policy effects. As the horizon extends, the impacts gradually dissipate, consistent with the transience and phase-specific nature of such shocks. In terms of amplitude, the gas industry responds the least, whereas coal and petroleum & petrochemicals display the largest responses. The smaller reaction of gas reflects price regulation, long-term contracting, and more diversified supply sources, which prevent external uncertainty from quickly amplifying into spot and end-user price volatility. By contrast, coal and petroleum & petrochemicals are more sensitive to policy and the macro cycle; uncertainty in economic policy transmits rapidly through high-elasticity channels such as production costs, producing stronger impulse responses.
Figure 12a–e show that the five energy sub-industries exhibit pronounced dynamic differences following a climate policy uncertainty shock. Overall, industries display a positive short-term response immediately after the shock, ref. [18] which also supports this view; after 2021, however, the short-term impulse responses of the clean-energy, gas, petroleum & petrochemical, and thermal-power industries turn from positive to negative. This indicates that climate policy uncertainty initially raises risk in the energy sector. At the same time, over time, the operation of the national carbon market, gas/coal storage and supply-guarantee mechanisms, and the marketization of electricity pricing enhance short-term risk-buffering capacity. In the medium term, the impulse responses are consistently negative, and in the long term, they are relatively stable. By industry, coal and thermal power experience the most substantial short-term effects—significantly larger than those of other industries—because of their pillar roles in China’s energy-consumption mix; heightened climate policy uncertainty intensifies environmental regulation on coal and thermal power, amplifying their short-term shock responses.
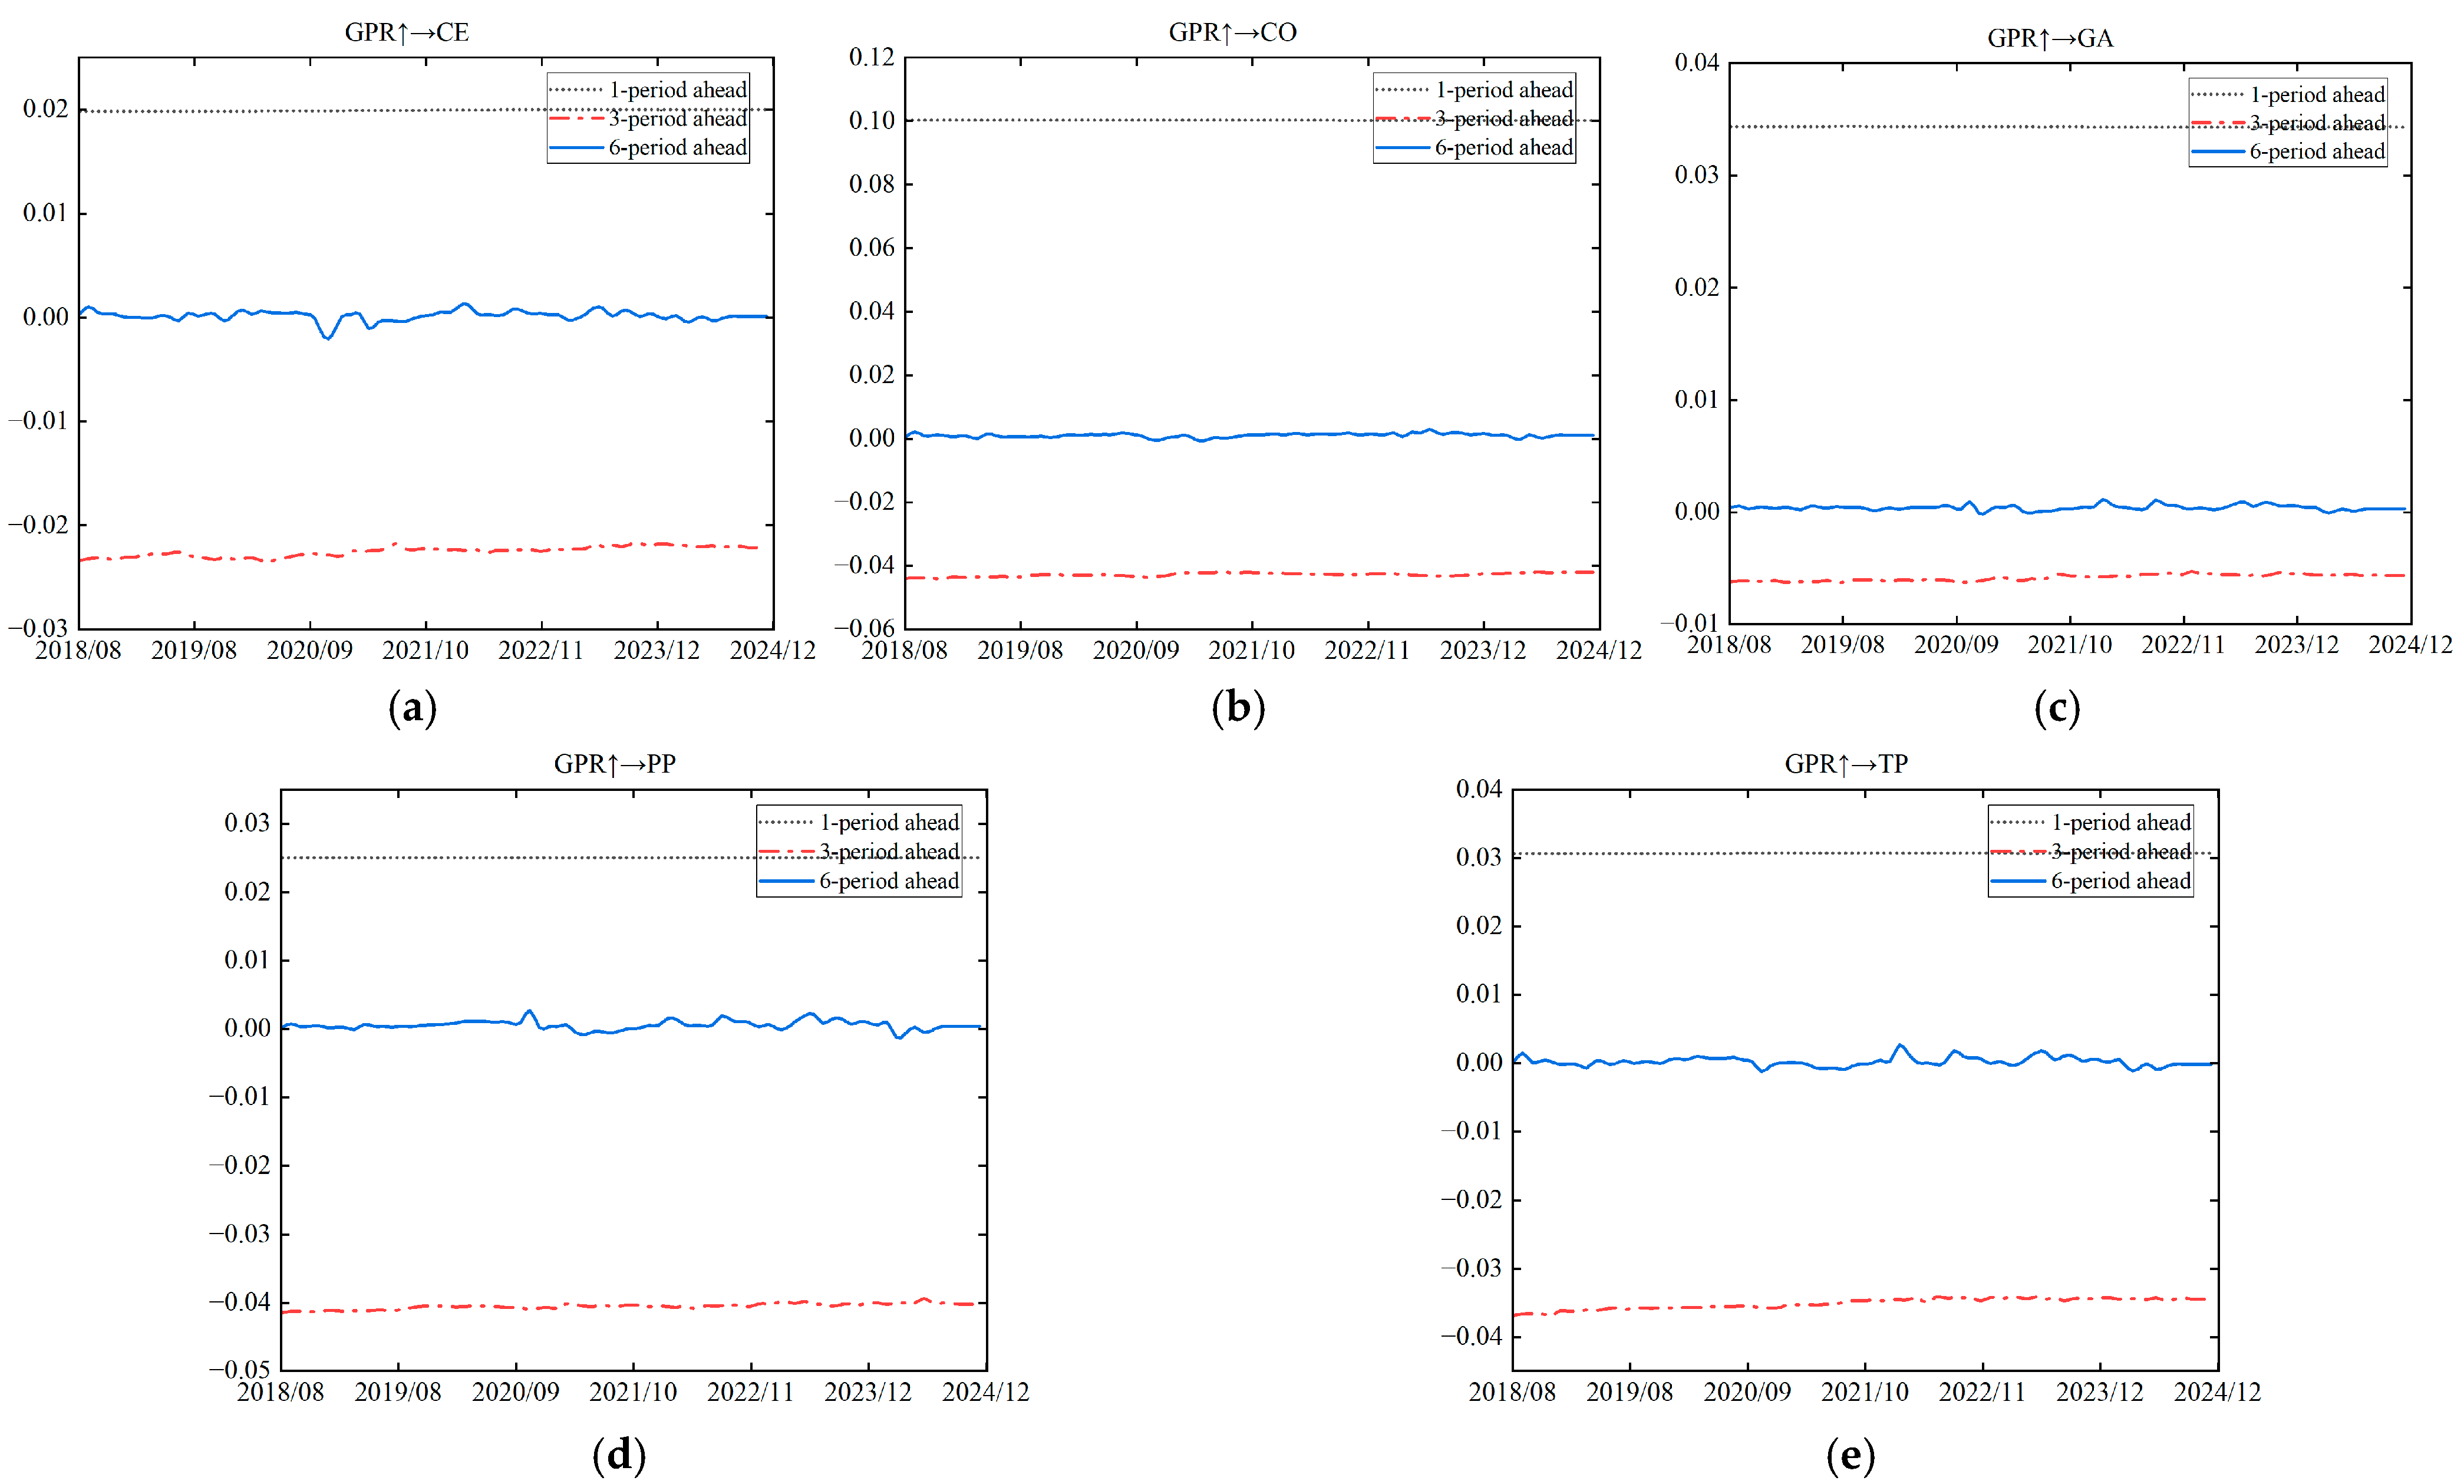
Figure 13a–e present the impulse responses of the five energy sub-industries to China’s geopolitical risk shock. Overall, all industries display a positive short-term response, a negative medium-term response, and weak long-term effects. The amplitudes at short, medium, and long horizons are relatively flat, indicating that the five industries exhibit strong resilience to geopolitical risk. The reasons are twofold: First, China faces comparatively low levels of geopolitical risk, and the resulting shocks to the energy sector are not sufficiently strong. As a result, the impulse response magnitudes remain relatively modest; second, institutional and structural buffer mechanisms—such as medium- and long-term supply contracts, supply-guarantee and peak-shaving policies, and electricity-market reforms; third, market and technology-based adaptive adjustments—including coal-gas-oil-renewables complementarity, cross-regional power transmission, demand-side response, and the use of futures—spot hedging and other risk-management tools—which together enhance energy-system stability.
Among the three uncertainty shocks, economic policy uncertainty has the most substantial impact, as evidenced by significant impulse responses across short, medium, and long horizons; climate policy uncertainty ranks second, with pronounced short-term responses that decay over time; and geopolitical risk is the weakest, with relatively stable responses at all horizons.
The significant heterogeneity among the three types of uncertainty shocks can be explained as follows. Changes in economic policy often affect capital costs and cash flow expectations through macroeconomic channels, thereby causing pronounced fluctuations in stock prices. Since energy firms are particularly dependent on long-term investment and high-leverage financing, policy uncertainty directly amplifies their risk spillover effects. Climate policy uncertainty mainly manifests in areas such as carbon pricing mechanisms and subsidy adjustments. Its impact typically influences market sentiment and firms’ strategic expectations first, rather than immediately altering actual business operations. As policy directions become clearer or markets complete their repricing, the effect of uncertainty gradually weakens, revealing a pattern of short-term significance and long-term convergence. China’s relatively low exposure to geopolitical risk, combined with a series of effective institutional arrangements, policies, and market-based instruments, contributes to the energy sector’s relatively stable impulse responses to geopolitical risk shocks.

6. Conclusions

Using multiple major events as the analytical frame, this paper applies LASSO-VAR-DY to study the risk spillover network of China’s listed energy firms from 2018 to 2024. Further, it extends firm-level connectedness to the industry level to identify system-level connectedness under major-event shocks. Based on recursively constructed industry-level series, a TVP-SV-VAR model is then used to evaluate the impulse responses of China’s energy industries to shocks in economic policy uncertainty (EPU), climate policy uncertainty (CPU), and China’s geopolitical risk (GPR). The main findings are:
(1) The energy system’s overall risk connectedness remains high, with regime-like shifts and persistent fluctuations. The system is vulnerable, and macroeconomic and market factors, policy and institutional factors, major unexpected events, climate and natural-disaster factors all exert significant effects on overall risk.
(2) Major event shocks amplify the spillover effects among energy industries and firms. At the industry level, the clean energy sector consistently acts as a net risk receiver across all four periods, while the other sectors alternate between risk transmitters and receivers under different shocks. At the firm level, the global COVID-19 pandemic outbreak and the official launch of the national carbon market primarily strengthen node-to-node connectedness, whereas the Russia-Ukraine conflict mainly intensifies the spillover strength between nodes. The Russia-Ukraine conflict significantly increases both the risk spillover capacity and the cross-sector spillover capacity of gas firms. In other periods, coal firms exhibit stronger risk spillover capacity, while thermal power firms demonstrate higher cross-sector spillover capacity.
(3) The effects of uncertainty index shocks differ markedly: economic policy uncertainty has the most substantial impact, followed by climate policy uncertainty, while geopolitical risk is the weakest. At the industry level, under shocks to economic policy uncertainty, the coal and oil-petrochemical sectors exhibit the most significant short-term responses, while the gas sector shows the smallest. Under shocks to climate policy uncertainty, the short-term impulse responses of the coal and thermal power sectors are significantly higher than those of other industries.
Based on the above findings, the following policy implications can be drawn:
(1) Strengthening risk monitoring and early warning mechanisms in the energy system. Given the high level of interconnectedness and volatility in the energy system, a multidimensional, dynamic risk-monitoring framework should be established. Real-time tracking and identification of macroeconomic, market price, policy, and climate-related indicators are essential. A coordinated monitoring and joint early-warning mechanism should be promoted across energy, financial, and climate risks to prevent the accumulation and contagion of systemic risk.
(2) Enhancing resilience and risk diversification capacity of the energy sector. To mitigate spillover effects triggered by major event shocks, the industrial structure and supply chain layout should be optimized. At the industry level, coordinated development between traditional and renewable energy should be promoted, while mechanisms such as carbon markets, green insurance, and strategic energy reserves can help share and absorb shocks. At the firm level, key energy enterprises should strengthen their risk resistance by pursuing asset diversification, sound financial management, and supply chain redundancy design to reduce risk transmission. Financial derivatives can also be effectively utilized to manage price volatility and policy uncertainty.
(3) Optimizing policy tools to address multidimensional uncertainty shocks. In the face of economic policy, climate policy, and geopolitical uncertainties, a response framework emphasizing expectation stability, flexible regulation, and policy coordination should be established. At the economic policy level, maintaining coherence among fiscal, monetary, and energy policies can help mitigate fluctuations in market expectations caused by frequent policy shifts. At the climate policy level, clarifying long-term emission-reduction pathways and technological roadmaps is essential to stabilizing expectations for renewable energy investment and reducing uncertainty. At the geopolitical level, strengthening international energy cooperation and enhancing strategic reserve systems can improve the security of the energy supply chain and overall system resilience.
Anchored in a multi-level “system-industry-firm” framework and combining event shocks with index-based shocks, this study provides a systematic account of risk connectedness in China’s energy system. Nonetheless, limitations remain. Although we consider three core shocks—EPU, CPU, and GPR—the energy system faces multiple sources of disturbance. For example, the direct effects of extreme climate events on generation efficiency and energy demand, and disruptive technological breakthroughs that reshape the energy mix, are not incorporated into the current model. Future research can further refine the scope of analysis by extending the sample period to encompass a broader range of shocks and incorporating firm-level heterogeneity. Moreover, integrating indicators of extreme weather events into the extended model would help capture the multifaceted impacts of climate and environmental uncertainties on the transmission of energy system risk.
Author Contributions

T.X.: Data Curation, Writing—Original Draft Preparation and Analysis. L.W.: Conceptualization, Methodology and Project Administration. T.C.: Formal analysis, Writing—Review and Editing, Funding Acquisition and Supervision. X.Z.: Conception of the Theoretical Analytical Framework and Data Analysis. All authors have read and agreed to the published version of the manuscript.

Funding

This research is supported by Major Project of the National Social Science Foundation (22&ZD122), Youth Project of the National Social Science Foundation (25CJY108), and Postgraduate Research & Practice Innovation Program of Jiangsu Province (SJCX25_0633).

Data Availability Statement

Data are available on request to the authors.

Conflicts of Interest

The authors declare no conflicts of interest.

References

  1. Wen, H.; Shi, J.; Lu, P. Can Green Technology Innovation Reduce the Operational Risks of Energy-Intensive Enterprises? Systems 2023, 11, 194. [Google Scholar] [CrossRef]
  2. Peng, S.; Liu, C.; Wang, Z.; Ye, Z.; Sun, X.; Tan, Z. The Impact of the Carbon Reduction Policy Effectiveness on Energy Companies’ ESG Performance. Int. Rev. Financ. Anal. 2024, 96, 103720. [Google Scholar] [CrossRef]
  3. Dabbous, A.; Aoun Barakat, K.; Ben Arfi, W.; Nammouri, H. The Impact of Environmental Policy Stringency and Economic Complexity on Nations’ Energy Transitions: The Mediating Role of Fintech Financing. Energy Econ. 2025, 147, 108540. [Google Scholar] [CrossRef]
  4. Wang, W.; Liu, H.; Wang, L.; Che, Z. Networked Liquidity Risk Contagion in High-Carbon Sectors: The Role of Multi-Agent Behavioral Constraints. Int. Rev. Financ. Anal. 2025, 106, 104530. [Google Scholar] [CrossRef]
  5. Xu, J.; Guan, Y.; Oldfield, J.; Guan, D.; Shan, Y. China Carbon Emission Accounts 2020-2021. Appl. Energy 2024, 360, 122837. [Google Scholar] [CrossRef]
  6. Sohaib, M.; Majeed, A.; Liu, J.; Oláh, J. The Role of Renewable Energy in Mitigating Carbon Emissions: Insights from China’s Energy Consumption Patterns. Energy Strateg. Rev. 2025, 61, 101860. [Google Scholar] [CrossRef]
  7. Wang, X.; Wang, J.; Wang, W.; Zhang, S. International and Chinese Energy Markets: Dynamic Spillover Effects. Energy 2023, 282, 128724. [Google Scholar] [CrossRef]
  8. Zheng, X.; Wang, L.; Chen, T.; Xu, T. Quantifying Tail Risk Spillovers in Chinese Petroleum Supply Chain Enterprises: A Neural-Network-Inspired Multi-Layer Machine Learning Framework. Systems 2025, 13, 874. [Google Scholar] [CrossRef]
  9. Zhang, Y.; Tang, G.; Li, R. Spillover Effects between China’s New Energy and Carbon Markets and International Crude Oil Market: A Look at the Impact of Extreme Events. Int. Rev. Econ. Financ. 2025, 98, 103939. [Google Scholar] [CrossRef]
  10. Guo, X.; Wang, Y.; Hao, Y.; Zhang, W. Spillover Effect among Carbon Bond Market, Carbon Stock Market and Energy Stock Market: Evidence from China. Financ. Res. Lett. 2023, 58, 104521. [Google Scholar] [CrossRef]
  11. Liu, M.; Liu, H.; Ping, W. Dynamic Spillovers between Shanghai Crude Oil Futures and China’s Green Markets: Evidence from Quantile-on-Quantile Connectedness Approach. Econ. Anal. Policy 2025, 85, 78–93. [Google Scholar] [CrossRef]
  12. Zhu, Y.; Gong, Y.; Yang, L.; Xu, D. The Rise of Clean Energy Markets: Evidence from Frequency-Domain Spillover Effects between Critical Metals and Energy Markets. Energy Econ. 2025, 141, 108126. [Google Scholar] [CrossRef]
  13. Zhang, C.; Chen, K. Unravelling the Interplay of Crude Oil, Renewable Energy, and Commodity Price Volatility: A DCC-GARCH Model Approach on the Chinese Stock Market. Renew. Energy 2026, 256, 124128. [Google Scholar] [CrossRef]
  14. Wu, B.; Zhu, P.; Yin, H.; Wen, F. The Risk Spillover of High Carbon Enterprises in China: Evidence from the Stock Market. Energy Econ. 2023, 126, 106939. [Google Scholar] [CrossRef]
  15. Chen, T.; Zheng, X.; Wang, L. Systemic Risk among Chinese Oil and Petrochemical Firms Based on Dynamic Tail Risk Spillover Networks. N. Am. Econ. Financ. 2025, 77, 102404. [Google Scholar] [CrossRef]
  16. Chen, Y.; Feng, A.; Mi, J.J. Does Climate Policy Uncertainty Drive the Extreme Spillovers of Carbon-Energy-Shipping Markets? J. Environ. Manag. 2024, 366, 121737. [Google Scholar] [CrossRef]
  17. Jiang, W.; Dong, L.; Liu, X.; Zou, L. Volatility Spillovers among Economic Policy Uncertainty, Energy and Carbon Markets—The Quantile Time-Frequency Perspective. Energy 2024, 307, 132683. [Google Scholar] [CrossRef]
  18. An, Y.; Li, X.; Guo, S.; Song, J.; Jiang, K. The Asymmetric Impact of China’s Climate Policy Uncertainty on Risk Spillovers among Energy Markets: A Dual-Perspective Analysis from Time and Frequency Domains. J. Clean. Prod. 2025, 522, 146315. [Google Scholar] [CrossRef]
  19. Wang, L.; Wang, Y.; Wang, J.; Yu, L. Forecasting Nonlinear Green Bond Yields in China: Deep Learning for Improved Accuracy and Policy Awareness. Financ. Res. Lett. 2025, 85, 107889. [Google Scholar] [CrossRef]
  20. Dong, F.; Li, Z.; Huang, Z.; Liu, Y. Extreme Weather, Policy Uncertainty, and Risk Spillovers between Energy, Financial, and Carbon Markets. Energy Econ. 2024, 137, 107761. [Google Scholar] [CrossRef]
  21. Fasanya, I.O.; Mubaiwa, D.T. Dynamics of Extreme Spillovers between Clean Energy Stocks and Fossil Fuels: The Role of Climate Policy Uncertainty and Geopolitical Risk. Energy 2025, 335, 138267. [Google Scholar] [CrossRef]
  22. Ren, X.; Li, J.; Duan, K.; Parhi, M. Cross-Category Spillovers of Uncertainties in Energy Transition: Insights from a Full-Distributional Framework. Energy Econ. 2025, 149, 108810. [Google Scholar] [CrossRef]
  23. Jia, Y.; Dong, Z. Characteristics and Influencing Factors of Risk Spillover Effects across Clean Energy Stock Prices: A Comparative Analysis during Four Periods of the COVID-19 Pandemic. Energy Econ. 2024, 135, 107644. [Google Scholar] [CrossRef]
  24. Vo, D.H.; Tran, M.P.-B. Volatility Spillovers between Energy and Agriculture Markets during the Ongoing Food & Energy Crisis: Does Uncertainty from the Russo-Ukrainian Conflict Matter? Technol. Forecast. Soc. Change 2024, 208, 123723. [Google Scholar] [CrossRef]
  25. Yang, W.; Che, Z. Shadow Banking Risk Exposure and Green New Quality Productivity Forces Resilience: Pathways to Development for Chinese Firms. Int. Rev. Financ. Anal. 2025, 102, 104057. [Google Scholar] [CrossRef]
  26. Gong, X.-L.; Jia, K.-W.; Xiong, X. How Major Geopolitical Events Affect Tail Risk Contagion in Global Crude Oil Markets —Evidence from the Russia-Ukraine Conflict. Int. Rev. Econ. Financ. 2025, 103, 104523. [Google Scholar] [CrossRef]
  27. Alanne, K.; Saari, A. Distributed Energy Generation and Sustainable Development. Renew. Sustain. Energy Rev. 2006, 10, 539–558. [Google Scholar] [CrossRef]
  28. Holden, E.; Linnerud, K.; Rygg, B.J. A Review of Dominant Sustainable Energy Narratives. Renew. Sustain. Energy Rev. 2021, 144, 110955. [Google Scholar] [CrossRef]
  29. Yang, Y.; Xia, S.; Huang, P.; Qian, J. Energy Transition: Connotations, Mechanisms and Effects. Energy Strateg. Rev. 2024, 52, 101320. [Google Scholar] [CrossRef]
  30. Rodríguez-Manotas, J.; Bhamidipati, P.L.; Haselip, J. Getting on the Ground: Exploring the Determinants of Utility-Scale Solar PV in Rwanda. Energy Res. Soc. Sci. 2018, 42, 70–79. [Google Scholar] [CrossRef]
  31. Wang, J.; Song, C.; Yuan, R. CO2 Emissions from Electricity Generation in China during 1997–2040: The Roles of Energy Transition and Thermal Power Generation Efficiency. Sci. Total Environ. 2021, 773, 145026. [Google Scholar] [CrossRef]
  32. Ding, Q.; Huang, J.; Chen, J. Time-Frequency Spillovers and the Determinants among Fossil Energy, Clean Energy and Metal Markets. Energy J. 2023, 44, 259–286. [Google Scholar] [CrossRef]
  33. Su, C.; Xu, Z.; Wang, X.; Li, B. Research on the Co-Evolution Mechanism of Electricity Market Entities Enabled by Shared Energy Storage: A Tripartite Game Perspective Incorporating Dynamic Incentives/Penalties and Stochastic Disturbances. Systems 2025, 13, 817. [Google Scholar] [CrossRef]
  34. Wang, L.; Yang, Z.; Chen, T.; Xu, T.; Xiao, B. The Mechanism of Green Transition of Energy Enterprises Applying Noncooperative–Cooperative Biform Game Model. Systems 2025, 13, 942. [Google Scholar] [CrossRef]
  35. Nicholson, W.B.; Matteson, D.S.; Bien, J. VARX-L: Structured Regularization for Large Vector Autoregressions with Exogenous Variables. Int. J. Forecast. 2017, 33, 627–651. [Google Scholar] [CrossRef]
  36. Demirer, M.; Diebold, F.X.; Liu, L.; Yilmaz, K. Estimating Global Bank Network Connectedness. J. Appl. Econom. 2018, 33, 1–15. [Google Scholar] [CrossRef]
  37. Diebold, F.X.; Yilmaz, K. On the Network Topology of Variance Decompositions: Measuring the Connectedness of Financial Firms. J. Econom. 2014, 182, 119–134. [Google Scholar] [CrossRef]
  38. Liang, Q.; Lu, Y.; Li, Z. Business Connectedness or Market Risk? Evidence from Financial Institutions in China. China Econ. Rev. 2020, 62, 101503. [Google Scholar] [CrossRef]
  39. Primiceri, G.E. Time Varying Structural Vector Autoregressions and Monetary Policy. Rev. Econ. Stud. 2005, 72, 821–852. [Google Scholar] [CrossRef]
  40. Yang, J.; Yu, Z.; Ma, J. China’s Financial Network with International Spillovers: A First Look. Pac.-Basin Financ. J. 2019, 58, 101222. [Google Scholar] [CrossRef]
  41. He, Z.; Liu, Z.; Zhang, C.; Zhao, Y. How Do Carbon Pricing Spillover Effects Impact Green Asset Price Volatility? An Empirical Study Based on the TVP-VAR-DY Model. Econ. Anal. Policy 2025, 85, 2162–2179. [Google Scholar] [CrossRef]
  42. Che, Z.; Wu, C.; Liu, X. A Four-Factor Model of Knowledge Agglomeration. Asia Pac. J. Manag. 2024, 42, 1411–1452. [Google Scholar] [CrossRef]
  43. He, Z.; Qian, W.; Miftah, B.; Zoynul Abedin, M. Quantile Time-Frequency Spillovers among Climate Policy Uncertainty, Energy Markets, and Stock Markets. Int. Rev. Econ. Financ. 2025, 103, 104428. [Google Scholar] [CrossRef]
  44. Jia, S.; Guo, N.; Jin, J. Climate Policy Uncertainty Risk and Sovereign Bond Volatility. J. Clean. Prod. 2024, 434, 140145. [Google Scholar] [CrossRef]
  45. Hanif, W.; Teplova, T.; Rodina, V.; Alomari, M.; Mensi, W. Volatility Spillovers and Frequency Dependence between Oil Price Shocks and Green Stock Markets. Resour. Policy 2023, 85, 103860. [Google Scholar] [CrossRef]
  46. Tiwari, A.K.; Aikins Abakah, E.J.; Doğan, B.; Adekoya, O.B.; Wohar, M. Asymmetric Spillover Effects in Energy Markets. Int. Rev. Econ. Financ. 2024, 92, 470–502. [Google Scholar] [CrossRef]
  47. Zhang, D.; Bai, D.; Chen, X. Can Crude Oil Futures Market Volatility Motivate Peer Firms in Competing ESG Performance? An Exploration of Shanghai International Energy Exchange. Energy Econ. 2024, 129, 107240. [Google Scholar] [CrossRef]
  48. Liu, C.; Ma, S.; Lu, S.; Zhi, J.; Shen, J.; Li, X.; Shi, C. Study on the Time-Frequency Risk Spillover Network of “Carbon-Energy-Stock” System under Climate Risk Shock. Energy 2025, 334, 137441. [Google Scholar] [CrossRef]
  49. Ye, Y.; Lin, B.; Que, D.; Cai, S.; Wang, C. COVID-19, the Russian-Ukrainian Conflict and the Extreme Spillovers between Fossil Energy, Electricity, and Carbon Markets. Energy 2024, 311, 133399. [Google Scholar] [CrossRef]
  50. Gavriilidis, K. Measuring Climate Policy Uncertainty; SSRN: Rochester, NY, USA, 2021. [Google Scholar]
  51. Guo, J.; Long, S.; Luo, W. Nonlinear Effects of Climate Policy Uncertainty and Financial Speculation on the Global Prices of Oil and Gas. Int. Rev. Financ. Anal. 2022, 83, 102286. [Google Scholar] [CrossRef]
  52. Baker, S.R.; Bloom, N.; Davis, S.J. Measuring Economic Policy Uncertainty. Q. J. Econ. 2016, 131, 1593–1636. [Google Scholar] [CrossRef]
  53. Caldara, D.; Iacoviello, M. Measuring Geopolitical Risk. Am. Econ. Rev. 2022, 112, 1194–1225. [Google Scholar] [CrossRef]
  54. Nakajima, J.; Kasuya, M.; Watanabe, T. Bayesian Analysis of Time-Varying Parameter Vector Autoregressive Model for the Japanese Economy and Monetary Policy. J. Jpn. Inst. Econ. 2011, 25, 225–245. [Google Scholar] [CrossRef]
  55. Zheng, H.; Wang, S.; Zhang, T. Dynamic Risk Spillovers between Green Bonds and Energy Markets: New Evidence from the GARCH-MIDAS-D-Copula-CoVaR Approach Considering Uncertainties. Renew. Energy 2025, 239, 122129. [Google Scholar] [CrossRef]
Figure 1. The research framework.
Systems 13 01037 g001
Figure 2. Energy-system interconnectedness mechanism diagram.
Systems 13 01037 g002
Figure 3. Dynamic risk spillover index among energy firms.
Systems 13 01037 g003
Figure 4. Energy-industry risk spillover network for the full sample period and under the three major-event shocks. (Note: the arrow denotes the direction of spillover; line thickness indicates the magnitude of spillovers; red denotes net risk receivers, and blue denotes net risk transmitters.) (a) Full sample period; (b) Global COVID-19 pandemic; (c) Official launch of the national carbon market; (d) Outbreak of the Russia-Ukraine conflict.
Systems 13 01037 g004
Figure 5. Risk spillover network of all energy firms for the full sample period and under the three major-event shocks. (a) Full sample period; (b) Global COVID-19 pandemic; (c) Official launch of the national carbon market; (d) Outbreak of the Russia-Ukraine conflict.
Systems 13 01037 g005aSystems 13 01037 g005b
Figure 6. Risk spillover network among clean-energy firms for the full sample period and under the three major-event shocks. (Note: the arrow denotes the direction of spillover; line thickness indicates the magnitude of spillovers.) (a) Full sample period; (b) Global COVID-19 pandemic; (c) Official launch of the national carbon market; (d) Outbreak of the Russia-Ukraine conflict.
Systems 13 01037 g006aSystems 13 01037 g006b
Figure 7. Risk spillover network among coal firms for the full sample period and under the three major-event shocks. (Note: the arrow denotes the direction of spillover; line thickness indicates the magnitude of spillovers.) (a) Full sample period; (b) Global COVID-19 pandemic; (c) Official launch of the national carbon market; (d) Outbreak of the Russia-Ukraine conflict.
Systems 13 01037 g007aSystems 13 01037 g007b
Figure 8. Risk spillover network among gas firms for the full sample period and under the three major-event shocks. (Note: the arrow denotes the direction of spillover; line thickness indicates the magnitude of spillovers.) (a) Full sample period; (b) Global COVID-19 pandemic; (c) Official launch of the national carbon market; (d) Outbreak of the Russia-Ukraine conflict.
Systems 13 01037 g008aSystems 13 01037 g008b
Figure 9. Risk spillover network among petroleum and petrochemical firms for the full sample period and under the three major-event shocks. (Note: the arrow denotes the direction of spillover; line thickness indicates the magnitude of spillovers.) (a) Full sample period; (b) Global COVID-19 pandemic; (c) Official launch of the national carbon market; (d) Outbreak of the Russia-Ukraine conflict.
Systems 13 01037 g009aSystems 13 01037 g009b
Figure 10. Risk spillover network among thermal-power firms for the full sample period and under the three major-event shocks. (Note: the arrow denotes the direction of spillover; line thickness indicates the magnitude of spillovers.) (a) Full sample period; (b) Global COVID-19 pandemic; (c) Official launch of the national carbon market; (d) Outbreak of the Russia-Ukraine conflict.
Systems 13 01037 g010aSystems 13 01037 g010b
Figure 11. (a) Impulse response results of clean-energy industry to EPU shocks; (b) Impulse response results of coal industry to EPU shocks; (c) Impulse response results of gas industry to EPU shocks; (d) Impulse response results of petroleum and petrochemical industry to EPU shocks; (e) Impulse response results of thermal power industry to EPU shocks.
Systems 13 01037 g011
Figure 12. (a) Impulse response results of clean-energy industry to CPU shocks; (b) Impulse response results of coal industry to CPU shocks; (c) Impulse response results of gas industry to CPU shocks; (d) Impulse response results of petroleum and petrochemical industry to CPU shocks; (e) Impulse response results of thermal power industry to CPU shocks.
Systems 13 01037 g012
Figure 13. (a) Impulse response results of clean-energy industry to GPR shocks; (b) Impulse response results of coal industry to GPR shocks; (c) Impulse response results of gas industry to GPR shocks; (d) Impulse response results of petroleum and petrochemical industry to GPR shocks; (e) Impulse response results of thermal power industry to GPR shocks.
Systems 13 01037 g013
Table 1. Classification of Energy Firms.
CategoryNumber of FirmsCode
Clean-energy firms21CE
Coal firms21CO
Gas firms10GA
Petroleum and petrochemical firms23PP
Thermal-power firms24TP
Table 2. Directions and intensities of risk spillovers among energy industries.
Node ANode BFull Sample PeriodGlobal COVID-19 PandemicOfficial Launch of the National Carbon MarketOutbreak of the Russia-Ukraine Conflict
DirectionIntensityDirectionIntensityDirectionIntensityDirectionIntensity
CECOCE ← CO0.132CE ← CO0.355CE ← CO0.313CE ← CO0.197
CEGACE ← GA0.211CE ← GA0.159CE ← GA0.423
CEPPCE → PP0.133CE ← PP0.208CE ← PP0.249
CETPCE ← TP0.230CE ← TP0.155
COGACO → GA0.169CO ← GA0.194
COPPCO → PP0.264CO → PP0.339
COTPCO → TP0.158CO → TP0.189
GAPPGA → PP0.220GA → PP0.283GA → PP0.232
GATPGA → TP0.365
PPTPPP ← TP0.186PP → TP0.132PP → TP0.182
Note: — indicates that the spillover effect between nodes is below the threshold.
Table 3. Top 10 Energy Firms by Risk Inflow and Outflow across Scenarios.
Full Sample PeriodGlobal COVID-19 PandemicOfficial Launch of the National Carbon MarketOutbreak of the Russia-Ukraine Conflict
RankInflowOutflowInflowOutflowInflowOutflowInflowOutflow
1CO03CO03PP15CO13CO10CO03GA05GA01
2TP14TP14CE03CO04CO03CO21CE02GA09
3TP21TP12PP04CO15CO21PP01TP19GA04
4TP19GA01PP18GA08PP01CO08TP20GA10
5TP12CE19CO13PP11CO08CO13GA06PP22
6CO10TP19CO04TP03CO09CO09CE21PP14
7CO04GA10TP03TP24CO05PP13CE08GA06
8CO01TP21CO10CE14CO13CO10GA01PP18
9CE19CO10CO02CO10PP13PP21PP02PP19
10GA01CO04CO15CO02PP21CO05GA02GA07
Table 4. Distribution Statistics of the Top 10 Energy Firms under Different Scenarios.
Full Sample PeriodGlobal COVID-19 PandemicOfficial Launch of the National Carbon MarketOutbreak of the Russia-Ukraine Conflict
SectorInflowOutflowInflowOutflowInflowOutflowInflowOutflow
CE11110030
CO43557700
GA12010046
PP00313314
TP44120020
Table 5. Top 10 Energy Firms by Cross-Industry Risk Inflow and Outflow across Scenarios.
Full Sample PeriodGlobal COVID-19 PandemicOfficial Launch of the National Carbon MarketOutbreak of the Russia-Ukraine Conflict
RankInflowOutflowInflowOutflowInflowOutflowInflowOutflow
1PP14GA01PP09TP24TP13CO14TP19GA01
2CO09CE19PP04TP03CE06PP01TP20PP19
3CE14TP12PP23PP11CE03CO03CE02GA09
4CE19GA10PP15CO15CE14PP21PP02TP20
5CE03PP14PP11TP01CO14PP18TP01GA06
6CE16CO03PP19CO13CE12CO21PP20PP18
7GA01TP14PP13TP16PP18PP13TP06TP01
8GA05GA02PP06TP10CE05CO04CE21GA04
9GA06TP21CE05GA08PP14CO13CE08CE02
10PP07TP01PP10CE14GA09CO09TP12PP14
Table 6. Distribution Statistics of the Top 10 Cross-sector Energy Firms under Different Scenarios.
Full Sample PeriodGlobal COVID-19 PandemicOfficial Launch of the National Carbon MarketOutbreak of the Russia-Ukraine Conflict
SectorInflowOutflowInflowOutflowInflowOutflowInflowOutflow
CE41115031
CO11021600
GA33011004
PP24912423
TP01051052
Table 7. Descriptive Statistics of Variables.
CECOGAPPTPEPUCPUGPR
Mean0.0120.0680.0020.0360.043313.951211.3030.907
Median−0.0180.103−0.013−0.0410.015306.399209.1740.857
Max.1.7953.2191.0192.4642.128661.828422.1872.475
Min.−2.049−2.375−0.498−2.12−1.99124.29579.4730.418
Stdev0.5841.1070.2630.8540.839101.22165.040.287
Skewness0.2910.720.7690.350.1521.0210.6972.295
Kurtosis2.9830.9621.9441.3920.2291.7671.36510.271
JB25.096 ***8.695 **17.299 ***6.436 **0.35121.138 ***10.78 ***362.147 ***
ADF−7.241 ***−5.722 ***−5.551 ***−6.106 ***−5.114 ***−5.486 ***−6.373 ***−5.521 ***
VIF3.4492.6962.3402.3783.0501.0691.0761.054
Note: **, and *** denote statistical significance at the 5%, and 1% levels, respectively.
Table 8. Parameter Estimates of the TVP-SV-VAR Model.
ParameterMeanStd.Dev95% U95% LGewekeInef.
sb10.00230.00030.00180.00290.6075.43
sb20.00230.00030.00180.00290.3664.81
sa10.00570.00170.00340.01000.45326.84
sa20.00560.00180.00340.00990.71425.87
sh10.00550.00160.00340.00940.62027.60
sh20.00560.00170.00340.00980.71420.90
Disclaimer/Publisher’s Note: The statements, opinions and data contained in all publications are solely those of the individual author(s) and contributor(s) and not of MDPI and/or the editor(s). MDPI and/or the editor(s) disclaim responsibility for any injury to people or property resulting from any ideas, methods, instructions or products referred to in the content.