A Hybrid Modeling Framework for Evaluating ESG Investment Risks in Highway Real Estate Investment Trusts: Insights from Chinese Highway Assets
Abstract
1. Introduction
2. Literature Review
2.1. ESG Integration and Financial Performance in REITs
2.2. Economic Risks in Highway Infrastructure Projects
2.3. System Dynamics Applications in Risk Management and Sustainability
3. Methodology
3.1. Design Overview
3.2. Data Sources and Sample Construction
3.2.1. Sampling Frame
3.2.2. Data Streams
3.3. Variable Definitions and Construction
3.3.1. ESG Proxy Construction and Methodology
3.3.2. Value at Risk
3.3.3. ESG-Adjusted CAPM Variables
3.3.4. System Dynamics Modeling Framework
4. Results and Analysis
4.1. Empirical Results on Static VaR Analysis
4.2. ESG-Adjusted CAPM Analysis
4.2.1. Model Estimation and ESG Risk–Return Relationships
4.2.2. Integration and System Dynamics Parameterization
4.3. System Dynamics Model Validation and Simulation Results
4.3.1. Model Validation and Parameter Calibration
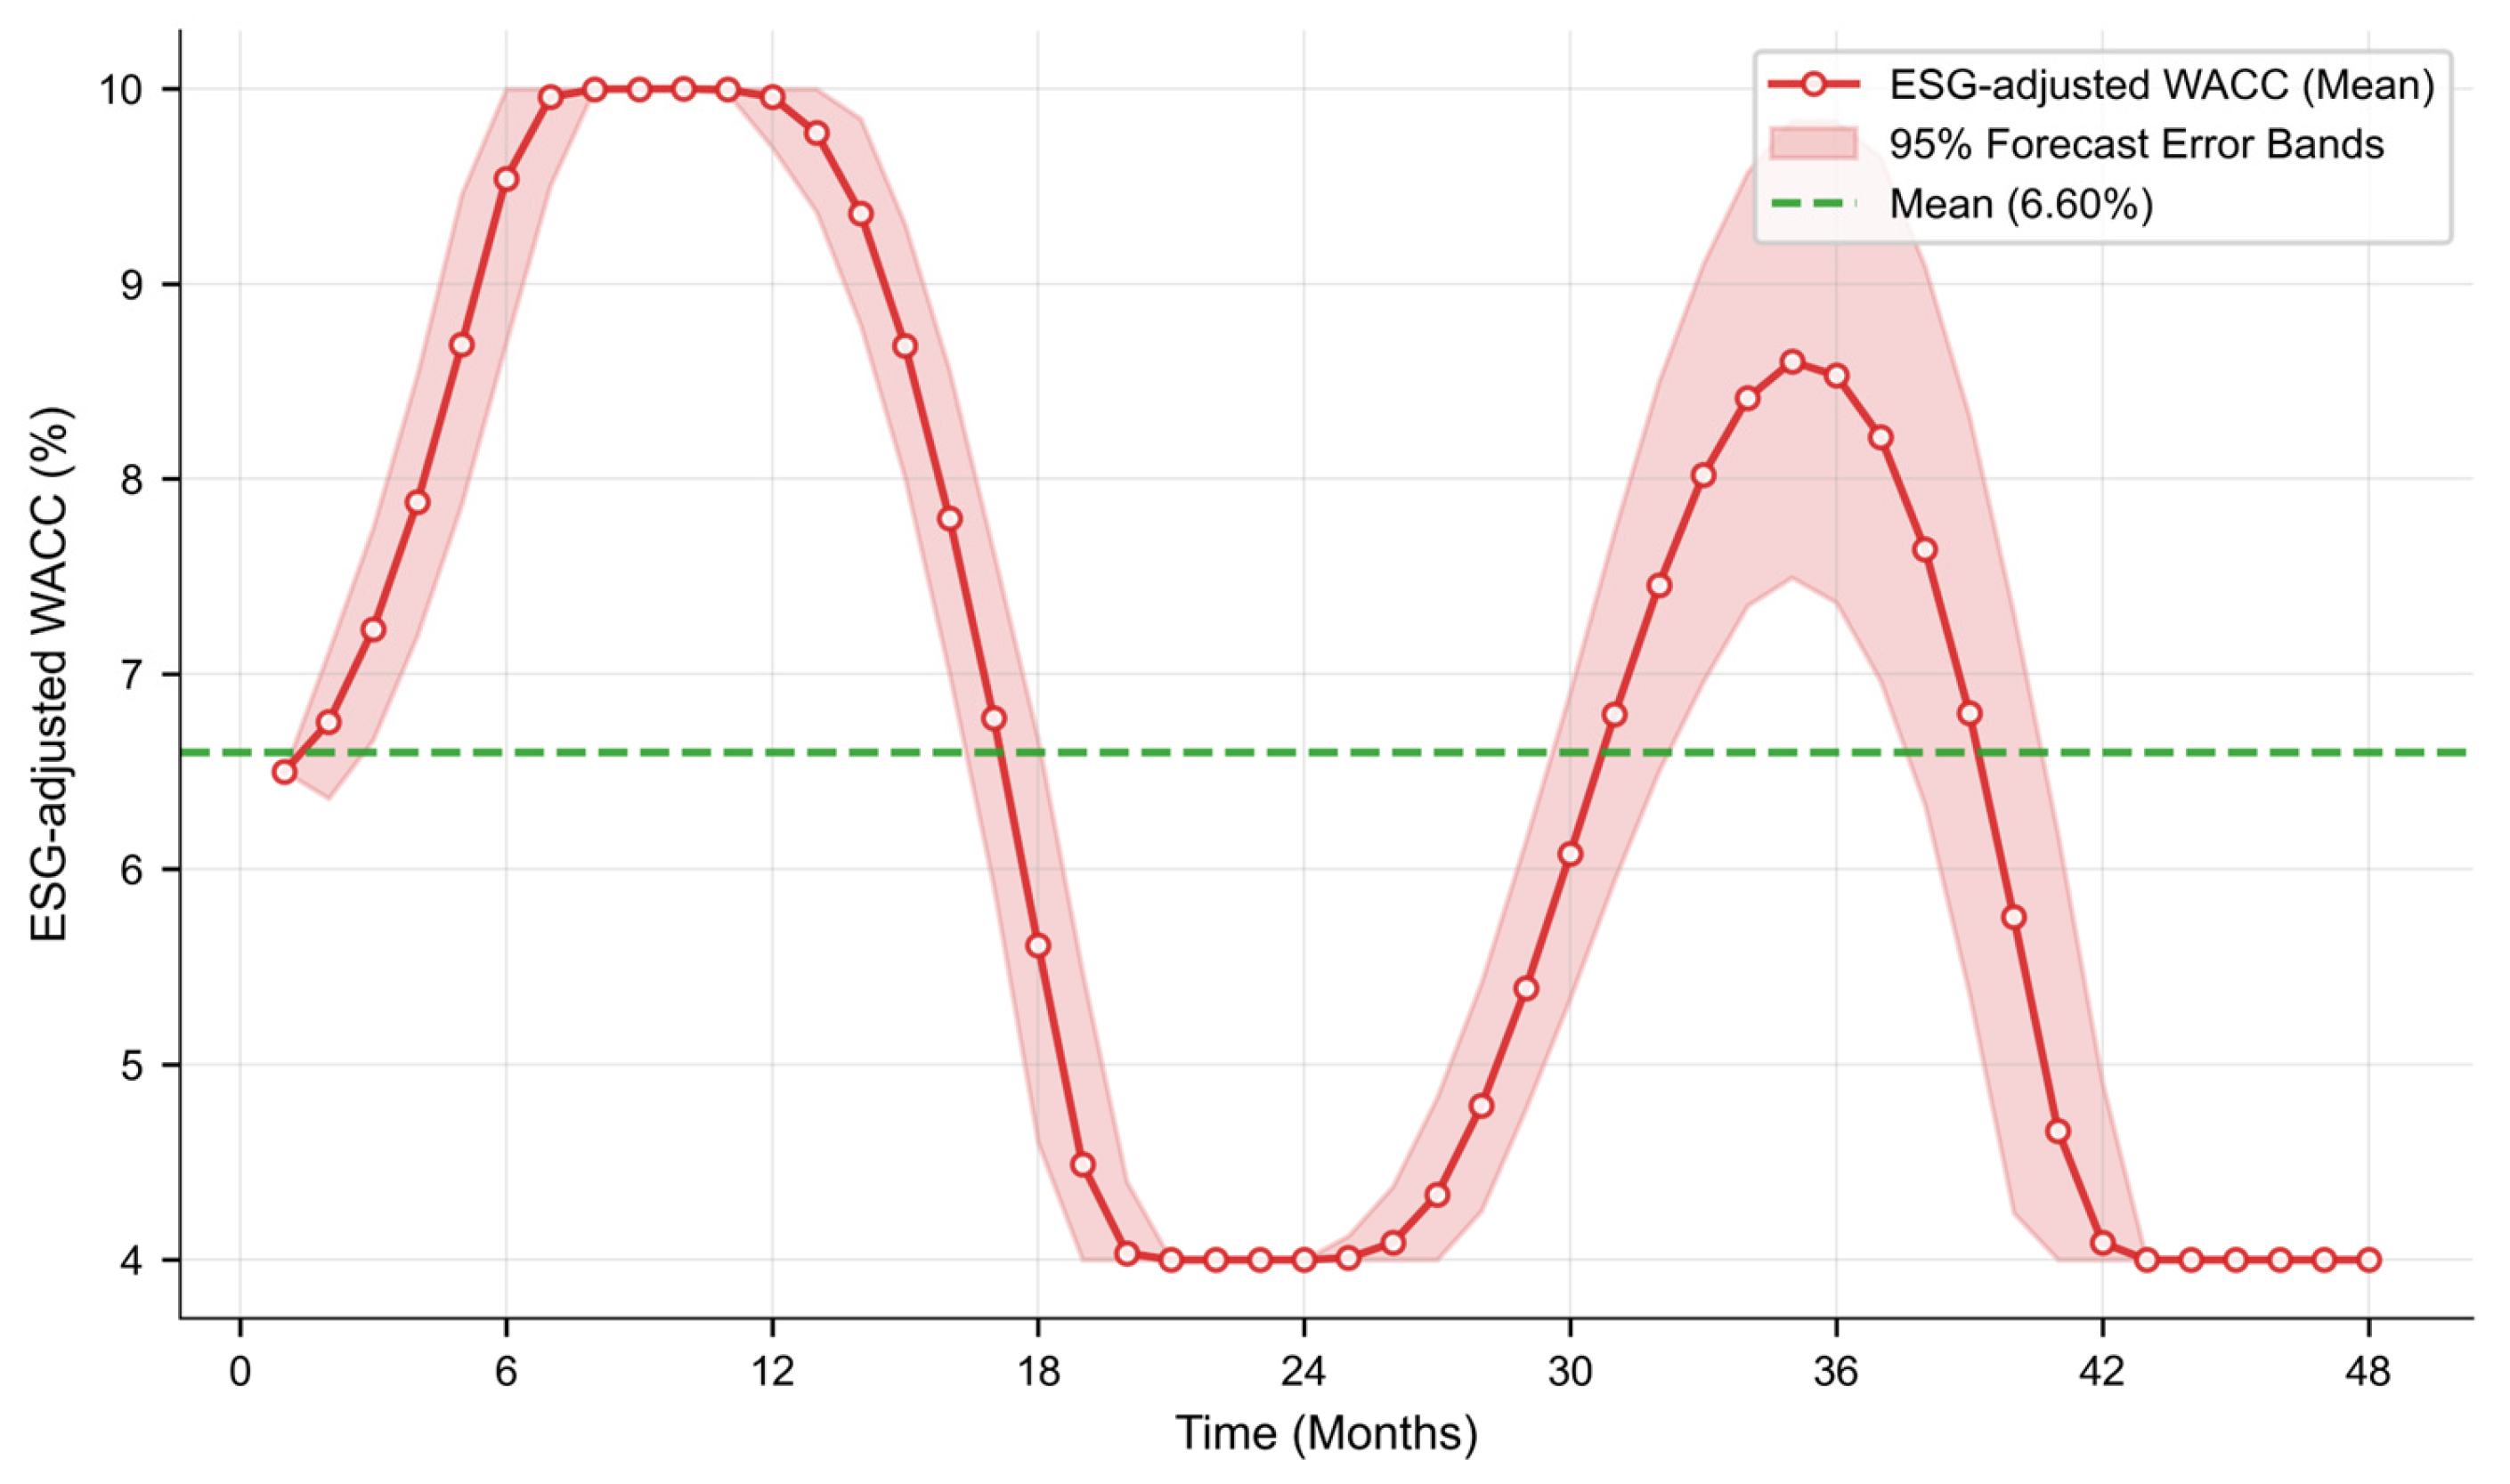
4.3.2. ESG-Adjusted WACC Evolution
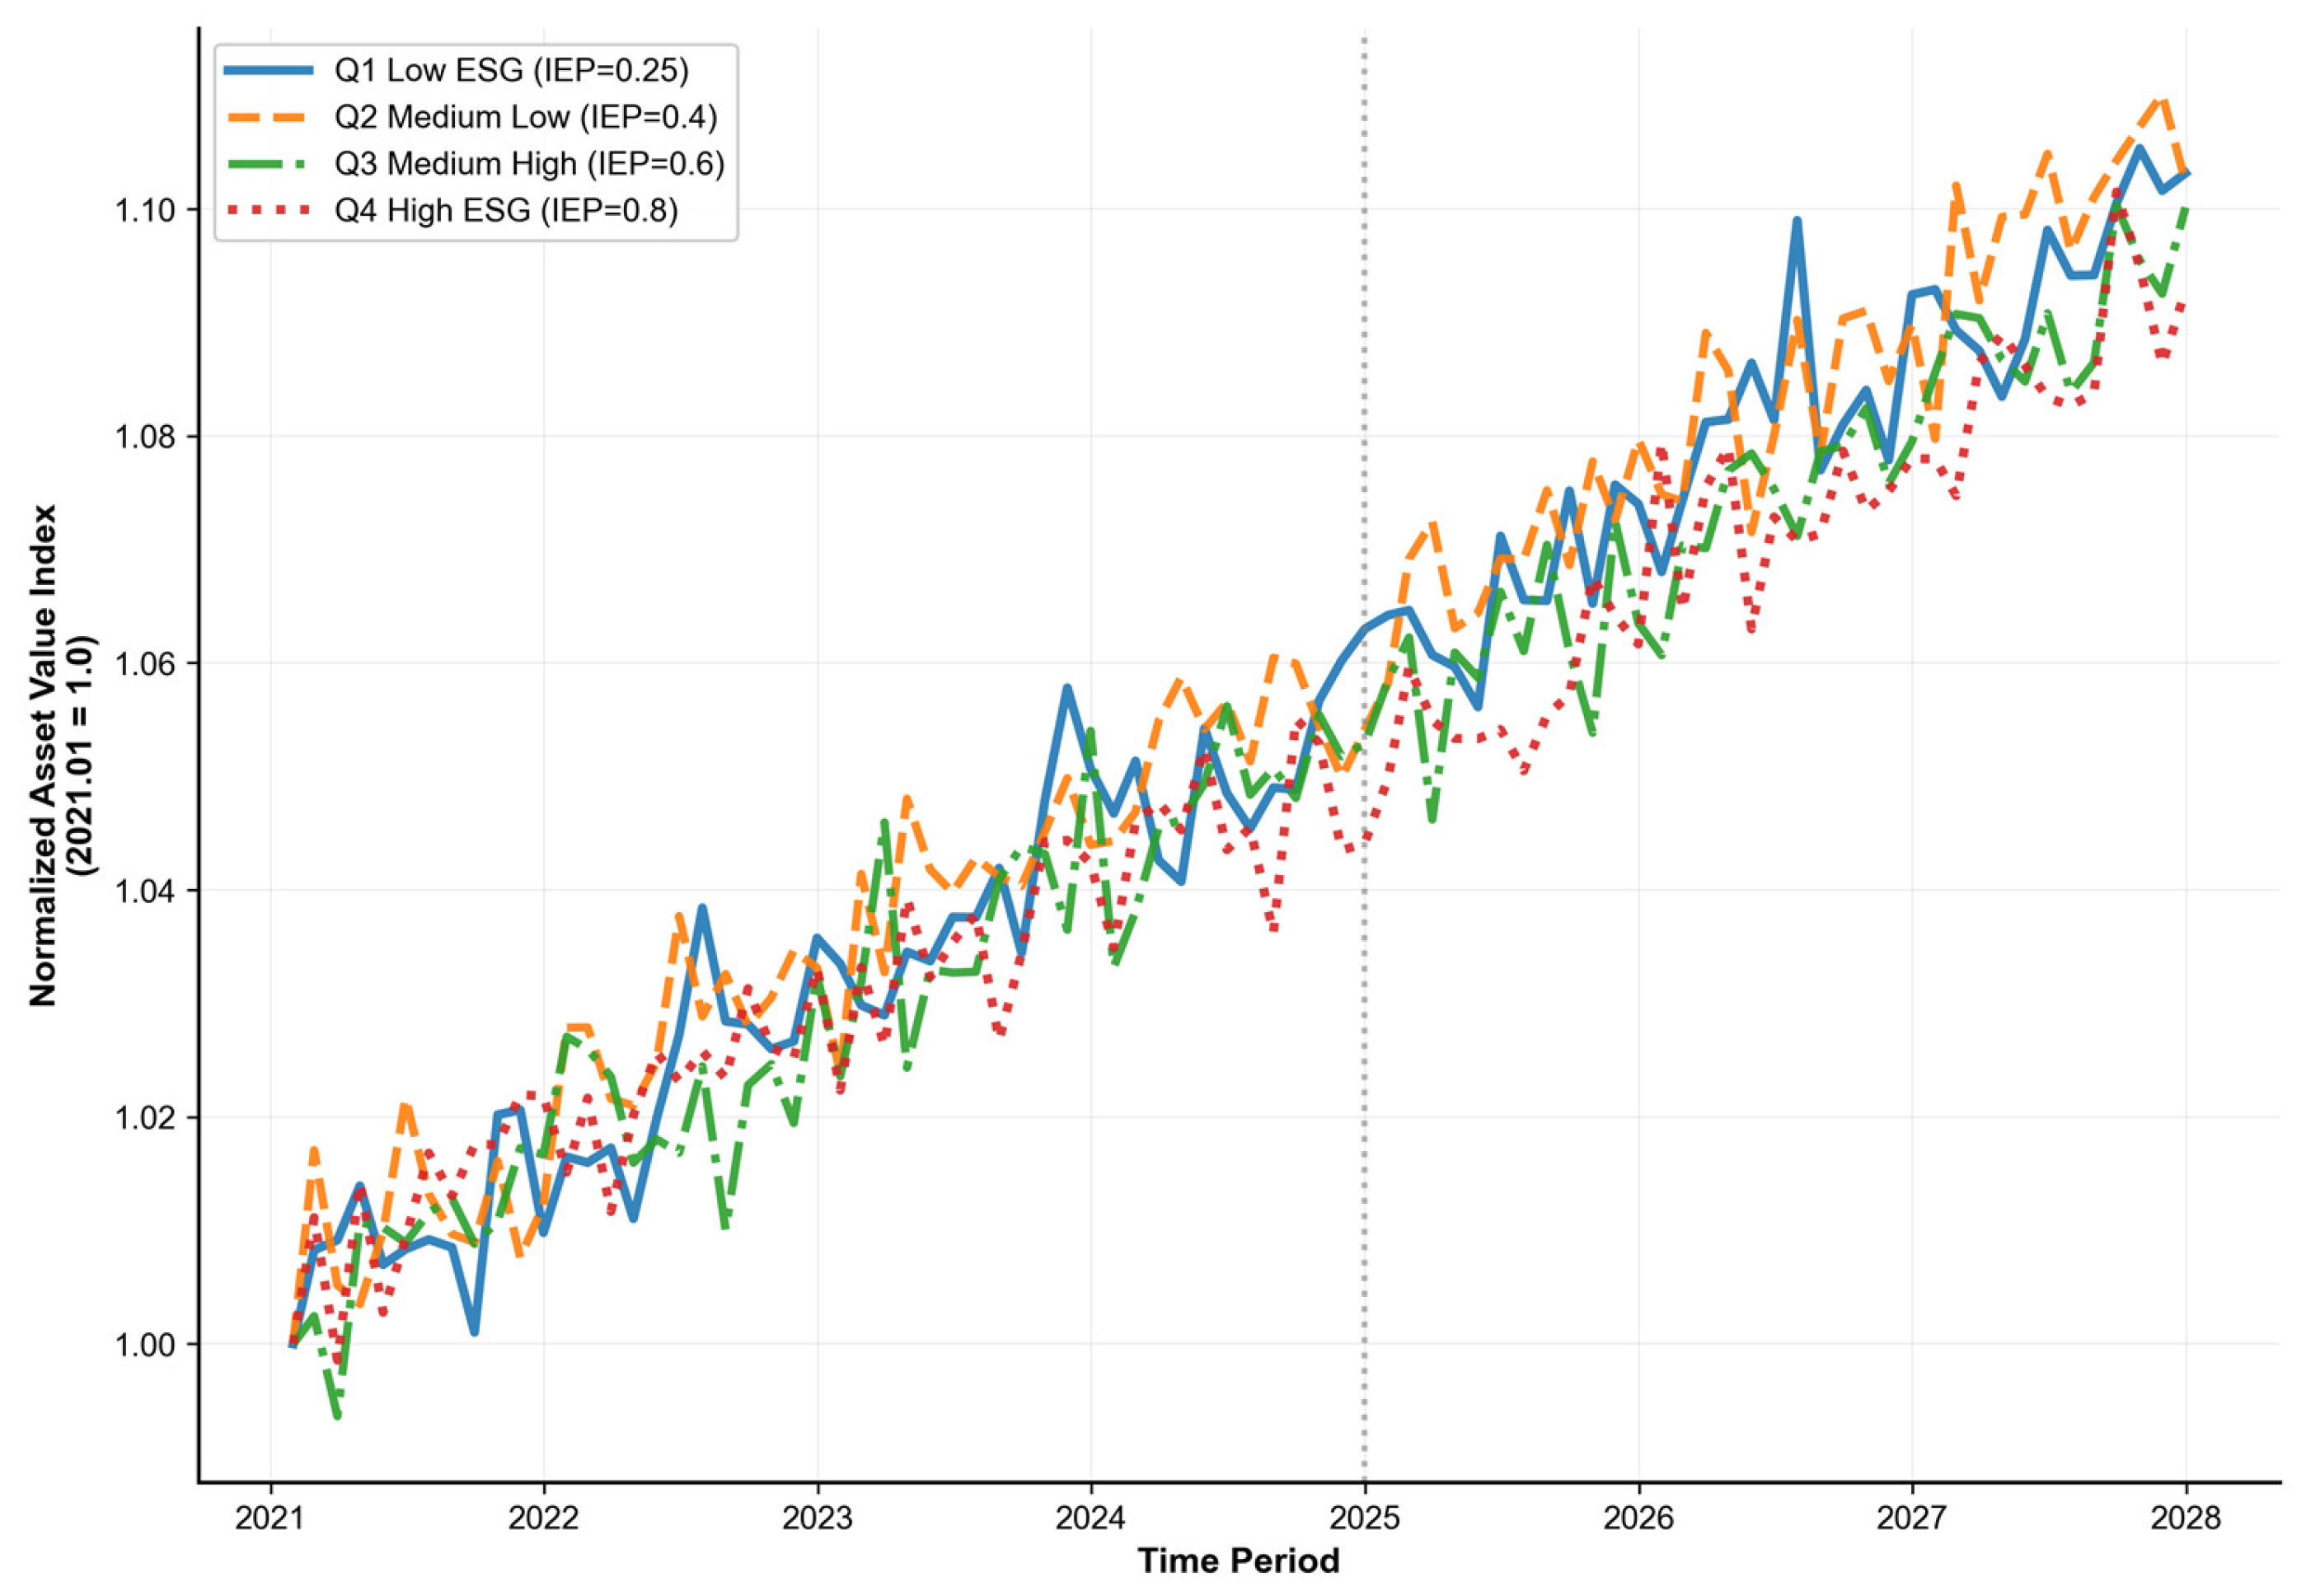
4.3.3. Multi-Scenario Asset Value Performance
4.3.4. Market Price Dynamics
4.3.5. Comparative Analysis with Static Models
5. Discussion
5.1. Theoretical Implications and Literature Contributions
5.2. Methodological Contributions to Risk Assessment
5.3. Strategic Implications and Implementation Guidelines
6. Conclusions
- A small sample (10 REITs over 48 months) limits generalizability; future work: expand to diverse markets through multi-country panel data.
- IEP measurement errors from disclosures; future work: refine via Lasso/PCA once data matures.
- Focus on Chinese highway REITs; future work: international comparisons.
- Twenty-month cycles need verification; future work: longitudinal studies over 5–10 years.
- Potential endogeneity between ESG performance and financial outcomes, unmitigated due to data constraints; future work: employ GMM or IV methods in expanded datasets to quantify bias.
Author Contributions
Funding
Data Availability Statement
Acknowledgments
Conflicts of Interest
Appendix A. Supplementary Details on Data Processing and Model Validation
| Step | Operation Description | Sample Size Change |
|---|---|---|
| Step 1. Raw Data Collection | Initial collection of 10 REIT-month observations. | Initial sample: 10 REITs, each with at least 12 months of data. |
| Step 2. Missing Value Exclusion | Exclusively linear interpolation for gaps ≤ 3 months (<5% overall missing rate); gaps > 3 months flagged for exclusion if exceeding threshold. | Sample size unchanged; gaps filled (no substantial gaps exceeded threshold in this sample). |
| Step 3. Outlier Detection and Winsorization | Winsorize monthly returns by clipping values below the 1% quantile and above the 99% quantile. | Sample size unchanged; outliers adjusted to quantile values. |
| Step 4. Exclusion of REITs with Insufficient Sample Size | Remove REITs with fewer observations than the minimum threshold (at least 20 observations). | Sample size further reduced by excluding low-observation REITs. |
| Step 5. Outlier and Inconsistency Exclusion | Exclude observations with insufficient market data (n = 12), incomplete ESG scores (n = 8), and regulatory inconsistencies (n = 4). High missing rates defined as >20% per REIT, but exclusions here are criterion-specific. | Sample size reduced by 24 observations (from the initial 210). |
| Step 6. Normalization and Proxy Construction | Min–max standardization within months for IEP components. | Sample size unchanged; proxies constructed. |
| Step 7. Final Sample Selection | Remaining REITs after screening and processing used for analysis, with complete processed monthly returns (186 observations for CAPM, reconciled from initial 210 minus 24 exclusions). | Final sample. Processed REITs for subsequent analysis. |
| Category | Method | Description | Rationale |
|---|---|---|---|
| Data Processing | Winsorization | Clip monthly return data below the 1% quantile and above the 99% quantile to those points, which was applied after linear interpolation but before any exclusions to maintain distributional integrity. | Mitigates outlier effects on VaR and CAPMs, ensuring data robustness without introducing selection bias from exclusions. |
| Data Processing | Pattern Matching | Deliberately avoided for all gaps; instead, gaps >3 months were flagged for exclusion. | To minimize potential bias in non-stationary REIT metrics, consistent with exclusive linear interpolation. |
| Data Processing | Interpolation | Linear interpolation for minor data gaps. | Preserves temporal continuity in time-series data. |
| Backtesting | Backtesting Implementation | Compute VaR exceedance rates via Kupiec test; use Christoffersen’s test for further model accuracy validation. | Kupiec test verifies exceedance correctness; Christoffersen’s test assesses overall robustness. |
Appendix B. Detailed System Dynamics Equations
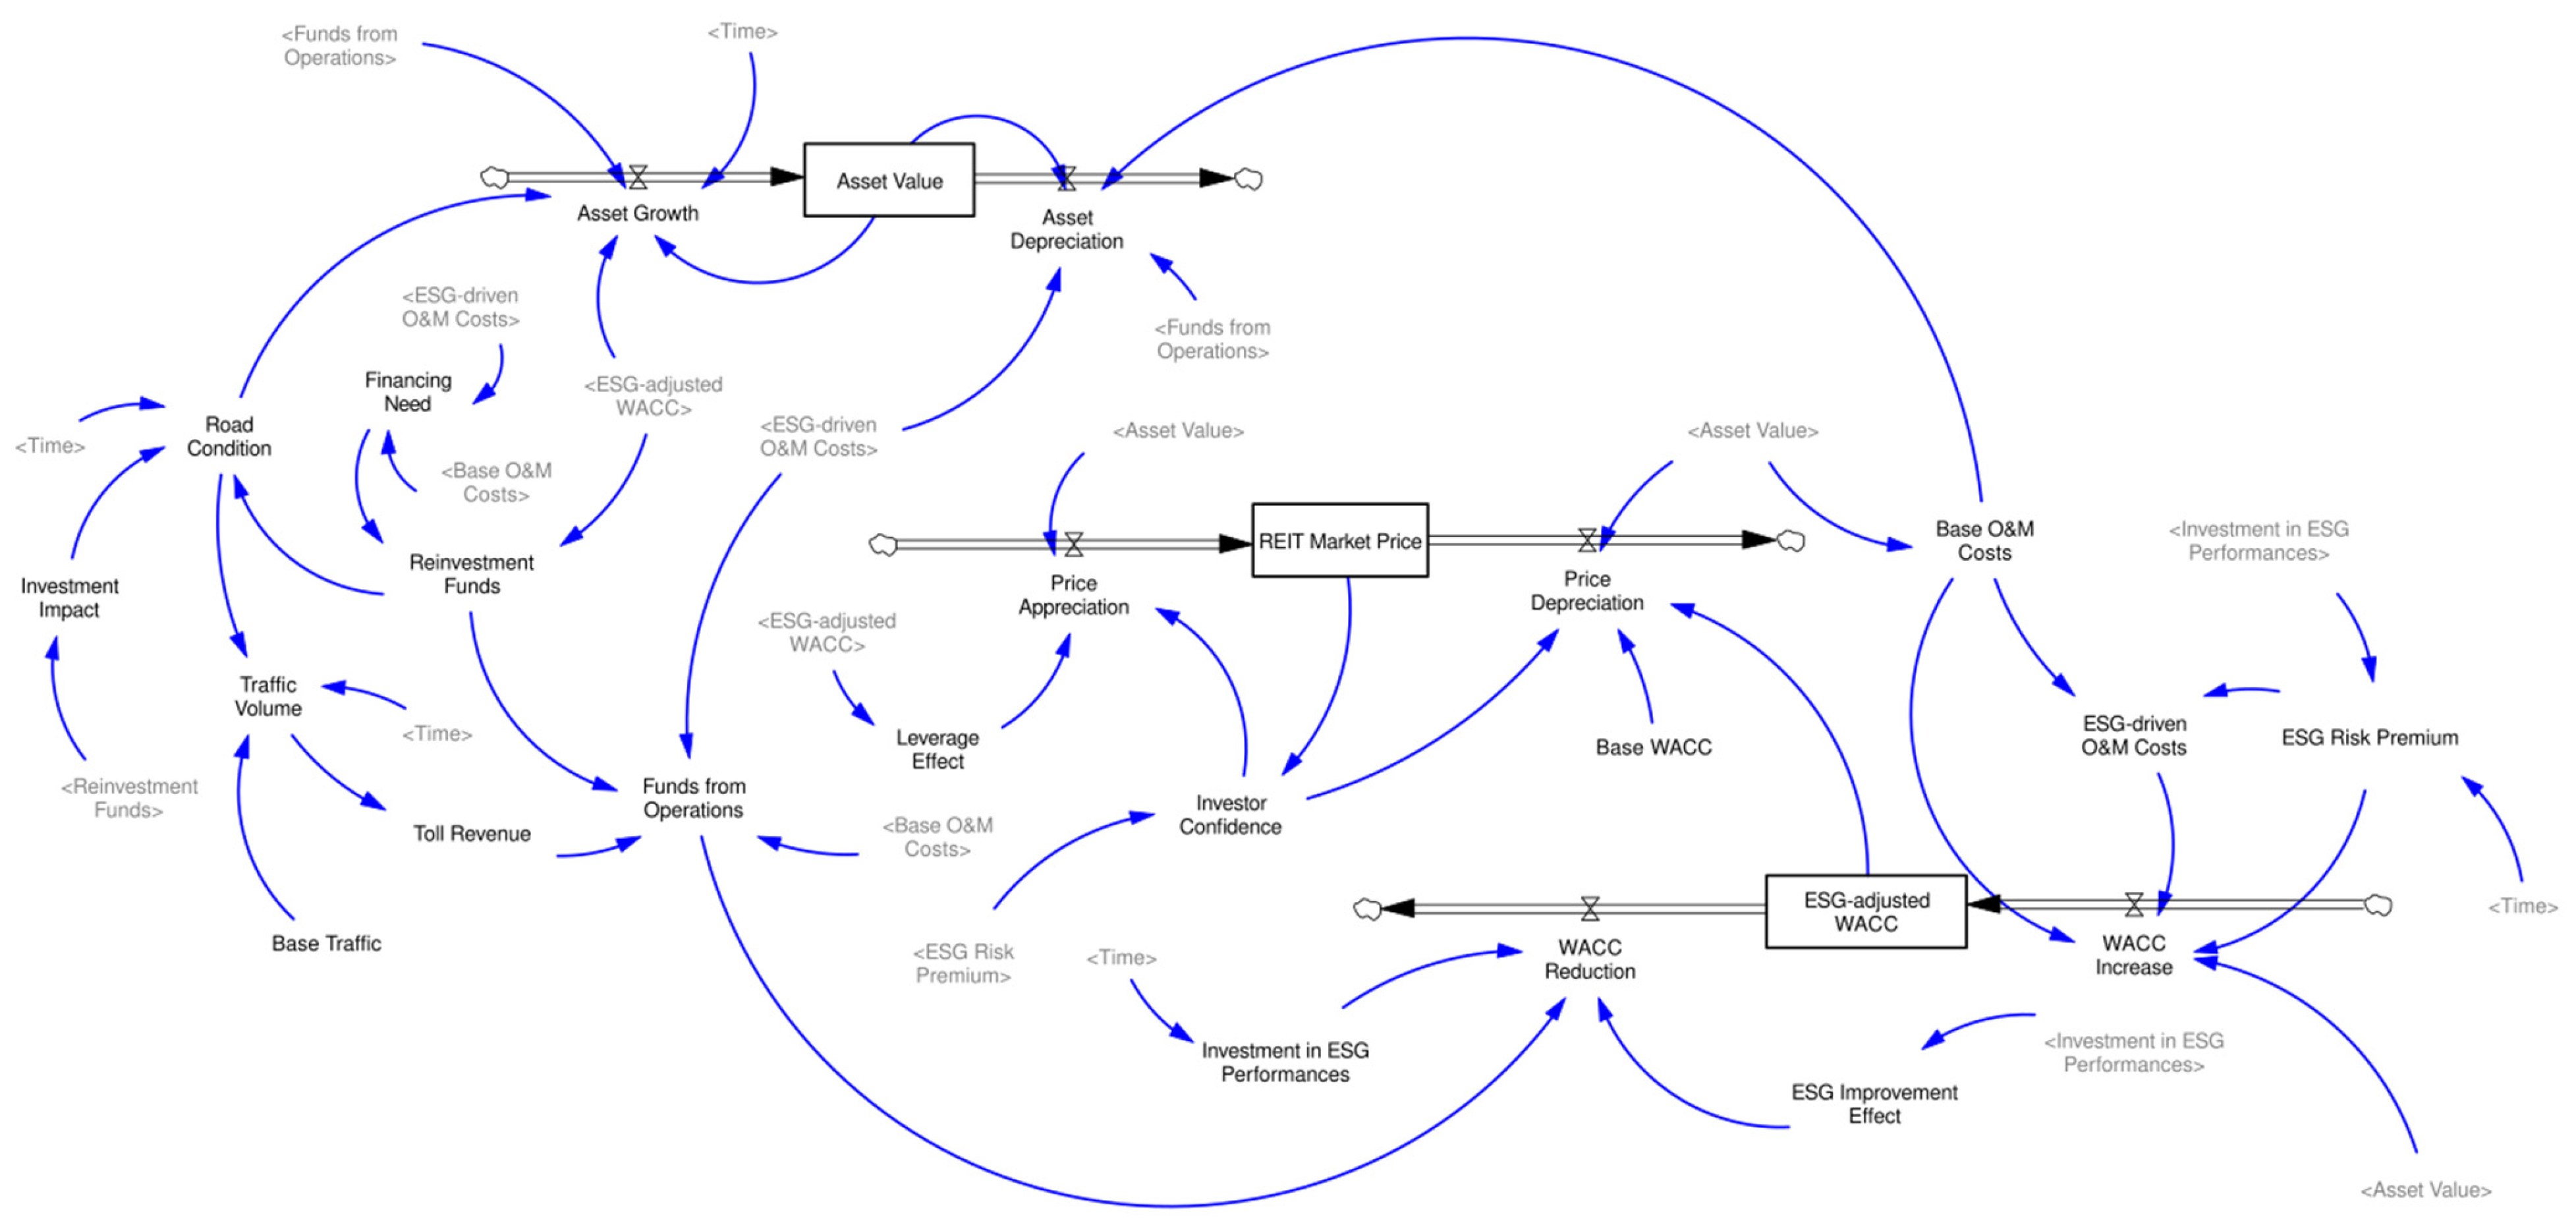
- Asset Depreciation = Asset Value/Depreciation Period + Depreciation Factor × MAX (0, MIN (Funds from Operations, Asset Value × Depreciation Rate)) + O&M Depreciation Coefficient × (“Base O&M Costs” + “ESG-driven O&M Costs”);
- Asset Growth = MAX (0, MIN (Asset Value × Growth Rate, Asset Trend Factor × MAX (0, Funds from Operations))/(1 + MAX (Base WACC, ABS (“ESG-adjusted WACC”))) × Road Condition × (1 − EXP (−MAX (1, Time)/Delay Time)));
- Asset Value(t) = INTEG (Inflow—Outflow, Initial Asset Value), where Inflow = Toll Revenue + ESG Efficiency Gains, and ESG Efficiency Gains = IEP(t) × Road Condition(t) × (1 − Depreciation Rate);
- Price Appreciation = MAX (0, MIN (Asset Value × Appreciation Rate, Asset Value × MAX (Min Appreciation, MIN (Max Appreciation, (Investor Confidence − Confidence Threshold) × Confidence Multiplier)) × Leverage Effect));
- Price Depreciation = MAX (0, MIN (Asset Value × Depreciation Rate, Asset Value × MAX (0, MIN (Max Depreciation, (“ESG-adjusted WACC” − Target WACC) × WACC Multiplier)) × (Confidence Offset—Investor Confidence))) + Base WACC;
- REIT Market Price(t) = Asset Value(t) × Investor Confidence(t)/ESG-adjusted WACC(t);
- WACC Reduction = MAX (0, MIN (WACC Reduction Cap, ESG Improvement Effect × Investment in ESG Performances/ESG Normalization Factor × MAX (0, Funds from Operations)));
- WACC Increase = MAX (0, MIN (WACC Increment Cap, WACC Increment Factor × (“Base O&M Costs” + “ESG-driven O&M Costs”)/Asset Value + ESG Risk Premium from Subsystems × Risk Multiplier));
- ESG-adjusted WACC(t) = WACC(t−1) + α × (ESG Impact(t) − Target WACC), where α = Adjustment Rate, and ESG Impact(t) = β1 × IEP(t) + β2 × IEP(t)2 (from CAPM quadratic term);
- Base O&M Costs = O&M Coefficient × Asset Value;
- ESG-driven O&M Costs = Base O&M Costs × (1 + ESG Risk Premium);
- ESG Risk Premium = MAX (Min Risk Premium, MIN (Max Risk Premium, Base Risk Premium + Risk Adjustment Factor × DELAY3 (Investment in ESG Performances × ESG Risk Coefficient + RANDOM NORMAL (Mean Noise, Std Noise, Mean Noise, Std Noise, Seed), Risk Delay Time)/(1 + MAX (1, Time)/Normalization Time)));
- ESG Improvement Effect = DELAY1 (Investment in ESG Performances × ESG Impact Factor, ESG Delay Time);
- Financing Need = (“Base O&M Costs” + “ESG-driven O&M Costs”) × Financing Multiplier.
- Depreciation factor: Multiplier for operations-based depreciation, value = 0.02;
- O&M depreciation coefficient: Links O&M costs to depreciation, value = 0.15;
- α: Adjustment rate for WACC convergence, value = 0.05;
- β1: IEP linear coefficient in ESG impact, value = −0.097;
- β2: IEP quadratic coefficient in ESG impact, value = −0.005.
Appendix C. Robustness Check with Fixed Econometric Parameters
| Parameter | Fixed Estimate | Optimized Value | Rationale for Fixing |
|---|---|---|---|
| IEP linear coefficient | −0.097 (p = 0.073) | −0.085 | Direct from CAPM; marginally significant. |
| IEP quadratic coefficient | −0.005 (p > 0.10) | −0.005 | Set to zero reflecting static non-significance. |
| IEP × market interaction | 0.954 (p = 0.030) | 0.920 | Significant CAPM interaction term. |
| Initial WACC | 6.5% (intercept) | 6.6% | Econometric baseline at t = 0. |
| Base WACC (long-run) | 6.6% (historical mean) | 6.8% | Anchored to static average. |
| Indicator | Fixed Model | Optimized Model | Deviation (Opt. Fixed) |
|---|---|---|---|
| RMSE vs. history | 0.035 | 0.030 | −0.005 (1400 basis points reduction) |
| Correlation r | 0.850 | 0.894 | +0.044 |
| WACC peak | 9.8% (month 22) | 10% (month 18) | +0.2% |
| Optimal IEP | 0.40 | 0.40 | 0 |
| Peak lag | 20 months | 18 months | −2 months |
References
- Global Infrastructure Hub. Infrastructure Monitor 2024; Global Infrastructure Hub: Sydney, Australia, 2024; Available online: https://cdn.gihub.org/umbraco/media/5555/infrastructure-monitor-2024-report.pdf (accessed on 7 November 2025).
- Angeles, L. In Periods Including Market Stress, ESG Provides Protection, Sustainalytics Study Shows; Morningstar: Newtown, PA, USA, 2025. [Google Scholar]
- Brounen, D.; Veld, H. Pricing ESG Equity Ratings and Underlying Data in Listed Real Estate Securities. Sustainability 2021, 13, 2037. [Google Scholar] [CrossRef]
- Fan, K.Y.; Shen, J.; Hui, E.C.M.; Cheng, L.T.W. ESG components and equity returns: Evidence from real estate investment trusts. Int. Rev. Financ. Anal. 2024, 96, 103716. [Google Scholar] [CrossRef]
- Elie, K.; Alexander, S.; Tanlak, S.U. ESG Integration in REITs: Exploring Financial Performance and WACC Implications. Master’s Thesis, Antwerp Management School, Antwerp, Belgium, June 2023. [Google Scholar] [CrossRef]
- Huang, B.; Wang, Z.; Gu, Y. ESG Investment Scale Allocation of China’s Power Grid Company Using System Dynamics Simulation Modeling. Int. J. Environ. Res. Public Health 2023, 20, 3643. [Google Scholar] [CrossRef]
- Zhang, H.; Chang, J.; Lin, T. Quantitative Evaluation of Value for Money in Sponge City Construction Public–Private Partnership Projects Through a System Dynamics Model. Systems 2025, 13, 471. [Google Scholar] [CrossRef]
- Bauer, R.; Eichholtz, P.; Kok, N. Corporate Governance and Performance: The REIT Effect. Real Estate Econ. 2010, 38, 1–29. [Google Scholar] [CrossRef]
- Eichholtz, P.; Kok, N.; Yonder, E. Portfolio greenness and the financial performance of REITs. J. Int. Money Financ. 2012, 31, 1911–1929. [Google Scholar] [CrossRef]
- Liu, J.; Cheng, C.; Yang, X.; Yan, L.; Lai, Y. Analysis of the efficiency of Hong Kong REITs market based on Hurst exponent. Phys. A Stat. Mech. Its Appl. 2019, 534, 122035. [Google Scholar] [CrossRef]
- Liu, J.; Chen, Y.; Li, X. A Booster or a Stabilizer? Investigating the Role of Chinese Real Estate Investment Trusts in the Systemic Risk of Financial Markets. SSRN 2024. [Google Scholar] [CrossRef]
- Chen, S.; Song, Y.; Gao, P. Environmental, social, and governance (ESG) performance and financial outcomes: Analyzing the impact of ESG on financial performance. J. Environ. Manag. 2023, 345, 118829. [Google Scholar] [CrossRef] [PubMed]
- Friede, G.; Busch, T.; Bassen, A. ESG and financial performance: Aggregated evidence from more than 2000 empirical studies. J. Sustain. Financ. Invest. 2015, 5, 210–233. [Google Scholar] [CrossRef]
- Erol, I.; Unal, U.; Coskun, Y. ESG investing and the financial performance: A panel data analysis of developed REIT markets. Environ. Sci. Pollut. Res. 2023, 30, 85154–85169. [Google Scholar] [CrossRef]
- Shangguan, X.; Shi, G.; Yu, Z. ESG Performance and Enterprise Value in China: A Novel Approach via a Regulated Intermediary Model. Sustainability 2024, 16, 3247. [Google Scholar] [CrossRef]
- Song, S.; Zuo, Z.; Cao, Y.; Wang, L. Analysis of Social Risk Causes of Rail Transit Construction Projects Based on DEMATEL-ISM. In Proceedings of the International Conference on Transportation Engineering 2015, Dalian, China, 26–27 September 2015; pp. 1868–1875. [Google Scholar]
- Lv, H.; Shi, Z.; Liu, J. Risk Assessment of Highway Infrastructure REITs Projects Based on the DEMATEL—ISM Approach. Sustainability 2024, 16, 5159. [Google Scholar] [CrossRef]
- Wang, T.; Han, Z.; Yang, Y.; Wang, S. Annual Report on The Development of PPP in China. In Research Series on the Chinese Dream and China’s Development Path; Springer: Berlin/Heidelberg, Germany, 2020. [Google Scholar]
- Zhang, S.; Chan, A.P.C.; Feng, Y.; Duan, H.; Ke, Y. Critical review on PPP Research—A search from the Chinese and International Journals. Int. J. Proj. Manag. 2016, 34, 597–612. [Google Scholar] [CrossRef]
- Maqsoom, A.; Babar, Z.; Shaheen, I.; Abid, M.; Kakar, M.R.; Mandokhail, S.J.; Nawaz, A. Influence of Construction Risks on Cost Escalation of Highway-Related Projects: Exploring the Moderating Role of Social Sustainability Requirements. Iran. J. Sci. Technol. Trans. Civ. Eng. 2021, 45, 2003–2015. [Google Scholar] [CrossRef]
- Deep, S.; Banerjee, S.; Dixit, S.; Vatin, N. Critical Factors Influencing the Performance of Highway Projects: An Empirical Evaluation. Buildings 2022, 12, 849. [Google Scholar] [CrossRef]
- Kashyap, A.K.; Sharma, V. Project finance through Infrastructure Investment Trust: Legal and regulatory analysis. Risk Gov. Control. Financ. Mark. Inst. 2024, 14, 65–76. [Google Scholar] [CrossRef]
- Han, B.-J.; Jiang, Y.-S.; Wang, Z.; Gong, D.; Jiang, H.; Jiang, P.-l. Analysis of the Risk Path of the Pipeline Corridor Based on System Dynamics. Shock Vib. 2021, 2021, 5529642. [Google Scholar] [CrossRef]
- Sterman, J. Business Dynamics, Systems Thinking and Modeling for a Complex World; Irwin/McGraw-Hill: Boston, MA, USA, 2000; Available online: https://web.mit.edu/jsterman/www/BusDyn2.html (accessed on 7 November 2025).
- Hjorth, P.; Bagheri, A. Navigating towards sustainable development: A system dynamics approach. Futures 2006, 38, 74–92. [Google Scholar] [CrossRef]
- Nguyen, T.; Cook, S.; Ireland, V. Application of System Dynamics to Evaluate the Social and Economic Benefits of Infrastructure Projects. Systems 2017, 5, 29. [Google Scholar] [CrossRef]
- Ghufran, M.; Khan, K.I.A.; Ullah, F.; Nasir, A.R.; Al Alahmadi, A.A.; Alzaed, A.N.; Alwetaishi, M. Circular Economy in the Construction Industry: A Step towards Sustainable Development. Buildings 2022, 12, 1004. [Google Scholar] [CrossRef]
- Xue, Y.; Xiang, P.; Jia, F.; Liu, Z. Risk Assessment of High-Speed Rail Projects: A Risk Coupling Model Based on System Dynamics. Int. J. Environ. Res. Public Health 2020, 17, 5307. [Google Scholar] [CrossRef]
- Jonsdottir, A.T.; Johannsdottir, L.; Davidsdottir, B. Systematic literature review on system dynamic modeling of sustainable business model strategies. Clean. Environ. Syst. 2024, 13, 100200. [Google Scholar] [CrossRef]
- Sánchez-García, J.Y.; Núñez-Ríos, J.E.; López-Hernández, C.; Rodríguez-Magaña, A. Modeling Organizational Resilience in SMEs: A System Dynamics Approach. Glob. J. Flex. Syst. Manag. 2023, 24, 29–50. [Google Scholar] [CrossRef]
- Yuan, H.; Yang, B. System Dynamics Approach for Evaluating the Interconnection Performance of Cross-Border Transport Infrastructure. J. Manag. Eng. 2022, 38, 04022008. [Google Scholar] [CrossRef]
- Martinez-Moyano, I.J.; Richardson, G.P. Best practices in system dynamics modeling. Syst. Dyn. Rev. 2013, 29, 102–123. [Google Scholar] [CrossRef]
- Urgewald; RIMA. ESG Standards in China. Available online: https://www.urgewald.org/sites/default/files/media-files/urgewald-RIMA_China-ESG_2024.pdf (accessed on 15 August 2025).
- Commission, C.S.R. Guidelines on Investor Relations Management for Listed Companies; China Securities Regulatory Commission (CSRC): Beijing, China, 2022. [Google Scholar]
- KPMG. China Stock Exchanges Finalised Mandatory Sustainability Reporting Requirements for Larger Listed Entities. Available online: https://assets.kpmg.com/content/dam/kpmg/cn/pdf/en/2024/04/china-stock-exchanges-finalised-mandatory-sustainability-reporting-requirements-for-larger-listed-entities.pdf (accessed on 15 August 2025).
- Fetters, M.D.; Curry, L.A.; Creswell, J.W. Achieving integration in mixed methods designs-principles and practices. Health Serv. Res. 2013, 48, 2134–2156. [Google Scholar] [CrossRef]
- Gong, E.; Wang, Y.; Zhou, X.; Duan, J. ESG factors affecting the asset sustainability of infrastructure REITs in China. Eng. Constr. Archit. Manag. 2024; ahead of print. [Google Scholar] [CrossRef]
- Shang, H.; Yin, H. Dynamic simulation research on urban green transformation under the target of carbon emission reduction: The example of Shanghai. Humanit. Soc. Sci. Commun. 2023, 10, 754. [Google Scholar] [CrossRef]
- Nardo, M.; Saisana, M.; Saltelli, A.; Tarantola, S.; Hoffman, A.; Giovannini, E. Handbook on Constructing Composite Indicators and User Guide; OECD: Paris, France, 2008; Volume 2005. [Google Scholar]
- Hu, A.; Yuan, X.; Fan, S.; Wang, S. The Impact and Mechanism of Corporate ESG Construction on the Efficiency of Regional Green Economy: An Empirical Analysis Based on Signal Transmission Theory and Stakeholder Theory. Sustainability 2023, 15, 13236. [Google Scholar] [CrossRef]
- Brounen, D.; Marcato, G. Price-Signalling and Return-Chasing: Efficiency Game or Behavioural Argument. 2016. Available online: https://www.tias.edu/docs/default-source/Kennisartikelen/int'l-liqret-wp16-submitted.pdf?Status=Temp&sfvrsn=2 (accessed on 15 August 2025).
- Switzer, L.; Tu, Q.; Wang, J. Corporate governance and default risk in financial firms over the post-financial crisis period: International evidence. J. Int. Financ. Mark. Inst. Money 2017, 52, 196–210. [Google Scholar] [CrossRef]
- Rahmandad, H.; Oliva, R.; Osgood, N.D. Analytical Methods for Dynamic Modelers; The MIT Press: Cambridge, MA, USA, 2015. [Google Scholar]
- Schoemann, A.; Boulton, A.; Short, S. Determining Power and Sample Size for Simple and Complex Mediation Models. Soc. Psychol. Personal. Sci. 2017, 8, 194855061771506. [Google Scholar] [CrossRef]
- Wu, M.-C.; Wang, C.-M. Revisiting the nexus of REITs returns and macroeconomic variables. Financ. Res. Lett. 2024, 59, 104837. [Google Scholar] [CrossRef]
- Fama, E.F.; French, K.R. The Cross-Section of Expected Stock Returns. J. Financ. 1992, 47, 427–465. [Google Scholar] [CrossRef]
- Bäck, T.H.W.; Kononova, A.V.; van Stein, B.; Wang, H.; Antonov, K.A.; Kalkreuth, R.T.; de Nobel, J.; Vermetten, D.; de Winter, R.; Ye, F. Evolutionary Algorithms for Parameter Optimization—Thirty Years Later. Evol. Comput. 2023, 31, 81–122. [Google Scholar] [CrossRef] [PubMed]
- Qin, A.K.; Huang, V.L.; Suganthan, P.N. Differential Evolution Algorithm With Strategy Adaptation for Global Numerical Optimization. IEEE Trans. Evol. Comput. 2009, 13, 398–417. [Google Scholar] [CrossRef]
- Barlas, Y. Formal aspects of model validity and validation in system dynamics. Syst. Dyn. Rev. 1996, 12, 183–210. [Google Scholar] [CrossRef]
- Cavana, R. Modeling the environment: An introduction to system dynamics models of environmental systems. Andrew Ford. Syst. Dyn. Rev. 2003, 19, 171–173. [Google Scholar] [CrossRef]



| Source | Variables | Processing Details | Data Frequency and Notes |
|---|---|---|---|
| Wind and CSMAR | Closing price, trading volume, net asset value (NAV), distributions | Winsorized at 1%/99% levels (removing ~2% outliers to reduce extreme value impact). | Daily |
| Issuer filings | Toll revenue, operation and maintenance (O&M) costs, capital expenditures (capex), leverage | Linear interpolation for ≤ 3 months missing; gaps > 3 months flagged for exclusion if exceeding 5% threshold. | Monthly/quarterly (converted to monthly) |
| CSR/ESG reports/issuer filings | Environmental, Social, and Governance performance | Min–max normalization within each month. | Monthly/quarterly (converted to monthly) |
| Macro sources | 10-year bond yield, Brent crude oil price, Gross Domestic Product (GDP) | Cross-source reconciliation (e.g., averaging from multiple databases for consistency). | Monthly |
| Variable | Coefficient | Std. Error | t-Statistic | p-Value | 95% CI |
|---|---|---|---|---|---|
| Constant | −0.056 | 0.147 | −0.383 | 0.702 | [−0.345, 0.232] |
| IEP_c | −0.097 | 0.054 | −1.795 | 0.073 * | [−0.203, 0.009] |
| IEP_c_sq | −0.005 | 0.103 | −0.044 | 0.965 | [−0.207, 0.198] |
| GDP YoY | 0.004 | 0.002 | 1.716 | 0.086 * | [−0.001, 0.009] |
| Debt Ratio | −0.056 | 0.029 | −1.951 | 0.051 * | [−0.112, 0.000] |
| Brent USD | 0.002 | 0.002 | 1.234 | 0.217 | [−0.001, 0.005] |
| CN10Y Yield | −0.009 | 0.008 | −1.168 | 0.243 | [−0.024, 0.006] |
Disclaimer/Publisher’s Note: The statements, opinions and data contained in all publications are solely those of the individual author(s) and contributor(s) and not of MDPI and/or the editor(s). MDPI and/or the editor(s) disclaim responsibility for any injury to people or property resulting from any ideas, methods, instructions or products referred to in the content. |
© 2025 by the authors. Licensee MDPI, Basel, Switzerland. This article is an open access article distributed under the terms and conditions of the Creative Commons Attribution (CC BY) license (https://creativecommons.org/licenses/by/4.0/).
Share and Cite
Wang, X.; Shi, Z. A Hybrid Modeling Framework for Evaluating ESG Investment Risks in Highway Real Estate Investment Trusts: Insights from Chinese Highway Assets. Systems 2025, 13, 1004. https://doi.org/10.3390/systems13111004
Wang X, Shi Z. A Hybrid Modeling Framework for Evaluating ESG Investment Risks in Highway Real Estate Investment Trusts: Insights from Chinese Highway Assets. Systems. 2025; 13(11):1004. https://doi.org/10.3390/systems13111004
Chicago/Turabian StyleWang, Xinghua, and Zhenwu Shi. 2025. "A Hybrid Modeling Framework for Evaluating ESG Investment Risks in Highway Real Estate Investment Trusts: Insights from Chinese Highway Assets" Systems 13, no. 11: 1004. https://doi.org/10.3390/systems13111004
APA StyleWang, X., & Shi, Z. (2025). A Hybrid Modeling Framework for Evaluating ESG Investment Risks in Highway Real Estate Investment Trusts: Insights from Chinese Highway Assets. Systems, 13(11), 1004. https://doi.org/10.3390/systems13111004


