Abstract
Passive transit signal priority (TSP) strategies are widely recognized as effective tools for mitigating bus delays along urban arterials. However, existing TSP models primarily focus on through movements of transit vehicles, leading to potential delays for buses making turning movements. Moreover, these models do not adequately address signal coordination in multi-modal traffic systems involving both buses and private vehicles, resulting in increased delays and frequent stops for private vehicles. To address these limitations, this study proposes a binary mixed-integer linear programming (BMILP)-based signal progression band optimization model designed for multi-modal, path-level signal coordination. The model creates multiple progression bands for both straight and turning buses to minimize potential transit delays and enhance public transport service levels. By incorporating the mutual interactions between buses and private vehicles, progression bands for private vehicles are simultaneously optimized, enabling coordinated signal control that considers all users. The objective function maximizes passenger-equivalent service demand satisfied by the progression bands, explicitly accounting for mixed traffic flows and passenger loads. Numerical experiments on an urban arterial corridor demonstrate that, compared with the benchmark BUSBAND method, the proposed model achieves a 26% reduction in average bus delays, a 37% reduction in passenger car delays, and a 22% decrease in total stops, while also improving overall travel time reliability.
1. Introduction
In recent years, the role of public transport has been increasingly contextualized within the broader paradigm of intermodality and, more generally, Mobility as a Service (MaaS). This paradigm envisions the seamless integration of different travel modes, supported by digital platforms that optimize user-centric mobility solutions [1,2,3]. In this context, effective transit signal coordination not only improves operational efficiency but also strengthens the reliability and attractiveness of buses as a core component of MaaS ecosystems [4,5]. By enhancing multimodal traffic signal coordination, this study contributes to the discourse on how infrastructure-based operational strategies can complement MaaS initiatives.
Multi-modal traffic signal optimization is a complex systemic problem involving not only spatiotemporal coordination of signals at intersections but also cooperative operation and right-of-way allocation among different traffic modes, particularly private vehicles and buses [6,7,8]. Extensive research has focused on transit signal priority (TSP) systems, which allow buses to pass through intersections without delays from traffic signals [9]. This method has demonstrated significant potential in enhancing transit services and easing urban traffic congestion. TSP systems are typically classified into two types: passive and active control. Active TSP utilizes bus detectors at intersections to adjust signal timing based on factors like bus location, schedule adherence, and current traffic conditions [10]. However, there are concerns about potential negative impacts on side roads, especially with frequent priority requests. Researchers have addressed these challenges by introducing constraints such as limiting priority calls, maintaining consistent cycle lengths, and prioritizing buses that are behind schedule [11,12]. These adjustments, however, can reduce the number of buses benefiting from TSP, potentially compromising its effectiveness in high-volume transit scenarios. In contrast, passive TSP relies on predetermined signal plans that consider transit routes, travel times, dwell times, and other operational factors, making it a cost-effective option for arterial roads that does not require real-time data.
In urban arterial networks, passive TSP is commonly integrated into arterial traffic control systems. A review of the literature reveals that most existing studies in this domain can be broadly classified into two categories: performance-based and bandwidth-based approaches. Performance-based approaches aim to optimize signal timing parameters by modeling the relationship between traffic indices (such as delay and number of stops) and signal timing [13,14,15]. However, due to the complexity of nonlinear models involved in calculating parameters like delay, obtaining the optimal solution can be challenging. The bandwidth-based approaches focus on maximizing the green bandwidth by adjusting signal timing parameters such as phase differences. This method has garnered widespread attention and application due to its simplicity, intuitiveness, and ability to achieve optimal solutions [16,17,18,19,20].
Progression models for passenger cars typically rely on recommended progression speeds. However, applying these models to bus flows poses challenges due to buses’ unique travel behaviors, including extended dwell times at bus stops. To enhance operational efficiency in transit systems, several studies have focused on controlling arterial signal progression. Building upon traditional arterial progression models, scholars have proposed the TRAMBAND, BUS-MULTIBAND, and BUS-AM-BAND models [21,22]. These models aim to optimize transit progression using a binary mixed-integer linear programming approach. Most TSP models primarily focus on through movements, which may cause delays for buses making turns at intersections due to insufficient signal priority adjustments. To address this issue, Chen et al. [23] proposed a signal coordination model that accounts for multi-route transit lines, enabling the provision of independent coordinated green waves for multiple routes, including turning movements.
However, these models do not adequately address multi-modal signal coordination, resulting in significant delays and an increased number of stops for private vehicles as they navigate through coordinated signal systems designed primarily for buses. To address these problems, this paper establishes a signal progression bands optimization model for multi-modal signal coordination. The main contributions of this study are as follows:
- The multiple signal progression bands are designed for both straight and turning transit to avoid potential bus delays and to enhance the service level of the public transportation system;
- The progression bands for private vehicles are incorporated into the model, enabling it to coordinate transit vehicle operations while simultaneously accounting for private vehicles;
- A mixed integer linear model is developed to optimize progression bands with an objective that balances mixed traffic and passenger loads.
The remainder of this paper is organized as follows: First, a review of the relevant literature is provided. Next, the proposed methodology is described. Subsequently, a case study and a simulation-based comparative experiment are conducted to demonstrate the effectiveness of the model. Finally, conclusions are presented.
2. Literature Review
The literature regarding transit signal priority and arterial signal coordination is reviewed separately in the following.
2.1. Transit Signal Priority
Drawing on current research, bus priority control strategies can be categorized into three main types: Active Transit Signal Priority, Passive Transit Signal Priority, and Adaptive Transit Signal Priority. Active TSP utilizes detectors at targeted intersections to execute control strategies such as extending green phases, early termination of red phases, and setting dedicated bus phases upon detecting a bus. This strategy is highly effective in improving bus throughput but may adversely affect general traffic and coordination, particularly when frequent requests or early arrivals lead to over-activation of priority signals [10].
Passive TSP does not require traffic detectors at intersections. Instead, it relies on pre-set offline timing plans to provide priority to buses. Ma and Yang [24] simulated the Bus Rapid Transit (BRT) system based on the relationship between bus frequency and signal cycle length, finding that bus priority is easier to implement when the headway is an integer multiple of the signal half-cycle. Adaptive TSP addresses the overall operation of the traffic system by optimizing specific performance indicators, such as minimizing vehicle delays, minimizing per-passenger delays, and maximizing headway distances, to reduce overall system load. Mirchandani et al. [25] optimized intersection signal control strategies and bus schedules to minimize total vehicle delays. Eleni et al. [26] proposed an adaptive TSP strategy that minimizes average traveler delays by weighting vehicle delays based on passenger occupancy rates. Chen et al. [23] proposed a signal coordination model that can provide coordinated progression bands for multiple bus routes. Recent studies also integrate connected vehicle data and adaptive decision-making to enhance TSP. For example, Hao et al. [27] used edge-computing-based connected vehicle data for dynamic TSP deployment, while Kampitakis et al. [28] incorporated reinforcement learning (RL) to enable online bus priority adjustment at the corridor scale. These methods show great adaptability but are primarily focused on localized intersections and do not yet provide systematic progression design along arterials. Overall, prior research on TSP has demonstrated substantial benefits for bus operations but often treats buses in isolation, with limited consideration of their interactions with general traffic, turning flows, or multimodal coordination requirements.
2.2. Arterial Signal Coordination
The maximization of green bandwidth methods is commonly used to improve traffic flow efficiency. Little et al. [29] were the first to propose a maximum green bandwidth model, later refined as MAXBAND [16] and extended to MULTIBAND [17]. Zhang et al. [30] proposed AM-BAND to relax symmetry constraints, while Xu et al. [31] adapted MULTIBAND for connected and automated vehicles (CAVs). Although MAXBAND and MULTIBAND have laid the foundation for progression design, their focus is primarily vehicle-centric. More recent works, such as OD-BAND [32] and AM-BAND [30], have introduced OD-based modeling and asymmetric progression to better reflect traffic diversity. RL-based adaptive systems [33] further optimize phase splits and offsets in real time, showing promise for highly dynamic environments. In the connected vehicle era, adaptive progression schemes leverage vehicle-to-infrastructure (V2I) communication to dynamically optimize bandwidth [34]. However, most studies still lack explicit integration of transit operations or multimodal coordination at the corridor level. Despite these advancements, most arterial coordination models remain vehicle-centric, focusing on maximizing average traffic efficiency without systematically integrating multimodal users, especially buses and turning movements.
2.3. Summary and Research Gap
As shown in Table 1, existing bus signal coordination models only focus on straight routes, neglecting the needs of turning traffic. This oversight can lead to unbalanced signal allocation, favoring mainline traffic and reducing service levels for turning buses. Traditional arterial progression models and their enhancements mainly optimize for average vehicular throughput without explicitly addressing multimodal coordination. In summary, research progress can be divided into three streams: (i) TSP strategies for localized intersections, (ii) green-band optimization methods for arterial vehicular traffic (MAXBAND, MULTIBAND, OD-BAND, AM-BAND), and (iii) adaptive and RL-based control for connected vehicle environments. However, no existing framework systematically combines progression optimization for both transit and general traffic at the path level while explicitly accounting for turning flows. The contribution of this study is to bridge this gap by proposing a path-based progression optimization model that (i) designs progression bands for both straight and turning buses; (ii) explicitly integrates multimodal traffic interactions; and (iii) applies an exact optimization formulation, enabling performance gains in delay reduction and travel time reliability for both buses and private vehicles.

Table 1.
Comparison of bus and multimodal signal coordination models.
3. Methods
3.1. Constraints
We present a compact, logic-oriented formulation that groups constraints by function and moves repetitive algebra to Appendix A for readability. The arterial is two-way with n signalized intersections; directions are denoted as inbound and outbound (Figure 1). Key notation is summarized in Table 1 (an abridged list), and the full list is provided in Table A1 in Appendix A.
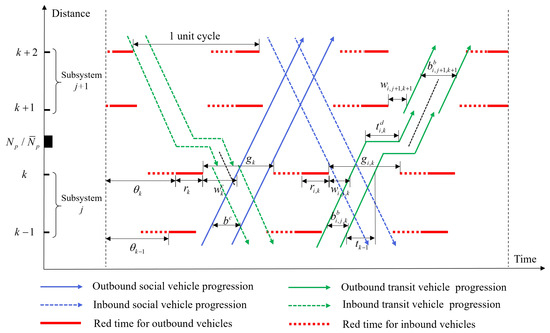
Figure 1.
Progression bands for the proposed model.
The proposed model is based on a two-way arterial with n signalized intersections. As shown in Figure 1, the two travel directions along the artery are designated as inbound and outbound. The associated symbols are defined in Table 2, with some also illustrated in Figure 1.
Table 2.
List of Key Parameters and Variables in the Proposed Model.
With the large-scale and high-density deployment of both mobile and fixed traffic detectors, comprehensive traffic flow monitoring on key road segments (e.g., arterials) has become feasible, providing a foundation for more precise and real-time traffic signal coordination [37]. For instance, path-level traffic flow data can be obtained through roadside Automatic Vehicle Identification (AVI) sensors, while bus dwell times at stops can be captured via mobile GPS-based detectors. Accordingly, this study assumes that both network-wide traffic flow information and spatiotemporal bus operation data can be accessed in real time. This assumption forms the basis for implementing the proposed signal coordination optimization for buses and general vehicles.
It is important to clarify the perspective of analysis adopted in this study. The proposed model is developed from the standpoint of a city traffic manager who seeks to balance the service quality of public transport with the overall efficiency of urban road traffic. While bus operators aim to minimize delays and enhance schedule reliability, general traffic users and city managers emphasize reducing congestion and ensuring fair allocation of green time. Our model explicitly incorporates these contrasting objectives by optimizing progression bands in a way that accounts for both passenger loads of buses and the traffic volumes of private vehicles.
3.2. Social Vehicle Green Band Constraints
We aggregate social vehicle constraints into four groups: (S1) bandwidth bounds, (S2) progression continuity, (S3) activation and minimum-band constraints, and (S4) directional balance. We keep one representative equality per group in the main text and defer the remaining algebra to Appendix A.
The optimization objective for social vehicles is to achieve two-way green bands on the straight paths in both outbound and inbound directions. Drawing from the MAXBAND framework, the fundamental bounds are
Progression continuity (S2) links adjacent intersections via loop-integer constraints; one representative is
The inbound counterpart and relaxed big-M forms appear in Appendix A, Equations (A1)–(A4).
Activation and minimum-band constraints (S3) switch coordination on/off for each direction via and enforce ; see Equations (A5)–(A8) in Appendix A. Directional balance constraints (S4) preventing degenerate allocations are given in Equation (A9) in Appendix A.
3.2.1. Transit Vehicle Green Band Constraints
Transit constraints are grouped analogously: (T1) bandwidth bounds, (T2) subgroup progression continuity (intra/inter), (T3) activation with big-M relaxations, (T4) discrete capacity of bands, and (T5) stop/queue spillback protection. We illustrate each group with a representative constraint and move the rest to Appendix A.
(T1) Bandwidth bounds:
(T2) Intra-subgroup continuity mirrors (3): a representative form is provided in Equation (A10) in Appendix A, while inter-subgroup connectivity (centerline alignment) appears in Equations (A11) and (A12) in Appendix A.
(T3) Activation constraints use to relax continuity/connectivity when a band is absent; the big-M forms are consolidated in Equations (A13)–(A16) in Appendix A.
(T4) Discrete band capacity: the band width must accommodate an integer number of buses per cycle, i.e., and (Equations (A17) and (A18) in Appendix A).
(T5) Stop capacity and spillback protection: we estimate the maximum queue at the end of red and ensure it clears before the first bus reaches the stop under the active band. The queue build-up expression and clearance timing inequality are provided in Equations (A19)–(A21) in Appendix A.
3.2.2. Phase Sequence Constraints
To expand feasibility under multimodal conflicts and dwell times, we co-optimize phase differences and phase order. We model phase precedence with binary and enforce irreflexivity, antisymmetry, and transitivity (Equations (A22)–(A24) in Appendix A). We then bind precedence to red splits via linking constraints, ensuring that left/right red durations plus green equal one cycle (Equations (A25)–(A27) in Appendix A). Keeping these details in the appendix avoids repetition in the main text.
3.2.3. Summary
Putting it together, the developed program can be summarized as follows. The objective is to maximize the passenger-equivalent demand served by active green bands (see Equation (A28) in Appendix A), subject to social, transit, and phase sequence constraints (Equations (A1)–(A27) in Appendix A). The full model is:
Compared with prior arterial coordination models such as MAXBAND, MULTIBAND, OD-BAND, and BUSBAND, the proposed BMILP model introduces three key innovations: (i) explicit multi-path progression with subgroup continuity, (ii) simultaneous optimization of both bus and private vehicle bands, and (iii) integration of bus dwell time and stop/queue spillback protection. This extends existing formulations from one-dimensional arterial bands to a multimodal, multi-path setting.
In the proposed BMILP model, deterministic averages are adopted to preserve tractability. This is consistent with practice in BUSBAND-type models but admittedly simplifies reality [38]. Future research can extend our BMILP formulation to incorporate stochastic dwell times via chance constraints or robust optimization, which would better capture operational uncertainty.
3.3. Solution
The proposed model is formulated as a mixed-integer linear programming problem and can be solved by the standard branch-and-bound method. Commercial solvers, such as Gurobi and LINGO, can readily handle the model. Compared with the BUSBAND model, the proposed model further incorporates the coordination of private vehicles [38]. New decision variables, such as the bandwidth of private vehicle progression and the offset , are introduced. However, this does not pose any computational difficulty for modern solvers.
We also note that the subgroup-based progression constraints are modular: additional intersections only add linear constraints per subgroup and do not alter problem structure. Hence, the model can be directly scaled to longer arterials, although the computational burden rises.
4. Case Study
In this section, the model is solved using the Gurobi optimizer on a laptop equipped with a 2.3 GHz Intel Core i5-6300HQ CPU, 16 GB RAM, and Windows 11 (64-bit). The laptop is a Lenovo model, manufactured by Lenovo Group Ltd. (Beijing, China) The entire solution process can be completed within 10 s. To validate the effectiveness of the model, simulation experiments are conducted using the SUMO traffic simulation platform.
4.1. Site Description
A case study is conducted on Shuanglong Avenue in Jiangning District, Nanjing, China. The arterial is defined such that the outbound direction corresponds to the south-to-north movement, while the inbound direction corresponds to the north-to-south movement. The network layout of the study corridor is illustrated in Figure 2b. The arterial has a total length of approximately 3.1 km, consisting of five segments and six signalized intersections, with five bus stops provided in each direction. Figure 2b also presents the ideal travel times of each segment when vehicles travel at the maximum speed limit of 80 km/h.
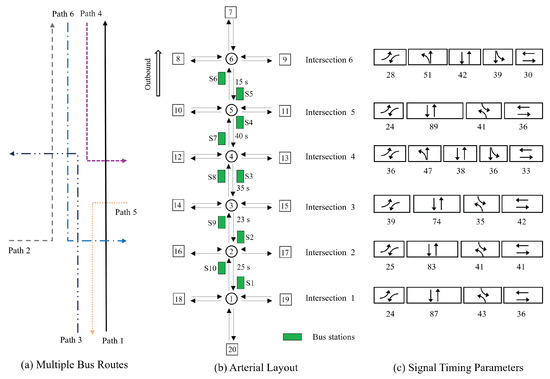
Figure 2.
Illustration of the experiment’s arterial and critical bus routes.
Based on the bus operation characteristics along the study corridor, six representative bus routes are selected as the optimization paths, as shown in Figure 2a and Table 3. Among them, Paths 1, 2, and 3 operate in the outbound direction, while Paths 4, 5, and 6 operate in the inbound direction. The signal timing parameters of each intersection are illustrated in Figure 2c.
Table 3.
Bus Stopping at Stations for Different Paths.
The traffic flow and bus dwell time data used in this study were obtained from field surveys conducted along the study corridor. For the signalized intersections along the arterial road, a traffic flow survey was conducted during the off-peak period from 14:30 to 16:30 on a typical weekday. The survey aimed to collect traffic volume data for both public transit vehicles and general traffic vehicles along the designated routes to be optimized, which is summarized in Table 4. In addition to traffic volume data, average dwell times for buses at each stop were surveyed and are used as parameters for subsequent simulations. The average dwell times are provided in Table 5. A dash (“–”) indicates that no bus stops are present along the given segment. These data sources ensure that the simulation inputs reflect realistic operating conditions, thereby enhancing transparency and reproducibility. The minimum green bandwidth required for a single bus to pass is set to 8 s.
Table 4.
Traffic Flows on The Routes Need to Be Optimized.
Table 5.
Bus Stopping Time.
4.2. Bandwidth Results Analysis
To validate the effectiveness of the proposed model, simulation experiments were conducted using the SUMO traffic simulation platform, and two classical algorithms were selected for comparison. The first is BUSBAND, a classical transit signal coordination model capable of providing bidirectional green bands for through bus movements along arterials [38]. The second is MP-BUSBAND, a recently developed multipath transit coordination model that enables green bands for multiple bus routes, including those with turning movements [23].
Figure 3, Figure 4 and Figure 5 and Table 6 compare results. BUSBAND achieves 39 s outbound and 21 s inbound (weighted 30 s). MP-BUSBAND generates bandwidths for all six paths (weighted 32 s), but Paths 2 and 5 remain 0. Our model reaches 37 s total with 50/13/47/54/39/41 s for six paths and adds a 72 s outbound private vehicle band.
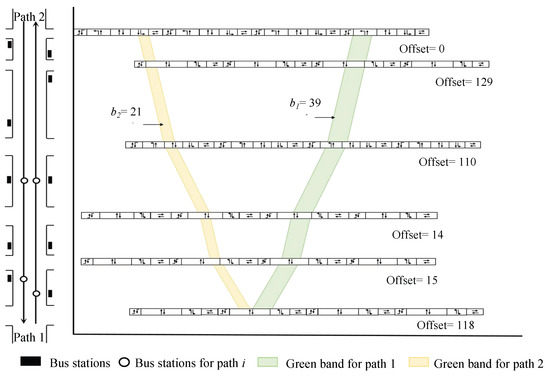
Figure 3.
Time–space diagram under the BUSBAND model.
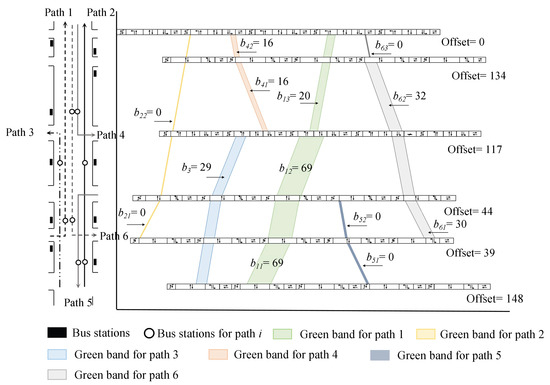
Figure 4.
The time–space diagram under the MP-BUSBAND model.
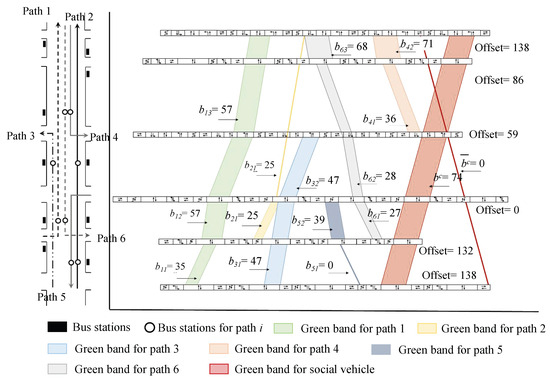
Figure 5.
The time–space diagram under the proposed model.
Table 6.
Comparison of Bandwidth between Three Models.
4.3. Simulation Result Analysis
SUMO was used to simulate and evaluate the effectiveness of multi-path signal coordination control that balances public transportation and private vehicles. The graphical interface editor NetEdit was used to configure the road network structure, traffic signals, bus stop locations, and traffic information detectors in the simulation environment, as shown in Figure 6. The traffic flow distribution and vehicle composition information of the simulation environment are written into the. rou file. The simulation parameter information configured for the experiment includes the following. (i) The distance between the stop line and the intersection center is 15 m. (ii) The body length of private vehicles is 4 m, and the body length of public transportation vehicles is 12 m. (iii) The maximum speed limit for private vehicles is 80 km/h, and the maximum speed limit for public transportation vehicles is 60 km/h. The speed distribution of vehicles follows a normal distribution. Use the default values of sumo simulation software (version 1.14.1) for other simulation parameters. The evaluation indicators are average delay, average number of stops, and average travel time.
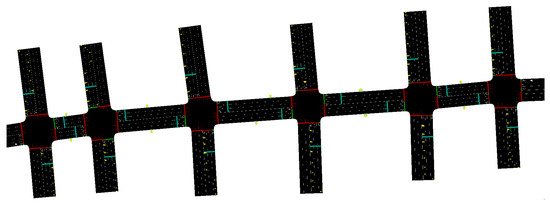
Figure 6.
SUMO simulation environment.
4.3.1. Average Delay
The average delay time of buses and private vehicles under three coordinated control schemes is shown in Figure 7. For buses, MP-BUSBAND cuts average delay by 7.09% versus BUSBAND. Our model lowers bus delay to 123 s (6.11% and 12.77% less than BUSBAND and MP-BUSBAND). For private vehicles, a 74 s northbound band reduces delay by 25.00%, 20.41%, and 30.30% compared with the BUSBAND and baseline.
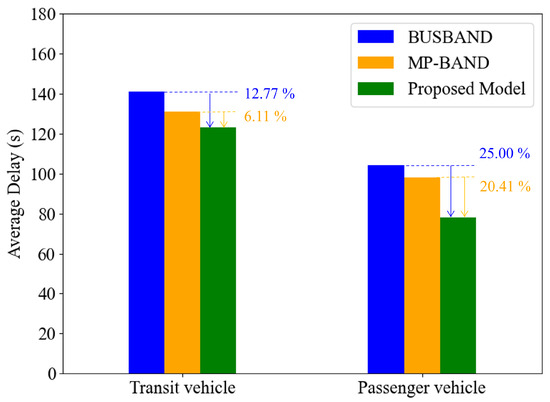
Figure 7.
Average delay under the three models.
4.3.2. Average Number of Stops
The average number of stops for buses and private vehicles under three coordinated control schemes is shown in Figure 8. For buses, MP-BUSBAND improves over BUSBAND, while our model performs best (10.50% and 4.95% fewer stops). For private vehicles, our model reduces stops by 36.59% and 20.41% versus BUSBAND and MP-BUSBAND.
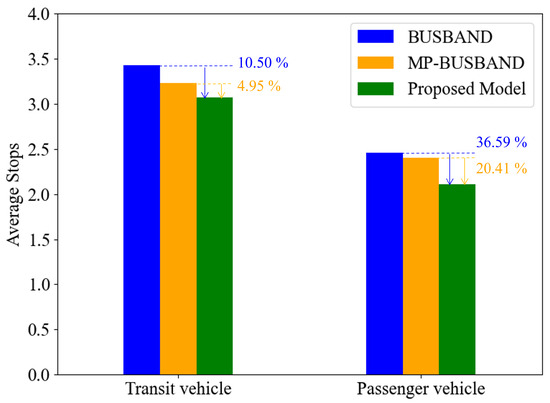
Figure 8.
Average stops under the three models.
4.3.3. Average Travel Time
The average travel time of buses and private vehicles under three coordinated control schemes is shown in Figure 9. Travel time trends mirror delay and stops. For buses, our model reduces travel time by 5.70% and 16.73% compared with BUSBAND and MP-BUSBAND. For private vehicles, reductions are 16.73% and 14.64%.

Figure 9.
Average travel time under the three models.
In summary, the multi-path signal coordination control model proposed in this article, which takes into account both public transportation and private vehicles, has certain mixed traffic flow service capabilities. From the operational status of public transportation vehicles, it can adapt to scenarios with multiple bus routes, and the optimization results of the proposed model are superior to those of the BUSBAND and MP-BUSBAND; From the perspective of the operational status of private vehicles, the optimization results of the proposed model show significant improvement.
4.4. Sensitivity Analysis
This section investigates the impact of model parameters—namely, the minimum bandwidth for private vehicles and the bandwidth weighting coefficients and —on system performance. Specifically, denotes the lower bound of the green bandwidth for private vehicles; bandwidths below this threshold are regarded as invalid and the corresponding constraints are relaxed. The coefficients and represent the relative weights of passenger vehicle and transit vehicle green bandwidths in the objective function, respectively. In the simulation, the average occupancy is set to 2 passengers per passenger vehicle and 20 passengers per bus, and person-based delay and stop frequency are calculated to evaluate the overall traffic efficiency under different parameter settings.
4.4.1. Analysis of Minimum Bandwidth
The minimum bandwidth is set to 0, 2, 4, 6, 8, 10, 12, 14, and 16 s, while the weighting coefficients and are fixed at 0.3 and 0.7. As shown in Figure 10, exerts a significant influence on model performance. With increasing , the average vehicle delay and stop frequency first decrease and then increase, achieving the best performance at s, which indicates the most effective signal coordination. When s, an excessively high threshold restricts the feasible solution space, excluding some effective green waves and thereby reducing system performance. In practice, the choice of should account for both the number of coordinated routes and the signal cycle length: with more routes or shorter cycles, a smaller is preferable to balance green-band validity and coordination flexibility.
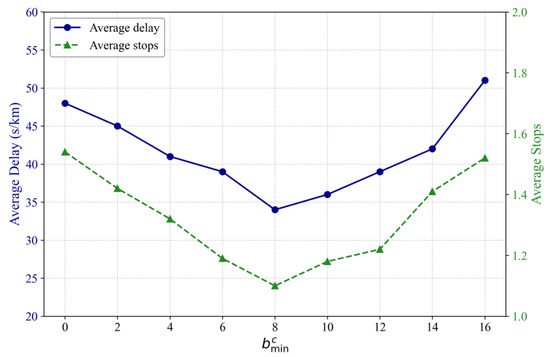
Figure 10.
Model performance with different bandwidth limitations.
4.4.2. Analysis of Bandwidth Weight Coefficient
The combinations of the green wave weight coefficients and are set to (0, 1), (0.1, 0.9), (0.2, 0.8), (0.3, 0.7), (0.4, 0.6), (0.5, 0.5), (0.6, 0.4), (0.7, 0.3), (0.8, 0.2), (0.9, 0.1), and (1, 0). The sum of and is set to 1. These correspond to the optimization weights assigned to private vehicles and buses, respectively, with the minimum bandwidth fixed at 8 s. As shown in Figure 11, the system performance exhibits a pronounced U-shaped trend with respect to the weight configuration. When and , both the average delay and the average number of stops reach their minimum values, at 34 s/km and 1.10 stops, respectively. This indicates that the weighting scheme achieves the best multi-objective coordination, balancing bus priority with overall traffic efficiency. As the configuration deviates from this point, system performance gradually deteriorates. In particular, when , excessive emphasis on private vehicle green bandwidth undermines bus coordination, thereby increasing overall delay. In this case, the average delay rises to a maximum of 54 s/km (), with the number of stops increasing to 1.51. These results indicate that the weight configuration should be adapted to the traffic composition. In transit-dominated corridors, assigning a larger improves overall system performance, whereas in networks primarily served by passenger vehicles, moderately increasing enhances traffic efficiency.
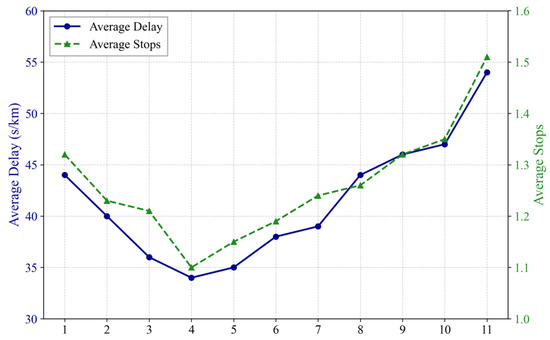
Figure 11.
Model performance with different bandwidth weight coefficients.
5. Conclusions
This paper presents a BMILP framework that jointly optimizes progression bandwidths for transit and private vehicles, accounting for turning flows and dwell times. Numerical examples and simulation experiments demonstrate that (i) co-optimizing phase order and offsets enlarges feasible coordination; (ii) multipath progression with minimum effective bandwidths avoids ineffective allocations; and (iii) compared with BUSBAND and MP-BUSBAND, the proposed approach reduces bus delay and travel time while significantly improving private vehicle efficiency.
The current model is mainly designed for undersaturated conditions. In oversaturated traffic, cumulative queues may weaken the effectiveness of planned green bandwidth, suggesting that future research should extend the model to such scenarios. To improve robustness, factors such as uncertain bus dwell times can be incorporated. With the development of connected vehicle technologies, integrating multimodal green bandwidth optimization with speed guidance offers a promising direction for further enhancing urban traffic efficiency. In addition, future work will also explore the integration of heterogeneous data sources (e.g., probe vehicles, smart card data, and mobile phone data [37]) to enhance the observability of mobility patterns and further strengthen the applicability of the proposed model.
Author Contributions
Conceptualization, Q.C., C.W. and S.W.; Methodology, Q.C., C.W., S.W. and W.C.; Software, Q.C., S.W. and W.C.; Validation, Q.C. and C.W.; Formal analysis, Q.C., C.W., H.L. and W.C.; Investigation, Q.C., C.W., S.W. and H.L.; Resources, Q.C., C.W., and S.W.; Data curation, Q.C., W.C. and C.W.; Writing — original draft, Q.C., C.W., S.W., H.L. and W.C.; Writing—review & editing, Q.C., C.W. and H.L.; Visualization, Q.C., C.W. and W.C.; Supervision, S.W.; Project administration, Q.C. and S.W.; Funding acquisition, Q.C. and S.W. All authors have read and agreed to the published version of the manuscript.
Funding
This research was supported by the National Natural Science Foundation of China (NO. 52202399, 52402401 and 52372314), China Postdoctoral Science Foundation (grant no. 2024M750440), Jiangsu Funding Program for Excellent Postdoctoral Talent (grant no. 2024ZB073).
Data Availability Statement
Data are contained within the article.
Conflicts of Interest
Author Weihan Chen is employed by Huawei Technologies Co., Ltd. The remaining authors declare that the research was conducted in the absence of any commercial or financial relationships that could be construed as a potential conflict of interest.
Abbreviations
The following abbreviations are used in this manuscript:
| TSP | Passive transit signal priority |
| BMILP | Binary Mixed-integer Linear Program |
| OD | Origin-Destination |
Appendix A. Full Formulation
This appendix provides the full constraint set referenced in Section 2, grouped as follows. (S1)–(S4): Private vehicle constraints (Equations (A1)–(A9)); (T1)–(T5): Transit constraints (Equations (A10)–(A21)); Phase sequence (Equations (A22)–(A27)); Objective expansion (Equation (A28)). The complete notation table appears as Table A1.
Table A1.
Constraints Table.
Table A1.
Constraints Table.
| Constraint Formulation | ID |
|---|---|
| Social-vehicle constraints | |
| (A1) | |
| (A2) | |
| (A3) | |
| (A4) | |
| (A5) | |
| (A6) | |
| (A7) | |
| (A8) | |
| (A9) | |
| (A10) | |
| (A11) | |
| Transit constraints | |
| (A12) | |
| (A13) | |
| (A14) | |
| (A15) | |
| (A16) | |
| (A17) | |
| (A18) | |
| (A19) | |
| (A20) | |
| (A21) | |
| (A22) | |
| (A23) | |
| (A24) | |
| (A25) | |
| (A26) | |
| (A27) | |
| (A28) | |
| (A29) | |
| (A30) | |
| (A31) | |
| (A32) | |
| (A33) | |
| (A34) | |
| (A35) | |
| (A36) | |
| Phase sequence constraints | |
| (A37) | |
| (A38) | |
| (A39) | |
| (A40) | |
| (A41) | |
| (A42) | |
| Objective expansion | |
| (A43) | |
References
- Kriswardhana, W.; Esztergár-Kiss, D. A systematic literature review of Mobility as a Service: Examining the socio-technical factors in MaaS adoption and bundling packages. Travel Behav. Soc. 2023, 31, 232–243. [Google Scholar] [CrossRef]
- Meloni, I.; Musolino, G.; Piras, F.; Rindone, C.; Russo, F.; Sottile, E.; Vitetta, A. Mobility as a Service: Insights from pilot studies across different Italian settings. Transp. Eng. 2024, 18, 100294. [Google Scholar] [CrossRef]
- Zhong, C.; Wu, P.; Zhang, Q.; Ma, Z. Online prediction of network-level public transport demand based on principle component analysis. Commun. Transp. Res. 2023, 3, 100093. [Google Scholar] [CrossRef]
- Chmiel, B.; Pawlowska, B.; Szmelter-Jarosz, A. Mobility-as-a-Service as a Catalyst for Urban Transport Integration in Conditions of Uncertainty. Energies 2023, 16, 1828. [Google Scholar] [CrossRef]
- Chen, P.; Xu, J.; Mei, Y.; Wei, L. Network-wide critical routes identification and coordinated control based on Automatic Vehicle Identification data. Transp. Res. Part C Emerg. Technol. 2025, 172, 105019. [Google Scholar] [CrossRef]
- Wei, L.; Ampountolas, K.; Hirrle, A.; Wang, M. Hierarchical Predictive Control of Network Traffic Signals Using Link Transmission Model With Queue Dynamics. IEEE Trans. Intell. Transp. Syst. 2025, 1–14. [Google Scholar] [CrossRef]
- Wei, L.; Chen, P.; Mei, Y.; Sun, J.; Wang, Y. A hierarchical control framework for alleviating network traffic bottleneck congestion using vehicle trajectory data. J. Intell. Transp. Syst. 2024, 28, 988–1010. [Google Scholar] [CrossRef]
- Xu, L.; Jin, S.; Li, B.; Wu, J. Traffic signal coordination control for arterials with dedicated CAV lanes. J. Intell. Connect. Veh. 2022, 5, 72–87. [Google Scholar] [CrossRef]
- Lin, W.; Hu, X.; Wang, J. Multi-level objective control of AVs at a saturated signalized intersection with multi-agent deep reinforcement learning approach. J. Intell. Connect. Veh. 2023, 6, 250–263. [Google Scholar] [CrossRef]
- Lin, Y.; Yang, X.; Zou, N.; Franz, M. Transit Signal Priority Control at Signalized Intersections: A Comprehensive Review. Transp. Lett. 2015, 7, 168–180. [Google Scholar] [CrossRef]
- Li, M.; Yin, Y.; Zhang, W.B.; Zhou, K.; Nakamura, H. Modeling and Implementation of Adaptive Transit Signal Priority on Actuated Control Systems. Comput.-Aided Civ. Infrastruct. Eng. 2011, 26, 270–284. [Google Scholar] [CrossRef]
- Lin, Y.; Yang, X.; Chang, G.L.; Zou, N. Transit Priority Strategies for Multiple Routes under Headway-Based Operations. Transp. Res. Rec. 2013, 2366, 34–43. [Google Scholar] [CrossRef]
- Li, J.; Yu, C.; Shen, Z.; Su, Z.; Ma, W. A Survey on Urban Traffic Control under Mixed Traffic Environment with Connected Automated Vehicles. Transp. Res. Part C Emerg. Technol. 2023, 154, 104258. [Google Scholar] [CrossRef]
- Robertson, D.I. TRANSYT: A Traffic Network Study Tool; Road Research Laboratory: Crowthorne, UK, 1969. [Google Scholar]
- Wallace, C.E.; Courage, K.G.; Reaves, D.P.; Schoene, G.W.; Euler, G.W. TRANSYT-7F User’s Manual; University of Florida: Gainesville, FL, USA, 1984. [Google Scholar]
- Little, J.D.; Kelson, M.D.; Gartner, N.H. MAXBAND: A Versatile Program for Setting Signals on Arteries and Triangular Networks. Transp. Res. Rec. J. Transp. Res. Board 1981, 795, 40–46. [Google Scholar]
- Gartner, N.H.; Assman, S.F.; Lasaga, F.; Hou, D.L. A Multi-Band Approach to Arterial Traffic Signal Optimization. Transp. Res. Part B Methodol. 1991, 25, 55–74. [Google Scholar] [CrossRef]
- Kim, H.; Cheng, Y.; Chang, G.L. Variable Signal Progression Bands for Transit Vehicles Under Dwell Time Uncertainty and Traffic Queues. IEEE Trans. Intell. Transp. Syst. 2019, 20, 109–122. [Google Scholar] [CrossRef]
- Jing, B.; Lin, Y.; Shou, Y.; Lu, K.; Xu, J. Pband: A General Signal Progression Model with Phase Optimization along Urban Arterial. IEEE Trans. Intell. Transp. Syst. 2022, 23, 344–354. [Google Scholar] [CrossRef]
- Ye, B.L.; Wu, W.; Mao, W. A Two-Way Arterial Signal Coordination Method With Queueing Process Considered. IEEE Trans. Intell. Transp. Syst. 2015, 16, 3440–3452. [Google Scholar] [CrossRef]
- Florek, K. Arterial Traffic Signal Coordination for General and Public Transport Vehicles Using Dedicated Lanes. J. Transp. Eng. Part A Syst. 2020, 146, 04020051. [Google Scholar] [CrossRef]
- Jeong, Y.; Kim, Y. Tram Passive Signal Priority Strategy Based on the MAXBAND Model. KSCE J. Civ. Eng. 2014, 18, 1518–1527. [Google Scholar] [CrossRef]
- Chen, W.; Zhang, Z.; Cao, Q.; Wu, C.; Cui, T.; Chen, Y.; Ren, G. A Partition-Enabled Multi-Path Signal Optimization under Arterial Progression for Transit Priority. Transp. Res. Rec. 2024, 2678, 908–922. [Google Scholar] [CrossRef]
- Ma, W.; Bai, Y. Serve Sequence Optimization Approach for Multiple Bus Priority Requests Based on Decision Tree. In Proceedings of the Plan, Build, and Manage Transportation Infrastructure in China, Shanghai, China, 21–22 May 2007; pp. 605–615. [Google Scholar]
- Mirchandani, P.; Knyazyan, A.; Head, L.; Wu, W. An Approach Towards the Integration of Bus Priority, Traffic Adaptive Signal Control, and Bus Information/Scheduling Systems. In Computer-Aided Scheduling of Public Transport; Springer: Berlin/Heidelberg, Germany, 2001; pp. 319–334. [Google Scholar]
- Christofa, E.; Papamichail, I.; Skabardonis, A. Person-Based Traffic Responsive Signal Control Optimization. IEEE Trans. Intell. Transp. Syst. 2013, 14, 1278–1289. [Google Scholar] [CrossRef]
- Hao, R.; Wang, Y.; Wang, Z.; Yang, L.; Sun, T. A Coordinated Adaptive Signal Control Method Based on Queue Evolution and Delay Modeling Approach. Appl. Sci. 2025, 15, 9294. [Google Scholar] [CrossRef]
- Kampitakis, E.; Katzilieris, K.; Vlahogianni, E.I. Reinforcement Learning for Efficient Bus Priority Systems: Balancing Transit Efficiency and Traffic Impact. Data Sci. Transp. 2024, 6, 16. [Google Scholar] [CrossRef]
- Morgan, J.T.; Little, J.D. Synchronizing Traffic Signals for Maximal Bandwidth. Oper. Res. 1964, 12, 896–912. [Google Scholar] [CrossRef]
- Zhang, C.; Xie, Y.; Gartner, N.H.; Stamatiadis, C.; Arsava, T. AM-Band: An Asymmetrical Multi-Band Model for Arterial Traffic Signal Coordination. Transp. Res. Part C Emerg. Technol. 2015, 58, 515–531. [Google Scholar] [CrossRef]
- Xu, L.; Xu, J.; Qu, X.; Jin, S. An Origin-Destination Demands-Based Multipath-Band Approach to Time-Varying Arterial Coordination. IEEE Trans. Intell. Transp. Syst. 2022, 23, 17784–17800. [Google Scholar] [CrossRef]
- Arsava, T.; Xie, Y.; Gartner, N.H. Arterial Progression Optimization Using OD-BAND. Transp. Res. Rec. J. Transp. Res. Board 2016, 2558, 1–10. [Google Scholar] [CrossRef]
- Wu, C.; Ma, Z.; Kim, I. Multi-Agent Reinforcement Learning for Traffic Signal Control: Algorithms and Robustness Analysis. In Proceedings of the 2020 IEEE 23rd International Conference on Intelligent Transportation Systems (ITSC), Rhodes, Greece, 20–23 September 2020; pp. 1–7. [Google Scholar] [CrossRef]
- Li, J.; Peng, L.; Hou, K.; Tian, Y.; Ma, Y.; Xu, S.; Qiu, T.Z. Adaptive signal control and coordination for urban traffic control in a connected vehicle environment: A review. Digit. Transp. Saf. 2023, 2, 89. [Google Scholar] [CrossRef]
- Yang, K.; Menendez, M.; Guler, S.I. Implementing transit signal priority in a connected vehicle environment with and without bus stops. Transp. B Transp. Dyn. 2019, 7, 423–445. [Google Scholar] [CrossRef]
- Zeng, X.; Zhang, Y.; Jiao, J.; Yin, K. Route-Based Transit Signal Priority Using Connected Vehicle Technology to Promote Bus Schedule Adherence. IEEE Trans. Intell. Transp. Syst. 2021, 22, 1174–1184. [Google Scholar] [CrossRef]
- Alonso, B.; Musolino, G.; Rindone, C.; Vitetta, A. Estimation of a Fundamental Diagram with Heterogeneous Data Sources: Experimentation in the City of Santander. ISPRS Int. J. Geo-Inf. 2023, 12, 418. [Google Scholar] [CrossRef]
- Lin, Y.; Yang, X.; Zou, N. Passive transit signal priority for high transit demand: Model formulation and strategy selection. Transp. Lett. 2019, 11, 119–129. [Google Scholar] [CrossRef]
Disclaimer/Publisher’s Note: The statements, opinions and data contained in all publications are solely those of the individual author(s) and contributor(s) and not of MDPI and/or the editor(s). MDPI and/or the editor(s) disclaim responsibility for any injury to people or property resulting from any ideas, methods, instructions or products referred to in the content. |
© 2025 by the authors. Licensee MDPI, Basel, Switzerland. This article is an open access article distributed under the terms and conditions of the Creative Commons Attribution (CC BY) license (https://creativecommons.org/licenses/by/4.0/).