Article

How to Promote Traditional Automobile Companies’ Intelligent-Connected Transformation under the New Dual-Credit Policy? A Tripartite Evolutionary Game Analysis Combined with Funding Time Delay

1
School of Management Science and Engineering, Anhui University of Technology, Ma’anshan 243032, China
2
Key Laboratory of Multidisciplinary Management and Control of Complex Systems of Anhui Higher Education Institutes, Anhui University of Technology, Ma’anshan 243002, China
3
School of Economics and Management, Shenyang-Aerospace University, Shenyang 110136, China
*
Author to whom correspondence should be addressed.
Systems 2024, 12(9), 319; https://doi.org/10.3390/systems12090319
Submission received: 17 July 2024 / Revised: 19 August 2024 / Accepted: 20 August 2024 / Published: 23 August 2024

Abstract

:
Based on the interactive integration between smart cities and intelligent transportation, this paper discusses how traditional automobile companies achieve intelligent-connected transformation and how to promote the development of intelligent connected vehicles. First, we construct a tripartite evolutionary game model of traditional automobile companies, internet companies, and financial institutions under the dual-credit policy. Second, we define an ideal event and analyze the impacts of cost factors, market factors, and policy factors on system evolution. Finally, funding time delay is combined with the evolutionary game analysis. Results indicate that: (1) Compared with traditional automobile companies and internet companies, financial institutions are more sensitive to the profit-sharing coefficient and cost-sharing coefficient; (2) The probability of an ideal event is more sensitive to credit trading price than new energy vehicle (NEV) credit accounting coefficients and the NEV credit ratio requirement; (3) The government should fully consider the linkage between policy factors and market factors, and it is unreasonable for the government to consider the range of any factor alone; (4) Both the financing amount and regulatory cost have specific threshold ranges within which tripartite collaboration can be facilitated.

1. Introduction

The deep integration of the automotive industry and the information technology industry, driven by the development of internet technology and a new generation of scientific and technological revolution, has facilitated the advancement of automotive intelligence and network connectivity [1]. In the face of imperfect intelligent-connected technology, lack of funds, and intelligent software, among other issues, traditional automobile companies urgently need to find a new way to adapt to the new energy intelligent-connected market. Under the background of digital intelligence, automobile production has transformed from “manufacturing” to “intellectual manufacturing”, leading to a new cross-industry, cross-industrial, and cross-field automobile supply chain system. The National Development and Reform Commission issued the “New Energy Automobile Industry Development Plan (2021–2035)” [2] in 2021, highlighting the increasing prominence of artificial intelligence, big data, and the internet. This has led to a shift towards electrification, network connectivity, and intelligence as the prevailing trends in the automotive industry. Consequently, the automotive industry ecosystem is gradually transitioning from a traditional “chain relationship” to a more interconnected “mesh ecology”, which facilitates efficient collaboration among people, vehicles, roads, and the cloud with data as the connecting element.
Intelligent connected vehicle (ICV) is an organic combination of telematics and intelligent vehicles, utilizing modern communication and network technologies and integrating an intelligent cockpit, intelligent driving, and digital gateway [3]. Cross-border collaboration among different types of companies is an inherent requirement to ensure the healthy and coordinated development of the ICVs market. Traditional automobile companies have transitioned from the production of traditional fuel vehicles (TFVs) to the production of new energy vehicles (NEVs), and now they are producing intelligence connected NEVs, which cannot be achieved without collaboration with internet and software chip manufacturers. The SAIC Group collaborated with Ali as early as 2014 to create an internet-based SUV; Huawei embedded its application mall into the next-generation Volvo intelligent in-vehicle interaction system through its first cooperation with Volvo; BAIC Group’s strategic partnership with Horizon resulted in a new model of intelligent driving; and Avita 11-Chana Auto cooperated with Huawei to create an emotionally intelligent energy vehicle. China’s NEVs and ICVs sales have been rising year by year, of which 6.887 million NEVs were sold in 2022 [4], and the penetration rate of L2 level1 ICVs reached 34.5% [5] (MIIT, 2023) (Figure 1).
China formulated the “Measures for Parallel Management of Average Fuel Consumption of Passenger Car Enterprises and New Energy Vehicle Credits” [6] (dual-credit policy) in September 2017. “Dual-credits” refers to Corporate Average Fuel Consumption Credits (CAFC credits) and New Energy Vehicle Credits (NEV credits). When an automobile company produces fuel vehicles that do not meet the average fuel consumption standard, it will generate negative CAFC credits. Negative NEV credits will also be generated if the production of fuel vehicles reaches 30,000 or more. The policy stipulates that only positive NEV credits can be sold. Therefore, the negative CAFC credits can be offset by positive CAFC credits transferred from the company’s previous year’s carry-over or affiliated companies. Additionally, they can be offset by positive NEV credits from the company itself, its affiliated companies, or through the purchase of positive NEV credits generated by other companies. Negative NEV credits can only be offset by positive NEV credits generated by the company, its affiliates, or through the purchase of other companies, all with an offset ratio of 1:1 [7]. Compared to subsidy policies, the implementation of the dual-credit policy not only facilitates the rapid development of NEVs but also ensures fair competition between traditional automobile companies and NEV companies [8]. However, due to the rapid development of the automotive industry, the dual-credit policy prevents it from adapting effectively to market changes and hinders the positive growth of the NEVs industry. Therefore, the new dual-credit policy [9] was released by the MIIT in July 2023. The new dual-credit policy adjusts the standard model credit calculation coefficients and the requirement of the NEV credit ratio, thereby increasing the difficulty of acquiring credits.
Evolutionary game theory (EGT) is derived and developed from the combination of biological and evolutionary, as well as game theory [10,11]. EGT considers the game player to have limited rationality and achieves equilibrium stability through continuous trial and error [12]. Unlike complete rationality, limited rationality prefers collaborative dynamic evolution among game players in order to maximize gains [13]. According to the definition, a game is a process of repeated interaction among players. The success of a game player depends on whether the strategy they adopt can be combined with the strategies adopted by other players. Furthermore, while repeating dynamic games, it continues to learn from previous experiences. This implies that the optimal strategy choice of a game player is also influenced by its previous state. Therefore, the paper introduces the concept of time delay in simulating the evolutionary game model. The time delay refers to the difference in time between executing instructions and obtaining results [14].
The paper uses the new dual-credit policy as its background and explores how to promote the intelligent-connected transformation of traditional automobile companies. It constructs a tripartite evolutionary game model among traditional automobile companies, internet companies, and financial institutions. The aim is to simulate and analyze how cost factors, market factors, and policy factors can ensure the intelligent-connected transformation of traditional automobile companies under funding time delay conditions. Furthermore, it aims to promote collaborative innovation among these three parties. Therefore, this paper focuses on answering the following questions: (1) How does the new dual-credit policy impact the intelligent-connected transformation of traditional automobile companies? How does the interaction between policy factors and market factors promote the intelligent-connected transformation of traditional automobile companies? (2) How can internet companies facilitate traditional automobile companies’ intelligent-connected transformation? (3) How to promote production of NEVs and even high-end ICVs? (4) In the case of the funding time delay, how can financial institutions set the appropriate amount and interest rate to effectively support the transformation of traditional automobile companies?
The rest of the paper is organized as follows: Section 2 reviews the relevant literature. Section 3 describes the problem and makes corresponding assumptions. Section 4 constructs a tripartite game model for cross-border collaborative innovation and analyzes the system’s evolutionary stability strategies. Section 5 performs sensitivity simulation analysis of relevant parameters with funding time delay. Section 6 provides conclusions, policy recommendations, and limitations.

2. Literature Review

The research work currently encompasses three aspects: firstly, the policy factors of the automobile industry; secondly, research on the development of related internet technologies; and thirdly, evolutionary game theory.

2.1. Policy Factors

The dual-credit policy serves as a sustainable development policy aimed at reducing companies’ average fuel consumption and promoting NEVs [15]. Despite its shortcomings, the dual-credit policy, which replaces subsidy policies, still promotes the expansion of the NEV market to a greater extent and impacts the fuel vehicle market [16]. Liu et al. [17] demonstrated that the dual-credit policy can alleviate the sales headwinds due to subsidy policy phase-outs. Some scholars have already analyzed the impact of the dual-credit policy on the automotive market. Li et al. believed that the dual-credit policy can expand the NEV market size [18]. Meanwhile, stable credit trading can ensure the maximization of profits for traditional automobile companies [19,20,21,22]. Ma et al. [23] studied the optimal choice of technological innovation in NEV production systems under the dual-credit policy, and the results showed that higher credit prices motivate automobile companies to innovate further. Li et al. [24] used the difference-in-difference model to examine the impact of the dual-credit policy on both the quantity and quality of green innovation in automobile companies and indicated that this policy has improved these companies’ innovation performance. However, there are systematic loopholes in the implementation of the dual-credit policy, resulting in an oversupply of credits. The original intention of the dual-credit policy is to reduce fuel consumption, but due to the support from NEVs, TFV companies have been lax in researching and developing energy-saving technology [25,26]. Therefore, the dual-credit policy needs to be adjusted gradually in line with the policy background and market development. The new dual-credit policy was released in July 2023 and implemented in August 2023. So far, there is no relevant theoretical research to provide an answer regarding the effect of the new dual-credit policy on promoting transformation in traditional automobile companies.

2.2. Internet Technology

Against the backdrop of intelligence and digitalization, big data, cloud computing, and other internet thinking have provided new ideas for the transformation of traditional automobile companies. Plantec et al. [27] studied the impact of big data and AI on the automobile industry and revealed that these technologies have been integrated into the industrialization phase of new vehicle development. Carlos et al. [28] explored the impact of digital technology on the automobile industry from various behavioral perspectives and demonstrated that necessary investment in digital technology can better promote profits, productivity, and competitiveness of automobile companies. The transformation of traditional automobile companies into new energy is ultimately progressing from electrification to intelligence and network connectivity. While some scholars have already studied the electrification transformation of traditional automobile companies [29,30,31], there are fewer studies in the field of intelligent and network connectivity. Tang et al. [32] investigated the innovation efficiency of cross-border collaboration in ICVs based on single-vehicle intelligence and vehicle-road collaboration. The results showed that cross-border collaboration is an inevitable stage for ICVs, and vehicle-road collaboration can accelerate cross-border integration. Huang et al. [33] discussed the three stages of automation, informatization, and intelligence in the transformation and upgrading of China’s automobile manufacturing industry. However, traditional automobile companies have advantages in vehicle manufacturing but lack core software technology. Internet companies enable traditional automobile companies to smoothly transform. Yu and Chen [34] examined the impact of industrial internet platforms on companies based on the theory of internet empowerment, and the results showed that internet platforms can significantly enhance companies’ innovation performance.

2.3. Evolutionary Game Theory

EGT has been applied in various fields and involves two aspects related to the traditional automobile industry. The first is energy technology. Evolutionary game models are built to analyze the development of green transformation in terms of energy structure transformation [35], low-carbon technology transformation [36,37], green technology innovation [38], hydrogen fuel cells [39,40], and so on. Zhao et al. [41] constructed a three-stage evolutionary game model of government, NEV companies, and traditional fuel vehicle companies and found that only high enough subsidies can promote the NEV diffusion within the threshold range. The second is the internet. Zhou et al. [42] constructed a tripartite evolutionary game model of industrial internet platforms, developers, and companies from the perspectives of income distribution and government subsidies and studied how to empower the transformation of the manufacturing industry. However, the innovative development of big data and internet thinking has made simple NEVs unable to meet the market demand for competition, making intelligent-connected NEVs the mainstream trend. At present, the research on ICVs primarily focuses on technical aspects such as computer program development, software manufacturing, and external information perception [43,44,45]. There is still limited research on the evolutionary mechanism of cross-border collaboration in the ICVs market.
Most scholars have constructed evolutionary game models that consider government, new energy automobile companies, fuel automobile companies, or consumers. Wang et al. [46] integrated the consumer utility function to construct an evolutionary game model between the government and automobile manufacturers. The study found that a higher credit trading price can stimulate the short-term growth of the NEV market. Liao and Tan [47] described consumer utility based on the hoteling model, constructed an evolutionary game model between local governments and automobile manufacturers, and analyzed the impact of government policies on the diffusion of NEVs. However, few scholars have studied the interaction behavior among automotive companies, internet companies, and financial institutions, and research considering the time delay in games has not yet been seen. Hu and Qiu [48] developed the Hopf difference theory to analyze the impact of bifurcation on equilibrium points. The research revealed that a time delay beyond a certain range would impact the equilibrium point. Cheng and Meng [49] analyzed the environmental feedback caused by time delay and found that when the time delay is large sufficiently, the environmental state will fluctuate. Krawiec and Szydłowski [50] found that in an economic model, the larger the time delay parameter, the longer the duration of the economic growth cycle, and the greater the amplitude of income and capital.
Therefore, unlike existing researches, this paper has the following innovations: (1) consider and analyze how the new dual-credit policy can promote traditional automobile companies to produce NEVs and even high-end ICVs; (2) in the cross-border collaborative innovation between traditional automobile companies and internet companies, the influence of funding time delay on system evolution is studied; (3) construct a tripartite evolutionary game model among traditional automobile companies, internet companies, and financial institutions, define an ideal event, and analyze the impacts of cost factors, market factors and policy factors on the players’ behaviors and the probability of the ideal event.

3. Questions and Assumptions

3.1. Problem Description

The dual-credit policy aims to promote the coordinated development of the NEV industry by establishing a credit trading mechanism, thereby forming a market-based mechanism. The paper explores the collaborative innovation between traditional automobile companies and internet companies across borders. When both sides engage in collaborative innovation, traditional automobile companies can produce high-end ICVs such as the Polar Fox Alpha S Hi Edition, AITO Ask M7, and Ji-du ROBO-01 Limited Edition. When traditional automobile companies choose collaborative innovation strategy and internet companies choose non-collaborative innovation strategy, traditional automobile companies will produce mid-end ICVs such as the Ford Focus, Model 3, and Audi A6L. High-end ICVs outperform mid-end ICVs in terms of both single-vehicle intelligence and vehicle-road coordination. Traditional automobile companies will produce traditional fuel vehicles unless they do not engage in collaborative innovation. The collaborative innovation between both parties will incur high costs simultaneously. To address the issue of funding, this paper explores the involvement of financial institutions in collaborative innovation and the infusion of funds to ensure the intelligent-connected transformation of traditional automobile companies.
This paper constructs a tripartite evolutionary game model involving traditional automobile companies, internet companies, and financial institutions. In this model, all three players are finite rational agents. The strategy spaces of traditional automobile companies and internet companies consist of {collaborative innovation and non-collaborative innovation}. Collaborative innovation and non-collaborative innovation refer to whether there is cross-border collaboration between traditional automobile companies and Internet companies. The strategy space of financial institutions is {financing, non-financing}. Financing and non-financing refer to whether financial institutions are involved in the innovation process between traditional automobile companies and internet companies. The relationship between game players is depicted in Figure 2.

3.2. Assumptions

Assumption 1.
We assume that all three players in the game are bounded rational individuals. This paper examines three game players: traditional automobile companies, internet companies, and financial institutions. The probability of traditional automobile companies choosing “collaborative innovation” strategy is x ( 0 x 1 ) , and the probability of choosing “non-collaborative innovation” strategy is 1 x ; the probability of internet companies choosing “collaborative innovation” strategy is y ( 0 y 1 ) , and the probability of choosing “non-collaborative innovation” strategy is 1 y ; the probability of financial institutions choosing “financing” strategy is z ( 0 z 1 ) , and the probability of choosing “non-financing” strategy is 1 z .
Assumption 2.
Assuming that traditional automobile companies produce three types of vehicles: high-end ICVs, mid-end ICVs, and TFVs. The production of high-end ICVs is Q 1 ; the production of mid-end ICVs is Q 2 ; the production of TFVs is Q 3 .
Assumption 3.
The new dual-credit policy changes the credit calculation method of the standard model for new energy passenger vehicles from the original 0.0056 R + 0.4 (maximum credits per vehicle is 5) [51] to 0.0034 R + 0.2 (maximum credits per vehicle is 3.4) [9], and R is the driving range (CLTC). For the convenience of research, it is assumed that the credit calculation formula of NEVs is a R + b , and both a and b are the NEV credit accounting coefficients set in the policy.
Assumption 4.
Assuming that the fuel vehicles produced by traditional automobile companies do not meet the average fuel consumption standards. The CAFC credits are negative as λ G Q 3 , and λ G ( λ G > 0 ) is the CAFC credit coefficient of the unit NEV. The new dual-credit policy includes the annual mandatory requirements on NEV credits for each TFV manufacturer. Let β ( β > 0 ) denote the NEV credit ratio requirement for the TFV manufacturer, so the negative NEV credits are β Q 3 .
Assumption 5.
The initial profit obtained by traditional automobile companies, internet companies, and financial institutions is π i ( i = 1 ,   2 ,   3 ) . The collaboration between traditional automobile companies and internet companies leads to innovative profits k . At the same time, when financial institutions choose the financing strategy, the value-added profit brought to both traditional automobile companies and internet companies is Δ k 1 . The profit-sharing coefficient for collaborative innovation between traditional automobile companies and internet companies is α and 1 α . To encourage traditional automobile companies and internet companies to collaborate in the production of high-end ICVs, a credit reward coefficient h ( h > 1 ) is set for high-end ICVs. The credit reward for ICVs is a government incentive designed to encourage car companies to produce high-end ICVs. For instance, in cities such as Shenzhen, Chengdu, Jinan, etc., local governments offer subsidies based on the total project investment if enterprises innovate key technologies and conduct R&D on components related to ICVs.
Assumption 6.
The collaboration process between traditional automobile companies and internet companies carries the risk of technology spillover for both sides. Assuming the success probability of collaborative innovation between traditional automobile companies and internet companies is P . When financial institutions choose the financing strategy, the innovation cost is c 1 if both traditional automobile companies and internet companies choose collaborative innovation strategy, c e 1 if only traditional automobile companies choose collaborative innovation strategy, and c i 1 if only internet companies choose collaborative innovation strategy. In order to prevent risks, financial institutions will bear the regulatory cost c b . When financial institutions choose the non-financing strategy, the innovation cost is c 2 if both traditional automobile companies and internet companies choose collaborative innovation strategy, c e 2 if only traditional automobile companies choose collaborative innovation strategy, and c i 2 if only internet companies choose collaborative innovation strategy. The cost-sharing coefficients of collaborative innovation between traditional automobile companies and internet companies are θ and 1 θ .
Assumption 7.
The financing amount of the financial institutions is B , and the financing rate is r . When financial institutions choose the financing strategy, collaboration and innovation between the automobile companies and the internet companies will bring the value-added profit Δ k 2 to the financial institutions.
Assumption 8.
If any party, whether it be a traditional automobile company or an internet company, breaches the contract, they will receive the same penalty L , which will be obtained by the other party in the game.
The model symbols and definitions are shown in Table 1.

4. Models and Methods

Evolutionary game theory is a dynamic equilibrium theory and the equilibrium point that the system will reach after a given game strategy and payment matrix. The payoff matrix is shown in Table 2.

4.1. Stability Analysis of Unilateral Game Players

4.1.1. Traditional Automobile Companies

The expected payoff for traditional automobile companies that choose collaborative innovation is as follows:
U e = y z π 1 + h P N E V Q 1 a R + b + α P k + Δ k   1 θ c 1 + 1 + r   B + y 1 z π 1 + h P   N E V Q 1 a R + b + α P k θ c 2 + 1 y z π 1 + P N E V Q 2 a R + b c e 1 1 + r B + L + 1 y 1 z π 1 + P N E V Q 2 a R + b c e 2 + L
The expected payoff for traditional automobile companies that choose non-collaborative innovation is as follows:
U n e = y z π 1 P N E V λ G + β Q 3 L + y 1 z π 1 P N E V λ G + β Q 3 L + 1 y z π 1 P N E V λ G + β Q 3 + 1 y 1 z π 1 P N E V λ G + β Q 3
The average payoff for traditional automobile companies is as follows:
U ¯ e = x U e + ( 1 x ) U n e
Therefore, the replication dynamics equation of traditional automobile companies that choose collaborative innovation is as follows:
F x = d x d t = x ( U e U ¯ e ) = x 1 x L ( 1 + r ) B z + ( 1 θ ) ( 1 + r ) B y z + k P y α + θ ( c 2 c 1 ) y z y θ c 2 + y z ( c e 1 c e 2 ) ( 1 y ) c e 2 + z ( c e 2 c e 1 ) + P y z α Δ k 1 + P N E V ( y h ( a R + b ) Q 1 + ( 1 y ) ( a R + b ) Q 2 + ( λ G + β ) Q 3 )
According to the theorem of the replication dynamic equation, in order to achieve the optimal state of dynamic equilibrium for game players, the stable point of the replication dynamic equation should satisfy two conditions: it equals zero and its first derivative is less than zero. The unilateral strategic stability analysis of traditional automobile companies is as follows:
The first-order partial derivation of F ( x ) is obtained:
d F x / d x = 1 2 x L ( 1 + r ) B z + ( 1 θ ) ( 1 + r ) B y z + k P y α + θ ( c 2 c 1 ) y z y θ c 2 + y z ( c e 1 c e 2 ) ( 1 y ) c e 2 + z ( c e 2 c e 1 ) + P y z α Δ k 1 + P N E V ( y h ( a R + b ) Q 1 + ( 1 y ) ( a R + b ) Q 2 + ( λ G + β )   Q 3 )
According to the stability theorem of differential equations, in order to make the collaborative innovation strategy of traditional automobile companies optimal, it is necessary to satisfy F ( x ) = 0 , d F x / d x < 0 . Let F ( x ) = 0 , solved x * = 0 , x * = 1 , z = [ P N E V Q 3 ( λ G + β ) + ( 1 y ) P N E V Q 2 ( a R + b ) + y k P α θ c 2 + c e 2 + h P N E V Q 1 ( a R + b ) + L c e 2 ] / [ ( 1 + r ) B + c e 1 c e 2 + y ( 1 θ ) ( 1 + r ) B + θ ( c 1 c 2 ) c e 1 + c e 2 P α Δ k 1 ] .
If z = z * , whatever the current state is stable, the probability of traditional automobile companies choosing any strategy will not change with time.
If z z * , then analyze the different cases of ( 1 + r ) B + c e 1 c e 2 + y ( 1 θ ) ( 1 + r ) B + θ ( c 1 c 2 ) c e 1 + c e 2 P α Δ k 1 as follows:
(1) Case 1: if ( 1 + r ) B c e 2 + y ( 1 θ ) ( 1 r ) B + θ ( c 1 c 2 ) c e 1 + c e 2 P α Δ k 1 + c e 1 < 0 , we analyze the following two scenarios.
When z < z * , d F x / d x | x = 0 > 0 , d F x / d x | x = 1 < 0 , x = 1 is the only ESS; and when z > z * , d F x / d x | x = 0 < 0 , d F x / d x | x = 1 > 0 , x = 0 is the only ESS.
(2) Case 2: if ( 1 + r ) B c e 2 + y ( 1 θ ) ( 1 r ) B + θ ( c 1 c 2 ) c e 1 + c e 2 P α Δ k 1 + c e 1 > 0 , we analyze the following two scenarios.
When z < z * , d F x / d x | x = 0 < 0 , d F x / d x | x = 1 > 0 , x = 0 is the only ESS; and when z > z * , d F x / d x | x = 0 > 0 , d F x / d x | x = 1 < 0 , x = 1 is the only ESS.
Proposition 1.
The z * plane has a monotonic relationship with NEV credit ratio requirement β , credit trading price P N E V and NEV credit accounting coefficients a and b are monotonic relations. As β , P N E V , a and b increase, the probability of non-collaborative innovation strategies adopted by traditional automobile companies increases. The probability of traditional automobile companies choosing a non-collaborative innovation strategy to produce ICVs is proportional to policy parameters and market parameters, indicating that it is not advisable for the government to simply tighten market parameters or policy parameters.
Proof 1.
z * β > 0 ,   z * P N E V > 0 ,   z * a > 0 ,   z * b > 0 , when β ,   P N E V ,   a , and b increase, z * gradually increases, the probability of collaborative innovation strategies adopted by traditional automobile companies decreases. □
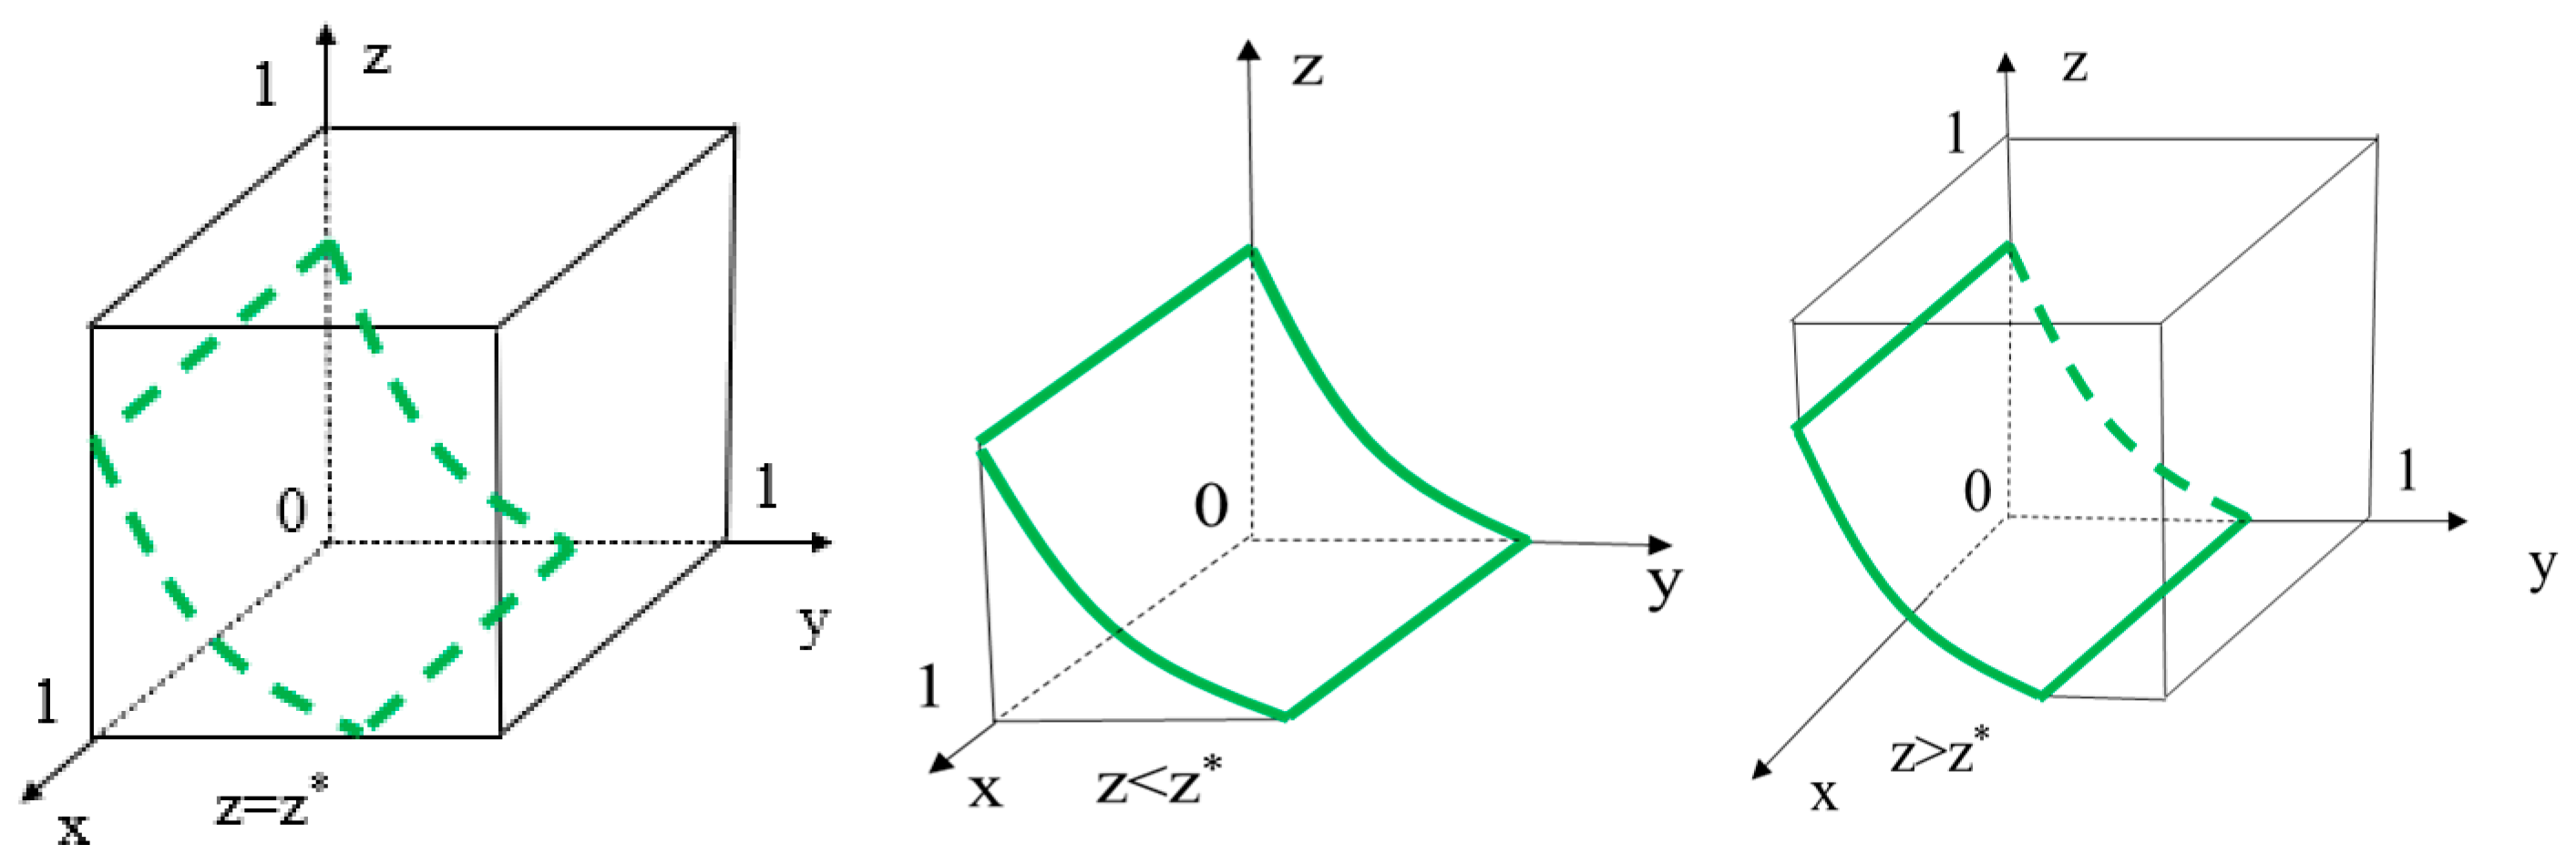
Figure 3 illustrates the stabilization strategy choices and evolutionary trends of traditional automobile companies.

4.1.2. Internet Companies

The expected payoff for internet companies that choose collaborative innovation is as follows:
U i = x z π 2 + 1 α P k + Δ k 1 1 θ c 1 + 1 + r B + 1 x 1 z ( π 2 c i 2 + L ) + 1 x z π 2 c i 1 1 + r B + L + x 1 z π 2 + 1 α P k 1 θ c 2
The expected payoff for internet companies that choose non-collaborative innovation is as follows:
U n i = x z π 2 L + x 1 z π 2 L + 1 x z π 2 + 1 x 1 z π 2
The average payoff of internet companies is as follows:
U ¯ i = y U i + 1 y U ni
Therefore, the replication dynamics equation of internet companies that choose collaborative innovation is as follows:
F y = d y d t = y ( U i U ¯ i ) = y 1 y L z ( 1 + r ) B + x z θ ( 1 + r ) B x z 1 θ c 1 x 1 z ) ( 1 θ c 2 ( 1 x ) c i 2 + ( 1 x ) z ( c i 2 c i 1 ) + x z P ( 1 α ) Δ k 1 + x P ( 1 α ) k
The first-order partial derivation of F ( y ) is obtained:
d F y / d y = 1 2 y L z ( 1 + r ) B + x z θ ( 1 + r ) B x z 1 θ c 1 x 1 z ) ( 1 θ c 2 ( 1 x ) c i 2 + ( 1 x ) z ( c i 2 c i 1 ) + x z P ( 1 α ) Δ k 1 + x P ( 1 α ) k
According to the stability theorem of differential equations, in order to make the collaborative innovation strategy of internet companies optimal, it is necessary to satisfy F ( y ) = 0 , d F y / d y < 0 . Let F ( y ) = 0 , solved y * = 0 , y * = 1 , x * = [ c i 2 L + z ( 1 + r ) B + c i 1 c i 2 ] / [ θ ( 1 + r ) B + ( 1 θ ) ( c 2 c 1 ) + c i 1 c i 2 + P ( 1 α ) Δ k 1 z + P ( 1 α ) k ( 1 θ ) c 2 + c i 2 ] .
If x = x * , whatever the current state is stable, and the probability of internet companies choosing any strategy will not change with time;
If x x * , then analyze the different cases of θ ( 1 + r ) B + ( 1 θ ) ( c 2 c 1 ) + c i 1 c i 2 + P ( 1 α ) Δ k 1 z + P ( 1 α ) k ( 1 θ ) c 2 + c i 2 as follows:
(1) Case 1: if ( θ ( 1 + r ) B + ( 1 θ ) ( c 2 c 1 ) + c i 1 c i 2 + P ( 1 α ) Δ k 1 ) z + P ( 1 α ) k ( 1 θ ) c 2 + c i 2 < 0 , we analyze the following two scenarios.
When x < x * , d F y / d y | y = 0 > 0 , d F y / d y | y = 1 < 0 , y = 1 is the only ESS; and when x > x * , d F y / d y | y = 0 < 0 , d F y / d y | y = 1 > 0 , y = 0 is the only ESS.
(2) Case 2: if ( θ ( 1 + r ) B + ( 1 θ ) ( c 2 c 1 ) + c i 1 c i 2 + P ( 1 α ) Δ k 1 ) z + P ( 1 α ) k ( 1 θ ) c 2 + c i 2 > 0 , we analyze the following two scenarios.
When x < x * , d F y / d y | y = 0 < 0 , d F y / d y | y = 1 > 0 , y = 0 is the only ESS; and when x > x * , d F y / d y | y = 0 > 0 , d F y / d y | y = 1 < 0 , y = 1 is the only ESS.
Proposition 2.
The x * plane has a monotonic relationship with penalty L . As L increases, the probability of internet companies choosing a collaborative innovation strategy increase. The increase in penalty has reinforced the determination of internet companies to engage in collaborative innovation, ensuring their commitment to continue investing in R&D of ICVs.
Proof 2.
x * L < 0 , when L increases, x * gradually decreases, and the probability of internet companies choosing collaborative innovation strategy increases. □
Figure 4 illustrates the stabilization strategy choices and evolutionary trends of internet companies.

4.1.3. Financial Institutions

The expected payoff for financial institutions that choose to finance is as follows:
U b = x y π 3 + Δ k 2 + P 1 + r B c b + x 1 y π 3 + P 1 + r B c b + 1 x y π 3 + P 1 + r B c b + 1 x 1 y π 3 c b
The expected payoff for financial institutions that choose to non-financing is as follows:
U n b = x y π 3 + x 1 y π 3 + 1 x y π 3 + 1 x 1 y π 3
The average payoff of financial institutions is as follows:
U ¯ b = z U b + 1 z U nb
Therefore, the replication dynamics equation of financial institutions choosing financing is as follows:
F z = d z d t = z ( U b U ¯ b ) = z 1 z B P 1 + r x 1 + y y c b + x y Δ k 2
The first-order partial derivation of F ( z ) is obtained:
d F z / d z = 1 2 z B P 1 + r x 1 + y y c b + x y Δ k 2
According to the stability theorem of differential equations, in order to make the collaborative innovation strategy of financial institutions optimal, it is necessary to satisfy F ( z ) = 0 , d F z / d z < 0 . Let F ( z ) = 0 , solved z * = 0 , z * = 1 , y * = [ B P + B P r x c b ] / [ B P B P r + x B P + B P r Δ k 2 ] .
If y = y * , whatever the current state is stable, and the probability of financial institutions choosing any strategy will not change with time;
If y y * , because B P B P r + x B P + B P r Δ k 2 < 0 , then analyze the cases of as follows:
When y < y * , d F z / d z | z = 0 < 0 , d F z / d z | z = 1 > 0 , z = 0 is the only ESS; and when y > y * , d F z / d z | z = 0 > 0 , d F z / d z | z = 1 < 0 , z = 1 is the only ESS.
Proposition 3.
The y * plane has a monotonic relationship with regulatory cost c b . As c b increases, financial institutions tend to choose financing strategies. The increase in financial parameters indicates that the higher regulatory cost of investing in riskier projects is more conducive to financial institutions’ financing.
Proof 3.
y * c b < 0 , when c b increases, y * gradually decreases, and the probability of financial institutions choosing financing strategies increases. □
Figure 5 shows the stabilization strategy choices and evolutionary trends of financial institutions.
The core problem of evolutionary game theory is to solve evolutionary stable strategy (ESS) and replication dynamics. The replication dynamic system composed of Equations (4), (9) and (14) is as follows:
F x = d x d t = 1 x x L ( 1 + r ) B z + ( 1 θ ) ( 1 + r ) B y z + k P y α + θ ( c 2 c 1 ) y z y θ c 2 + y z ( c e 1 c e 2 ) ( 1 y ) c e 2 + z ( c e 2 c e 1 ) + P y z α Δ k 1 + P N E V ( y h ( a R + b ) Q 1 + ( 1 y ) ( a R + b ) Q 2 + ( λ G + β ) Q 3 ) F y = d y d t = 1 y y L z ( 1 + r ) B + x z θ ( 1 + r ) B x 1 z ) ( 1 θ c 2 x z 1 θ c 1 ( 1 x ) c i 2 + ( 1 x ) z ( c i 2 c i 1 ) + x z P ( 1 α ) Δ k 1 + x P ( 1 α ) k F z = d z d t = 1 z z B P 1 + r x 1 + y y c b + x y Δ k 2

4.2. Stability Analysis of System Evolution

According to the replicator dynamic system (16), strategy equilibrium points can be obtained: P 1 ( 0 ,   0 ,   0 ) , P 2 ( 1 ,   0 ,   0 ) , P 3 ( 0 ,   1 ,   0 ) , P 4 ( 0 ,   0 ,   1 ) , P 5 ( 1 ,   1 ,   0 ) , P 6 ( 1 ,   0 ,   1 ) , P 7 ( 0 ,   1 ,   1 ) , P 8 ( 1 ,   1 ,   1 ) , P 9 ( x 0 ,   y 0 ,   z 0 ) . This P9 represents the equilibrium of all the mixed strategies. The mixed strategy can only reach equilibrium under certain conditions. The equilibrium of a strict evolutionary game is an asymptotically stable state, that is, pure strategy equilibrium. Therefore, only P1~P8 are considered in tripartite evolutionary equilibrium. The Lyapunov asymptotically stable conditions state that by constructing the Jacobian matrix and solving the characteristic values of each equilibrium point, we can determine its stability. The equilibrium point is evolutionarily stable when all the characteristic values are negative; it becomes a saddle point when one or two characteristic values are negative and an unstable point when all the characteristic values are positive. By substituting the above eight strategic equilibrium points into the Jacobian matrix, we can obtain the characteristic values and stability results of each strategic equilibrium point as shown in Table 3.
J = a   11 a   12 a   13 a   21 a   22 a   23 a   31 a   32 a   33 = F ( x ) / x F ( x ) / y F ( x ) / z F ( y ) / x F ( y ) / y F ( y ) / z F ( z ) / x F ( z ) / y F ( z ) / z

5. Simulation Analysis

5.1. Data Processing and Analysis

On 5 November 2021, Chain’s Chana Auto, Huawei, and Ningde Era formed a consortium to provide strategic financing to Avita Technology. Avita Technology has collaborated with the vehicle manufacturing advantages of Chana Auto, Huawei, and Contemporary Amperex Technology Co., Limited to use research and development in the field of intelligent technology and intelligent travel ecology. The goal was to establish a sophisticated global platform for intelligent electric vehicles. On 20 May 2022, the Avita 11 made its official debut. On 2 August of the same year, Avita Technology completed A round of financing with the participation of several financial institutions. The total amount raised in this financing round was approximately 5 billion yuan. According to the 2022 annual report of Chana Automobile [52], the loan interest rate range of Chana Auto to the Arms and Equipment Group Finance Limited Liability Company is from 1% to 4.75%, so let r = 0.0047 . The Pacific Auto data shows that in the first half of 2023, Avita 112 (high-end ICVs) sold 10,755 vehicles, Chana Deep Blue Series SL033 (mid-end ICVs) sold 37,884 vehicles, and Chana Auto CS75 PLUS4 (TFV) sold 115,891 vehicles, so that Q 1 = 1 , Q 2 = 3 , Q 3 = 11 . The official websites of Chana Shamrock Automobile5 and Avita6 show that the 515 pure electric version of Shamrock SL03 and the dual-motor long range version of Avita 11, respectively, have a range (CLEC condition) of 515 km and 555 km, so it is assumed that R = 530 . In addition, according to the 2022 Annual Report and 2023 Annual Report issued by the MIIT, the price of new energy positive credits in 2021 and 2022 is 2088 yuan/point and 1128 yuan/point, respectively. According to the statistical forecast of China Automobile Data Co., Ltd. [53], the price of the unit credit transaction in 2023 will drop to 200–400 yuan/point. Therefore, credit trading price is taken P N E V 0.05 ,   0.2 . Referring to the relevant literature [54], assume parameter B = 1 . The main model parameters are set in Table 4.
It is worth noting that there is a time lag between the fund circulation and the result feedback in the investment industry [55,56,57]. There is an information gap in the decision-making of the three parties, as well as the allocation and arrival time of financing funds. The final evolution result depends not only on the decision at that time but also on a certain moment and state before. When financial institutions choose the financing strategy and traditional automobile companies and internet companies accept financing, financial institutions will fully analyze their liquidity and then remit funds to each other’s accounts through banks and other channels. The results obtained from using funds for innovation will not be immediately reflected to companies, which will have a considerable time lag. Based on this, this paper introduces the time delay of funds in the numerical simulation. It is assumed that during the financing process, the game players encounter a fund delay τ 0 with a probability of p 0 , the fund delay τ 1 with a probability of p 1 , and the fund delay τ 2 with a probability of p 2 , which satisfies the condition of p 0 + p 1 + p 2 = 1 . The delay differential equations for traditional automobile companies, internet companies, and financial institutions are as follows:
F ( x ) = d x ( t ) d t = 1 x ( t ) x ( t ) c e 2 c e 1 + L ( 1 + r ) B Z c e 2 + P N E V Q 2 ( a R + b ) + ( λ G + β ) Q 3 + P α k + L + c e 2 θ c 2 + h P N E V Q 1 ( a R + b ) P N E V Q 2 ( a R + b ) Y + P α Δ k 1 + θ ( c 2 c 1 ) + ( 1 θ ) ( 1 + r ) B L + ( c e 2 c e 1 ) Y Z F ( y ) = d y ( t ) d t = 1 y ( t ) y ( t ) c i 2 c i 1 ( 1 + r ) B Z + P ( 1 α ) k ( 1 θ ) c 2 + c i 2 X + L c i 2 + θ ( 1 + r ) B + ( 1 θ ) ( c 2 c 1 ) ( c i 2 c i 1 ) + P ( 1 α ) Δ k 1 X Z F ( z ) = d z ( t ) d t = 1 z ( t ) z ( t ) B P 1 + r X 1 + Y Y c b + X Y Δ k 2
Relevant supplements of Equation (18) are as follows:
X = p 0 x ( t ) + p 1 x ( t τ 1 ) + p 2 x ( t τ 2 ) Y = p 0 y ( t ) + p 1 y ( t τ 1 ) + p 2 y ( t τ 2 ) Z = p 0 z ( t ) + p 1 z ( t τ 1 ) + p 2 z ( t τ 2 )
In the numerical simulation, let p 0 = 0.5, p 1 = p 2 = 0.25, τ 1 = 8, τ 2 = 12. To ensure the fairness of all parties, the initial stable state of the system is set as x = 0.5 , y = 0.5 , z = 0.5 . The specific simulation results are shown in Section 5.2, Section 5.3 and Section 5.4.
The transformation process of traditional automobile companies towards ICVs is time-consuming. The competition for intelligent software and chips necessitates the collaborative operation of internet companies. Injecting funds from financial institutions is a necessary condition for innovation in high-end ICVs. This paper defines the situation x = 1 , y = 1 , z = 1 as ideal event A. The probability of an ideal event is P ( A ) = x y z .

5.2. Influence of Changes in Collaborative Parameters between Traditional Automobile Companies and Internet Companies on System Evolution

5.2.1. Profit Sharing Coefficient α

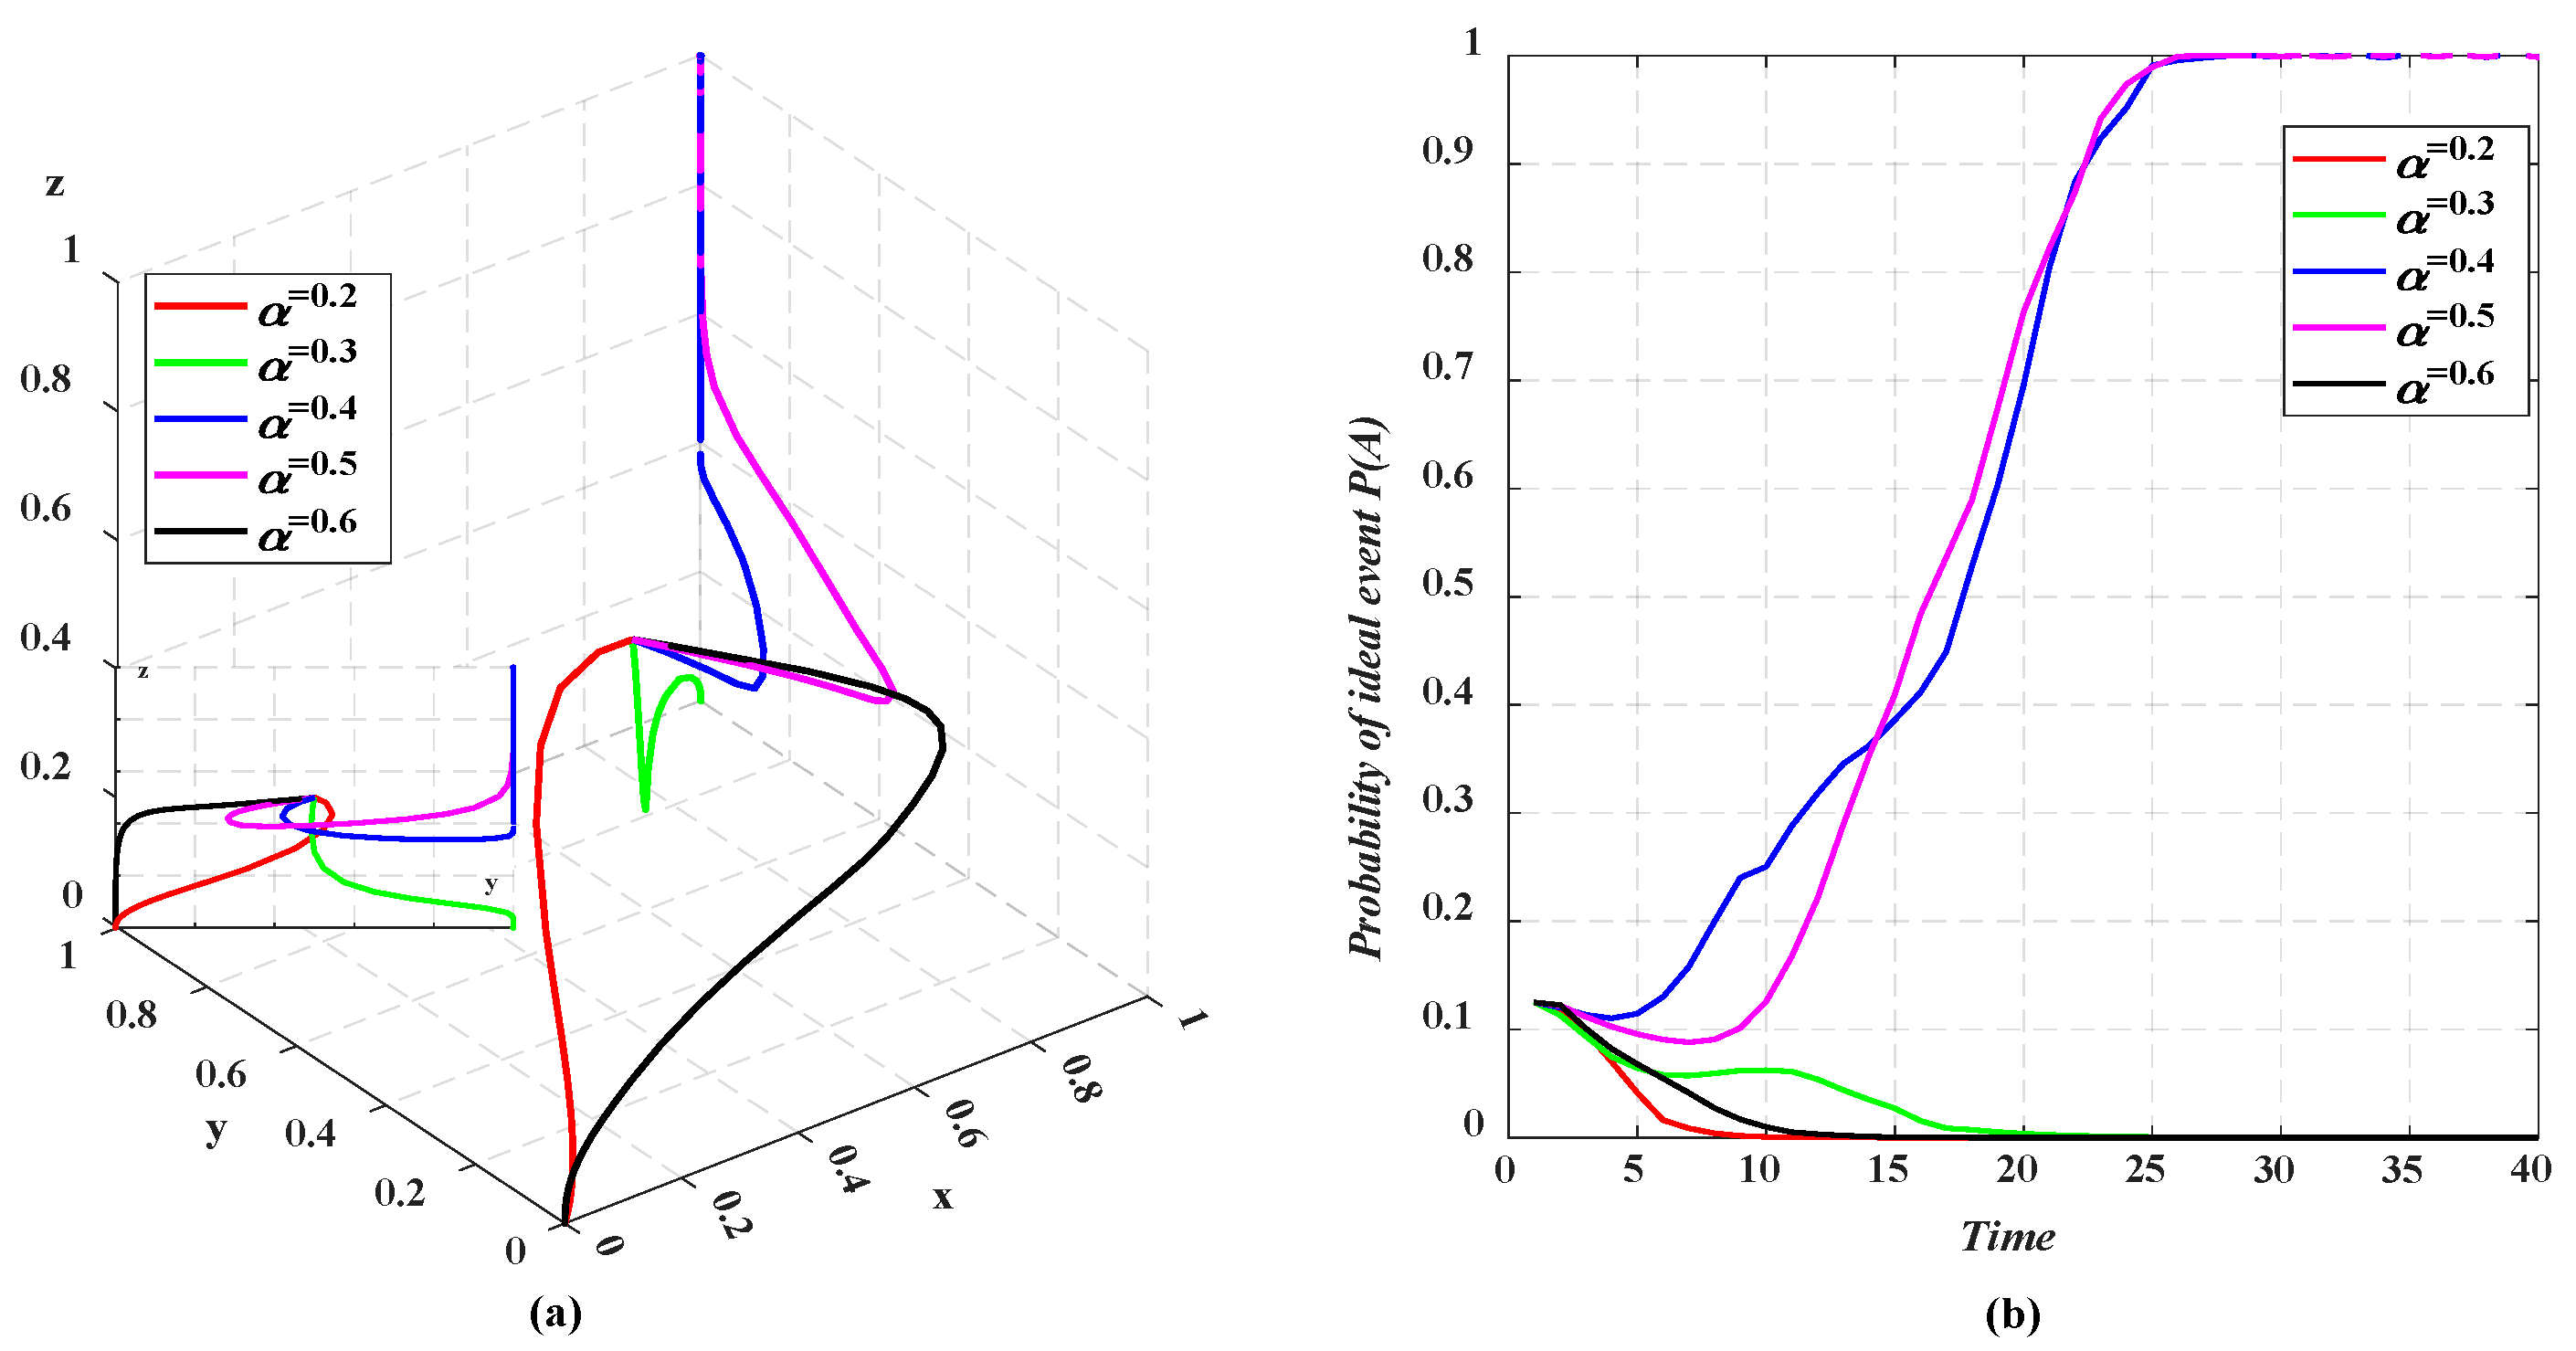
The step size of the profit-sharing coefficient α is taken to be 0.1, holding all other parameters constant. Figure 6 illustrates the impact of changes in the profit-sharing coefficient on the system evolution. As shown in Figure 6a, the profit-sharing coefficient for traditional automobile companies and internet companies is in the range of [0.3, 0.5], which enables collaborative innovation between the two parties; for financial institutions, the profit-sharing coefficient should be in the range of [0.4, 0.5] to guide their choice of financing strategy. It can be observed that financial institutions are more sensitive to changes in the profit-sharing coefficient. Combined with the actual situation and ideal event A, a profit-sharing coefficient biased towards internet companies can better promote collaboration among the three parties (see Figure 6b). As the profit-sharing coefficient gradually increases, traditional automobile companies and internet companies have evolved from non-collaborative innovation to collaborative innovation. As the collaboration between the two sides gradually stabilizes, financial institutions have evolved from a non-financing strategy to a financing strategy. When traditional automobile companies have a high profit-sharing coefficient, internet companies will eventually withdraw from collaboration because their income cannot cover the high R&D costs and the risk of loss of knowledge spillover. The two sides eventually evolve into non-collaborative innovation.

5.2.2. Cost-Sharing Coefficient θ

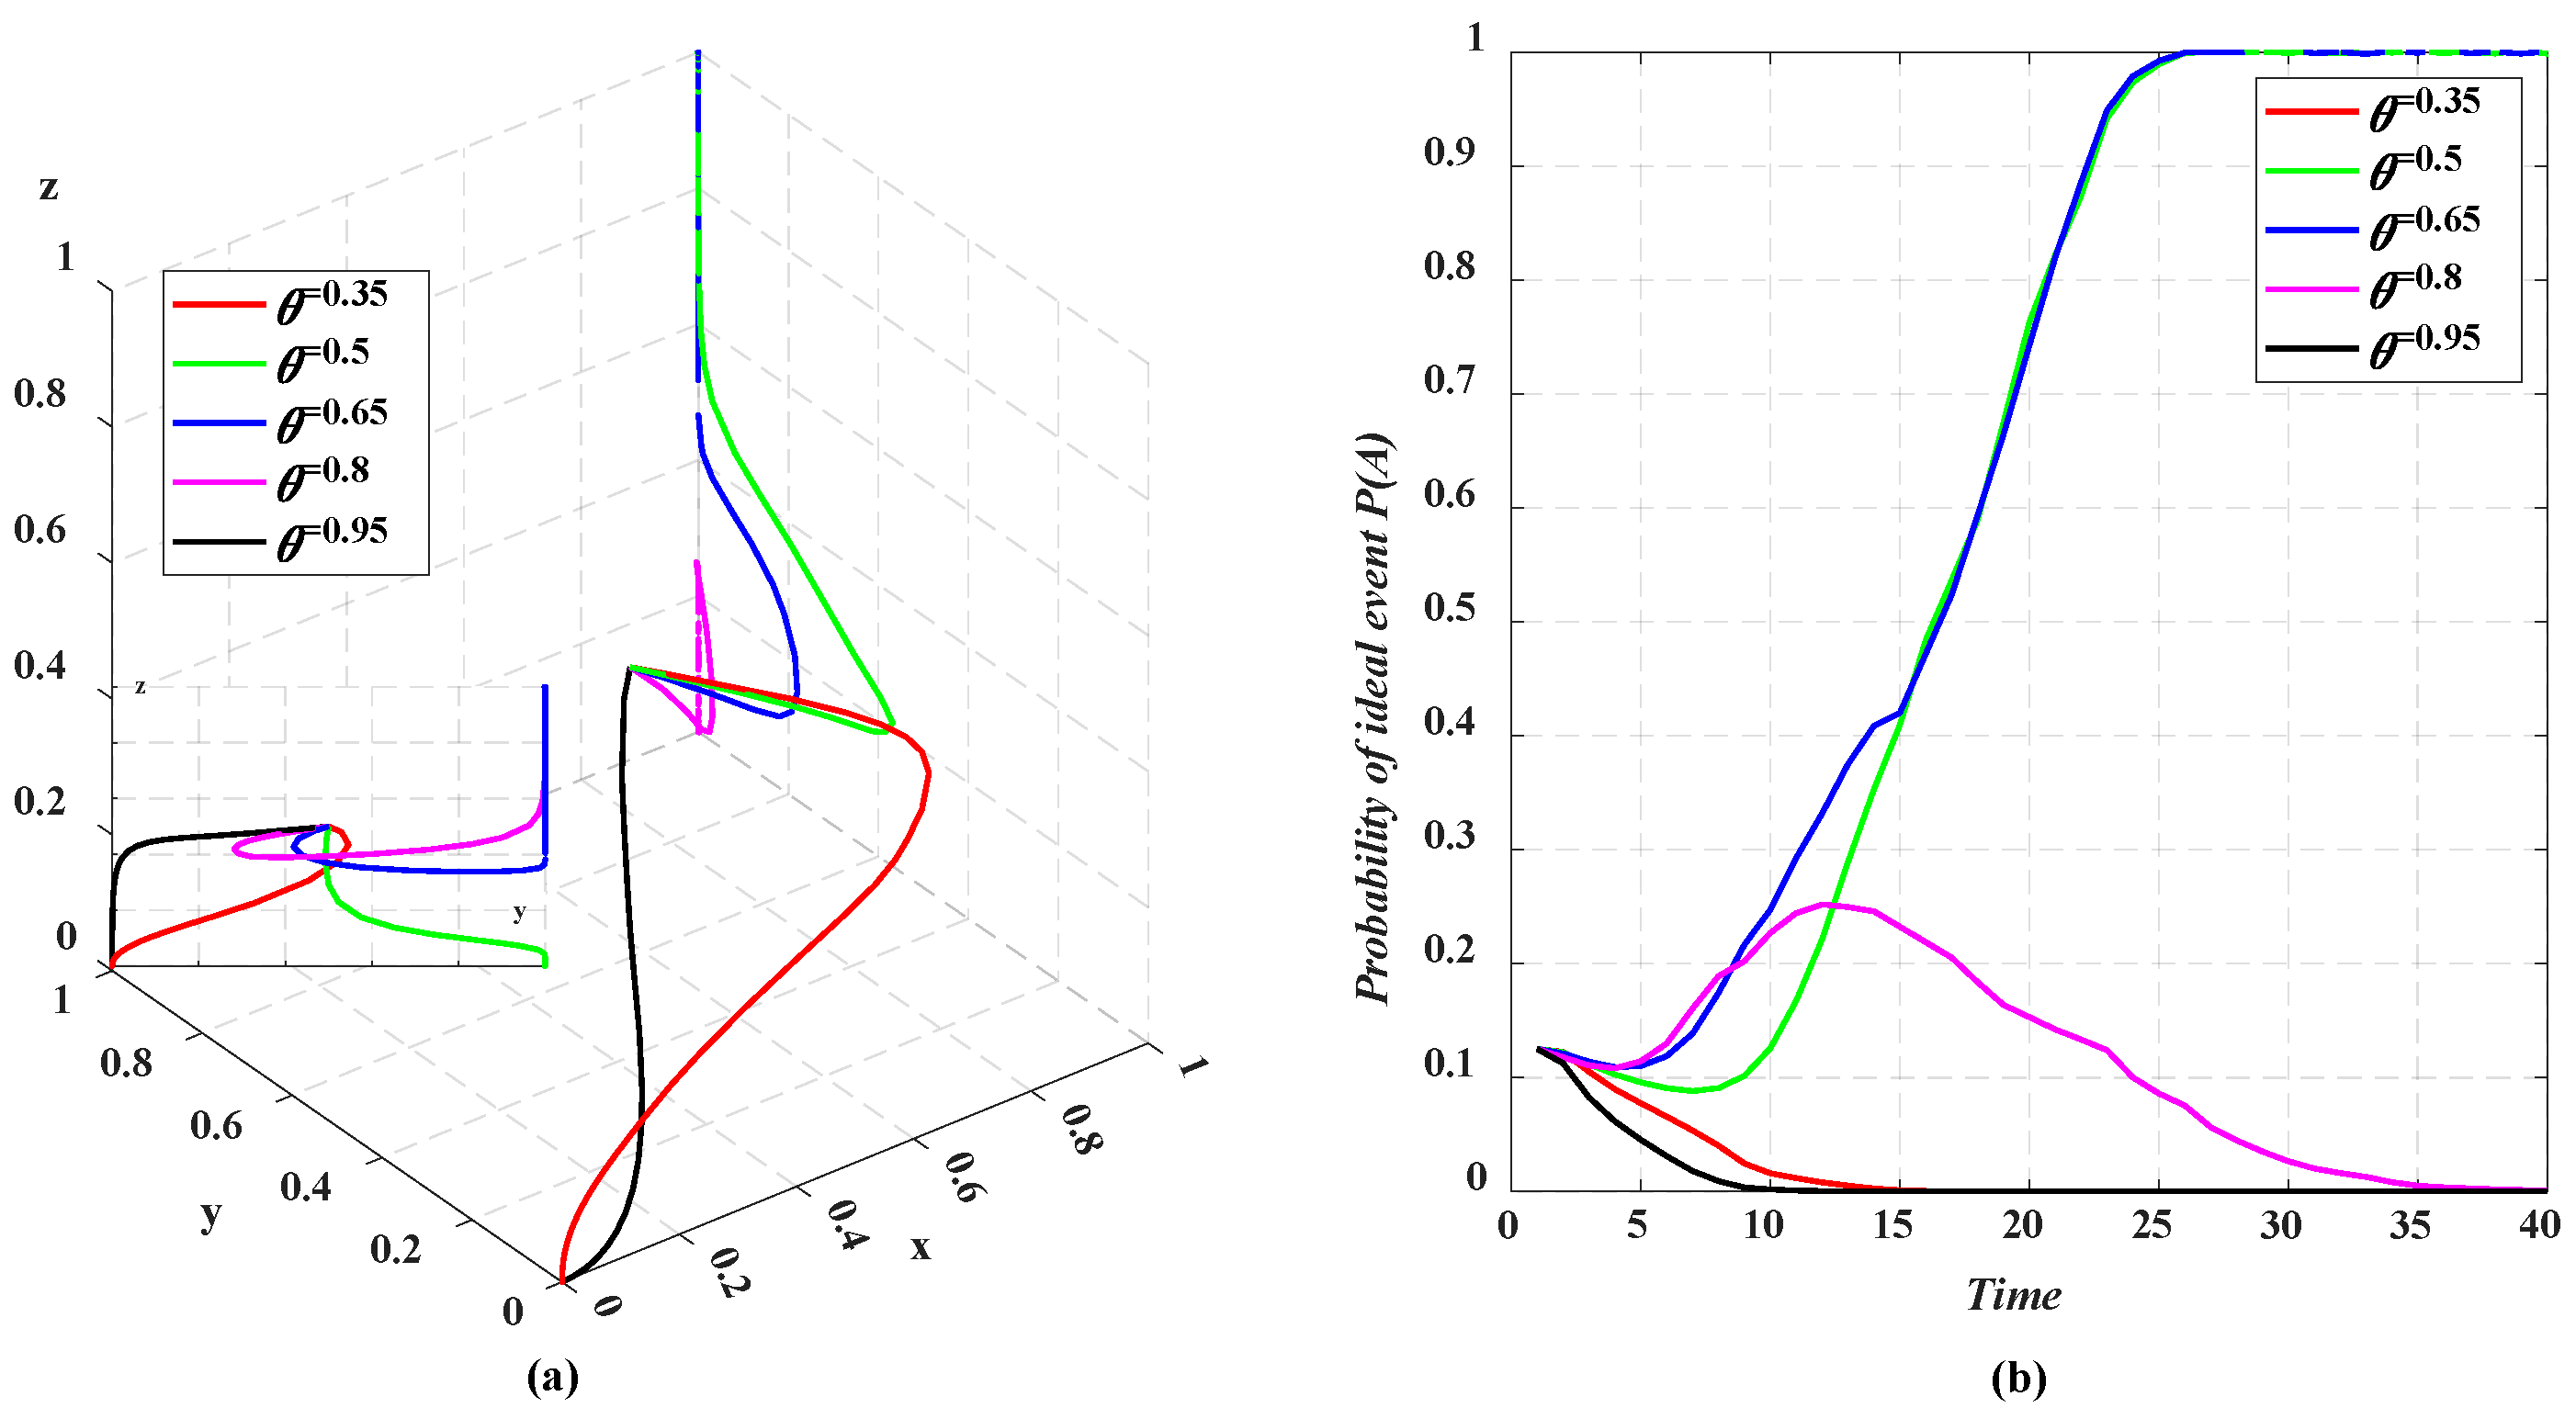
The step size of the cost-sharing coefficient θ is taken to be 0.15, holding all other parameters constant. Figure 7 illustrates the impact of changes in the cost-sharing coefficient on the system evolution. As shown in Figure 7a, traditional automobile companies and internet companies will choose the collaborative innovation strategy when the cost-sharing coefficient is in the range of [0.5, 0.8]; financial institutions will choose the financing strategy when the cost-sharing coefficient is in the range of [0.5, 0.65], and financial institutions are more sensitive to the cost-sharing coefficient. The cost-sharing coefficient slightly biased towards traditional automobile companies will promote the occurrence of ideal event A, that is θ 0.5 ,   0 . 65 (see Figure 7b). In the process of tripartite collaboration, traditional automobile companies are in a dominant position, and internet companies, as new entrants, are unwilling to bear higher costs. With the increase in the cost borne by traditional automobile companies, the strategies of traditional automobile companies and internet companies will evolve from non-collaborative innovation strategies to collaborative innovation strategies. When traditional automobile companies bear too much cost, the probability of ideal event A will fluctuate greatly. When the cost-sharing coefficient is 0.8, the probability of an ideal event first increases and then decreases. At this time, intelligent connected cost tends to shift from two parties to one, and the risk loss of collaborative innovation increases. Due to increased risk costs, financial institutions will evolve into non-financing entities, while both traditional automobile companies and internet companies will face financial pressure and evolve into non-collaborative innovation.

5.3. Influence of Changes in Financing Parameters of Financial Institutions on System Evolution

5.3.1. Financing Amount B

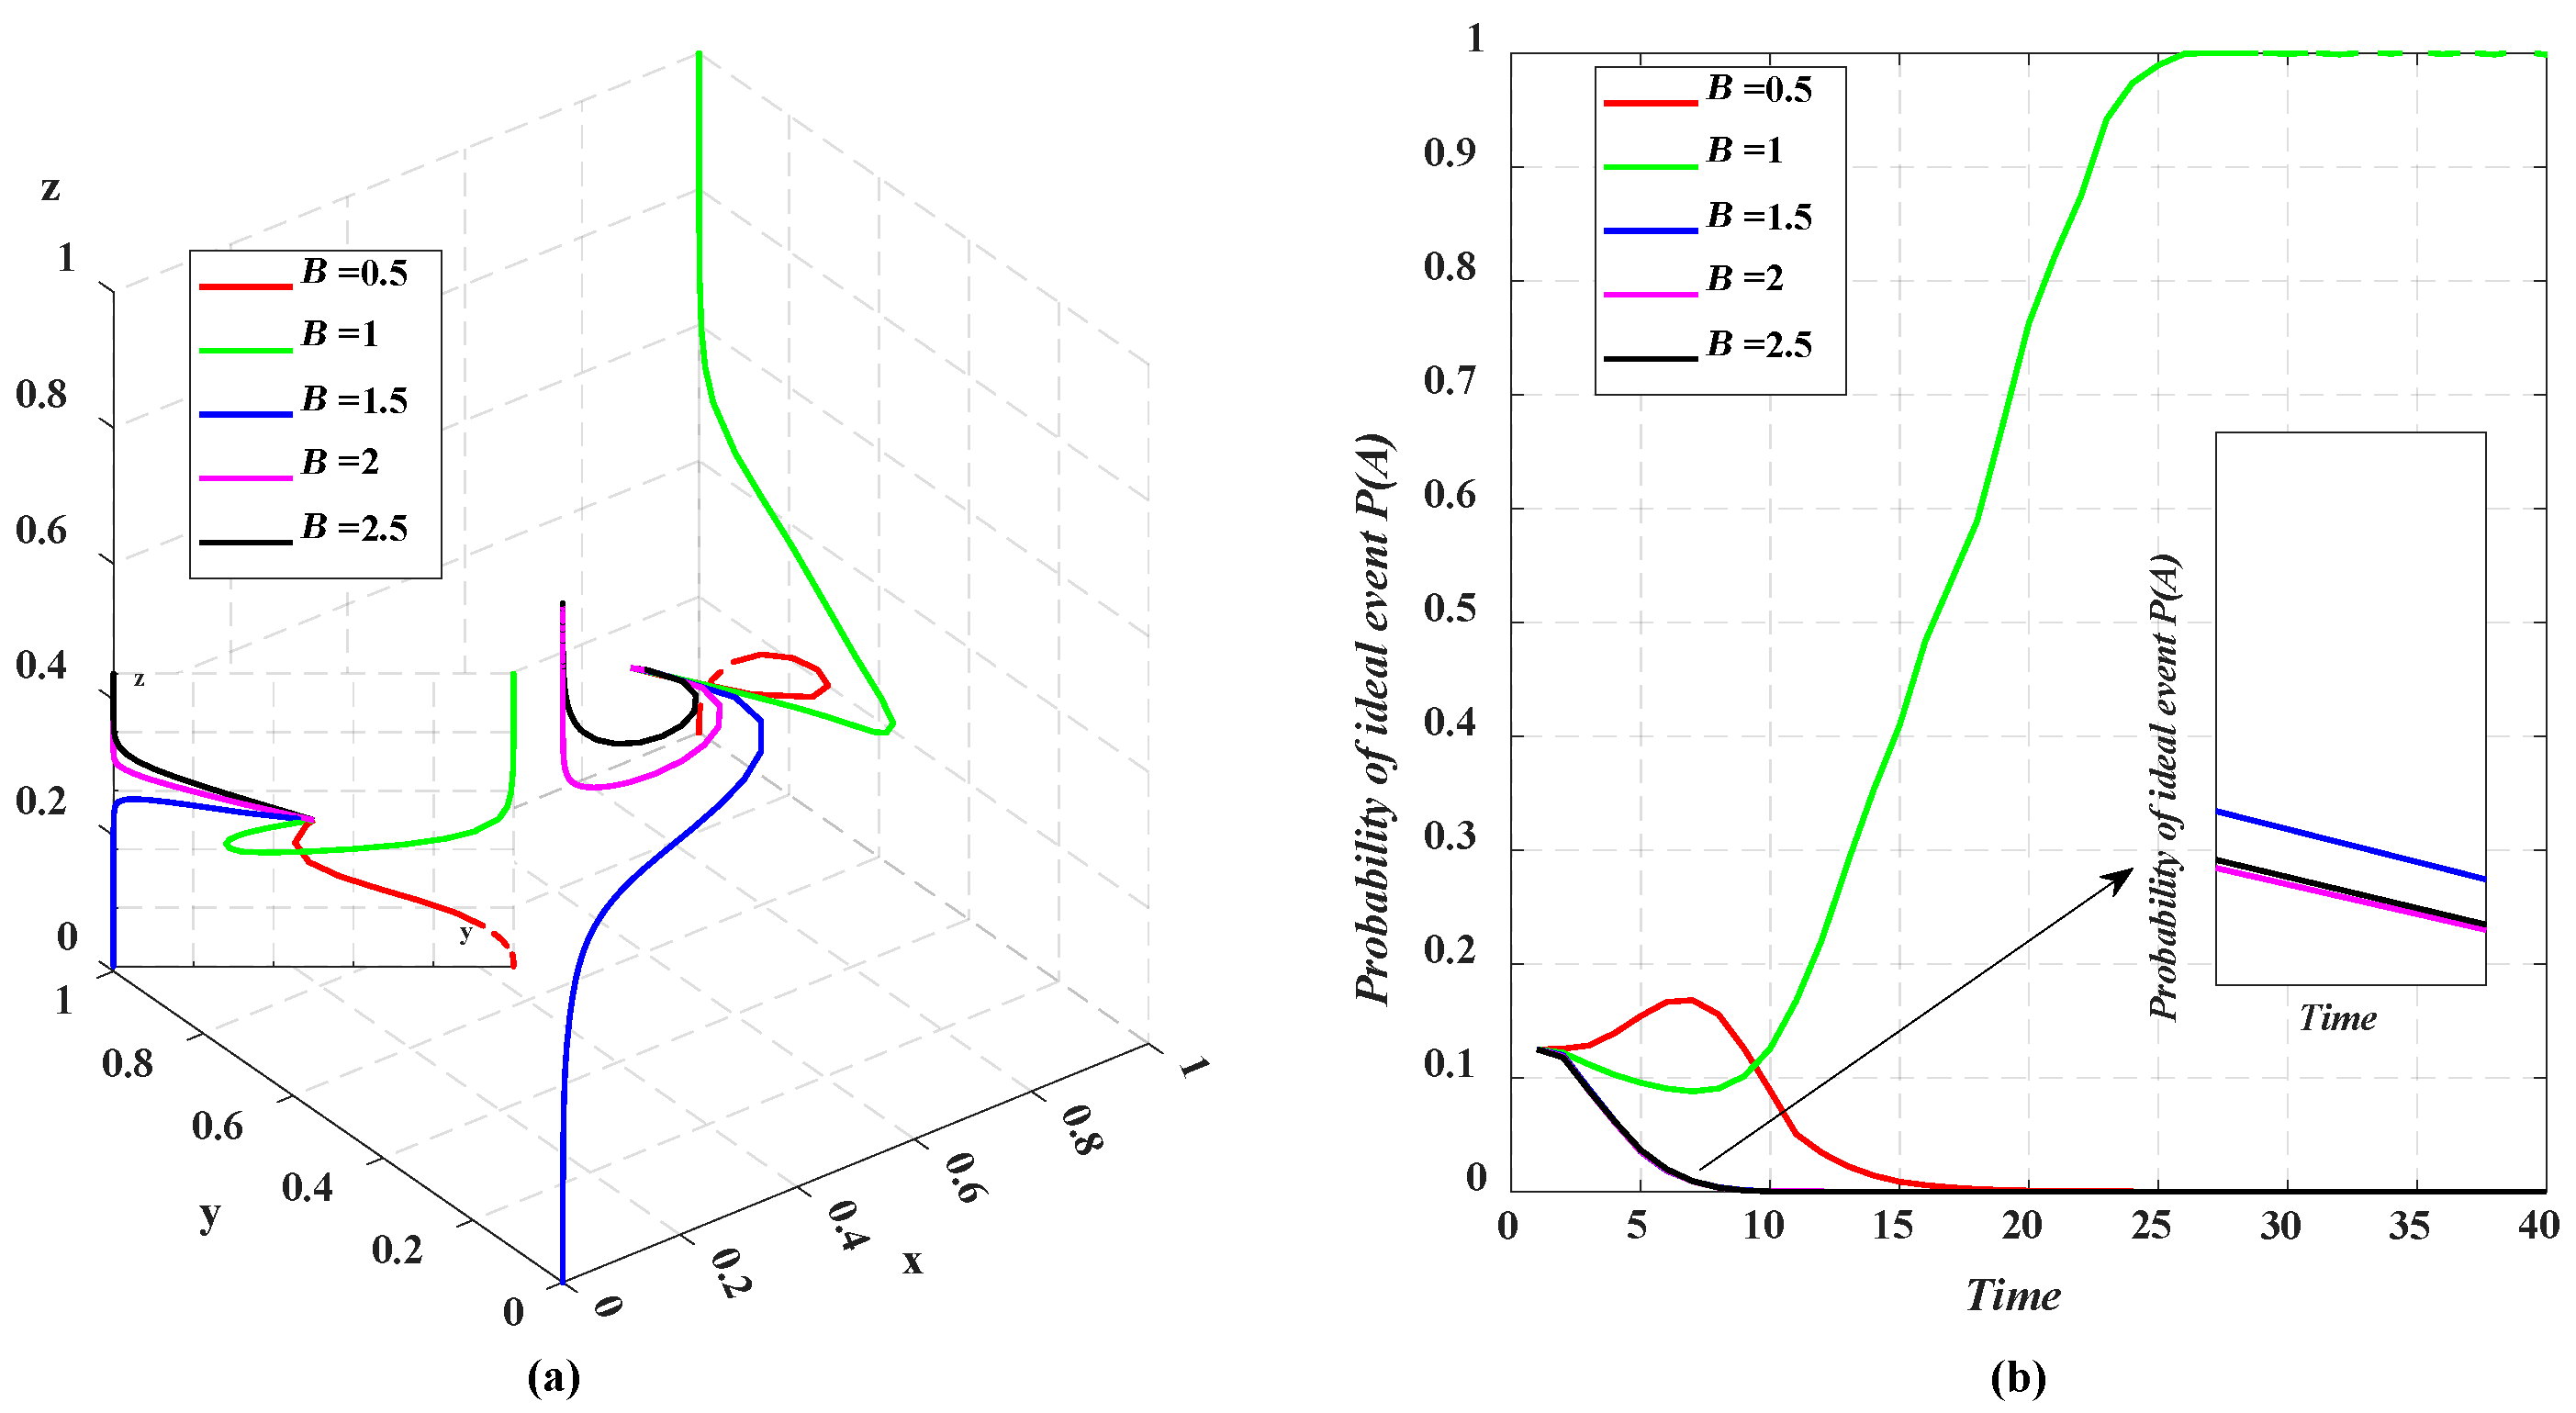
The step size of the financing amount B is taken to be 0.5, holding all other parameters constant. Figure 8 illustrates the impact of changes in the financing amount on the system evolution. Financial institutions, traditional automobile companies, and internet companies should have a thorough understanding of their own capital operations when seeking financing. When the financing amount is low, the risk of collaboration failure is within an acceptable range. Therefore, all parties initially tend to collaborate; however, the low financing amount is insufficient to compensate for the costs of collaboration, and ultimately the collaboration fails. Consequently, the probability of ideal event A fluctuates greatly under the low financing amount (see Figure 8b). Traditional automobile companies and internet companies invest less in initial collaborative innovation, have a smaller funding gap, and require lower financing amounts. However, financial institutions often choose the non-financing strategy because they receive insufficient interest or other additional benefits that are insufficient to offset higher regulatory costs. When the financing amount is high, companies often choose not to finance due to higher interest expenses (see Figure 8a). Therefore, choosing the appropriate timing and amount of financing can facilitate collaboration among traditional automobile companies, internet companies, and financial institutions.

5.3.2. Regulatory Cost of Financial Institutions c b

The step size of the regulatory cost of financial institutions c b is taken to be 0.1, holding all other parameters constant. Figure 9 illustrates the impact of changes in the regulatory cost of financial institutions on the system evolution. The regulatory costs of financial institutions can effectively mitigate the collaboration risks between traditional automobile companies and internet companies. As can be seen from Figure 9a, the regulatory costs have a dual nature, and improper or excessive regulation will greatly reduce the financing efficiency. When the regulatory cost is low, financial institutions are unable to accurately grasp the operational information of companies. There are great risks in financing, which cannot guarantee the collaborative innovation of companies. When regulatory cost is excessive, the additional benefits obtained by financial institutions cannot compensate for their costs, so they choose the non-financing strategy. Therefore, financial institutions should bear appropriate regulatory costs to ensure the collaborative innovation between traditional automobile companies and internet companies, thereby ultimately contributing to the probability of ideal event A.

5.4. Influence of Changes in Policy Parameters of New Dual-Credit Policy on System Evolution

5.4.1. Credit Trading Price P N E V

The step size of the credit trading price P N E V is taken to be 0.05, holding all other parameters constant. Figure 10 illustrates the impact of changes in the credit trading price on the system evolution. As shown in Figure 10a, when the credit trading price is between [0.05, 0.1], traditional automobile companies and internet companies have evolved from non-collaborative innovation to collaborative innovation, and financial institutions have evolved from non-financing strategy to financing strategy. As shown in Figure 10b, the higher the credit trading price, the faster the probability of ideal event A converges to a stable state. However, excessive credit trading prices will actually reduce the convergence speed of the probability of ideal event A. The depreciation of NEV credits allows traditional automobile companies to meet the policy requirement by purchasing credits. Therefore, a low credit trading price cannot effectively promote the transformation of traditional automobile companies. As the credit trading price increases, traditional automobile companies are forced to transform because of the increase in the cost of purchasing credits.
Figure 10 shows that excessively high or excessively low credit trading prices are not conducive to the transformation of traditional automobile companies. Essentially, the dual-credit policy balances the automobile market by considering both policy and market factors. Therefore, the revision of dual-credit policy should fully consider the linkage among various factors, ultimately promoting the probability of the ideal event.

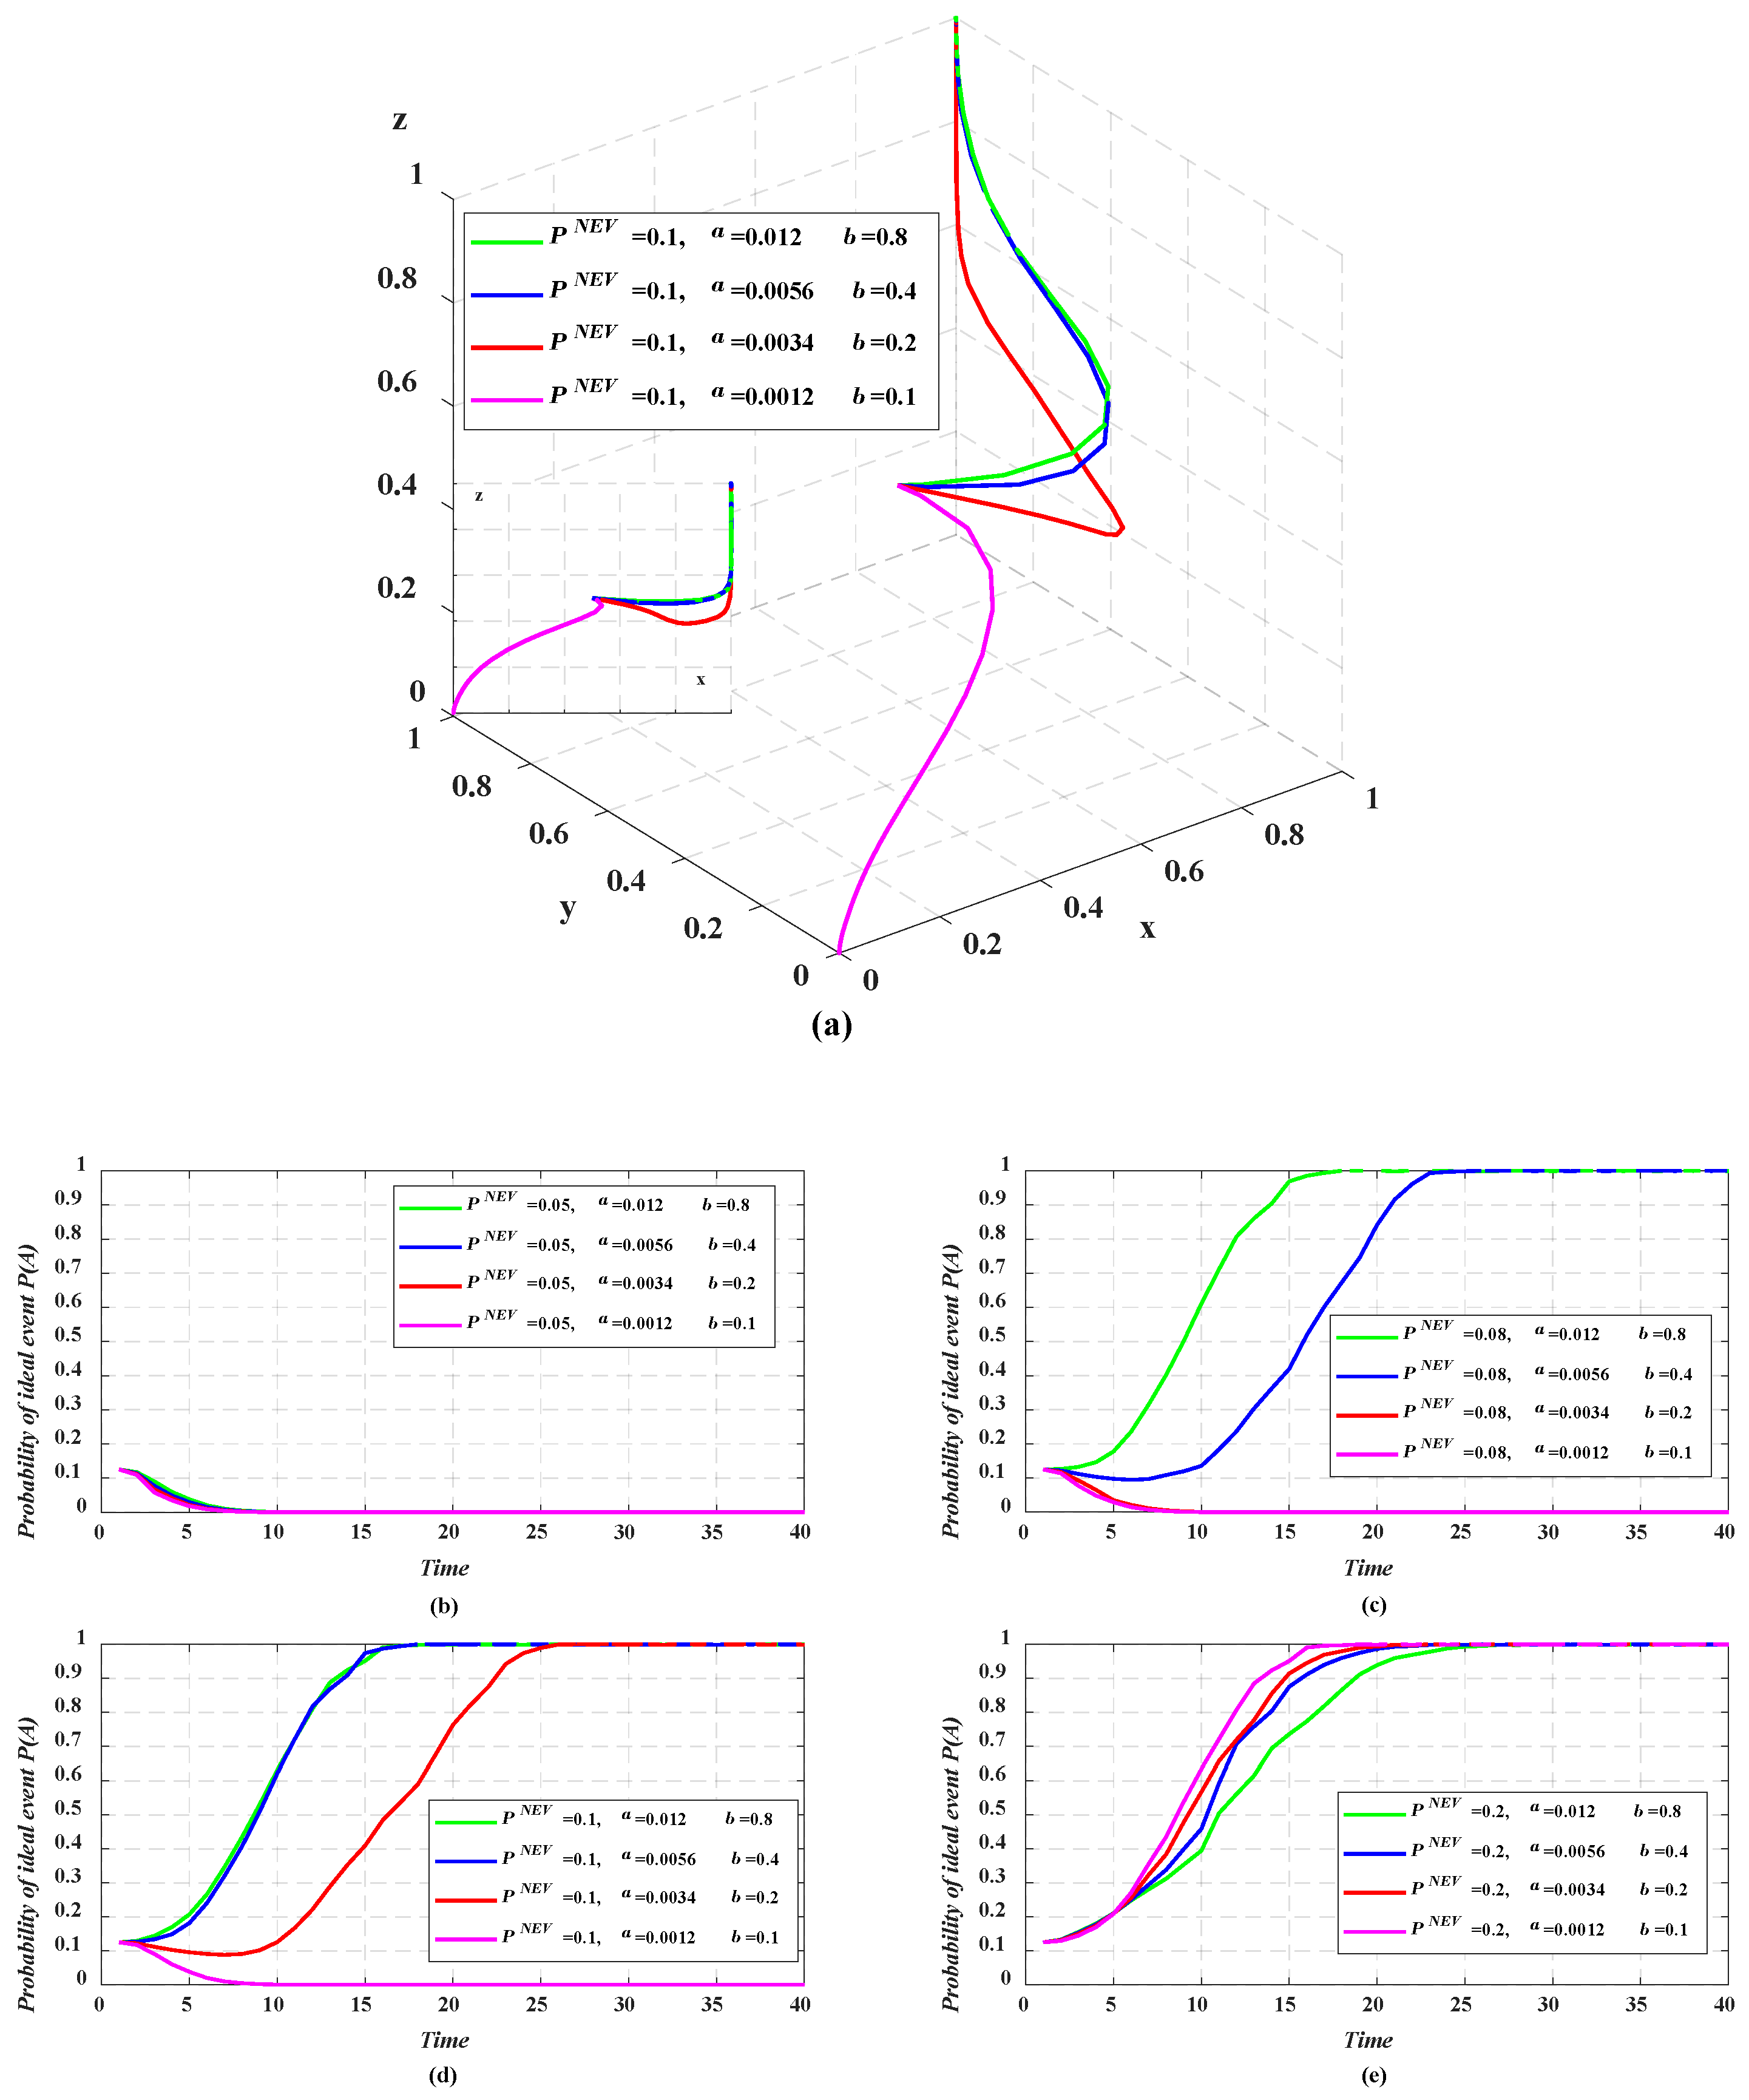
5.4.2. NEV Credit Accounting Coefficients a and b for Standard Vehicle Model

According to the new dual-credit policy and its development trend, the values of NEV credit accounting coefficients a and b are assigned. Figure 11 shows the synergistic effect of NEV credit accounting coefficients a and b and credit trading price P N E V on system evolution. Comparing Figure 11b–e, it is obvious that the sensitivity of the probability of ideal event A to credit trading price greatly exceeds the sensitivity to NEV credit accounting coefficients. When the credit trading price is moderate, the low NEV credit accounting coefficients cannot compensate for the high cost required for transforming traditional automobile companies (see Figure 11c,d). Therefore, when the credit trading price is moderate, the government can balance the credit market by adjusting NEV credit accounting coefficients and finally promote the collaborative innovation between traditional automobile companies and internet companies, as well as the financing from financial institutions.

5.4.3. NEV Credit Ratio Requirement β

According to the national policy, the NEV credit ratio requirement β from 2022 to 2025 is 0.16, 0.18, 0.28, and 0.38. Figure 12 shows the synergistic effect of NEV credit ratio requirement β and credit trading price P N E V on system evolution. The new dual-credit policy has raised the NEV credit ratio requirement, resulting in a shortage of NEV credits in the credit trading market. As shown in Figure 12b–e, the probability of ideal event A can mostly converge to 1 under medium and high credit trading prices. The ideal event is influenced by the interaction between the NEV credit ratio requirement and credit trading price. Therefore, combined with Figure 10 and Figure 11, it can be seen that it is unreasonable for governments to blindly and unilaterally increase policy constraints or the NEV credit trading price.

6. Conclusions and Policy Recommendations

6.1. Conclusions

Under the wave of electrification and intelligent-connected development, the transformation of traditional automobile companies must be imminent in order to adapt to the market trend. In the new market model, the definition of automobile is not only hardware but also technological intelligence, that is, high-end ICVs and mid-end ICVs. Therefore, this paper considers the cross-border collaborative innovation between traditional automobile companies and internet companies and introduces third-party financial institutions to address the problem of funds. Under the background of funding time delay, this paper constructs a tripartite evolutionary game model of traditional automobile companies, internet companies, and financial institutions. The research conclusions are as follows:
(1) The collaborative innovation between traditional automobile companies and internet companies is affected by the profit-sharing coefficient and cost-sharing coefficient. The profit-sharing coefficient and cost-sharing coefficient each have a certain threshold interval, which can promote collaborative innovation between traditional automobile companies and internet companies. Compared to traditional automobile companies and internet companies, financial institutions are more sensitive to the profit-sharing coefficient and cost-sharing coefficient.
(2) Although the NEV credit rule and CAFC credit rule have imposed some pressure on automobile companies, simply tightening them is not conducive to promoting the healthy development of the entire automotive industry. Furthermore, the appropriate credit reward for high-end ICVs can better stimulate the enthusiasm of automobile companies for intelligent-connected transformation and innovation of more high-end intelligent technologies.
(3) The financing amount and regulatory cost are important factors that affect the financing of financial institutions. The financing amount and regulatory cost each have a certain threshold range, within which tripartite collaboration can be facilitated. Excessive financing will bring great interest expense to automobile companies and internet companies. The low financing amount does not bring enough profits to financial institutions to compensate for their regulatory costs, and it will also lead to an information gap and collaboration risk.

6.2. Policy Recommendations

In the digital transformation of traditional automobile companies, relevant national departments should fully consider the linkage between various factors when revising the dual credit policy. For example, policy factors include NEV credit accounting coefficients, NEV credit ratio requirement, and market factors include NEV credit trading price. It is unreasonable for the government to consider the range of any factor alone. The government should ensure the balance between supply and demand in the credit market. In terms of network connectivity, the government should introduce corresponding rewards for the production of higher end ICVs, and encourage automobile companies to innovate in automotive intelligence and networking.
Intelligent technology presents both opportunities and challenges for traditional automobile companies when compared to new car-making forces such as NIO and Xiaopeng. The realization of intelligent driving, an intelligent cockpit, and a digital gateway requires internet thinking and computer technology. Unlike the traditional supply chain dominated by automobile companies in the past, multi-party collaboration is required to ensure the coordinated development of the industrial chain. The digital transformation can best respond to customer demand and facilitate continuous innovation, and traditional automobile companies should closely integrate all aspects of internal R&D, manufacturing, and service. Moreover, internet companies should continue to enhance the core strength of software. Internet companies can utilize the internet platform to assist automobile companies in providing service and precise after-sales support.
Financial institutions provide funding for the collaborative innovation between traditional automobile companies and internet companies. The government should formulate relevant policies to encourage financial institutions to finance small and medium-sized enterprises engaged in scientific and technological innovation, streamline the approval process for fund allocation, and minimize the time it takes for funds to be disbursed. Relevant compensation mechanisms should be established to mitigate the losses incurred by financial institutions when the other party defaults.

6.3. Limitations

This paper constructs a tripartite evolutionary game model of traditional automobile companies, internet companies, and financial institutions considering funding time delay. The paper did not take into consideration the potential depreciation of funds caused by time delays. There may be inaccuracies in the input data of numerical simulation, so the actual financing situation should be explored in the future.

Author Contributions

D.Z.: Conceptualization, Methodology, Formal analysis, Data curation, Writing—original draft, Writing—Review and Editing. Y.L.: Conceptualization, Methodology, Software, Visualization, Writing—original draft. J.W.: Date curation, Writing—review and editing. J.T.: Writing—review and editing, Supervision. All authors have read and agreed to the published version of the manuscript.

Funding

This work was supported by the National Natural Science Foundation of China (Grant Nos. 72204001, 71702112), the National Social Science Foundation of China (Grant No. 22BGL202), the Research Project for Outstanding Young Scholars of Anhui Provincial Education Department (Grant No. 2023AH030035), Excellent scientific research and innovation team of Anhui Provincial Education Department of China (No. 2022AH010027), and the Planning Funds of Philosophy and Social Science in Anhui Province (Grant No. AHSKQ2020D14).

Data Availability Statement

The data that has been used is confidential.

Conflicts of Interest

The authors declare that they have no known competing financial interests or personal relationships that could have appeared to influence the work reported in this paper.

Notes

1
ICVs are classified as assisted driving stage (L1), partial driving stage (L2), conditional autonomous driving stage (L3), highly automated driving stage (L4) and fully automated driving stage (L5), and the mass production and popularization of L2 Level vehicles were achieved in 2019.
2
3
4
5
https://www.deepal.com.cn/sl03 (accessed on 1 July 2023).
6

References

  1. China Academy of Information and Communications Technology (CAICT). Cloud Computing White Paper (2023). Available online: http://www.caict.ac.cn/kxyj/qwfb/bps/202307/t20230725_458185.htm (accessed on 20 July 2023).
  2. The State Council. Development Plan for the New Energy Vehicle Industry (2021–2035). Available online: https://www.gov.cn/gongbao/content/2020/content_5560291.htm (accessed on 20 October 2020).
  3. Yang, D.; Jiang, K.; Zhao, D.; Yu, C.; Cao, Z.; Xia, S.; Xiao, Z.; Jiao, X.; Wang, S.; Zhang, K. Intelligent and connected vehicles: Current status and future perspectives. Sci. China Technol. Sci. 2018, 61, 1446–1471. [Google Scholar] [CrossRef]
  4. Ministry of Industry and Information Technology (MIIT). Economic Operation of the Automotive Industry in December 2022. Available online: https://www.miit.gov.cn/gxsj/tjfx/zbgy/qc/art/2023/art_610c626d34b8424c9c1077ac5e5a40fe.html (accessed on 12 January 2023).
  5. MIIT. Decision on Amending the “Measures for Parallel Management of Average Fuel Consumption of Passenger Car Enterprises and New Energy Vehicle Credits”. Available online: https://www.miit.gov.cn/jgsj/zbys/gzdt/art/2023/art_02e935e2cce74be4a641d7b8ca5621b4.html (accessed on 6 July 2023).
  6. MIIT. Measures for Parallel Management of Average Fuel Consumption of Passenger Car Enterprises and New Energy Vehicle Credits. Available online: https://www.miit.gov.cn/jgsj/zbys/qcgy/art/2020/art_f09be90b302f4875928ac1c05a5c3bbc.html (accessed on 28 September 2017).
  7. Zhao, D.; Yan, X.C.; Wang, H.P.; Li, Y. Evolutionary game analysis of cooperative innovation of automakers under dual-credit policy. Chin. J. Manag. Sci. 2024, 32, 279–292. [Google Scholar] [CrossRef]
  8. Liao, H.; Peng, S.; Li, L.; Yi, Z. The role of governmental policy in game between traditional fuel and new energy vehicles. Comput. Ind. Eng. 2022, 169, 108292. [Google Scholar] [CrossRef]
  9. MIIT. Annual Report on the Implementation of Parallel Management of Average Fuel Consumption and New Energy Vehicle Credits in Passenger Vehicle Enterprises (2023). Available online: http://www.miit-eidc.org.cn/module/download/downfile.jsp?classid=0&filename=cdd994c1750b4c2f8ba7468c146bccff.pdf (accessed on 25 April 2023).
  10. Smith, J.M.; Price, G.R. The logic of animal conflict. Nature 1973, 246, 15–18. [Google Scholar] [CrossRef]
  11. Taylor, P.D.; Jonker, L.B. Evolutionary stable strategies and game dynamics. Math. Biosci. 1978, 40, 145–156. [Google Scholar] [CrossRef]
  12. Cai, G.; Kock, N. An evolutionary game theoretic perspective on e-collaboration: The collaboration effort and media relativeness. Eur. J. Oper. Res. 2009, 194, 821–833. [Google Scholar] [CrossRef]
  13. Axelrod, R.; Hamilton, W.D. The evolution of cooperation. Science 1981, 211, 1390–1396. [Google Scholar] [CrossRef]
  14. McClure, S.M.; Laibson, D.I.; Loewenstein, G.; Cohen, J.D. Separate neural systems value immediate and delayed monetary rewards. Science 2004, 306, 503–507. [Google Scholar] [CrossRef]
  15. Ma, H.; Lou, G.; Fan, T.; Chan, H.; Chung, S. Conventional automotive supply chains under China’s dual-credit policy: Fuel economy, production and coordination. Energy Policy 2021, 151, 112166. [Google Scholar] [CrossRef]
  16. Wang, N.; Fang, T.; Liu, X.; Shu, Y.J. Research on the influence of dual-credit policy on Chinese automobile market and policy trend. China Soft. Sci. 2019, S01, 203–215. [Google Scholar] [CrossRef]
  17. Liu, L.; Wang, Z.; Liu, Y.; Zhang, Z. Vehicle product-line strategy under dual-credit and subsidy back-slope policies for conventional/new energy vehicles. Comput. Ind. Eng. 2023, 177, 109020. [Google Scholar] [CrossRef]
  18. Li, Y.; Zhang, Q.; Li, H.; Tang, Y.Y.; Liu, B.Y. The impact of dual-credit scheme on the development of the new energy vehicle industry. Energy Procedia 2019, 158, 4311–4317. [Google Scholar] [CrossRef]
  19. Wu, F.; Li, P.; Dong, X.; Lu, Y. Exploring the effectiveness of China’s dual credit policy in a differentiated automobile market when some consumers are environmentally aware. Energy Econ. 2022, 111, 106077. [Google Scholar] [CrossRef]
  20. Cheng, Y.; Fan, T.; Zhou, L. Optimal strategies of automakers with demand and credit price disruptions under the dual-credit policy. J. Manag. Sci. Eng. 2022, 7, 453–472. [Google Scholar] [CrossRef]
  21. Li, J.Z.; Ku, Y.Y.; Li, L.Y.; Liu, C.L.; Deng, X.D. Optimal channel strategy for obtaining new energy vehicle credits under dual credit policy: Purchase, self-produce, or both? J. Clean. Prod. 2022, 342, 130852. [Google Scholar] [CrossRef]
  22. Cheng, Y.; Fan, T. Production coopetition strategies for an FV automaker and a competitive NEV automaker under the dual-credit policy. Omega 2021, 103, 102391. [Google Scholar] [CrossRef]
  23. Ma, M.; Meng, W.; Li, Y.; Huang, B. Impact of dual credit policy on new energy vehicles technology innovation with information asymmetry. Appl. Energy 2023, 332, 120524. [Google Scholar] [CrossRef]
  24. Li, B.; Chen, Y.; Cao, S. Carrot and stick: Does dual-credit policy promote green innovation in auto firms? J. Clean. Prod. 2023, 403, 136863. [Google Scholar] [CrossRef]
  25. Prospective Economist. An Article Will Explain the Advantages and Disadvantages of the Dual Point Policy on the Development of China’s New Energy Vehicle Industry! Available online: https://baijiahao.baidu.com/s?id=1649503891247096241&wfr=spider&for=pc (accessed on 11 July 2019).
  26. Wang, Y. Comparison of California ZEV Mandate with China’s Dual-Credit Regulation and Its Simulation Result. Available online: https://www.d1ev.com/kol/49713 (accessed on 3 July 2017).
  27. Plantec, Q.; Deval, M.A.; Hooge, S.; Weil, B. Big data as an exploration trigger or problem-solving patch: Design and integration of AI-embedded systems in the automotive industry. Technovation 2023, 124, 102763. [Google Scholar] [CrossRef]
  28. Carlos, L.A.; Francisco, R.; Francisco, V. Impact of digital transformation on the automotive industry. Technol. Forecast. Soc. Change 2021, 162, 120343. [Google Scholar] [CrossRef]
  29. Ou, S.; Hsieh, I.; He, X.; Lin, Z.; Yu, R.; Zhou, Y.; Bouchard, J. China’s vehicle electrification impacts on sales, fuel use, and battery material demand through 2050: Optimizing consumer and industry decisions. iScience 2021, 24, 103375. [Google Scholar] [CrossRef] [PubMed]
  30. He, H.; Li, S.; Wang, S.; Chen, Z.; Zhang, J.; Zhao, J.; Ma, F. Electrification decisions of traditional automakers under the dual-credit policy regime. Transp. Res. Part D Transp. Environ. 2021, 98, 102956. [Google Scholar] [CrossRef]
  31. Zhao, C.; Guo, Q.; Jia, R.; Dong, K.; Wang, K. How does clean energy transition promote original design manufacturers? A three-party evolutionary game analysis. Energy Econ. 2023, 126, 106965. [Google Scholar] [CrossRef]
  32. Tang, J.; Wu, W.; Zhao, D.; Chen, X. Evolutionary Game and Simulation Analysis of Intelligent Connected Vehicle Industry with Cross-Border Collaborative Innovation. IEEE Access 2023, 11, 17721–17730. [Google Scholar] [CrossRef]
  33. Huang, J.; Guo, G.X.; Min, L.; Qin, Y. Research on the Intelligent Transformation and Upgrade Path of China’s Automobile Manufacturing Enterprises from the Perspective of Dynamic Capabilities—Case Study based on 3 Domestic Manufacturing Companies. Sci. Technol. Prog. Policy 2018, 35, 121–129. [Google Scholar] [CrossRef]
  34. Yu, F.; Chen, J. The impact of industrial internet platform on green innovation: Evidence from a quasi-natural experiment. J. Clean. Prod. 2023, 414, 137645. [Google Scholar] [CrossRef]
  35. Wang, X.P.; Zhang, Z.M.; Guo, Z.H.; Su, C.; Sun, L.H. Energy structure transformation in the context of carbon neutralization: Evolutionary game analysis based on inclusive development of coal and clean energy. J. Clean. Prod. 2023, 398, 136626. [Google Scholar] [CrossRef]
  36. Zou, C.; Huang, Y.; Hu, S.; Huang, Z. Government participation in low-carbon technology transfer: An evolutionary game study. Technol. Forecast. Soc. Chang. 2023, 188, 122320. [Google Scholar] [CrossRef]
  37. Tian, T.; Sun, S. Low-carbon transition pathways in the context of carbon-neutral: A quadrilateral evolutionary game analysis. J. Environ. Manag. 2022, 322, 116105. [Google Scholar] [CrossRef]
  38. Wang, J.; Jia, L.; He, P.; Wang, P.; Huang, L. Engaging stakeholders in collaborative control of air pollution: A tripartite evolutionary game of enterprises, public and government. J. Clean. Prod. 2023, 418, 138074. [Google Scholar] [CrossRef]
  39. Wang, W.; Li, J. A tripartite evolutionary game model for the hydrogen fuel cell vehicle industry development under government regulation in China. Fuel 2023, 348, 128223. [Google Scholar] [CrossRef]
  40. Huang, T.F.; Hu, C.H.; He, Q.Y.; Yang, D.X.; He, T.; Fu, Y. A coordination analysis of stakeholder interests on the new subsidy policy of hydrogen fuel cell vehicles in China: From the perspective of the evolutionary game theory. Int. J. Hydrogen Energy 2022, 47, 24493–24510. [Google Scholar] [CrossRef]
  41. Zhao, D.; Ji, S.F.; Wang, H.P.; Jiang, L.W. How do government subsidies promote new energy vehicle diffusion in the complex network context? A three-stage evolutionary game model. Energy 2021, 230, 120899. [Google Scholar] [CrossRef] [PubMed]
  42. Zhou, X.Y.; Li, C.C.; Liu, Y.; Zhao, F.; Feng, G.Z.; Wang, S.Y. Tripartite cooperation evolutionary strategy of industrial Internet platform, developer and enterprise—The role of government subsidies and revenue sharing. Chin. J. Manag. Sci. 2024, 32, 1–14. [Google Scholar]
  43. Zeng, J.; Qian, Y.; Li, J.; Zhang, Y.; Xu, D. Congestion and energy consumption of heterogeneous traffic flow mixed with intelligent connected vehicles and platoons. Phys. A Stat. Mech. Its Appl. 2023, 609, 128331. [Google Scholar] [CrossRef]
  44. Zheng, J.; Zhang, T.; Ma, L.; Wu, Y.; Zhang, W. Vibration warning design for reaction time reduction under the environment of intelligent connected vehicles. Appl. Ergon. 2021, 96, 103490. [Google Scholar] [CrossRef]
  45. Liu, J.; Liao, X.; Dong, J.; Mansoori, A. A neurodynamic approach for nonsmooth optimal power consumption of intelligent and connected vehicles. Neural Netw. 2023, 161, 693–707. [Google Scholar] [CrossRef]
  46. Wang, H.P.; Yan, X.C.; Zhao, D.; Ge, L.J. Research on production-decision of automakers considering consumer’s low-carbon preference under the government reward-penalty mechanism. Syst. Eng.-Theory Pract. 2023, 49, 2669–2684. [Google Scholar] [CrossRef]
  47. Liao, D.; Tan, B. An evolutionary game analysis of new energy vehicles promotion considering carbon tax in post-subsidy era. Energy 2023, 264, 126156. [Google Scholar] [CrossRef]
  48. Hu, L.; Qiu, X. Stability analysis of game models with fixed and stochastic delays. Appl. Math. Comput. 2022, 435, 127473. [Google Scholar] [CrossRef]
  49. Cheng, H.; Meng, X. Multistability and Hopf bifurcation analysis for a three-strategy evolutionary game with environmental feedback and delay. Phys. A Stat. Mech. Its Appl. 2023, 620, 128766. [Google Scholar] [CrossRef]
  50. Krawiec, A.; Szydłowski, M. Economic growth cycles driven by investment delay. Economic Modelling 2017, 67, 175–183. [Google Scholar] [CrossRef]
  51. MIIT. Decision on Amending the “Measures for Parallel Management of Average Fuel Consumption of Passenger Car Enterprises and New Energy Vehicle Credits”. Available online: https://www.miit.gov.cn/xwdt/gxdt/sjdt/art/2020/art_e78f4efb0deb421c9970d7c35abb8afe.html (accessed on 22 June 2020).
  52. Chongqing Chana Automobile Co., Ltd. 2022 Annual Report. Available online: https://www.changan.com.cn/uploads/chan_reportreportfile/700b7118195d571b8e31e9ec03860bfc.pdf (accessed on 24 April 2023).
  53. China Automotive News. Credits Pool “in Place” Trading Market Stabilized Dual Credits Timely Change. Available online: http://www.cnautonews.com/shendu/2023/07/24/detail_20230724358349.html (accessed on 24 July 2023).
  54. Zhao, B.; Ziedonis, R. State governments as financiers of technology startups: Evidence from Michigan’s R&D loan program. Res. Policy 2020, 49, 103926. [Google Scholar] [CrossRef]
  55. Liu, Y.; Chen, K.; Hill, R.V. Delayed premium payment, insurance adoption, and household investment in rural China. Am. J. Agric. Econ. 2020, 102, 1177–1197. [Google Scholar] [CrossRef]
  56. Takeuchi, Y.; Yamamura, T. Stability analysis of the Kaldor model with time delays: Monetary policy and government budget constraint. Nonlinear Anal. Real World Appl. 2004, 5, 277–308. [Google Scholar] [CrossRef]
  57. Kalecki, M. A macrodynamic theory of business cycles. Econometrica 1935, 3, 327–344. [Google Scholar] [CrossRef]
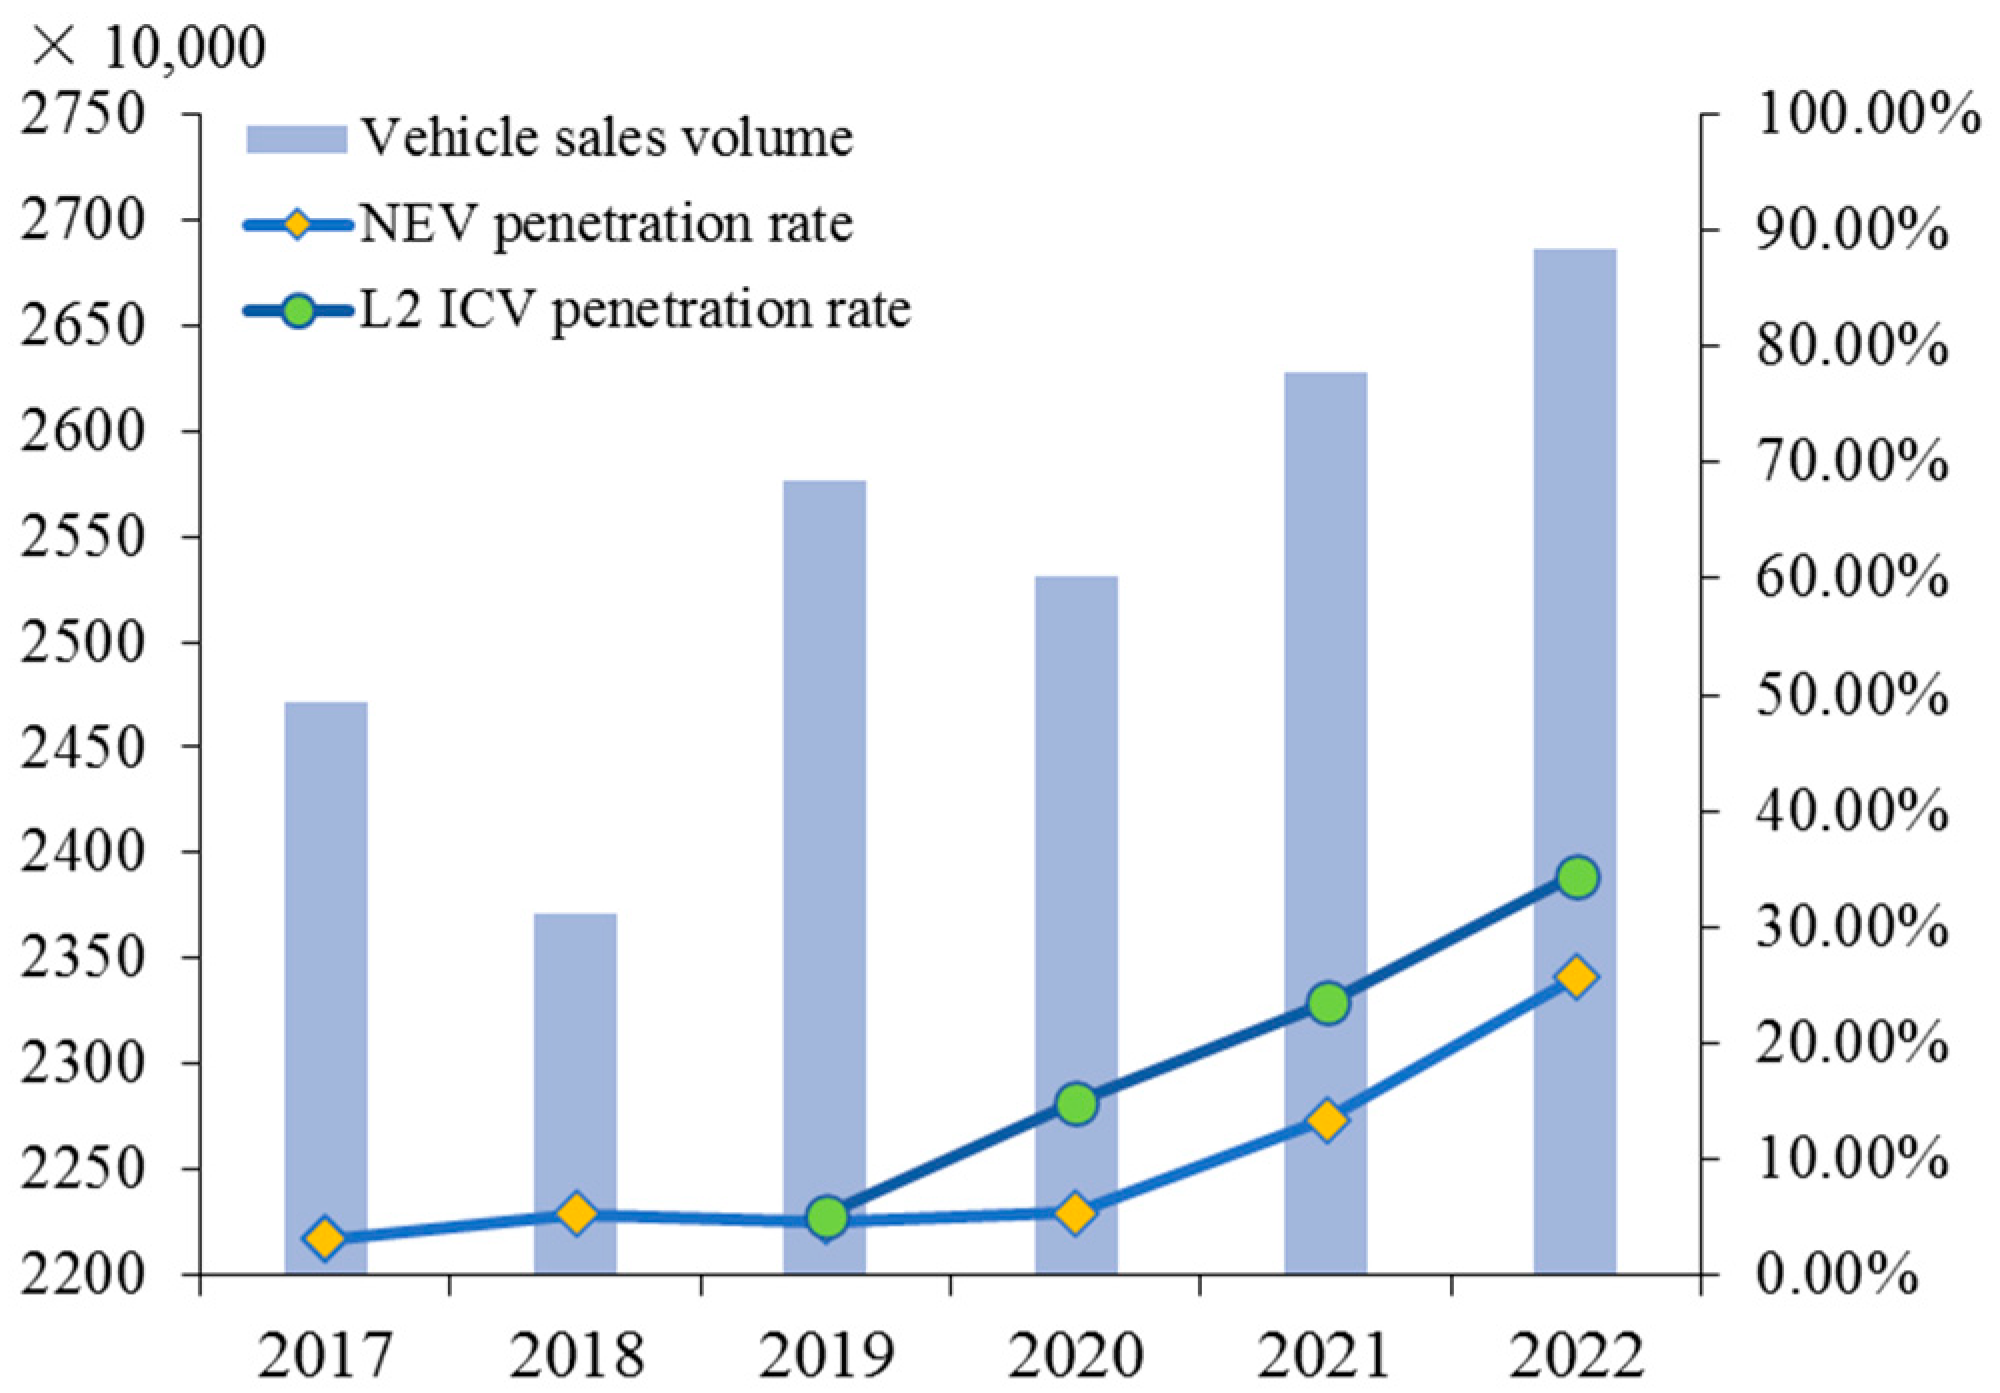
Figure 1. China’s vehicle sales, NEVs penetration rate, and L2 ICVs penetration rate (Sources: China Industrial Information Network).
Systems 12 00319 g001
Figure 2. Relationships between game players.
Systems 12 00319 g002
Figure 3. Phase diagrams for evolution of traditional automobile companies’ strategies.
Systems 12 00319 g003
Figure 4. Phase diagrams for evolution of internet companies’ strategies.
Systems 12 00319 g004
Figure 5. Phase diagrams for evolution of financial institutions’ strategies.
Systems 12 00319 g005
Figure 6. Evolutionary results of the system with different profit-sharing coefficients α . (a) tripartite evolutionary (b) the ideal event.
Systems 12 00319 g006
Figure 7. Evolutionary results of the system with different cost-sharing coefficients θ . (a) tripartite evolutionary (b) the ideal event.
Systems 12 00319 g007
Figure 8. Evolutionary results of the system with different financing amounts B . (a) tripartite evolutionary (b) the ideal event.
Systems 12 00319 g008
Figure 9. Evolutionary results of the system with different regulatory costs c b . (a) tripartite evolutionary (b) the ideal event.
Systems 12 00319 g009
Figure 10. Evolutionary results of the system with different credit trading prices P N E V . (a) tripartite evolutionary (b) the ideal event.
Systems 12 00319 g010
Figure 11. Evolutionary results of the system with different NEV credit accounting coefficients a and b . (a) tripartite evolutionary (b) the ideal event, when PNEV = 0.05 (c) the ideal event, when PNEV = 0.08 (d) the ideal event, when PNEV = 0.1 (e) the ideal event, when PNEV = 0.2.
Systems 12 00319 g011
Figure 12. Evolutionary results of the system with different NEV credit ratio requirements β . (a) tripartite evolutionary (b) the ideal event, when PNEV = 0.05 (c) the ideal event, when PNEV = 0.09 (d) the ideal event, when PNEV = 0.1 (e) the ideal event, when PNEV = 0.2.
Systems 12 00319 g012
Table 1. Model symbols and definitions.
SymbolsDefinitionsSymbolsDefinitions
π i ( π i > 0 ) Initial tripartite profits ( i = 1 , 2 , 3 ) c b ( c b > 0 ) Regulatory cost of financial institutions
P N E V ( P N E V > 0 ) Credit trading price β ( β > 0 ) NEV credit ratio
requirement
a ( a > 0 ) NEV credit accounting
multiplication coefficient
λ G ( λ G > 0 ) CAFC credit coefficient of unit NEV
b ( b > 0 ) NEV credit accounting
additive coefficient
h ( h > 1 ) Credit reward coefficient of ICVs
R ( R > 0 ) Driving range (CLTC) k ( k > 0 ) Innovation profit between traditional automobile companies and internet companies
Δ k 1 ( Δ k 1 > 0 ) Value-added profit of
between traditional
automobile companies and internet companies when financial institutions choose the financing strategy
Δ k 2 ( Δ k 2 > 0 ) Value-added profits of
financial institutions
financing when traditional automobile companies and internet companies choose innovation
α ( 0 < α < 1 ) Profit-sharing coefficient of collaborative innovation θ ( 0 < θ < 1 ) Cost-sharing coefficient of collaborative innovation
r ( 0 < r < 1 ) Financing rate B ( B > 0 ) Financing amount
c 1 ( c 1 > 0 ) Cost of collaborative
innovation when financial institutions choose the
financing strategy
c 2 ( c 2 > 0 ) Cost of collaborative
innovation when financial institutions choose the
non-financing strategy
c e 1 ( c e 1 > 0 ) Innovating cost of
traditional automobile
companies when financial institutions choose the
financing strategy
c e 2 ( c e 2 > 0 ) Innovating cost of
traditional automobile
companies when financial institutions choose the
non-financing strategy
c i 1 ( c i 1 > 0 ) Innovating cost of internet companies when financial institutions choose the
financing strategy
c i 2 ( c i 2 > 0 ) Innovating cost of internet companies when financial institutions choose the
non-financing strategy
L ( L   >   0 ) Penalty for collaborative
innovation
P ( P > 0 ) Success probability of
collaborative innovation
Q 1 ( Q 1 > 0 ) Production of high-end ICVs Q 2 ( Q 2 > 0 ) Production of mid-end ICVs
Q 3 ( Q 3 > 0 ) Production of TFVs x ( 0 x 1 ) Probability of traditional
automobile companies choosing collaborative
innovation strategy
y ( 0 y 1 ) Probability of internet
companies choosing
collaborative innovation strategy
z ( 0 z 1 ) Probability of financial
institutions choosing
financing strategy
Table 2. Payoff matrix for tripartite players.
Traditional
Automobile Companies
Internet
Companies
Financial Institutions
Financing
(z)
Non-Financing
(1 − z)
Collaborative innovation
(x)
Collaborative innovation
(y)
π 1 + h P N E V Q 1 ( a R + b ) + P α k + Δ k 1 θ c 1 + 1 + r B
π 2 + P 1 α k + Δ k 1 1 θ c 1 + 1 + r B
π 3 + Δ k 2 + P 1 + r B c b
π 1 + h P N E V Q 1 ( a R + b ) + P α k θ c 2
π 2 + P 1 α k 1 θ c 2
π 3
Non-
Collaborative innovation (1 − y)
π 1 + P N E V Q 2 ( a R + b ) c e 1 1 + r B + L
π 2 L
π 3 + P 1 + r B c b
π 1 + P N E V Q 2 ( a R + b ) c e 2 + L
π 2 L
π 3
Non-
collaborative innovation (1 − x)
Collaborative innovation
(y)
π 1 P N E V Q 3 ( λ G + β ) L
π 2 c i 1 1 + r B + L
π 3 + P 1 + r B c b
π 1 P N E V Q 3 ( λ G + β ) L
π 2 c i 2 + L
π 3
Non-
collaborative innovation (1 − y)
π 1 P N E V Q 3 ( λ G + β )
π 2
π 3 c b
π 1 P N E V Q 3 ( λ G + β )
π 2
π 3
Table 3. Stability analysis of equilibrium points.
Equilibrium PointsCharacteristic ValuesResult
P 1 ( 0 ,   0 ,   0 ) λ 1 = L c e 2 + P N E V a R + b Q 2 + Q 3 β + λ G λ 2 = c i 2 + L λ 3 = c b ESS
P 2 ( 1 ,   0 ,   0 ) λ 1 = c e 2 P N E V a R + b Q 2 + Q 3 β + λ G L λ 2 = P 1 α k 1 θ c 2 + L λ 3 = P 1 + r B c b Instability point
P 3 ( 0 ,   1 ,   0 ) λ 1 = P α k θ c 2 + L + P N E V h a R + b Q 1 + Q 3 β + λ G λ 2 = c i 2 L λ 3 = P 1 + r B c b Instability point
P 4 ( 0 ,   0 ,   1 ) λ 1 = 1 + r B c e 1 + L + P N E V a R + b Q 2 + Q 3 β + λ G λ 2 = 1 + r B c i 1 + L λ 3 = c b Saddle point
P 5 ( 1 ,   1 ,   0 ) λ 1 = P α k θ c 2 + L + P N E V h b + a R Q 1 + Q 3 β + λ G λ 2 = P 1 α k 1 θ c 2 + L λ 3 = Δ k 2 + P 1 + r B c b Saddle point
P 6 ( 1 ,   0 ,   1 ) λ 1 = 1 + r B + c e 1 L P N E V b + a R Q 2 + Q 3 β + λ G λ 2 = P 1 α k + Δ k 1 1 θ c 1 + 1 + r B + L λ 3 = P 1 + r B c b Saddle point
P 7 ( 0 ,   1 ,   1 ) λ 1 = P α k + Δ k 1 β c 1 + 1 + r B + L + P N E V h b + a R Q 1 + Q 3 β + λ G λ 2 = 1 + r B + c i 1 L λ 3 = P 1 + r B + c b Saddle point
P 8 ( 1 ,   1 ,   1 ) λ 1 = P α k + Δ k 1 θ c 1 + 1 + r B + L + P N E V h b + a R Q 1 + Q 3 β + λ G λ 2 = P 1 α k + Δ k 1 1 θ c 1 + 1 + r B + L λ 3 = Δ k 2 + P 1 + r B c b ESS
Table 4. Initial parameter values.
Parameters Q 1 a L h P N E V c 1 c 2 B r
Initial value10.00340.251.20.1 × 10−41.92.210.047
Unitten
thousand vehicles
-billions-billionsbillionsbillionsbillions-
Parameters Q 2 b R β c b k Δ k 1 Δ k 2 λ G
Initial value30.25300.180.899.632.451.50.5
Unitten
thousand vehicles
-km-billionsbillionsbillionsbillions-
Parameters Q 3 P α θ c e 1 c e 2 c i 1 c i 2
Initial value110.50.50.52.52.82.42.65
Unitten
thousand vehicles
---billionsbillionsbillionsbillions
Disclaimer/Publisher’s Note: The statements, opinions and data contained in all publications are solely those of the individual author(s) and contributor(s) and not of MDPI and/or the editor(s). MDPI and/or the editor(s) disclaim responsibility for any injury to people or property resulting from any ideas, methods, instructions or products referred to in the content.