Article

How to Reshape the Selection Boundaries between Traditional and Digital Supply Chain Finance Based on the Pledge Rate and Default Loss: Two Tripartite Game Models

College of Economics, Sichuan Agricultural University, Chengdu 611130, China
*
Author to whom correspondence should be addressed.
Systems 2024, 12(7), 253; https://doi.org/10.3390/systems12070253
Submission received: 13 June 2024 / Revised: 7 July 2024 / Accepted: 9 July 2024 / Published: 13 July 2024

Abstract

:
The development of digital technologies such as blockchain has provided new possibilities for solving the financing difficulties of small and medium-sized enterprises (SMEs). In order to explore the mutual influence of the participants in the supply chain, this paper constructs two static tripartite game models for traditional and digital supply chain finance, including a small and medium-sized enterprise (SME), a core enterprise (CE), and a financial institution (FI). The conditions for SME, CE, and FI to participate in digital supply chain finance, and the equilibrium strategy (repayment, repayment, loan) after participating in digital supply chain finance, are figured out. It is found that compared with the traditional supply chain, the digital supply chain expands the probability range of repayment for SME and CE by the change of pledge rate and default loss and broadens the probability range of repayment for CE by the change of default loss. Further, compared with the traditional supply chain finance, the greater the pledge rate of digital supply chain finance and the smaller the default loss, the stronger the willingness of the SME and CE to participate in the digital supply chain and the lower the willingness of the FI. After the three parties participate in the digital supply chain, however, the conclusion is the opposite. The smaller the pledge rate and the greater the default loss, the stronger the repayment willingness for the SME and CE and the stronger the loan willingness of the FI. Therefore, it is suggested to find the critical values of pledge rate and default loss and raise these two variables to an appropriate range to encourage all parties to voluntarily and consistently participate in digital supply chain financing.

1. Introduction

Small and medium-sized enterprises (SMEs) play a pivotal role in driving the growth of the national economy and serve as catalysts for promoting its sustainable development [1]. According to the 2018 China SMEs Yearbook, by the end of 2018, there were approximately 48.423 million registered market entities in China, among which the number of SMEs exceeded 44 million, accounting for over 90%. The SMEs, being a pivotal component of the market, make substantial contributions to fiscal tax revenue (accounting for over 50%), GDP growth (exceeding 60%), technological innovation (surpassing 70%), and urban employment generation (more than 80%). Despite China’s extensive efforts in banking reform and implementing financial support policies for SMEs, these entities remain susceptible to financial constraints within the credit market due to information asymmetry, primarily stemming from the lack of transparent hard data (the hard data here refer to objective, easily verifiable and quantifiable data, such as standardized financial statements, production and sales data, etc., while soft data are more dependent on subjective judgment, such as the ability of management, corporate culture, employee morale, etc.) [2,3,4,5]. At the same time, the cost of gathering soft information on SMEs is concurrently high, while the incentives are insufficient. Consequently, financial institutions (FIs) encounter inherent disadvantages when providing financing services for such enterprises [6,7]. On the other hand, in the case of an imperfect business environment and system, the CEs associated with SMEs exert excessive control over the capital of trading partners, thereby impeding the growth of SMEs. According to the Research Report on Corporate Financing and Supply Chain Finance Under the Epidemic conducted by Renmin University of China, China Federation of Logistics and Purchasing, WanInternet and Zhongguancun Fintech Industry Development Alliance in March 2020, “CEs’ unwillingness to cooperate” ranked first among the obstacles causing financial institutions to support SMEs, accounting for 46.1% of the surveyed financial institutions. The cooperation of CEs is crucial in ensuring the integrity and reliability of transactions. Without their involvement, it becomes challenging to guarantee accurate information, leading to potential risks, such as huge bad debts associated with SMEs [8]. In order to address this issue, the emergence of supply chain finance business transcended the limitations of traditional credit evaluation mechanisms by leveraging the credit endorsement from CEs and fostering a collaborative relationship between upstream and downstream entities in the supply chain. Since the 18th National Congress of the Communist Party of China (CPC), the government has implemented policies aimed at alleviating financing difficulties faced by real enterprises. These measures include fostering the development of regional small and medium-sized banks, rural banks, small loan companies, guarantee institutions, commercial factoring companies, etc., as well as establishing multi-level capital markets and promoting supply chain finance [9].
The loan technology utilizing supply chain finance services for SMEs financing was initially proposed in [10]. The success of supply chain finance hinges on the participation of CEs to facilitate financing activities, with FIs utilizing their credit rating as a benchmark for credit evaluation, while SMEs leverage their creditworthiness as a guarantee for credit applications. CEs play an indispensable role in driving the effectiveness of supply chain finance [11]. The CE plays a pivotal role in the entire supply chain, and it is crucial to devise contractual arrangements that facilitate risk transfer and sharing between the CEs and non-CEs. This will effectively reduce financing costs and default risks within the supply chain, while simultaneously enhancing turnover rates and overall efficiency of the supply chain [12].
The empirical findings demonstrated that supply chain finance could effectively mitigate information asymmetry pre- and post-transaction in comparison to traditional bank loans by acquiring transactional information and leveraging relationship embeddedness and business closure and implementing a combination of result control and process control after the loan disbursement, thereby enhancing financing accessibility for SMEs [13]. However, based on past practices, supply chain finance encounters certain bottlenecks in alleviating the financing constraints faced by SMEs. One of the most prominent challenges lies in banks’ difficulty in verifying the authenticity of information [14,15], which subsequently escalates operational costs for banks [16] while also creating opportunities for SMEs to default or engage in fraudulent activities [17]. In the conventional supply chain finance model, due to the lack of fragmentation and limited standardization of CEs’ certificates, the credit endorsement from CEs to their direct suppliers or dealers is at the first level. Consequently, a significant number of enterprises at the second, third, and even terminal levels are unable to access support from CEs [18]. The 2021 Central Economic Work Conference stressed that “we should give more prominence to serving the real economy”, “innovate the service model of supply chain finance”, and guide capital to “move from the virtual to the real” [19].
With the rapid advancement of mobile Internet, Internet of Things (IoT), blockchain technology, cloud computing, and intelligent solutions, enterprise digital transformation has emerged as a prominent topic in recent years. Consequently, supply chain digitalization has become an indispensable trend for the development of supply chains [20,21]. New digital supply chain finance models, such as fintech and digital service-based supply chain finance, can mitigate the financing challenges faced by real enterprises [22]. These models also facilitate the credit provision of banks to SMEs [23,24,25], reduce transaction costs, enhance investment and financing efficiency for businesses, minimize financial risks arising from information asymmetry, address issues related to excessive charges [26,27], and foster technological innovation among suppliers. The promotion of innovative supply chain finance and the enhancement of industrial and supply chain modernization are imperative, as stated in the 14th Five-Year Plan for National Economic and Social Development of the People’s Republic of China and the Outline of Long-term Goals for 2035. At the 18th group study session of the Political Bureau of the CPC Central Committee in October 2019, President Xi Jinping emphasized the imperative to expedite the advancement of block-chain technology and foster industrial innovation and development, while establishing a robust ecosystem for the block-chain industry. The blockchain utilizes its distributed ledger to facilitate data sharing [28], ensure trusted data and real transactions through information disclosure [29], transfer CE credit via token ecology [30], and automatically control risks with smart contracts [31].
Taking accounts receivable financing as an example, an SME transfers the credit certificate (accounts receivable for SMEs) issued by a CE to a bank in exchange for financing. If the borrower fails to repay the loan by the due date, the bank can collect payment from the CE through their accounts receivable. In such cases, if the CE chooses to default on its obligations, it will result in significant losses for the lending institution, which may lead them to reconsider future loans. Therefore, based on existing research, this paper aims to employ game theory to analyze the advantages of each stakeholder in block-chain-enabled supply chain finance. It seeks to elucidate the mechanism for each subject to participate in digital supply chain finance and the conditions for all three parties to achieve the optimal strategy, thereby fostering the advancement of digital supply chain finance and addressing the financing challenges faced by SMEs. Additionally, numerous varieties of numerical simulations are provided to further investigate the impact of pledge rate and default loss on the decision-making process of each individual and validate the outcomes derived from theoretical analysis.
The contributions of this study can be summarized as follows. First, this paper provides a theoretical basis for China’s digital supply chain finance practice. Since blockchain has been upgraded to a national strategy and incorporated into the “new infrastructure”, China’s blockchain technology and application have made initial achievements. Especially in the field of supply chain finance, it has given birth to a new model of digital supply chain finance. Relevant industrial practice has come to the front of academic research, and scientific theories are urgently needed to reveal the internal logic of blockchain technology driving digital economy and financial innovation. However, the existing literature on blockchain mainly focuses on crypto currency [32,33,34,35,36] or the Internet of Things [37,38,39], and the research on digital supply chain finance needs to be further studied. This paper systematically examines the theoretical mechanism behind the practice of digital supply chain finance in China, which is not only a summary of the regularity of the existing practice, but also a forward-looking judgment of the future development trend.
Second, the existing literature mostly analyzes the optimization of business models and the guiding role of blockchain from the macro or micro perspective, mainly from the perspective of exogenous factors such as government macro industrial activities, financial regulation, and banking structure [7,40]. A small amount of literature has examined the impact of the number of enterprises participating in the digital supply chain, the quality of up-chain information, and the operation and maintenance cost on the participation of banks and SMEs in the digital supply chain from the micro perspective [17,41]. However, there are few studies on the sensitivity analysis of the endogenous factors such as pledge rate and default loss on the selection of system strategies. Starting from the two core factors that affect the system strategy selection, namely pledge rate and default loss, this paper conducts sensitivity analysis on the system strategy selection from the micro level and then obtains the sensitivity of the system strategy selection to the influencing factors.
Third, the existing literature mostly conducts qualitative analysis in theory and generally believes that the digital supply chain is superior to the traditional supply chain, without using mathematical or scientific methods to verify the specific aspects in which the digital supply chain is superior to the traditional supply chain [21,22]. Starting from the action path of the digital supply chain on system strategy selection, this paper finds that digital supply chain finance may not necessarily be superior to traditional supply chain finance. Through game analysis and numerical simulation, this paper identifies the thresholds for digital supply chain finance to be superior to traditional supply chain finance, making up for this gap.
Finally, most of the existing literature generalizes all SMEs and CEs, without considering how different enterprises respond to different supply chain financing modes [41,42]. From a dialectical perspective, this paper demonstrates the scope of application of the digital supply chain and that not all SMEs or CEs are suitable to participate in the digital supply chain and finds that enterprises with different default risks should choose different supply chain modes.
The remainder of this paper proceeds as follows. The comprehensive literature review is combed in Section 2. Section 3 presents the theoretical model in detail, and Section 4 provides several simulation analyses to validate the proposed model. Section 5 concludes with insightful findings and provides valuable suggestions.

2. Literature Review

The paper examines the dualistic dynamics between SMEs and CEs in both traditional and digital supply chain finance models, with a particular focus on accounts receivable financing. Considering that the lending decisions of FIs directly impact the income of each individual, we propose to participate in the tripartite game of FIs based on this premise.

2.1. Research on Traditional Supply Chain Finance

Conceptually, supply chain finance is a credit and financing system established by banks and other FIs, which is based on the supply chain network with CEs as the focal point. It relies between upstream and downstream partners in the supply chain, encompassing business flow, logistics, information flow, capital flow, and other fundamental elements [12,43]. The primary objective of supply chain finance is not to directly provide credit support to CEs, but rather to facilitate node credit for a multitude of upstream and downstream SMEs through the involvement of CEs. This effectively assists SMEs in mitigating operational and financial risks [44].
In terms of advantages, unlike big data credit analysis, FIs now assess the creditworthiness of SMEs based on factors such as their adherence to agreements, transaction history, position in the supply chain, market capabilities, and efficiency of supply chain management for CEs [45]. The key advantage of supply chain finance lies in its ability to enable real-time monitoring, control, and optimization of cash flow resources [46].
Empirical evidence suggests that the implementation of supply chain finance has partial constraints faced by SMEs, as indicated by their cash–cash flow sensitivity [47]. Researchers employed embedded multi-case study and empirical research methods, revealing supply chain and post-event information asymmetry, thereby enhancing the financing accessibility of SMEs [13].
In terms of the deficiencies in supply chain finance, someone posited that there exist four primary challenges within the current landscape including inadequate digitalization across the entire chain, optimization requirements for data quality, incapacity to transfer credit of CEs, and inability to achieve automated payment and settlement processes [1]. In terms of the degree of informatization across the entire supply chain, it is argued that trust-related challenges such as information asymmetry and transaction information forgery, along with data leakage and operational risks in the internet environment, currently serve as common bottlenecks impeding the development of supply chain finance business [48]. In terms of data quality, it is discovered that banks often have a limited understanding of the background of enterprises involved in supply chain transactions, making it challenging to accurately assess the real value of goods used by these enterprises as collateral [17]. The phenomenon of banks becoming increasingly reluctant to lend is exacerbated by the inherent characteristics of SMEs, such as operational instability, inadequate financial information, and lack of collateral [49].
In terms of credit transitivity among CEs, it is suggested that due to short operation lifespan and unstable operations of SMEs, banks can only extend credit to first-level suppliers or dealers associated with CEs [50]. In terms of payment and settlement processes, it is asserted that since internet-based supply chain finance involves multiple participants from different regions, FIs frequently face difficulties verifying transactions through on-site investigations across various regions. This leads to significant inconveniences for FIs due to lengthy financing times and high formalities [15].
In brief, the current challenges in supply chain finance primarily encompass the following aspects. Firstly, CEs are unable to extend credit to supplier enterprises beyond the second tier due to a multitude of complex end-of-chain entities resulting in suboptimal levels of digitization and high monitoring costs. Secondly, information asymmetry poses difficulties for FIs seeking lending criteria through digital channels. Thirdly, inadequate supervision coupled with outdated technology management leads to security concerns such as data tampering. In September 2020, the People’s Bank of China and other eight ministries and commissions issued Opinions on Standardizing and Developing Supply Chain Finance to Support the Stable Circulation, Optimization and Upgrading of Supply Chain Industry Chain, which made it clear that scenarioizing, ecology, online, and digitalization are the development direction of supply chain finance in the future.

2.2. Research on Digital Supply Chain Finance

Blockchain technology is the most disruptive force in the fourth industrial revolution [51] and has been successfully implemented in areas such as supply chain finance, logistics, and other related fields. The Evaluation Rules for Financial Applications of Block-chain Technology issued by the People’s Bank of China define blockchain as a collaborative technical system maintained by multiple parties, utilizing cryptography to ensure secure transmission and access, while enabling consistent data storage, tamper resistance, and non-repudiation. Its core advantage is decentralization, which lies in its utilization of data encryption, time stamping, distributed consensus, and economic incentives. These enable peer-to-peer transactions to be realized within distributed systems where nodes lack trust in each other and are reluctant to rely on third parties. Consequently, it addresses issues such as high costs, low, and data security that exist within centralized institutions (specifically CEs and FIs). Furthermore, it provides solutions for problems like information asymmetry and financing marginalized institutions (namely SMEs) [52].
Functionally speaking, in terms of the level of informatization, it is discovered that blockchain technology has the potential to dismantle information barriers both between and within organizations [53]. The blockchain timestamps data blocks to generate heterogeneous data and facilitates automatic conversion of property rights between different entities through smart contracts during circulation. The utilization of hash algorithms ensures the security of the data [54]. The blockchain technology is inherently “immutable” as each subsequent block in the chain includes the hash value or signature of the previous block. Once a transaction is recorded within a block, it becomes tamper-proof, and any alteration would render the stored signature in subsequent blocks invalid [55]. Therefore, it is crucial to disclose accurate information in order to prevent manipulation of enterprise data, fraudulent activities, and other ethical risks [17].
In terms of data quality, several researchers revealed that the blockchain technology’s distributed database has the capability to integrate and store multiple isolated databases, which are jointly maintained by various parties, thereby enhancing data quality [56].
In terms of credit transmission, it is argued that the blockchain information traced the trust of banks and other FIs in establishing connections with multi-level suppliers or dealers, particularly small, medium, and micro enterprises [57]. In the trustless environment facilitated by asymmetric encryption technology, all nodes operate in accordance with identical transaction rules through the identification of each other’s public keys. This ensures equal participation of all parties in sharing and node verification, collectively maintaining system operation [58], and shifting reliance from relational trust to system-based trust grounded in cognition [59]. By simplifying and weakening intermediaries [22], the realization of multi-party co-governance can be facilitated, enabling innovation in the business process trust mechanism, reduction of risks and costs associated with opportunistic behavior in cooperation, effective resolution of principal–agent problems [60], enhancement of operational efficiency within the supply chain network [61], as well as the achievement of autonomy and mutual trust among participants [62].
In terms of payment and settlement, it has been highlighted that those smart contracts, as an essential embedded program on the blockchain, possess the capability to automatically execute contracts upon meeting predetermined thresholds. This not only offers innovative solutions for traditional financial asset issuance, trading, creation, and management, but also plays a significant role in asset management, contract administration, regulatory law enforcement, and other related affairs [52].
In terms of the mechanism of influence, it is discovered from a banking perspective that banks could derive greater benefits by engaging in digital supply chain finance only when the number of on-chain enterprises reaches a certain threshold and the quality of on-chain information attains a specific standard [17]. The study employed evolutionary game analysis to ascertain that digital supply chain finance outperforms traditional supply chain finance solely in cases where the underlying assets of SMEs exhibit poor quality [41].
Based on the aforementioned research, the advantages of blockchain in enabling supply chain finance can be summarized as follows. Firstly, decentralization and consensus mechanisms facilitate the transmission of CEs’ credit to SMEs at the end of the supply chain. Secondly, the information-sharing platform constructed by a distributed ledger effectively mitigates issues related to information and opacity. Lastly, the smart contract’s automatic execution clause function efficiently resolves problems associated with low efficiency, accuracy, and data tampering in traditional manual verification of financial voucher information. This significantly enhances risk control capabilities and financing security levels. By the end of 2020, several pilot projects focusing on small and micro financial innovation applications, such as block-chain-based online financing services for SMEs, were successfully implemented, yielding promising initial results in alleviating the financing challenges faced by SMEs.

2.3. Exploring Supply Chain Finance through a Game-Theoretic Lens

By constructing a game model between CEs and SMEs within the traditional supply chain finance framework, it was concluded that an increase in receivables leads to higher default risk for SMEs. Additionally, greater supply chain income results in increased default loss, thereby facilitating the achievement of a trustworthy equilibrium [1]. The game model does not incorporate blockchain and banks, and the impact of blockchain on supply chain finance is only analyzed qualitatively. The study developed an evolutionary game model to analyze the impact of technology on SMEs and FIs. The findings show that the implementation of blockchain not only mitigated for FIs but also addressed the financing challenges [42]. However, it is worth noting that the decision-making dynamics of CEs were not taken into consideration in this analysis. By constructing a dynamic game model based on the inventory mortgage framework, it is discovered that banks are more suitable for engaging in digital supply chain finance only when there is a sufficient number of up-chain enterprises (i.e., digital supply chain participants) and when the information flow among these enterprises reaches a certain level. However, this analysis does not allow optimal decision making of CEs and SMEs, nor does it consider the game model under the receivable’s framework [17].
To summarize, the current game models in both domestic and international contexts primarily revolve around the interaction between SMEs and CEs within the traditional supply chain, without blockchain. And the majority of research on blockchain technology in supply chain finance is with limited analysis on the impact of a game-theoretic perspective on decision making and income for each participant in the supply. In addition, the game models constructed by existing research primarily focus on theoretically explaining the behavioral decision-making mechanism and significance of each participant in the supply chain, without conducting empirical testing or numerical simulation to validate relevant theoretical hypotheses.
Building upon an analysis of the limitations inherent in the traditional supply chain financing model and the potential of blockchain technology to enable supply chain finance, this study develops two tripartite game models for both accounts receivable-based traditional supply chain finance and digital supply chain finance. Furthermore, through comparative analysis, it theoretically demonstrates that incorporating is a dominant strategy for all stakeholders involved. Last, many numerical simulations are provided to validate the dynamic impact path as well as the incentive and constraint mechanism equilibrium.

3. Model Formulation

This section considers the accounts receivable financing model and uses game theory to construct a tripartite game between an SME, a CE, and an FI under traditional supply chain finance and digital supply chain finance models, delving into the impact of block-chain technology on game equilibrium.

3.1. Traditional Supply Chain Finance Model

3.1.1. Problem Description

The traditional supply chain finance is composed of an SME, a CE, and an FI, breaking through the constraints of traditional credit review mechanisms and opening up new ideas for SMEs’ financing [1]. The accounts receivable financing model is a major one in supply chain finance. In this model, the SME, acting as the supplier, initially establishes an agreement and executes a contract with the CE, serving as manufacturer. The supplier provides goods to the CE, who subsequently issues receivables notes. Upon making payment commitments to the FI, the CE transfers these receivables notes to the institution while the supplier applies for loans based on them. It is required that the loan term should not exceed the age of accounts receivable. After conducting a thorough assessment of the creditworthiness of both the CE and SME, the FI will extend credit loans to the SME. Subsequently, at the maturity of the loans, the CE will settle their outstanding debts with the FI. The earnings of the SME, as well as the CE, are contingent upon the willingness of the FI to provide loans. Conversely, the lending decisions made by the FI depend on the trustworthiness of the SME and the repayment behavior of the CE. To address this interdependence, this article proposes a tripartite game involving the aforementioned economies.

3.1.2. Assumptions of the Model

When the supplier has financing needs, the FI can opt for either providing a loan or not. If the FI decides to issue loans, the SME can choose the behavior strategy of repayment or default. When the SME chooses to repay, the temporarily unpaid receivables can be reinvested by the CE to generate profits. Referring to the existing literature, all of them have incorporated this concept into their analysis of the accounts receivable financing model [17,41]. The CE can temporarily defer debt repayment after an SME obtains a loan with its bills, allowing the CE to invest the deferred debt and generate income. We define this investment rate of return as β 1 . Similar to reference [63], β 2 denotes the reproduction rate of return subsequent to SMEs acquiring financing. On the contrary, if the SME defaults, the CE is required to take responsibility for the bank accounts. At this juncture, the CE has the option to repay or default. The round of the game has concluded, and the FI now has the option to offer re-loan services to the SME based on their observations. Therefore, the default of the SME can lead to cessation of cooperation with CE and withdrawal of lending by FI. In addition, the failure of CE to repay may have a negative impact on their credit history and subsequent cooperation with FI. In other words, both SME and CE will incur default costs.
By introducing relevant parameters as shown in Table 1 and then making the following assumptions, a tripartite game model is constructed to analyze the stability of strategies and equilibrium points for each economy as well as the influence relationship of each element.
The following preconditions need to be proposed in advance in order to further construct the payoff matrix and explore the game process.
Precondition 1. 
According to the theory of bounded rationality, it is assumed that the three participants in the game have the characteristic of bounded rationality, pursuing utility or income maximization under incomplete information conditions. This does not require proof, but merely lays the groundwork for further analysis.
Precondition 2. 
According to the prevailing trend in recent literature [1,17,41,42,54], we posit that the strategic landscape of SME is  θ = ( θ 1 , θ 2 ) = (repayment, default), and θ 1 is chosen with probability r 1 and θ 2 with probability ( 1 r 1 ) , r 1 [ 0 , 1 ] ; the strategic landscape of CEs is λ = ( λ 1 , λ 2 ) = (repayment, default), and λ 1 is chosen with probability r 2 and λ 2 with probability ( 1 r 2 ) , r 2 [ 0 , 1 ] ; the strategic landscape of finance institutions is ω = ( ω 1 , ω 2 ) = (loan, non-loan), and ω 1 is chosen with probability r 3 and ω 2 with probability ( 1 r 3 ) , r 3 [ 0 , 1 ] .
Precondition 3. 
Referring to the practice in the literature in recent years [64], we assume that  A is the income that can be obtained from the supply chain, which is derived when both the SME and CE maintain the contractual agreement. β is the rate of loss, which means when the SME fails to repay, the CE is unable to fully reap the benefits derived from delayed account payments due to the bank’s collection efforts.
Precondition 4. 
The recent literature on quality consistently emphasizes the following points [1,17,41,42,54,63]. In general, once the supply chain is established, it facilitates long-term cooperation and transactions between the CE and SME. This stability ensures that they prioritize sustained returns over aligning with the hypothesis of repeated games. This will be demonstrated in Section 3.1.3. Therefore, if the SME violates the contract in a game, it will incur losses due to breach, namely  M > 0 . Similarly, the default loss of the CE will also persist, namely N > 0 . The default loss is greater than 0, which is evidently apparent.
Precondition 5. 
The financing scheme cannot be realized when banks choose not to lend, regardless of whether it is made by the CE or SME. For the purpose of research convenience, we designate the payoffs of the three parties at this time as  ( 0 , 0 , 0 ) . The absence of r 3 in the Table 2 and Table 3 is predicated on the assumption that earnings and cash flows are exclusively generated through bank lending activities. Consequently, the utilization of the bank loan as a basis for constructing the payoff matrix proves more expedient in facilitating subsequent game process derivation. It can be understood as assuming that in the first game the bank chooses to lend.

3.1.3. Construction of the Model

According to the aforementioned definition of each variable and the practice of quality literature in recent years [1,17,41,42,54,63], the income matrix of the three parties under traditional accounts receivable financing mode can be derived as shown in Table 2.
Table 2. Income matrix in traditional accounts receivable financing.
EarningsSME
Repayment   r 1 Default   1 r 1
CERepayment
r 2
α R ( β 0 β 3 ) + A 1 C
R β 1 + A
α R ( β 2 β 0 ) + A
α R β 3 + A 1 C
( 1 β ) R β 1
α R ( 1 + β 2 ) M
Default
1 r 2
α R ( β 0 β 3 ) + A 1 C
R ( 1 + β 1 ) N
α R ( β 2 β 0 ) R
α R ( 1 + β 3 ) C
R ( 1 + β 1 ) N
α R ( 1 + β 2 ) R M
The repeated game in Precondition 4 necessitates further elucidation and substantiation. The matrix in Table 2 represents the returns of the FI, CE, and SME from top to bottom, where it is assumed that the FI opts for issuing loans when the SME initially seeks funding, which is consistent with Precondition 5.
π 1 and π 2 are denoted as the anticipated income of the FI obtained by the SME’s repayment and default strategies, respectively. According the income matrix as Table 2, they can be calculated as follows.
π 1 = r 2 [ α R ( β 0 β 3 ) + A 1 C ] + ( 1 r 2 ) [ α R ( β 0 β 3 ) + A 1 C ] , π 2 = r 2 ( α R β 3 + A 1 C ) + ( 1 r 2 ) [ α R ( 1 + β 3 ) C ] .
π 1 π 2 = α R + ( α R + A 1 ) ( 1 r 2 ) > 0 , which is universally true, implying that the anticipated return of the FI will be higher when the SME chooses to repay. Based on it, the FI is inclined to provide loans, thereby facilitating a sustainable game.
π 3 = r 1 [ α R ( β 0 β 3 ) + A 1 C ] + ( 1 r 1 ) [ α R β 3 + A 1 C ] , which is denoted as the expected income of the FI when the CE fulfills its repayment obligation. On the contrary, the expected income of the FI is expressed as
π 4 = r 1 [ α R ( β 0 β 3 ) + A 1 C ] + ( 1 r 1 ) [ C α R ( 1 + β 3 ) ]
It is obvious that π 3 π 4 = ( α R + A 1 ) ( 1 r 1 ) > 0 ,demonstrating that the anticipated return of FI will be higher when the CE repays. It also encourages the FI to provide loans. Precondition 4 is verified.

3.2. Digital Supply Chain Finance Model

3.2.1. Problem Description

In the traditional supply chain finance model, the absence of a standardized platform for SMEs, CEs, and FIs during the accounts receivable financing process leads to significant challenges in verifying data authenticity. This results in severe information asymmetry and hampers the effective implementation of incentive and punishment mechanisms that could otherwise ensure SMEs’ trustworthiness. Consequently, FIs have to consume substantial information costs incurred with each transaction. The characteristics of blockchain have the potential to overcome the aforementioned bottlenecks. Figure 1 illustrates the primary business process in the context of connecting to a blockchain platform, taking accounts receivable business as an example. This study examines the impact of blockchain on decision-making for SMEs and FIs through a game model within the scenario of supply chain finance enabled by blockchain.

3.2.2. Assumptions of the Model

On the one hand, the supply chain mode empowered by blockchain can bring comprehensive improvements to supply chain finance, enhance business processing efficiency, and reduce overall operational costs [56]. On the other hand, according to actor network theory, for financial service institutions acting as trust intermediaries, it is crucial to comprehend the enabling mechanism of digital technology to establish a solid foundation for trust relationship construction. Additionally, they have elucidated the role of blockchain technology in effectively resolving issues related to trust crisis [64]. If an SME is reliable, it is supposed that the blockchain supply chain finance platform brings additional income to enterprises through reduced transaction costs and improved efficiency, which amounts to D . Additionally, the step-by-step transmission of credit brings further income to a CE, amounting to d . In this scenario, the following parameters are added based on Table 1, as shown in Table 3.
Table 3. Description of the parameters in digital supply chain finance.
ItemsSymbol
Default loss of SME (Digital) M 1
Default loss of CE (Digital) N 1
All business additional income (Digital) D
CE additional income (Digital) d
Cost associated with introducing blockchain and fee for platform maintenance m
Bank’s pledged interest rate α
Precondition 6. 
Based on the mechanism and principles of a blockchain platform [53,57], as well as recent articles’ findings [1,41,42,54,63], we also propose that after being connected to the block-chain platform, the bad credit of the SME or CE due to default will be recorded, which cannot be tampered with. As a result, the reputation of the CE will be affected, making it difficult for the SME to regain trust in financing. Therefore, the punishment is more severe than that in traditional supply chain models, namely  M 1 > M , N 1 > N .
Precondition 7. 
Based on the cost-saving benefits of blockchain technology, in the block-chain technology environment, information sharing is highly prevalent, reducing costs associated with obtaining information. This facilitates the establishment of effective consensus among parties involved and enhances the accuracy of information. Consequently, banks are relieved from the need to incur additional supervision and transaction costs in advance, but the cost associated with introducing blockchain and the fee for platform maintenance should be made, namely  C m . The cost is divided equally among the three parties.
Precondition 8. 
The existing literature assumes that the pledge rate provided by banks will increase after their participation in the digital supply chain [1,17,41], which is also applied in this paper. After the integration of blockchain, the transparency of information pertaining to the SME will be enhanced, thereby leading to an increase in the loan pledge rate by FI towards such enterprises, namely α > α .

3.2.3. Construction of the Model

According to the aforementioned definition of each variable, the income matrix of the three parties under the conventional supply chain finance accounts receivable financing model can be derived as shown in Table 4. The matrix below represents the returns of the FI, CE, and SME from top to bottom.

3.3. Comparison of the Returns with and without Blockchain

3.3.1. Taking SME as Object

  • Income expectation of SME in traditional model
The anticipated payoff for the SME by maintaining their commitment is denoted by E 11 , while the expected payoff resulting from defaulting is represented as E 12 . The overall average expected payoff is indicated as E 1 . They can be figured out as shown below.
E 11 = r 2 r 3 [ α R ( β 2 β 0 ) + A ] + r 3 ( 1 r 2 ) [ α R ( β 2 β 0 ) R ] + r 2 ( 1 r 3 ) × 0 + ( 1 r 2 ) ( 1 r 3 ) × 0 ,
E 12 = r 2 r 3 [ α R ( 1 + β 2 ) M ] + r 3 ( 1 r 2 ) [ α R ( 1 + β 2 ) R M ] + r 2 ( 1 r 3 ) × 0 + ( 1 r 2 ) ( 1 r 3 ) × 0 ,
E 1 = r 1 E 11 + ( 1 r 1 ) E 12 = r 3 [ r 1 ( r 2 A α R β 0 α R + M ) + r 2 R + α R + α R β 2 R M ] .
  • Income expectation of SME in digital model
The anticipated payoff for the SME by maintaining their commitment is denoted by E 21 , while the expected payoff resulting from defaulting is represented as E 22 . Moreover, E 2 is denoted as the overall average expected payoff. The detailed calculation can be seen below.
E 21 = r 2 r 3 [ α R ( β 2 β 0 ) + A + D m 3 ] + r 3 ( 1 r 2 ) [ α R ( β 2 β 0 ) R m 3 ] + r 2 ( 1 r 3 ) × 0 + ( 1 r 2 ) ( 1 r 3 ) × 0 ,
E 22 = r 2 r 3 [ α R ( 1 + β 2 ) M 1 m 3 ] + r 3 ( 1 r 2 ) [ α R ( 1 + β 2 ) R M 1 m 3 ] + r 2 ( 1 r 3 ) × 0 + ( 1 r 2 ) ( 1 r 3 ) × 0 ,
E 2 = r 1 E 21 + ( 1 r 1 ) E 22 = r 3 [ r 1 ( r 2 A + r 2 D α R β 0 α R + M 1 ) + r 2 R + α R + α R β 2 R M 1 m 3 ] .
  • The essential prerequisites for the SME to engage in digital supply chain finance
According to Precondition 1, the rational choice for the SME is to participate in digital supply chain finance if the advantages it offers surpass those of traditional supply chain finance, namely E 2 > E 1 , which can be simplified to inequality (1) as below.
r 1 [ ( α R α R ) ( 1 + β 0 ) + M 1 M + r 2 D ] > M 1 M ( 1 + β 2 ) ( α R α R ) + m 3  
When (1) is satisfied, the optimal strategy for the SME is to participate in digital supply chain finance. The preliminary analysis suggests that the greater the repayment probability of CE is, the smaller the difference in default losses, and the greater the difference in pledge rates, the greater the probability that the inequality is upheld—in other words, the more willing the SME is to participate in the digital supply chain.

3.3.2. Taking CE as Object

  • Income expectation of CE in traditional model
The anticipated payoff for the CE by maintaining their commitment is denoted by E 31 , while the expected payoff resulting from default is represented as E 32 . The overall average expected payoff is indicated as E 3 .
E 31 = r 1 r 3 ( R β 1 + A ) + ( 1 r 1 ) r 3 ( 1 β ) R β 1 + r 1 ( 1 r 3 ) × 0 + ( 1 r 1 ) ( 1 r 3 ) × 0 ,
E 32 = r 1 r 3 [ R ( 1 + β 1 ) N ] + ( 1 r 1 ) r 3 [ R ( 1 + β 1 ) N ] + r 1 ( 1 r 3 ) × 0 + ( 1 r 1 ) ( 1 r 3 ) × 0 ,
E 3 = r 2 E 31 + ( 1 r 2 ) E 32 = r 3 [ r 2 ( r 1 A + r 1 β R β 1 β R β 1 R + N ) + R N + R β 1 ) .
  • Income expectation of CE in digital model
The anticipated payoff for the CE by maintaining their commitment is denoted E 41 , while the expected payoff resulting from default is represented as E 42 . The overall average expected payoff is indicated as E 4 .
E 41 = r 1 r 3 ( R β 1 + A + D + d m 3 ) + ( 1 r 1 ) r 3 [ ( 1 β ) R β 1 + d m 3 ] + r 1 ( 1 r 3 ) × 0 + ( 1 r 1 ) ( 1 r 3 ) × 0 ,
E 42 = r 1 r 3 [ R ( 1 + β 1 ) N 1 m 3 ] + ( 1 r 1 ) r 3 [ R ( 1 + β 1 ) N 1 m 3 ] + r 1 ( 1 r 3 ) × 0 + ( 1 r 1 ) ( 1 r 3 ) × 0 ,
E 4 = r 2 E 41 + ( 1 r 2 ) E 42 = r 3 [ r 2 ( r 1 A + r 1 D + r 1 β R β 1 β R β 1 + d R + N 1 ) + R + R β 1 N 1 m 3 ] .
  • Essential prerequisites for CE to engage in digital supply chain finance
According to Precondition 1, the rational choice for the CE is to participate in digital supply chain finance if E 4 > E 3 , which can be simplified to inequality (2).
  r 2 > N 1 N + m 3 r 1 D + d + N 1 N  
When (2) is satisfied, the optimal strategy for the CE is to participate in digital supply chain finance. The preliminary analysis suggests that the greater the probability of trustworthiness of the SME, and the smaller the difference in default losses, the greater the probability that the inequality is upheld—in other words, the more willing the CE are to participate in the digital supply chain.

3.3.3. Taking FI as Object

  • Income expectation of FI in traditional model
The anticipated yield from lending for the FI is E 51 , the anticipated yield from abstaining from lending is E 52 , and the average anticipated yield is E 5 .
E 51 = r 1 r 2 [ α R ( β 0 β 3 ) + A 1 C ] + r 1 ( 1 r 2 ) [ α R ( β 0 β 3 ) + A 1 C ] + r 2 ( 1 r 1 ) [ α R β 3 + A 1 C ] + ( 1 r 1 ) ( 1 r 2 ) [ α R ( 1 + β 3 ) C ] ,
E 52 = 0 ,
E 5 = r 3 E 51 + ( 1 r 3 ) E 52 = r 3 [ ( r 1 + r 2 r 1 r 2 ) ( A 1 + α R ) + α R ( β 0 r 1 β 3 1 ) C ]
Let E 5 = f ( r 1 , r 2 , r 3 ) , then
f ( r 1 , r 2 , r 3 ) r 1 = r 3 [ ( 1 r 2 ) ( A 1 + α R ) + α R β 0 ] > 0
is always true. It shows that the higher the probability of SME’s trustworthiness, the greater the profitability for FI, thus increasing their willingness to provide loans. Moreover,
f ( r 1 , r 2 , r 3 ) r 2 = r 3 ( 1 r 1 ) ( A 1 + α R ) > 0
is always true, showing that the higher the probability of the CE’s repayment, the greater the profitability for FI, thus increasing their willingness to provide loans. In addition, the equation
f ( r 1 , r 2 , r 3 ) r 3 = ( r 1 + r 2 r 1 r 2 ) ( A 1 + α R ) + α R ( β 0 r 1 β 3 1 ) C
holds. It shows that the FI must ensure that the derivative function is greater than 0 in order for its choice of loan to positively impact its own earnings. Therefore, the critical conditions for the FI to choose loans in traditional supply chain finance are identified as shown below.
( r 1 + r 2 r 1 r 2 ) ( A 1 + α R ) + α R ( β 0 r 1 β 3 1 ) C > 0
  • Income expectation of FI in digital model
The anticipated yield from lending for the FI is E 61 , the anticipated yield from not lending is E 62 , and the average anticipated yield is E 6 .
E 61 = r 1 r 2 [ α R ( β 0 β 3 ) + A 1 m 3 ] + r 1 ( 1 r 2 ) [ α R ( β 0 β 3 ) + A 1 m 3 ] + r 2 ( 1 r 1 ) [ α R β 3 + A 1 m 3 ] + ( 1 r 1 ) ( 1 r 2 ) [ α R ( 1 + β 3 ) m 3 ] ,
E 62 = 0 ,
E 6 = r 3 E 61 + ( 1 r 3 ) E 62 = r 3 [ ( r 1 + r 2 r 1 r 2 ) ( A 1 + α R ) + α R ( β 0 r 1 β 3 1 ) m 3 ] .
Let E 6 = g ( r 1 , r 2 , r 3 ) , then
g ( r 1 , r 2 , r 3 ) r 1 = r 3 [ ( 1 r 2 ) ( A 1 + α R ) + α R β 0 ] > 0
is always true, demonstrating that the higher the probability of SME’s trustworthiness, the greater the FI’s profitability, thus increasing their willingness to provide loans. Moreover,
g ( r 1 , r 2 , r 3 ) r 2 = r 3 ( 1 r 1 ) ( A 1 + α R ) > 0
is always true. It shows that the higher the probability of the CE’s repayment, the greater the profitability for the FI, thus increasing their willingness to provide loans. And furthermore, the equation
g ( r 1 , r 2 , r 3 ) r 3 = ( r 1 + r 2 r 1 r 2 ) ( A 1 + α R ) + α R ( β 0 r 1 β 3 1 ) m 3
holds. This indicates that the FI must make sure that the derivative function is greater than 0 in order for their loan choices to have a positive impact on their own returns. Therefore, the key conditions for the FI to choose loans in traditional supply chain finance are as follows.
( r 1 + r 2 r 1 r 2 ) ( A 1 + α R ) + α R ( β 0 r 1 β 3 1 ) m 3 > 0
Comparing (3) with (4), according to Precondition 8, it can be observed that since the pledge rate in the digital supply chain is generally greater than that in the traditional supply chain, and m / 3 < C is generally true (from Precondition 7), therefore, under the same probability of trustworthiness and repayment, the loan probability of FI under digital supply chain finance is higher.
  • Essential prerequisites for FI to engage in digital supply chain finance
The rational choice for the FI is to participate in digital supply chain finance if E 6 > E 5 , that is
E 6 E 5 = r 3 [ ( α R α R ) ( r 1 + r 2 r 1 r 2 + β 0 r 1 β 3 1 ) + C m 3 ] > 0
When Equation (5) is established, according to the premise of bounded rationality (Precondition 1), it is obviously a dominant strategy for the FI to engage in the digital supply chain.
{ α α > m 3 C R ( r 1 + r 2 r 1 r 2 + β 0 r 1 β 3 1 ) , r 1 + r 2 r 1 r 2 + β 0 r 1 β 3 1 > 0 α α < m 3 C R ( r 1 + r 2 r 1 r 2 + β 0 r 1 β 3 1 ) , r 1 + r 2 r 1 r 2 + β 0 r 1 β 3 1 < 0

4. Simulation Analysis

The Shuangliantong platform, launched in October 2018, is a pioneering financial service platform for supply chain SMEs that leverages blockchain technology in China. It has successfully established a groundbreaking “blockchain + supply chain” finance model. In order to intuitively observe the game decision-making process of SMEs, CEs, and FIs in the supply chain under the blockchain empowerment, and verify the enabling effect of blockchain derived from the model theory on supply chain finance and SME financing, this part takes the supply chain financial chain composed of an SME supplier and a CE manufacturer on the Shuangliantong platform as an example to carry out numerical simulation. Based on the fact that the numerical values cannot contradict the actual situation and the Preconditions, we set the initial parameters as shown in Table 5. For example, M 1 is greater than M and N 1 is greater than N , satisfying Precondition 4 and 6; C is greater than m , so Precondition 7 is satisfied; α is greater than α , in accordance with Precondition 8.

4.1. Static Game Analysis of Complete Information between SME and CE

4.1.1. Traditional Supply Chain Finance Mode

  • Conditional mixed strategy
Firstly, as both the SME and CE lack knowledge of each other’s decisions prior to making their own, the interaction between them can be characterized as a static game with complete information. Suppose that in the first game, the FI chooses to loan (Precondition 5). From E 1 = r 3 [ r 1 ( r 2 A α R β 0 α R + M ) + r 2 R + α R + α R β 2 R M ] , we know that when r 2 A α R β 0 α R + M > 0 , namely r 2 > ( α R β 0 + α R M ) / A holds. In order to maximize E 1 , r 1 should be kept as small as possible. But r 1 cannot be less than zero, so we have r 1 = 0 . Lastly, when r 2 A α R β 0 α R + M = 0 , r 3 ( r 2 R + α R + α R β 2 R M ) is independent of r 1 , so r 1 can take any value, namely r 1 = [ 0 , 1 ] . Here, r 1 = [ 0 , 1 ] means that r 1 can take any value between 0 and 1(including 0 and 1).
Therefore, the conditional mixed strategy of the SME can be summarized as follows.
  r 1 = { 1 [ 0 , 1 ] 0 r 2 > ( α R β 0 + α R M ) / A r 2 = ( α R β 0 + α R M ) / A r 2 < ( α R β 0 + α R M ) / A
From E 3 = r 3 [ r 2 ( r 1 A + r 1 β R β 1 β R β 1 R + N ) + R N + R β 1 ) , we can know that the conditional mixed strategy of the CE can be summarized as follows.
r 2 = { 1 [ 0 , 1 ] 0 r 1 > ( β R β 1 + R N ) / ( A + β R β 1 ) r 1 = ( β R β 1 + R N ) / ( A + β R β 1 ) r 1 < ( β R β 1 + R N ) / ( A + β R β 1 )  
  • Mixed strategies and Nash equilibrium
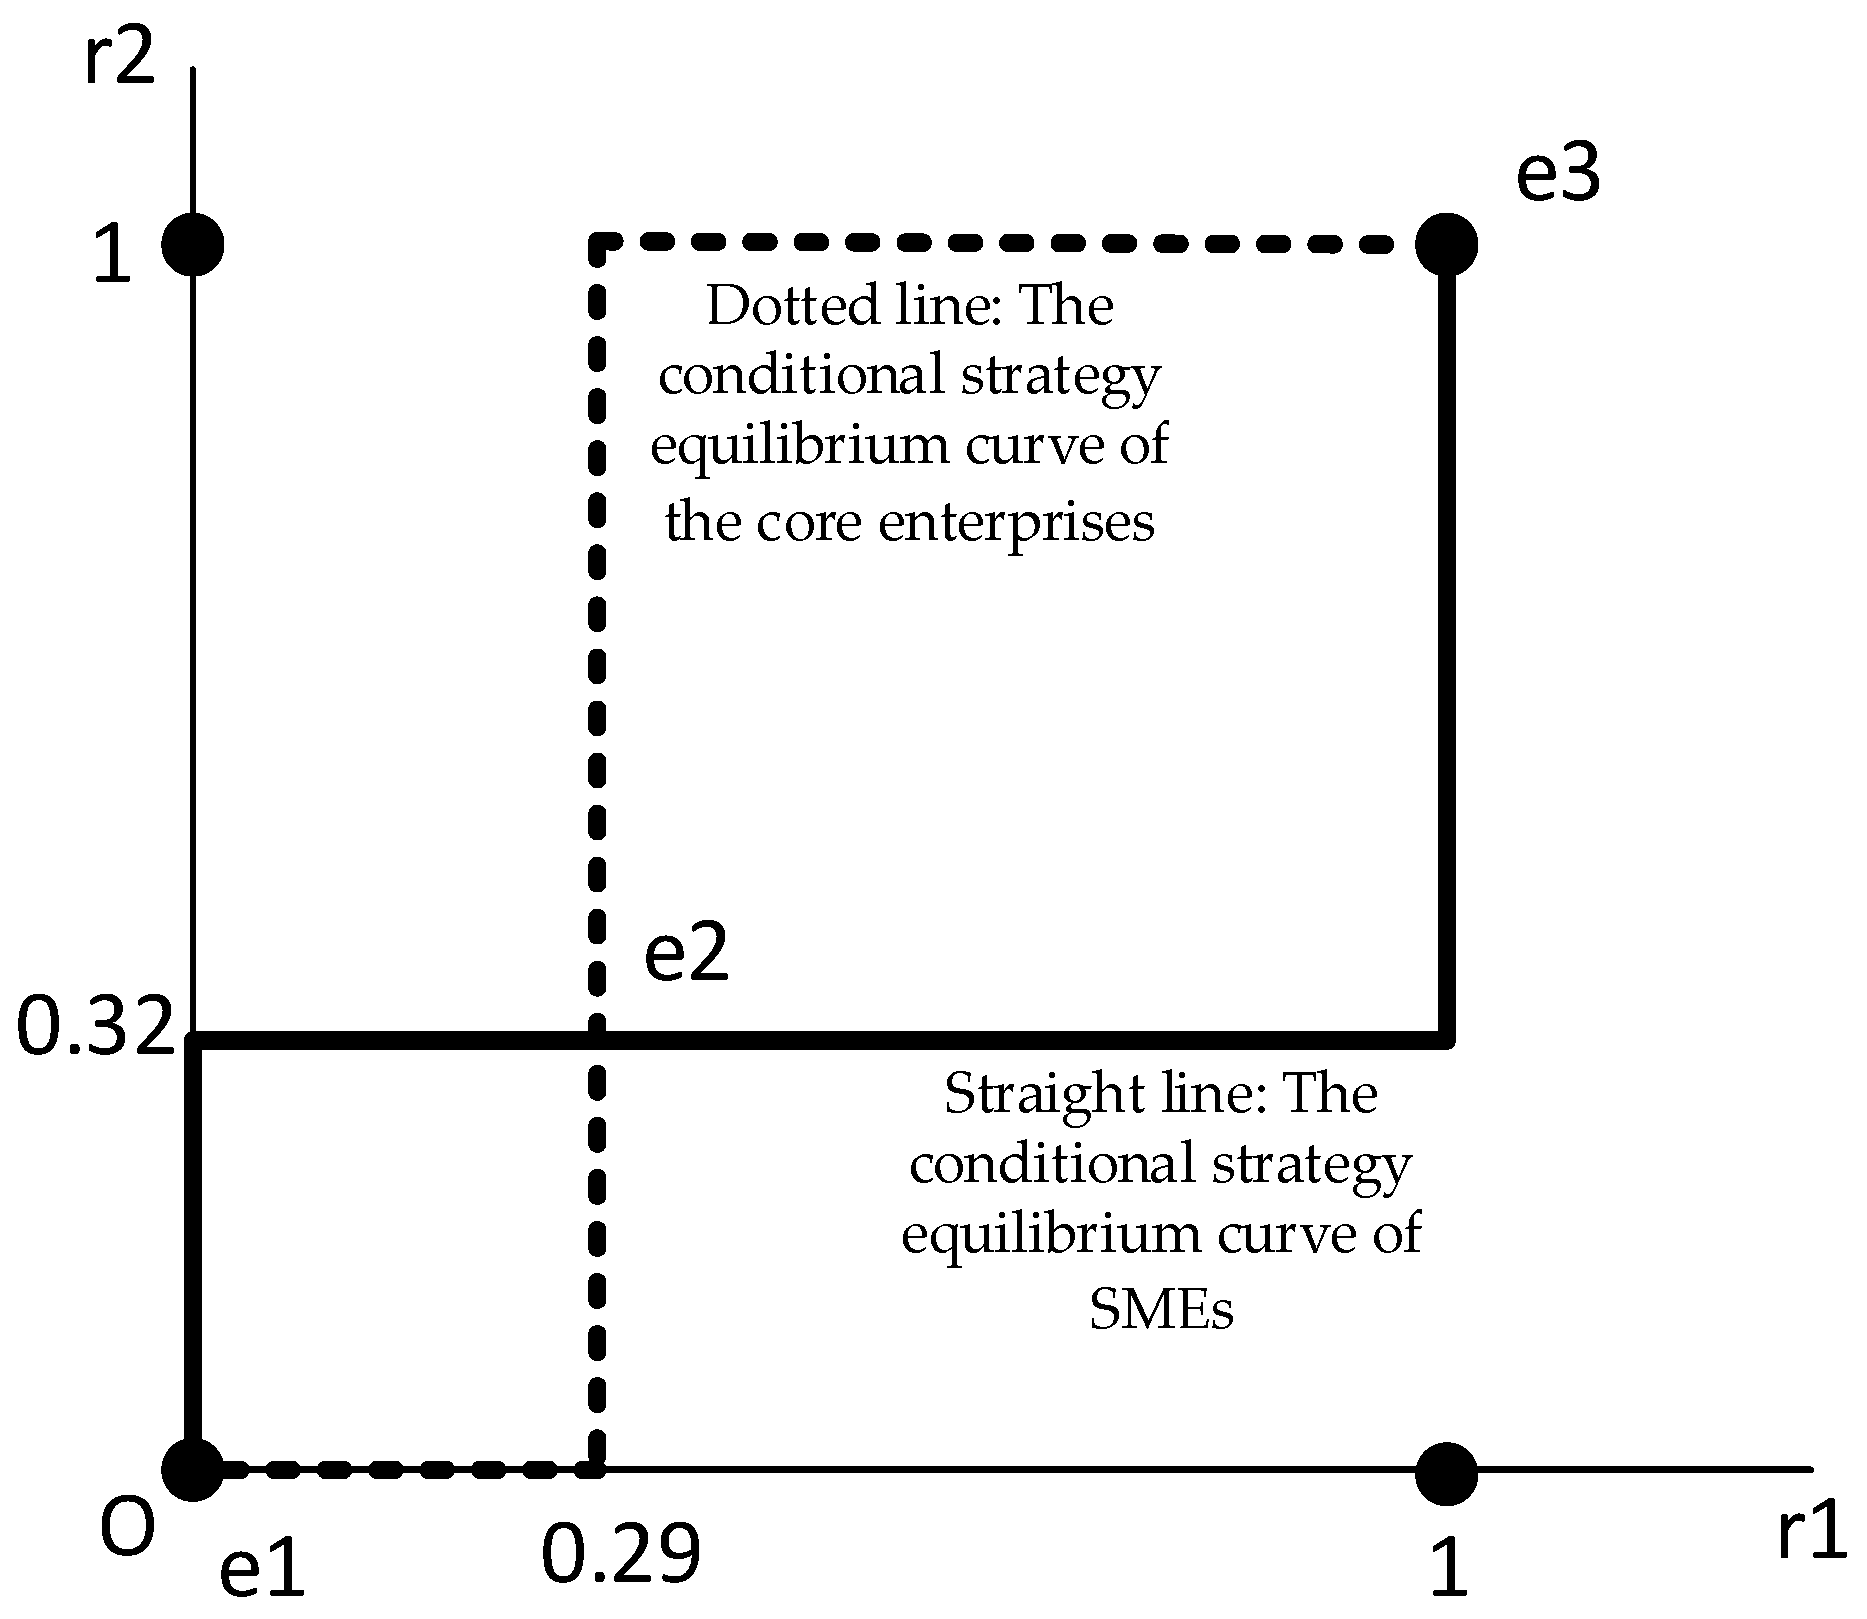
With the parameter settings in Table 5, we can further determine the Nash equilibrium of mixed strategies, as shown in Figure 2.
In the Figure 2, the horizontal and vertical axes correspond to the probabilities r 1 and r 2 , respectively. The straight line represents the SME, while the dotted line represents the CE. The two curves intersect at three points, specifically the origin, point e 2 , and e 3 . Firstly, the origin implies that both r 1 and r 2 are equal to 0, and the Nash equilibrium of mixed strategies can be expressed as ( ( r 1 , 1 r 1 ) , ( r 2 , 1 r 2 ) ) = ( ( 0 , 1 ) , ( 0 , 1 ) ) , which happens to be the pure strategy combination (default, default). Secondly, point e 3 indicates that both r 1 and r 2 are equal to 1; therefore, the Nash equilibrium of mixed strategies can be expressed as ( ( r 1 , 1 r 1 ) , ( r 2 , 1 r 2 ) ) = ( ( 1 , 0 ) , ( 1 , 0 ) ) . It happens to be the pure strategy combination (repayment, repayment). Lastly, point e 2 represents that the game reaches equilibrium when the SME chooses mixed strategy (0.8, 0.2) and the CE chooses mixed strategy (0.48, 0.52). That is to say, the CE opts for repayment when the credit probability of the SME exceeds 0.8 , whereas the SME will definitely choose to maintain faith when the repayment probability of CE surpasses 0.48 .

4.1.2. Digital Supply Chain Finance Mode

  • Conditional mixed strategy
From E 2 = r 3 [ r 1 ( r 2 A + r 2 D α R β 0 α R + M 1 ) + r 2 R + α R + α R β 2 R M 1 m / 3 ] , we can know that the conditional mixed strategy of the SME can be summarized as follows.
r 1 = { 1 [ 0 , 1 ] 0 r 2 > ( α R β 0 + α R M 1 ) / ( A + D ) r 2 = ( α R β 0 + α R M 1 ) / ( A + D ) r 2 < ( α R β 0 + α R M 1 ) / ( A + D )
From E 4 = r 3 [ r 2 ( r 1 A + r 1 D + r 1 β R β 1 β R β 1 + d R + N 1 ) + R + R β 1 N 1 m / 3 ] , we can know that the conditional mixed strategy of the CE can be summarized as follows.
  r 2 = { 1 [ 0 , 1 ] 0 r 1 > ( β R β 1 + R N 1 d ) / ( A + D + β R β 1 ) r 1 = ( β R β 1 + R N 1 d ) / ( A + D + β R β 1 ) r 1 < ( β R β 1 + R N 1 d ) / ( A + D + β R β 1 )
  • Mixed strategies and Nash equilibrium
With the parameter settings in Table 5, we can further determine the Nash equilibrium of mixed strategies in digital supply chain finance, as shown in Figure 3.
The meaning of intersection points and the line is the same as Section 4.1.1 above. The point e 2 implies that the game reaches equilibrium when the SME chooses mixed strategy (0.29,0.71) and the CE chooses mixed strategy (0.32,0.68). That is to say, the CE opts for repayment when the credit probability of the SME exceeds 0.29, whereas the SME will definitely choose to maintain faith when the repayment probability of the CE surpasses 0.32.
Therefore, compared with the traditional supply chain, the digital supply chain significantly enhances the propensity for repayment and trustworthiness of both the CE and SME, and increases the probability of repayment and trustworthiness of both parties. According to the aforementioned analysis, it can be preliminarily inferred that in the traditional supply chain finance, only when both the credit probability of the SME and the repayment probability of the CE are substantial can a game equilibrium (loan, repayment) be attained. In digital supply chain finance, however, an equilibrium (repayment, repayment) can also be achieved even when both the trustworthiness probability of the SME and the repayment probability of the CE are low. This demonstrates the potential of digital supply chain finance in facilitating the alignment of the SME as well as the CE towards the direction of (repayment, repayment).

4.2. Impact of the Pledge Rate

4.2.1. Impact on SME’s Willingness to Participate in the Digital Supply Chain

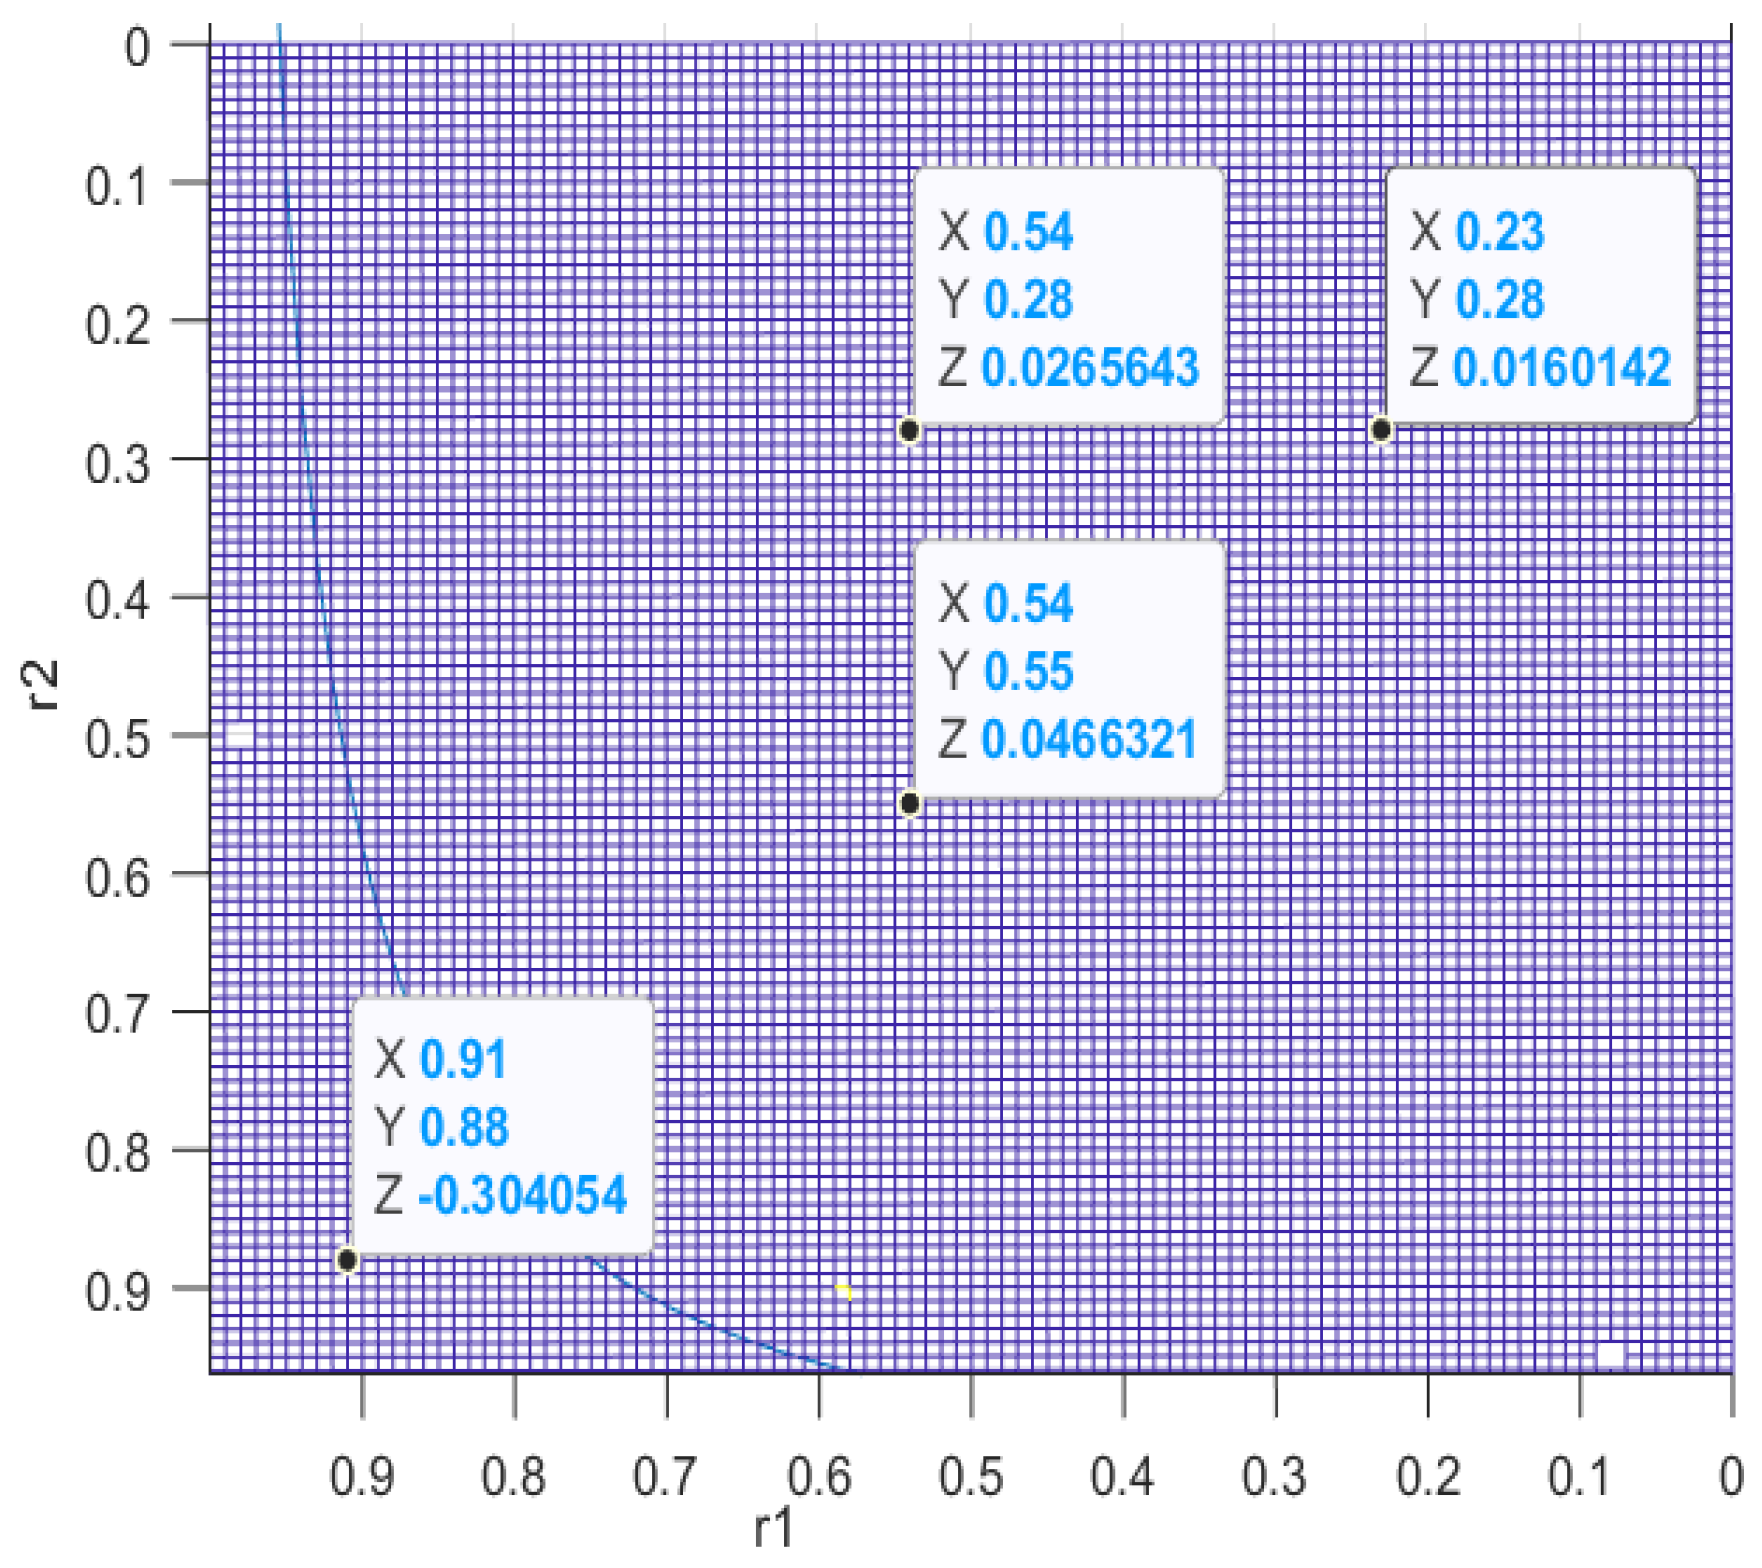
Taking the SME as the analysis object, according to Equation (1), the variables considered include α α , r 1 and r 2 , which denote the disparity in pledge rates between the traditional and digital supply chain, the probability of trustworthiness of the SME, and the likelihood of repayment by the CE, respectively. By substituting the remaining parameters in Table 5, we can derive the inequality below, the critical condition for which is shown in Figure 4.
α α > 2.01 2 r 1 r 1 r 2 11 10.8 r 1
X, Y, and Z represent the repayment probability by the CE, trust-keeping probability from the SME, and the disparity in pledge rates between the traditional and digital supply chain ( r 1 corresponds to Y, and r 2 corresponds to X), respectively. According to the image analysis, when α α > 0 and r 2 remains constant, r 1 will decrease as α α increases. On the one hand, the analysis in Section 4.1 reveals that under digital supply chain finance, the SME and CE can achieve equilibrium even with a low probability of maintaining trust and repayment. On the other hand, from a mathematical perspective, when r 2 remains constant, the greater the value of α α and the smaller the value of r 1 , the higher the likelihood that the inequality holds true. This suggests that the greater the difference in the pledge rate, the greater the probability of the SME participating in digital supply chain finance.
In general, the pledge rate of digital supply chain finance tends to be higher compared to that of traditional supply chain finance. Now we consider a specific scenario, where the pledge rate of digital supply chain finance is lower than that of traditional supply chain finance, namely α α < 0 . When r 2 remains unchanged, the increase of | α α | will lead to an increase in r 1 . This finding is consistent with the conclusion obtained in Section 4.1, that is, in the traditional supply chain, only when the probability of the SME being trustworthy is large can the SME and CE reach the equilibrium. Therefore, the SME will choose to participate in traditional supply chain finance when α α < 0 . The repayment probability of CE is 0.82, for instance, when the difference of pledge rate is about 0.075, the trustworthiness probability of the SME amounts to 0.59. And when the difference of pledge rate is about 0.16, the trustworthiness probability of the SME amounts to 0.24, which is in line with the above conclusions. The verification can also be conducted when the disparity in pledge rate is below 0.
Therefore, it can be further inferred from the aforementioned analysis that when the repayment probability of the CE is certain, and when the pledge rate under the digital supply chain is greater than that of the traditional supply chain and the difference is larger, the stronger the willingness of the SME to participate in digital supply chain finance is, and the equilibrium point (repayment, repayment) is easier to be satisfied. Therefore, from the analysis in Section 3.3.3, it can be seen that the FI exhibits a greater inclination towards opting for loans. This demonstrates that it is a wise move for the FI to increase their pledge rate in digital supply chain finance.

4.2.2. Impact on FI’s Willingness to Participate in the Digital Supply Chain

Taking the FI as the analysis object, according to Equation (5), the variables considered include α α , r 1 , and r 2 , which means the disparity in the pledge rate between the traditional and digital supply chain, the probability of trustworthiness of the SME, and the likelihood of repayment by the CE, respectively. By substituting the remaining parameters in Table 5, we can derive the inequality below. Meanwhile, the critical condition is shown in Figure 5.
{ α α > 9 1000 ( 1.08 r 1 + r 2 r 1 r 2 1.03 ) , 1.08 r 1 + r 2 r 1 r 2 1.03 > 0 α α < 9 1000 ( 1.08 r 1 + r 2 r 1 r 2 1.03 ) , 1.08 r 1 + r 2 r 1 r 2 1.03 < 0
X, Y, and Z denote, respectively, the repayment probability about the CE, trust-keeping probability about the SME, and the disparity in the pledge rate between the traditional and digital supply chain ( r 1 corresponds to Y, and r 2 corresponds to X. To ensure the image’s rigor and aesthetic appeal, α α is omitted without impeding the analysis). According to the image, the solid line represents 1.08 r 1 + r 2 r 1 r 2 1.03 = 0 , the left side of the solid line represents 1.08 r 1 + r 2 r 1 r 2 1.03 > 0 , and the right side of the solid line represents 1.08 r 1 + r 2 r 1 r 2 1.03 < 0 . On the one hand, the special case of α α < 0 will occur when the SME exhibits a high level of trustworthiness and when the repayment probability of the CE is also high, indicating their position to the left of the solid line. During this period, the SME and CE will opt for the traditional supply chain finance to achieve a balanced strategy, while FI naturally aligns with this choice, in accordance with the findings of Section 4.1 and Section 4.2.1. On the contrary, when the trustworthiness probability of the SME and the repayment probability of the CE are on the right side of the solid line, it is the general situation, α α > 0 . At this time, the SME and CE will opt for the digital supply chain finance to achieve a balanced strategy. For the FI, the closer it is to the solid line, the higher their likelihood of participating in traditional supply chain finance. Therefore, for the FI, the difference in pledge rate has the opposite effect to that of the SME, that is, when the pledge rate of the digital supply chain is greater than that of the traditional supply chain and the difference is smaller, the FI is more willing to participate in the digital supply chain.

4.2.3. Impact of the Pledge Rate on SME’s Willingness to Keep Loyalty in Traditional and Digital Supply Chains

Taking the SME as the analysis object, according to Equations (6) and (8), the variables considered include the probability of loyalty r 1 and the pledge rate. By substituting the remaining parameters in Table 5, we can derive the inequality below and its critical condition. When the expression is equal, its function image is simulated, as shown in Figure 6.
  r 1 = { 1 , r 2 > 10.8 α 6 1 , r 2 > 5.5 α 4  
In the digital supply chain, the condition for r 2   >   5.4 α 4 to be established is that the pledge rate is located to the left of its solid line. According to this, the smaller the pledge rate is, the more likely it is for the inequality to persist and for the SME to uphold their commitments. In the traditional supply chain, when the pledge rate is less than 0.648, the SME will choose to keep faith, while in the digital supply chain, the value is 0.926. Therefore, the probability of the SME keeping loyalty in the digital supply chain will be exceed that in the traditional supply chain by a trapezoidal area. The trapezoid area is approximately calculated to be 0.2777, leading to the presumption that SME is expected to exhibit a 27.77% higher probability of keeping loyalty in the digital supply chain compared to the traditional one. Therefore, due to the advantages of digital supply chain financial information, such as complete sharing, the range of the pledge rate can be expanded, which means the high pledge rate will also promote the credibility of the SME.

4.2.4. Impact of the Pledge Rate on FI’s Willingness to Loan in Traditional and Digital Supply Chains

Taking the FI as the analysis object, according to Equations (3) and (4), the variables considered include the probability of royalty r 1 , the probability of repayment r 2 and the pledge rate. We can obtain the inequality and its critical condition.
  { α > 10 50 ( r 1 + r 2 r 1 r 2 ) 1000 ( 1.08 r 1 + r 2 r 1 r 2 1.03 ) , 1.08 r 1 + r 2 r 1 r 2 1.03 > 0 α < 1 50 ( r 1 + r 2 r 1 r 2 ) 1000 ( 1.08 r 1 + r 2 r 1 r 2 1.03 ) , 1.08 r 1 + r 2 r 1 r 2 1.03 < 0  
According to the analysis in Section 4.2.2, the FI will opt for traditional supply chain finance when 1.08 r 1 + r 2 r 1 r 2 1.03 > 0 , whereas they will choose to engage in digital supply chain finance when 1.08 r 1 + r 2 r 1 r 2 1.03 < 0 . Therefore, the function expression is shown in (13), representing the critical conditions of FI loans under the traditional and digital supply chains, respectively. So, in the digital supply chain, the smaller the pledge rate is, the more likely the inequality will hold, and the more likely the FI will choose to loan.

4.3. Impact of the Default Loss

4.3.1. Impact of the Difference in the Default Losses on the Willingness of SME to Engage in the Digital Supply Chain

Taking the SME as the analysis object, according to Equation (1), the variables considered include M 1 M , r 1 , and r 2 , which represent the disparity in default losses of the SME between the traditional and digital supply chain, the probability of trustworthiness of the SME, and the likelihood of repayment by the CE, respectively. By substituting the remaining parameters in Table 5, we can derive inequality (14). Its critical condition is shown in Figure 7.
M 1 M < 2190 + 1000 r 1 r 2 2160 r 1 1 r 1
The meaning of X, Y are the same as in Section 4.2.1 and Z represents the disparity in default losses of the SME between the traditional and digital supply chain ( r 1 corresponds to Y, and r 2 corresponds to X). According to the image analysis, when r 2 remains constant, r 1 will decrease as M 1 M decreases. The analysis in Section 4.1 reveals that under digital supply chain finance, the SME and CE can achieve equilibrium even with a low probability of maintaining trust and repayment. The statement indicates that as the difference in default loss decreases, the SME becomes more inclined to participate in digital supply chain finance. The repayment probability of CE is 0.67; for instance, when the difference in default losses of the SME is about 4182, the trustworthiness probability of SME amounts to 0.74. And when the difference in the default losses of the SME is about 2423, the trustworthiness probability of the SME amounts to 0.25, which is in line with the above conclusions.
Therefore, it can be further inferred from the aforementioned analysis that when the repayment probability of the CE is certain, and when the default loss under the digital supply chain is greater than that of the traditional supply chain and the difference is smaller, the stronger the willingness of the SME to participate in digital supply chain finance is, and the equilibrium point (repayment, repayment) is satisfied more easily. Therefore, from the analysis in Section 3.3.3, it can be seen that the FI exhibits a greater inclination towards opting for loans. This shows that the reduction of default loss by the FI in digital supply chain finance is conducive to the participation of the SME in digital supply chain finance.

4.3.2. Impact of the Difference in the Default Losses on the Willingness of CE to Engage in the Digital Supply Chain

Taking CE as the analysis object, according to Equation (2), the variables considered include N 1 N , r 1 , and r 2 . They denote the disparity in default losses of the CE between the traditional supply chain and the digital supply chain, the probability of trustworthiness of the SME, and the likelihood of repayment by the CE, respectively. By substituting the remaining parameters in Table 5, we can derive the inequality below, and its critical condition shown in Figure 8.
N 1 N < r 2 ( 1000 r 1 + 500 ) 10 1 r 2
The meaning of X, Y, Z are the same as Section 4.3.1. According to the image analysis, when r 1 remains constant, r 2 will decrease as N 1 N decreases. The analysis in Section 4.1 reveals that under digital supply chain finance, the SME and CE can achieve equilibrium even with a low probability of maintaining trust and repayment. The statement indicates that as the difference in default loss decreases, the CE becomes more inclined to participate in digital supply chain finance. The repayment probability of the SME is 0.82; for instance, when the difference in the default losses of the CE is about 7413, the trustworthiness probability of the CE amounts to 0.85. And when the difference in the default losses of the CE is about 635, the trustworthiness probability of the CE amounts to 0.33, which is in line with the above conclusions.
Therefore, it can be further inferred from the aforementioned analysis that when the royalty probability of the SME is certain, and when the default loss under the digital supply chain is greater than that of the traditional supply chain and the difference is smaller, the stronger the willingness of the CE to participate in digital supply chain finance is, and the equilibrium point (repayment, repayment) is satisfied more easily. Therefore, from the analysis in Section 3.3.3, it can be seen that the FI exhibits a greater inclination towards opting for loans. This shows that the reduction of default loss by the FI in digital supply chain finance is conducive to the participation of the CE in digital supply chain finance.

4.3.3. Impact of the Default Losses on CE’s Willingness to Keep Repayment in Traditional and Digital Supply Chains

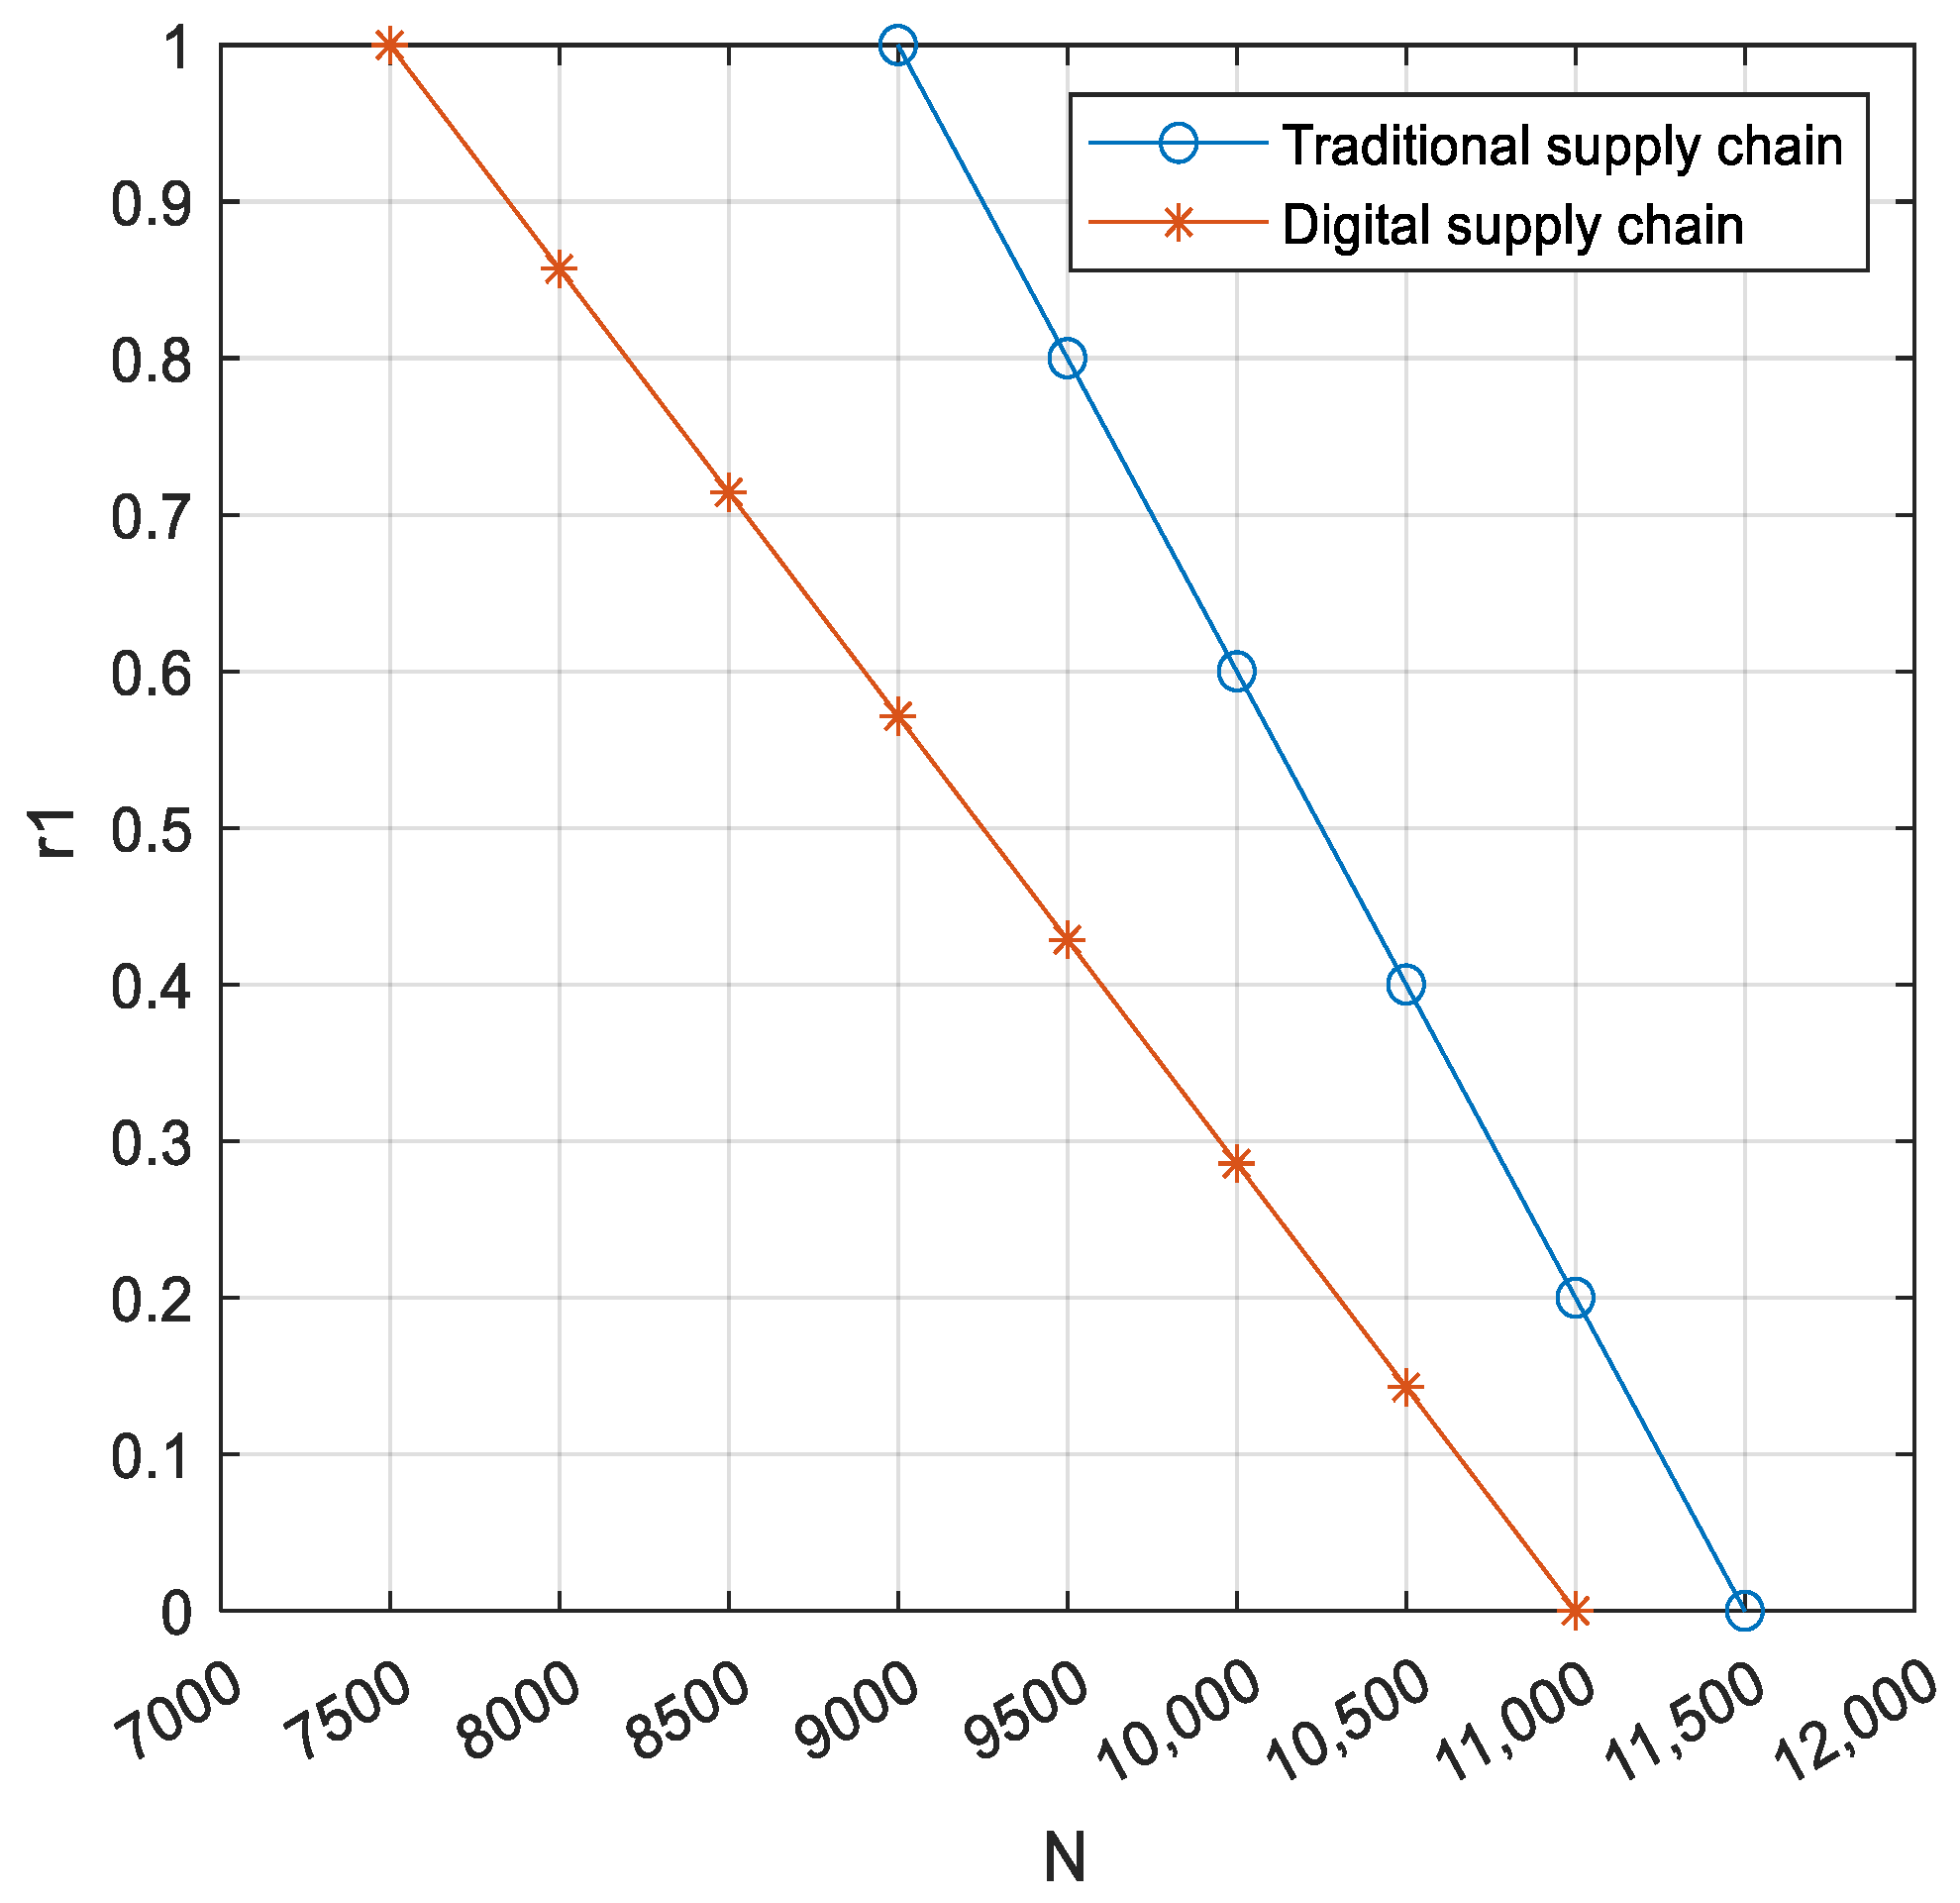
Taking the CE as the analysis object, according to Equations (7) and (9), the variables considered include the probability of repayment r 2 and the pledge rate. We can derive the inequality below and its corresponding critical condition in the following Figure 9.
  r 2 = { 1 , r 1 > 11,500 N 2500 1 , r 1 > 11,000 N 1 3500
In the digital supply chain, the condition for r 1   >   ( 11,000 N 1 ) / 3500 to be established is that the default losses are located to the right of its solid line. According to this, the greater the default loss, the more likely it is for the inequality to persist and for CEs to uphold their commitments. In the traditional supply chain, when the default loss is more than 9500, the CE will choose to keep repayment, while in the digital supply chain, the value is 7500. Therefore, the probability of the CE keeping repayment in the digital supply chain will exceed that in the traditional supply chain by a trapezoidal area. The trapezoid area is approximately calculated to be 0.0976, leading to the presumption that CEs are expected to exhibit a 9.76% higher probability of keeping repayment in the digital supply chain compared to the traditional one. Therefore, due to the advantages of digital supply chain financial information, such as complete sharing, the range of the default loss can be expanded, which means the low default loss will also promote the repayment of the CE. Similarly, it can simulate the impact of default loss on the trustworthiness of the SME as well as the CE, which will not be elaborated upon here.

5. Conclusions and Suggestions

5.1. Conclusions

Based on the financing problems faced by SMEs under the traditional supply chain, this paper firstly analyzes the defects of the traditional supply chain, subsequently proposing to embed blockchain technology in supply chain finance. The theoretical demonstration of blockchain’s potential in facilitating supply chain financing for the SME is based on its inherent characteristics of information transparency and its feature, which is impervious to tampering. And the game models between the SME, CE, and FI are constructed separately in the traditional supply chain and digital supply chain from a gaming perspective. Through comparing the pre- and post-introduction of blockchain in the supply chain, this paper examines the impact of pledge rate and default loss on the participation of the SME, CE, and FI in digital supply chain finance. And this paper additionally examines the impact of pledge rate and default loss on the probability of loyalty of the SME, the probability of repayment of the CE, as well as FI loan performance after implementing blockchain technology. The results of the game are ultimately validated through numerical simulations. The key findings can be summarized as follows.
Firstly, there are certain thresholds for the SME, CE, and FI to participate in the digital supply chain. For the SME, it hopes to obtain more loans under the same pledge, therefore, the high pledge rate of the digital supply chain is conducive to enhancing the willingness of the SME to participate in digital supply chain. The high default loss of the digital supply chain, however, simultaneously diminishes the willingness of the SME to participate in digital supply chain finance. Therefore, a higher pledge rate and lower default loss can enhance the willingness of the SME to participate in digital supply chain finance. Similarly, for the CE, lower default loss can enhance the willingness to participate in digital supply chain finance. For the FI, a lower pledge rate and higher default loss can enhance the willingness to participate in digital supply chain finance. Therefore, there is a game problem when the three parties choose to join the chain.
Secondly, whether in the traditional or digital supply chain, the lower the pledge rate, the higher the default loss, and the stronger the willingness of the SME to choose to keep loyalty; the higher the default loss, the greater the CE’s inclination to select a higher probability of maintaining repayment; the lower the pledge rate, the higher the default loss, and the stronger the bank’s inclination to select the loan. Moreover, the three decisions are interdependent, with a higher likelihood of the SME as well as the CE choosing to maintain loyalty and repayment, leading to an increased probability of FI opting to provide loans. The low pledge rate and high default loss, however, hinder the participation in the digital supply chain of the SME and CE. Therefore, there is another game problem in whether to choose the equilibrium point (repayment, repayment, loan) after the three parties participate in the digital supply chain.
Thirdly, the implementation of digital supply chain finance expands the range of pledge rates, thereby enhancing the probability of loyalty of the SME even under a high pledge rate. That is, assuming the traditional and the digital supply chain are at the same high pledge rate level, the likelihood of default of the SME operating within the traditional supply chain is higher compared to those operating within the digital supply chain.
Fourthly, the implementation of digital supply chain finance expands the range of default losses, thereby enhancing the credibility of the SME and the repayment probability of the CE even under a low default loss. That is, assuming the traditional supply chain and the digital supply chain are at the same low default loss level, the likelihood of the SME’s default operating within the traditional supply chain is higher compared to that operating within the digital supply chain, and the likelihood of non-repayment for a CE operating within the traditional supply chain is higher compared to those operating within the digital supply chain.
Fifthly, the implementation of digital supply chain finance alleviates the financing limitations faced by the SME. In traditional supply chain finance, the game equilibrium point (repayment, repayment) can only be reached when both the credibility of the SME and the repayment probability of the CE are high. In digital supply chain finance, however, the game equilibrium point (repayment, repayment) can be achieved even when both the credibility of the SME and the repayment probability of the CE are low.

5.2. Suggestions

In light of the aforementioned conclusions and the economic implications derived from game analysis equilibrium results, the subsequent countermeasures and recommendations can be proposed to further enhance the facilitative role of blockchain technology in supply chain financing for SMEs.
Firstly, lower the threshold for SMEs and CEs to participate in the digital supply chain. Before participating in the digital supply chain, the government should act as the medium between FIs and enterprises and issue relevant policies to appropriately increase the loan pledge rate of SMEs, appropriately reduce the default loss of digital supply chain, and encourage SMEs and CEs to join the digital chain. After several rounds of games or observation for a period of time, if the trustworthiness of SMEs and the repayment likelihood of CEs meet expectations, regulatory measures may not be necessary. Otherwise, policies can be implemented to decrease the pledge rate to an appropriate range in the digital supply chain, increase default losses to some extent, and include several defaulting enterprises in credit investigations. The CSRC and other relevant departments could issue trading suspension warnings.
Secondly, the government should equip a greater number of professionals with interdisciplinary expertise in computer science and finance. The future of finance will be shaped by the advancements in digital economy and information technology, making it a more technologically driven and scientific field. Digital supply chain finance technology is the product of the collision between finance and technology. The government, as the regulatory authority of the market economy, should possess the capacity to comprehend procedures, analyze data, and engage in continuous learning. The government should promote the establishment of a more robust blockchain data governance system, continuously explore the application of technologies such as blockchain, big data, cloud computing, and artificial intelligence in the field of digital inclusive finance, and enhance the collection of credit investigation data for SMEs.

Author Contributions

Conceptualization, X.S. and Y.W.; methodology, X.S. and Y.W.; software, X.S.; validation, Y.H. and Y.W.; formal analysis, X.S., Y.H., Y.Z. and Y.W.; writing—original draft preparation, X.S.; writing—review and editing, X.S., Y.Z., Y.H. and Y.W.; visualization, X.S. and Y.W.; supervision, Y.W.; project administration, Y.W.; funding acquisition, Y.H. and Y.W. All authors have read and agreed to the published version of the manuscript.

Funding

This research was funded by the Sichuan Social Science Planning Project (grant number: SC22B100), the Meteorological Disaster Prediction, Early Warning and Emergency Management Research Center Project (grant number: ZHYJ23-YB11), Key Projects of Sichuan Financial Society (SCJR2024146) and the College Student Innovation Training Program (grant number: 202410626173).

Data Availability Statement

The original contributions presented in the study are included in the article, further inquiries can be directed to the corresponding author.

Conflicts of Interest

The authors declare no conflicts of interest.

References

  1. Zhang, L. Research on financial innovation of supply chain driven by blockchain from the perspective of game theory. Econ. Probl. 2019, 4, 48–54. [Google Scholar]
  2. Stiglitz, J.E.; Weiss, A. Credit rationing in markets with imperfect information. Am. Econ. Rev. 1981, 71, 393–410. [Google Scholar]
  3. Wang, X.; Zhang, J. On the bank credit rationing and loan of small and medium-sized Enterprises (SMEs). Econ. Res. J. 2003, 7, 68–75+92. [Google Scholar]
  4. Lin, Y.F.; Sun, X.F. Information, informal finance and SME financing. Econ. Res. J. 2005, 7, 35–44. [Google Scholar] [CrossRef]
  5. Liu, C.; Liu, C.; Ma, G.R. Small-and-medium banks and small-and-medium enterprise loans. Econ. Res. J. 2017, 8, 65–77. [Google Scholar]
  6. Lin, Y.F.; Li, Y.J. Promoting the growth of medium and small-sized enterprises through the development of medium and small-sized financial institutions. Econ. Res. J. 2001, 1, 10–18+53. [Google Scholar]
  7. Zhang, Y.L.; Lin, Y.F.; Gong, Q. Firm size, bank size and optimal banking structure: From the perspective of new structural economics. J. Manag. World 2019, 35, 31–47+206. [Google Scholar]
  8. Song, H. Pattern Innovation of the Supply Chain Finance Enabled by the Digital Platform. China Bus. Mark. 2020, 34, 17–24. [Google Scholar]
  9. Liu, Y.M.; Cao, T.Q.; Liu, J.H. Research on Supply Chain Finance and Chinese Listed Companies’ Risk-taking Level. Syst. Eng.-Theory Pract. 2024, 1–20. Available online: https://link.cnki.net/urlid/11.2267.N.20240515.1602.029 (accessed on 8 July 2024).
  10. Berger, A.N.; Udell, G.F. A more complete conceptual framework for SME finance. J. Bank. Financ. 2006, 30, 2945–2966. [Google Scholar] [CrossRef]
  11. Yu, H.; Wang, S. Core Enterprises’ Willingness to Participate in Supply Chain Finance and Their Orientation of Financing Pattern. China Bus. Mark. 2022, 36, 22–34. [Google Scholar]
  12. Yang, B.; Zhu, W.M.; Zhao, H.Y. Theoretical study on upstream party initiated finance. J. Financ. Res. 2016, 12, 175–190. [Google Scholar]
  13. Song, H.; Lu, Q.; Yu, K. Comparative study of the impact supply chain finance and bank lending on financing performance of SMEs. Chin. J. Manag. 2017, 14, 897–907. [Google Scholar]
  14. Gomm, M.L. Supply chain finance: Applying finance theory to supply chain management to enhance finance in supply chains. Int. J. Logist. Res. Appl. 2010, 13, 133–142. [Google Scholar] [CrossRef]
  15. Lekkakos, S.D.; Serrano, A. Supply chain finance for small and medium sized enterprises: The case of reverse factoring. Int. J. Phys. Distrib. Logist. Manag. 2016, 46, 367–392. [Google Scholar] [CrossRef]
  16. Guo, N. The government? The market? Who is more effective-a study on the effectiveness of financing mechanism for small and medium-sized enterprises. J. Financ. Res. 2013, 03, 194–206. [Google Scholar]
  17. Gong, Q.; Ban, M.Y.; Zhang, Y.L. Blockchain, enterprise digitalization and supply chain finance innovation. J. Manag. World 2021, 37, 22–34. [Google Scholar]
  18. Song, X.C.; Mao, J.Y. Research on the process of blockchain-based interorganizational trust building—Take the digital supply chain finance model for example. Chin. Ind. Econ. 2022, 11, 174–192. [Google Scholar]
  19. Tang, S.; Xie, X.Y. How Do Firms Holding Financial Institutions Serve the Real Economy—From the Perspective of Supply Chain Spillover Effect. China Ind. Econ. 2021, 11, 116–134. [Google Scholar]
  20. Zhang, C.; Dhaliwal, J. An investigation of resource-based and institutional theoretic factors in technology adoption for operations and supply chain management. Int. J. Prod. Econ. 2009, 120, 252–269. [Google Scholar] [CrossRef]
  21. Chen, J.; Huang, S.; Liu, Y.H. Operations Management in the Digitization Era: From Empowering to Enabling. J. Manag. World 2020, 36, 117–128+222. [Google Scholar]
  22. Song, H.; Yang, Y.D.; Tao, Z. The Application of Blockchain in Enterprise Financing: A Literature Review and Knowledge Framework. Nankai Bus. Rev. 2022, 25, 34–48. [Google Scholar] [CrossRef]
  23. Jon, F.; Leonardo, G.; Yi, H. BigTech and the changing structure of financial intermediation. Econ. Policy 2019, 34, 761–799. [Google Scholar]
  24. Fuster, A.; Plosser, M.; Schnabl, P. The Role of Technology in Mortgage Lending. Rev. Financ. Stud. 2019, 32, 1854–1899. [Google Scholar] [CrossRef]
  25. Sheng, T.X.; Fan, C.L. Fintech, Optimal Banking Market Structure, and Credit Supply for SMEs. J. Financ. Res. 2020, 6, 114–132. [Google Scholar]
  26. Zhu, Y.; Jia, R.; Wang, G.J. A review of supply chain finance risk assessment research: Based on knowledge graph technology. Syst. Eng.-Theory Pract. 2023, 43, 795–812. [Google Scholar]
  27. Chod, J.; Trichakis, N.; Tsoukalas, G.; Aspegren, H.; Weber, M. On the Financing Benefits of Supply Chain Transparency and Blockchain Adoption. Manag. Sci. 2020, 66, 4378–4396. [Google Scholar] [CrossRef]
  28. Ali, O.; Ally, M.; Clutterbuck, D.Y. The state of play of blockchain technology in the financial services sector: A systematic literature review. Int. J. Inf. Manag. 2020, 54, 102199. [Google Scholar] [CrossRef]
  29. Iansiti, M.; Lakhani, K.R. The truth about blockchain (Note). Harv. Bus. Rev. 2017, 95, 118–127. [Google Scholar]
  30. Choi, T.M. Supply chain financing using blockchain: Impacts on supply chains selling fashionable products. Ann. Oper. Res. 2020, 331, 393–415. [Google Scholar] [CrossRef]
  31. Catalini, C.; Gans, J.S. Some simple economics of the blockchain. Commun. ACM 2020, 63, 80–90. [Google Scholar] [CrossRef]
  32. Easley, D.; O’Hara, M.; Basu, S. From mining to markets: The evolution of bitcoin transaction fees. J. Financ. Econ. 2019, 134, 91–109. [Google Scholar] [CrossRef]
  33. Biais, B.; Bisière, C.; Bouvard, M.; Casamatta, C. The Blockchain Folk Theorem. Rev. Financ. Stud. 2019, 32, 1662–1715. [Google Scholar] [CrossRef]
  34. Makarov, I.; Schoar, A. Trading and Arbitrage in Cryptocurrency Markets. J. Financ. Econ. 2020, 135, 293–319. [Google Scholar] [CrossRef]
  35. Cong, L.W.; Li, Y.; Wang, N. Tokenomics: Dynamic Adoption and Valuation. Rev. Financ. Stud. 2021, 34, 1105–1155. [Google Scholar] [CrossRef]
  36. Howell, S.T.; Niessner, M.; Yermack, D. Initial Coin Offerings: Financing Growth with Cryptocurrency Token Sales. Rev. Financ. Stud. 2020, 33, 3925–3974. [Google Scholar] [CrossRef]
  37. Chen, J.N.; Chen, S.Y.; Luo, S.Y.; Wang, Q.; Cao, B.; Li, X.Q. An intelligent task offloading algorithm (iTOA) for UAV edge computing network. Digit. Commun. Netw. 2020, 6, 433–443. [Google Scholar] [CrossRef]
  38. Wang, S.P.; Li, H.; Chen, J.J.; Wang, J.F.; Deng, Y.J. DAG blockchain-based lightweight authentication and authorization scheme for IoT devices. J. Inf. Secur. Appl. 2022, 66, 103134. [Google Scholar] [CrossRef]
  39. Yang, Z.X.; Yang, R.Z.; Yu, F.R.; Li, M.; Zhang, Y.H.; Teng, Y.L. Sharded Blockchain for Collaborative Computing in the Internet of Things: Combined of Dynamic Clustering and Deep Reinforcement Learning Approach. IEEE Internet Things J. 2022, 9, 16494–16509. [Google Scholar] [CrossRef]
  40. Liu, C.; Cao, G.Y.; Ma, G.R. Does the Local Government Financing Platform Crowd Out Small and Medium-sized Enterprise Loans? Econ. Res. J. 2020, 55, 50–64. [Google Scholar]
  41. Lou, Y.; Chang, Y.X.; Hao, F.X. The influence of blockchain on supply chain finance—Based on tripartite game theory and dynamic evolutionary game theory. Chin. J. Manag. 2022, 30, 352–360. [Google Scholar]
  42. Sun, R.; He, D.Y.; Su, H.L. Application of blockchain technology to preventing supply chain finance based on evolutionary game. Chin. J. Manag. 2024, 32, 125–134. [Google Scholar]
  43. Ling, R.Z.; Li, B.; Pan, A.L. Supply Chain Finance and Corporate Debt Maturity Selection. Econ. Res. J. 2023, 58, 93–113. [Google Scholar]
  44. Song, H.; Yang, X. How does supply chain finance help SMEs financing—Perspective of supply chain network embeddedness. R&D. Manag. 2018, 30, 22–33. [Google Scholar]
  45. Duan, W.C. Blockchain Supply Chain Finance, 1st ed.; Publishing House of Electronics Industry: Beijing, China, 2018; pp. 31–94. [Google Scholar]
  46. Wuttke, A.D.; Blome, C.; Foerstl, K. Managing the innovation adoption of supply chain finance—Empirical evidence from six europeancase studies. J. Bus. Logist. 2013, 34, 148–166. [Google Scholar] [CrossRef]
  47. Zhang, W.B.; Liu, K. The implementation of supply chain finance, can it alleviate the financing constraints faced by SMEs?—Drawing on empirical analysis of small and medium-sized listed companies. Econ. Sci. 2012, 3, 22–33. [Google Scholar]
  48. Bai, Y.F.; Zhai, D.X.; Wu, D.L.; Lin, X. Blockchain—Based optimization strategies for supply chain finance platforms. Financ. Econ. Res. 2020, 35, 119–132. [Google Scholar]
  49. Song, H.; Han, S.Q.; Liu, W.Y. Digital Financial Technology Platform Enabled Supply Chain Finance Pattern: A Comparative Case Study from Information Processing Perspective. Manag. Rev. 2024, 36, 264–275. [Google Scholar]
  50. Roberts, R.M. The role of dynamic renegotiation and asymmetric information in financial contracting. J. Financ. Econ. 2015, 116, 61–81. [Google Scholar] [CrossRef]
  51. Priyanka, C.B.; Vimal, K.; Tzu-Chuen, L.; Tugrul, D. Technology convergence assessment: Case of blockchain within the IR 4.0 platform. Technol. Soc. 2021, 67, 101709. [Google Scholar]
  52. Yuan, Y.; Wang, Y.F. Blockchain: The state of the art and future trends. Acta. Autom. Sin. 2016, 42, 481–494. [Google Scholar]
  53. Saberi, S.; Kouhizadeh, M.; Sarkis, J.; Shen, L.J. Blockchain technology and its relationships to sustainable supply chain management. Int. J. Prod. Res. 2019, 57, 2117–2135. [Google Scholar] [CrossRef]
  54. Sun, G.Q.; Xie, Y.F. Blockchain Technology, Supply Chain Networks and Data Sharing: Based on the Perspective of Evolutionary Game.Chin. J. Manag. Sci. 2023, 31, 149–162. [Google Scholar]
  55. Kumar, A.; Liu, R.; Shan, Z. Is blockchain a silver bullet for supply chain management? Technical challenges and research opportunities. Decis. Sci. 2020, 51, 8–37. [Google Scholar] [CrossRef]
  56. Shao, Q.F.; Jin, C.Q.; Zhang, Z.; Qian, W.N.; Zhou, A.Y. Blockchain: Architecture and research progress. Chin. J. Comput. 2018, 41, 969–988. [Google Scholar]
  57. Lu, W.; Robert, L.; Frank, L.; Jose, B. Value creation in blockchain-driven supply chain finance. Inf. Manag. 2022, 59, 103510. [Google Scholar]
  58. Wang, L.; Duan, T.; Dong, J. Integration of blockchain and enterprise network: Opportunities, challenges and countermeasures. Econ. Prob. 2021, 4, 23–30. [Google Scholar]
  59. Qian, X.N.; Papadonikolaki, E. Shifting trust in construction supply chains through blockchain technology. Eng. Constr. Archit. Manag. 2021, 28, 584–602. [Google Scholar] [CrossRef]
  60. Chang, S.E.; Chen, Y. When blockchain meets supply chain: A systematic literature review on current development and potential applications. IEEE Access 2020, 8, 62478–62494. [Google Scholar] [CrossRef]
  61. Qian, X.D.; Wang, Y.P. Research on evolution of supply chain networks in the blockchain environment. J. Stat. Inf. 2022, 37, 76–89. [Google Scholar]
  62. Lu, Y. The blockchain: State-of-the-art and research challenges. J. Ind. Inf. Integr. 2019, 15, 80–90. [Google Scholar] [CrossRef]
  63. Yang, H.Z.; Zhang, W.J.; Xi, X.N. Research on Supply Chain Finance Game Based on Accounts Receivable Model in Blockchain Environment. Math. Pract. Theory 2020, 50, 313–320. [Google Scholar]
  64. Song, H.; Han, S.Q.; Liu, W.Y. How Does Digital Technology Construct the Trust Relationship of Supply Chain Finance Network? J. Manag. World 2022, 38, 182–200. [Google Scholar]
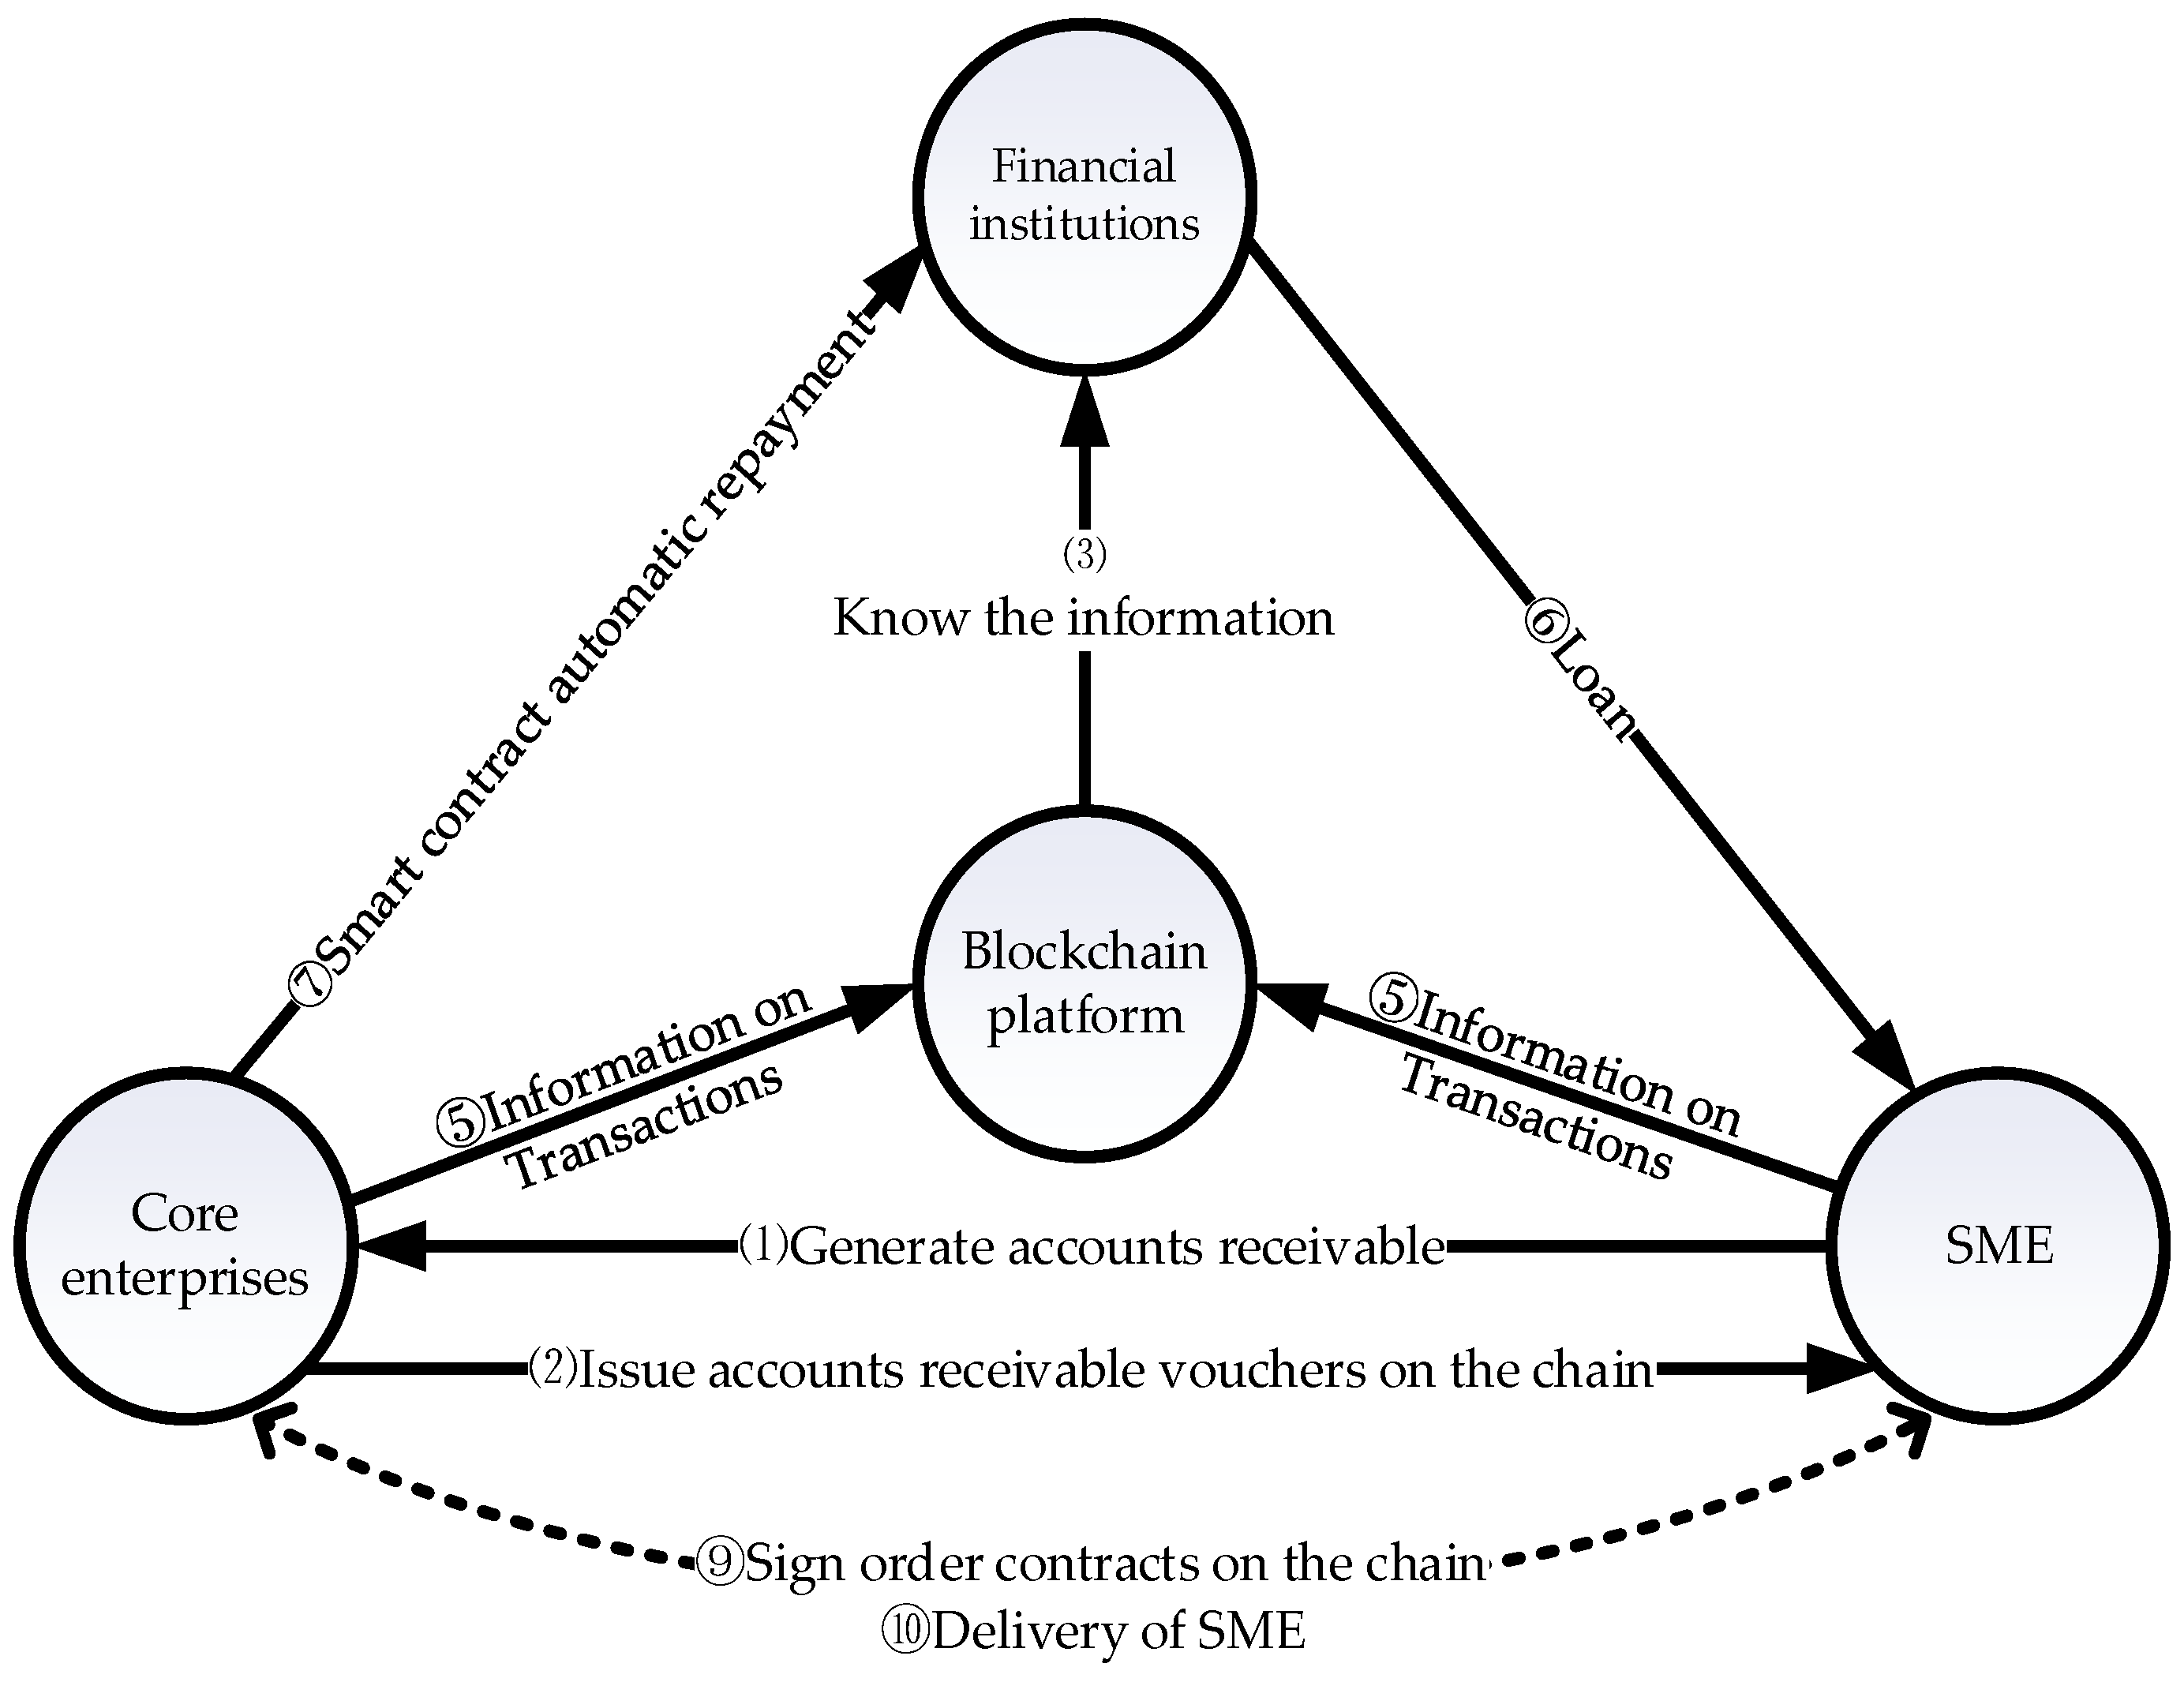
Figure 1. Business flow chart of accounts receivable under digital supply chain.
Systems 12 00253 g001
Figure 2. Mixed strategy equilibrium between SME and CE in the traditional supply chain.
Systems 12 00253 g002
Figure 3. Mixed strategy equilibrium between SME and CE in the digital supply chain.
Systems 12 00253 g003
Figure 4. Impact of the difference in the pledge rate on the willingness of SME to engage in the digital supply chain.
Systems 12 00253 g004
Figure 5. Impact of the difference in the pledge rate on the willingness of FI to engage in the digital supply chain.
Systems 12 00253 g005
Figure 6. Impact of the pledge rate on the trustworthiness of SME.
Systems 12 00253 g006
Figure 7. Impact of the difference in the default losses on the willingness of SME to engage in the digital supply chain.
Systems 12 00253 g007
Figure 8. Impact of the difference in the default losses on the willingness of CE to engage in the digital supply chain.
Systems 12 00253 g008
Figure 9. Impact of the default losses on the repayment of CE.
Systems 12 00253 g009
Table 1. Description of the parameters in traditional supply chain finance.
ItemsSymbol
Accounts receivable from SME R
Pledge rate for accounts receivable α
Loanable amount α R
CE’s loss rate on the original investment income due to SME’s default β
Return on investment of CE β 1
Return on reproduction of SME β 2
Interest rate on FI loan β 0
Interest rate on FI deposit β 3
Loss incurred due to default by SME M
Loss incurred due to default by CE N
Benefit for SME and CE due to their repayment A
FI’s intermediate income A 1
FI’s supervision cost C
Table 4. Income matrix of accounts receivable financing in digital supply chain finance.
EarningsSME
Repayment   r 1 Default   1 r 1
CERepayment
r 2
α R ( β 0 β 3 ) + A 1 m / 3
R β 1 + A + D + d m / 3
α R ( β 2 β 0 ) + A + D m / 3
α R β 3 + A 1 m / 3
( 1 β ) R β 1 + d m / 3
α R ( 1 + β 2 ) M 1 m / 3
Default
1 r 2
α R ( β 0 β 3 ) + A 1 m / 3
R ( 1 + β 1 ) N 1 m / 3
α R ( β 2 β 0 ) R m / 3
α R ( 1 + β 3 ) m / 3
R ( 1 + β 1 ) N 1 m / 3
α R ( 1 + β 2 ) R M 1 m / 3
Table 5. Parameter configuration for numerical simulation.
ParameterValuesParameterValues
R 10,000 A 1 500
α 0.6 C 100
β 0.5 M 1 8000
β 0 0.08 N 1 10,000
β 1 0.3 D 1000
β 2 0.1 d 500
β 3 0.03 m 30
M 6000 A 1000
N 9500 α 0.8
Disclaimer/Publisher’s Note: The statements, opinions and data contained in all publications are solely those of the individual author(s) and contributor(s) and not of MDPI and/or the editor(s). MDPI and/or the editor(s) disclaim responsibility for any injury to people or property resulting from any ideas, methods, instructions or products referred to in the content.