Article

Research and Application of the Simulation Method for Product Development Process Based on System Dynamics

1
School of Management Engineering, Shandong Jianzhu University, Jinan 250101, China
2
School of Mechanical Engineering, Shandong University, Jinan 250061, China
*
Author to whom correspondence should be addressed.
Systems 2024, 12(5), 172; https://doi.org/10.3390/systems12050172
Submission received: 2 April 2024 / Revised: 5 May 2024 / Accepted: 10 May 2024 / Published: 12 May 2024

Abstract

:
Product development is a complex process involving intricate components, dynamics and constantly evolving internal and external environments, as well as numerous influencing factors. In order to accurately simulate and predict the effectiveness of the development process, this paper proposes a system dynamics simulation method based on information maturity. Different types of development processes are simulated, and the discussion includes the impact of activity information correlation, information evolution coefficient, start time, and other parameters on the dynamic behavior of the process. This study examines a specific mold development process as a case study to validate the method’s feasibility, accurately predicting the duration and cost of the process. It also investigates dynamic fluctuations resulting from uncertain events such as changes in customer demand and resource shortages. The method provides support for process optimization and resource scheduling.

1. Introduction

Due to its complex characteristics and external factors, the product development process is a multifaceted system which manifests in various aspects including product, process, organization, environment, and goals [1,2]. Accurately predicting and executing the development process in a planned manner poses challenges due to the process’s inherent complexity. Two types of complexity exist within this context: structural complexity and dynamic complexity [3]. Many models, such as the Design Structure Matrix (DSM) [4,5], Quality Function Deployment (QFD) [6,7,8], Concurrent Engineering (CE) [9,10], and Integrated Product Development (IPD) [11,12], have been utilized to analyze and solve these problems from various perspectives. These models prioritize the stability and reliability of the product but do not give sufficient consideration to the factors that trigger dynamic changes in the process and the resulting dynamic change patterns. They are commonly used to depict the intricate structure of the product design process [13]; however, they only provide a static view of the design process and do not adequately capture or analyze dynamic complexity [14].
Various scholars have conducted research on the dynamic nature of the development process from perspectives such as resource allocation [15], engineering change propagation [16], and workforce management [17]. Dynamic complexity refers to the evolution of the product design process over time. This evolution is reflected in dynamic changes within its internal structure and is influenced by fluctuations in system elements and parameters. Changes in these parameters can impact performance indicators such as cost, cycle time, and quality. Analyzing the dynamic characteristics of the product development process is crucial for accurate prediction and control. Simulation methods are effective for solving complex dynamic problems, such as Petri nets [18] and Monte Carlo simulations [19]. These methods evaluate the performance (cost, lead time, risk, etc.) of the development process by adjusting input variables to forecast output outcomes. They provide robust support for optimizing and controlling the process. However, these approaches consider the development process structure as static and fail to capture its evolutionary nature.
The product development process has dynamic feedback characteristics and involves many nonlinear decision problems. Some scholars have applied system dynamics, which is an effective method for addressing nonlinear system problems and analyzing complex dynamic feedback processes in product development process research [20,21,22,23,24,25,26]. Most of these studies, however, focus on the dynamic behavior of product development processes at the organizational level and do not describe the dynamic changes in the internal components of the process and their impact. Kasperek et al. (2016) proposed a structure-based system dynamics (SD) model to analyze the relationship between the underlying structure and the dynamic characteristics of the design process [1]. However, this model is only a framework and does not analyze the evolution process of dynamic characteristics in product design.
The dynamic characteristics of the product development process are determined by the dynamic features of all activities that constitute the process. The dynamic characteristics of activities are reflected in the process of transforming input information into output information. One activity can be considered a unit of information evolution. Some scholars have proposed evolutionary functions [27,28,29,30]. The ability of design activities to create and transmit information is referred to as activity function in this paper. The fundamental purpose of development activities is to fully realize their functions. We introduced the concept of information maturity to measure the degree of completion of the activity function, which reflects the activity’s state. Based on this, the paper will establish a new SD model of the development process. In literature, the revision cycle is always a key component of the development process. However, it is difficult to distinguish between original works and reworked ones. Normal works and reworks are usually mixed together. The SD model established in this paper is driven by the information maturity of the activity.
The remainder of this paper is organized as follows. Section 2 presents the literature review. Section 3 discusses the information maturity of development activities and proposes a structural model of the development process. The information evolution process of development activities is analyzed in Section 4, and an application example of a specific mold development process is also provided. Finally, the conclusions and some additional research findings are presented in Section 5. Information evolution and related concepts in the product development process are presented in Appendix A, and the equations of the SD model are established in Appendix B.

2. Literature Review

2.1. Modeling of the Product Development Process

The product development process is a crucial factor in ensuring sustainable growth for enterprises. Currently, there are numerous development tools available to help optimize the development process, aiming to shorten the development cycle and decrease development costs. Due to the uncertainty and unpredictability of the product development process, complex iterative and overlapping relationships exist between the activities involved in the development process [31].
Some scholars have studied organizational management issues in the development process or examined the development process from an organizational perspective. Attari-Shendi et al. (2019) proposed a multi-objective activity organization model based on the design structure matrix and technology maturity level for the sequencing of activities in complex product development projects [5]. The model considers information interdependence between activities and the project’s budget. Zapata-Rhodan and Sheikh (2020) proposed an agent-based organizational functional model for design management that coordinates design, engineering, and operational activities [32]. Yang and Hsu (2019) proposed a development program that integrates engineering, manufacturing, and marketing to address technological constraints and consumer market demands [33]. Zhao et al. (2021) viewed the dynamic resource allocation problem as a convex optimization problem and proposed a development process management model which takes into account budget constraints [15]. Sankowski et al. (2021) conducted detailed research and analysis on the front end of a product family development process for a product series, exploring possible constraints, boundary conditions, and influencing factors [34]. Yang and Hsu (2019) proposed a matrix that can help obtain the optimal design strategy for determining product design specifications [35]. Peykani et al. (2023) developed a two-stage resource scheduling model to address the scheduling challenges of design and development projects for complex product systems [36]. However, these models are overly intricate and challenging to compute. The dynamics and complexity of the product development process determine the diversity of development process modeling and research objectives. How to make the model universal and serve different goals, it must be approached from within the process and there is still a significant gap in research in this area.
The dynamically changing market and uncertain factors require continuous optimization of the product development process. To accurately simulate the progress and performance of the development process, it is necessary to construct a robust simulation model. The simulation-based method applies simulation technology to simulate the dynamic iteration process of product design. By changing the input parameters of the simulation model, we can analyze the performance of the iteration process to optimize the model. Discrete event simulation is a commonly used method. León et al. (2013) proposed an iterative management method to help designers identify, evaluate, and determine the optimal design process structure [37]. Maier et al. (2014) studied priority selection strategies involved in design and explored the combined effects of progressive iteration, rework, and change propagation in product design [38]. Yang et al. (2014) constructed a quantitative model to evaluate the impact of iterative uncertainty and overlapping fuzziness on project progress [31]. The common drawback of these models is that they overlook the transmission and evolution of information during the development process.

2.2. Information Transmission during the Product Development Process

The accuracy and timeliness of information transmission are the primary factors influencing the uncertainty of the product development process. The success of any product development project depends on the maturity of the information and knowledge involved. The transmission and evolution of information between research and development activities can help analysts delve deeper into the content of the development process and optimize the process structure from the foundational level. Yassine et al. (2013) studied the optimal information exchange strategy between two activities in the integrated product development process but did not consider the impact of uncertainties, such as resources and customer needs [39]. This method is not suitable for processes involving multiple activities. Li et al. (2022) established a dynamic model based on ordinary differential equations to address the issue of engineering change propagation across multiple product development stages [16]. Mallek-Daclin et al. (2023) proposed the application of digital twin technology to real-time check the deviation between product development models and reality, in order to quickly predict otherwise unforeseeable events [40]. Zhang and Bhuiyan (2014) studied uncertain evolution patterns under different overlapping modes to determine the optimal overlapping process [41].
Unfortunately, several uncertainty factors significantly impact model-based simulation and optimization [42]. Yang et al. (2014) defined uncertainty as the unknown probability distribution related to iteration when the process structure is fixed [31]. Li et al. (2019) studied the uncertainty arising from engineering changes and proposed a comprehensive simulation and optimization method to address scheduling problems under resource constraints [43]. Suss and Thomson (2012) simulated and analyzed information flow during the design process to coordinate the impact of uncertainty on process behavior [44].
The product design process can be viewed as an information evolution process. An activity in the design process is considered as an information evolution unit which receives information from other activities, outputs information, and transfers it to other activities. In this kind of information feedback process both normal activities and rework activities are generated to cope with changes in the product design process. These activities are challenging to differentiate using various methods of information exchange. However, most researchers artificially distinguish between normal activities and rework.

2.3. Modeling Using System Dynamics in the Product Development Process

System dynamics (SD) is an effective methodology based on feedback control theory that deals with nonlinear systems and facilitates computer simulation. SD emphasizes the role of feedback loops, which illustrate how a change in one variable impacts other variables and, consequently, influences the behavior of the entire system. In SD models, there are two fundamental variables: stocks and flows. Stocks refer to substances or information stored or accumulated in a system, whose changes depend on the flows. Flows refer to the flow of materials, energy, or information in a system. The correlation between these variables or parameters in SD is depicted as a causal loop diagram with feedback loops and mathematical equations. SD models can be used to simulate and predict the dynamic behavior of complex nonlinear systems with time-varying characteristics. Black and Repenning (2001) extended the application of system dynamics to the field of product development, and they conducted investigations into resource allocation in the early stages of product development projects and concluded that under-allocation of resources in the early phases leads to firefighting later in the process [45]. These days, researchers often use system dynamics to analyze process uncertainties or dynamic characteristics. Lai (2008) studied the evolution process of new product development using the SD model to analyze the nonlinear relationship among elements in the product development process [46]. Lin et al. (2008) analyzed the dynamic impact process of error information or upstream activity changes on the rework of downstream activities [47]. However, the model can only handle sequential iterations without interconnected activities. Rodrigues et al. (2006) analyzed the impact of new technology on the dynamic changes in product development [21]. The influences of overlapping degree [26], organization [27], and requirement change [22] on the design process were also studied using SD simulations. Riedel et al. (2023) modeled and visualized dependency relationships among parameters, processes, and stakeholders [48]. Most of these studies were conducted at the organizational or project level. The work of a product development project is categorized into three stages: work to be done, work in progress, and finished work. Within each of these categories are two subdivisions: initial work and rework. Most researchers believe that rework is carried out after the initial work is completed. However, when it comes to the process level, particularly in the execution of development activities, work is continuously adjusted in response to changes in external input information, and there is no distinct boundary between initial work and rework. Therefore, it is necessary to study the entire process through the evolution of activity information.
The product development process consists of sub-processes or design activities with strong interrelationships. Each activity can be viewed as an information evolution process involving complex information interactions and feedback among activities. Only by establishing the SD model from the perspective of information evolution can we reveal the structural behavior and change patterns of complex product design processes. Currently, there is a lack of research in this area.

3. Structural Model of the Development Process Based on Information Evolution

3.1. Information Feedback Process in Product Development

The development process involves the continuous generation, transfer, and integration of information, with activities serving as the fundamental units. The dynamic behavior of activities is reflected in the process of transforming input information into output information, a process known as information evolution. A discussion on the theory of information evolution in the product development process is presented in Appendix A.
The speed of information evolution of the activity is called the information maturation in this paper. Due to factors such as the external environment, resource investment, and interrelationships between activities, the input and output information of activities may be incomplete. The completeness of information is referred to as information maturity, which is utilized to assess the accuracy and comprehensiveness of information, with values ranging from 0 to 1.
The evolution of information within an activity is a continuous process that involves iterations over time. This evolution is influenced by factors such as the duration of the activity, the maturity of input information, the execution time, and the type of activity. The feedback process is illustrated in Figure 1.
This feedback process forms a reinforcing loop, R: the maturation process of product development. The loop is: maturity of output information → rework → information maturation. It reflects the influence of the activity output information as input information on its own speed of evolution. As the output information becomes more mature, the need for activity rework will decrease. An increase in rework will hinder the growth of information maturation of the activity, while the enhancement of information maturation will elevate the maturity of output information. The process of information maturation is influenced by the input information and evolution coefficient. The greater the maturity of input information, the more conducive it is to the information maturation process. The evolution coefficient is a parameter that reflects the laws of information evolution and is related to the stage of activity.

3.2. Activity Evolution Based on Information Maturity

The variation pattern of activity information maturity reflects the evolution process of activities; therefore, the information maturity function should be applied to depict the evolution process of activities. This is because the maturity of output information reflects the level of activity completion, that is, the maturity of activity. Therefore, these two concepts are consistent. This article uniformly represents the maturity function of Activity i as Equation (1).
M o A i ( t ) = M o I i · t d i α i
where MoAi denotes the maturity of Activity i, and MoIi denotes the maturity of input information of Activity i. t is the execution time of Activity. di denotes the basic duration of Activity i, which is the time required for activity execution when the input information maturity is 1 and resources are sufficient. αi denotes the evolution coefficient, which is determined by designers based on their experience.
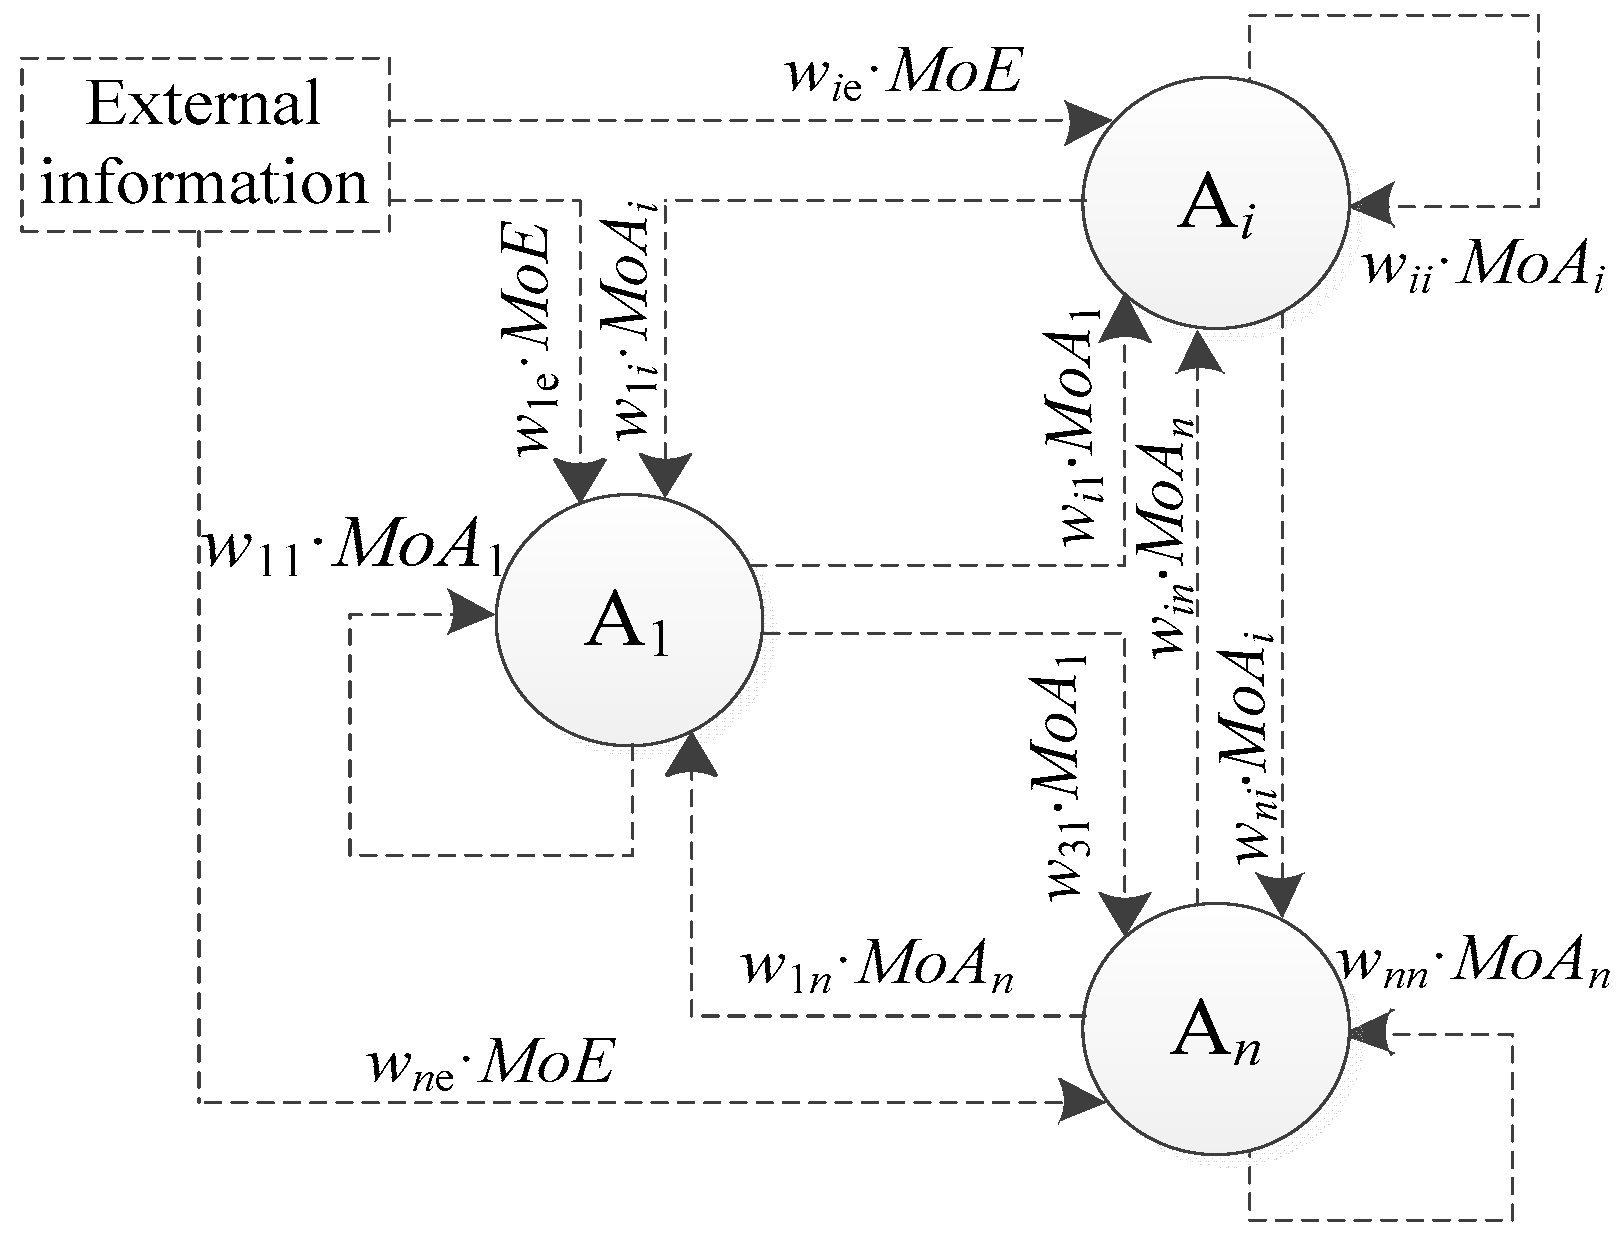
The input information for the activity is derived from the output information of all activities in the process (including the activity itself) and information about the external environmental (such as technical status, customer needs, etc.), as illustrated in Figure 2. The maturity of the input information is determined by the relevance and significance of all information, and the calculation formula is as follows:
M o I i = j = 1 n M o A j · w i j + M o E · w i e
where n denotes the total number of activities; MoE denotes the maturity of the external information; wij and wie represent the importance coefficient of input information from Activity j and input information from the external environment to Activity i, respectively, as represented by matrix W. For an activity, the sum of the importance coefficients of its input information is equal to 1, that is j n w i j + w i e = 1.
W = w 11 w 1 n w n 1 w n n         w 1 e w n e

3.3. The Key Causal Loop

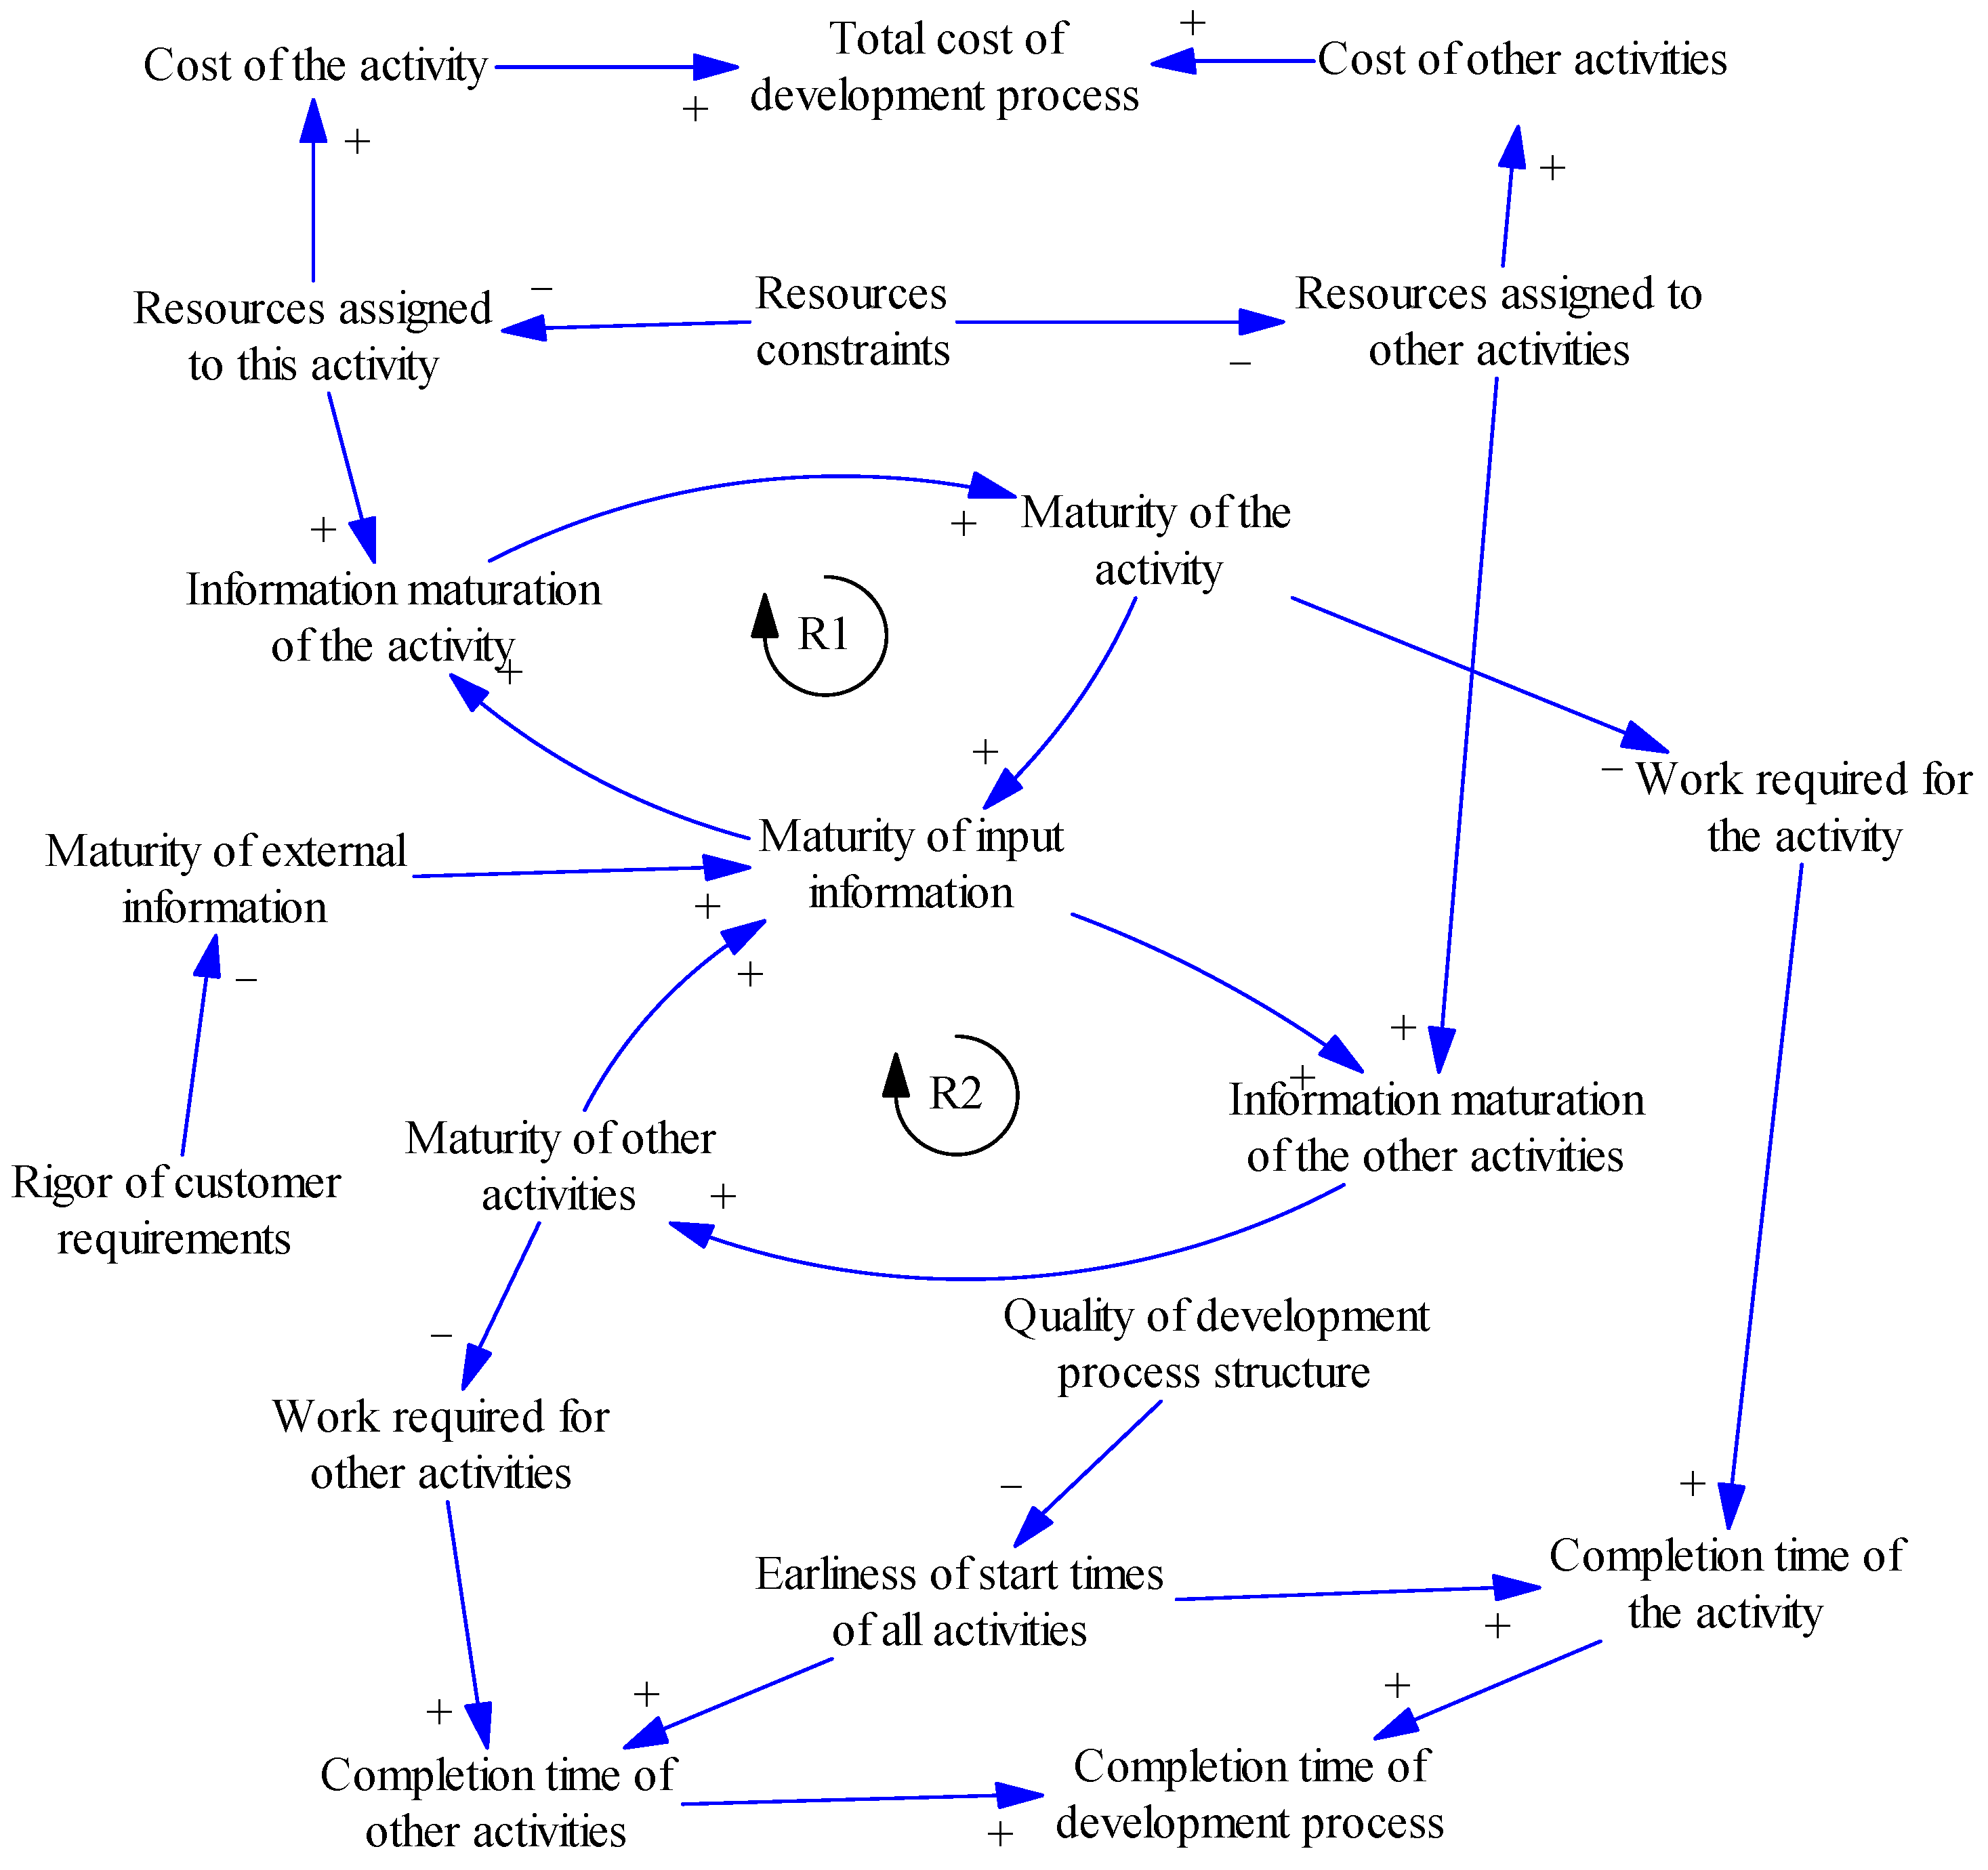
Based on the analysis of the information evolution process, the causal loop is established as shown in Figure 3. The main feedback loop is a positive feedback loop composed of maturity of activity, maturity of input information, and information evolution rate, which is expressed as information maturation. In the product development process, every activity will have a feedback loop. As the development process involves multiple activities, Figure 3 only uses two feedback loops, R1 and R2, to represent the relationships between activities.
R1: The maturation of the current activity, which is a reinforcing loop, is as follows: maturity of the activity → maturity of input information → information maturation of the activity. It represents the maturity of the current activity.
R2: The maturation of other activities, which is also a reinforcing loop, is as follows: maturity of other activities → maturity of input information → information maturation of other activities. It represents the maturity of the activities outside of the current one.
The mutual influence among various variables is evident. The rigor of customers reflects the degree of customer demand. Increased rigor will lead to greater uncertainty, thereby diminishing the reliability of external information for activities. The development process structure describes the activities and their relationships. A high-quality development process will commence activities earlier than scheduled, leading to a reduction in the completion time of the activity. Conversely, a delayed start time prolongs the activity duration and extends the overall duration of the process. Stricter resource constraints lead to fewer resources being allocated to activities, thereby slowing down the maturation of information.
Additionally, the maturity of output information decreases the workload needed to complete activities. The correlation between these variables influences the dynamic changes and uncertainties in the development process. The state and dynamic behavior of the development process are described using indicators such as activity information evolution rate and output information maturity, which vary over time.
The variables—such as the basic duration of the activity, resource requirements, interrelationships between activities, and planned start time—are determined by the development process strategy. These are exogenous to the system; they are established in the early stages of simulation and remain unchanged throughout the simulation process.

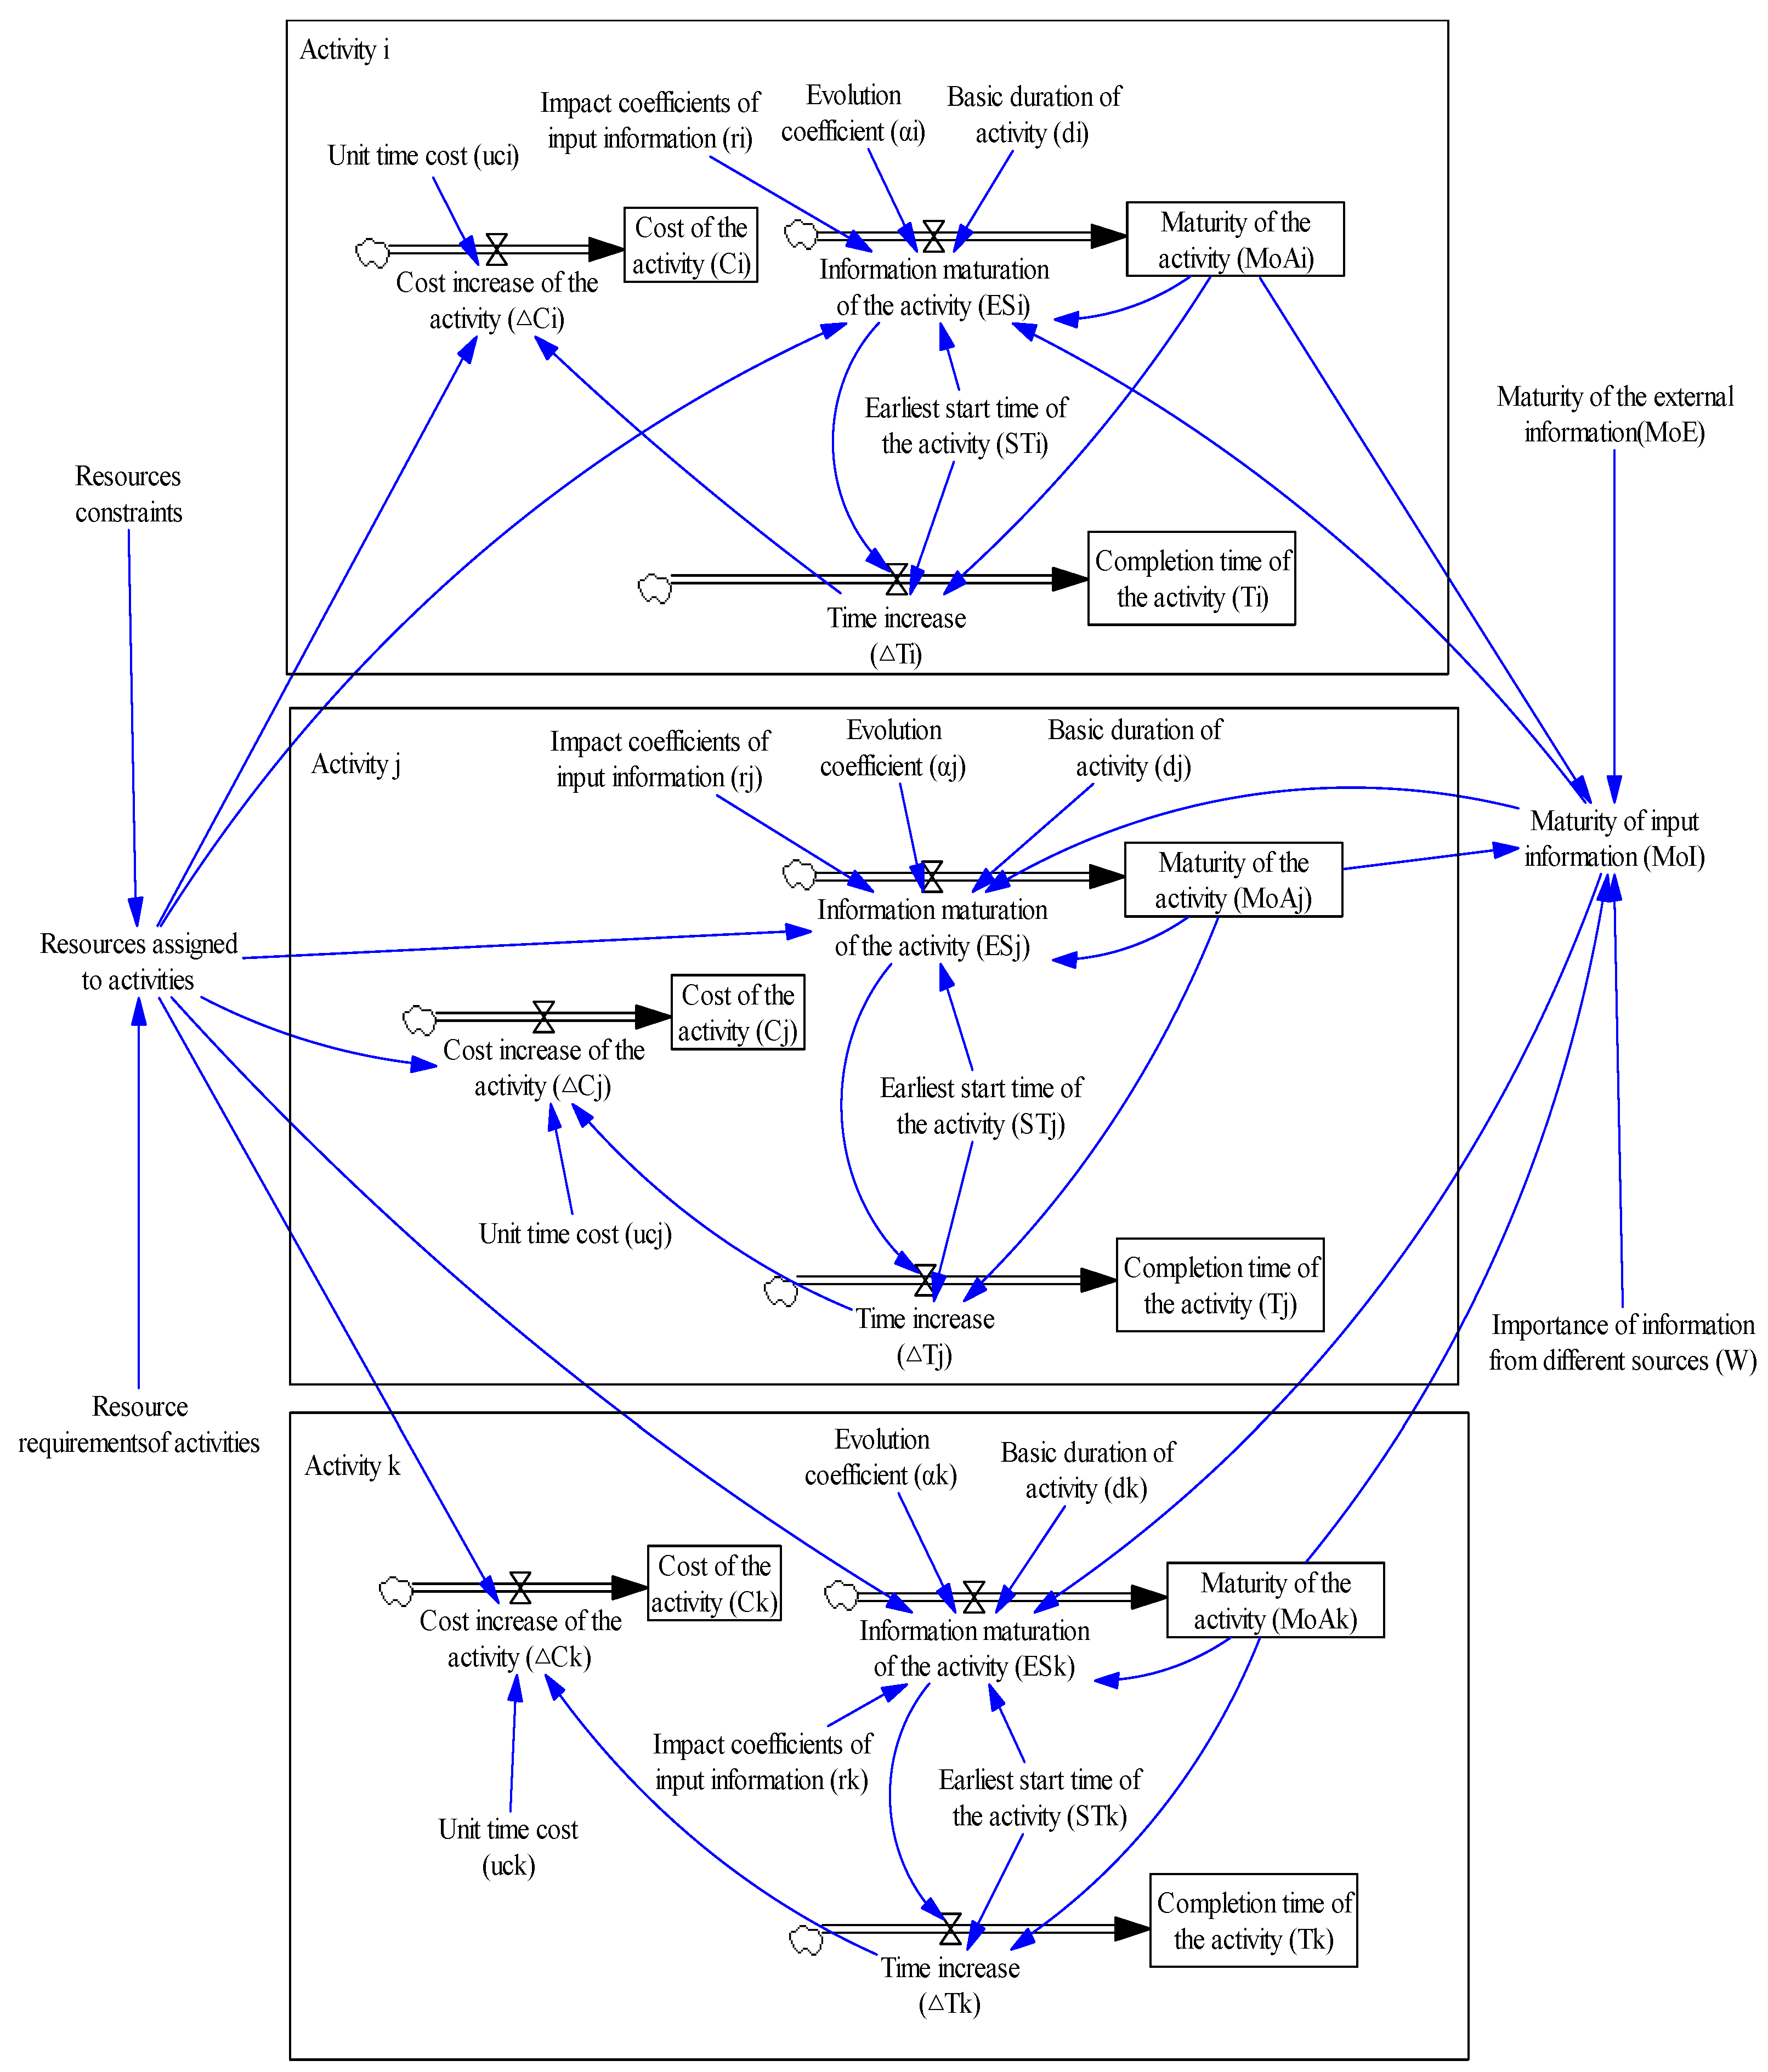
3.4. The Structure Model

The variables and parameters—such as state variables, rate variables, auxiliary variables, and constants—are identified based on the causal relationship diagram. For product development activities, the structure model can be expressed as shown in Figure 4, which illustrates the evolution process stock-and-flow diagram of Activity i. As depicted in the figure, there are three types of level variables: The maturity of the activity, the cost of the activity, and the completion time of the activity. The main rate variable is the evolution speed of the maturity of the activity (ESi), which represents the information maturation of the activity. Its value determines whether resources need to be arranged and how many resources need to be arranged, which is expressed as the resource requirements that need to be assigned to the activity. The actual resources assigned to the activity will take into account both resource constraints and resource requirements. In the case of sufficient resources, the activity will receive the required resources. The information maturation is determined by the evolution coefficient (α), the basic duration of activity (d), and the maturity of input information (MoI). In addition, uncertain situations such as changes in external requirements or development errors also impact the information maturation. This influence is quantified as the degree of random influence (r).
The dynamic behavior of the development process is determined by the evolution of all activity information, as depicted in the stock-and-flow diagram comprising three activities: Activity i, Activity j, and Activity k, in Figure 5. The maturity of input information (MoI), importance of information from different sources (W), resource requirements of the activities, resources assigned to activities, and resource constraints in Figure 5 are sets of variables that may be decomposed into multiple variables based on actual situations in specific simulation models.
Constructing dynamic equations is an important step in system dynamics simulation. Based on the above analysis, this article establishes the dynamic equations of the model. The equation and its construction process are presented in Appendix B.

4. Simulation and Application

4.1. Model Test

The SD model, as the foundation of system simulation, must be validated to demonstrate its ability to simulate the behavior of actual systems in a reasonable manner. By setting extreme values for model parameters, such as an initial maturity of external information of 0, no feedback (where the output information of an activity has no impact on its input information), and the maturity of input information of 0, the proposed model has passed the equation’s extreme condition. Figure 6 shows some equation extreme test results.
Figure 6a shows that when the input information maturity is 0, no matter how hard the developers work or how long the activity is executed, the activity maturity will only be 0. In Figure 6b, when we set the evolution coefficient to 0, it is evident that the activity completed all the work instantly, rendering the remaining duration essentially futile. In Figure 6c, we set a very large evolution coefficient. It can be observed that there was minimal progress in the activity until the final moment, with almost all the work being completed at the last moment. Therefore, the value of the evolution coefficient should not be excessively large or small. We suggest setting it between 0.2 and 5.
The model validity test, dimensional consistency test and mechanical error test can be passed in the simulation section below. Under ideal conditions, when the simulation time reaches the start time of the activity plan, the activity can start executing. The activity will stop executing when its maturity reaches 1. This is because when the maturity of an activity reaches 1, it indicates that the output information from the activity is complete. Continuing to execute the activity only adds cost and time; it adds no value to the development process. In some special cases, such as when customer requirements change after the activity is completed, it is necessary to assess the impact of lowering the maturity of the activity, which may result in the activity being restarted.

4.2. Simulation

To verify the feasibility of the model, the development process was modeled with a single activity, two activities, and three activities. The simulation step size was set to 1 day. All simulations were implemented using Vensim software, Version 7.2.

4.2.1. Simulation Analysis of One Activity

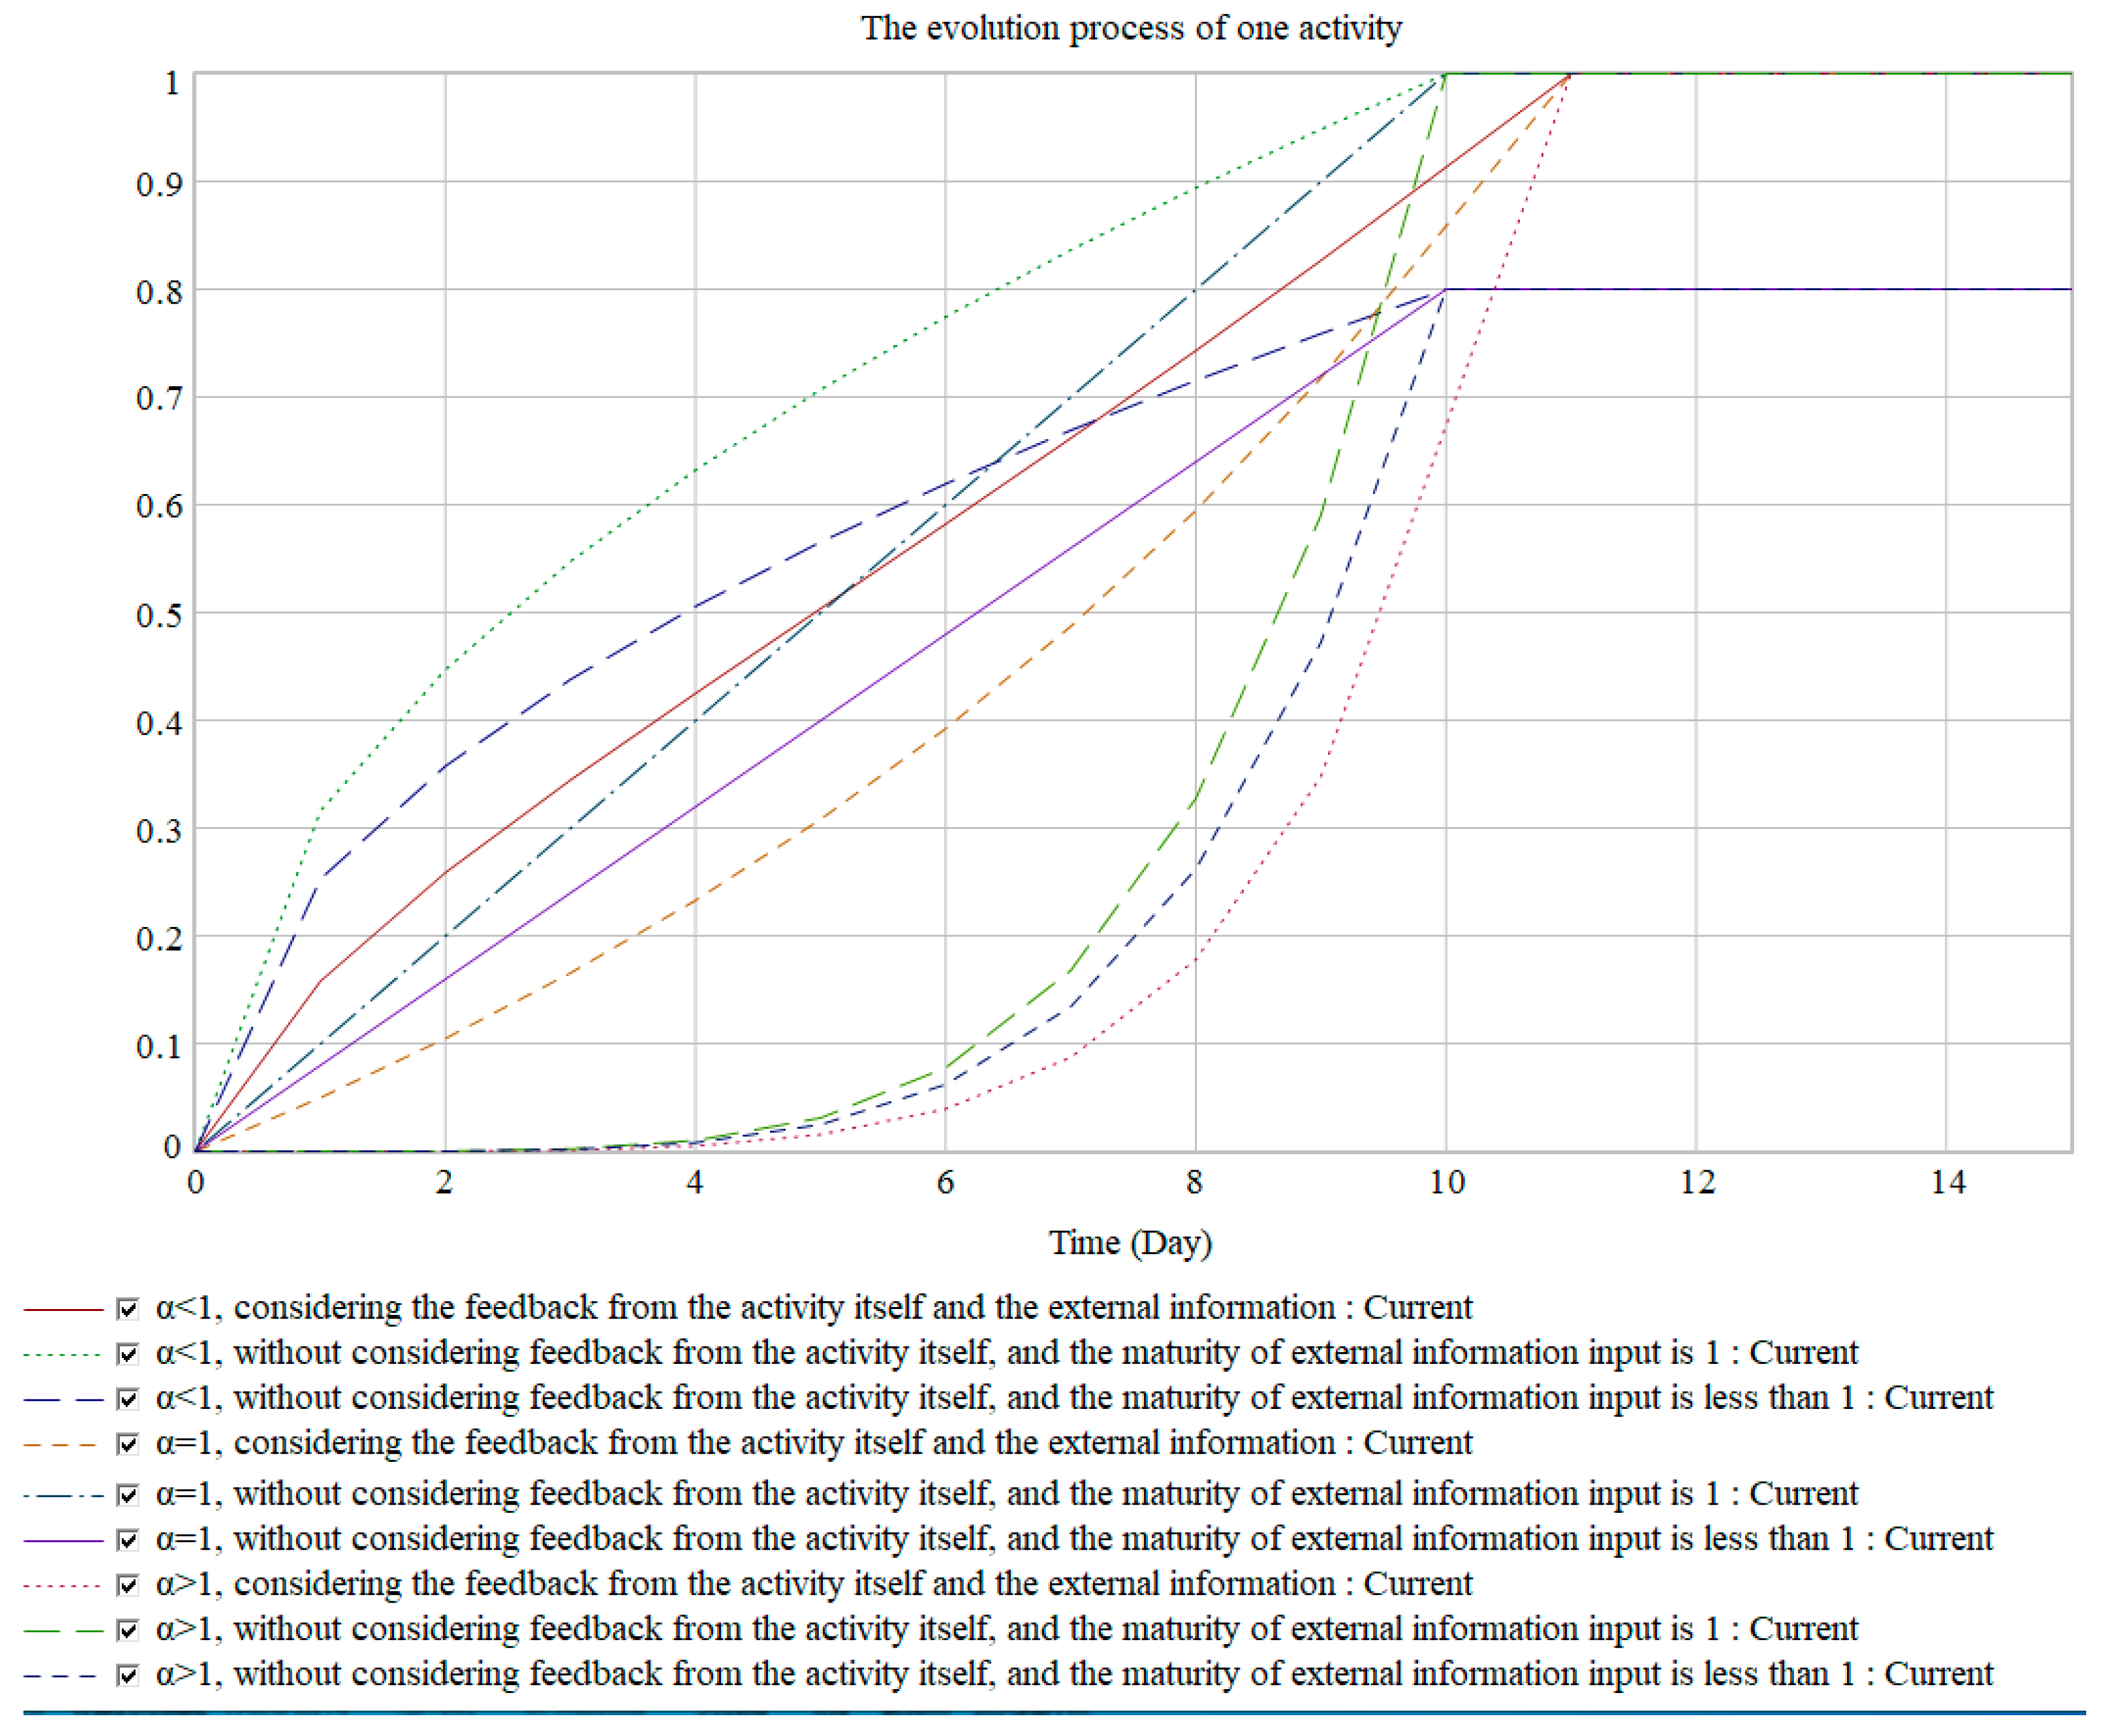
The basic duration of the activity was set to 10 days, and the information evolution coefficient had three different values α > 1, α = 1, and α < 1. Nine scenarios were simulated, and the results are shown in Figure 7.
For a single activity, information evolution laws and the evolution coefficient α were considered. Without considering the feedback from the activity itself, when the maturity of external information input is 1, the activity duration is equal to its basic duration. When the maturity of input external information is less than 1, the maturity of activity output information cannot reach 1, which is consistent with the actual situation. When considering the feedback from the activity itself, the duration of the activity will be longer than the basic duration. This is related to the size of the evolution coefficient and the importance coefficient of input information. The more important the feedback information from the activity itself is and the smaller the information evolution coefficient, the longer the activity duration.

4.2.2. Simulation Analysis of Two Activities

The basic duration for two activities, Activity 1 and Activity 2, was set to 10 for both, and the different scenarios were simulated separately. Figure 8 shows the simulation results when both evolution coefficients were 1 and there was no information correlation between them. In Figure 8a, the start time of both activities is 0, indicating that the two activities were executed in parallel. In Figure 8b, the start time of Activity 1 is 0 and the start time of Activity 2 is 10, indicating that the two activities were executed sequentially. In Figure 8c, the start time of Activity 1 is 0 and the start time of Activity 2 is 5, indicating that the two activities overlapped in execution. Activities were executed independently, and forms such as parallel, serial, and overlapping had no impact on the information evolution process. Simulation results for when two activity evolution coefficients α1 < 1 and α2 > 1 had information correlation between them are shown in Figure 9.
Figure 9a illustrates the evolution process when two activities are executed independently. Figure 9b,c illustrate the evolution process when the two activities interact with each other. Due to the correlation of information between activities, the process of information evolution influences each other. The smaller the evolution coefficient, the greater the impact of other activities. When Activity 1 is executed before Activity 2 (as shown in Figure 9b), the impact of information exchange on project duration is greater than when Activity 2 is executed before Activity 1 (as shown in Figure 9c).

4.2.3. Simulation Analysis of Three Activities

The basic duration for all three activities, Activity 1, Activity 2, and Activity 3, was set to 10 days, with an information evolution coefficient α1 < 1, α2 = 1, and α3 > 1. The importance coefficient of activity input information was established, and the simulation results are shown in Figure 10. The Gantt chart in the figure illustrates the parallel relationship of each activity.
When simulating three activities, the information correlation between the activities is relatively complex. The evolution of the process will vary depending on the start times of the activities, as they are influenced by these start times. A development plan that minimizes the process duration or cost can be explored by setting different start times.

4.3. Application Example

The development process for producing a specific mold was used as an example to validate the application of the model. It is known that the development process of this mold consists of eight activities, and the parameters are shown in Table 1.
The importance coefficient matrix of activity input information is as follows:
W = 0.20 0.70 0 0 0 0 0 0     0.10 0.10 0.65 0.50 0 0 0 0     0 0.10 0.15 0 0.45 0 0 0     0 0 0 0.10 0.25 0 0 0     0 0 0 0.16 0.10 0.75 0 0     0 0 0 0 0.20 0.10 0.80 0     0 0 0 0 0 0.15 0.01 0.80     0 0 0 0 0 0 0.16 0.10     0.70 0.10 0.20 0.24 0 0 0.03 0.10
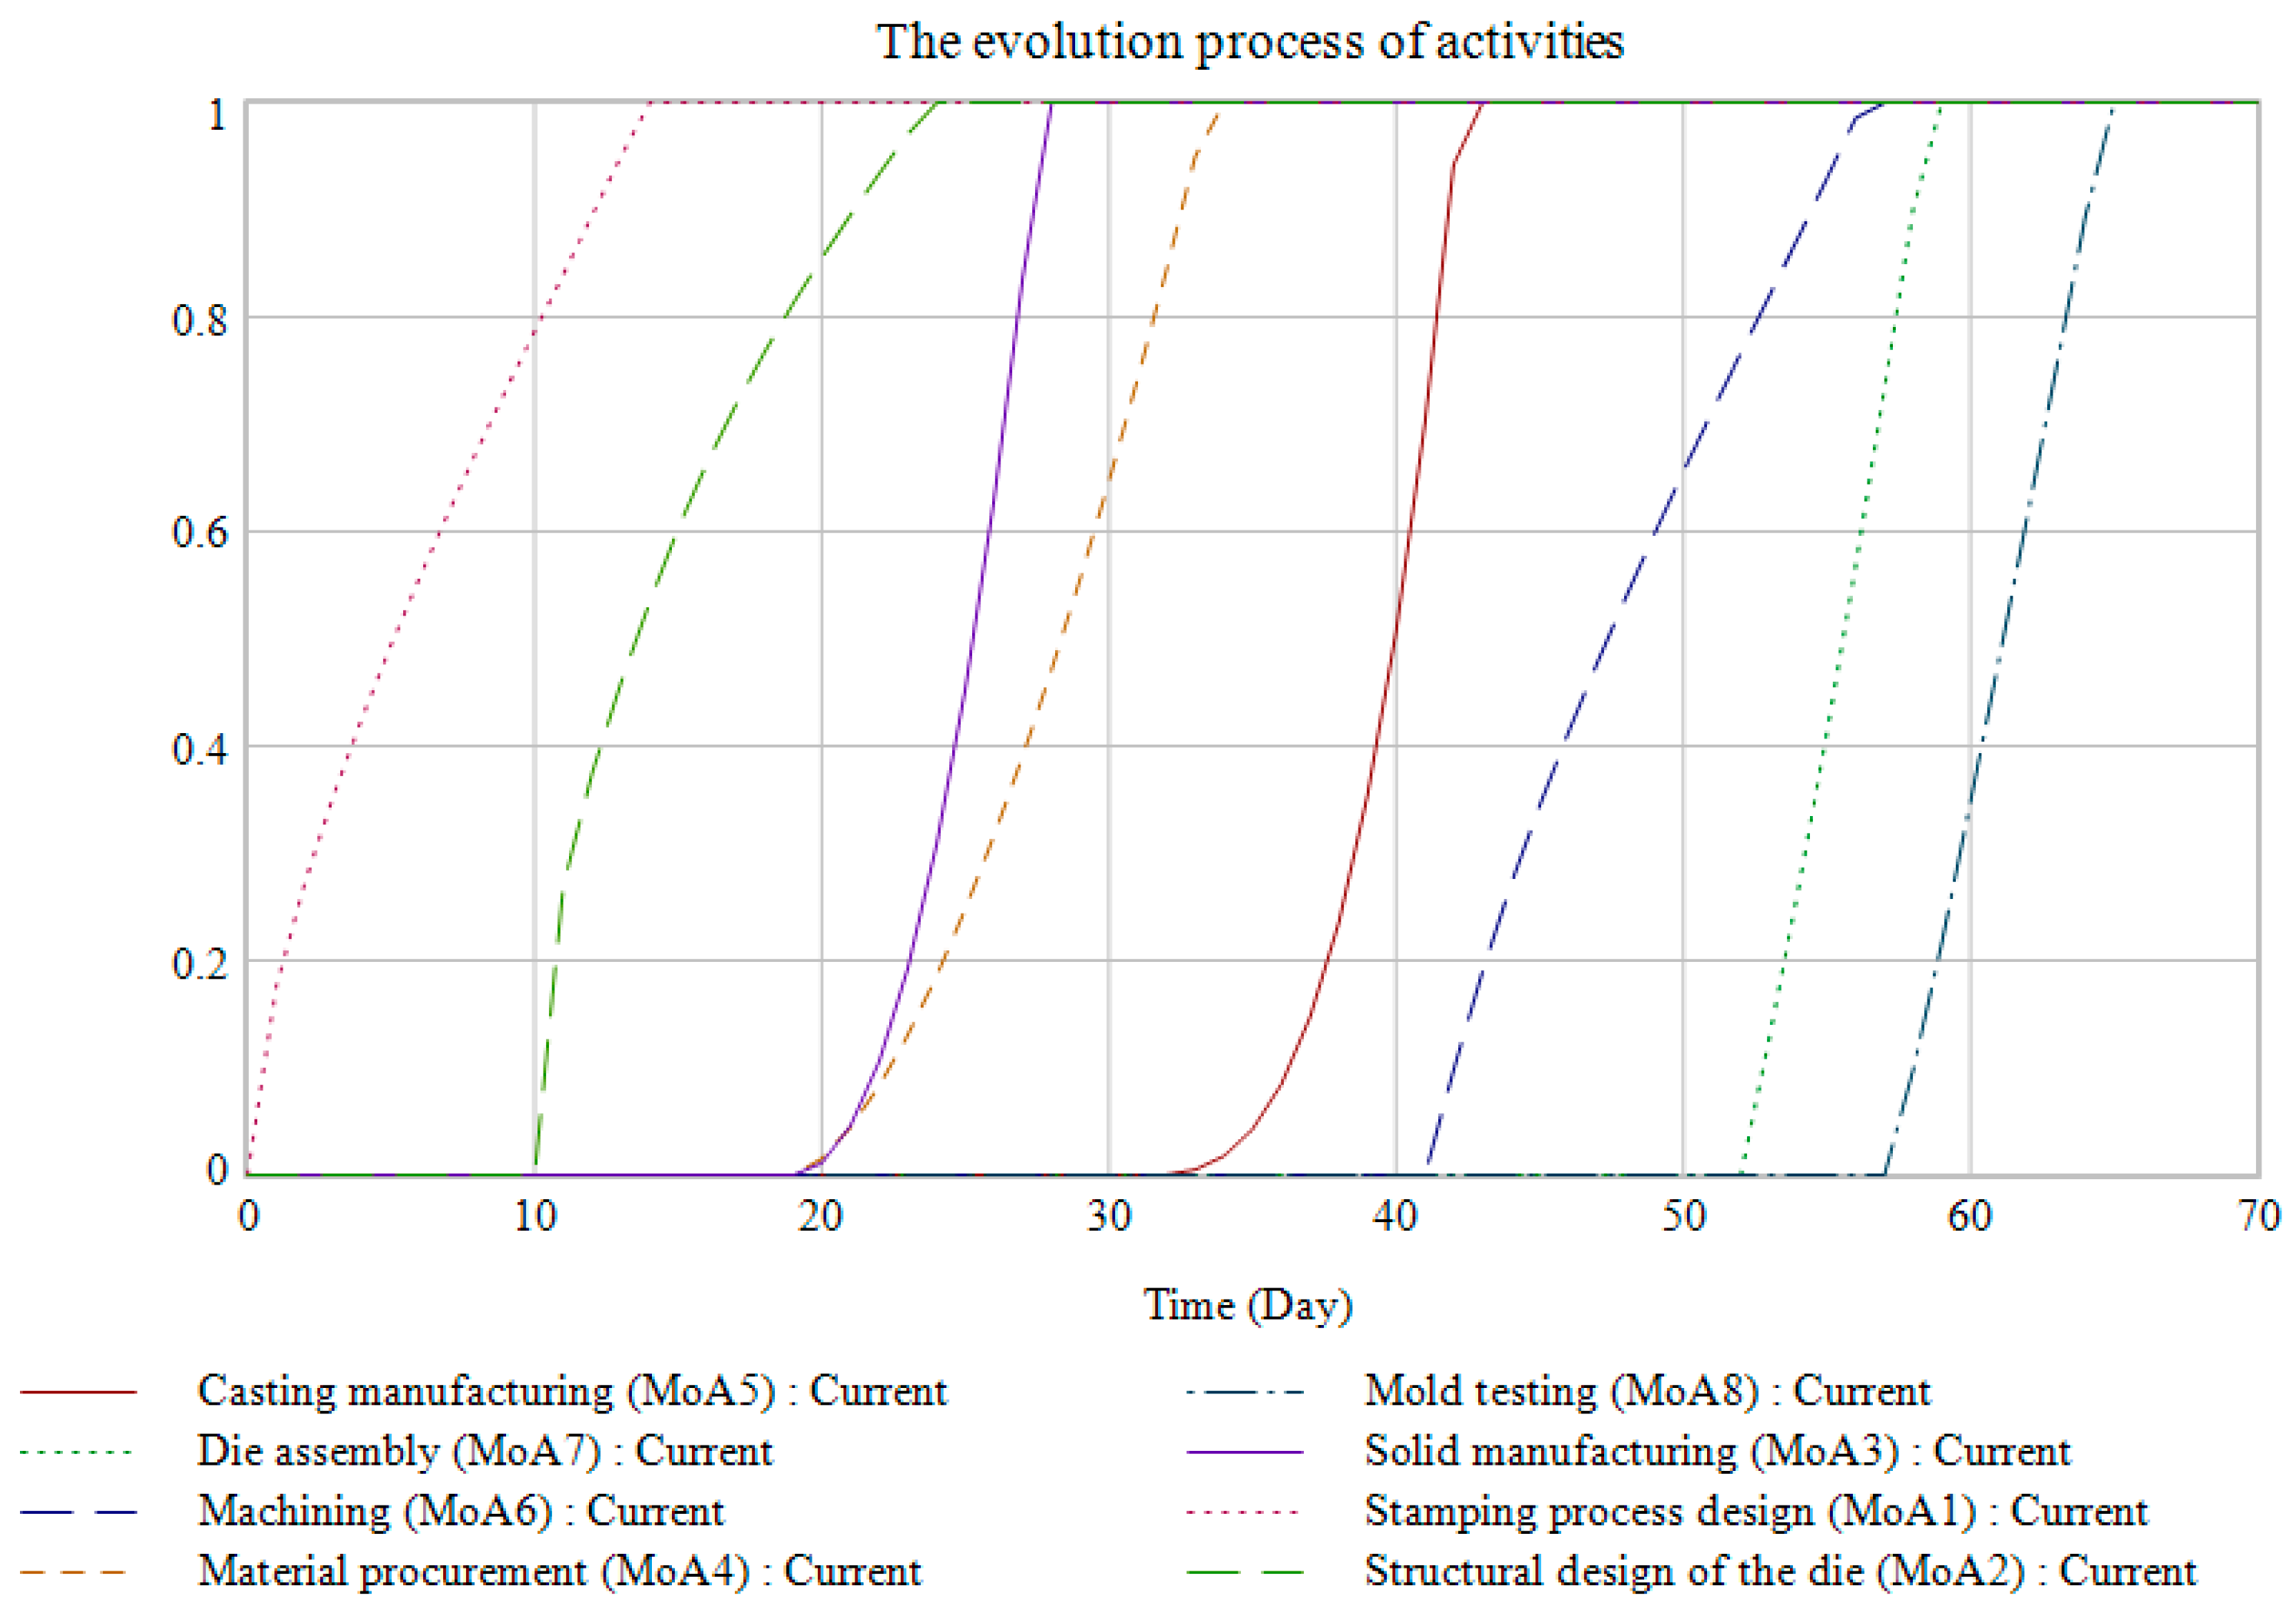
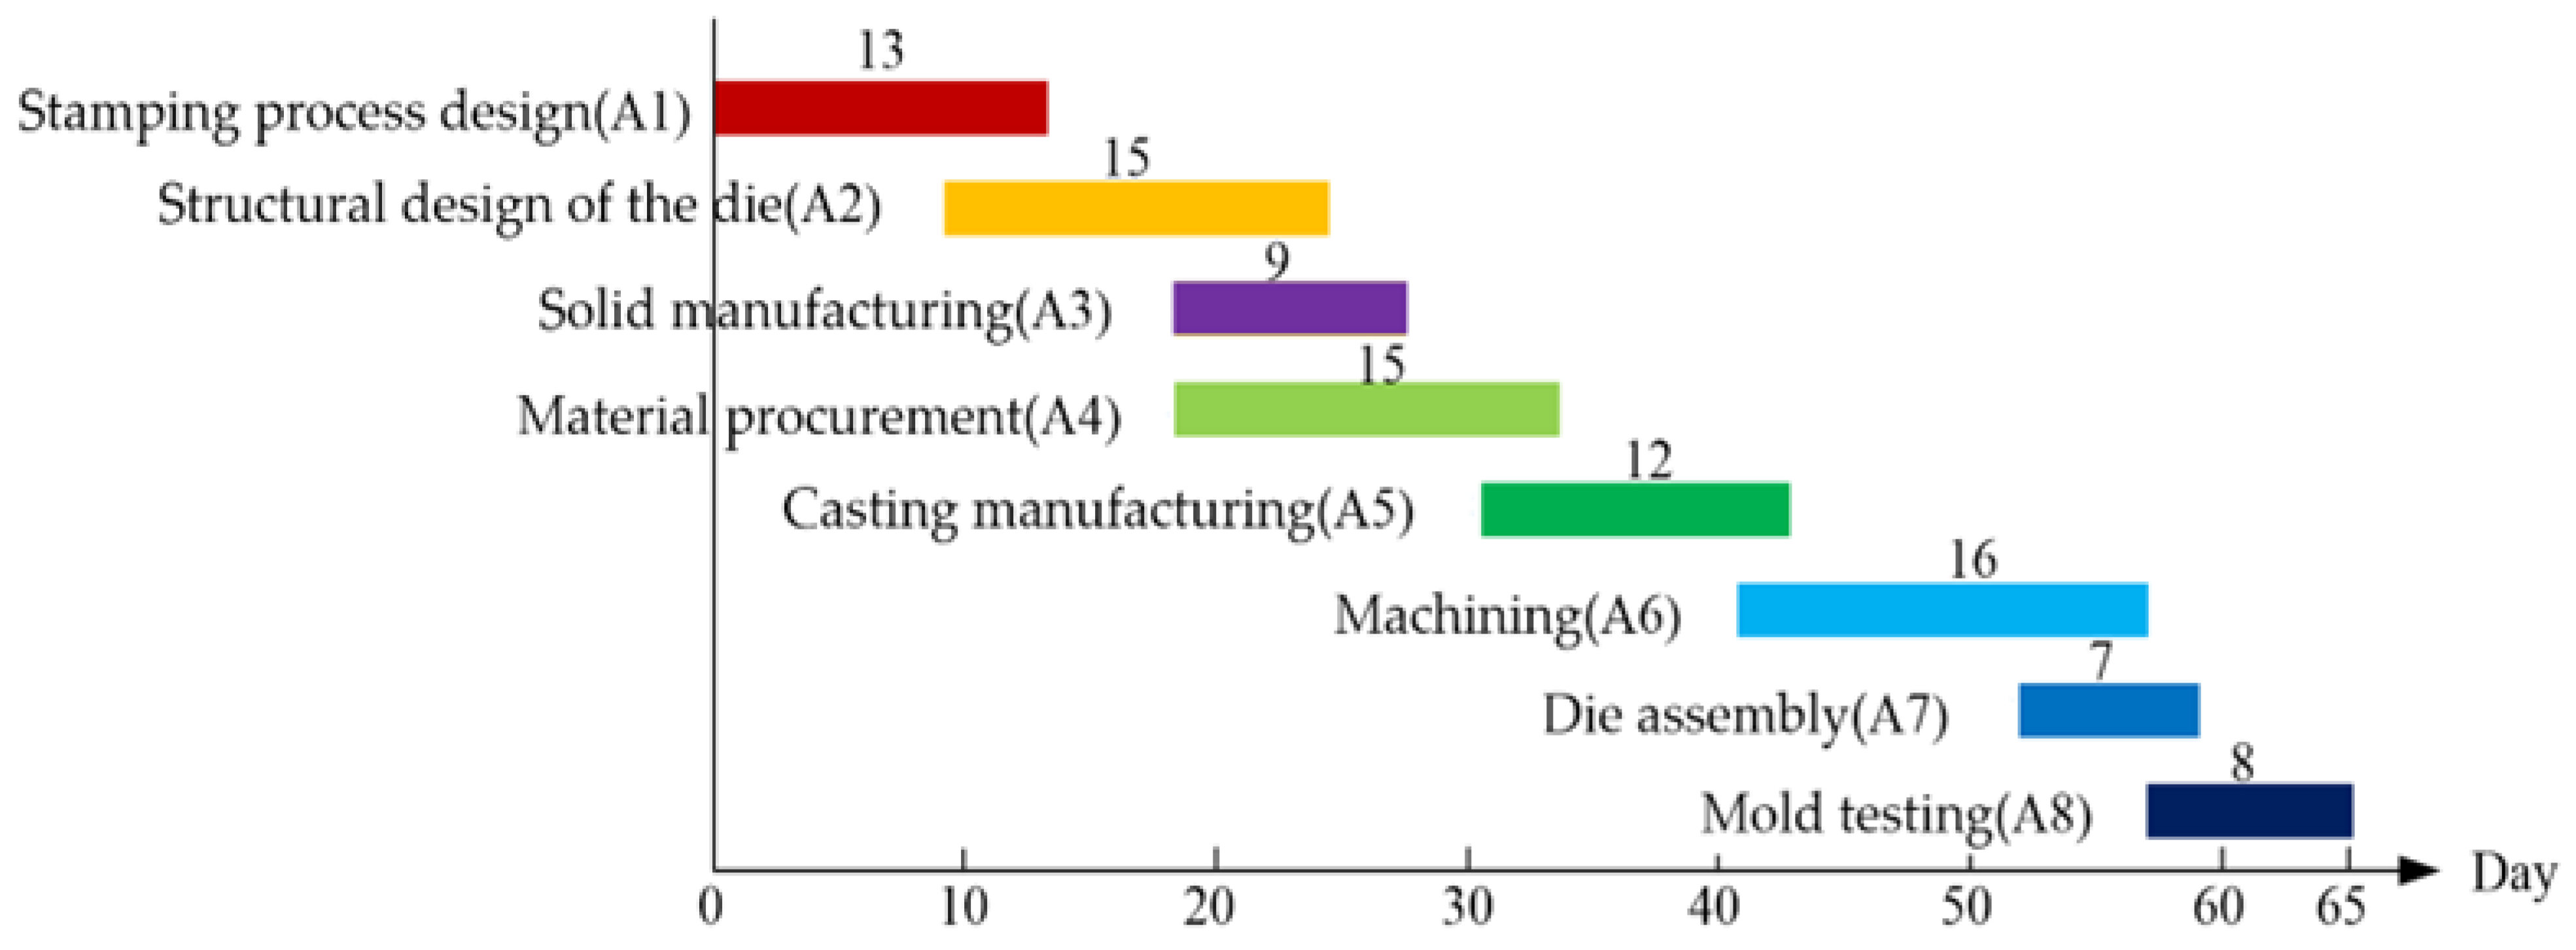
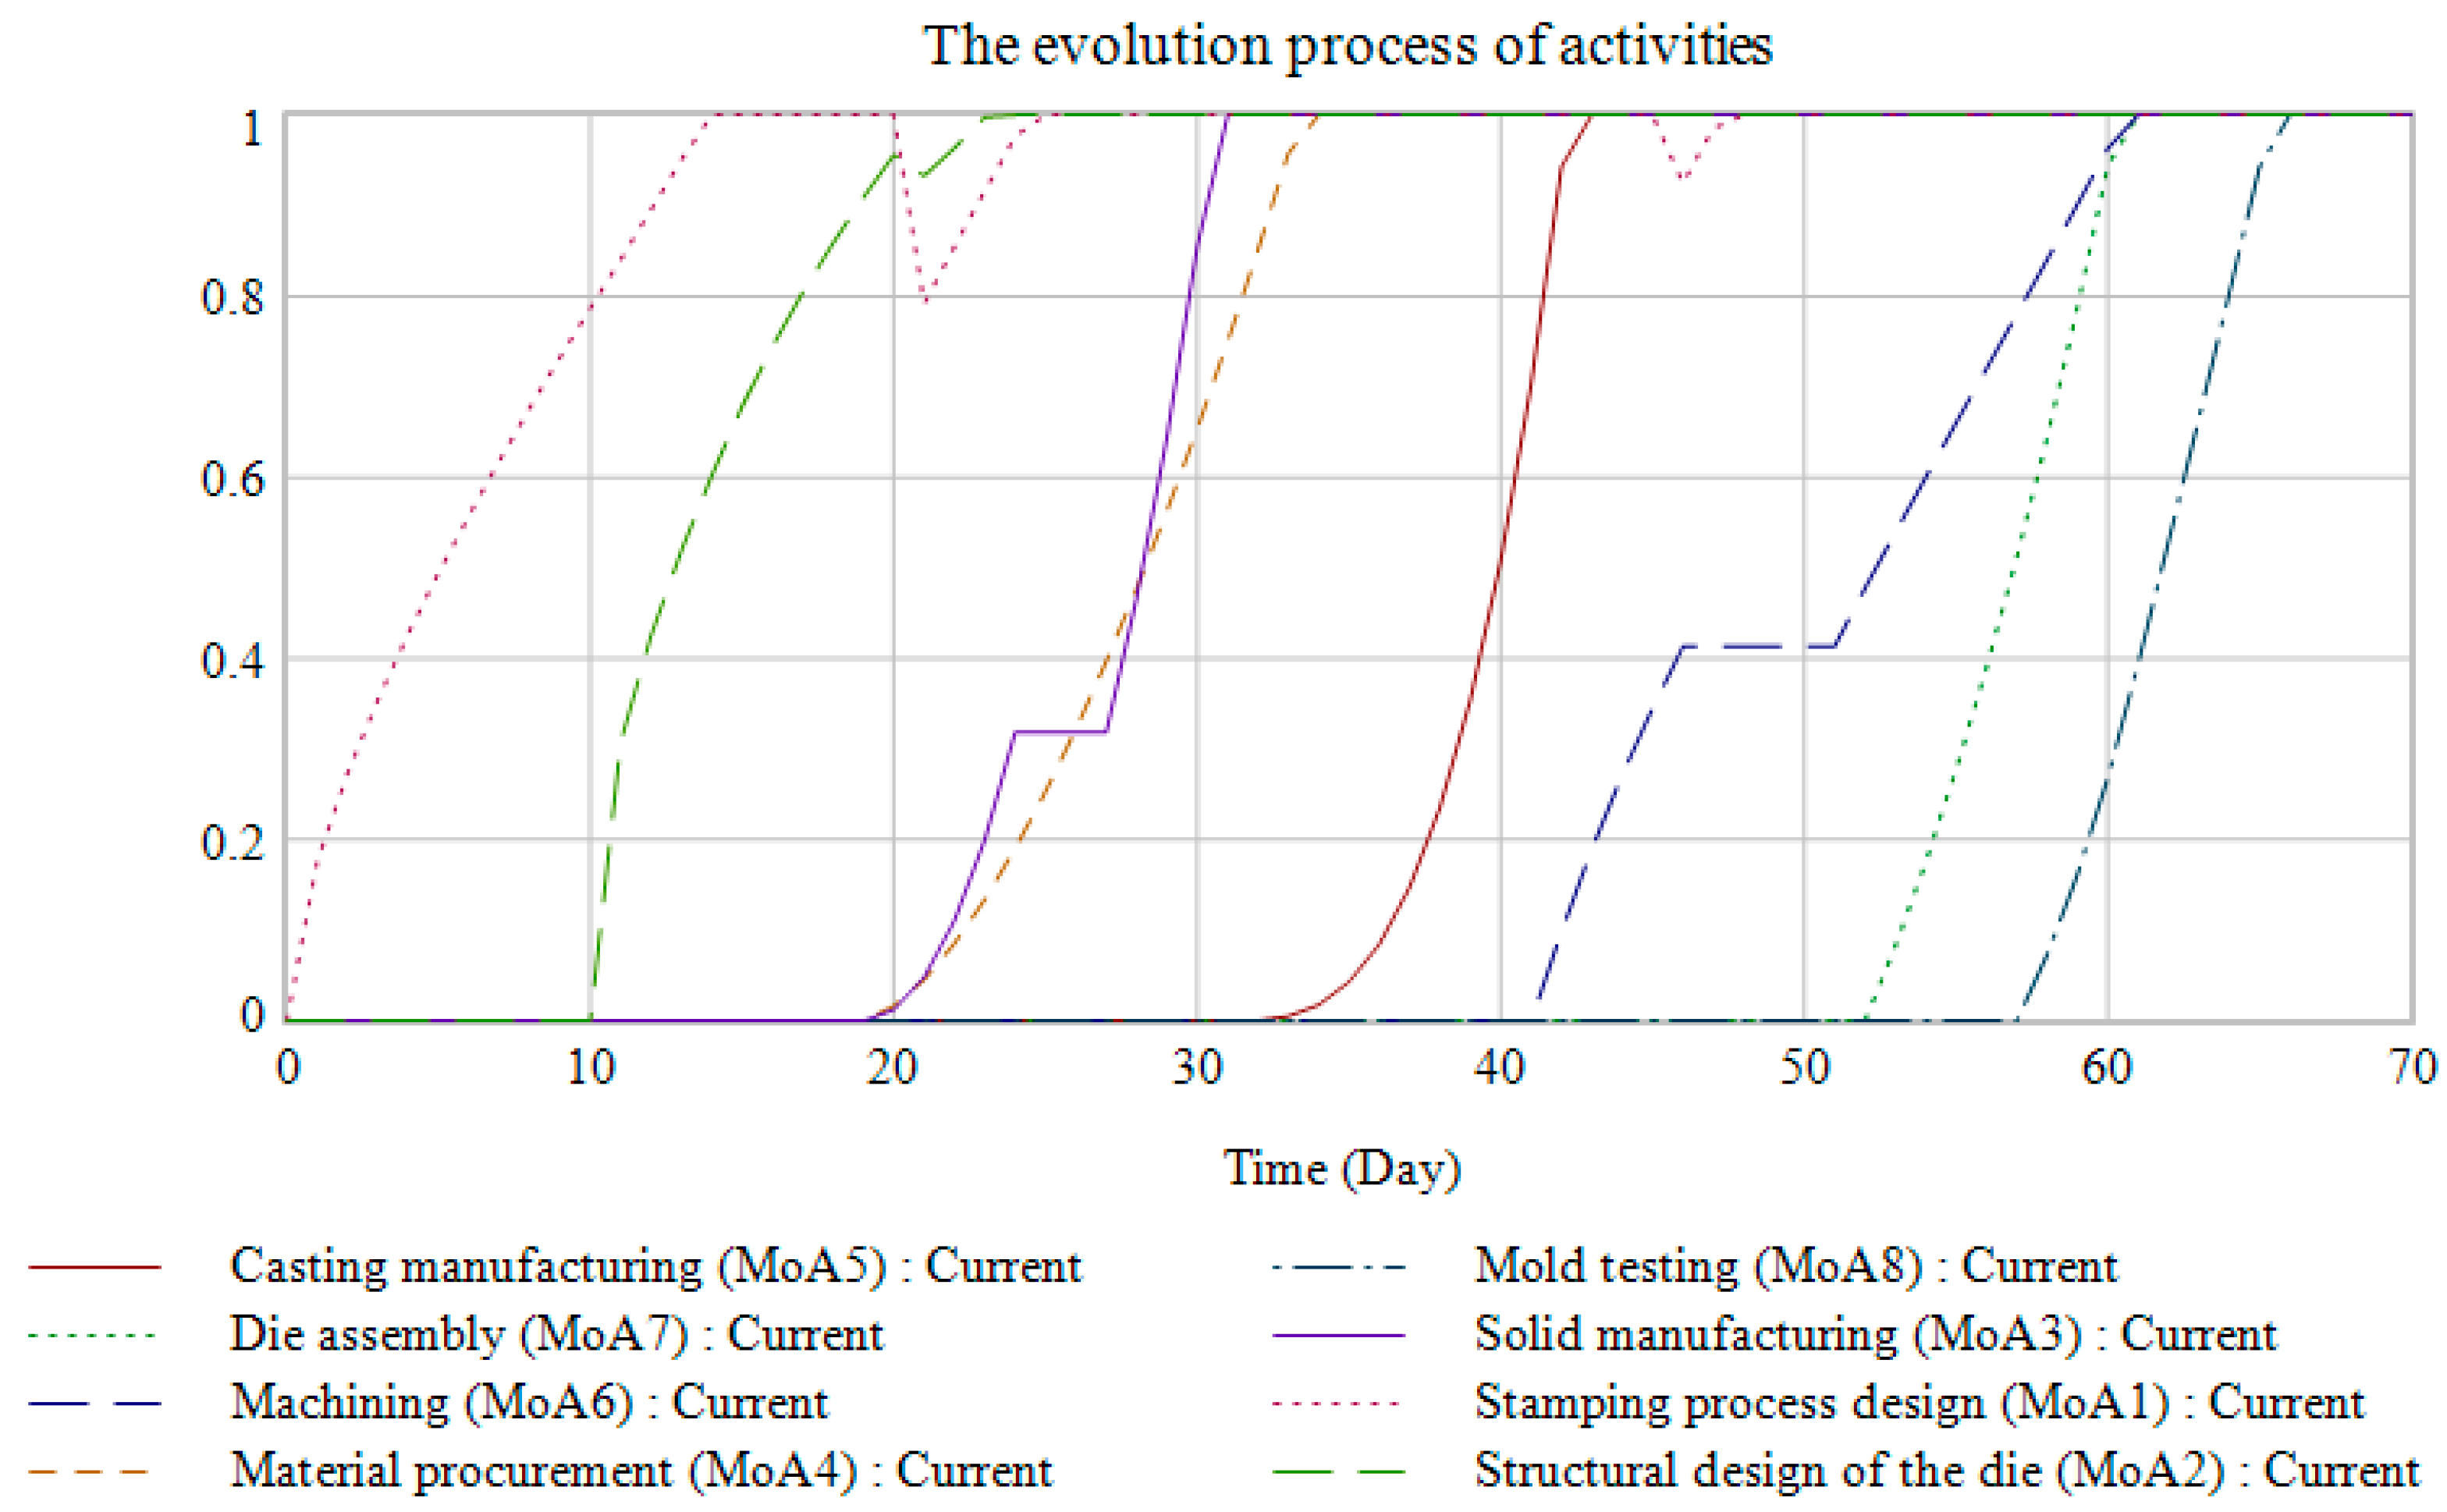
The information evolution process is depicted in Figure 11 and simulation was carried out in accordance with the activity plan’s start time, assuming that the maturity of input information in the external environment was 1. The process takes 65 days and costs ¥37,070 in total. When each activity is carried out in accordance with the original plan (i.e., when the ES value in the figure is larger than 0), Figure 12 replicates the actual execution time of each activity based on which resources can be arranged reasonably. The fundamental duration of the activity “Stamping process design (A1)” is 10 days, but it actually takes 13 days to complete because of the input information. In a similar manner, the Gantt chart in Figure 13 displays the estimated execution time of additional tasks.
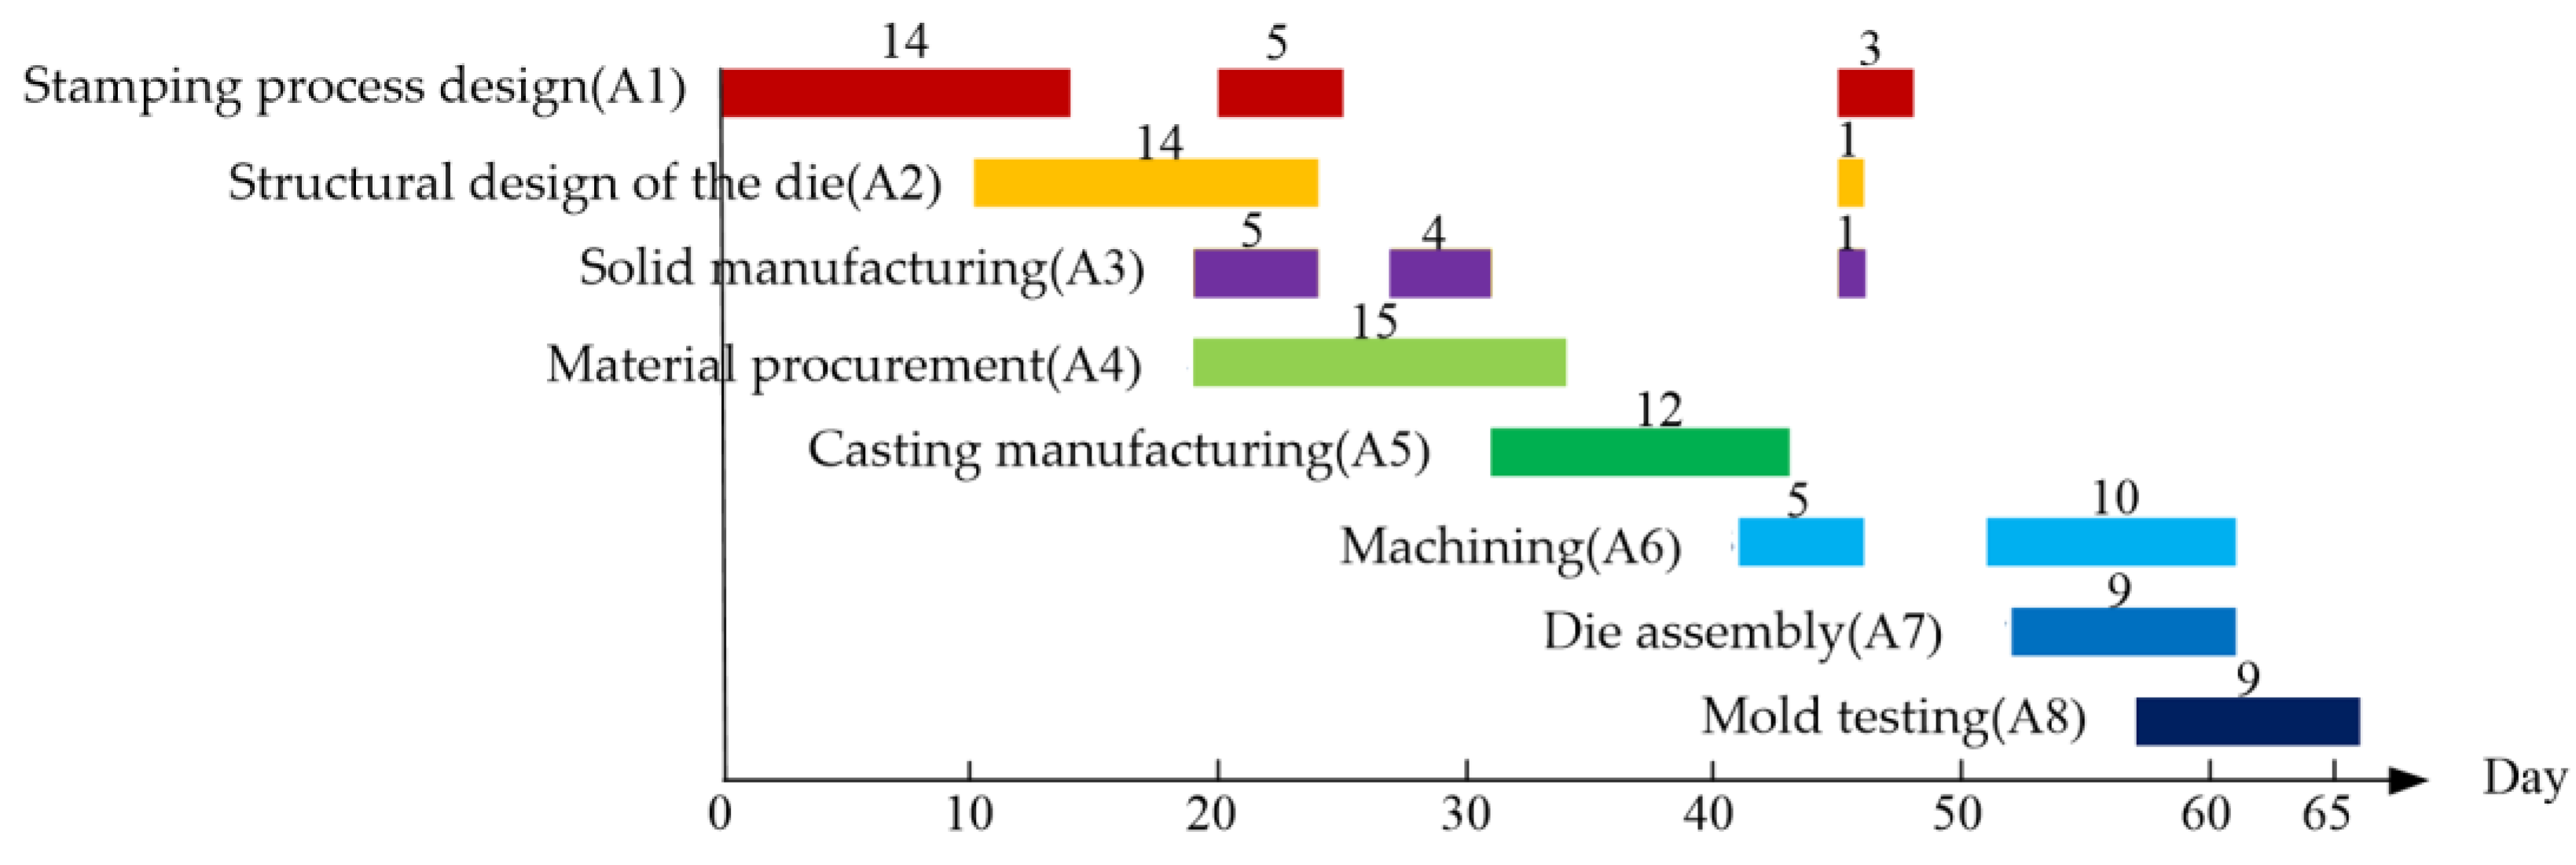
The advancement of operations is typically impacted by a few undetermined variables, such as shifting client demands or a lack of resources. It was assumed that during the development phase the following unpredictable occurrences take place:
(1)
There is a 40% change rate in client demand at time = 20; there is another 20% change rate in consumer requirements at time = 45.
(2)
The activity “Solid manufacturing (A3)” is suspended when the time is between 24 and 26 due to a lack of resources needed for the activity.
(3)
The activity “Machining (A6)” is suspended when the time is between 46 and 50 due to a lack of resources needed for the activity.
At this stage, certain adjustments were made to the model’s parameters, and Figure 14 displays the outcomes of the simulation. A Gantt chart similar to the one is presented in Figure 15.

5. Conclusions

Several related tasks converge during the development of a new product to form a complex system with essential feedback and dynamic characteristics. A system dynamics simulation model based on information maturity is the scientific breakthrough presented in this paper. It has the following advantages:
(1)
The proposed model has a strong application across a range of development processes and requires a minimal number of variables to accurately estimate the process length and cost while simulating the dynamic features of the process.
(2)
The development process can be optimized by adjusting the basic duration, activity evolution coefficient, and activity correlation, among other parameters. Using the model as a guide to determine the optimal process parameter solution can help create the best possible development process structure.
(3)
This model can simulate the actual execution time of each task throughout the original schedule, as well as deviations caused by random, intermittent events. For instance, adjusting the simulation’s parameters can enhance the initial design and serve as a guide for resource allocation in case client needs evolve, resources become limited, or errors occur during the design process.
This work introduces a novel approach to applying system dynamics techniques to process simulation and serves as a guide for investigating the dynamic behavioral characteristics of various processes. Nevertheless, setting the basic parameters for model operation requires specialized research, and uncertain factors during model operation need to be set randomly in advance. This may deviate from the actual uncertainty that occurs, and adjustments need to be implemented during operation. The next phase of the research will investigate real-time scheduling techniques and applications for simulation-based development processes by integrating intelligent optimization algorithms with system dynamics simulation.

Author Contributions

Conceptualization, F.Y. and Q.G.; methodology, F.Y.; software, F.Y.; validation, J.S.; formal analysis, Q.G.; investigation, F.Y. and J.S.; resources, J.S.; data curation, F.Y.; writing—original draft preparation, F.Y.; writing—review and editing, F.Y.; visualization, F.Y.; supervision, Q.G.; project administration, F.Y.; funding acquisition, Q.G. and F.Y. All authors have read and agreed to the published version of the manuscript.

Funding

This research was funded by the Doctoral Foundation of Shandong Jianzhu University, grant number X19094Z, and Shandong Province Natural Science Foundation of China under Grant, grant number ZR2020ME139.

Data Availability Statement

Some or all data that support the findings of this study are available from the first author upon request.

Conflicts of Interest

The authors declare no conflict of interest.

Appendix A

The product development process can be seen as the accumulation of information. Activities are the fundamental unit of information accumulation. For a single activity, the accumulation of information is the process of continuously generating and transmitting new information based on certain input information, as shown in Figure A1. The process of transforming input information into output information is called information evolution.
Figure A1. A single activity.
Systems 12 00172 g0a1
In this article, we also refer to the process of continuously generating and transmitting new information through activities as the evolution process of activity. The completeness of information is referred to as information maturity, which is a value ranging from 0 to 1. The higher the value, the more complete the information. The degree of evolution of activities is referred to as activity maturity, which can be seen as a concept akin to information maturity, with its value also ranging from 0 to 1. Before the activity is executed, its maturity is considered to be 0. As execution of the activity begins and the development process progresses, its maturity will gradually increase until the activity is completed, reaching a maturity level of 1. In fact, the maturity of an activity is equal to the maturity of its output information. When the maturity of the output information reaches 1, it indicates that the output information is complete and can represent the completion of the activity. Therefore, in this article, activity maturity also represents the maturity of the output information of the activity; that is, the maturity of the activity is equal to the maturity of the output information of the activity.
When scheduling and managing the development process, an initial schedule is typically established for each activity based on historical data and past experience. If the input information for an activity is complete (i.e., the maturity of the input information is 1), it can be assumed that after a certain duration, the output information of the activity will also be complete (i.e., the maturity of the output information can also reach 1), and the activity can be finished without the need for rework. In practice, due to the dynamic and ever-changing nature of information, as well as the impact of development time and complex environments, it is challenging to wait for the input information of an activity to be complete before starting execution. Therefore, an activity often begins execution when its input information is incomplete (i.e., the maturity of input information < 1). In theory, if the input information of an activity is incomplete, its output information cannot be complete. In this case, no matter how hard the developers work or how long the activity is executed, the activity maturity will not reach 1.
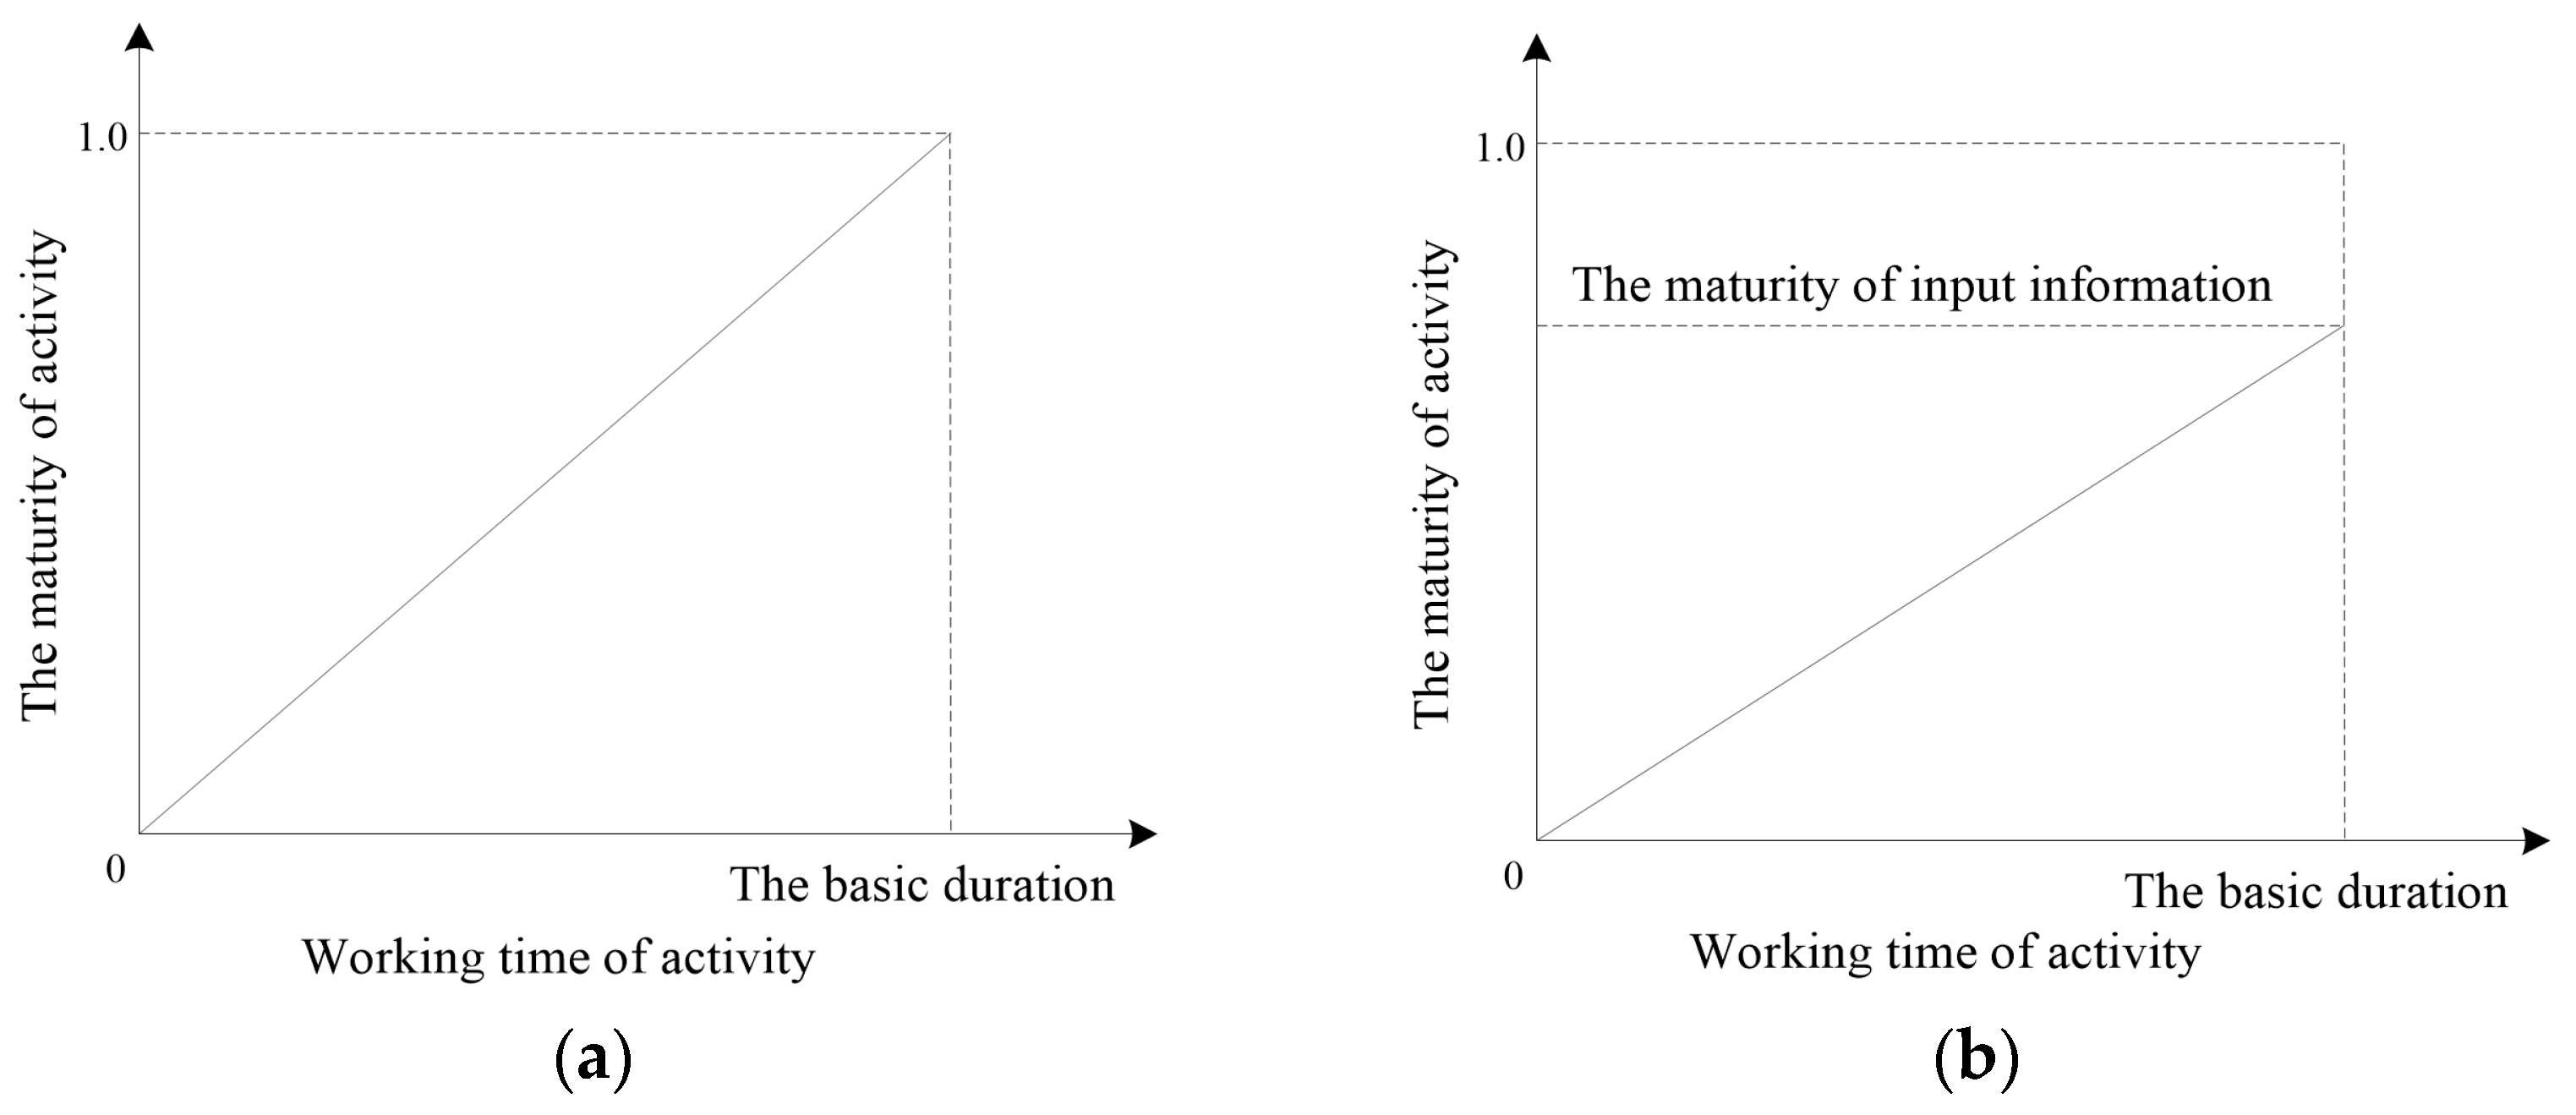
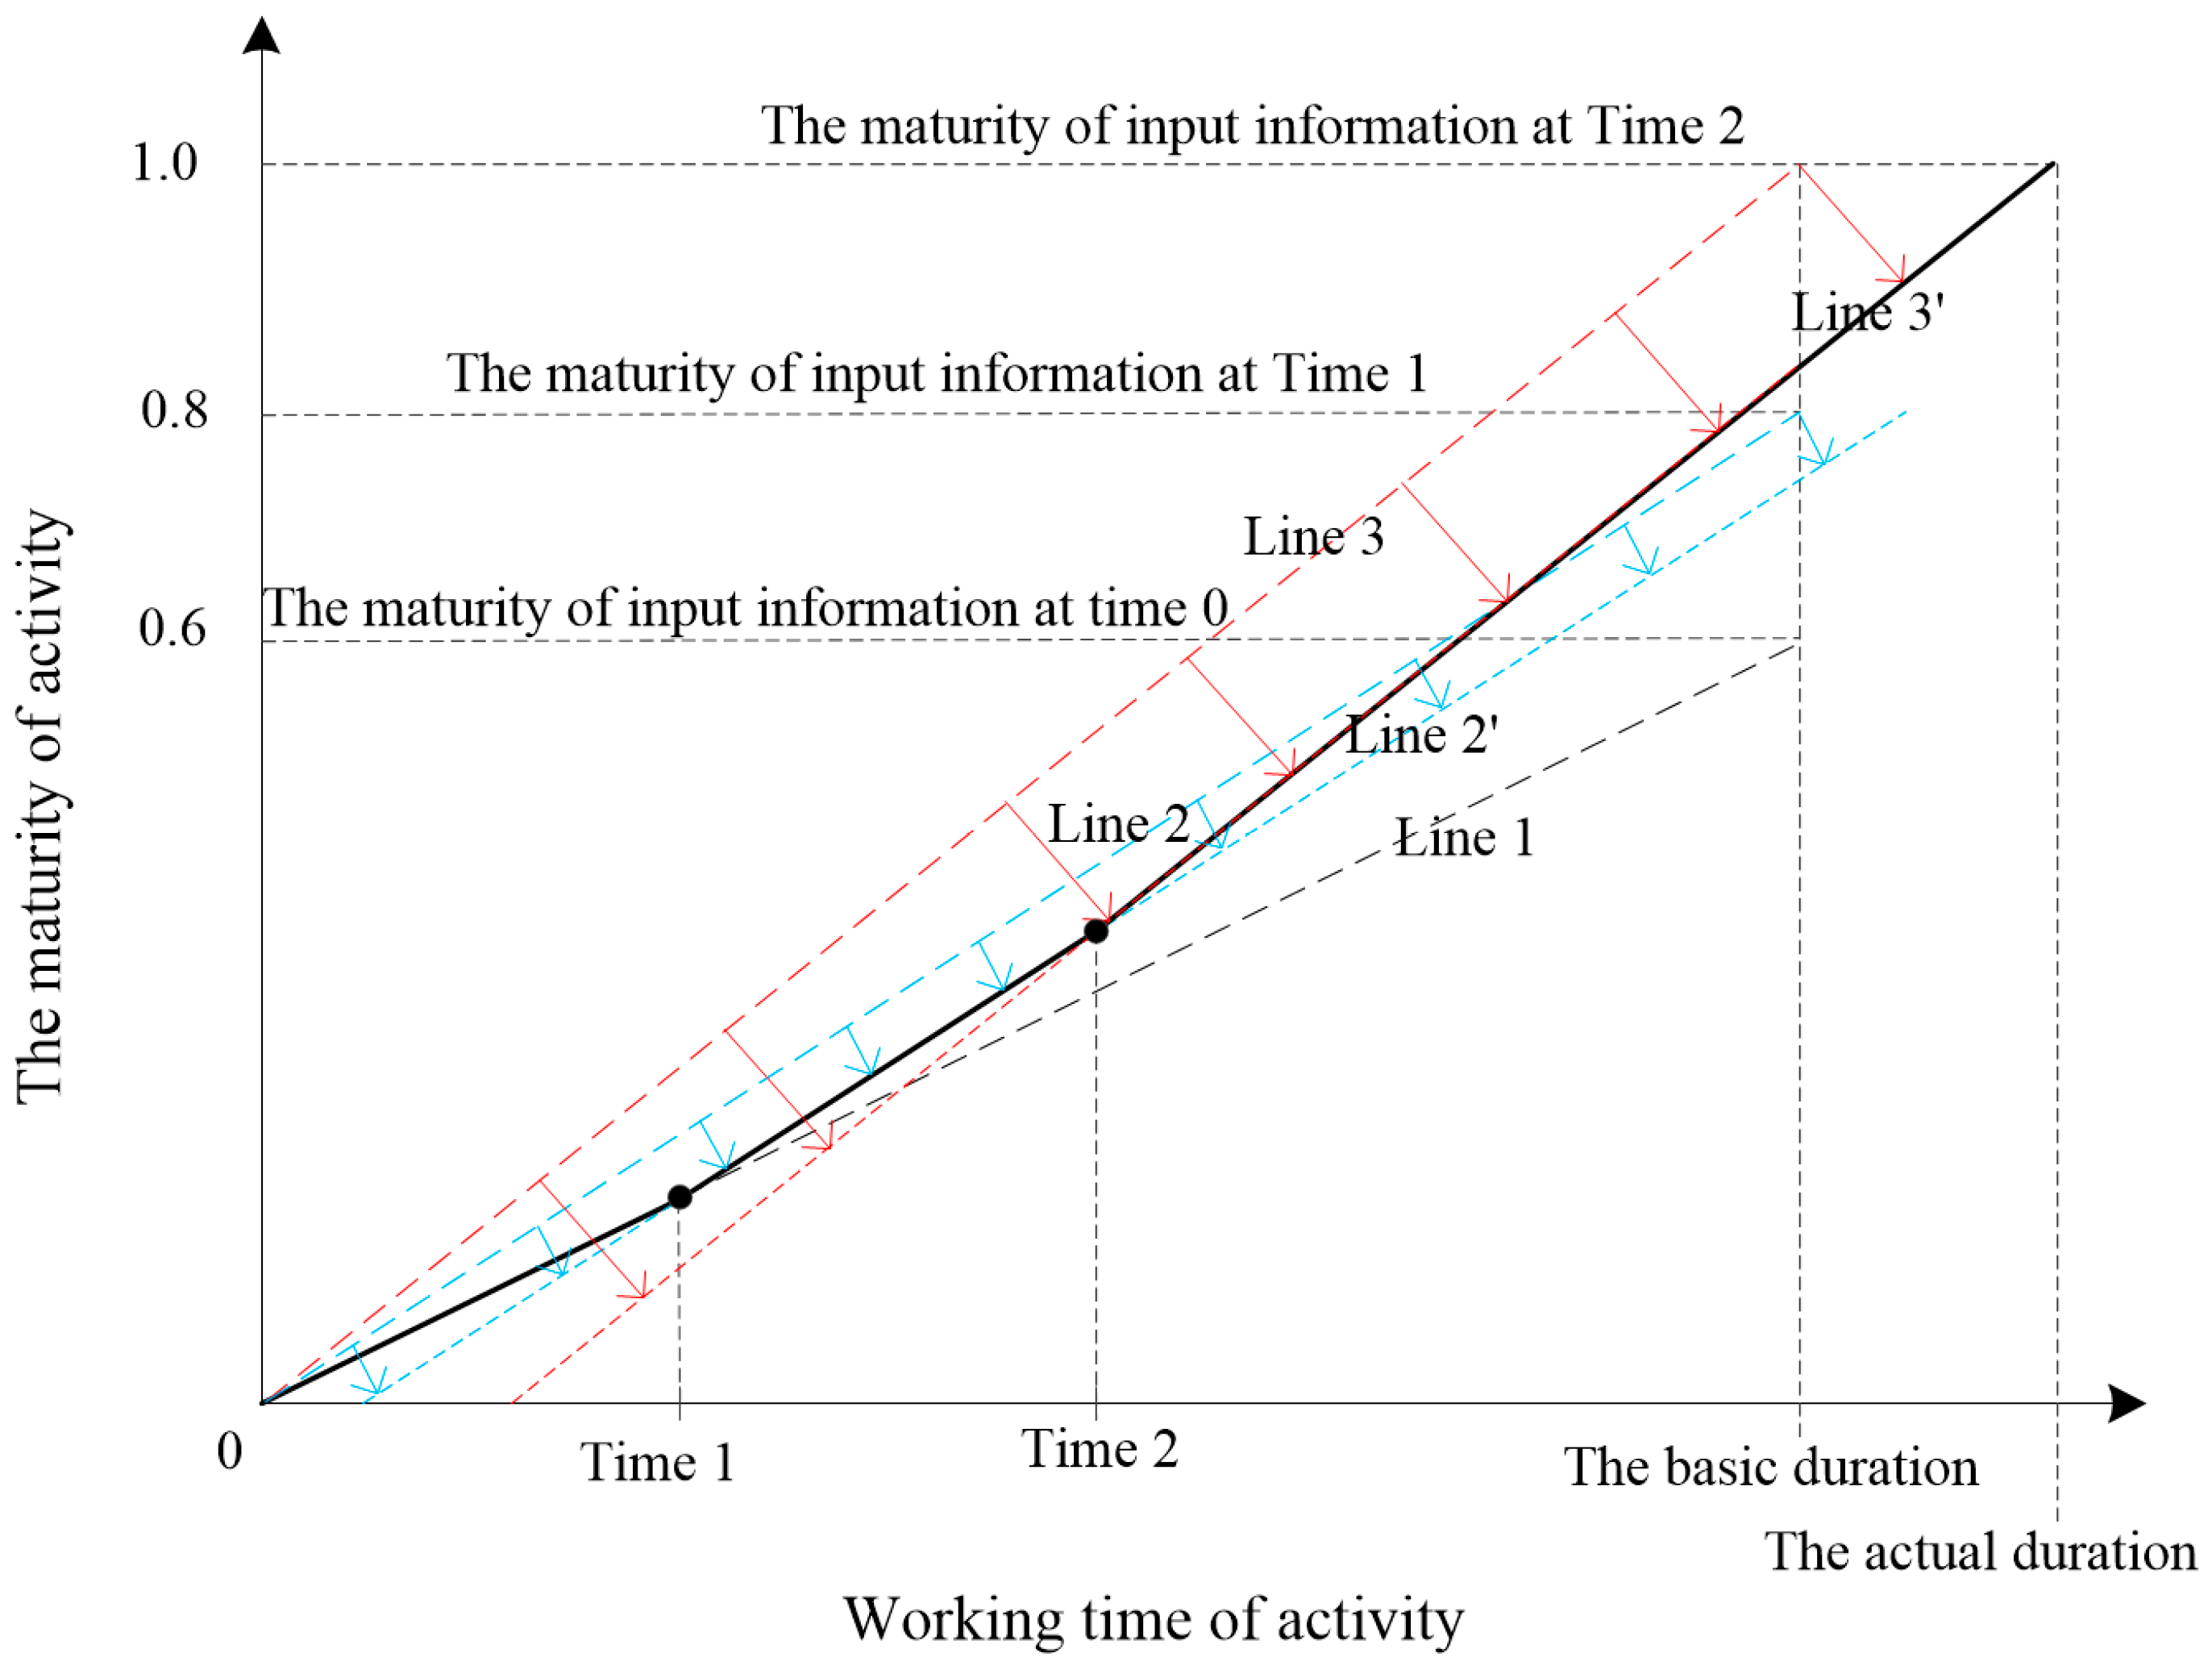
Assuming that the completion level of activities during the development process can reach a specific value at different time points, the evolution process of activities can form a trajectory, as illustrated in Figure 2. Figure A2a illustrates the evolution process of activity within a duration with complete input information, while Figure A2b depicts the evolution process of activities within a duration with incomplete input information. For the situation depicted in Figure A2b, if the input information for the activity gradually becomes more complete as the development process advances, the activity can be finalized through rework until it reaches completion, meaning the maturity of the activity reaches 1. The actual duration of the activity should exceed the provided basic duration. The evolution process is depicted in Figure A3.
Figure A2. (a) Evolution process of activity when the maturity of input information is 1; (b) evolution process of activity when the maturity of input information is less than 1.
Systems 12 00172 g0a2
Figure A3. The evolution process of activity as the maturity of input information increases.
Systems 12 00172 g0a3
In Figure A3, it is assumed that the maturity of input information is 0.6 at the beginning of execution, updated to 0.8 at Time 1, and updated to 1 at Time 2. Since the input information maturity is less than 1, the evolution trajectory of the activity will be Line 1 at the beginning of execution. When the working time reaches Time 1, the evolution trajectory will change to Line 2’ (derived from translating Line 2) due to the update of input information. When the working time reaches Time 2, the evolution trajectory will change to Line 3’ (derived from translating Line 3) due to the input information being updated to 1. This change will persist until the maturity reaches 1 and the activity is completed.
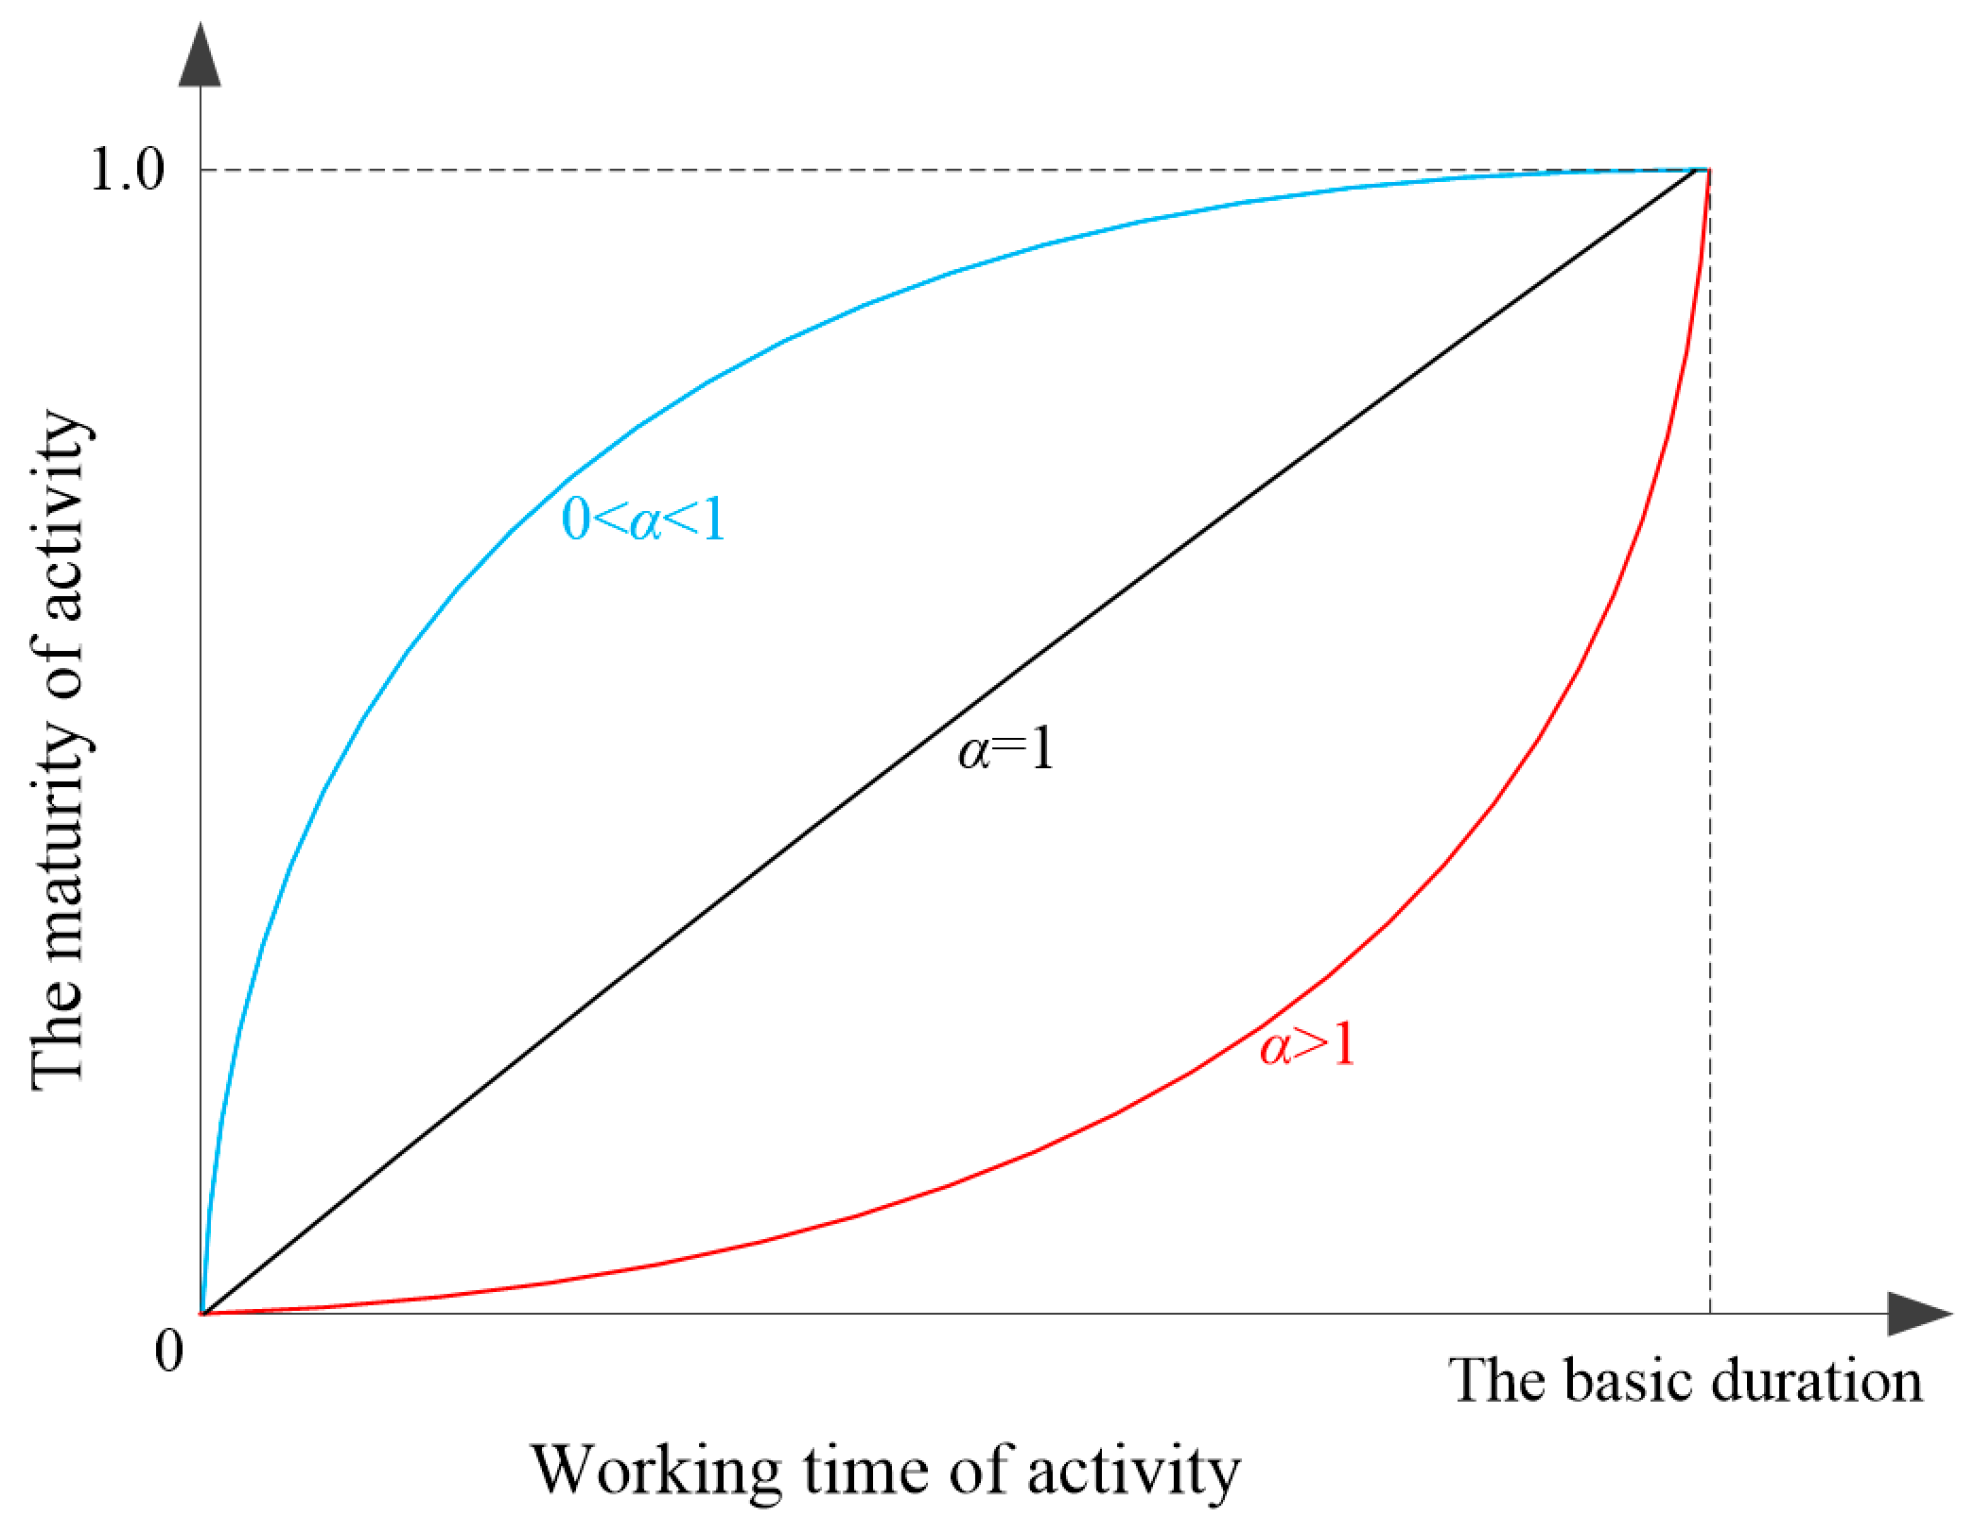
According to the law of information evolution, the evolution process of activities can be categorized into rapid evolution and slow evolution. Generally speaking, different activities undergo distinct information evolution processes, and this evolution pattern is characterized by the evolution coefficient (denoted as α). The evolution trajectory of activity maturity can be expressed as a time function with the evolution coefficient and the basic duration as parameters, as follows:
M a t u r i t y   o f   a c t i v i t y = t T h e   b a s i c   d u r a t i o n α
Assuming the maturity of the input information for the activity is 1, the evolution processes of the activity under different evolution coefficients are shown in Figure A4. If 0 < α < 1, the evolution process is rapid, and most of its work is completed in the first half of the activity execution. If α > 1, the evolution process is slow, and most of the work can only be completed in the latter half of the activity execution. If α = 1, the speed of evolution will be uniform.
Figure A4. The evolution process of activity under different evolution coefficients.
Systems 12 00172 g0a4
The development process typically consists of multiple activities, and the interrelationships among these activities constitute the exchange of information between them. The input information for an activity may originate from both the input information of all activities within the process (including the activity itself) and external information outside the process. As a process consisting of two activities, information exchange is illustrated in Figure A5.
Figure A5. Example of information exchange between two activities.
Systems 12 00172 g0a5
The completeness of information from various sources collectively determines the completeness and maturity of input information. For one activity, the impact of input information from different sources varies. In this article, the importance coefficient is used to indicate the degree to which information affects the activity. For example, using w12 represents the importance coefficient of information from Activity 2 to Activity 1, and w1e represents the importance coefficient of external information to Activity 1. The maturity of input information for Activity 1 can be calculated based on the maturity of output information for Activity 2 and the maturity of external information, as follows: the maturity of input information for Activity 1 = the maturity of output information of Activity 2 × w12 + the maturity of external information × w1e. The input information for Activity 2 consists of external information, the output information of Activity 1, and the output information of Activity 2 itself. Therefore, the maturity of the input information is calculated as follows: the maturity of input information of Activity 2 = the maturity output information of Activity 1 × w21 + the maturity output information of Activity 2 × w22 + The maturity of external information × w2e.
For development processes composed of more activities, the principle is similar. The theory of evolution process of activity is the foundation to establish the simulation model in this paper.

Appendix B

The simulation process is continuous, and the minimum time period set as the time interval for information exchange between activities is called the step size. Constructing model equations involves utilizing a universal expression of system dynamics equations. For instance, using X to denote state variables or auxiliary variables, where X•K represents the current value of variable X, X•J represents the previous value of variable X, and X•L represents the next value of variable X. If Y represents the rate variable, then Y•JK represents the change value of variable Y in the previous step, and Y•KL represents the change value of variable Y in the next step.
The state variables in the model include maturity of activity output information (MoA), activity cost (C), and completion time (T). Taking Activity i as an example, the leveling equations are established as follows:
M o A i K = M o A i J + D T E S i J K
C i K = C i J + T i u c i
T i K = T i J + T i
where MoAi represents the maturity of output information for Activity i, DT is the step size, and ΔT is the simulation time interval. In this article, DT and ΔT are consistent. ESi represents the rate of information evolution of Activity i. In Equation (A3), Ci represents the cost of Activity i, and uci represents the unit time cost of Activity i. In Equation (A4), Ti represents the actual execution time of Activity i.
When influenced by factors such as changes in customer requirements, resource shortages, and design errors, the quality of input information may decrease. At this time, the following adjustments need to be made to Equation (A2):
M o A i K = M o A i K 1 r i e K j = 1 n 1 r i j K
where rie and rij respectively represent the impact coefficients of external environmental changes and design errors of Activity j on the maturity of output information of Activity i. The occurrence time and probability of these factors are irregular and are represented by random events during simulation.
The main rate variables in the model include the rate of activity information evolution (ESi), the increase in activity costs (ΔCi), and the increased activity time (ΔTi). The rate equations are established as follows:
E S i K L = M o I i K t i K + t d i α i M o A i K
C i K L = I F   T H E N   E L S E E S i K L > 0 , u c i , 0
T i K L = I F   T H E N   E L S E T i m e S T i , T , 0
The increase in activity cost is related to whether the activity is executed. If it is executed, the cost increase value is the unit time cost; otherwise, it is 0. In Equation (A8), STi represents the start time of the activity plan, and the completion time of the activity is calculated from the start time. For each step, increase the time interval ΔT.
The equation for the maturity of input information (MoIi) is:
M o I i K = w i e M o E K + j = 1 n w i j M o A j K
ti represents the theoretical execution time of Activity i, calculated as follows:
t i K = M o A i K M o I i K 1 α i d i

References

  1. Kasperek, D.; Schenk, D.; Kreimeyer, M.; Maurer, M.; Lindemann, U. Structure-Based System Dynamics Analysis of Engineering Design Processes. Syst. Eng. 2016, 19, 278–298. [Google Scholar] [CrossRef]
  2. Browning, T.R.; Fricke, E.; Negele, H. Key concepts in modeling product development processes. Syst. Eng. 2010, 9, 104–128. [Google Scholar] [CrossRef]
  3. Strogatz, S.H. Exploring complex networks. Nature 2001, 410, 268–276. [Google Scholar] [CrossRef]
  4. Browning, T.R.; Eppinger, S.D. Modeling impacts of process architecture on cost and schedule risk in product development. IEEE Trans. Eng. Manag. 2002, 49, 428–442. [Google Scholar] [CrossRef]
  5. Attari-Shendi, M.; Saidi-Mehrabad, M.; Gheidar-Kheljani, J. A Comprehensive Mathematical Model for Sequencing Interrelated Activities in Complex Product Development Projects. IEEE Trans. Eng. Manag. 2019, 69, 2619–2633. [Google Scholar] [CrossRef]
  6. Du, Y.; Liu, D. A novel approach to relative importance ratings of customer requirements in QFD based on probabilistic linguistic preferences. Fuzzy Optim. Decis. Mak. 2021, 20, 365–395. [Google Scholar] [CrossRef]
  7. Zaim, S.; Sevkli, M.; Camgöz-Akdag˘, H.; Demirel, O.F.; Yayla, A.Y.; Delen, D. Use of ANP weighted crisp and fuzzy QFD for product development. Expert Syst. Appl. 2014, 41, 4464–4474. [Google Scholar] [CrossRef]
  8. Tanasić, Z.; Kecman, B.; Janjić, G. QFD Method-A Model for Product Improvement and Development. Int. J. Eng. 2021, 4, 75–79. [Google Scholar]
  9. Hong, S.K.; Schniederjans, M.J. Balancing concurrent engineering environmental factors for improved product development performance. Int. J. Prod. Res. 2000, 38, 1779–1800. [Google Scholar] [CrossRef]
  10. Shidpour, H.; Shahrokhi, M.; Bernard, A. A multi-objective programming approach, integrated into the TOPSIS method, in order to optimize product design; in three-dimensional concurrent engineering. Comput. Ind. Eng. 2013, 64, 875–885. [Google Scholar] [CrossRef]
  11. Lee, C.H.; Yang, M.Y.; Oh, C.W.; Gim, T.W.; Ha, J.Y. An integrated prediction model including the cutting process for virtual product development of machine tools. Int. J. Mach. Tools Manuf. 2015, 90, 29–43. [Google Scholar] [CrossRef]
  12. Setti, P.H.P.; Junior, O.C.; Estorilio, C.C.A. Integrated product development method based on Value Engineering and Design for Assembly concepts. J. Ind. Inf. Integr. 2021, 21, 100199. [Google Scholar] [CrossRef]
  13. David, M. Organising, valuing and improving the engineering design process. J. Eng. Des. 2013, 24, 524–545. [Google Scholar] [CrossRef]
  14. Diepold, K.J.; Biedermann, W.; Eben, K.G.M.; Kortler, S.; Lindemann, U. Combining structural complexity management and hybrid dynamical system modelling. Proc Des. 2010, 2, 1045–1054. [Google Scholar]
  15. Zhao, C.; Ogura, M.; Kishida, M.; Yassine, A. Optimal resource allocation for dynamic product development process via convex optimization. Res. Eng. Des. 2021, 32, 71–90. [Google Scholar] [CrossRef]
  16. Li, Y.; Zhao, W.; Zhang, W.; Chen, M. A dynamic model for engineering change propagations in multiple product development stages. Artificial Intelligence for Engineering Design. Anal. Manuf. 2022, 36, e13. [Google Scholar]
  17. Mutingi, M. Dynamic simulation for effective workforce management in new product development. Manag. Sci. Lett. 2012, 2, 2571–2580. [Google Scholar] [CrossRef]
  18. Ha, S.; Suh, H.W. A timed colored Petri nets modeling for dynamic workflow in product development process. Comput. Ind. 2008, 59, 193–209. [Google Scholar] [CrossRef]
  19. Arsham, H. Modeling and simulation for product design process. Simulation 2013, 89, 178–191. [Google Scholar] [CrossRef]
  20. Huang, H.Z.; Gu, Y.K. Modeling the Product Development Process as a Dynamic System with Feedback. Concurr. Eng. 2006, 14, 283–291. [Google Scholar] [CrossRef]
  21. Rodrigues, L.L.R.; Dharmaraj, N.; Rao, B.R.S. System dynamics approach for change management in new product development. Manag. Res. News 2006, 29, 512–523. [Google Scholar] [CrossRef]
  22. Zhang, X.; Tan, Y.; Yang, Z. Analysis of Impact of Requirement Change on Product Development Progress Based on System Dynamics. IEEE Access 2020, 9, 445–456. [Google Scholar] [CrossRef]
  23. Barbalho, S.C.M.; Leite, G.A.; Carvalho, M.M. Using System Dynamics for Simulating Mechatronic New Product Development. In Industrial Engineering and Operations Management I Proceedings in Mathematics & Statistics; Springer: Cham, Switzerland, 2019; Volume 280, pp. 195–206. [Google Scholar]
  24. Guimarães, L.; Marujo, E. Rework impacts evaluation through system dynamics approach in overlapped product development schedule. J. Technol. Manag. Innov. 2009, 4, 90–101. [Google Scholar]
  25. Reddi, K.R.; Moon, Y.B. Simulation of new product development and engineering changes. Ind. Manag. Data Syst. 2012, 112, 520–540. [Google Scholar] [CrossRef]
  26. Al-Kadeem, R.; Backar, S.; Eldardiry, M.; Haddad, H. Review on using system dynamics in designing work systems of project organizations: Product development process case study. Int. J. Syst. Dyn. Appl. 2017, 6, 52–70. [Google Scholar] [CrossRef]
  27. Krishnan, V.; Eppinger, S.D.; Whitney, D.E. A Model-Based Framework to Overlap Product Development Activities. Manag. Sci. 1997, 43, 437–451. [Google Scholar] [CrossRef]
  28. Su, J.C.P.; Chang, Y.L.; Ho, J.C. Framework of overlapping product development activities to maximize profit. J. Chin. Inst. Ind. Eng. 2011, 28, 616–627. [Google Scholar] [CrossRef]
  29. Wang, Z.; Wang, Y.; Qiu, S. Multi-segment and Multi-ply Overlapping Process of Multi Coupled Activities Based on Valid Information Evolution. Chin. J. Mech. Eng. 2013, 26, 176–188. [Google Scholar] [CrossRef]
  30. Unger, D.W.; Eppinger, S.D. Comparing product development processes and managing risk. Int. J. Prod. Dev. 2009, 8, 382–402. [Google Scholar] [CrossRef]
  31. Yang, Q.; Lu, T.; Yao, T.; Zhang, B. The impact of uncertainty and ambiguity related to iteration and overlapping on schedule of product development projects. Int. J. Proj. Manag. 2014, 32, 827–837. [Google Scholar] [CrossRef]
  32. Zapata-Roldan, F.; Sheikh, N.J. A Design Management Agent-Based Model for New Product Development. IEEE Trans. Eng. Manag. 2020, 69, 2026–2038. [Google Scholar] [CrossRef]
  33. Yang, C.L.; Hsu, H.K. Optimized new product development process. Int. J. Organ. Innov. 2019, 12, 320–332. [Google Scholar]
  34. Sankowski, O.; Küchenhof, J.; Dambietz, F.M.; Züfle, M.; Wallisch, A.; Krause, D.; Paetzold, K. Challenges in early phase of product family development processes. Procedia CIRP 2021, 100, 840–845. [Google Scholar] [CrossRef]
  35. Yang, C.L.; Hsu, H.K. Optimized new product development strategy. Int. J. Organ. Innov. 2019, 12, 110–121. [Google Scholar]
  36. Peykani, P.; Gheidarkheljani, J.; Shahabadi, S.; Ghodsypour, S.H.; Nouri, M. A two-phase resource-constrained project scheduling approach for design and development of complex product systems. Oper. Res. 2023, 23, 17. [Google Scholar] [CrossRef]
  37. León, H.C.M.; Farris, J.A.; Letens, G. Improving Product Development Performance Through Iteration Front-Loading. IEEE Trans. Eng. Manag. 2013, 60, 552–565. [Google Scholar] [CrossRef]
  38. Maier, J.F.; Wynn, D.C.; Biedermann, W.; Lindemann, U.; Clarkson, P.J. Simulating progressive iteration, rework and change propagation to prioritise design tasks. Res. Eng. Des. 2014, 25, 283–307. [Google Scholar] [CrossRef]
  39. Yassine, A.; Maddah, B.; Nehme, N. Optimal information exchange policies in integrated product development. Iie Trans. 2013, 45, 1249–1262. [Google Scholar] [CrossRef]
  40. Mallek-Daclin, S.; Daclin, N.; Rabah, S.; Zacharewicz, G. Product Development Plan Monitoring: Towards a Business Process Digital Twin. IFAC Pap. 2023, 56, 11894–11899. [Google Scholar]
  41. Zhang, D.; Bhuiyan, N. A Study of the Evolution of Uncertainty in Product Development as a Basis for Overlapping. IEEE Trans. Eng. Manag. 2014, 62, 39–50. [Google Scholar] [CrossRef]
  42. Vallerio, M.; Hufkens, J.; Impe, J.V.; Logist, F. An interactive decision-support system for multi-objective optimization of nonlinear dynamic processes with uncertainty. Expert Syst. Appl. 2015, 42, 7710–7731. [Google Scholar] [CrossRef]
  43. Li, Y.L.; Zhao, W.; Zhang, J. Resource-constrained scheduling of design changes based on simulation of change propagation process in the complex engineering design. Res. Eng. Des. 2019, 30, 21–40. [Google Scholar] [CrossRef]
  44. Suss, S.; Thomson, V. Optimal design processes under uncertainty and reciprocal dependency. J. Eng. Des. 2012, 23, 829–851. [Google Scholar] [CrossRef]
  45. Black, L.J.; Repenning, N.P. Why Firefighting Is Never Enough: Preserving High Quality in Product Development. Syst. Dyn. Rev. 2001, 17, 33–62. [Google Scholar] [CrossRef]
  46. Lai, C. Research on modeling of product development complex system based on system dynamics. In Proceedings of the International Symposium on Knowledge Acquisition and Modeling, KAM 2008, Wuhan, China, 21–22 December 2008. [Google Scholar]
  47. Lin, J.; Chai, K.H.; Wong, Y.S.; Slowinski, R.; Artalejo, J.; Billaut, J.C.; Dyson, R.; Peccati, L. A dynamic model for managing overlapped iterative product development. Eur. J. Oper. Res. 2008, 185, 378–392. [Google Scholar] [CrossRef]
  48. Riedel, R.; Jacobs, G.; Florides, C.; Spütz, K.; Konrad, C.; Wieja, F. Identification and Evaluation of Parameter Conflicts in Product Development Processes. Procedia CIRP 2023, 119, 164–169. [Google Scholar] [CrossRef]
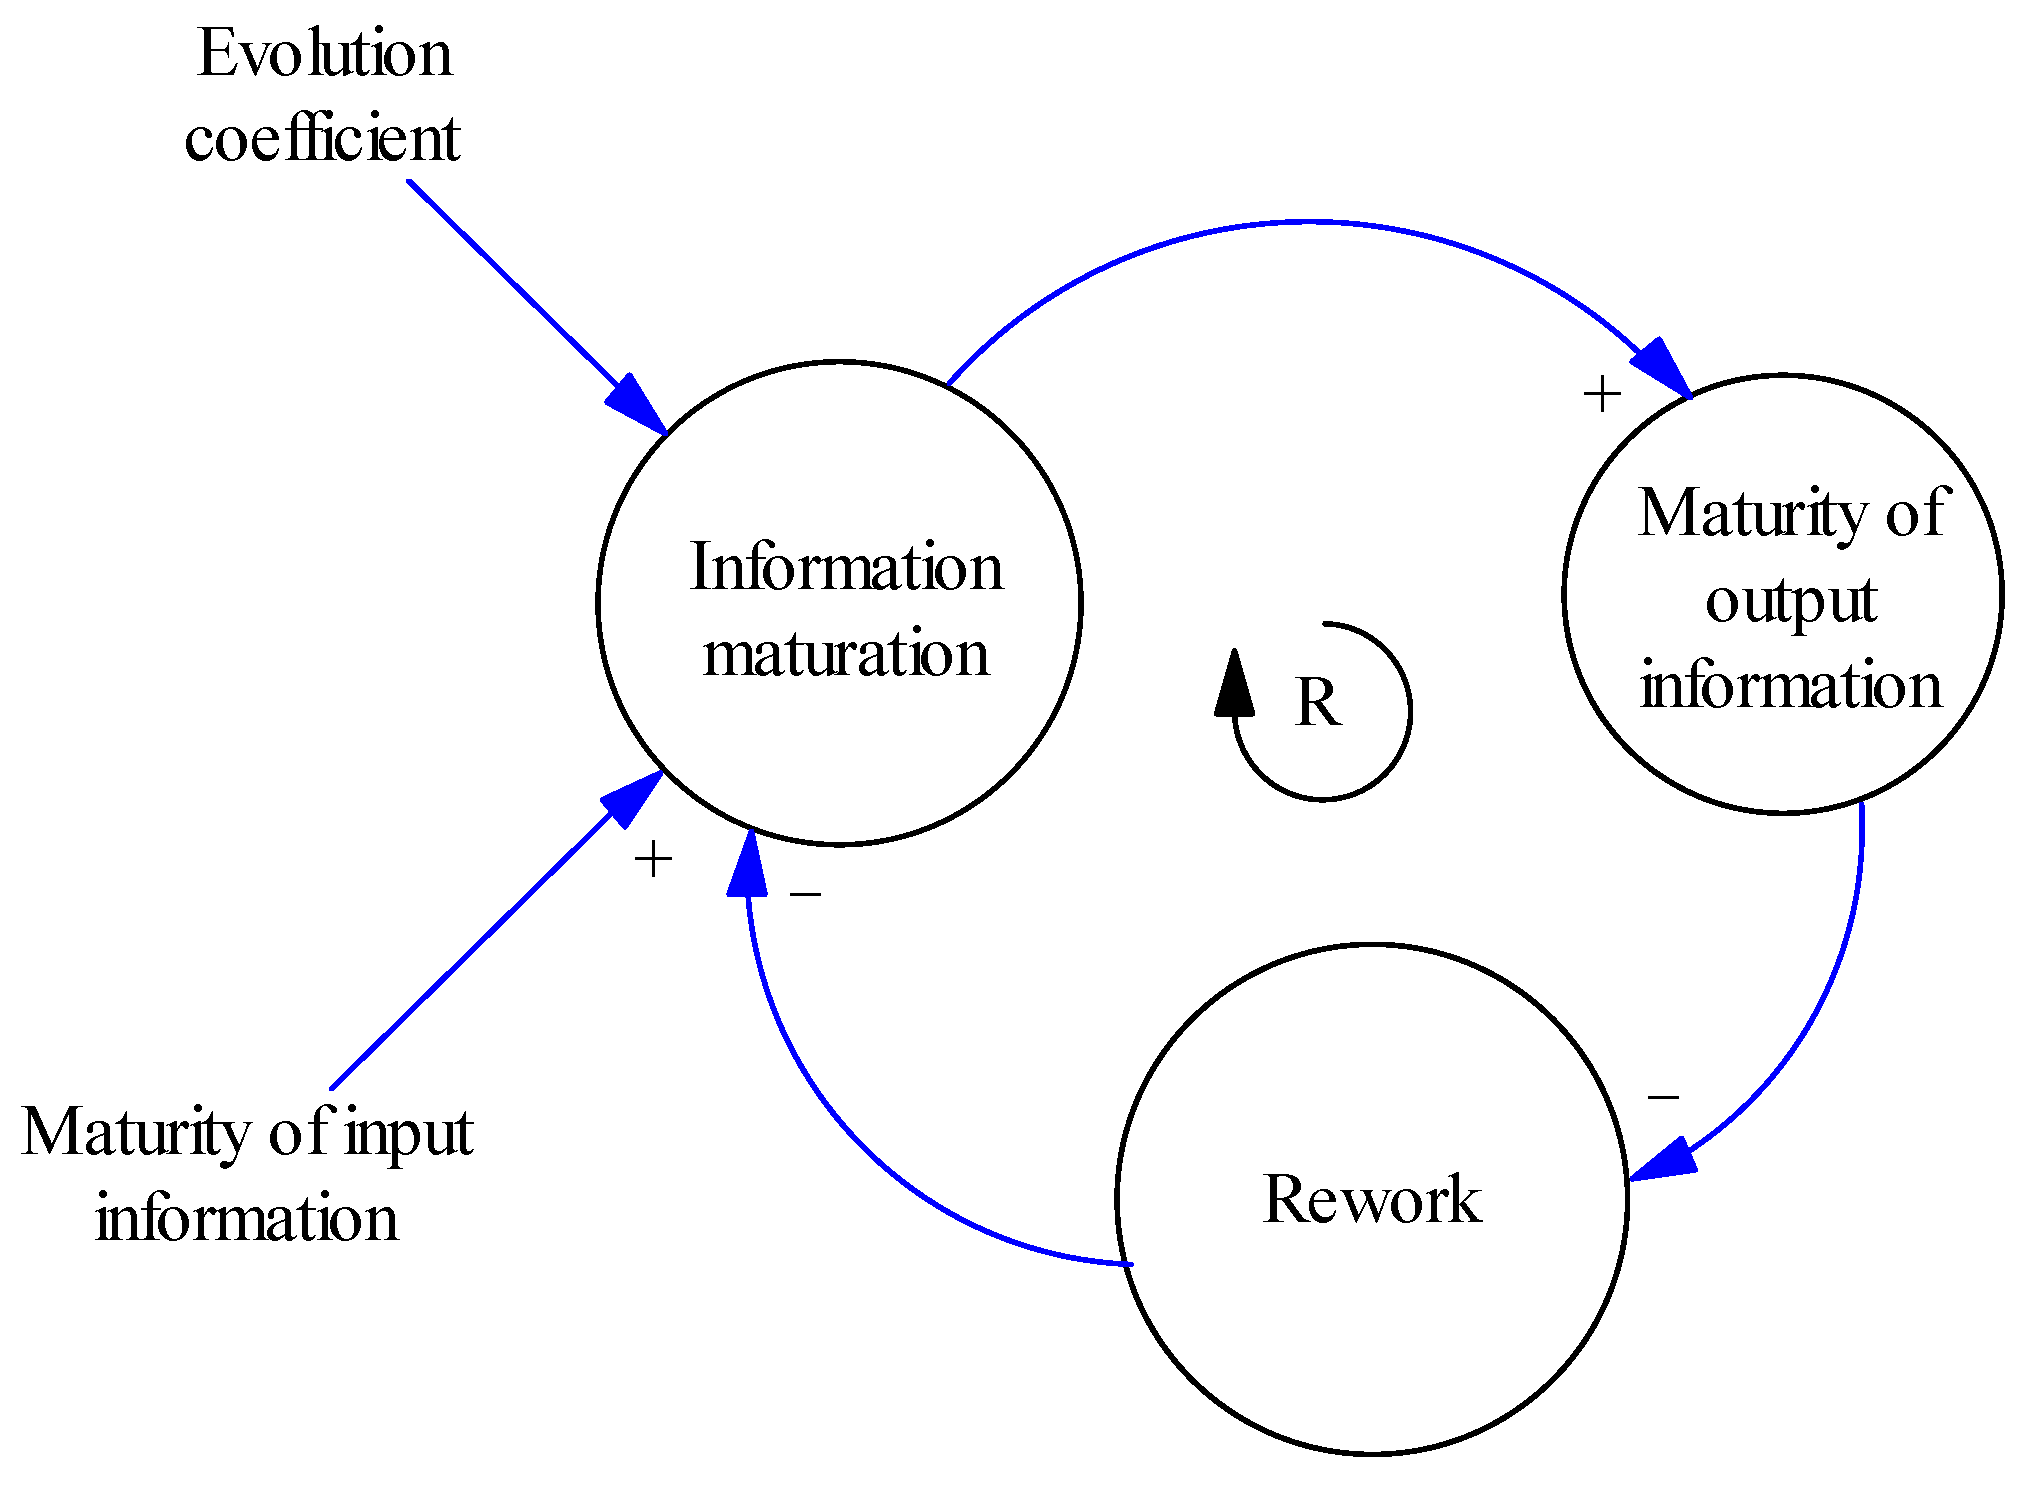
Figure 1. Information maturation process in product development.
Systems 12 00172 g001
Figure 2. Composition of the input information in product development.
Systems 12 00172 g002
Figure 3. Causal loop diagram.
Systems 12 00172 g003
Figure 4. The structure model of one activity.
Systems 12 00172 g004
Figure 5. The structure model of multiple activities.
Systems 12 00172 g005
Figure 6. (a) The maturity of input information is 0; (b) the evolution coefficient (α) is 0; (c) the evolution coefficient (α) is a large integer.
Systems 12 00172 g006
Figure 7. Simulation result of one activity.
Systems 12 00172 g007
Figure 8. (a) Simulation result of two parallel activities; (b) simulation result of two serial activities; (c) simulation result of two overlapping activities.
Systems 12 00172 g008
Figure 9. (a) Two activities are executed in parallel; (b) Activity 1 is executed before Activity 2; (c) Activity 2 is executed before Activity 1.
Systems 12 00172 g009
Figure 10. (a) Simulation result of three parallel activities; (b) simulation result of three serial activities; (c) simulation result of three overlapping activities.
Systems 12 00172 g010
Figure 11. Information evolution process under initial planning.
Systems 12 00172 g011
Figure 12. The actual execution time of each activity.
Systems 12 00172 g012
Figure 13. The Gantt chart under initial planning.
Systems 12 00172 g013
Figure 14. The information evolution process under uncertain environment.
Systems 12 00172 g014
Figure 15. The Gantt chart under uncertain environment.
Systems 12 00172 g015
Table 1. Development process parameters for a specific mold.
SymbolActivityEvolution CoefficientDuration
(Day)
Start Time
(Day)
Unit Time
Cost (¥)
A1Stamping process design0.6100500
A2Structural design of the die0.4910650
A3Solid manufacturing2819450
A4Material procurement1.51219100
A5Casting manufacturing31031350
A6Machining0.71141400
A7Die assembly1552460
A8Mold testing1757200
Disclaimer/Publisher’s Note: The statements, opinions and data contained in all publications are solely those of the individual author(s) and contributor(s) and not of MDPI and/or the editor(s). MDPI and/or the editor(s) disclaim responsibility for any injury to people or property resulting from any ideas, methods, instructions or products referred to in the content.