Article

A Novel Intuitionistic Fuzzy Set-Based Risk Priority Number Method for Solving Chemical Experiment Risk Evaluation

1
Department of Management Sciences, R.O.C. Military Academy, Kaohsiung 830, Taiwan
2
Department of Chemistry, R.O.C. Military Academy, Kaohsiung 830, Taiwan
*
Author to whom correspondence should be addressed.
Systems 2024, 12(5), 155; https://doi.org/10.3390/systems12050155
Submission received: 21 March 2024 / Revised: 29 April 2024 / Accepted: 29 April 2024 / Published: 30 April 2024

Abstract

:
Scientific experiments cover a wide range of fields—from basic to applied scientific research. Chemical experiments are the basis for cultivating chemical knowledge in scientific experiments and are an important way to cultivate scientific thinking and methods. However, due to the toxicity or flammability of the chemical substances in the experiments, hazardous events often lead to personal injuries and environmental damage. Exactly assessing risk factors and reducing the risk of hazards to protect the experimenters and ensure environmental safety are crucial in chemical experiments. However, while the traditional risk evaluation method cannot consider the weight of risk evaluation criteria, it also cannot effectively address problems through hierarchical analysis, as well as imprecise and ambiguous information inherent in human cognition. Therefore, this paper proposed an approach based on failure mode and effects analysis (FMEA) to assess the risk of chemical experiments in a fuzzy information environment. The approach combines the typical analytic hierarchy process (AHP), the risk priority number (RPN) of FMEA, and the intuitionistic fuzzy set (IFS) methods to evaluate risks associated with chemical experiments and consider the damage recovery in chemical experiments. This study applied the case of a university chemistry experiment, “preparation of hydrogels”, to validate the reasonableness and correctness of the proposed approach and compare its numerical verification results with those from the typical RPN, the AHP-RPN, and the AHP-fuzzy risk priority number (AHP-FRPN) methods. The finding demonstrates that the proposed method can more effectively address risk evaluation problems in chemical experiments than the other methods. This result serves as an important reference for reducing chemical experiment risk occurrences.

1. Introduction

Scientific experiments are universal and encompass research methods in various scientific fields—from physics and biology to social sciences. Chemical experiments are an important aspect of scientific experiments, which focus on unique issues and methods in the field of chemistry. As chemical experiments become more complex, their inherent risks and potential hazards also increase [1,2]. Incorporating risk assessments into chemical experiments is, therefore, crucial to safeguard the safety and well-being of laboratory personnel, prevent environmental hazards, and improve the reliability and precision of experimental results. However, the traditional risk evaluation method does not consider the weight of risk evaluation criteria. It cannot effectively address problems through hierarchical analysis, as well as imprecise and ambiguous information inherent in human cognition.
Various methods can be used to assess risks in chemical experiments. One of the most widely adopted methods is the failure mode and effects analysis (FMEA) method. The FMEA method was first applied in the aerospace industry in the 1960s and has been widely applied as a risk evaluation methodology for examining and identifying all possible or expected failures [3]. The main goal of FMEA is to initiate actions to proactively mitigate or eliminate failures, starting with the most serious failures. Many studies have applied the FMEA method over the years to explore risk assessment problems [4,5]. Potential failure modes (FMs) are prioritized in the conventional FMEA based on the risk factors of severity (S), occurrence (O), and detection (D). Each of these three factors is assigned a value between 1 and 10 (with higher values indicating a higher degree of the factor). In recent years, the FMEA methodology has gained significant popularity in various studies owing to its easy computation, such as in liquid hydrogen storage systems [6], electronic equipment [7], manufacturing systems [8], lithium-ion batteries [9], fire-induced domino effects [10], and the petrochemical industry [11]. However, there remain certain limitations in the solution of the risk priority number (RPN) method. For example, the three criteria, S, O, and D, are supposed to be equal in weight [12], which cannot effectively address problems through hierarchical analysis [13]. The aforementioned limitations have an impact on the precision of the solutions. Certain scenarios may result in lower RPN values of serious failure mode compared to minor failure mode, thereby posing potential risks.
Currently, many research methods can analyze and solve problems hierarchically. One of them is the analytic hierarchy process (AHP), which can organize decision-making factors hierarchically (including levels of objectives, criteria, sub-criteria, and alternatives). AHP was developed by Saaty in 1980 as a practical multi-criteria decision-making tool for analyzing choice problems [14]. This hierarchy facilitates evaluation through a series of pairwise judgments and uses qualitative and quantitative analysis, comparisons, and rankings of relative weights. The key factors with greater influence can be identified to assist decision-makers or management in making more informed choices. The AHP methodology has been used to address obstacles in several fields such as solar thermal plant demand [15], flood disaster identification [16], flood risk [17], and nuclear power plants [18]. In addition, the AHP method can effectively evaluate the weight of each criterion and overcome the limitation of PRN by assuming the same weight, providing more realistic results. However, it is limited to handling crisp information and lacks the capability to address imprecise and ambiguous information inherent in human cognition.
Human judgment is often affected by uncertainty and ambiguity of information, where decisions are made even despite insufficient key information. Moreover, people who assess something or make decisions also tend to describe information based on natural language expressions rather than relying on precise numerical values. The fuzzy set (FS) theory, first proposed by Professor Zadeh in 1965, has now been around for nearly 60 years [19,20]. The theory takes advantage of the degree of membership (MD) to express fuzzy phenomena. However, there are situations in which the fuzzy set approach cannot deal with the ambiguity posed by degrees of non-membership. To address this gap, Atanassov [21] put forth the notion of the intuitionistic fuzzy set (IFS) and considered non-membership degrees (NMDs) and combined them with the membership degree of FS to deal with uncertain situations while adhering to the condition that the sum of membership degrees and non-membership degrees should not exceed 1 [22]. In recent decades, FS and IFS have been used with numerous research techniques to address practical problems in various domains, including medical diagnoses [23], risk assessments [24], cluster analyses [25], fuzzy controls [26], emergency location selections [27], and supplier selections [28].
In addressing the limitations of the FMEA method in assessing safety-related risks in chemical experiments, this study proposed a novel IFS-based RPN method that integrates the conventional FMEA method with the IFS and AHP methods. By incorporating the IFS technique, the proposed research method can manage imprecise data in uncertain situations and overcome the inherent non-numeric cognitive biases of human decision-making. The novel IFS-based RPN method calculates the weight of the AHP method and determines the related importance of the evaluation criteria for S, O, and D. Finally, this method considers the chemical experiment damage recovery (R) as an evaluation criterion, aligns with the needs of practical chemical experiments, and enhances the efficacy and rationality of the final ranking of failure modes in chemical experiments.
The remainder of the paper is structured as follows. A brief overview of the FMEA method, AHP method, and IFS is provided in Section 2. In Section 3, this paper proposes an IFS-based RPN approach that integrates the AHP method, IFS, and the RPN approach and describes the solution steps in detail. Section 4 presents a numerical example of the “preparation of hydrogels” for use in general chemistry courses. Then, the results of the calculations are compared with those of the other approaches. The conclusion and future direction of this research are presented in the final section.

2. Literature Review

2.1. Failure Mode and Effects Analysis

In the 1960s, the National Aeronautics and Space Administration (NASA) pioneered the use of the FMEA methodology to meet the requirements for risk evaluation during the design or manufacturing stage for the aerospace sector. Since its formulation, FMEA has been widely used in various industries with varying degrees of success [29]. The FMEA method, a well-defined, bottom-up engineering analysis technique, is commonly used in the evaluation of related products in terms of failure during the manufacturing process [30].
In traditional FMEA, RPN is used to prioritize possible failure modes. Table 1 represents the evaluation scales for the three risk factors in FMEA. The failure modes are prioritized by S, O, and D for risk factors based on the scale shown in Table 1. Then, the three risk factors are multiplied to determine the priority of each failure mode based on the RPN value. Higher RPN values indicate higher failure risks, which should be prioritized at a higher level. The formula of RPN is shown in Equation (1).
R P N = S × O × D

2.2. Analytic Hierarchy Process Method

The purpose of the AHP method is to systematically analyze complex decision-making problems through a hierarchical decomposition [31]. Not only does it deal with qualitative analysis, but it also considers quantitative methods to aid in decision-making problems for multiple objectives [32]. The AHP method, which converts expert evaluation opinions into the comparison matrix, evaluates the criteria quantitatively by calculating the eigenvalues and consistency ratio, confirming the expert evaluation opinions’ consistency, and then determining the weight of each evaluation criterion. This result can be used as the judgment basis for decision-makers to make correct decisions.
The practical application of the AHP method can be roughly divided into the following stages.
(1)
Establish a paired comparison matrix at each level.
The paired comparison matrix is the judgment value of experts and scholars based on the relative importance of each standard. Table 2 represents the nine scales of pairwise comparison [15], where 1 represents the same importance and 9 represents “extremely important”. If there are n influential variables in the problem, the number of necessary comparisons is n ( n 1 ) / 2 .
(2)
Calculate the maximum eigenvalue ( λ m a x ) and eigenvector.
In the pairwise comparison matrix A shown in Equation (2), the maximum eigenvalue ( λ m a x ) of the pairwise matrix A can be calculated through numerical analysis. After obtaining the λ m a x , use Equation (3) to calculate the corresponding eigenvector (weight) W of each parameter, where W = w 1 , w 2 , , w n T , and i = 1 n w i = 1 .
A = 1 a 12 a 1 n 1 a 12 1 a 2 n 1 1 a 1 n 1 a 2 n 1
A W = λ m a x W
(3)
Check the consistency test.
Due to pairwise comparisons of experts’ opinions involving subjective awareness, the consistency test must be passed to ensure that the experts’ judgment is consistent. Saaty [14] recommends calculating the consistency index (CI) and consistency ratio (CR) as shown in Equations (4) and (5). If the CR is less than 0.1, the consistency of the matrix is considered sufficient for use, in which the value of the random index (RI) in Equation (3) depends on the order of the matrix, denoted by n, as shown in Table 3 [14].
C I = λ m a x n n 1
C R = C I R I
(4)
Determine the overall weights and yield the most ideal alternative.
After checking the consistency, the final weight value is derived through the process of aggregating the weights associated with each evaluation criterion or alternative. Subsequently, rank the overall weights to yield the most ideal solution.

2.3. Intuitionistic Fuzzy Set

To effectively deal with fuzzy and uncertain data, Atanassov [21] defined IFS, which describes fuzzy data in detail according to three aspects: membership degree, non-membership degree, and hesitancy degree. It overcomes the limitation of FS [19], which only considers the membership degree. This section introduces some relevant concepts and basic definitions of IFS.
Definition 1 
[19]. Assuming FS (E) in the set x = [ x 1 , x 2 , x n ] , X could be expressed as follows:
E = x ,   μ F x x X
where  μ F x  represents the membership degree of element x within E, with values [0, 1]. A larger  μ F x  value indicates a stronger affiliation of element x with set E.
Definition 2 
[21]. Assuming IFS (G) in the set x = [ x 1 , x 2 , x n ] , X could be expressed as follows:
G = x ,   μ I x , ν I x x X
where  μ I x  is the membership degree, and  ν I x  is the non-membership degree both in the interval [0, 1]. It satisfies the condition of  0 μ I x + ν I x 1 .
Definition 3 
[33,34]. Assuming that G 1 is denoted as ( e m ,   f m ) and G 2 as ( e n ,   f n ) , representing two intuitionistic fuzzy numbers (IFNs) and a positive number λ , the operation rule of addition, multiplication, and exponential relationships can be defined as:
G 1 G 2 = e m + e n e m · e n ,   f m · f n
G 1 G 2 = e m · e n ,   f m + f n f m · f n
λ G 1 = 1 1 e m λ ,   f m λ ,   λ > 0
G 1 λ = e m λ , 1 1 f m λ ,   λ > 0
Definition 4 
[35]. Let G 1 = ( e m ,   f m ) be an IFN, where e m 0,1 , f m 0,1 , and 0 e m + f m 1 , then the score function of IFS can be defined as follows:
I F S S = e m + e m ( 1 e m f m )
The score value represents the crisp result obtained after IFN defuzzification.

3. Research Method

3.1. The Plan of the Proposed Method

Chemical laboratories have high degrees of risk. Faced with the diversity of experiments and many potential hazards, any danger in the experiment directly affects the surrounding environment and the health and safety of experimenters. Correctly assessing and fully grasping the hazard risks in chemical experiments and eliminating the possibility of hazards is the primary key to experimental safety. The traditional FMEA method can identify and rank the risks of all possible failure modes in the system and take the corrective approach to reduce or even eliminate the occurrence of high-risk items, among which RPN is the most common method used. In contrast, the traditional RPN method has some limitations and shortcomings. For instance, it dismisses the relative importance of the risk factors and supposes the same weight of the evaluation criteria. In the process of risk assessment, due to differences in experts’ educational backgrounds and practical experience, the information provided may have cognitive differences. Therefore, it is difficult to use a precise value of 1 to 10 to evaluate risk items. Moreover, the traditional RPN only considers the use of S, O, and D for risk assessment and ignores the consideration of recovery degree factor. These situations lead to some difficulties in assessing the risk of chemistry experiments and affect the applicability of experimental risk assessment. Considering these gaps, this study proposes a novel IFS-based RPN method, which integrates the RPN method, the AHP method, and IFS to address the gaps in chemical experiment risk assessments. In particular, this study uses IFS to deal with the uncertainty and ambiguity of information of experts’ risk assessment appropriately and adds consideration of the risk evaluation criteria recovery degree (R). The AHP method is also used to consider the relative importance of the four risk factors. Further, this study uses the RPN to calculate the assessment scores of risk items that affect experimental safety and complete the ranking. Therefore, it can be considered a more authentic chemical experiment risk assessment, which can prevent risk occurrences in chemistry experiments.

3.2. The Procedure of the Research Method

In order to evaluate the potential risk items during chemical experiments, the novel IFS-based RPN approach comprises seven sequential steps, briefly expounded as follows.
  • Step 1: Construct a chemical experiment risk assessment team.
Invite scholars or experts with several years of experience in chemical experiments to form a chemical experiment risk assessment team.
  • Step 2: Determine the evaluation criteria for risk factors in chemical experiments.
According to the research objectives, clearly define the nature of the problem and the research structure and determine the risk assessment criteria for the risk factors of chemical experiments.
  • Step 3: Complete the questionnaire design and implement the questionnaire.
Complete the design of expert questionnaires based on the objectives, evaluation criteria, and risk factors of the risk assessment problems. Then, conduct questionnaire surveys.
  • Step 4: Defuzzify the expert-provided fuzzy information.
After completing the questionnaire, fully consider the available information provided by the experts. According to the linguistic level in Table 4, the linguistic scores provided by the experts in the questionnaire are transformed into intuitionistic fuzzy (IF) information. Then, Equations (8)–(12) are used to calculate the mean score.
  • Step 5: Calculate the weight of the four risk factors.
Use Equations (3)–(5) to calculate and determine the weight of the four risk assessment criteria, including S, O, D, and recovery (R).
  • Step 6: Calculate the weighted average score of risk items.
After obtaining the weights of the four risk evaluation criteria, multiply them by the experts’ ratings of the risk items in Step 4 to obtain the weighted average score of each risk item.
  • Step 7: Conduct a risk item assessment and ranking.
Rank the weighted average scores of each risk item so that managers or decision-makers can understand the hazards and severity of each risk item. Then, employ necessary safety management methods and approaches to effectively reduce the probability of laboratory hazards and ensure the experimental process safety of personnel and equipment.

4. An Illustrative Example

4.1. Overview

As far as laboratory safety is concerned, an “accident” refers to the negligence of laboratory personnel or failure to operate according to regulations, resulting in experiment failure, loss of control, or forced stop, resulting in personal injury and property loss. In recent years, researchers have been committed to strengthening risk assessment in chemical laboratories to reduce the occurrence of hazards. For example, Li et al. proposed a method to assess the risk of unsafe behaviors in university laboratories using the human factors analysis and classification system for university laboratories (HFACS-UL) and a fuzzy Bayesian approach. This method addresses the factors contributing to unsafe human behavior in laboratories and provides further prevention and control measures [37]. Fatemi introduced a method to identify, evaluate, and classify chemicals with higher hazards in academic laboratories, enabling a risk assessment of potentially hazardous chemicals and their prioritization. This awareness of the potential hazards and user risks associated with chemicals used in academic laboratory operations helps reduce risks [38]. Li et al. employed a semi-quantitative method combining material element expansion theory (MEET) and combined ordered weighted average (C-OWA) operators to manage comprehensive risks related to hazards during chemical laboratory operations [39]. Zhao analyzed the risks in hazardous chemical laboratories and used the SHELL model and HACCP system to establish a risk assessment index, effectively reducing laboratory risks [40]. Ozdemir proposed a methodology that integrates 5S (Sort, Set in Order, Shine, Standardization, and Sustain), interval two fuzzy sets (IT2FS), AHP, FMEA, and VlseKriterijumska Optimizacija I Kompromisno Resenje (VIKOR) to address significant hazard risks in university laboratory operations, contributing to safety improvement measures in the education sector [41]. The RPN is the most common and effective method used to reduce experimental risks in order to prevent laboratory accidents. It helps accurately predict and assess risks, enabling the implementation of necessary precautions and management approaches. However, the traditional RPN method has some shortcomings. While it dismisses the relative importance of the S, O, and D risk factors, it only considers the above three risk assessments. In addition, it does not consider the ability to return to the original situation and continue the chemical experiment even after an accident occurs. Moreover, due to differences in experts’ educational backgrounds and practical experience, the information provided may have cognitive differences. It is difficult to use a precise value of 1 to 10 on the RPN scale to evaluate risk items, which is different from the actual chemical experiments and affects the applicability of experimental risk assessments.
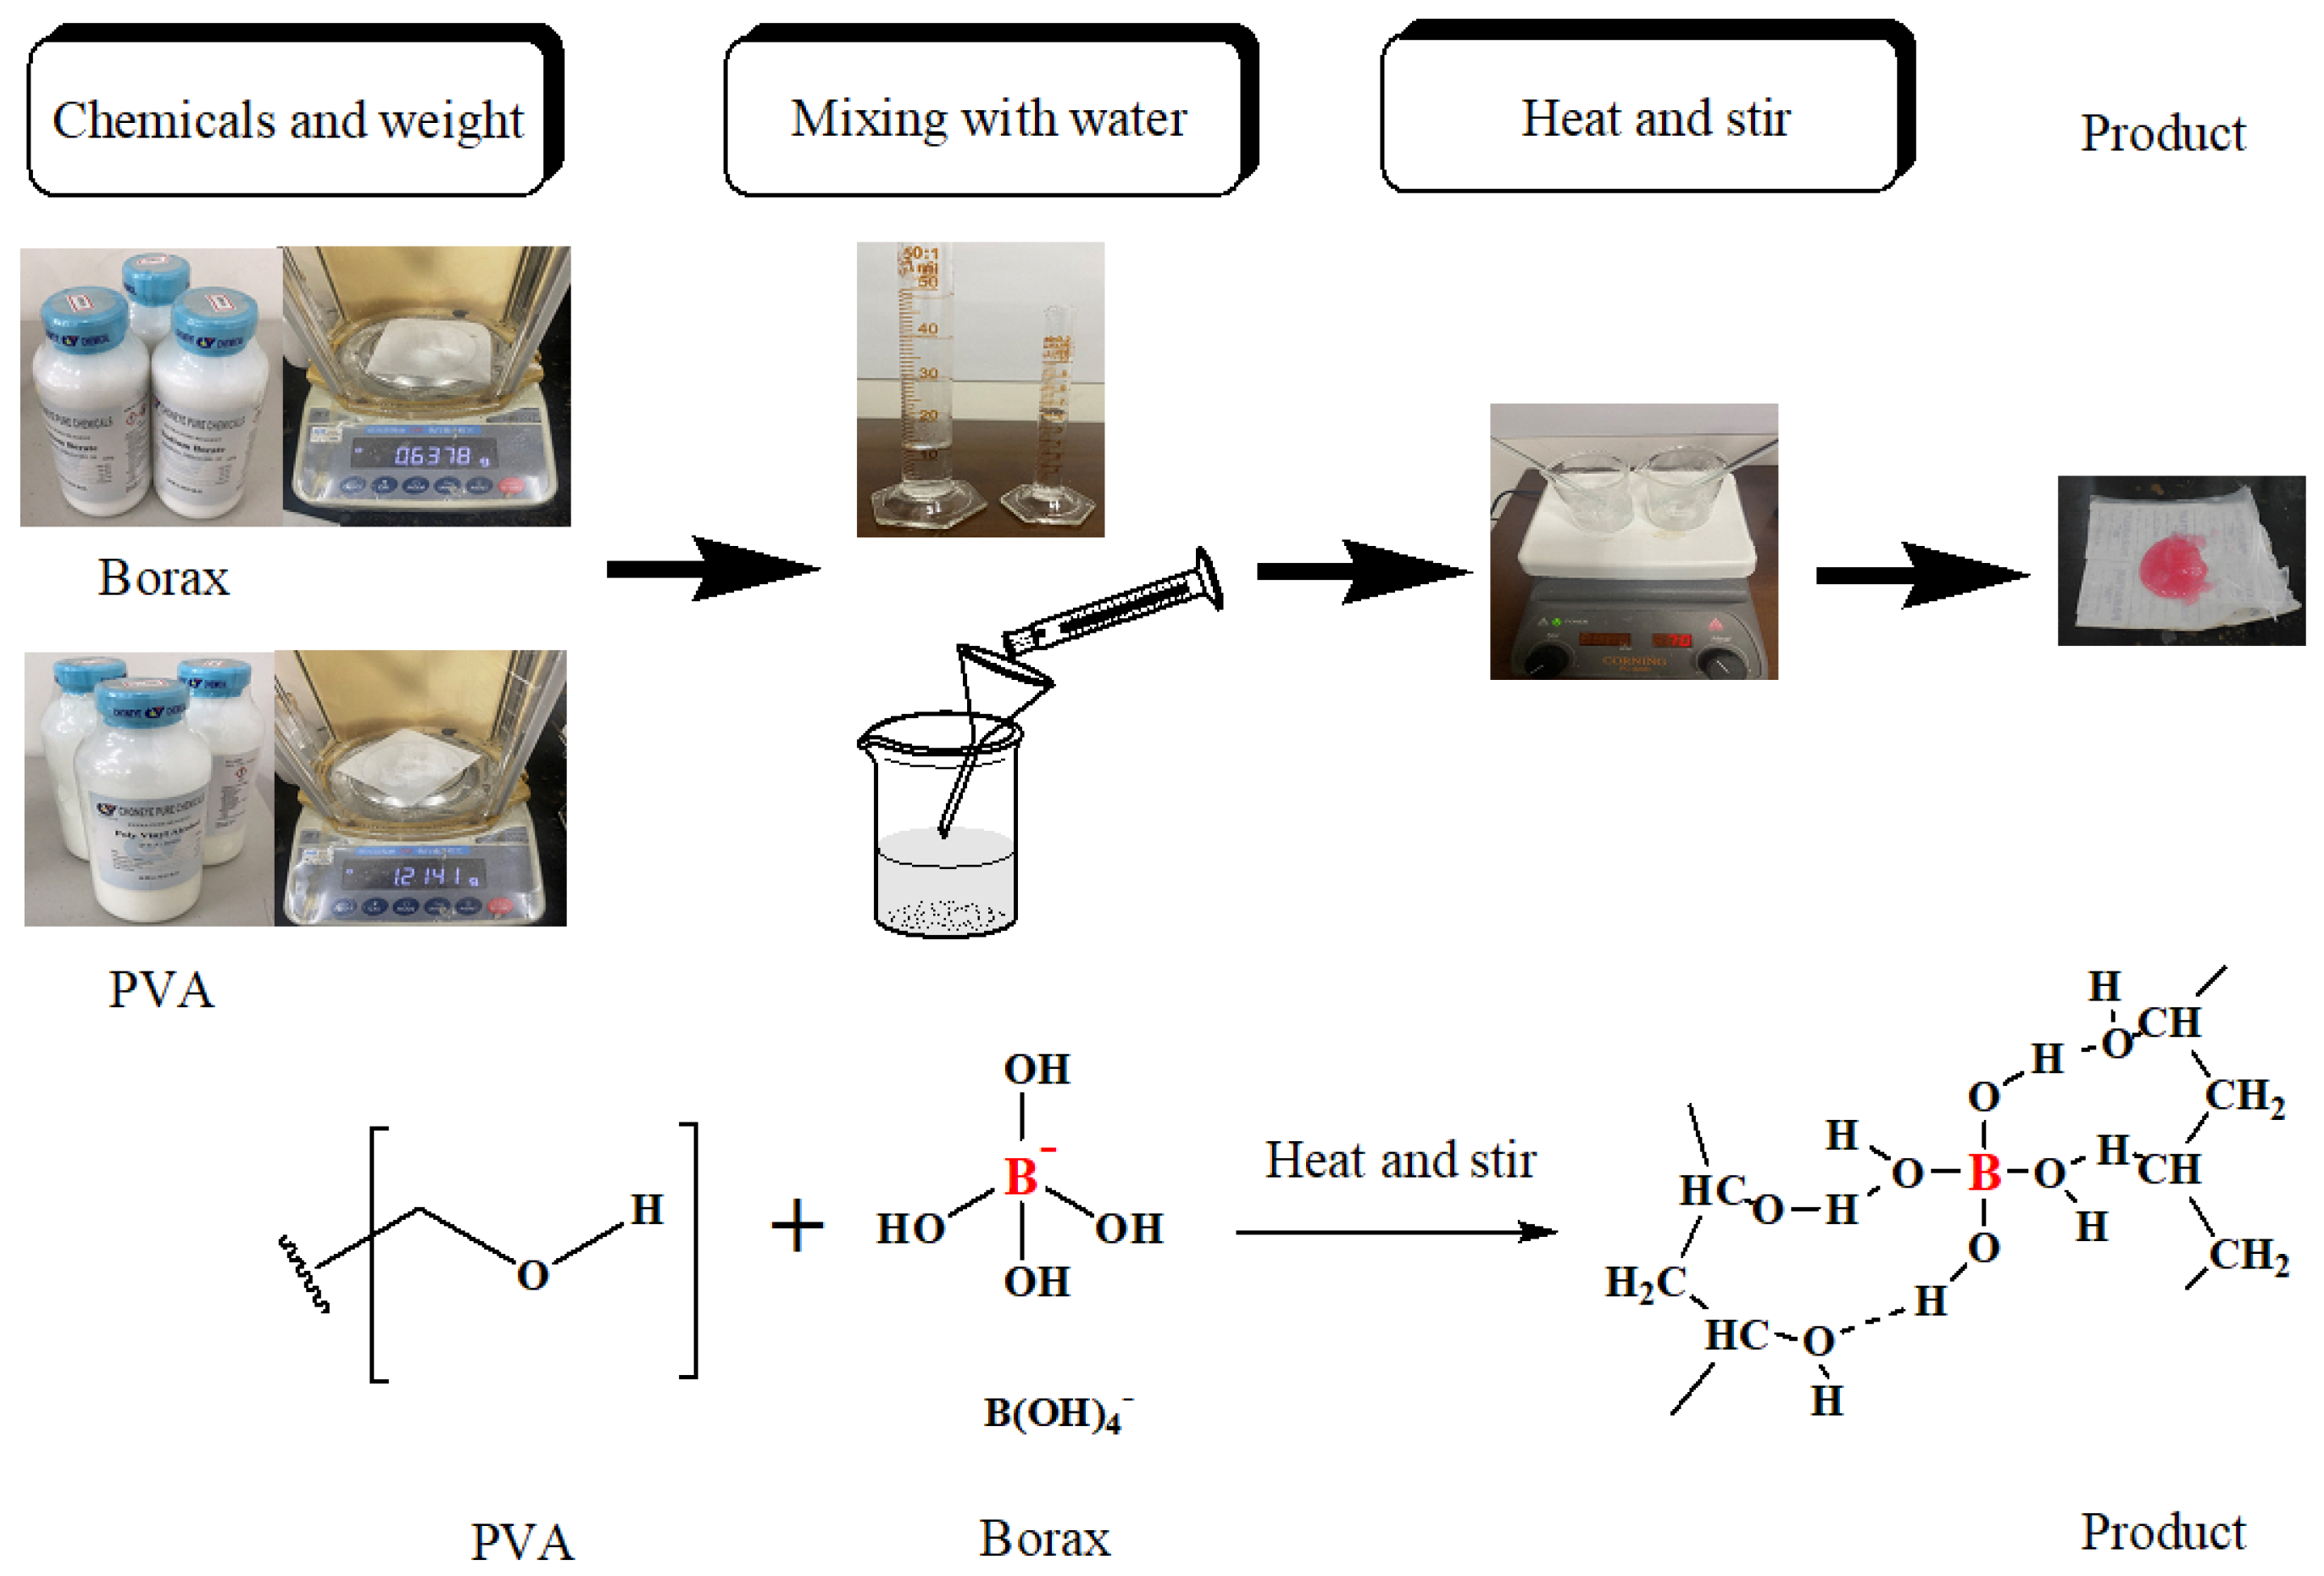
This study takes a “preparation of hydrogels” chemical experiment at a university in Taiwan as an example. The procedure of preparation of hydrogels is shown in Figure 1. It uses the cross-linking effect of borax and polyvinyl alcohol, resulting in hydrogels, which can be applied for medical consultation, health care, beauty, food, and agriculture. This study invited three scholars and experts with more than 10 years of teaching and practical experience in the field of chemical experimentation. In this risk assessment for the preparation of hydrogels in a chemical experiment, the evaluation criteria include severity (S), occurrence (O), detection (D), and recovery (R). Based on the rating scale of the FMEA evaluation in Table 5, the three scholars (E1, E2, and E3) rated the 20 failure modes from 1 to 10 according to the linguistic levels in Table 4 to complete the scoring of the four evaluation criteria of S, O, D, and R, as shown in Table 6. Then, based on the nine scales of the AHP method in Table 2, a comparison matrix of four risk assessment criteria was formulated, as shown in Table 7.

4.2. Solution Based on Risk Priority Number Method

The FMEA method is a widely used technique and tool for risk evaluation. Capable of identifying the root causes of failures and preventing or mitigating their consequences, it has been widely used in the military and industries. Traditional FMEA usually uses the RPN to assess the risk level of a failure mode. This method is carried out by multiplying the value of risk factors S, O, and D. If the RPN of a certain factor in the system is high, the probability of occurrence of risk may also be extremely high. A higher risk priority should be given to prevent its failure risk from happening. Juan et al. [42] combined statistical methods and the RPN to analyze and estimate the number of operating errors or delays per unit of time in construction projects. It can assist construction managers to prioritize and determine the need for construction improvements. This study also uses the RPN method to calculate a real case, as described in Section 4.1. According to Table 6, the arithmetic mean of three expert opinions was calculated, and Equation (1) was used to calculate the RPN. For example, the RPN of FM1 is 1.333 × 2.667 × 5.000 = 17.778 . The RPN of other failure modes was also generated in the same way. The computation results and rank are shown in Table 8.

4.3. Solution Based on Analytic Hierarchy Process and Risk Priority Number Method

The AHP-RPN methodology can overcome the limitation of assuming equal weights for evaluation criteria by applying the AHP method to determine the priority of criteria and using the RPN methodology to assess identified risk items, which are then weighted to generate risk index prioritization. Li et al. [43] combined the AHP and RPN methods to analyze the causes of failure of floating offshore wind turbines. This approach minimizes the catastrophic failure of long-term floating offshore wind turbines. This section adopts the AHP-RPN methods to deal with cases of chemical experiments. First, the AHP method is used to determine the weight of risk assessment criteria. Based on Table 7, Equations (3)–(5) are applied to conduct the weight calculation of risk criteria by calculating λ m a x = 3.001—the CI value is 0.001, and the CR value is 0.002. The calculation process is as follows:
C I = λ m a x n n 1 = 3.001 3 3 1 = 0.001
C R = C I R I = 0.001 0.58 = 0.002
After checking the consistency of expert assessment opinions (CR < 0.1), the weights from high to low are obtained—that is, W S   (0.442), W D (0.344), and W O (0.214). Second, the weights of the above three criteria (S, O, and D) are multiplied by the average value, as presented in Table 6. Then, Equation (1) is applied to calculate the RPN. For example, the RPN of FM1 is 0.589 × 0.571 × 1.720 = 0.578 . The RPN of other failure modes is also generated in the same way. The results and rank are expressed in Table 9.

4.4. Solution Based on the Analytic Hierarchy Process and Fuzzy Risk Priority Number Method

When experts conduct a risk assessment, it is often difficult to score the assessment items with precise values due to professional differences or personal preferences. The traditional FS approach can deal with ambiguous situations in daily life, as well as handle problems of human judgment that cannot objectively deal with, for example, fuzzy and uncertain conditions. Jin et al. [44] proposed this approach to analyze the causes of logistics system failures during the COVID-19 pandemic. This approach could improve the most effective way for logistics companies to engage with supply chain partners and their customers on risk management issues during the COVID-19 pandemic.
The traditional FS approach uses the value of MD (α)—where NMD equals 1 minus the value of MD (α)—to conduct the numerical calculation and determine the cause of a failure affecting a chemical experiment. For example, Expert 1 commented that the assessment value of the failure mode of “the laboratory has had a power outage” is L5 for the assessment criteria of severity in Table 6. According to Table 4, the linguistic variable L5 expresses the value of MD (α) as 0.5; thus, NMD (1–α) equals 0.5. Other failure modes also use the same way to determine the values of MD and NMD. Subsequently, multiplied with the weight of three risk factors obtained in Section 4.3, the weights from high to low are W S (0.442), W D (0.344), and W O (0.214), obtaining the weight average score of the risk factor. Then, Equations (8)–(11) were used to calculate the arithmetic mean of fuzzy information from three experts, as well as Equation (12) to defuzzify fuzzy information and obtain the score of failure modes under three risk factors, as shown in Table 10. Finally, Equation (1) was adopted to multiply the weight average score of the three risk factors to obtain the value of RPN of each failure mode, also shown in Table 10.

4.5. Solution Based on the Proposed Method

With the demand for education and research rising, the continuous increase in the number of chemical experiments and related safety accidents is gradually showing an upward trend. Therefore, effectively preventing, controlling, and managing laboratory safety risks is the primary problem to be addressed in laboratory management. To avoid disrupting the coherence of subsequent chemical experiment courses due to laboratory accidents, this study introduces chemical experiment damage recovery (R) into the risk assessment indicators as a key factor in restoring laboratory operations. Due to the many factors that need to be considered in the risk management and control of chemical experiments, experts have different experiences and perceptions. It is difficult to give evaluation information by crisp value, which often leads to bias in solution results. To address these problems, this paper proposes a flexible IFS-based RPN approach that integrates the typical AHP, FMEA, and IFS methods to deal with the possible risk problems in chemical experiments. The following steps are taken:
  • Steps 1 and 2 include organizing a risk assessment committee, constructing a research structure for risk assessment issues, and determining the assessment criteria for safety factors in chemical experiments.
  • Step 3: Complete the questionnaire design and implement the questionnaire.
According to the structure and elements of the risk assessment problem (including the objectives, evaluation criteria, and risk factors), complete the design of expert questionnaires and conduct surveys.
  • Step 4: Defuzzify the expert-provided fuzzy information.
In order to consider the available information provided by the experts fully and based on Table 6, the rating scale of Table 4 to convert it into IF information was used to calculate the arithmetic mean of IF information from three experts. Then, Equation (12) was applied to defuzzify IF information and obtain the score of failure modes under four risk factors.
  • Step 5: Calculate the weight of the four risk factors.
Due to adding the consideration of recovery of chemical experiment accidents in this study, according to Table 2, use Equations (3)–(5) to calculate the CR value. By calculating λ m a x = 4.058, the CI value is 0.019, then the CR value is 0.021, and the calculation process is as follows:
C I = λ m a x n n 1 = 4.058 4 4 1 = 0.019
C R = C I R I = 0.019 0.90 = 0.021
While the CR value is confirmed to be <0.1, it can be demonstrated that the experts’ judgments of the pairwise comparison matrix are consistent. After the calculation, the weight (eigenvector) can be obtained: (0.347, 0.147, 0.221, 0.285)T. The result shows that the weight value of W S (0.347) is the most important, followed by the weight of W R (0.285), W D (0.221), and W O (0.147).
  • Step 6: Calculate the weighted average score of risk items.
After obtaining the IF score of each failure mode, multiply the corresponding weight of the risk factors, S, O, D, and R, to obtain the weight average score of the 20 FMs.
For example, expert E1 determines the IFN to be (0.1, 0.9) for the risk factor S of FM1, and with W S (0.347) by Equation (10), it is found that
0.347 × 0.1 ,   0.9 = 1 1 0.1 0.347 , 0.9 0.347 = ( 0.036 ,   0.964 )
Apply Equations (8)–(11) to calculate the arithmetic mean of IF information from three experts.
For example, three experts determine the IFN to be (0.036, 0.964), (0.036, 0.905), and (0.036, 0.964), respectively, for the risk factor S of FM1 by Equation (10), and it is found that
1 / 3 × 0.036 ,   0.964 = 1 1 0.036 1 / 3 , 0.964 1 / 3 = ( 0.012 ,   0.988 )
( 1 / 3 ) × ( 0.036 ,   0.905 ) = 1 1 0.036 1 / 3 , 0.905 1 / 3 = ( 0.012 ,   0.967 )
By Equation (8), it is found that
( 0.012 ,   0.988 ) ( 0.012 ,   0.967 ) = 0.012 + 0.012 0.012 × 0.012 ,   0.988 × 0.967 = 0.024 ,   0.956 ( 0.024 ,   0.956 ) ( 0.012 ,   0.988 ) = 0.024 + 0.012 0.024 × 0.012 ,   0.956 × 0.988 = 0.036 ,   0.944
Apply Equation (9) to calculate the aggregated weighted average score for the risk items. Then, employ Equation (12) to defuzzify IF information and obtain the score of failure modes under four risk factors, as shown in Table 11.
For example, when W S S = ( 0.036 , 0.944 ) , W O O = ( 0.035 , 0.940 )   W D D = ( 0.145 , 0.813 ) , and W R R = ( 0.182 , 0.765 ) in FM1, by Equation (9), it is found that
W S S W O O = 0.036 × 0.035 ,   0.944 + 0.940 0.944 × 0.940 = ( 0.0012 ,   0.9966 ) W D D W R R = 0.145 × 0.182 ,   0.813 + 0.765 0.813 × 0.765 = ( 0.0264 ,   0.9561 ) W S S W O O W D D W R R = ( 0.0012 ,   0.9966 ) ( 0.0264 ,   0.9561 ) = 0.0012 × 0.0264 ,   0.9966 + 0.9561 0.9966 × 0.9561 = ( 0.033 × 10 3 ,   999.852 × 10 3 )
By Equation (12), it is found that
R P N = 0.033 × 10 3 + 0.033 × 10 3 × 1 0.033 × 10 3 999.852 × 10 3 = 0.033 × 10 3
  • Step 7: Risk items assessment and ranking.
Risk ranking is determined by ordering the RPN values from highest to lowest. While ranking the weighted average scores of each FM (refer to Table 11), the scholars or managers of the chemical laboratory can understand the hazards and severity of each FM. Subsequently, they can take necessary safety management approaches to effectively reduce the probability of laboratory hazards and ensure the safety of the experimental processes, as well as that of the personnel and equipment.

4.6. Comparisons and Discussion

In order to verify the effectiveness and necessity of the proposed novel IFS-based RPN method, this study used the case of a chemical experiment in a university laboratory to test and prove the results of different research approaches. This study used the same data (Table 6) and adopted four different research methods, including the traditional RPN, the AHP-RPN, the AHP-FRPN, and the proposed methods. The different calculation results of the analysis presented in Table 8, Table 9, Table 10 and Table 11 are summarized in Table 12. Based on the analysis and comparison in Table 13, the advantages of the method proposed in this study are described in detail.
First, during the evaluation of risk criteria in the chemical experiments, risk factors and concepts are encountered, which can only be described qualitatively and not quantitatively. Thus, they cannot be included in risk assessments. The proposed method presented in this study can take into account both qualitative and quantitative information simultaneously and combines the above different attribute analyses, as well as objectively synthesizes the subjective judgments of decision-makers on various risk assessment criteria in chemical experiments.
Second, in the solution process of the traditional RPN, all evaluation criteria are assumed to have the same weight, implying that prioritizing risk assessment criteria can be difficult. Meanwhile, in the AHP-RPN, the AHP-FRPN, and the proposed methods in this study, the importance of various risk assessment criteria in chemical experiments can be effectively measured. It is more in line with the actual situation and needs of chemical experiments.
Third, the traditional RPN and AHP-RPN methods can only process crisp and determined information but cannot deal with fuzzy and undetermined information. However, AHP-FRPN and the proposed novel IFS-based RPN method in this study can deal with situations where there is uncertainty in the information. They can fully consider the information provided by experts’ real thoughts, which is closer to the real-world situation.
Fourth, this study added chemical experiment damage recovery (R) as an important consideration factor in the risk assessment criteria. Due to the traditional FMEA method only considering risk factors (S, O, and D) to ensure laboratory safety and improve experimental quality, there is still an obvious problem in disrupting the coherence of experimental courses after chemical experiment risk accidents. However, in the proposed method of this study, the advantages of the R evaluation criteria increase the consideration of restoring laboratory operations after an experimental accident. Once an accident occurs, how to restore the laboratory environment and restore personnel operation capabilities in the fastest time needs to be determined. It can minimize the impact of chemical experiment accidents and restore school laboratory operations, and it is more in line with the particularity of the real situation of university chemistry experiments.

5. Conclusions

In academia, the scope covered by scientific experiments is extensive, spanning various scientific fields, such as biology, physics, and social sciences. The field of chemistry frequently employs chemical experiments to delve into research and develop new disciplinary knowledge. Due to the involvement of drugs, reagents, and operating procedures in chemical experiments, potential dangers and risks may arise. These risks not only impact the personal safety of laboratory members but also have implications for the health and safety of the environment and the public. Thus, the importance of safety in laboratory chemical experiments cannot be overlooked. It is imperative to ensure laboratory safety through appropriate hazard management and safety measures. However, the typical FMEA method has some limitations, such as the fact that three criteria, S, O, and D, are equal in weight, do not effectively address problems through hierarchical analysis, and cannot address imprecise and ambiguous information inherent in human cognition. Therefore, this paper proposed a novel IFS-based RPN method that integrates the AHP, FMEA, and IFS methods to evaluate the risk factors associated with chemical experiments in the laboratory. Through numerical analysis and comparison with various research methods, it has been demonstrated that this research methodology effectively evaluates the risk factors of chemical experiments and facilitates their sorting. Furthermore, this approach incorporates the consideration of evaluation criteria for chemical experiment damage recovery in chemical laboratories. This approach enables them to implement appropriate laboratory risk management actions and provide relevant management units with valuable insights, thereby reducing the likelihood of accidents.
The advantages of this research method can be summarized as follows:
(1)
The proposed novel IFS-based RPN method can consider both qualitative information and quantitative information in the risk assessment of chemical experiments.
(2)
The proposed novel IFS-based RPN method can consider the weight of risk assessment criteria in chemical experiments.
(3)
The proposed novel IFS-based RPN method handles the uncertainty and fuzziness that are present in the information.
(4)
The proposed novel IFS-based RPN method adds the consideration of recovery in chemical experiments’ damage.
Although the RPN calculation can effectively rank risk factors, it relies on subjective judgments and the accuracy of available data. Therefore, when utilizing the RPN for risk assessment and decision-making, it is crucial to fully consider the professional knowledge and experience of experts and scholars. This research could be further explored in different expert information environments, such as a picture fuzzy set, Pythagorean fuzzy set, or spherical fuzzy set, in terms of considering expert-provided information. This approach can lead to more reliable and accurate results that are better aligned with real-world conditions.

Author Contributions

Conceptualization, H.-Y.C.; methodology, H.-Y.C., T.-H.T. and K.-H.C.; validation, H.-Y.C. and K.-H.C.; data curation, H.-Y.C. and T.-H.T.; writing—original draft preparation, H.-Y.C., T.-H.T. and K.-H.C.; writing—review and editing, H.-Y.C. and K.-H.C.; funding acquisition, H.-Y.C. and K.-H.C. All authors have read and agreed to the published version of the manuscript.

Funding

The authors would like to thank the National Science and Technology Council, Taiwan, for financially supporting this research under Contract No. NSTC 112-2221-E-145-002 and NSTC 112-2221-E-145-003.

Data Availability Statement

The data presented in this study are available on request from the corresponding author.

Conflicts of Interest

The authors declare no conflicts of interest.

References

  1. Lu, Z.S. Analysis of China students’ laboratory accidents in the past 39 years and the laboratory management reform in the future. Educ. Chem. Eng. 2023, 42, 54–60. [Google Scholar] [CrossRef]
  2. Wang, X.A.; Hu, X.F. Quantitative risk assessment of college campus considering risk interactions. Heliyon 2023, 9, e13674. [Google Scholar] [CrossRef]
  3. Du, J.L.; Liu, S.F.; Tao, L.Y.; Dong, W.J. Three-way failure mode and effect analysis approach for reliability management in multigranular unbalanced linguistic contexts. Comput. Ind. Eng. 2023, 175, 108909. [Google Scholar] [CrossRef]
  4. Sun, J.J.; Liu, Y.M.; Xu, J.C.; Wang, N.; Zhu, F. A probabilistic uncertain linguistic FMEA model based on the extended ORESTE and regret theory. Comput. Ind. Eng. 2023, 180, 109251. [Google Scholar] [CrossRef]
  5. Chang, K.H.; Wen, T.C.; Chung, H.Y. Soft failure mode and effects analysis using the OWG operator and hesitant fuzzy linguistic term sets. J. Intell. Fuzzy Syst. 2018, 34, 2625–2639. [Google Scholar] [CrossRef]
  6. Ahluwalia, R.K.; Roh, H.S.; Peng, J.K.; Papadias, D.; Baird, A.R.; Hecht, E.S.; Ehrhart, B.D.; Ronevich, J.A.; Houchins, C.; Killingsworth, N.J.; et al. Liquid hydrogen storage system for heavy duty trucks: Configuration, performance, cost, and safety. Int. J. Hydrogen Energy 2023, 48, 13308–13323. [Google Scholar] [CrossRef]
  7. Chang, K.H. Integrating spherical fuzzy sets and the objective weights consideration of risk factors for handling risk-ranking issues. Appl. Sci. 2023, 13, 4503. [Google Scholar] [CrossRef]
  8. Zhou, J.; Liu, Y.; Liang, D.C.; Tang, M.C. A new risk analysis approach to seek best production action during new product introduction. Int. J. Prod. Econ. 2023, 262, 108911. [Google Scholar] [CrossRef]
  9. Zhu, Y.; Zhou, Y.X.; Gao, H.P.; Wang, Z.R.; Bai, W.; Ouyang, D.X.; Wang, J.L. Synergistic inhibition of thermal runaway propagation of lithium-ion batteries by porous materials and water mist. J. Clean. Prod. 2023, 406, 137099. [Google Scholar] [CrossRef]
  10. Ding, L.; Khan, F.; Ji, J. Application of data mining to minimize fire-induced domino effect risks. Risk Anal. 2023, 43, 571–589. [Google Scholar] [CrossRef] [PubMed]
  11. Ebadzadeh, F.; Monavari, S.M.; Jozi, S.A.; Robati, M.; Rahimi, R. An integrated of fuzzy-WASPAS and E-FMEA methods for environmental risk assessment: A case study of petrochemical industry, Iran. Environ. Sci. Pollut. Res. 2023, 30, 40315–40326. [Google Scholar] [CrossRef] [PubMed]
  12. Liu, J.W.; Wang, D.J.; Lin, Q.L.; Deng, M.K. Risk assessment based on FMEA combining DEA and cloud model: A case application in robot-assisted rehabilitation. Expert Syst. Appl. 2023, 214, 119119. [Google Scholar] [CrossRef]
  13. Wang, Y.; Zhang, R.; Zhang, X.Y.; Zhang, Y.L. Privacy risk assessment of smart home system based on a STPA-FMEA method. Sensors 2023, 23, 4664. [Google Scholar] [CrossRef] [PubMed]
  14. Saaty, T.L. The Analytic Hierarchy Process; McGraw-Hill: New York, NY, USA, 1980. [Google Scholar]
  15. Romero-Ramos, J.A.; Gil, J.D.; Cardemil, J.M.; Escobar, R.A.; Arias, I.; Perez-Garcia, M. A GIS-AHP approach for determining the potential of solar energy to meet the thermal demand in southeastern Spain productive enclaves. Renew. Sust. Energ. Rev. 2023, 176, 113205. [Google Scholar] [CrossRef]
  16. Roy, P.K.; Ghosh, A.; Basak, S.K.; Mohinuddin, S.; Roy, M.B. Analysing the role of AHP model to identify flood hazard zonation in a coastal island, India. J. Indian Soc. Remote Sens. 2023, 51, 1171–1185. [Google Scholar] [CrossRef]
  17. Agustina, R.D.; Putra, R.P.; Susanti, S. Mapping greater bandung flood susceptibility based on multi-criteria decision analysis (MCDA) using AHP method. Environ. Earth Sci. 2023, 82, 370. [Google Scholar] [CrossRef]
  18. Bognar, F.; Benedek, P. A novel AHP-PRISM risk assessment method-an empirical case study in a nuclear power plant. Sustainability 2022, 14, 11023. [Google Scholar] [CrossRef]
  19. Zadeh, L.A. Fuzzy sets. Inf. Control. 1965, 8, 338–353. [Google Scholar] [CrossRef]
  20. Ayyildiz, E. Interval valued intuitionistic fuzzy analytic hierarchy process-based green supply chain resilience evaluation methodology in post COVID-19 era. Environ. Sci. Pollut. Res. 2023, 30, 42476–42494. [Google Scholar] [CrossRef]
  21. Atanassov, K.T. Intuitionistic fuzzy-sets. Fuzzy Sets Syst. 1986, 20, 87–96. [Google Scholar] [CrossRef]
  22. Ren, W.J.; Yang, Z.P.; Li, X.P. Distance measures based on metric information matrix for Atanassov’s intuitionistic fuzzy sets. Axioms 2023, 12, 376. [Google Scholar] [CrossRef]
  23. Rehman, U.U.; Mahmood, T. The generalized dice similarity measures for bipolar complex fuzzy set and its applications to pattern recognition and medical diagnosis. Comput. Appl. Math. 2022, 41, 265. [Google Scholar] [CrossRef]
  24. Awodi, N.J.; Liu, Y.K.; Ayo-Imoru, R.M.; Ayodeji, A. Fuzzy TOPSIS-based risk assessment model for effective nuclear decommissioning risk management. Prog. Nucl. Energy 2023, 155, 104524. [Google Scholar] [CrossRef]
  25. Gwak, J.; Garg, H.; Jan, N.M. Hybrid integrated decision-making algorithm for clustering analysis based on a bipolar complex fuzzy and soft sets. Alex. Eng. J. 2023, 67, 473–487. [Google Scholar] [CrossRef]
  26. de Andres-Sanchez, J. A systematic review of the interactions of fuzzy set theory and option pricing. Expert Syst. Appl. 2023, 223, 119868. [Google Scholar] [CrossRef]
  27. Chang, K.H. Combining subjective and objective weights considerations to solve the emergency location selection problems under spherical fuzzy environments. Appl. Soft Comput. 2024, 153, 111272. [Google Scholar] [CrossRef]
  28. Hailiang, Z.; Khokhar, M.; Islam, T.; Sharma, A. A model for green-resilient supplier selection: Fuzzy best-worst multi-criteria decision-making method and its applications. Environ. Sci. Pollut. Res. 2023, 30, 54035–54058. [Google Scholar] [CrossRef] [PubMed]
  29. Ceylan, B.O. Shipboard compressor system risk analysis by using rule-based fuzzy FMEA for preventing major marine accidents. Ocean Eng. 2023, 272, 113888. [Google Scholar] [CrossRef]
  30. Hatefi, M.A.; Balilehvand, H.R. Risk assessment of oil and gas drilling operation: An empirical case using a hybrid GROC-VIMUN-modified FMEA method. Process Saf. Environ. Prot. 2023, 170, 392–402. [Google Scholar] [CrossRef]
  31. Zhang, W.Q.; Wu, X.T.; Wu, X.A.; Lei, Y.; Shao, J.L.; Wang, Z.Y. Risk assessment of water and sand inrush in mining under thick loose layer based on comprehensive weight-cloud model. Geofluids 2023, 2023, 1181284. [Google Scholar] [CrossRef]
  32. Sinha, A.; Nikhil, S.; Ajin, R.S.; Danumah, J.H.; Saha, S.; Costache, R.; Rajaneesh, A.; Sajinkumar, K.S.; Amrutha, K.; Johny, A.; et al. Wildfire risk zone mapping in contrasting climatic conditions: An approach employing AHP and F-AHP models. Fire 2023, 6, 44. [Google Scholar] [CrossRef]
  33. Chen, S.M. Fuzzy system reliability-analysis using fuzzy number arithmetic operations. Fuzzy Sets Syst. 1994, 64, 31–38. [Google Scholar] [CrossRef]
  34. Chang, K.H. A novel supplier selection method that integrates the intuitionistic fuzzy weighted averaging method and a soft set with imprecise data. Ann. Oper. Res. 2019, 272, 139–157. [Google Scholar] [CrossRef]
  35. Liu, H.W.; Wang, G.J. Multi-criteria decision-making methods based on intuitionistic fuzzy sets. Eur. J. Oper. Res. 2007, 179, 220–233. [Google Scholar] [CrossRef]
  36. Mirghafoori, S.H.; Tooranloo, H.S.; Saghafi, S. Diagnosing and routing electronic service quality improvement of academic libraries with the FMEA approach in an intuitionistic fuzzy environment. Electron. Libr. 2020, 38, 597–631. [Google Scholar] [CrossRef]
  37. Li, Z.Q.; Wang, X.L.; Gong, S.J.; Sun, N.H.; Tong, R.P. Risk assessment of unsafe behavior in university laboratories using the HFACS-UL and a fuzzy Bayesian network. J. Saf. Res. 2022, 82, 13–27. [Google Scholar] [CrossRef] [PubMed]
  38. Fatemi, F.; Dehdashti, A.; Jannati, M. Implementation of Chemical Health, Safety, and Environmental Risk Assessment in Laboratories: A Case-Series Study. Front. Public Health 2022, 10, 898826. [Google Scholar] [CrossRef] [PubMed]
  39. Li, X.H.; Zhang, L.Y.; Zhang, R.R.; Yang, M.; Li, H. A semi-quantitative methodology for risk assessment of university chemical laboratory. J. Loss Prev. Process Ind. 2021, 72, 104553. [Google Scholar] [CrossRef]
  40. Zhao, X.N.; Wei, Z.C.; Gao, Y.K.; Yin, P.G. Laboratory Risk Assessment Based on SHELL-HACCP-Cloud Model. Sustainability 2023, 15, 16590. [Google Scholar] [CrossRef]
  41. Ozdemir, Y.; Gul, M.; Celik, E. Assessment of occupational hazards and associated risks in fuzzy environment: A case study of a university chemical laboratory. Hum. Ecol. Risk Assess. 2017, 23, 895–924. [Google Scholar] [CrossRef]
  42. Juan, Y.K.; Sheu, U.Y.; Chen, K.S. Application of statistical data and methods to establish RPN ratings of FMEA method for construction projects. J. Civ. Eng. Manag. 2023, 29, 662–668. [Google Scholar] [CrossRef]
  43. Li, H.; Diaz, H.; Soares, C.G. A failure analysis of floating offshore wind turbines using AHP-FMEA methodology. Ocean Eng. 2021, 234, 109261. [Google Scholar] [CrossRef]
  44. Jin, G.Y.; Meng, Q.P.; Feng, W. Optimization of logistics system with fuzzy FMEA-AHP methodology. Processes 2022, 10, 1973. [Google Scholar] [CrossRef]
Figure 1. The procedure for preparing hydrogels.
Systems 12 00155 g001
Table 1. The evaluation scales for the three risk factors in FMEA.
Rating ScaleSOD
10Extremely highExceedingly highExceptionally low
9Very highVery highVery remote
8HighHighRemote
7Moderately highModerately highReasonably low
6ModerateModerateLow
5Moderately lowModerately lowModerate
4Relatively lowRelatively lowHigh
3RemoteRemoteVery high
2Very remoteVery remoteExtremely high
1Exceptionally lowExceptionally lowAlmost certain
Table 2. The nine scales of pairwise comparison.
Relative Intensity of ImportanceDefinition
1Equal
3Moderately
5Strongly
7Very strongly
9Extremely
2, 4, 6, 8Intermediate judgment between two adjacent judgments
Table 3. Random index table.
n123456789
RI0.000.000.580.901.121.241.321.411.45
Table 4. The IFN represents various linguistic levels of rating [36].
Rating ScaleLinguistic VariablesLinguistic LevelIFN
10Exceptionally highL10(1.00, 0.00)
9Extremely highL9(0.90, 0.10)
8Very highL8(0.80, 0.10)
7Moderately elevatedL7(0.70, 0.20)
6Medium highL6(0.60, 0.30)
5FairL5(0.50, 0.40)
4Lower to fairL4(0.40, 0.50)
3LowL3(0.25, 0.60)
2Very lowL2(0.10, 0.75)
1Extremely lowL1(0.10, 0.90)
Table 5. The rating scale for the four risk evaluation criteria in chemical experiment.
Rating ScaleSODR
10Moderate injury.The probability of occurrence is extremely high.Almost undetectable.Recoverable within 1 week.
9Minor injury.The probability of occurrence is very high.Extremely low probability of detection.Recoverable within 3 days.
8Very slight injury.High probability of occurrence.Very low probability of detection.Recoverable within 1 day.
7General risks (may get hurt).Medium to high probability of occurrence.Low probability of detection.Recoverable within half a day.
6Slight risk (may get hurt).Moderate probability of occurrence.Medium probability of detection.Recoverable within 2 h.
5Very slight risk (may get hurt).The probability of occurrence is medium to low.Possibility of detection is medium high.Recoverable within 1–2 h.
4General influence (does not cause injury).Low probability of occurrence.High probability of detection.Recoverable within 1 h.
3Slight influence (does not cause injury).The probability of occurrence is very low.Very high probability of detection.Recovery within half an hour.
2Very slight influence (does not cause injury).Very low chance of occurrence.Extremely high probability of detection.Recoverable within 10 min.
1Negligible impact.The probability of occurrence is almost zero.Almost certain to be detected.No effect.
Table 6. The linguistic values of the risk evaluation scale of failure modes.
Failure ModeFailure Mode DescriptionsCause of FailureExpertSODR
FM1Chemicals shortage.Chemicals break during storage or experimentation, causing leaks and contamination that render them unusable.E1L1L2L5L4
E2L2L2L4L5
E3L1L4L6L6
FM2There was a sudden power outage in the laboratory.Excessive use of electricity leads to unstable electricity.E1L5L3L10L7
E2L6L3L9L6
E3L6L2L8L4
FM3The lab lacks a water supply.Old and damaged pipes.E1L5L4L10L4
E2L5L3L9L4
E3L6L2L8L3
FM4Electric shock hazard.The equipment circuit is aging and leaking electricity, and it is charged during operation.E1L9L1L10L10
E2L9L2L9L9
E3L9L2L8L8
FM5Objects flying, collapsing, and causing injuries to people.Laboratory items are stacked too high.E1L4L4L9L3
E2L4L3L8L3
E3L3L2L8L2
FM6Cut injuries from instruments and broken glassware.The performance of instruments and glassware does not meet the experimental requirements.E1L5L6L8L4
E2L5L5L8L4
E3L4L5L7L3
FM7Poisoning hazard.The risk of inhaling or coming into contact with chemicals during experiments without wearing personal protective equipment.E1L6L10L10L3
E2L6L9L8L2
E3L5L9L8L2
FM8Corrosion hazard.During the experiment, the skin was in direct contact with chemicals without wearing personal protection.E1L8L9L10L5
E2L8L8L8L4
E3L7L7L6L3
FM9Using the incorrect chemical for experimentation.Insufficient training in chemical identification. E1L8L4L4L2
E2L6L3L3L2
E3L6L3L2L2
FM10Fall hazard.Running in the laboratory, the aisles are not clear, and the ground is wet.E1L8L3L8L8
E2L7L2L6L7
E3L7L2L5L6
FM11Conducting experiments outside of the course without permission is dangerous.Laboratory personnel have weak safety awareness.E1L4L5L9L3
E2L3L4L7L2
E3L3L4L8L2
FM12Aged or short-circuited laboratory wiring causes wire fire.The electrical wiring is old and not regularly updated.E1L6L4L9L3
E2L5L3L8L3
E3L4L3L8L1
FM13Static electricity is generated.Too low laboratory humidity results in the release of static electricity.E1L4L4L9L2
E2L3L3L7L3
E3L2L2L8L3
FM14The instrument is damaged and loses function.Experimental equipment failed to be inspected and maintained regularly.E1L7L4L9L7
E2L6L3L8L6
E3L6L2L7L6
FM15Poor laboratory ventilation.During the experiment, windows were not opened, and the intake and exhaust systems were turned on.E1L1L1L1L4
E2L1L1L1L4
E3L1L1L2L3
FM16Running, playing, eating, and engaging in activities unrelated to the experiment in the laboratory affected the experiment.Failure to comply with laboratory safety and hygiene practices.E1L1L1L10L5
E2L1L1L9L4
E3L1L1L9L4
FM17Burns and scald hazards.Failure to wear personal protective equipment as required when exposed to high-temperature substances.E1L7L8L7L6
E2L7L7L6L5
E3L6L7L5L5
FM18Improper handling of laboratory waste can produce violent reactions.Incompatible experimental waste is not clearly considered to cause chemical reactions.E1L10L3L8L8
E2L9L3L7L6
E3L7L2L6L5
FM19Fire and explosion hazards. Improper management and operation of flammable chemicals, experimental instruments, gas cylinders, etc. Illegal smoking, use of open flames and out-of-control chemical reactions.E1L10L1L10L9
E2L9L1L9L8
E3L8L2L8L8
FM20Unexpected occurrences.Natural disasters such as earthquakes and typhoons terminated the experiment.E1L1L3L5L3
E2L2L4L3L2
E3L2L4L4L2
Table 7. Pairwise comparisons of risk evaluation criteria.
Risk Evaluation CriteriaExpertSODR
SE11211
E21222
E31212
OE11/2111/2
E21/211/21/2
E31/211/21/2
DE11111/2
E21/2211/2
E31211
RE11221
E21/2221
E31/2211
Table 8. The risk computation result of failure mode by the RPN method.
Failure ModeSODRPNRank
FM11.3332.6675.00017.77818
FM25.6672.6679.000136.0009
FM35.3333.0009.000144.0007
FM49.0001.6679.000135.00010
FM53.6673.0008.33391.66714
FM64.6675.3337.667190.8154
FM75.6679.3338.667458.3702
FM87.6678.0008.000490.6671
FM96.6673.3333.00066.66716
FM107.3332.3336.333108.37012
FM113.3334.3338.000115.55611
FM125.0003.3338.333138.8898
FM133.0003.0008.00072.00015
FM146.3333.0008.000152.0006
FM151.0001.0001.3331.33320
FM161.0001.0009.3339.33319
FM176.6677.3336.000293.3333
FM188.6672.6677.000161.7785
FM199.0001.3339.000108.00013
FM201.6673.6674.00024.44417
Table 9. The risk computation result of failure mode by the AHP-RPN method.
Failure Mode W S S W O O W D DRPNRank
FM10.5890.5711.7200.57818
FM22.5050.5713.0964.4259
FM32.3570.6423.0964.6867
FM43.9780.3573.0964.39310
FM51.6210.6422.8672.98314
FM62.0631.1412.6376.2094
FM72.5051.9972.98114.9152
FM83.3891.7122.75215.9651
FM92.9470.7131.0322.16916
FM103.2410.4992.1793.52612
FM111.4730.9272.7523.76011
FM122.2100.7132.8674.5198
FM131.3260.6422.7522.34315
FM142.7990.6422.7524.9466
FM150.4420.2140.4590.04320
FM160.4420.2143.2110.30419
FM172.9471.5692.0649.5453
FM183.8310.5712.4085.2645
FM193.9780.2853.0963.51413
FM200.7370.7851.3760.79517
Table 10. Prioritization of failure modes for the AHP-FRPN technique.
Failure Mode W S S W O O W D DRPN (×10−3)Rank
FM1(0.046, 0.954)(0.050, 0.950)(0.216, 0.784)0.49319
FM2(0.311, 0.689)(0.047, 0.953)(1.000, 0.000)14.7287
FM3(0.288, 0.712)(0.062, 0.938)(1.000, 0.000)17.9645
FM4(0.639, 0.361)(0.022, 0.978)(1.000, 0.000)14.2379
FM5(0.175, 0.825)(0.062, 0.938)(0.469, 0.531)5.13913
FM6(0.244, 0.756)(0.151, 0.849)(0.398, 0.602)14.6938
FM7(0.311, 0.689)(1.000, 0.000)(1.000, 0.000)310.7311
FM8(0.479, 0.521)(0.306, 0.694)(1.000, 0.000)146.4012
FM9(0.398, 0.602)(0.075, 0.925)(0.098, 0.902)2.92016
FM10(0.477, 0.553)(0.035, 0.965)(0.309, 0.691)4.81614
FM11(0.148, 0.852)(0.115, 0.885)(0.444, 0.556)7.55712
FM12(0.268, 0.732)(0.075, 0.925)(0.469, 0.531)9.38311
FM13(0.125, 0.875)(0.062, 0.938)(0.444, 0.556)3.45515
FM14(0.361, 0.639)(0.062, 0.938)(0.419, 0.581)9.99610
FM15(0.046, 0.954)(0.022, 0.978)(0.036, 0.964)0.03620
FM16(0.046, 0.954)(0.022, 0.978)(1.000, 0.000)1.01417
FM17(0.387, 0.613)(0.249, 0.751)(0.276, 0.724)26.6053
FM18(1.000, 0.000)(0.047, 0.953)(0.348, 0.652)16.4936
FM19(1.000, 0.000)(0.022, 0.978)(1.000, 0.000)22.2954
FM20(0.046, 0.954)(0.089, 0.911)(0.157, 0.843)0.63818
Table 11. Prioritization of failure modes by the proposed method.
Failure Mode W S S W O O W D D W R R RPN (×10−3)Rank
FM1(0.036, 0.944)(0.035, 0.940)(0.145, 0.813)(0.182, 0.765)0.03317
FM2(0.253, 0.681)(0.033, 0.938)(1.000, 0.000)(0.221, 0.717)1.8457
FM3(0.234, 0.704)(0.043, 0.930)(1.000, 0.000)(0.117, 0.835)1.1878
FM4(0.550, 0.450)(0.015, 0.967)(1.000, 0.000)(1.000, 0.000)8.5373
FM5(0.141, 0.803)(0.043, 0.930)(0.334, 0.601)(0.063, 0.883)0.12714
FM6(0.197, 0.747)(0.107, 0.862)(0.278, 0.633)(0.117, 0.835)0.68510
FM7(0.253, 0.681)(1.000, 0.000)(1.000, 0.000)(0.063, 0.883)16.2051
FM8(0.400, 0.487)(0.222, 0.737)(1.000, 0.000)(0.117, 0.835)11.8822
FM9(0.328, 0.580)(0.052, 0.919)(0.064, 0.896)(0.030, 0.921)0.03218
FM10(0.372, 0.528)(0.024, 0.948)(0.211, 0.722)(0.298, 0.615)0.56611
FM11(0.118, 0.820)(0.081, 0.893)(0.314, 0.633)(0.046, 0.902)0.13813
FM12(0.217, 0.722)(0.052, 0.919)(0.334, 0.601)(0.063, 0.898)0.23612
FM13(0.099, 0.842)(0.043, 0.930)(0.314, 0.633)(0.063, 0.883)0.08515
FM14(0.296, 0.628)(0.043, 0.930)(0.314, 0.633)(0.251, 0.683)1.0159
FM15(0.036, 0.964)(0.015, 0.985)(0.023, 0.964)(0.117, 0.835)0.00120
FM16(0.036, 0.944)(0.015, 0.985)(1.000, 0.000)(0.150, 0.804)0.08316
FM17(0.319, 0.600)(0.179, 0.763)(0.187, 0.760)(0.196, 0.749)2.1055
FM18(1.000, 0.000)(0.033, 0.938)(0.240, 0.686)(0.263, 0.657)2.0866
FM19(1.000, 0.000)(0.015, 0.976)(1.000, 0.000)(0.408, 0.519)6.3074
FM20(0.036, 0.924)(0.062, 0.911)(0.104, 0.855)(0.046, 0.902)0.01119
Table 12. The comparison result and rank of different research methods.
Failure ModeRPNRank
RPN [42]AHP-RPN [43]AHP-FRPN [44] (×10−3)Proposed Method
(×10−3)
RPN [42]AHP-RPN [43]AHP-FRPN [44]Proposed Method
FM117.7780.5780.4930.03318181917
FM2136.0004.42514.7281.8459977
FM3144.0004.68617.9641.1877758
FM4135.0004.39314.2378.537101093
FM591.6672.9835.1390.12714141314
FM6190.8156.20914.6930.68544810
FM7458.37014.915310.73116.2052211
FM8490.66715.965146.40111.8821122
FM966.6672.1692.9200.03216161618
FM10108.3703.5264.8160.56612121411
FM11115.5563.7607.5570.13811111213
FM12138.8894.5199.3830.236881112
FM1372.0002.3433.4550.08515151515
FM14152.0004.9469.9961.01566109
FM151.3330.0430.0360.00120202020
FM169.3330.3041.0140.08319191716
FM17293.3339.54526.6052.1053335
FM18161.7785.26416.4932.0865566
FM19108.0003.51422.2956.307131344
FM2024.4440.7950.6380.01117171819
Table 13. The primary differences in features between the four methods.
Method SelectionSolving Characteristic
Qualitative and Quantitative
Information
Weight
Consideration
Fuzzy Information ProcessingConsideration of Damage Recovery in Chemical
Experiments
RPN method [42]NoNoNoNo
AHP-RPN method [43]YesYesNoNo
AHP-FRPN method [44]YesYesYesNo
Proposed methodYesYesYesYes
Disclaimer/Publisher’s Note: The statements, opinions and data contained in all publications are solely those of the individual author(s) and contributor(s) and not of MDPI and/or the editor(s). MDPI and/or the editor(s) disclaim responsibility for any injury to people or property resulting from any ideas, methods, instructions or products referred to in the content.

