1. Introduction
As the consequences of global climate change persist, natural disasters are becoming increasingly frequent and severe [
1]. This trend renders global communities more vulnerable to catastrophic events, like earthquakes, floods, hurricanes, and wildfires. Due to their unpredictable nature, natural disasters frequently result in significant property damage and loss of life, making the aftermath challenging to manage. On 12 May 2008, an 8.0 magnitude earthquake struck Wenchuan, with aftershocks continuing until June 11, severely damaging an area of approximately 500,000 square kilometers and affecting a total population of 46 million people, causing direct economic losses of CNY 845.14 billion [
2]. A 9.0 magnitude earthquake struck north-eastern Japan in 2011, triggering a massive tsunami that killed about 16,000 people and left almost 30,000 missing, with more than 460 aftershocks of magnitude 5 or higher in a month following the disaster. Widespread destruction of roads and homes further exacerbates relief and supply efforts, posing a significant threat to the stability of the emergency rescue logistics system and the recovery process. To this end, this study delves into the intricacies of humanitarian relief efforts in the face of the urgent demand for effective disaster responses. Its focus is on examining the economic considerations, demand fulfillment, and strategic management of emergency resources to establish a resilient and efficient logistics network for the distribution of emergency supplies. The goal is to strike a balance between managing economic costs and meeting the urgent needs of affected populations by studying the pre-positioning and allocation of emergency resources, with the ultimate aim of minimizing property losses and alleviating human suffering.
Effective disaster emergency rescue operation requires a combination of pre-disaster preparation and post-disaster response [
3]. Thorough planning before a disaster strikes is essential. The pre-disaster preparation involves strategically selecting storage facilities and determining the optimal amount of supplies to stockpile. The location and size of the stockpile should be carefully evaluated, as changes may be challenging to implement once established. Aslan and Çelik [
4] considered the siting of depots and the availability of supplies prior to the disaster. Sanci and Daskin [
5] developed a pre-disaster preparedness plan that took multiple uncertainties into account. In the post-disaster response, resources are distributed based on demand and delivered to the affected regions. Fiedrich et al. [
6] took uncertainty into account and introduced a dynamic optimization model to facilitate the rational allocation of resources in the aftermath of a disaster. Liberatore et al. [
7] contemplated the damage to basic electrical facilities after the earthquake and planned for the restoration of damaged elements. After thorough research, there appears to be limited efforts to enhance the effectiveness of pre-disaster preparation and post-disaster emergency response. Therefore, this study aims to delve deeper into this topic, specifically examining the optimization of pre-disaster positioning, depot allocation, supply distribution, and lateral transshipment for post-disaster relief.
Emergency disaster response is a complex process that is subject to various uncertainties [
8]. These uncertainties can stem from a range of factors, including different scenarios, fluctuations in demand for relief supplies, and the impact of transport and storage on supply integrity. During natural disasters such as earthquakes, roads and buildings may sustain severe damage, increasing the risk of breakage during transportation and storage of relief supplies. Additionally, the extent of road damage can significantly affect the integrity rates of the transported materials. To gain a comprehensive understanding of how different factors can impact the emergency disaster response process, this study introduces various scenarios that simulate a range of disaster situations while accounting for the uncertainties above. The goal is to provide valuable insights into potential risks that may arise during emergency disaster response and to offer practical strategies to mitigate them.
Effective disaster response requires careful planning and preparation, but even the best-laid plans can fall short when faced with sudden and destructive events. One common challenge is the uneven distribution of supplies, resulting in waste and inefficiencies that hinder relief efforts [
9]. To address this issue, the lateral transshipment strategy is implemented to decrease waste due to the uneven distribution of materials and improve the efficiency of material supply. However, due to the unpredictable nature of disasters, emergency rescue logistics management may encounter difficulties concerning depot allocation, inventory planning, and transportation. Striking a balance between cost and efficiency remains a real-world challenge.
Despite sharing similarities in designing networks, emergency logistics network design and supply chain network design have different optimization goals. In supply chain network design, the emphasis is on collaboration and a comprehensive approach, aimed at minimizing overall costs and maximizing revenue for all participating companies [
10]. Conversely, emergency logistics network design prioritizes rapid response and flexibility. During an emergency, the emergency logistics network is established virtually and ceases to exist once the rescue mission is completed. The design of emergency logistics networks is task-oriented, changing over time with the progress of rescue operations. The main focus of emergency logistics network design is to quickly create emergency logistics networks with unique topological structures and functions.
To sum up, this study explores the optimization of emergency rescue resource allocation and transportation network design, considering the uncertainty and multi-period nature of natural disaster rescue. The major contributions of this study are summarized as follows:
This study introduces the lateral transshipment strategy that can reduce casualties and material wastage due to shortages while optimizing the total cost of relief and minimizing property damage.
A novel three-stage stochastic programming model is formulated that can optimize the demand satisfaction rate by handling pre-positioning for depots, distributing relief supplies to corresponding areas, and ensuring adequate supplies through lateral transshipment and redistribution. The three-stage model outperforms two-stage optimization regarding solution capability and efficiency and fully reflects the humanitarian spirit of rescue.
Computational experiments have verified the superiority of the three-stage stochastic programming model over the two-stage stochastic planning model in terms of demand satisfaction, economic efficiency, and computation time. These contributions may be highly beneficial in enhancing logistics network resilience and improving disaster relief efforts’ effectiveness.
The rest of the paper is organized as follows.
Section 2 reviews the relevant literature. The problem is described for disaster emergency rescue in
Section 3. Mathematical models for direct transportation and lateral transshipment are developed in
Section 4.
Section 5 presents the results of computational experiments, including a sensitivity analysis.
Section 6 concludes the research and presents recommendations for future research.
2. Literature Review
2.1. Emergency Facilities Pre-Positioning Problem
Efficient disaster response demands proper pre-positioning of emergency facilities, which serves as the foundation of a reliable emergency logistics network. Decision making for emergency facilities pre-positioning can be categorized into two main aspects: pre-disaster preparation and post-disaster response. In the past few decades, plenty of research has focused on these essential elements to enhance our readiness to respond to emergencies and improve our ability to save lives and protect property.
From the disaster preparation stage, Aslan and Çelik [
4] considered the vulnerability of post-disaster roads as an uncertainty factor in making pre-disaster decisions on the location of depots and quantity of supplies. Ji and Qi [
11] developed a robust optimization model to determine the location of decontamination facilities and allocation solutions for affected villages, which was used to optimize the worst-case performance. Ukkusuri and Yushimito [
12] developed a pre-positioning site selection model that considered vehicle routing and possible disruptions in the transportation network, effectively enhancing the supply capacity of the logistics network under the risk of disruption. Sanci and Daskin [
5] considered road damage and the repair time for roads to develop a preparedness plan in anticipation of a disaster, identifying the number and location of emergency response facilities and recovery resources.
Some studies focused on post-disaster response. Fiedrich et al. [
6] considered time, quality, and quantity to be the limiting factors of resources, aiming to find the best allocation of available resources to the disaster site to minimize the total number of fatalities. Liberatore et al. [
7] focused on repairing damaged infrastructure in the post-disaster period, taking the adverse effects of road damage on the transportation of supplies into account. Çelik and Ergun [
13] optimized the order of road clearance in order to achieve the link between relief needs and supply, integrating resource constraints and the time-critical factors of post-disaster response.
Typically, the disaster preparation stage focuses more on the siting of the depot and the determination of material quantities, while the post-disaster response phase focuses on the supply of supplies and the restoration of damaged roads. In order to balance site location and storage quantities with the post-disaster transportation of supplies, more and more studies have focused on both disaster preparation and post-disaster response.
2.2. Stochstic Programming Model to Emergency Facilities Pre-Positioning Problem
For the two aspects in emergency facilities pre-positioning, two-stage stochastic programming is one of the most common ways to address its uncertainties. Recently, researchers have tended to develop a three-stage stochastic programming model to better describe the relationship between stages and different aspects of factors.
Rawls and Turnquist [
14] proposed a two-stage random mixed integer programming model, which considered the uncertainty of disasters and the availability of transportation networks while determining the location of depots and the preset quantity of various disaster relief supplies in the depots. Ahmadi et al. [
15] established a multi-depot location-routing model and extended it to a two-stage stochastic program. In the first stage, a deterministic model considering the operational logistics problems of real-world transportation networks was developed; in the second stage of the model, consideration was added to the damage factors of earthquake on the road to relocate the site, making the model more widely applicable. Alem et al. [
16] proposed a new two-stage stochastic network flow model with multiple constraints and extended the model through risk measures such as semi bias and conditional risk values. The first stage was used to determine the type and quantity of vehicles, and the second stage was used to purchase missing vehicles to supplement them. The goals of both stages were used for decision making on transportation vehicles. Jiang [
17] proposed a novel two-stage distributionally robust chance-constrained (DRCC) model to minimize the final total cost.
Recently, the three-stage model has gradually been used in decision making to mainly detect the feasibility of the running results of the first two stages and make the final results more reasonable. Rennemo et al. [
18] proposed a three-stage mixed integer random programming model in the development of disaster relief plans. The first two stages were used for decision making on material allocation and the development of initial planning routes. The third stage was further introduced to determine whether the route results of the second stage were feasible. If not, the route would be replanned in the third stage to avoid economic losses caused by the infeasible route in the second stage. Zhang et al. [
19] established a multi-objective three-stage stochastic programming model considering sustainable rescue capabilities, using an alternative single-objective model based on fuzzy auxiliary member variables to deal with multi-objective functions. Babaei [
20] minimized profit and efficiency as goals in the first two phases and reduced consumer and retailer independence in the third phase.
In summary, the two-stage model mainly focuses on decision-making problems, while the three-stage model mostly selects the best results from the first two stages to make the final results more reasonable.
The integration of research with real-life scenarios calls for the refinement and expansion of models on a large scale. This, in turn, necessitates a commensurate improvement in solution methods to ensure accuracy and speed. Van Henryck and Bent [
21] designed a multi-stage hybrid optimization algorithm involving disaster recovery, with a focus on stochastic final-stage delivery, reducing the delivery time for vehicles on the road. Rezaei Malek et al. [
22] established a new comprehensive model for determining pre-disaster inventory and post-disaster direct transportation plans. By retaining the horizontal Chebyshev program (RLTP) as an interactive method, the CPLEX solver was used to solve the data in case studies, which increased the ability to handle unexpected situations and made the model more widely applicable. Moreno et al. [
23] designed three heuristic algorithms based on mathematical programming to solve decision-making problems related to optimizing location, direct transportation, and fleet size. It was proposed that using the TSH+FXO hybrid strategy in the second layer could pursue a more stringent optimality gap and obtained high-quality solutions within a reasonable computational time. Aslan and Çelik [
4] developed a heuristic method based on the SAA scheme to overcome the problem of too many direct transportation scenarios caused by road damage and the inability to use an exact solution. The Sample Average Approximation (SAA) algorithm was proposed, which improved the computational efficiency of solving two-stage stochastic programming models by introducing effective inequalities and boundaries. Sanci and Daskin [
24] proposed a modified integer L-shaped algorithm (ILS I) in 2021 to solve the problem of emergency facilities and how to recover the quantity and location of resources in uncertain situations. They compared and analyzed the CPLEX solver, the integer L-shaped algorithm, and the modified integer L-shaped algorithm to solve the corresponding problems and found that ILS I has better solving effects. This verified the superiority of ILS I’s performance under execution time constraints.
The studies presented primarily center around algorithmic research findings concerning predetermined site selection and the ensuing transportation concerns. Numerous scholars have delved into using the CPLEX solver in their studies, with noteworthy advancements made in various aspects of the algorithm, such as reducing the time it takes to yield results, improving solution accuracy, and expanding the range of scenarios in which it can be applied.
2.3. Lateral Transshipment Strategies for Uncertainty
Lateral transshipment is a widely employed strategy in many inventory systems, particularly within commercial logistics, where the primary objective is maximizing benefits. However, in humanitarian logistics, the priority is to minimize casualties and property losses while meeting the demand, which is often unpredictable and fraught with risk. As noted by Paterson et al. [
25], the system can proactively address stockouts prior to the demand’s emergence or at any point thereafter.
In order to mitigate the challenges posed by uncertain disasters, scholars have begun exploring the integration of lateral transshipment strategies in post-disaster response. This approach addresses the imbalance between supply and demand due to uncertainty. It is expected to receive continued attention from scholars and practitioners alike. Wang et al. [
9] proposed a lateral transshipment strategy and a risk-averse two-stage distributionally robust optimization (DRO) model to distribute the relief resource evenly and tackle the uncertainty. Samani et al. [
26] proposed a two-phase approach to solve the disruptions in the platelet supply network, considering the lateral transshipment policy between hospitals to improve the performance of the logistics network. Wang et al. [
27] proposed a two-stage stochastic emergency supply planning model integrated with transshipment and procurement after the disaster to minimize the expected total cost and maximize the supply shortage rate. Vanvuchelen et al. [
28] proposed a more advanced deep reinforcement learning method to establish transshipment policies and analyze its performance in humanitarian health that has been proved to have a positive effect. Wang and Chen [
29] proposed a novel two-stage DRO model combined with mixed-integer recourse that took transshipment into account in the blood supply network. Wang et al. [
30] proposed a two-stage stochastic programming model to solve uncertain problems in demands, considering lateral transshipment for pre-positioning relief supplies and compared with a direct shipment solution to prove the flexibility and cost-effectiveness of the transshipment.
The main research on transshipment is shown in
Table 1.
3. Problem Description
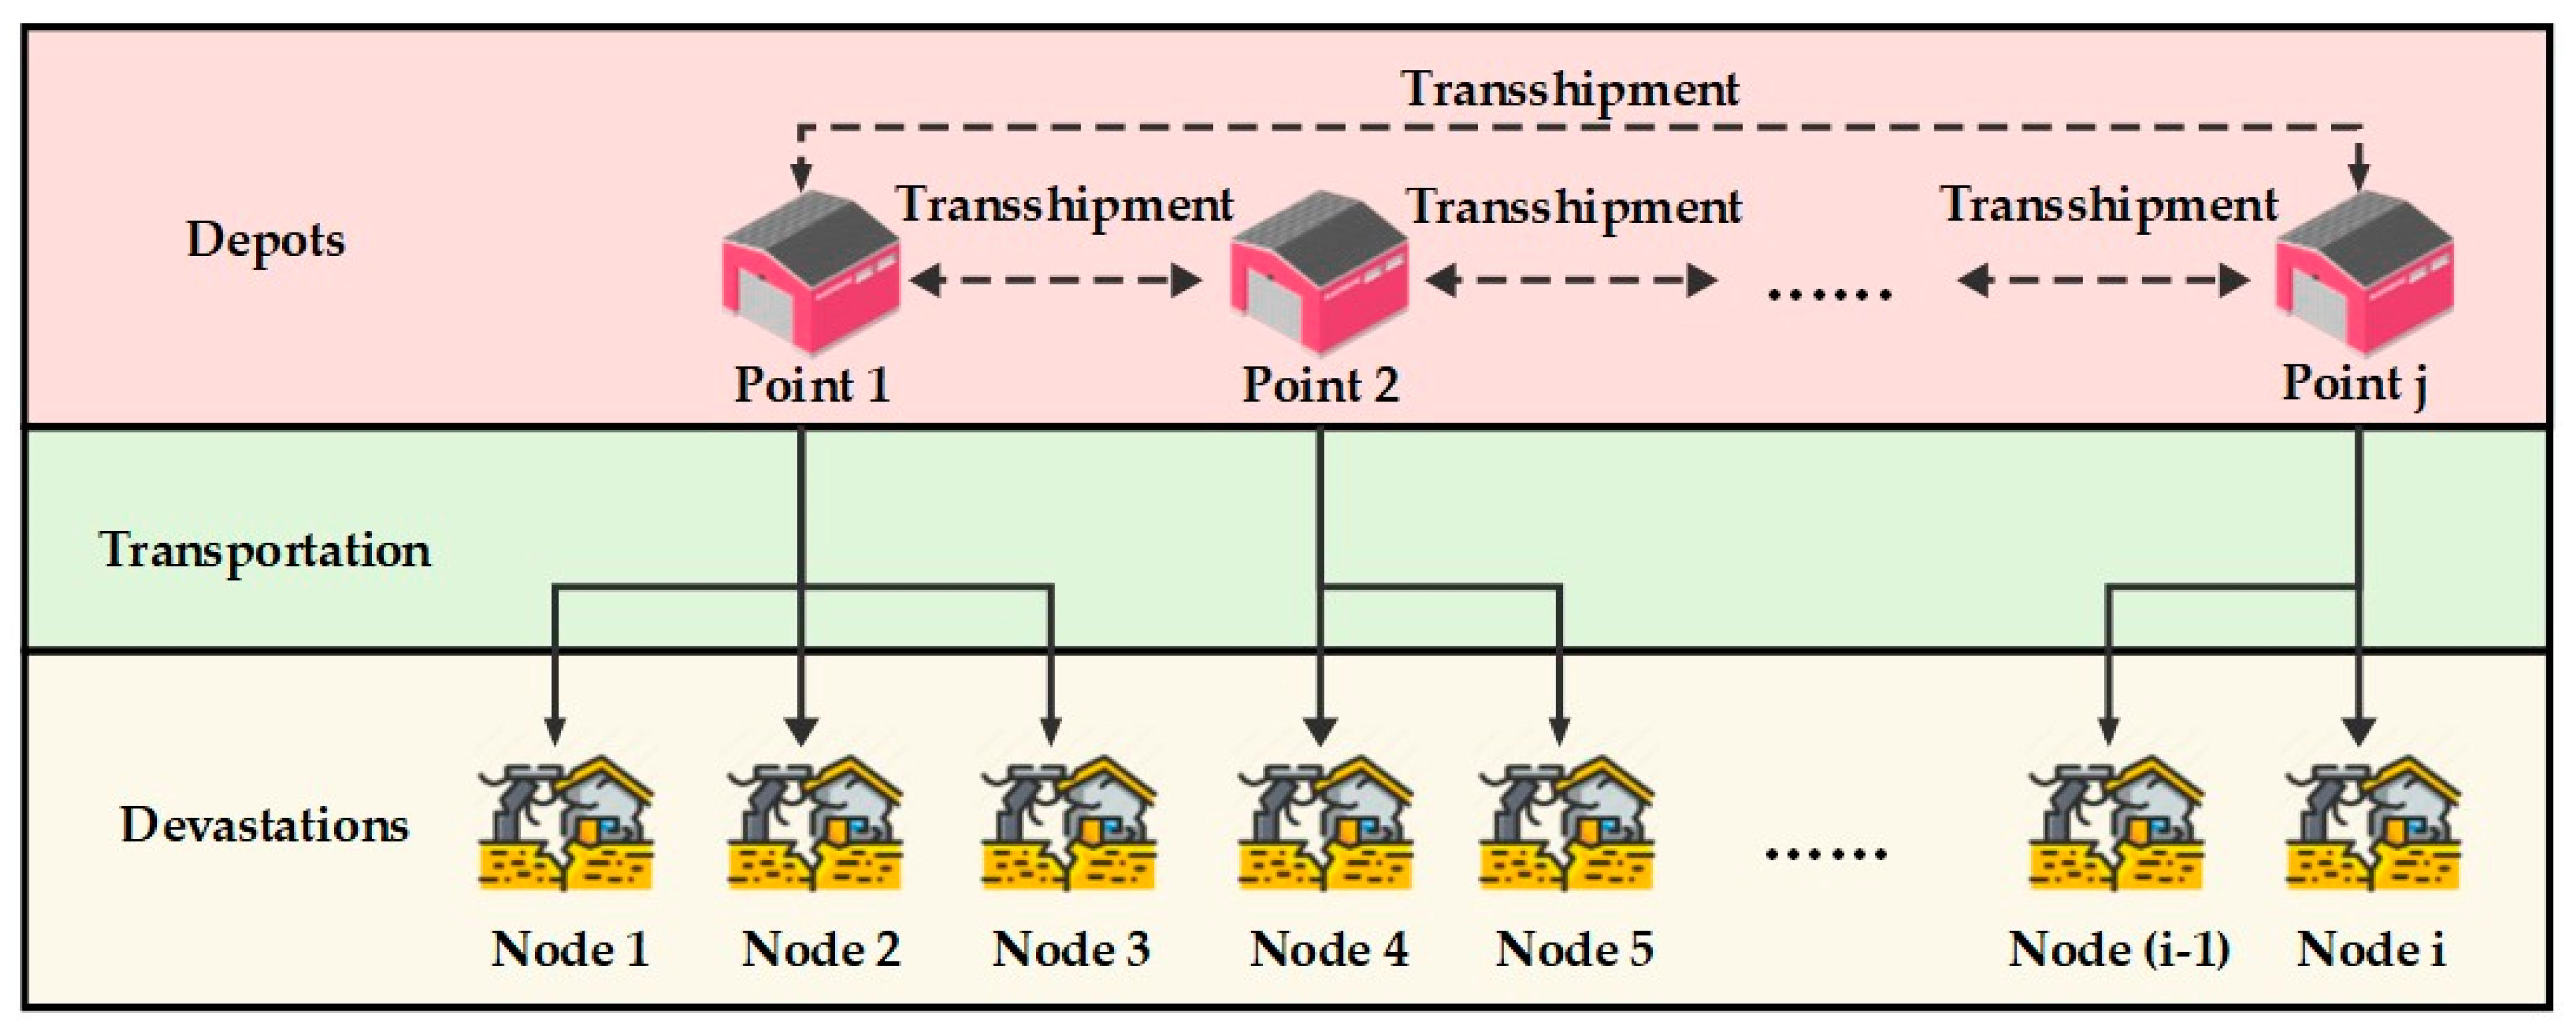
This section describes a two-echelon emergency logistics network, which consists of depots and devastations, under disaster response.
Figure 1 illustrates the structure of the logistics network and its relief supplies flows. Depots reserve relief supplies, which are transported to devastations. It should be noted that the demand for relief supplies and the impact of destruction are considered as the uncertain parameters in this study under disaster response.
Furthermore, disasters such as earthquakes and forest fires have a wide range of hazards; the aftershocks of earthquakes and the spread of fires last for a certain period of time, making it difficult to complete rescue operations at once. In the early stages of an emergency response, some emergency supplies are limited, and it usually takes several periods to meet surges in supplies [
31]. In this context, the disaster response is supposed to have muti-periods to provide relief supplies sustainably, where
represents the rescue period. This study addresses the distribution decision affected by demand uncertainty and material integrity in multi-period supply.
Since the impact of disasters is influenced by various factors, this study takes earthquakes as an example, where apart from the magnitude, factors, such as geological conditions, building structures, and population density in a region also affect the extent of damage caused by disasters. For instance, the 6.8-magnitude earthquake in Luding, Sichuan, in 2022, resulted in 93 fatalities, while a 6.9-magnitude earthquake in Hualien, Taiwan, caused 1 fatality. Therefore, considering the uncertainty of the different levels of disaster impact scenarios is crucial when disasters occur.
This two-echelon decision-making system involves three optimization problems where the data of the latter-level decision-making problem are influenced by the solution of the former. In the first two stages, since the locations of the common devastations are determined, the depot can be pre-positioned at proper nodes, and, after that, the devastations can be assigned to the corresponding depot to respond to the disasters as soon as possible. In the third stage, the focus shifts to incorporating transshipment between various depots, aiming to enhance demand satisfaction and increase the utilization rate of relief supplies.
This research considers the depot construction cost, direct transportation cost, and transshipment cost to make balanced decisions. The aim of this task is to obtain a better preposition–allocation –transportation scheme that balances the total cost of disaster relief under the premise of maximizing the demand of devastations in different scenarios and different periods.
4. Modeling
4.1. Notation
The following sets, parameters, and variables are used in this manuscript.
| Sets |
| Set of possible disaster scenarios, indexed by ; |
| Set of rescue periods, indexed by ; |
| Set of devastation locations, indexed by ; |
| Set of pre-positioned locations for depot, indexed by ; |
| Parameters |
| Cost of construction/open of depot ; |
| The depot integrity rate of the depot /the devastation in scenario and period ; |
| Distance between the devastation and the depot ; |
| Coefficient of demand in scenario ; |
| Demand of the devastation in scenario and period ; |
| Demand of the devastation in scenario and period , ; |
| Probability of scenario occurring in scenario ; |
| The largest inventory of the depot in scenario and period ; |
| Unit transport cost; |
| Penalty factor for unsatisfied demand; |
| A big enough positive value; |
| Auxiliary variables |
| Amount of punishment at devastation in scenario and period . |
| Decision variables |
| { | 1, If construction/open depot ;
0, otherwise; |
| { | 1, If depot take charge of devastation ;
0, otherwise; |
| Actual volume of transportation from the depot to the devastation in scenario and period |
4.2. Assumptions
In order to clearly define the problem and establish a mathematical model, this study makes the following assumptions.
- (1)
The capacity of depot varies across different periods in various disaster scenarios;
- (2)
The demand for disaster relief varies over periods;
- (3)
Each devastation must be allocated to only one depot;
- (4)
Following a disaster, there is a certain rate of depletion in both inventory and relief supplies.
4.3. The Two-Stage Stochastic Programming Model
To better demonstrate the effectiveness of the transshipment model in the third stage, we first set up a two-stage stochastic programming model for comparative verification. At the beginning of the pre-positioning horizon, the first-stage decisions are determined ahead of any disasters occurring. The decision variables include the optimal number of sites and their locations. In the second stage, the decision variables add the allocation plan and transportation volume of the depot and devastations. To balance the economic costs with humanitarian relief, a penalty cost is considered to influence the decision.
The two-stage stochastic programming model can be expressed in the following formulations:
First-stage objective function:
This model decides on the location and quantity of relief supplies in the depot to minimize the objective function (1), which contains warehouse construction costs and expected second-stage cost. Constraint (2) is to ensure that at least one depot is constructed.
Second-stage objective function:
The second-stage objective function (3) is for the transportation cost. Constraint (4) indicates that only one depot can be assigned to each devastation. Constraints (5) and (6) denote the consistency of the variables. Constraints (7) and (8) represent supply–demand constraints, where the total transportation quantity from the depot must not exceed the inventory level after accounting for storage depletion. Additionally, the transportation quantity from the material reserve depot must not exceed the demand of that disaster location. Constraint (9) defines the range of values for the decision variables in the second stage. In the objective function calculation, a penalty cost is introduced for the unmet demand
, with its computation formula shown as Equation (10).
4.4. The Three-Stage Stochastic Programming Model with Transshipment Strategy
Building upon the allocation scheme determined in the second stage, and with the aim of providing a more comprehensive elucidation of the interrelationships among depots, this section designates depots that have surplus inventory after allocation as “material transfer depots”, while depots requiring additional inventory to meet the demands of disaster-stricken areas are referred to as “material recipient depots”. The three-stage stochastic programming model is aimed at minimizing the expected total cost while keeping it flexible enough to destructive events. Hence, in the third stage, the decision variables include the transshipment plan and subsequent transportation scheme as follows:
: Binary decision variable represents whether the material transfer depot transports the supplies to the material recipient depots or not;
: Volume of transshipment from the depot bank
to in scenario and period ;
: Volume of subtransports that the material recipient depot tranches to its corresponding devastation after receiving the transshipment.
Therefore, under the lateral transshipment strategy, the total supplies transported from the material reserve depot to the disaster location comprise the sum of and. The three-stage stochastic programming model can be established as follows:
First-stage objective function:
Second-stage objective function:
Third-stage objective function:
s.t.
Objective functions (11) and (12) represent the pre-position in the first stage and allocation transportation plan in the second stage. The third-stage objective function (13) is for the transshipment and transportation cost. Constraints (14)–(16) denote the consistency of the variables. Constraint (17) states that the third-stage transportation quantity of the material-receiving warehouse must not exceed the sum of the received supplies. Constraint (18) states that the transportation quantity from material transfer warehouse must not exceed the difference between the inventory level after accounting for storage depletion and the second-stage transportation quantity. Constraint (19) signifies that the quantity of supplies received by the third-stage material-receiving warehouse does not exceed the shortage amount of the second stage. Constraint (20) defines the range of decision variables.
5. Computational Experiments
In this section, an earthquake disaster is selected as the background in response to uncertainties arising from factors, such as the extent of devastation scenarios, the demand for supplies, the material integrity rate, the rescue periods, and disaster occurrence probabilities, at varying magnitudes to validate the effectiveness of the transshipment strategy in the model compared with the two-stage stochastic programming model through computational experiments. All numerical experiments are solved by the commercial solver Gurobi 11.0.0 on a laptop with 2.4GHz Intel CPU and 8GB of RAM.
5.1. Generation of Test Instances
Illustrative examples are categorized into small, medium, and large scale. Each scale comprises multiple sets of examples designed to mitigate the likelihood of accidental outcomes.
For the data in experiments, the instance settings and implementation details are mainly from Ni et al. [
32]. But, to better illustrate the variations in requirements across different scenarios, we introduced the coefficient of
randomly distributed between [0.6, 1.3] to augment the variability of demands. The distance between the depots and devastations is calculated according to the Euclidean distance formula. The cost of road transportation by trucks is approximately 2 CNY/km/t, as referenced from Wang et al. [
33]. Considering humanitarian logistics, the primary focus is on addressing the requirements arising from devastations. Therefore, the penalty factor for stock-outs is firstly set at 100-times the unit transportation cost.
5.2. Performance Analysis
To better balance economic costs with the demand of devastations, the cost–benefit ratio is conducted to measure the effectiveness of solutions. In the context of this study, the approach involves a comparison of the economic costs at a unit-weighted satisfaction rate. The formula for calculating the weighted satisfaction rate is as follows:
Here, the economic cost is not equivalent to the objective function value
but, rather, encompasses the total cost after removing penalty costs. The cost–benefit ratio
represents the cost required per satisfaction. A lower value of this ratio indicates higher economic efficiency of the proposed solution. Consequently, the formula for calculating the cost–benefit ratio is as follows:
The results of small-scale and medium-scale examples are shown in
Table 2 and
Table 3, where
represents the total cost of the objective function,
represents the unit-weighted satisfaction rate,
represents the cost–benefit ratio, and
represents the calculation time. The
in the table illustrates the degree of error between the solution obtained by the two-stage and three-stage stochastic programming models, and its calculation formula is
.
Table 2 presents the performance of two-stage and three-stage stochastic programming models in terms of total cost, unit-weighted satisfaction rate, cost–benefit ratio, and calculation time across 12 small-scale examples. As shown in the results in
Table 2, both models can solve problems in a short time. Overall, the three-stage model outperforms the two-stage model in terms of both satisfaction level and cost–benefit. The instance ‘4-10-4-2’ means at the time of the disaster, there are four depots to choose from, ten devastations, four rescue periods, and two possible damage scenarios. In instance 4-10-4-2 and 5-12-4-3, although the satisfaction rate of the three-stage model is lower than that of the two-stage model, its cost–benefit ratio is also lower. To illustrate the difference between two-stage and three-stage redistribution clearly, the diagram of instance 4-10-4-2 fixed scenario 1 and Period 1 is shown in
Figure 2. Upon verification, it was found that the three-stage model with transshipment set up three and four depots, respectively, meeting the devastations’ demand through lateral transshipment instead of opting for full constructing depots. This approach aims to maximize demand satisfaction while minimizing the economic cost of construction.
In
Table 3, the calculation time of the two-stage model is significantly longer than the three-stage in six medium-scale examples. The solution time of the two-stage model is about 433-times that of the three-stage model on average. With an increase in the number of scenarios and periods, the processing time of the two-stage model is significantly affected. In terms of solution quality, the three-stage model constantly maintains a higher satisfaction rate and stable economic efficiency. It can be inferred that in more complex and dynamic disaster scenarios, the three-stage model with transshipment demonstrates greater flexibility in emergency response capabilities.
It is obvious that the average calculating time and cost–benefit ratio increase as the scale of the example increases in both models. In large-scale instances with variables exceeding 369,600, the two-stage model faces issues of prolonged runtime and difficulty to solve, whereas the three-stage model continues to maintain a fast solving speed, as shown in
Table 4. In comparing the two models, the three-stage model with lateral transshipment demonstrates superior performance, achieving a more efficient runtime, higher satisfaction levels, and lower economic costs.
5.3. Sensitivity Analysis
Since the penalty cost of unmet demand and the construction cost of the depot have a great influence on making the pre-positioning and distribution decision, in this section, a sensitivity analysis is conducted to study how these factors affect devastations’ demand satisfaction and economic efficiency. Instance 7-30-10-8 is used as an example in this section.
5.3.1. The Depot Construction Cost
In practical situations, the costs associated with construction and operating vary for different types of supplies and scales of operations. The unit construction cost utilized in
Section 5.2 is assumed to be the minimum scale and basic operational setup for the supplies. In this section, the influence of construction costs on the satisfaction rate and economic costs is explored by adjusting their multiples.
After multiple experiments, significant changes are observed in the transportation plans when the coefficient values are set to
,
, and
. As the results in
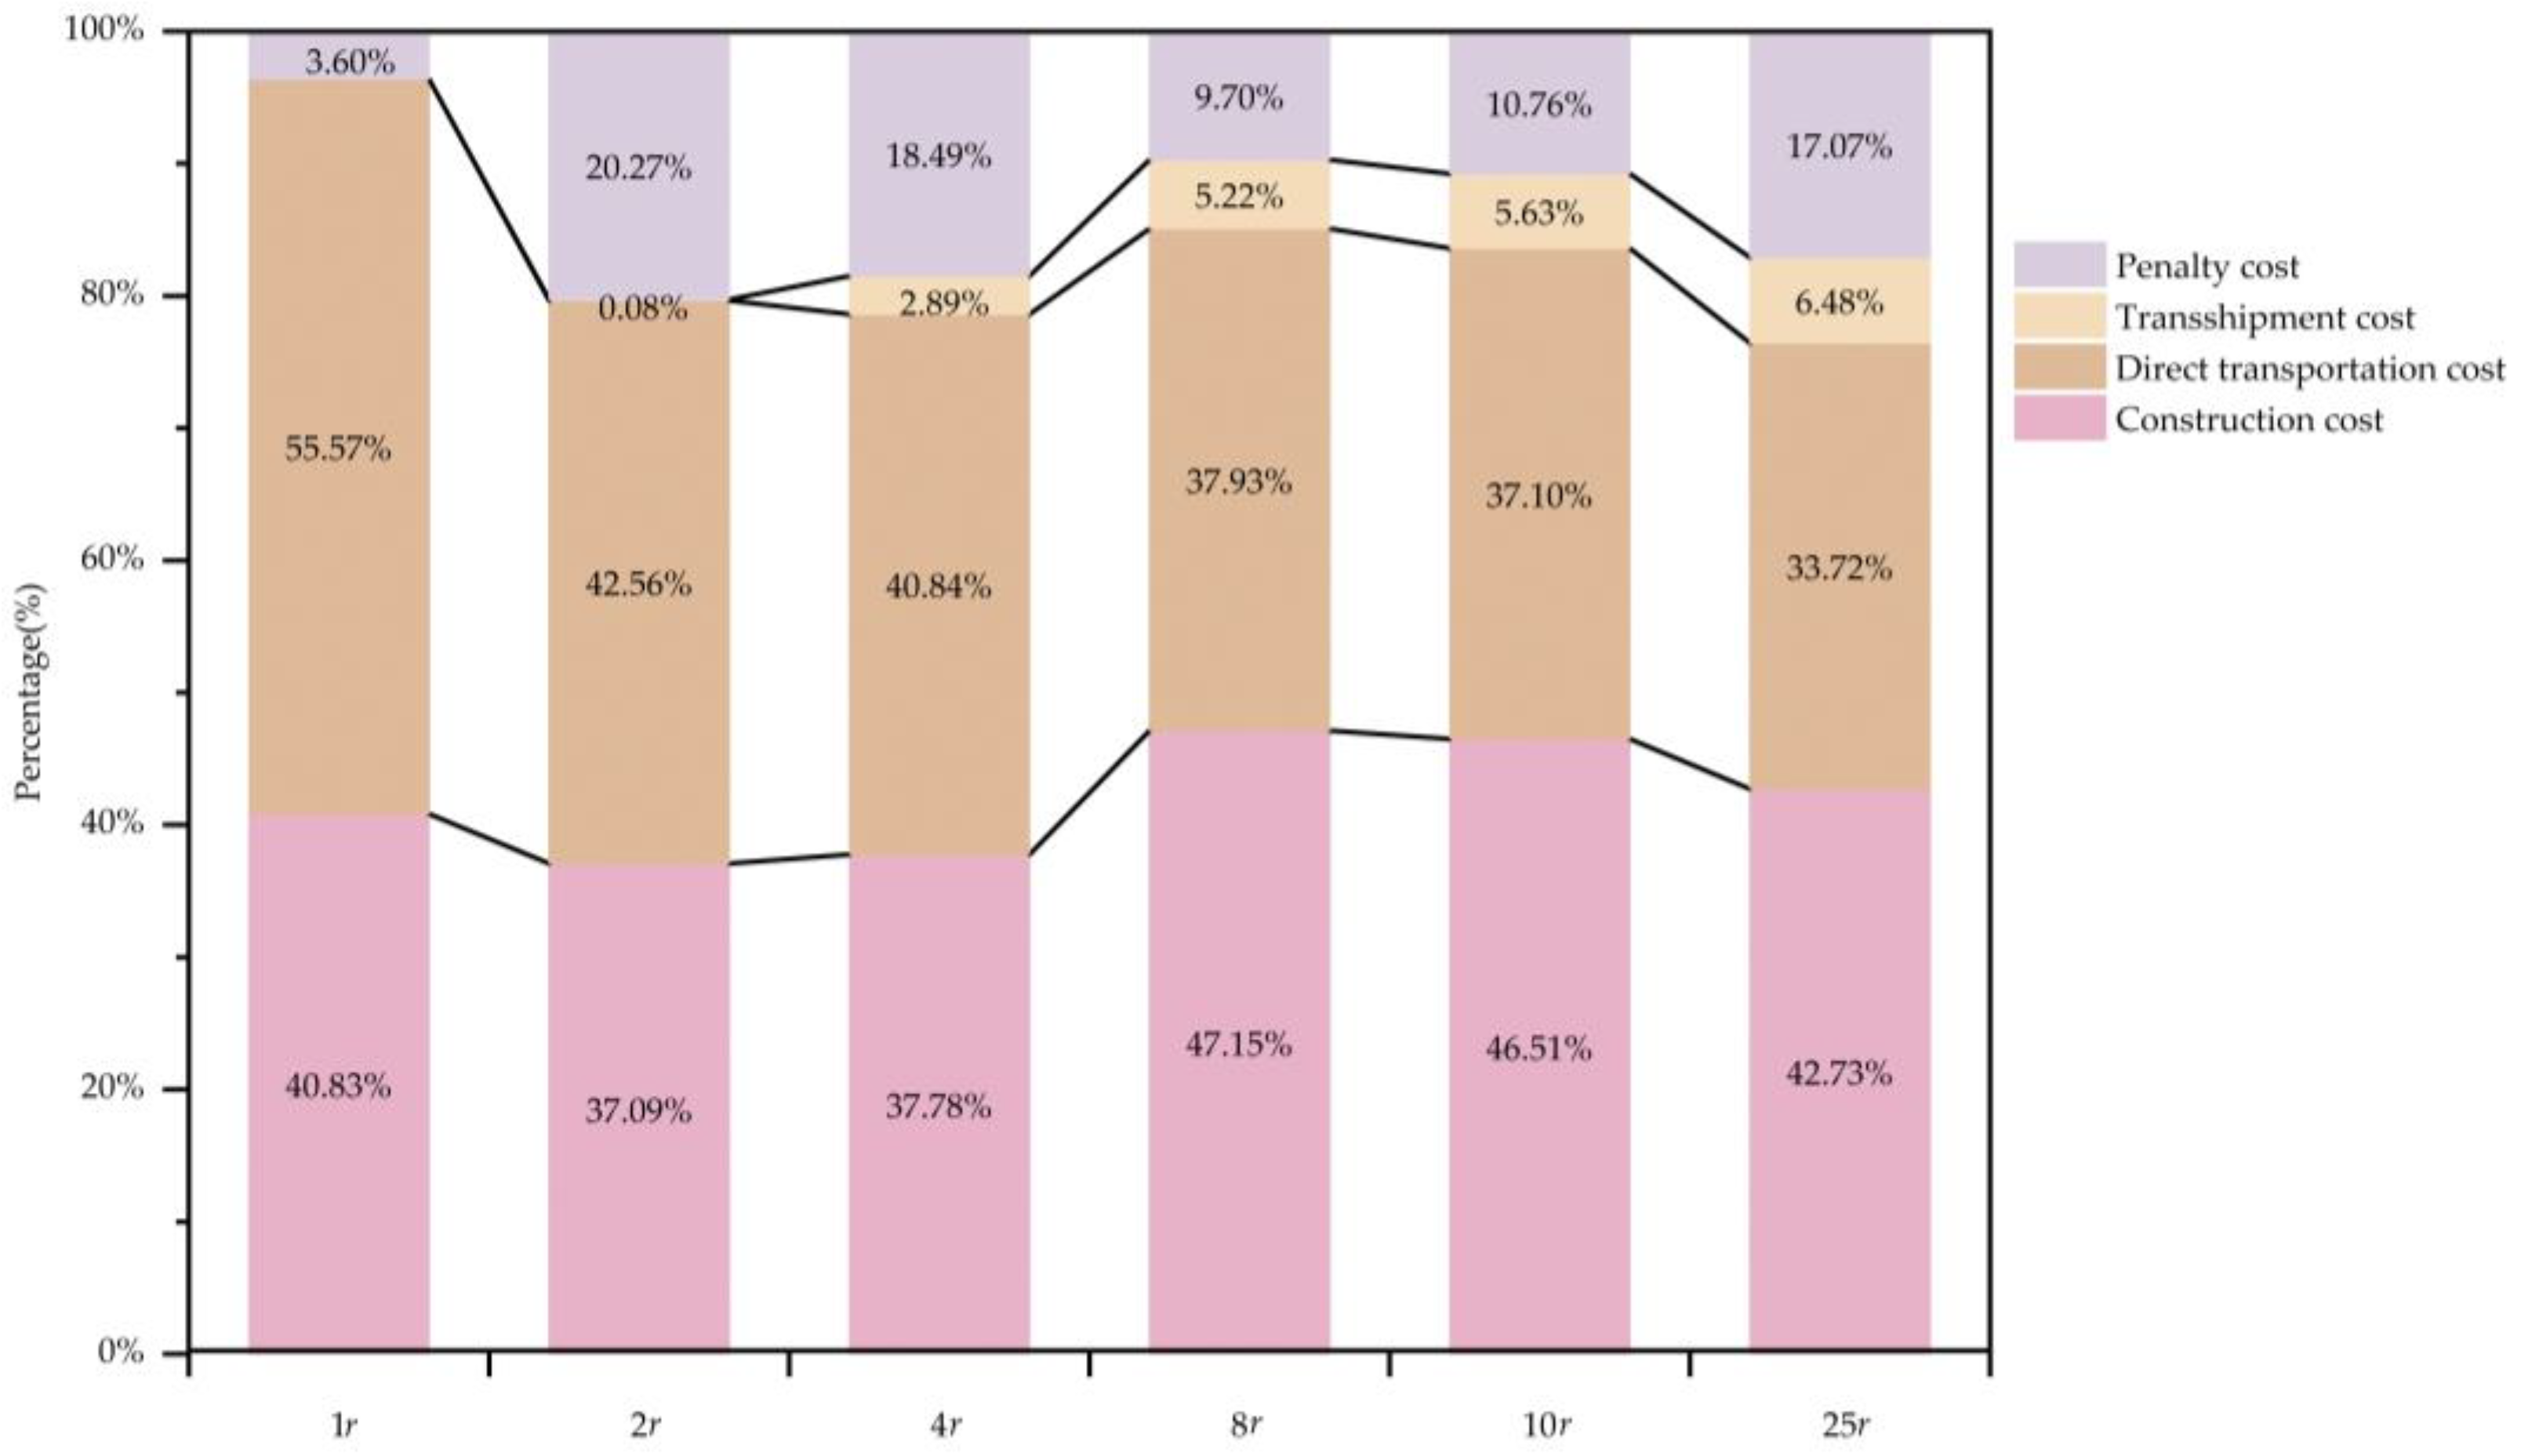
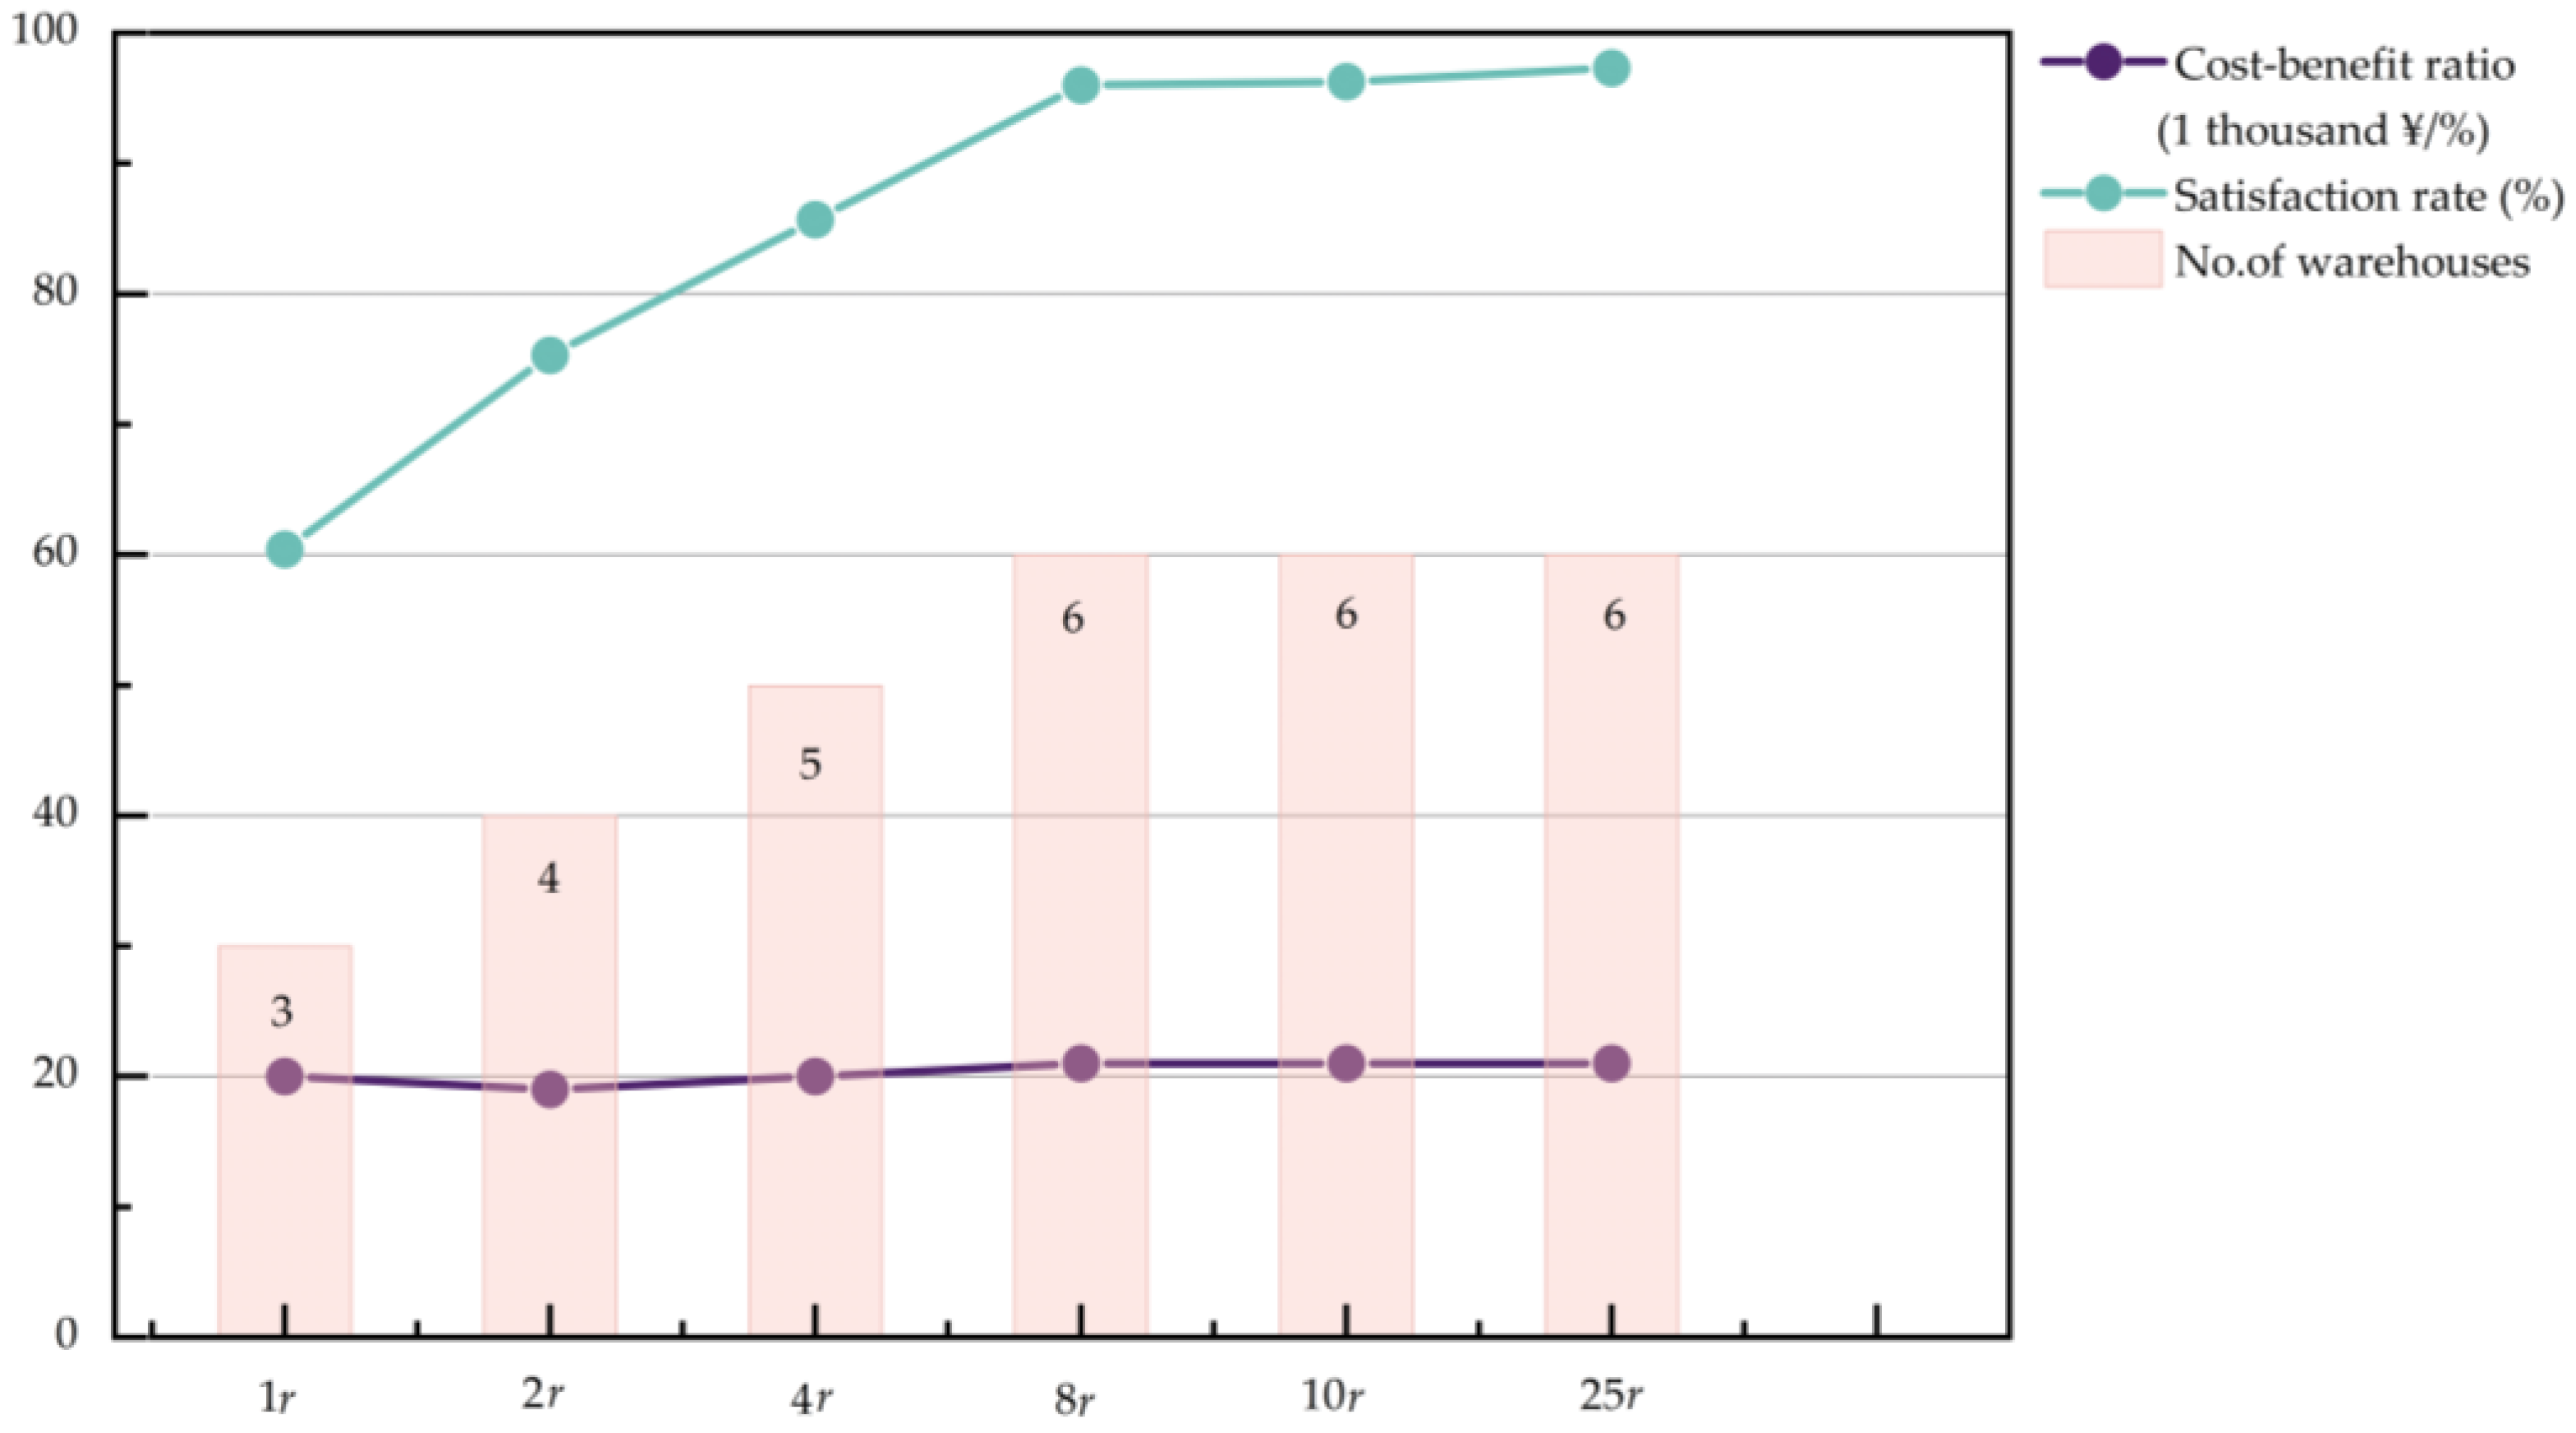
Table 5 indicate, it is obvious that with the increase in construction costs, both penalty costs and the cost–benefit ratio consistently rise, while the number of depots and the satisfaction rate steadily decrease. Thus, the proportion of penalty costs gradually accounts for the vast majority of the overall costs, as shown in
Figure 3. The reason behind this phenomenon is that with the increase in unit construction cost, the costs caused by establishing a warehouse are gradually greater than the transportation or even penalty cost by shortage. Therefore, in the case of a reduction in depots, lateral transshipment can make up for the shortage of relief supplies.
In practical disaster scenarios, it is found that for large-scale or operationally complex depots, such as medical facilities or precision instruments, it would be beneficial to decrease the number of pre-positioned depots that can be offset by implementing lateral transshipment to address demands and enhance the resilience of the logistic network. Conversely, for simpler depot-storing items such as water or dry rations, an appropriate increase in the number of pre-positioned depots can foster the efficiency of emergency response.
5.3.2. The Out-of-Stock Penalty Coefficient
In this study, since the penalty cost under consideration refers to the volume of unfulfilled relief supplies within the devastations, the penalty coefficient
is set as a multiple of the unit transportation cost to simulate the extra costs of expedited or temporary transportation arrangements in an emergency. In this section, the outcomes derived from six distinct penalty coefficients are shown in
Table 6.
As illustrated in
Figure 4 and
Figure 5, a discernible trend emerges with an elevation in both the transportation cost and satisfaction rate as the penalty coefficient increases in general within the same instance. Notably, within a range from
to
, the heightened penalty coefficient stimulates lateral transshipment between depots to effectively meet the demands while the direct transportation costs exhibit relative stability. Hence, in straightforward terms, the higher penalty coefficient, the greater the demand for supplies.
In the case of humanitarian relief, opting for a higher penalty factor is essential to meet the demands of devastations as far as possible. For instance, the choice of a penalty factor can ensure a satisfaction rate of more than 95 percent while maintaining a low cost–benefit ratio. Nevertheless, the three-stage model with a transshipment strategy proposed in this study can also be applied to the chain logistic network in various fields. The desired logistic outcomes can be attained by adjusting the penalty coefficient. In scenarios such as retail and e-commerce, where the impact of product stockouts and the urgency of product availability are less pronounced, adopting a lower penalty coefficient can be advantageous, which can decrease the costs associated with the establishment and operation of forward depots and ultimately boosting overall profitability. However, in cold chain logistics such as fresh e-commerce, a higher penalty coefficient can also be adopted to improve delivery rates, ensuring the safety and freshness of products.
5.4. Managerial Insights
Combined with the above experimental results, several recommendations for decision makers in the realm of emergency logistic management are offered in this section. In light of the findings derived from instance 7-30-10-8 in
Section 5.2, it is evident that the total cost incurred by the three-stage model incorporating transshipment is notably reduced by over CNY 2,000,000 compared to the two-stage model, and the cost–benefit ratio experiences a reduction of 125%, albeit maintaining a remarkably similar ratio. The reduction is attributed to a decline in the number of depot constructions and the adoption of lateral transshipment to fulfill demand. Consequently, it is possible to establish regional cooperation strategies between depots with frequent or significant transshipment volumes, achieving dual objectives of cost-effectiveness and high satisfaction through coordinated transportation and resource replenishment.
During sensitivity analysis in
Section 5.3.2, when adjusting penalty coefficients, it is noted that the coefficient size positively correlates with the satisfaction rate of demands and the quantity of depot constructions. Apart from representing urgency, especially in disaster emergency response scenarios, higher penalty coefficients can also be applied in e-commerce domains. This application facilitates the delivery rates of products that are challenging to store and manage, thereby promoting efficiency in logistics and supply chain management within such sectors.
6. Conclusions
This study addresses the challenges of demand uncertainty and supply shortage in emergency logistics network design from the perspective of resilience and humanitarian relief. The objective is to establish a resilient and efficient logistics network for distributing emergency supplies while balancing economic costs and meeting the urgent needs of affected populations. This study proposes a three-stage stochastic programming model that considers the continuity and uncertainty of emergency relief demand in various scenarios over multiple periods. The model includes a lateral transshipment strategy to address shortages in depots and strengthen the resilience of the logistics network.
Through computational experiments on different instances, the effectiveness of the proposed three-stage stochastic programming model is validated. In small-scale problems, although both models could solve problems in a short time, the three-stage model had a greater satisfaction level and cost–benefit ratio. As for medium-scale and large-scale problems, the CPU time of the two-stage model was significantly longer than the three-stage model as the cost–benefit gap value increased on average. The two-stage model failed to find a feasible solution in 21,000 s, while the three-stage model can find optimal solutions efficiently. Moreover, the three-stage model, with lateral transshipment, is more effective than the two-stage direct transportation model, with higher satisfaction levels, lower economic costs, and shorter computation time. When faced with a significant disaster or overwhelming demand that exceeds storage capacity, the proposed three-stage stochastic programming model for remedying emergency supplies shortages through lateral transportation offers a constructive approach to ensure the optimal allocation of resources during prolonged rescue efforts.
The analysis of construction and penalty costs yielded valuable insights into optimizing warehouse operations. The three-stage model that incorporates transshipment has proven especially effective for logistics networks with large or complex depots, resulting in a significant cost reduction of over 125% compared to the two-stage model. This creates opportunities for cooperative strategies between depots with high transshipment volumes. Additionally, the proposed model is also suitable for e-commerce and cold-chain logistics network design. To ensure timely delivery, penalty coefficients can be set higher for urgent or challenging-to-store supplies to prioritize their transport. Overall, these findings offer a promising approach for enhancing logistics network design and management.
In certain fields, retrieving or expressing historical data can be a challenging and intimidating task. Therefore, it may be beneficial to consider using real-time data for forecasting resource requirements instead in future research. Moreover, mitigating supply disruption risk is a promising topic [
34]. The integration of unmanned systems such as drones also presents a fascinating avenue to explore the fusion of humans and machines in search-and-rescue missions. Furthermore, the prompt mobilization of rescue teams and the subsequent transfer or resettlement of victims, while considering the diverse needs and vulnerabilities of displaced populations, are worthy, deserving comprehensive discussion in future research.
Author Contributions
Conceptualization, Z.W. and S.H.; methodology, Z.W.; software, S.H.; validation, S.H., L.Y. and K.H.; formal analysis, S.H.; investigation, L.Y.; data curation, L.Y.; writing—original draft preparation, S.H.; writing—review and editing, Z.W. and L.Y.; visualization, K.H.; supervision, Z.W.; funding acquisition, Z.W. All authors have read and agreed to the published version of the manuscript.
Funding
This research was supported by the Youth Program of Soft Science Research Project, Science and Technology Innovation Plan of Shanghai Science and Technology Commission [grant number 23692118400]; Humanities and Social Sciences Youth Foundation, Ministry of Education of the People’s Republic of China [grant number 20YJC630155].
Data Availability Statement
All data, models, or code generated or used during the study are available from the corresponding author by request.
Conflicts of Interest
The authors declare no conflict of interest.
References
- Trivedi, A.; Singh, A. A Hybrid Multi-Objective Decision Model for Emergency Shelter Location-Relocation Projects Using Fuzzy Analytic Hierarchy Process and Goal Programming Approach. Int. J. Proj. Manag. 2017, 35, 827–840. [Google Scholar] [CrossRef]
- Cao, C.; Liu, Y.; Tang, O.; Gao, X. A Fuzzy Bi-Level Optimization Model for Multi-Period Post-Disaster Relief Distribution in Sustainable Humanitarian Supply Chains. Int. J. Prod. Econ. 2021, 235, 108081. [Google Scholar] [CrossRef]
- He, F.; Zhuang, J. Balancing Pre-Disaster Preparedness and Post-Disaster Relief. Eur. J. Oper. Res. 2016, 252, 246–256. [Google Scholar] [CrossRef]
- Aslan, E.; Çelik, M. Pre-Positioning of Relief Items under Road/Facility Vulnerability with Concurrent Restoration and Relief Transportation. IISE Trans. 2019, 51, 847–868. [Google Scholar] [CrossRef]
- Sanci, E.; Daskin, M.S. Integrating Location and Network Restoration Decisions in Relief Networks under Uncertainty. Eur. J. Oper. Res. 2019, 279, 335–350. [Google Scholar] [CrossRef]
- Fiedrich, F.; Gehbauer, F.; Rickers, U. Optimized Resource Allocation for Emergency Response after Earthquake Disasters. Saf. Sci. 2000, 35, 41–57. [Google Scholar] [CrossRef]
- Liberatore, F.; Ortuño, M.T.; Tirado, G.; Vitoriano, B.; Scaparra, M.P. A Hierarchical Compromise Model for the Joint Optimization of Recovery Operations and Distribution of Emergency Goods in Humanitarian Logistics. Comput. Oper. Res. 2014, 42, 3–13. [Google Scholar] [CrossRef]
- Li, H.; Zhang, B.; Ge, X. Modeling Emergency Logistics Location-Allocation Problem with Uncertain Parameters. Systems 2022, 10, 51. [Google Scholar] [CrossRef]
- Wang, D.; Yang, K.; Yang, L.; Li, S. Distributional Robustness and Lateral Transshipment for Disaster Relief Logistics Planning under Demand Ambiguity. Int. Trans. Oper. Res. 2022, 31, 1736–1761. [Google Scholar] [CrossRef]
- Hu, H.; Guo, S.; Zhen, L.; Wang, S.; Bian, Y. A multi-product and multi-period supply chain network design problem with price-sensitive demand and incremental quantity discount. Expert Syst. Appl. 2023, 238, 122005. [Google Scholar] [CrossRef]
- Ji, Y.-M.; Qi, M.-L. A Robust Optimization Approach for Decontamination Planning of Emergency Planning Zone: Facility Location and Assignment Plan. Socio-Econ. Plan. Sci. 2020, 70, 100740. [Google Scholar] [CrossRef]
- Ukkusuri, S.V.; Yushimito, W.F. Location Routing Approach for the Humanitarian Prepositioning Problem. Transp. Res. Rec. J. Transp. Res. Board 2008, 2089, 18–25. [Google Scholar] [CrossRef]
- Çelik, M.; Ergun, Ö.; Keskinocak, P. The Post-Disaster Debris Clearance Problem under Incomplete Information. Oper. Res. 2015, 63, 65–85. [Google Scholar] [CrossRef]
- Rawls, C.G.; Turnquist, M.A. Pre-Positioning and Dynamic Delivery Planning for Short-Term Response Following a Natural Disaster. Socio-Econ. Plan. Sci. 2012, 46, 46–54. [Google Scholar] [CrossRef]
- Ahmadi, M.; Seifi, A.; Tootooni, B. A Humanitarian Logistics Model for Disaster Relief Operation Considering Network Failure and Standard Relief Time: A Case Study on San Francisco District. Transp. Res. Part E Logist. Transp. Rev. 2015, 75, 145–163. [Google Scholar] [CrossRef]
- Alem, D.; Clark, A.; Moreno, A. Stochastic Network Models for Logistics Planning in Disaster Relief. Eur. J. Oper. Res. 2016, 255, 187–206. [Google Scholar] [CrossRef]
- Jiang, Z.; Ji, R.; Dong, Z.S. A Distributionally Robust Chance-Constrained Model for Humanitarian Relief Network Design. OR Spectr. 2023, 45, 1153–1195. [Google Scholar] [CrossRef]
- Rennemo, S.J.; Rø, K.F.; Hvattum, L.M.; Tirado, G. A Three-Stage Stochastic Facility Routing Model for Disaster Response Planning. Transp. Res. Part E Logist. Transp. Rev. 2014, 62, 116–135. [Google Scholar] [CrossRef]
- Zhang, J.; Liu, H.; Yu, G.; Ruan, J.; Chan, F.T.S. A Three-Stage and Multi-Objective Stochastic Programming Model to Improve the Sustainable Rescue Ability by Considering Secondary Disasters in Emergency Logistics. Comput. Ind. Eng. 2019, 135, 1145–1154. [Google Scholar] [CrossRef]
- Babaei, A.; Khedmati, M.; Jokar, M.R.A.; Tirkolaee, E.B. Sustainable Transportation Planning Considering Traffic Congestion and Uncertain Conditions. Expert Syst. Appl. 2023, 227, 119792. [Google Scholar] [CrossRef]
- Van Hentenryck, P.; Bent, R.; Coffrin, C. Strategic Planning for Disaster Recovery with Stochastic Last Mile Distribution. In Integration of AI and OR Techniques in Constraint Programming for Combinatorial Optimization Problems; Springer: Berlin/Heidelberg, Germany, 2010; pp. 318–333. [Google Scholar] [CrossRef]
- Rezaei-Malek, M.; Tavakkoli-Moghaddam, R.; Zahiri, B.; Bozorgi-Amiri, A. An Interactive Approach for Designing a Robust Disaster Relief Logistics Network with Perishable Commodities. Comput. Ind. Eng. 2016, 94, 201–215. [Google Scholar] [CrossRef]
- Moreno, A.; Alem, D.; Ferreira, D.; Clark, A. An Effective Two-Stage Stochastic Multi-Trip Location-Transportation Model with Social Concerns in Relief Supply Chains. Eur. J. Oper. Res. 2018, 269, 1050–1071. [Google Scholar] [CrossRef]
- Sanci, E.; Daskin, M.S. An Integer L-Shaped Algorithm for the Integrated Location and Network Restoration Problem in Disaster Relief. Transp. Res. Part B Methodol. 2021, 145, 152–184. [Google Scholar] [CrossRef]
- Paterson, C.; Kiesmüller, G.; Teunter, R.; Glazebrook, K. Inventory Models with Lateral Transshipments: A Review. Eur. J. Oper. Res. 2011, 210, 125–136. [Google Scholar] [CrossRef]
- Samani, M.R.G.; Hosseini-Motlagh, S.-M.; Homaei, S. A Reactive Phase against Disruptions for Designing a Proactive Platelet Supply Network. Transp. Res. Part E Logist. Transp. Rev. 2020, 140, 102008. [Google Scholar] [CrossRef]
- Wang, Q.; Liu, Z.; Jiang, P.; Luo, L. A Stochastic Programming Model for Emergency Supplies Pre-Positioning, Transshipment and Procurement in a Regional Healthcare Coalition. Socio-Econ. Plan. Sci. 2022, 82, 101279. [Google Scholar] [CrossRef]
- Vanvuchelen, N.; De Boeck, K.; Boute, R.N. Cluster-Based Lateral Transshipments for the Zambian Health Supply Chain. Eur. J. Oper. Res. 2024, 313, 373–386. [Google Scholar] [CrossRef]
- Wang, C.; Chen, S. A Distributionally Robust Optimization for Blood Supply Network Considering Disasters. Transp. Res. Part E Logist. Transp. Rev. 2020, 134, 101840. [Google Scholar] [CrossRef]
- Wang, Y.; Dong, Z.S.; Hu, S. A Stochastic Prepositioning Model for Distribution of Disaster Supplies Considering Lateral Transshipment. Socio-Econ. Plan. Sci. 2021, 74, 100930. [Google Scholar] [CrossRef]
- Wang, S.L.; Sun, B.Q. Model of Multi-Period Emergency Material Allocation for Large-Scale Sudden Natural Disasters in Humanitarian Logistics: Efficiency, Effectiveness and Equity. Int. J. Disaster Risk Reduct. 2023, 85, 103530. [Google Scholar] [CrossRef]
- Ni, W.; Shu, J.; Song, M. Location and Emergency Inventory Pre-Positioning for Disaster Response Operations: Min-Max Robust Model and a Case Study of Yushu Earthquake. Prod. Oper. Manag. 2017, 27, 160–183. [Google Scholar] [CrossRef]
- Wang, B.C.; Qian, Q.Y.; Gao, J.J.; Tan, Z.Y.; Zhou, Y. The Optimization of Warehouse Location and Resources Distribution for Emergency Rescue under Uncertainty. Adv. Eng. Inform. 2021, 48, 101278. [Google Scholar] [CrossRef]
- Hu, H.; Guo, S.; Qin, Y.; Lin, W. Two-stage stochastic programming model and algorithm for mitigating supply disruption risk on aircraft manufacturing supply chain network design. Comput. Ind. Eng. 2022, 175, 108880. [Google Scholar] [CrossRef]
| Disclaimer/Publisher’s Note: The statements, opinions and data contained in all publications are solely those of the individual author(s) and contributor(s) and not of MDPI and/or the editor(s). MDPI and/or the editor(s) disclaim responsibility for any injury to people or property resulting from any ideas, methods, instructions or products referred to in the content. |
© 2024 by the authors. Licensee MDPI, Basel, Switzerland. This article is an open access article distributed under the terms and conditions of the Creative Commons Attribution (CC BY) license (https://creativecommons.org/licenses/by/4.0/).


