
Expansion Direction Selection of the Coal-to-Olefin Industrial Chain in Inner Mongolia from the Value Chain Perspective


Abstract
1. Introduction
2. Coal-to-Olefin Industrial Chain Composition and Value Chain Accounting
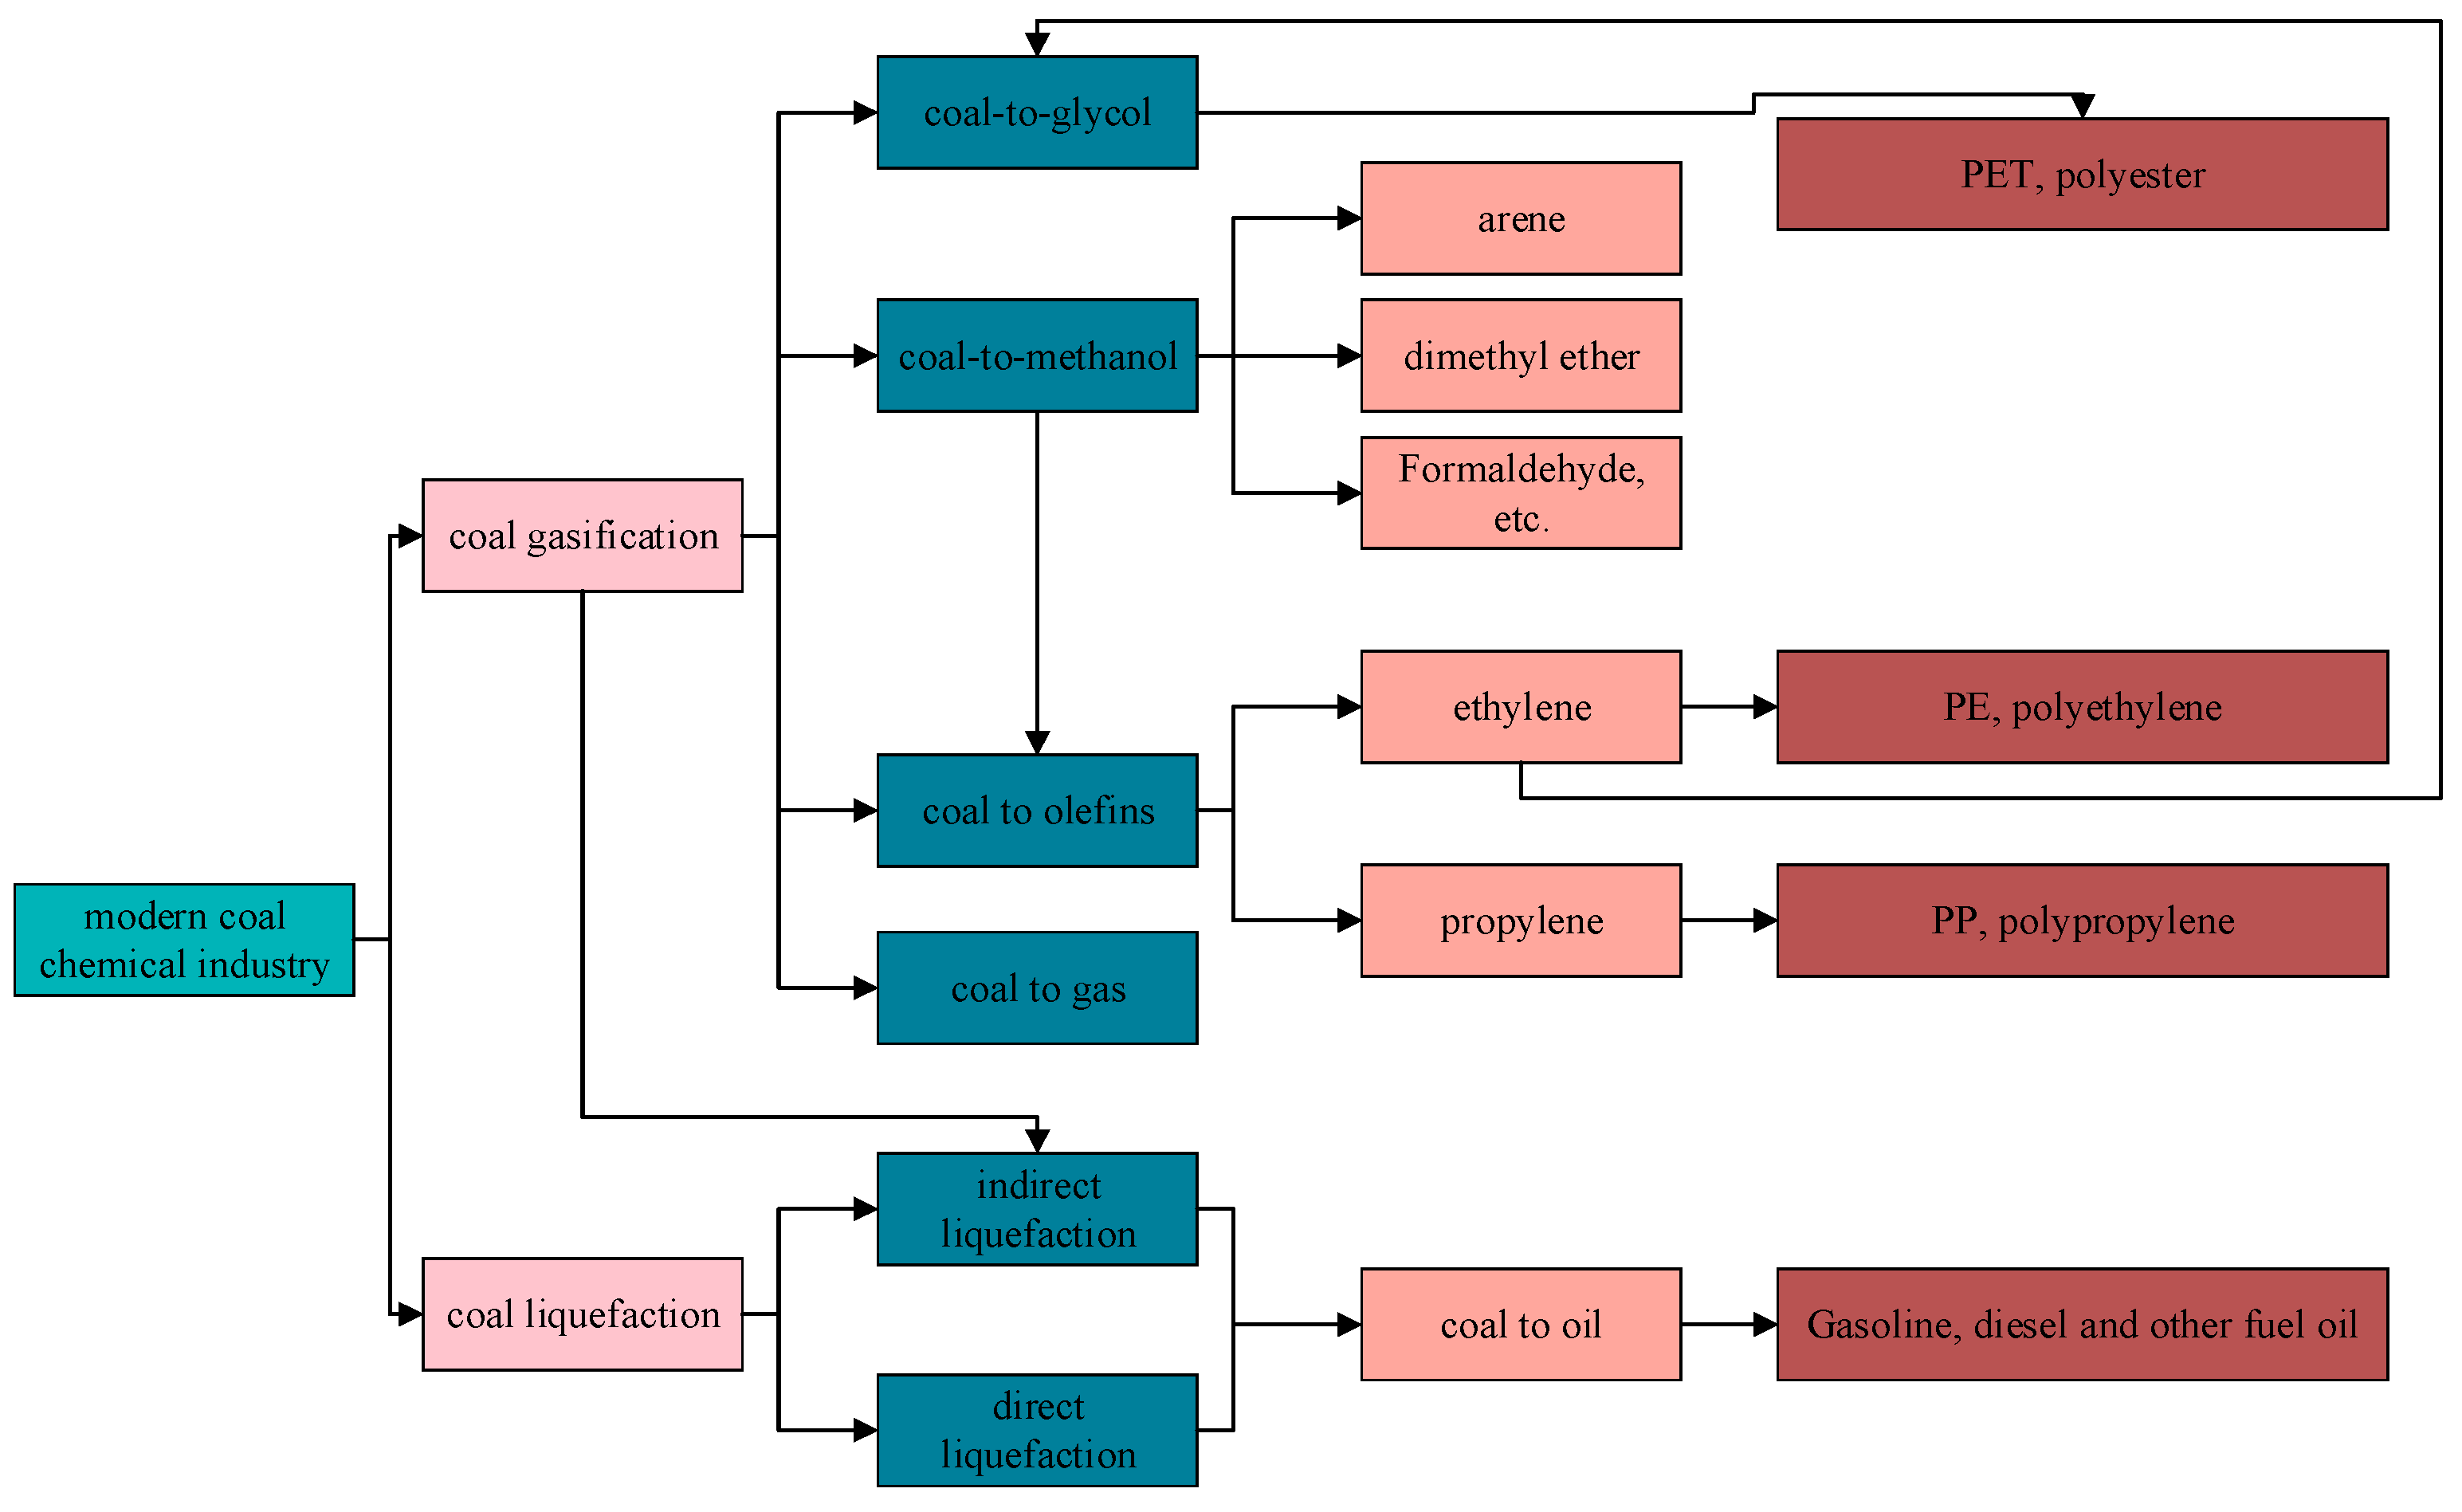
2.1. Coal-to-Olefin Industrial Chain Composition
2.2. Coal-to-Olefin Value Chain and Accounting Method
2.3. Olefin Value Chain Accounting
3. Methods
3.1. System Dynamics Methods
3.2. SD Model Analysis Framework from the Value Chain Perspective
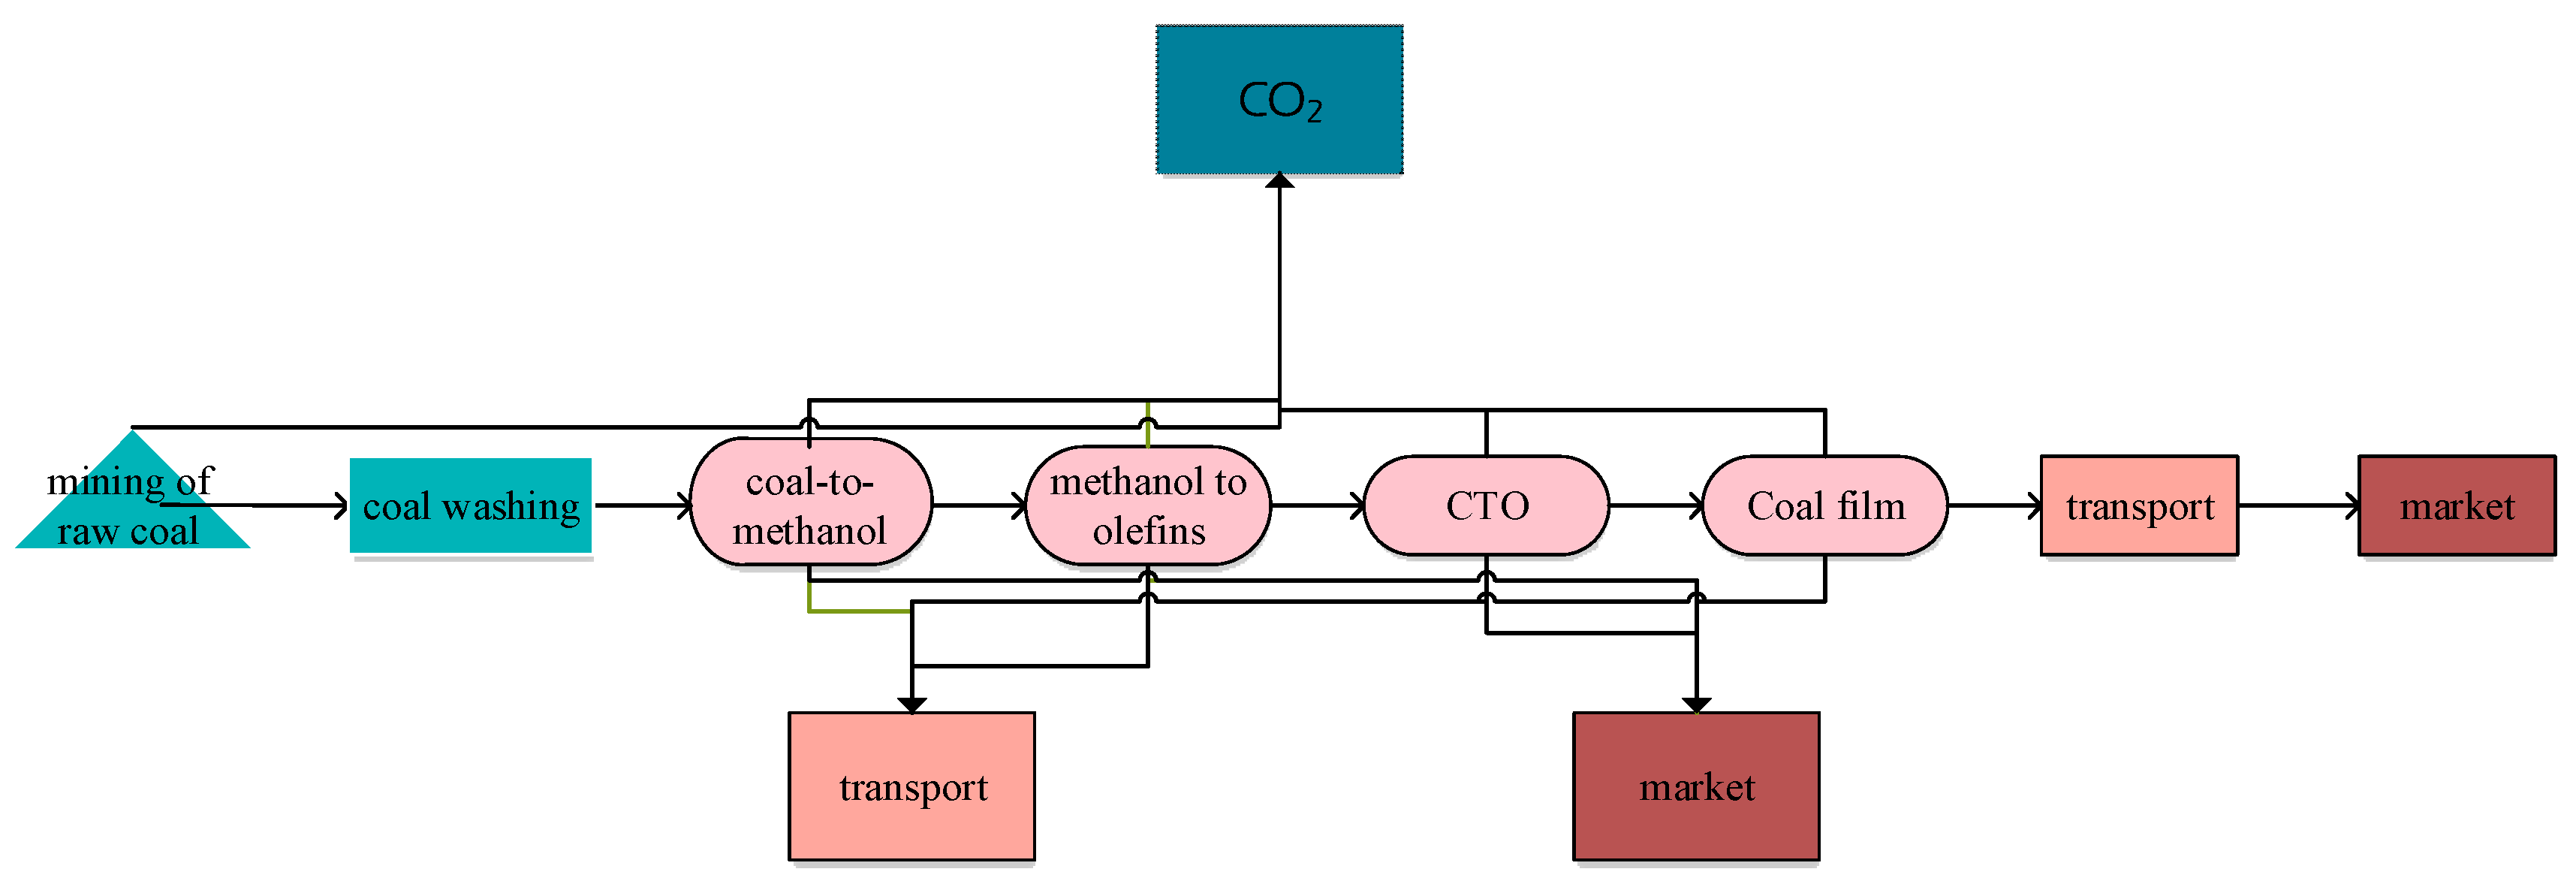
3.3. System Boundary
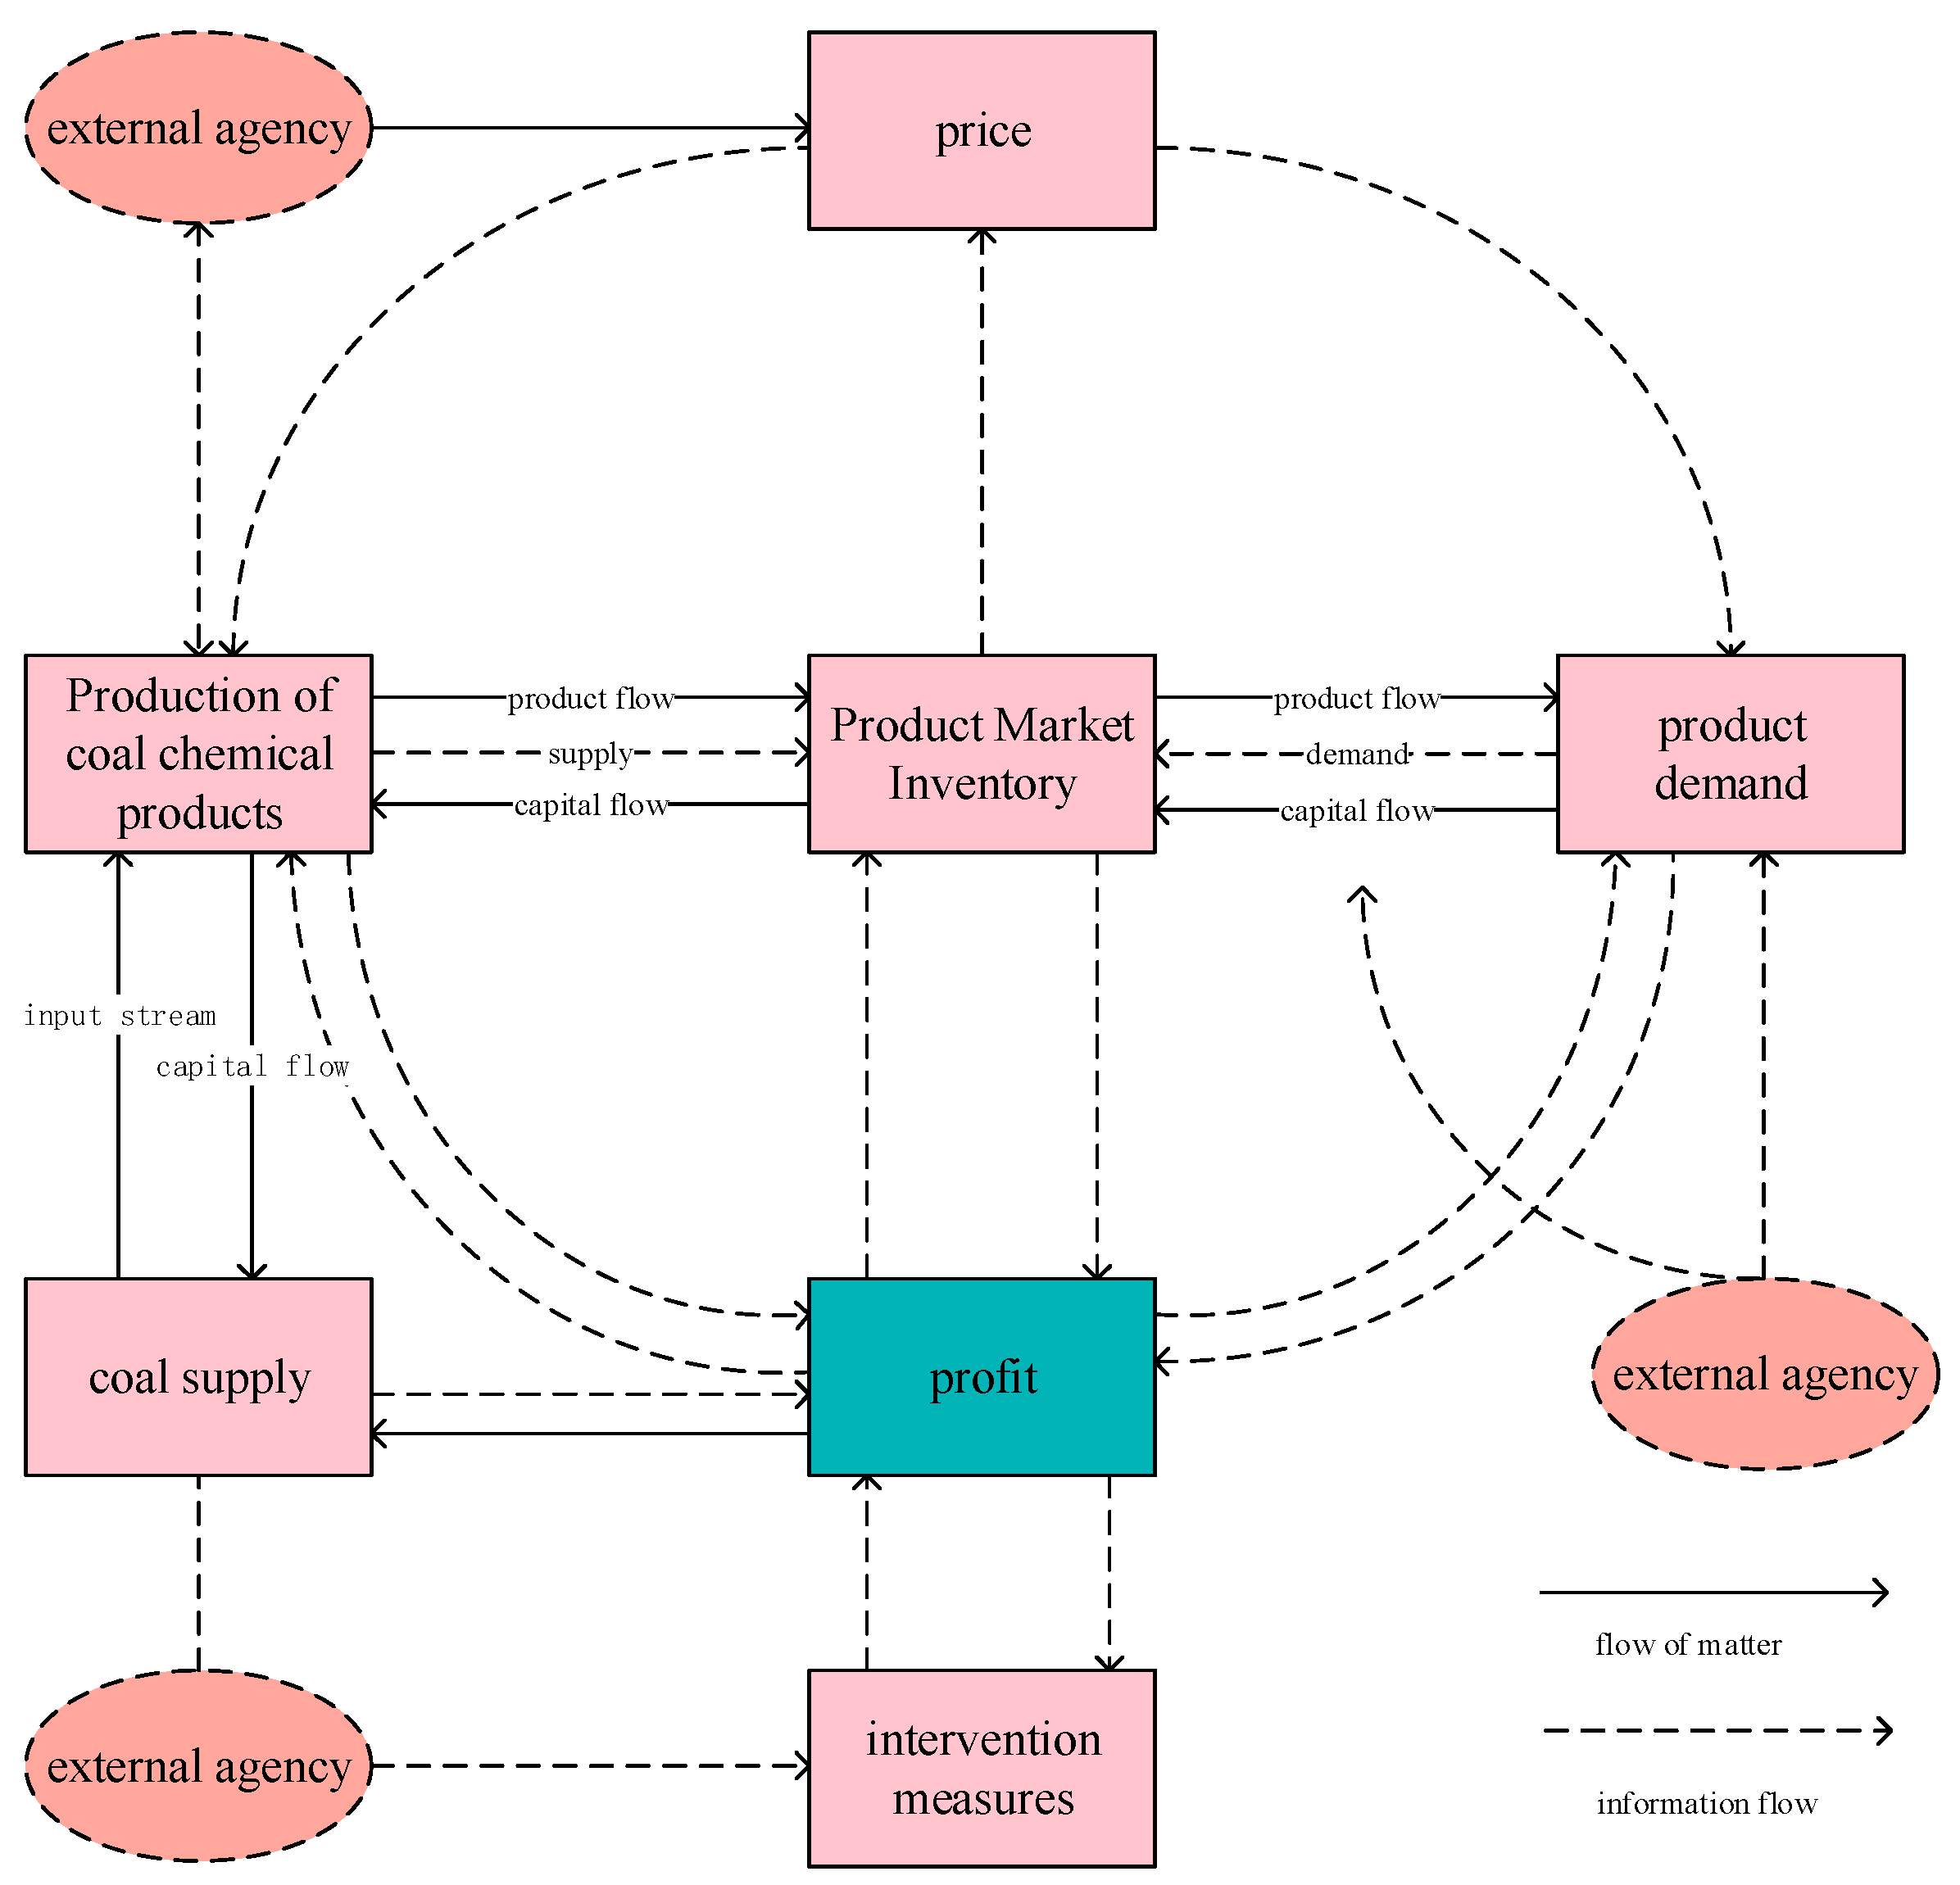
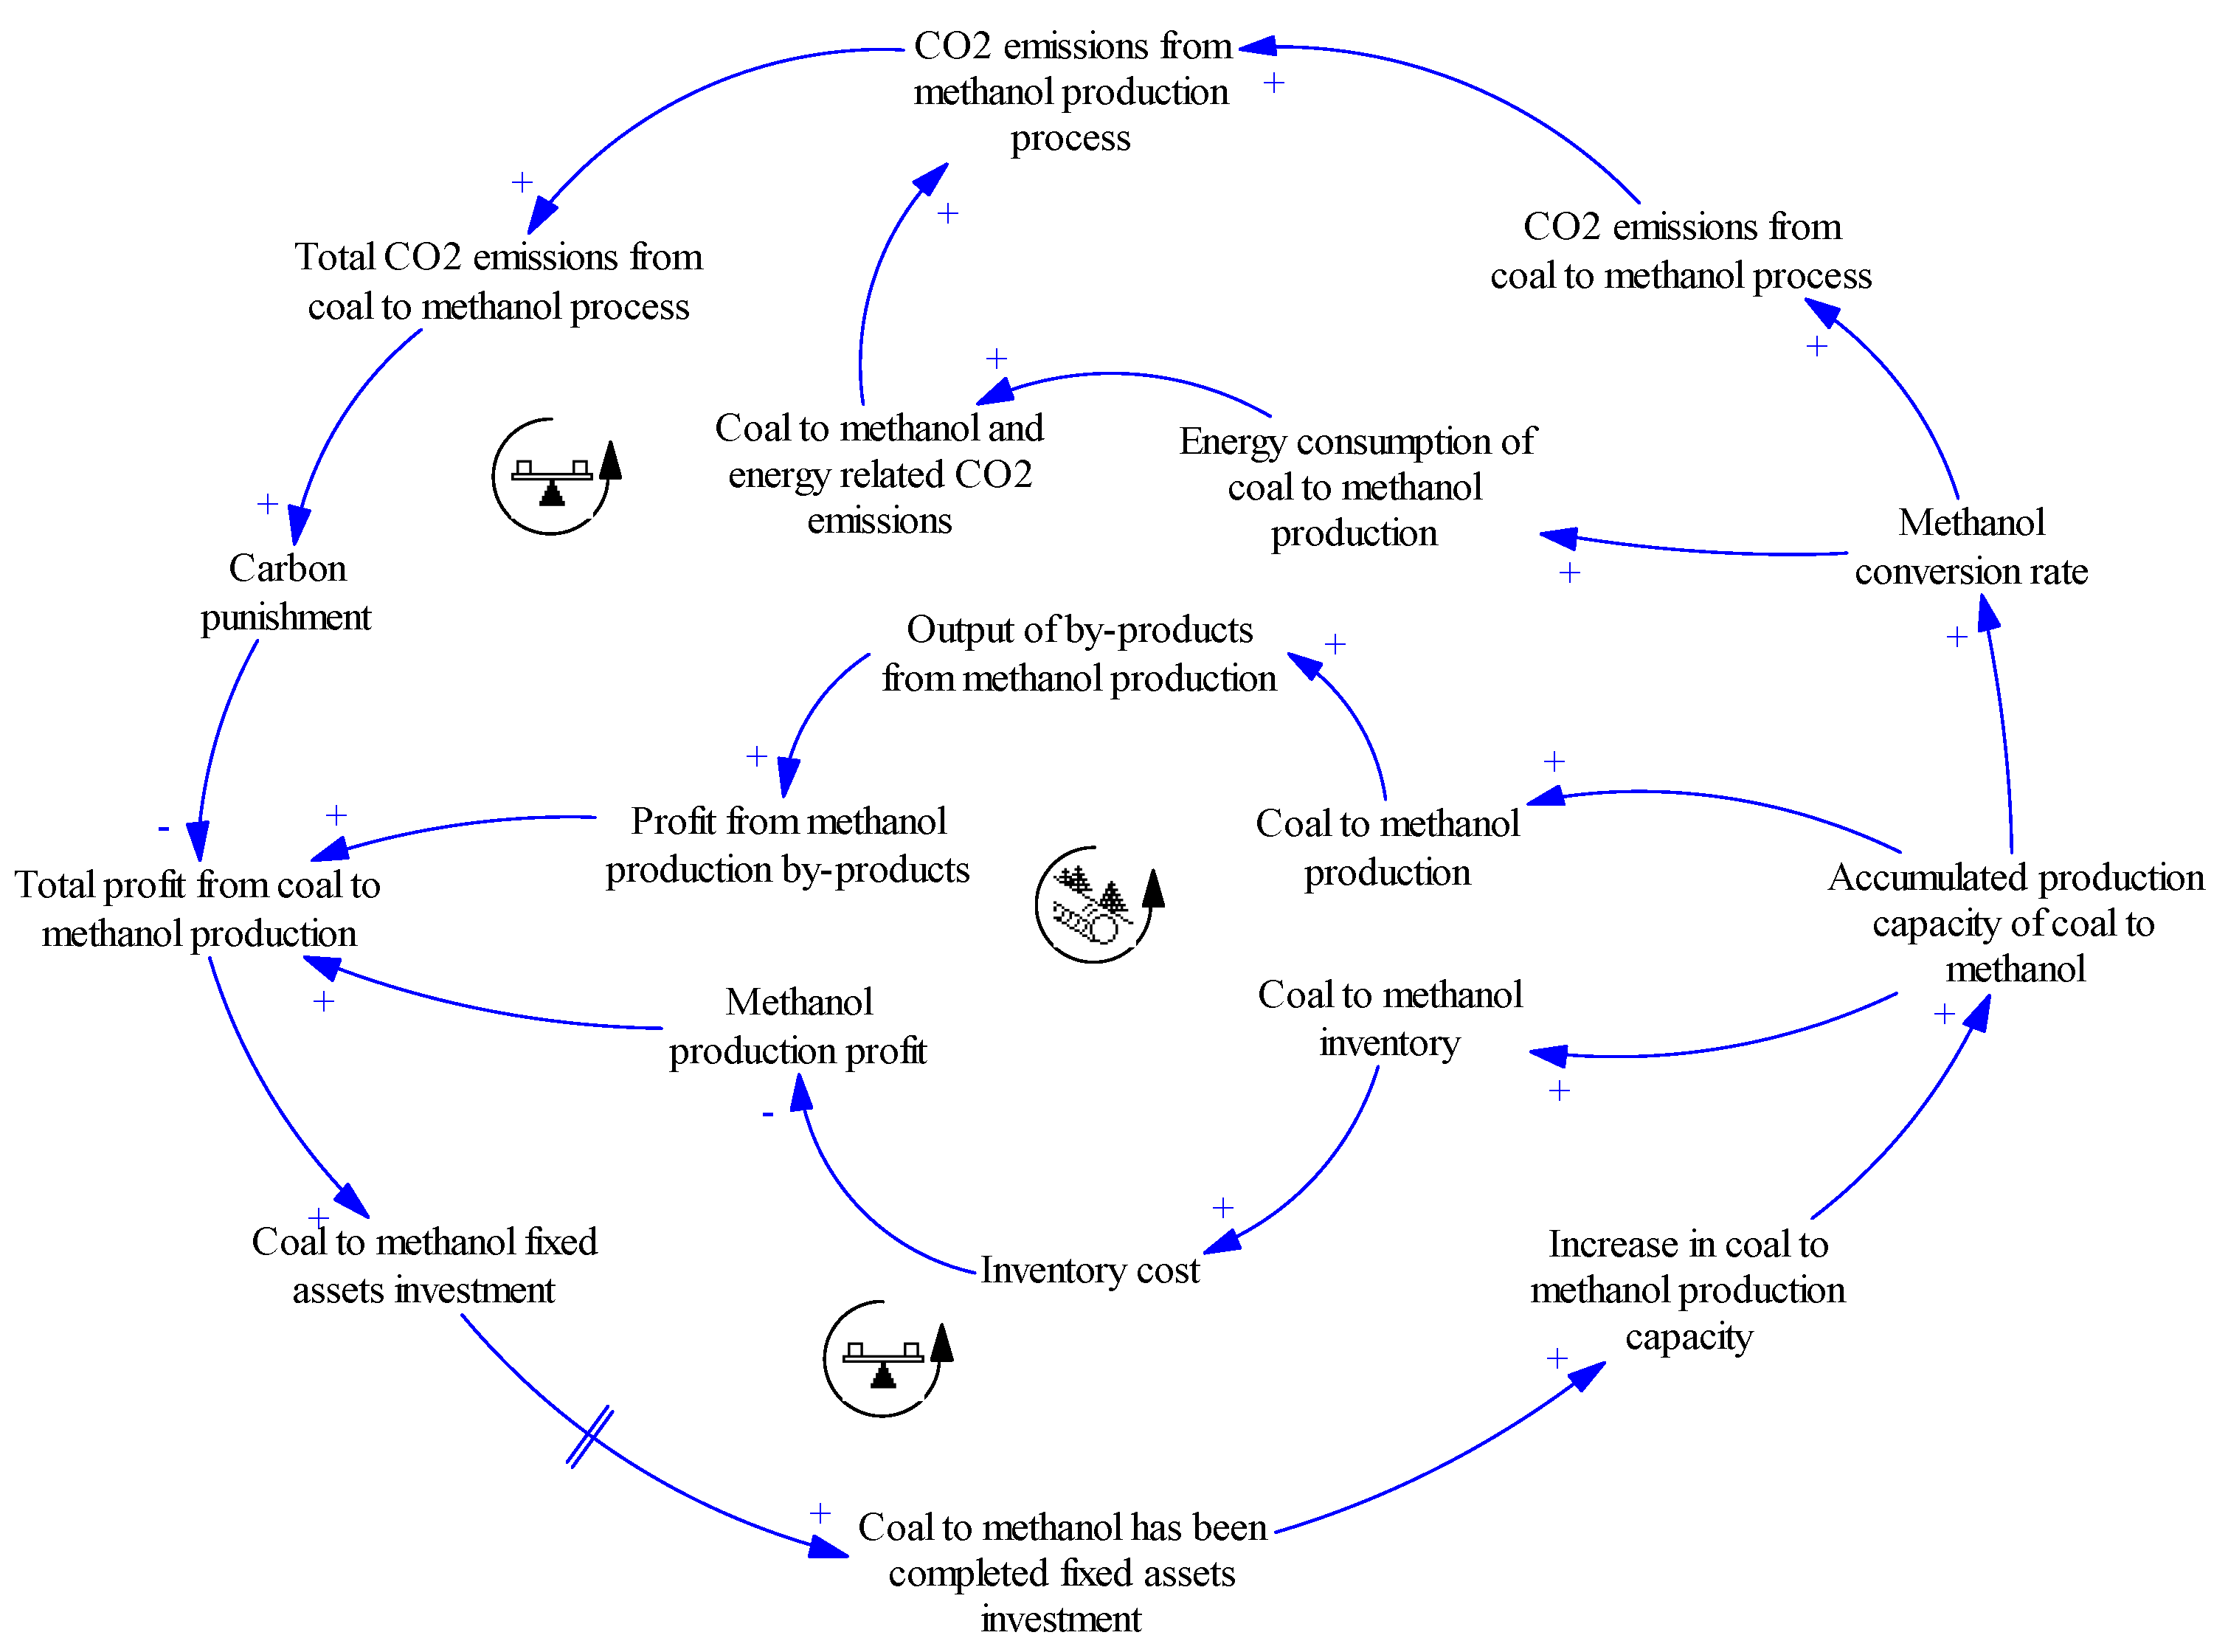
3.4. Causal Circuit Diagram and Main Feedback
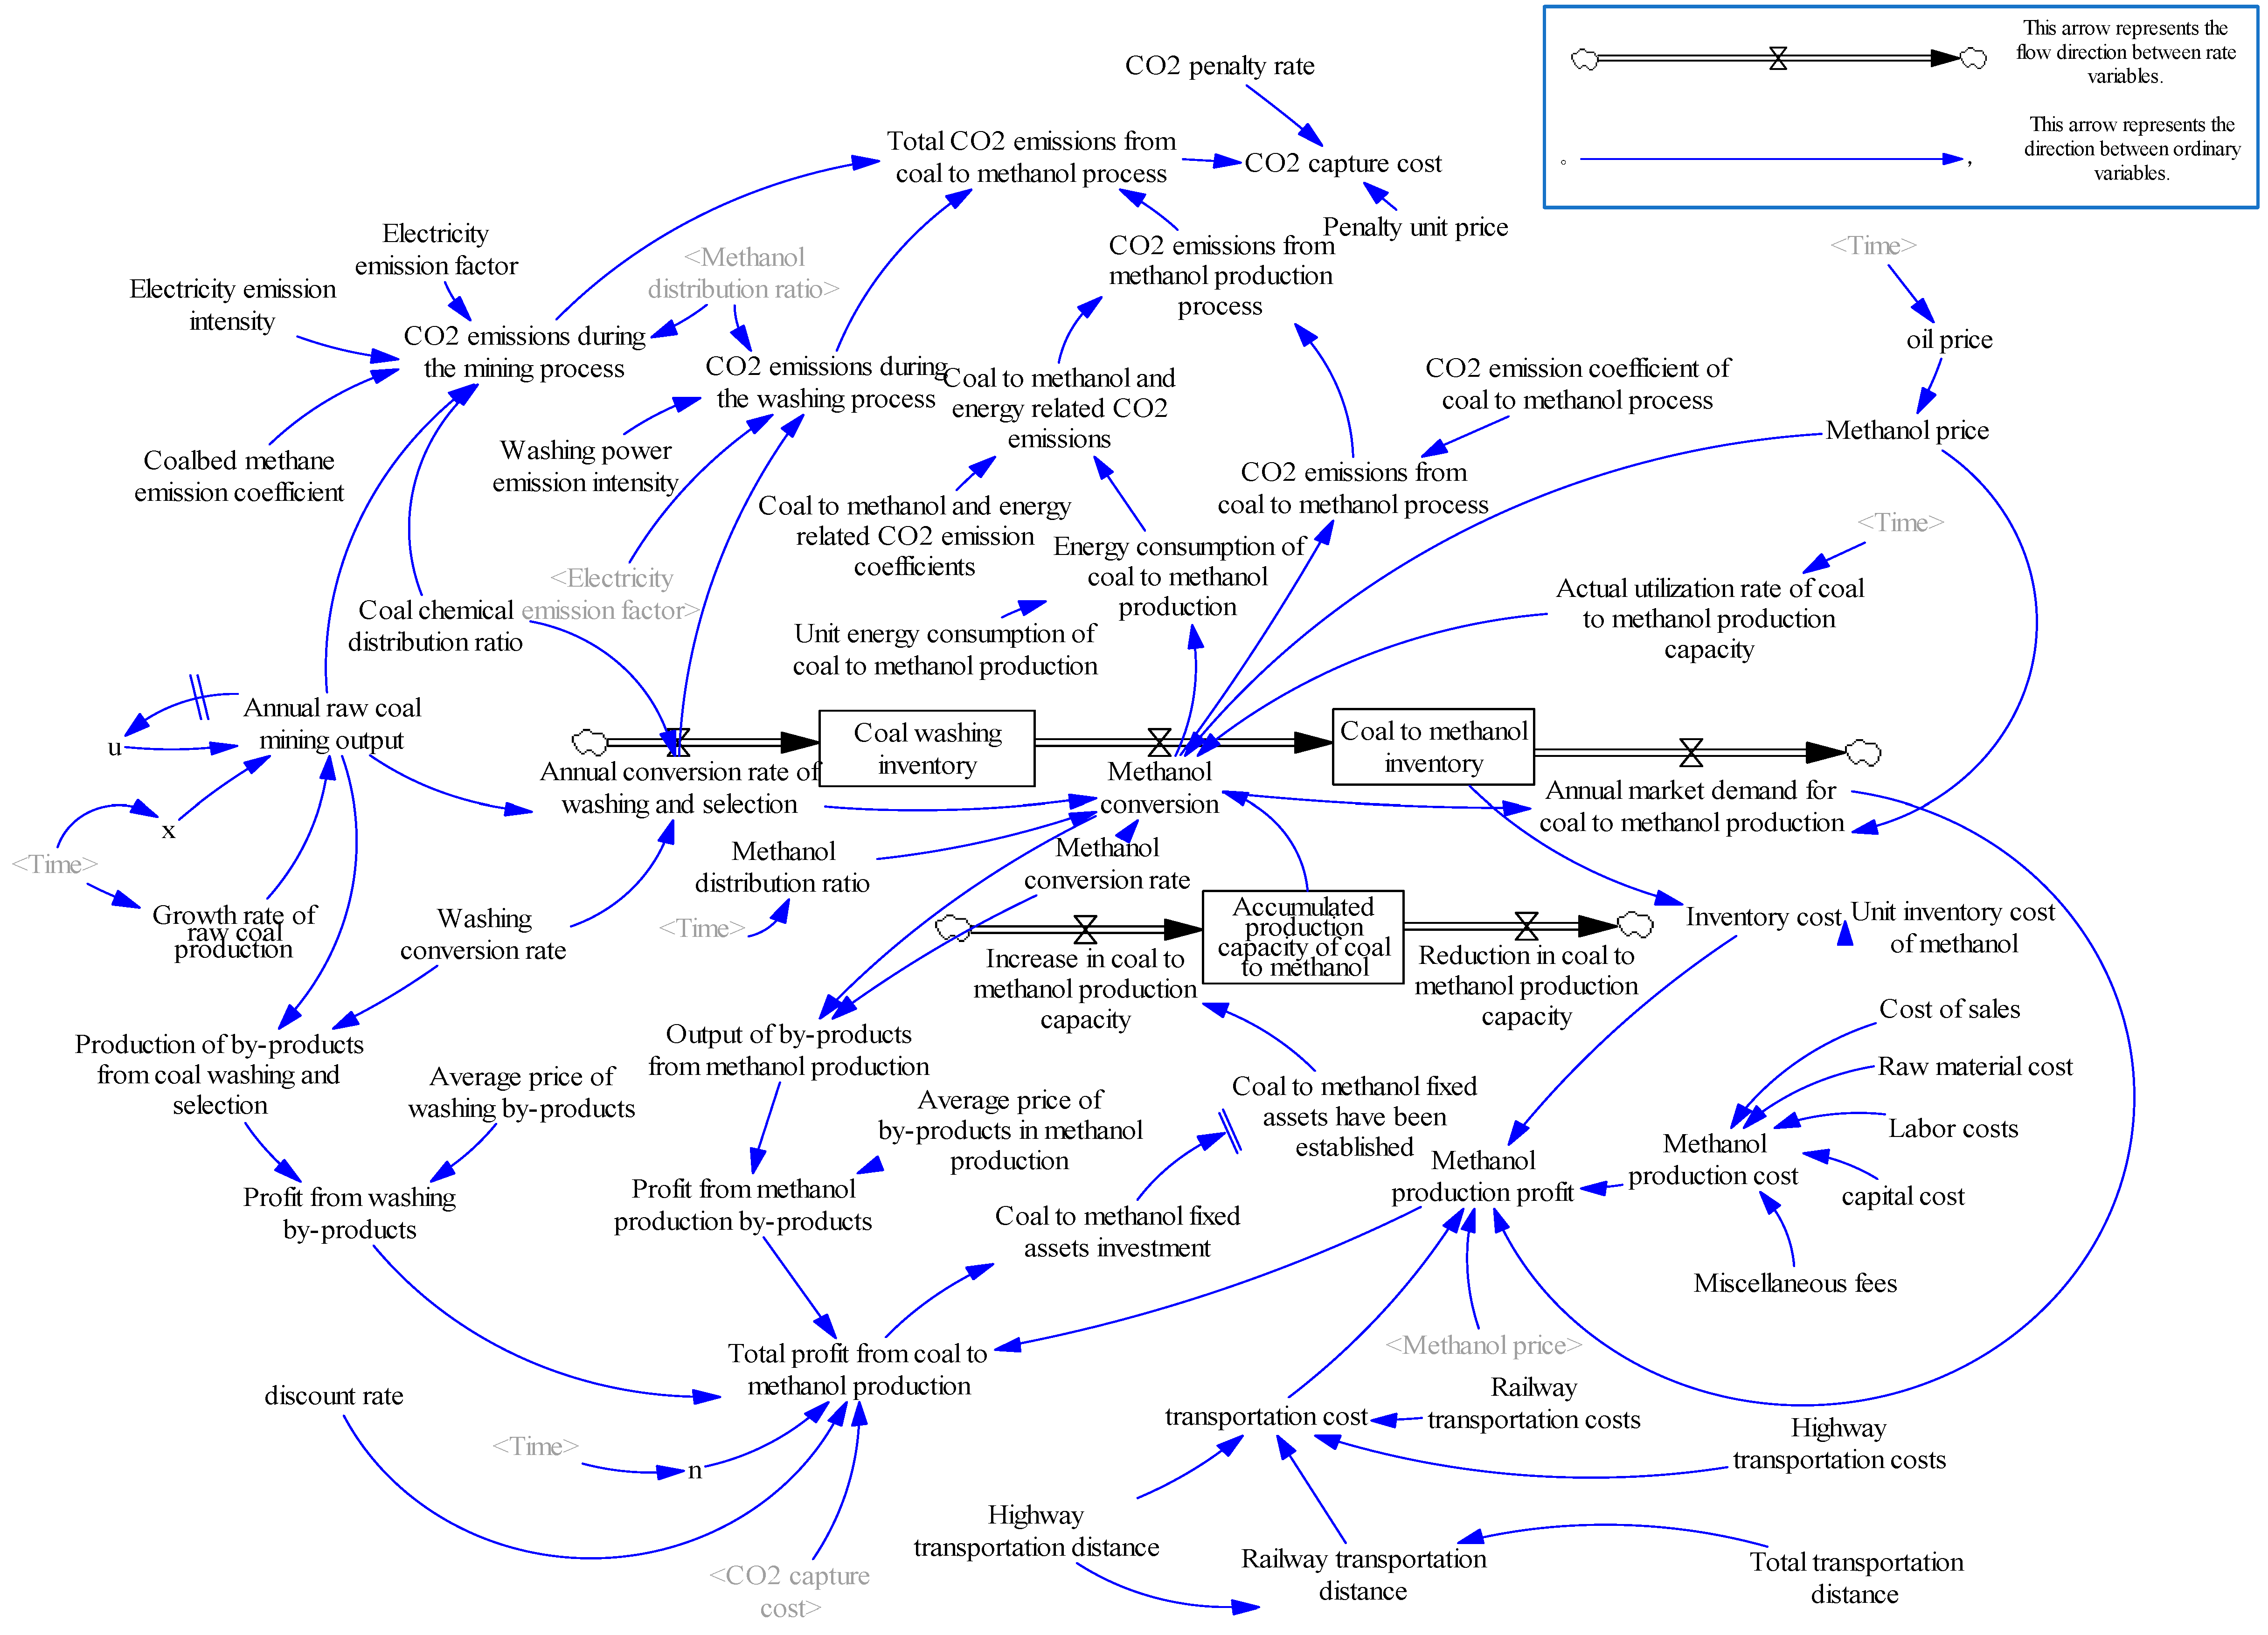
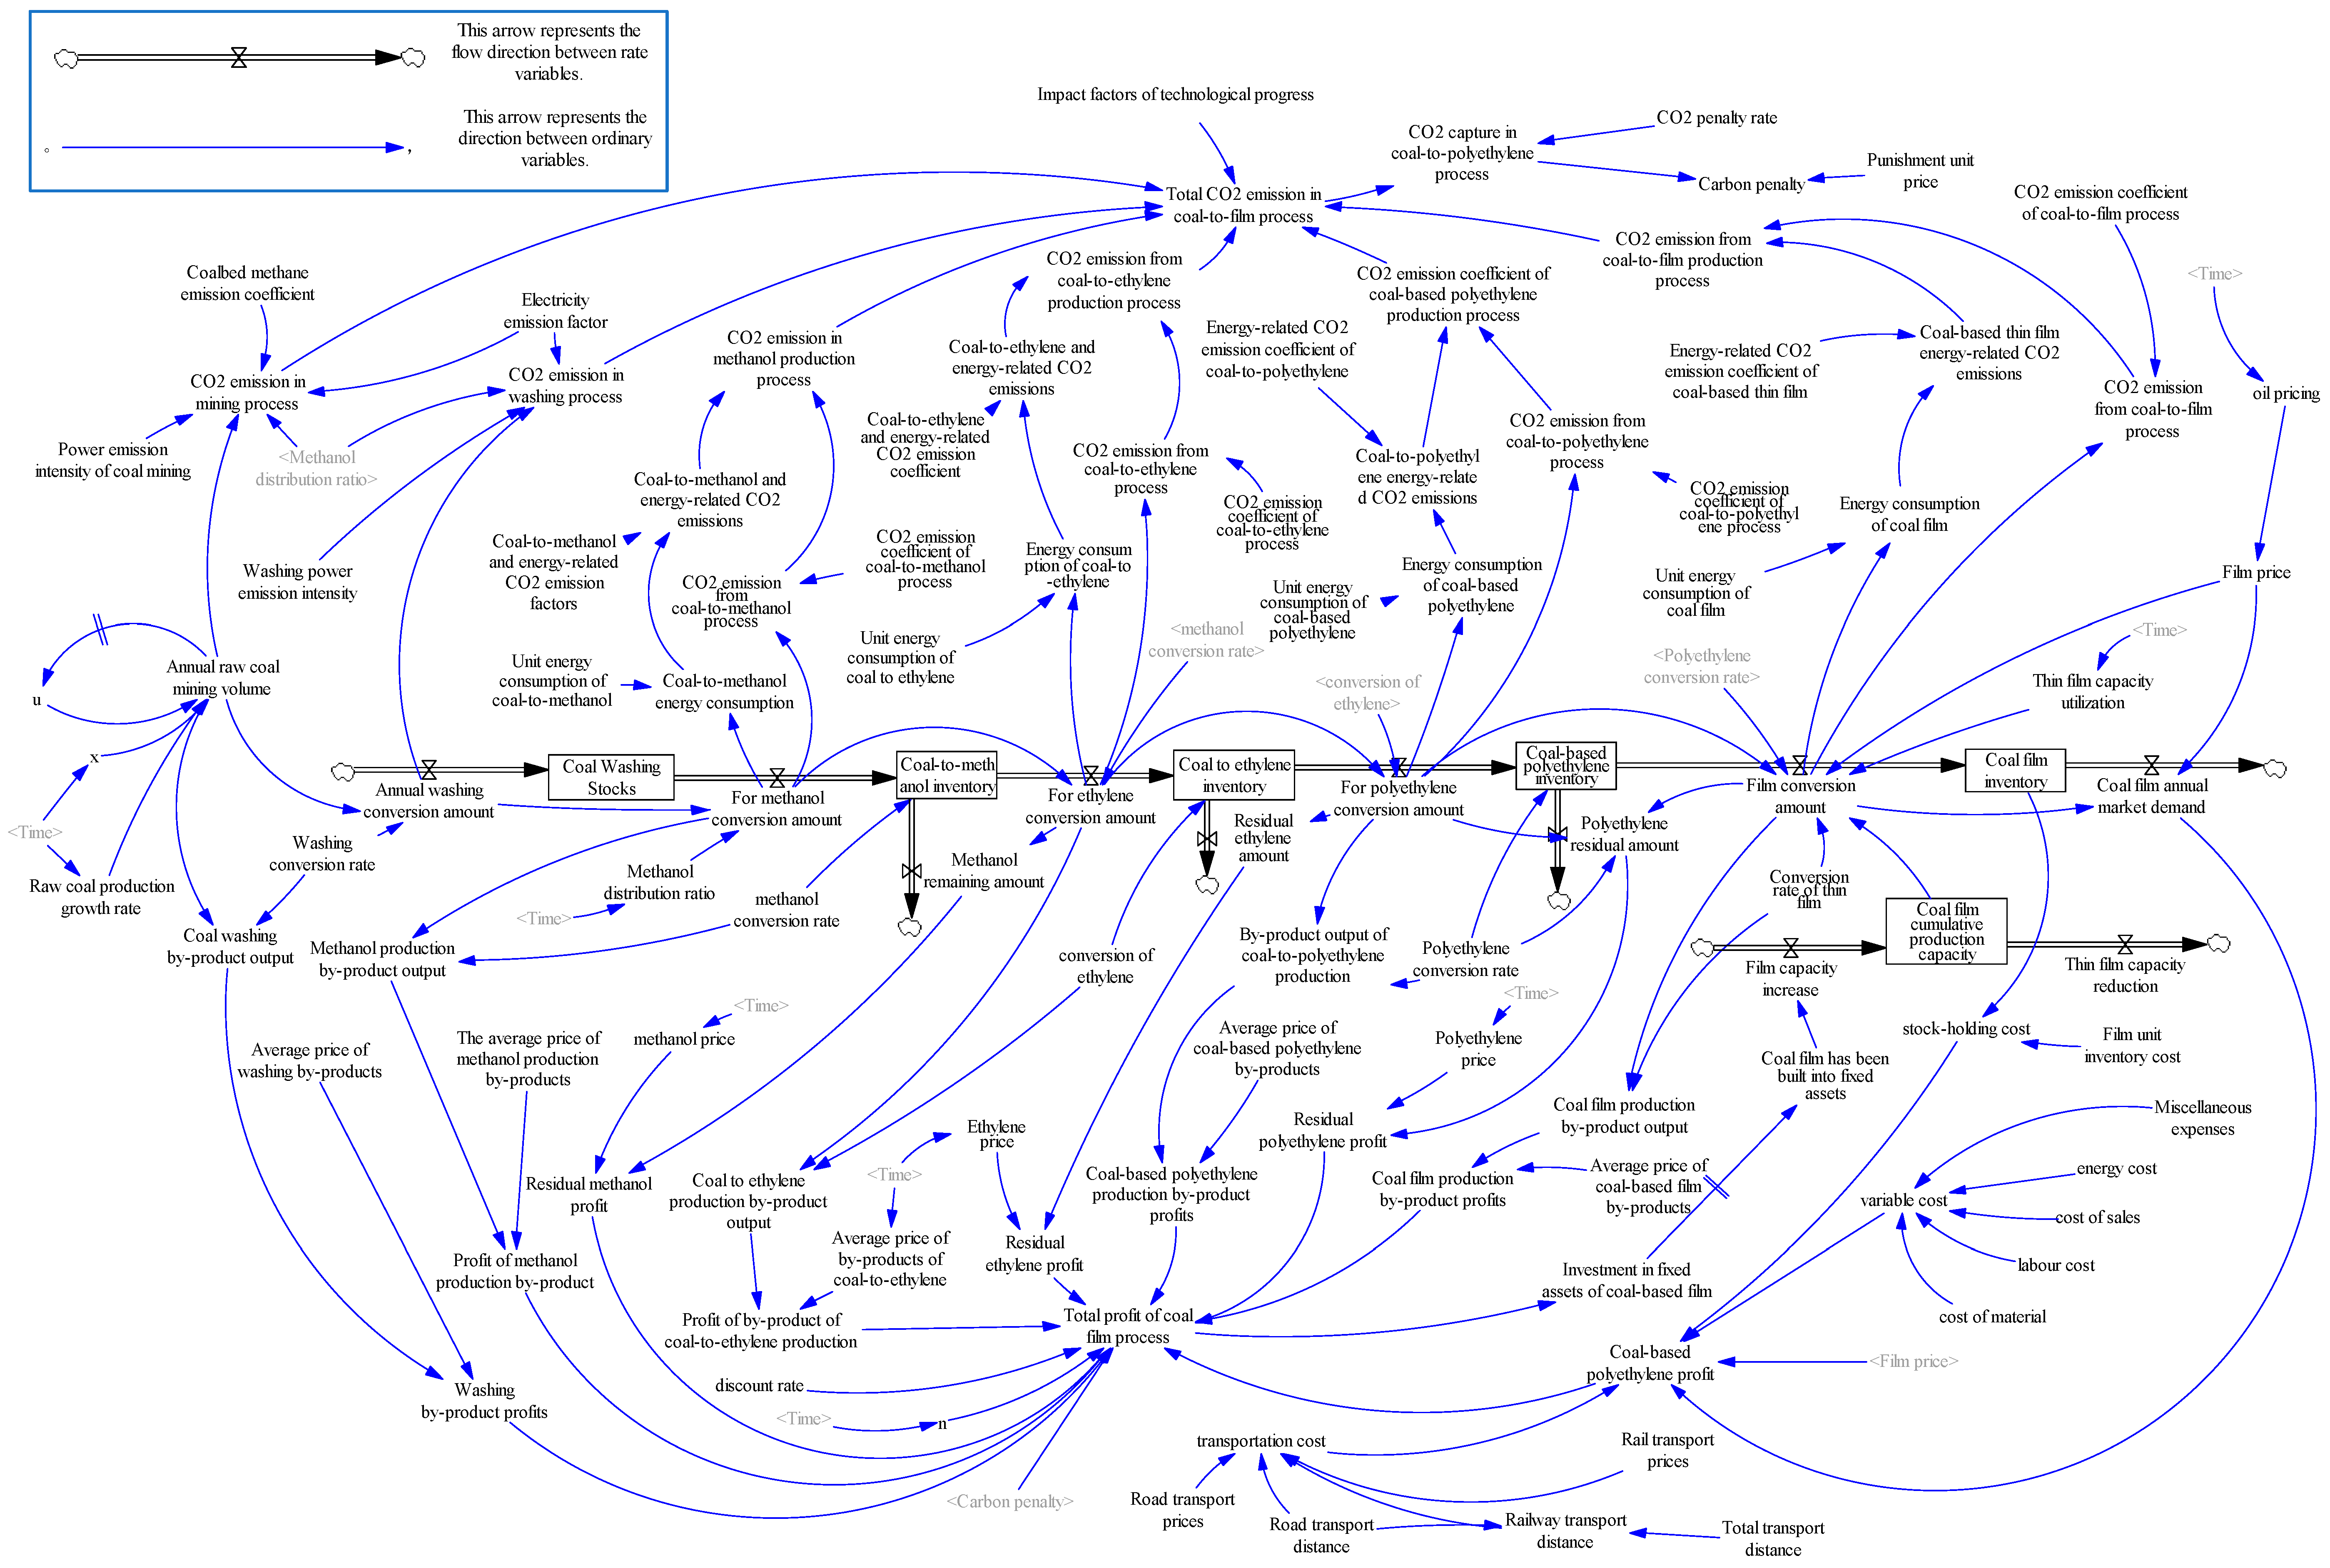
3.5. Stock and Flow Diagram and Main Equation Setting
- (1)
- u = u = DELAY FIXED (annual amount of raw coal mining, 1, 1)
- (2)
- x = IF THEN ELSE (Time = 2011, 78,900, 1)
- (3)
- Total profit of methanol production = (methanol production profit + washing by-product profit + methanol production by-product profit-CO2 capture integration cost)/(1 + POWER (discount rate, n))
- (4)
- The total CO2 emission of the coal-to-methanol production process = CO2 emission of the mining process + CO2 emission of the washing process + CO2 emission of the methanol production process
- (5)
- Methanol conversion amount = 0.333 × (methanol allocation ratio × 0.365 × annual washing conversion amount × methanol conversion rate + actual utilization rate of coal-to-methanol capacity × cumulative capacity of coal-to-methanol + (0.290435 × methanol price − 163.882))
- (6)
- Coal-to-methanol production CO2 emissions = (coal-to-methanol and energy-related CO2 emissions + coal-to-methanol process CO2 emissions) × technical progress impact factor
- (7)
- Coal-to-methanol and energy-related CO2 emissions = coal-to-methanol energy consumption × coal-to-methanol and energy-related CO2 emission coefficient
- (8)
- CO2 emission of coal-to-methanol process = methanol conversion × CO2 emission coefficient of coal-to-methanol process
- (9)
- Coal-to-methanol production by-product profit = methanol conversion × (1-methanol conversion)
- (10)
- Coal-to-methanol inventory = IF THEN ELSE (methanol conversion-annual market demand of coal-to-methanol ≥ 0, methanol conversion-annual market demand of coal-to-methanol, 0)
- (11)
- Coal-to-methanol fixed asset investment = IF THEN ELSE (total profit of coal-to-methanol ≤ 0, 0, 128.12 + 0.08 × total profit of coal-to-methanol)
- (12)
- Coal-to-methanol built fixed assets = DELAY FIXED (coal-to-methanol fixed assets investment, 2, 0)
- (13)
- Methanol production profit = annual market demand of coal-to-methanol × (methanol price-methanol production cost-transportation cost) − inventory cost
- (14)
- Methanol production cost = -STEP ((sales cost + capital cost + raw material cost + labor cost + miscellaneous expenses) × 0.1, 2023) -STEP ((sales cost + capital cost + raw material cost + labor cost + miscellaneous expenses) × 0.05, 2023)
- (15)
- Penalty unit price = STEP ((8 + RAMP (1, 2023, 2030)) × 7.314, 2023)
- (16)
- Coal chemical allocation ratio = 0.333 + RAMP (0.02, 2023, 2025) + RAMP (0.01, 2025, 2030).
3.6. Model Validation
3.7. Data Source
4. Scenario Design and Simulation Results Discussions
4.1. Scenario Design
4.2. Scenario Discussions
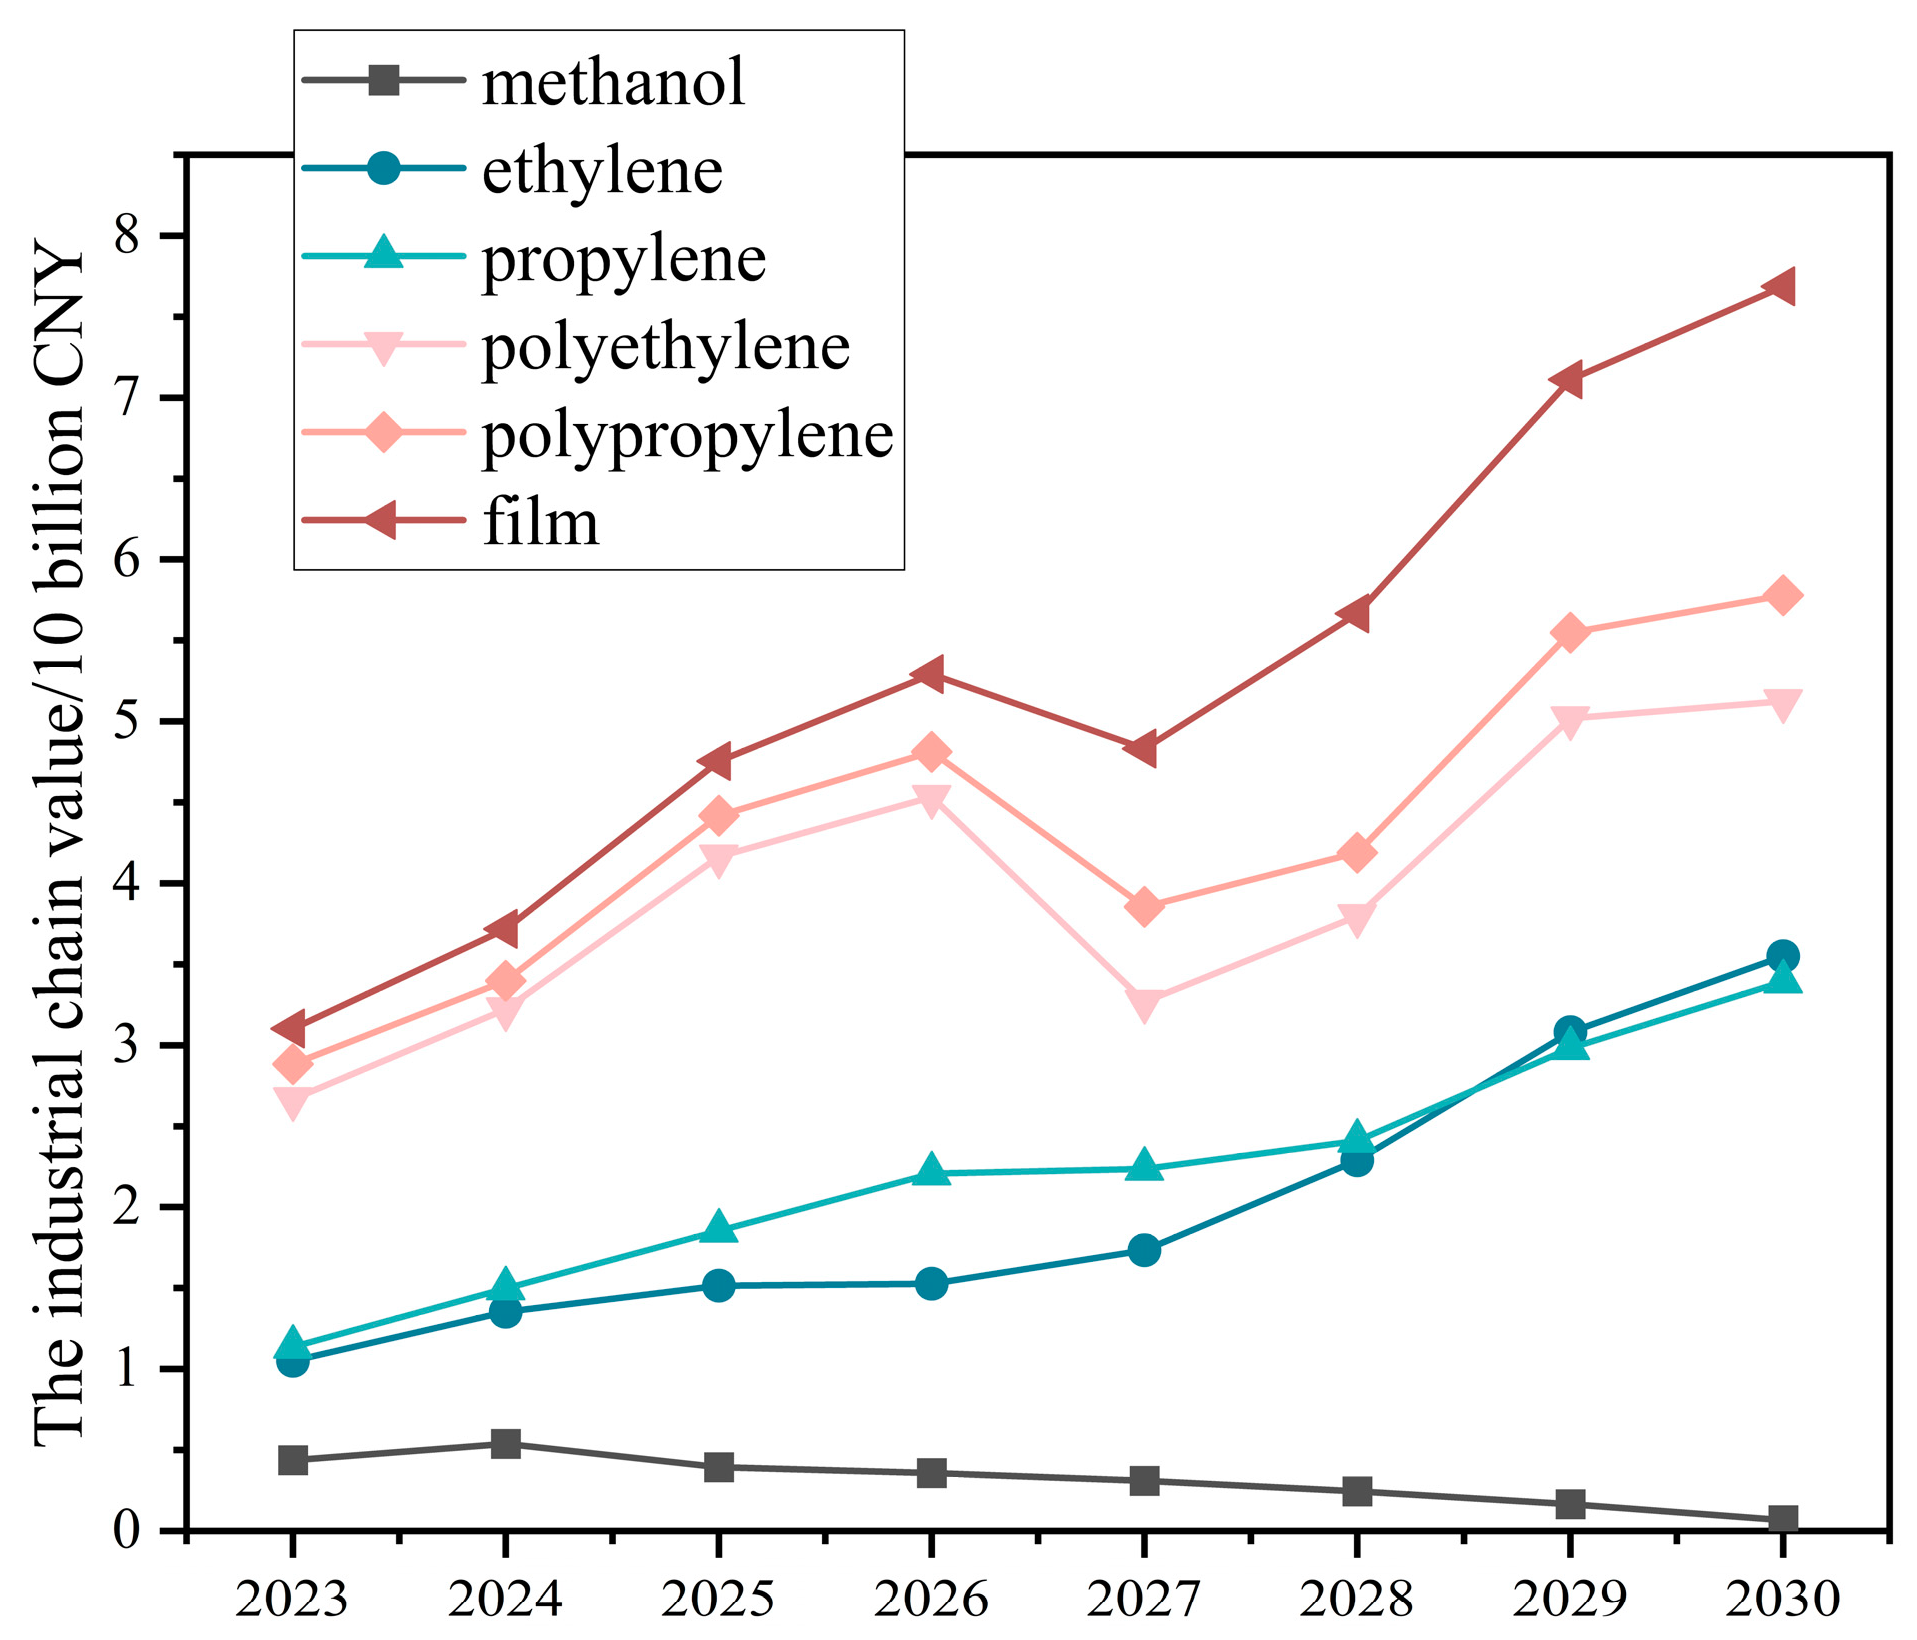
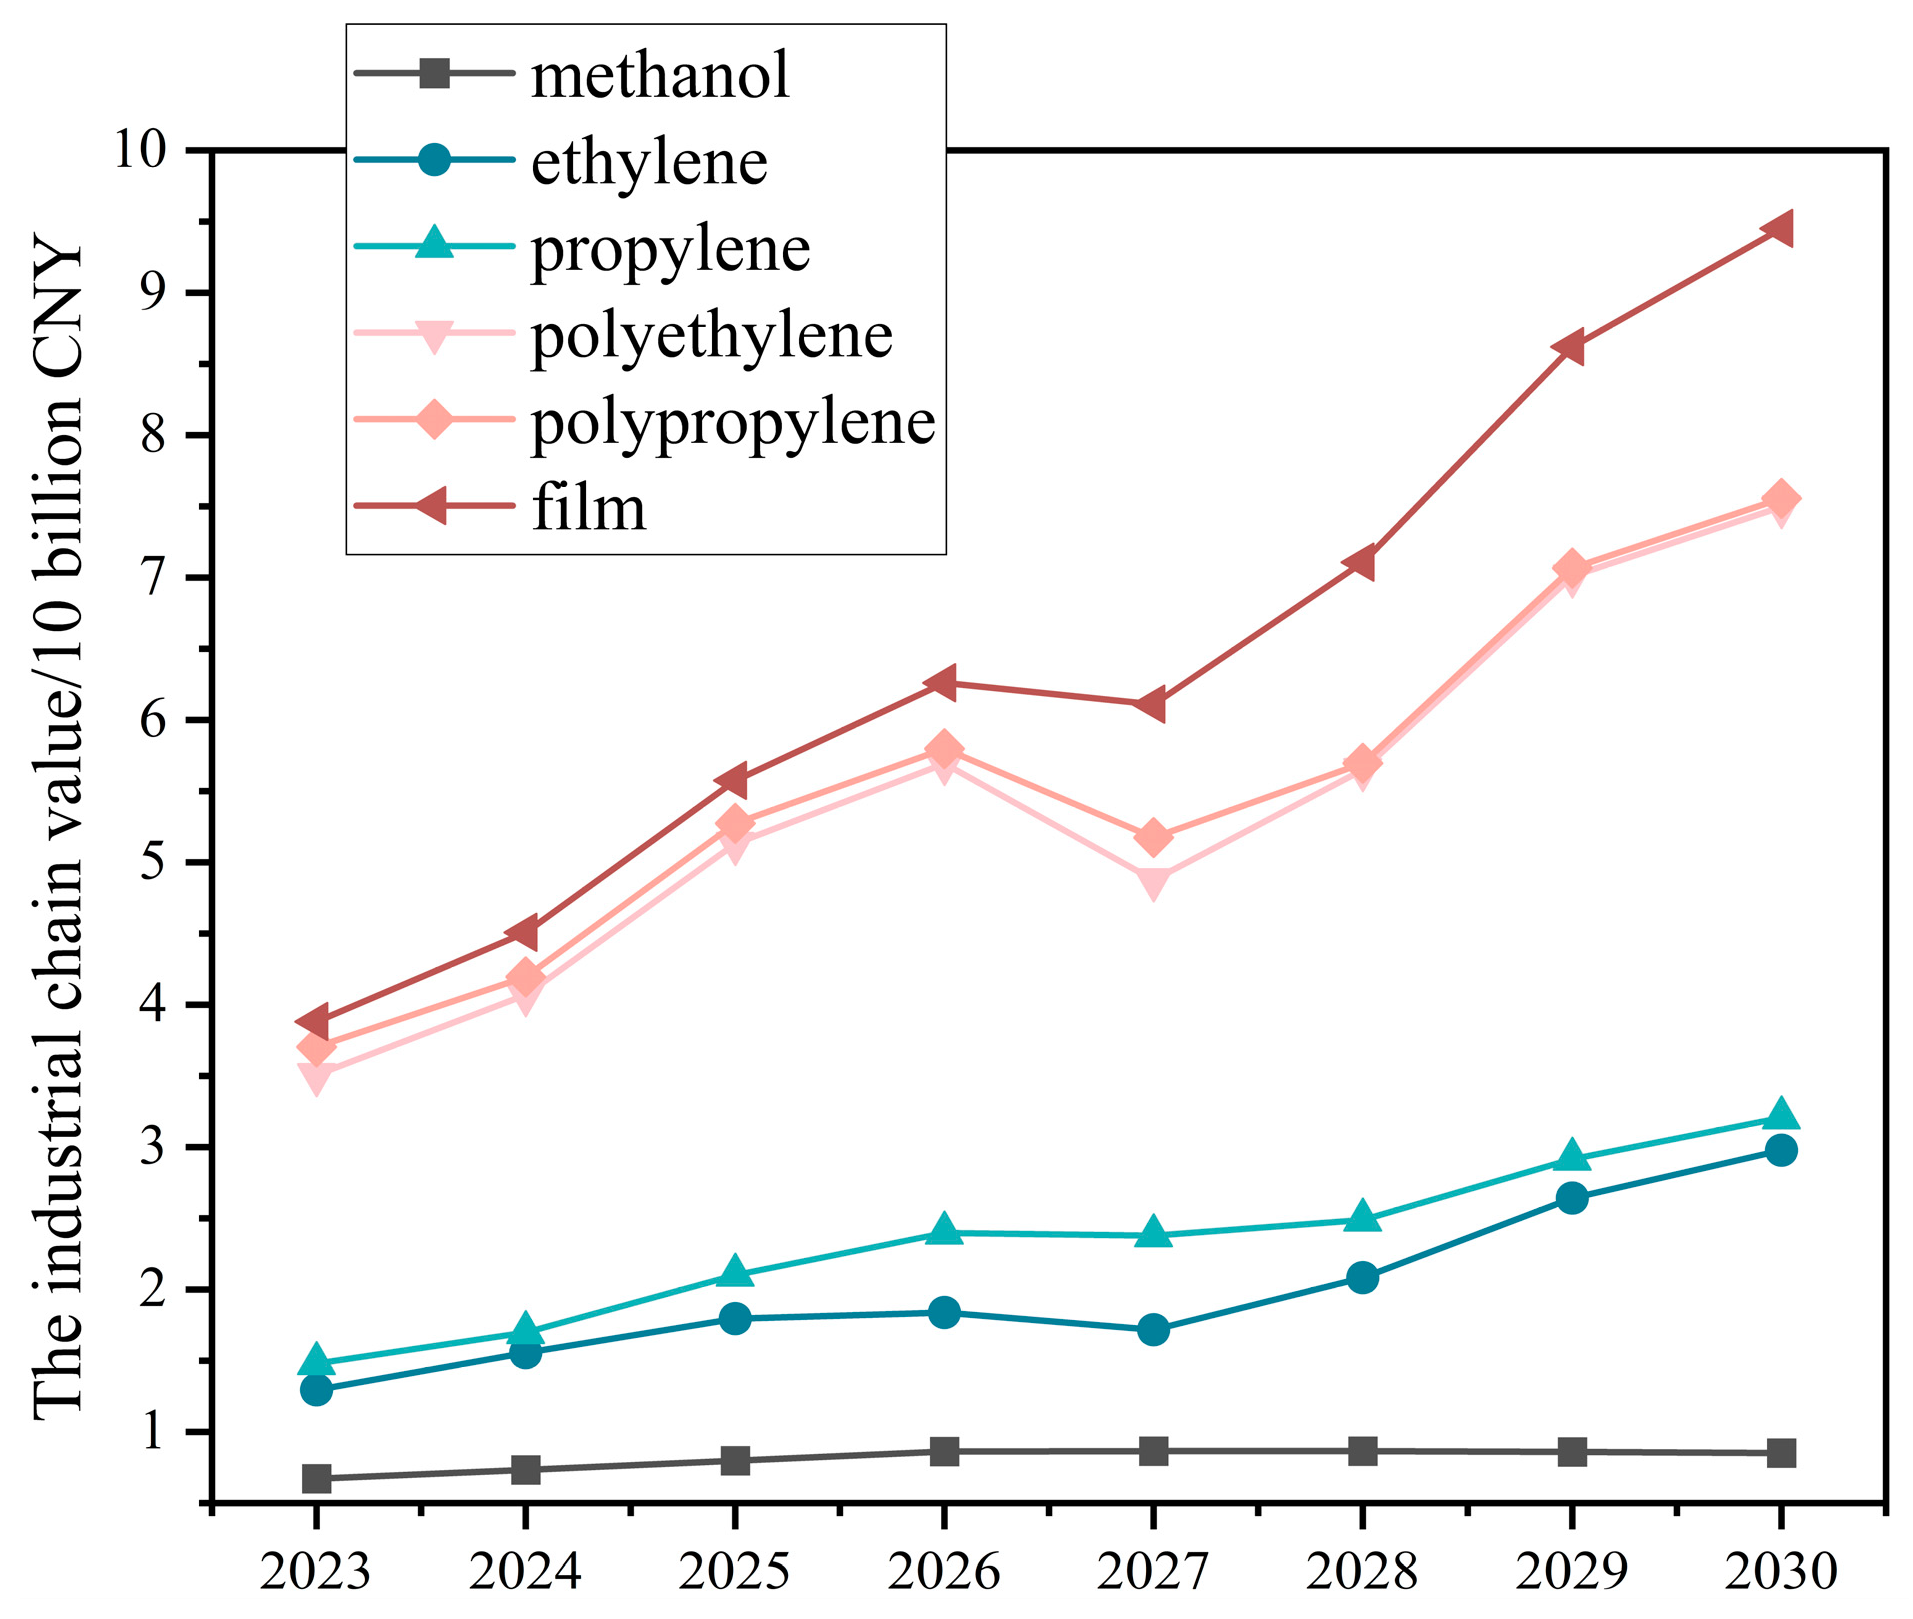
4.2.1. Coal-to-Olefin Industrial Chain Values in Each Expansion Direction
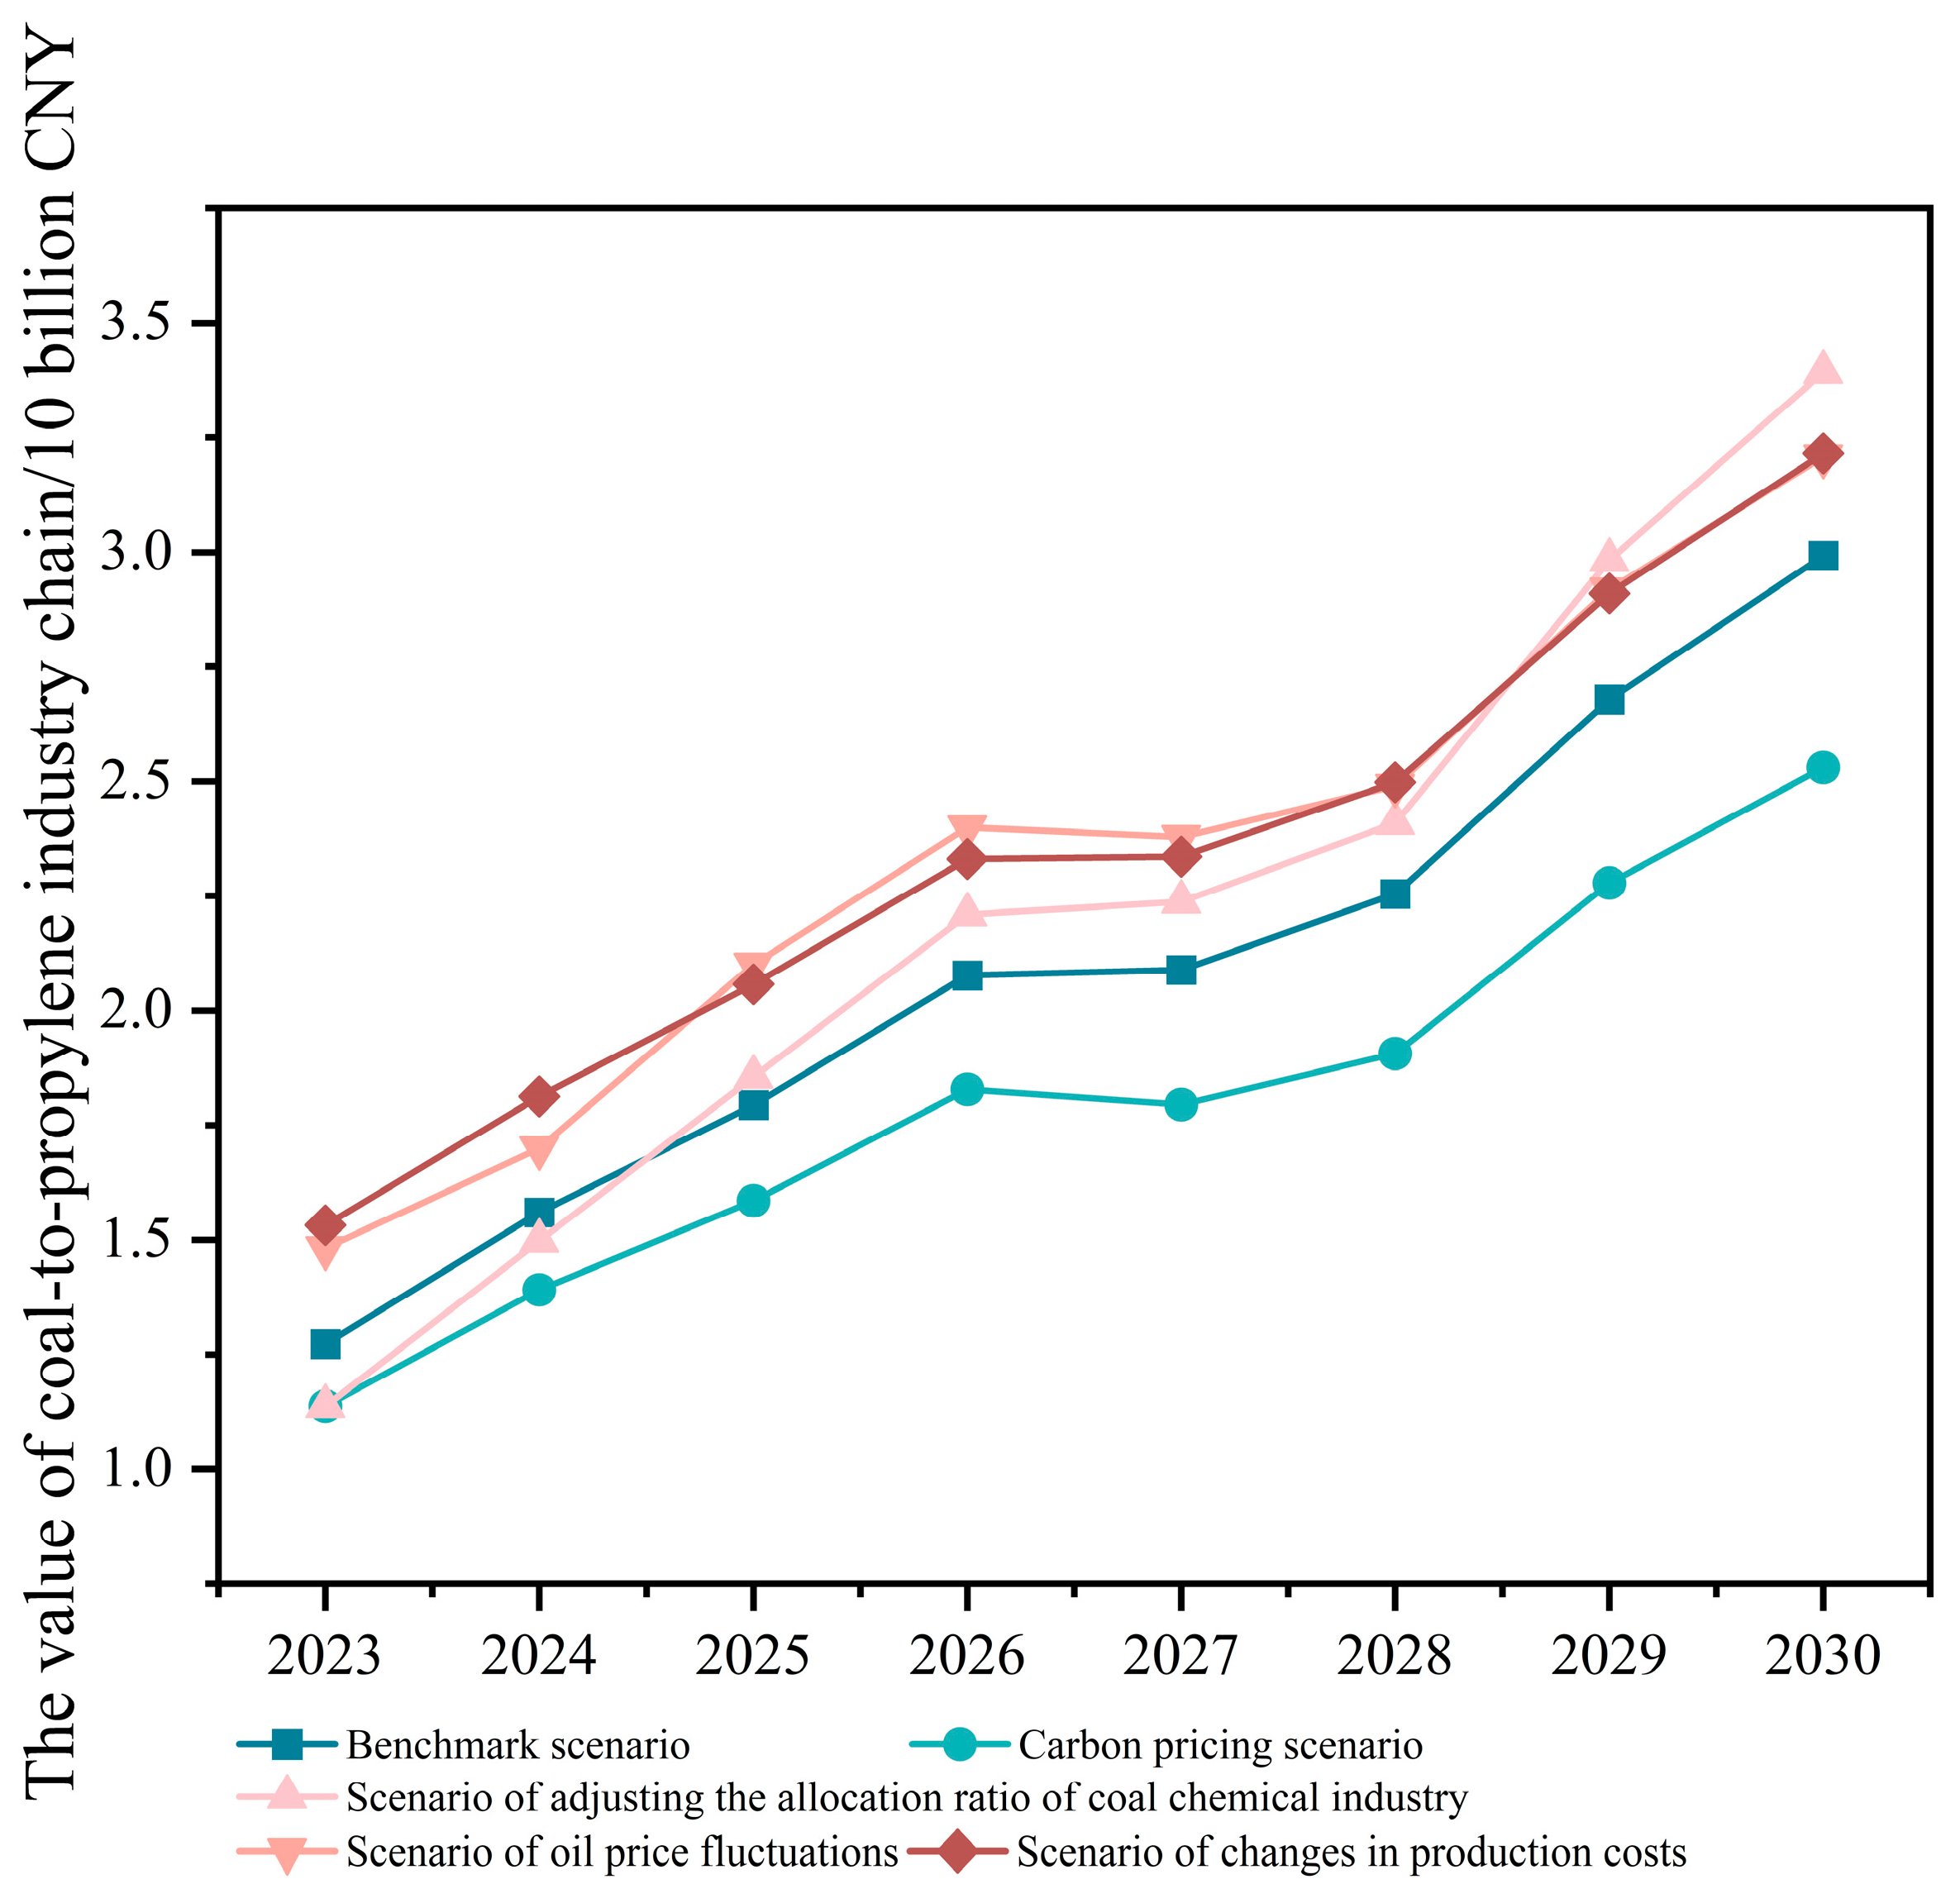
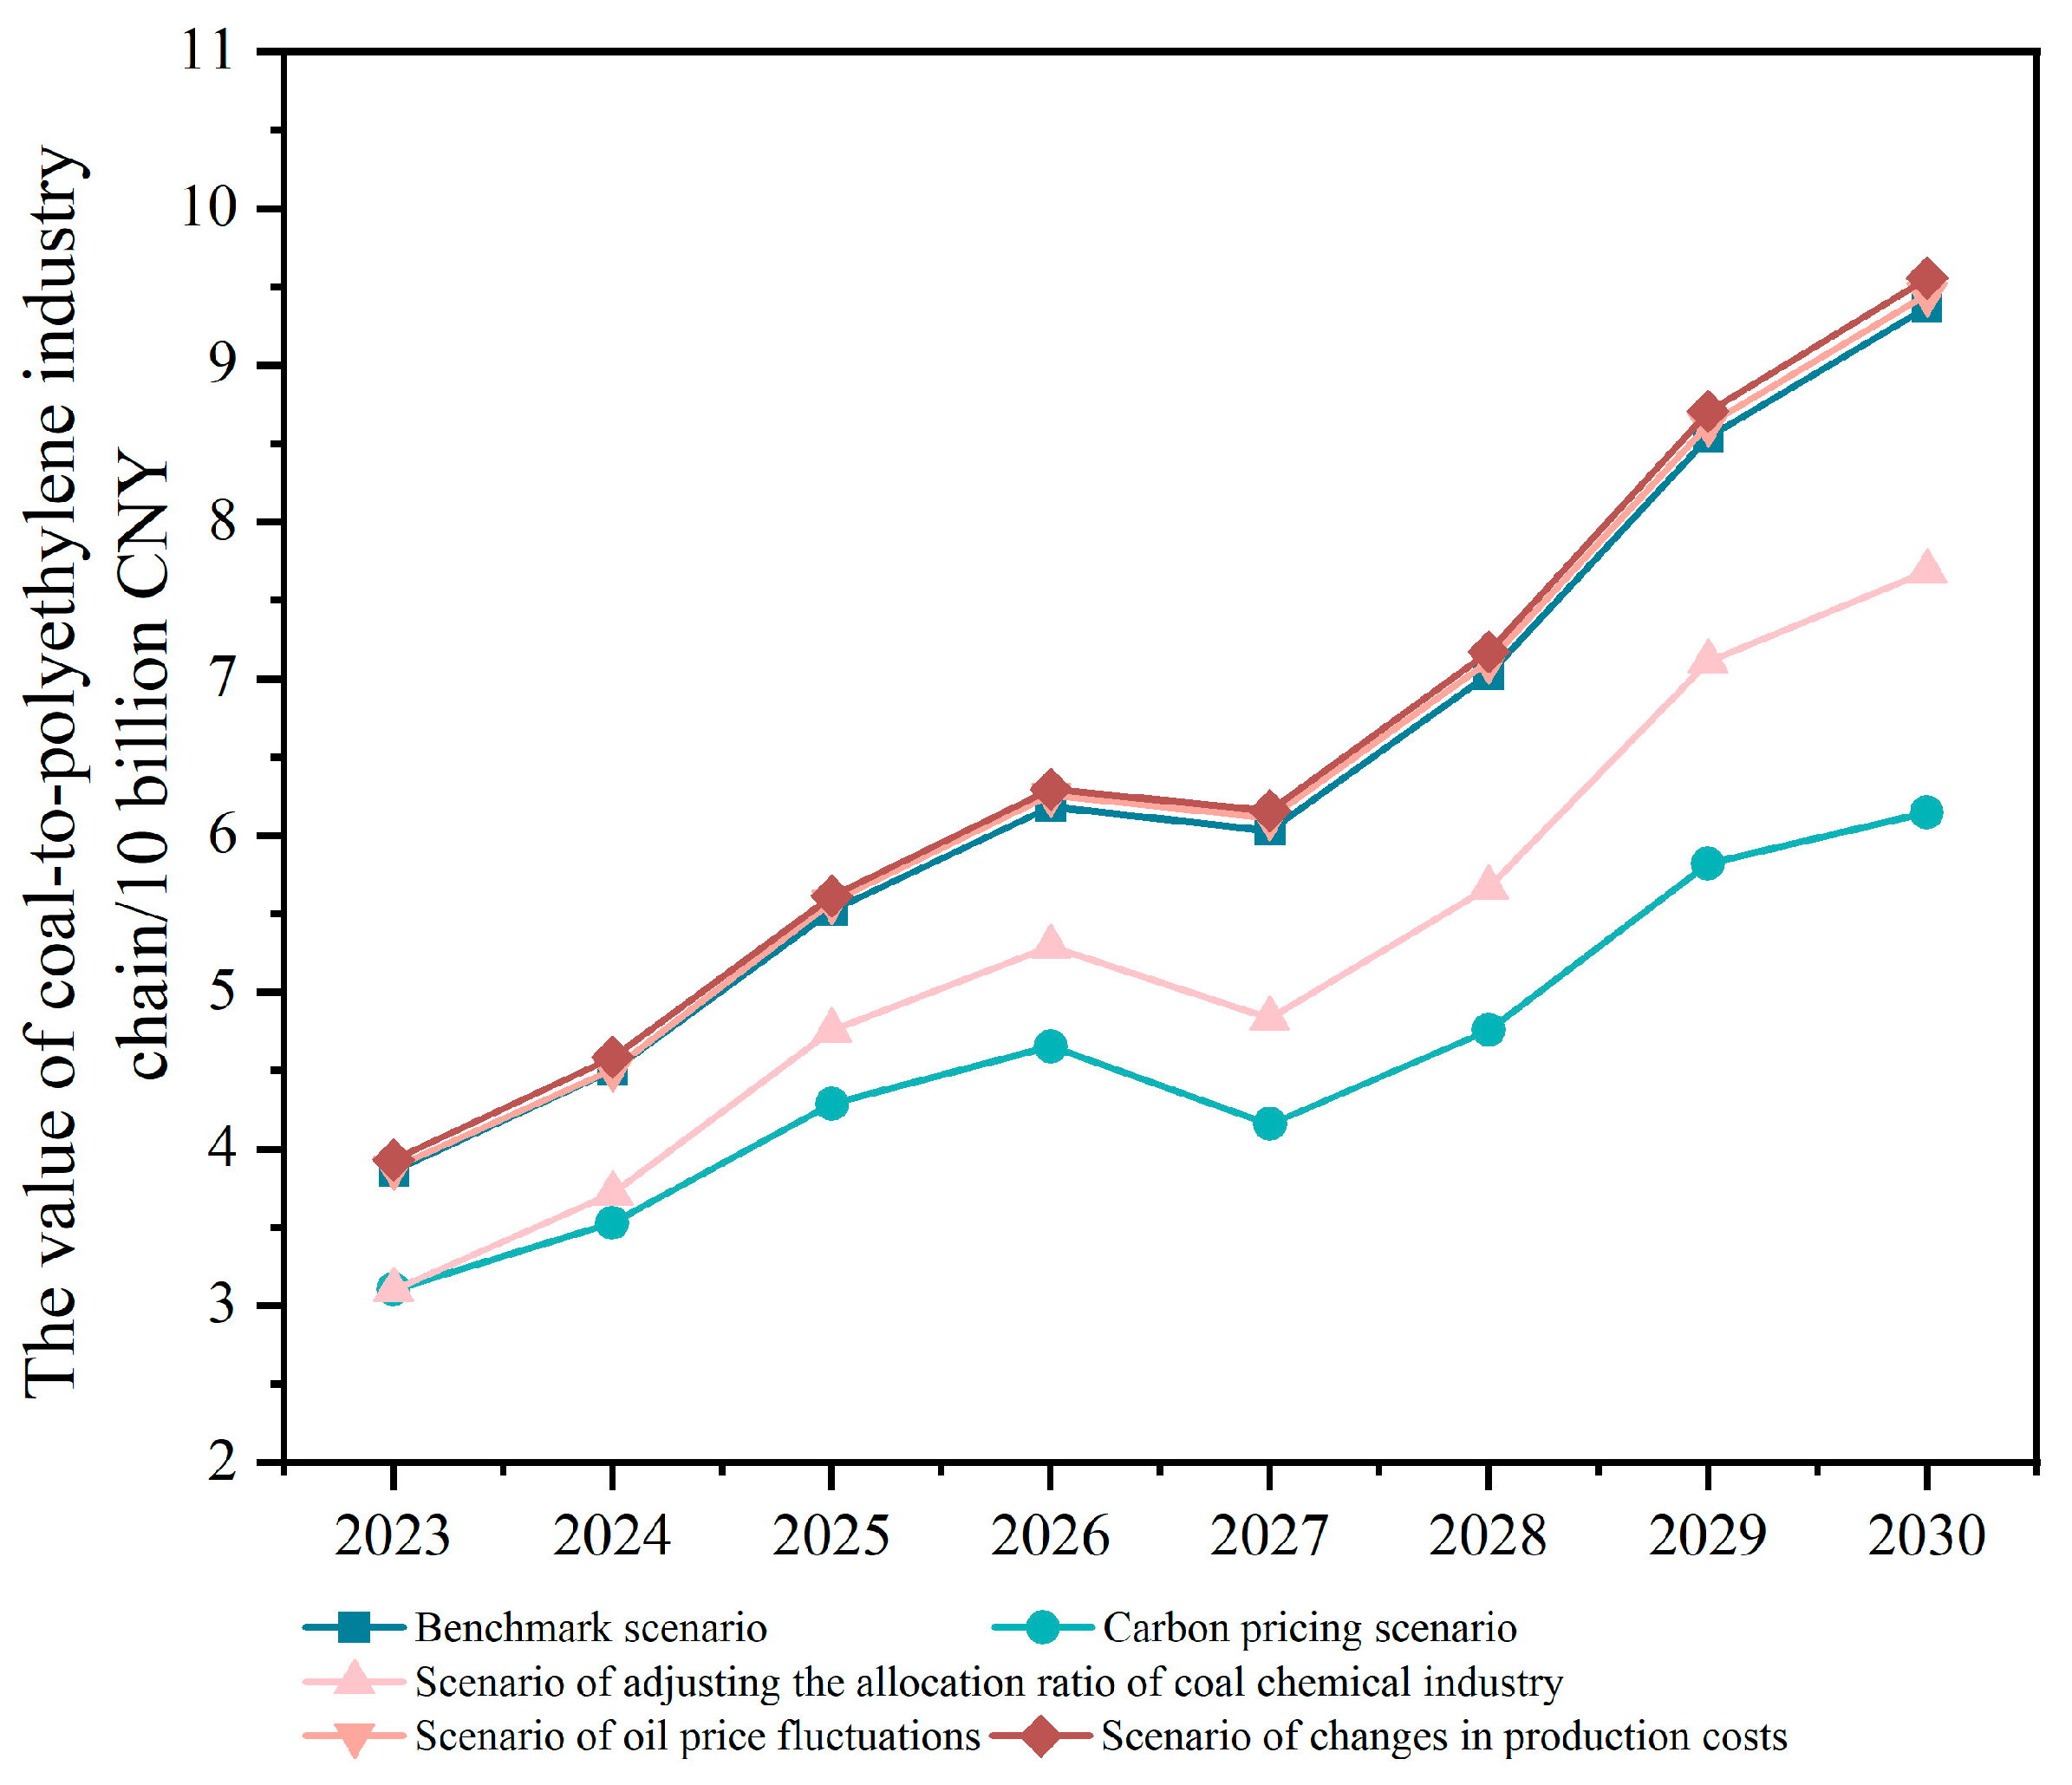
4.2.2. Effects of External Factors on the Values of Coal-to-Olefin Industrial Chains with Different Expansion Directions
5. Uncertainty Analysis
5.1. Monte Carlo Simulation Settings
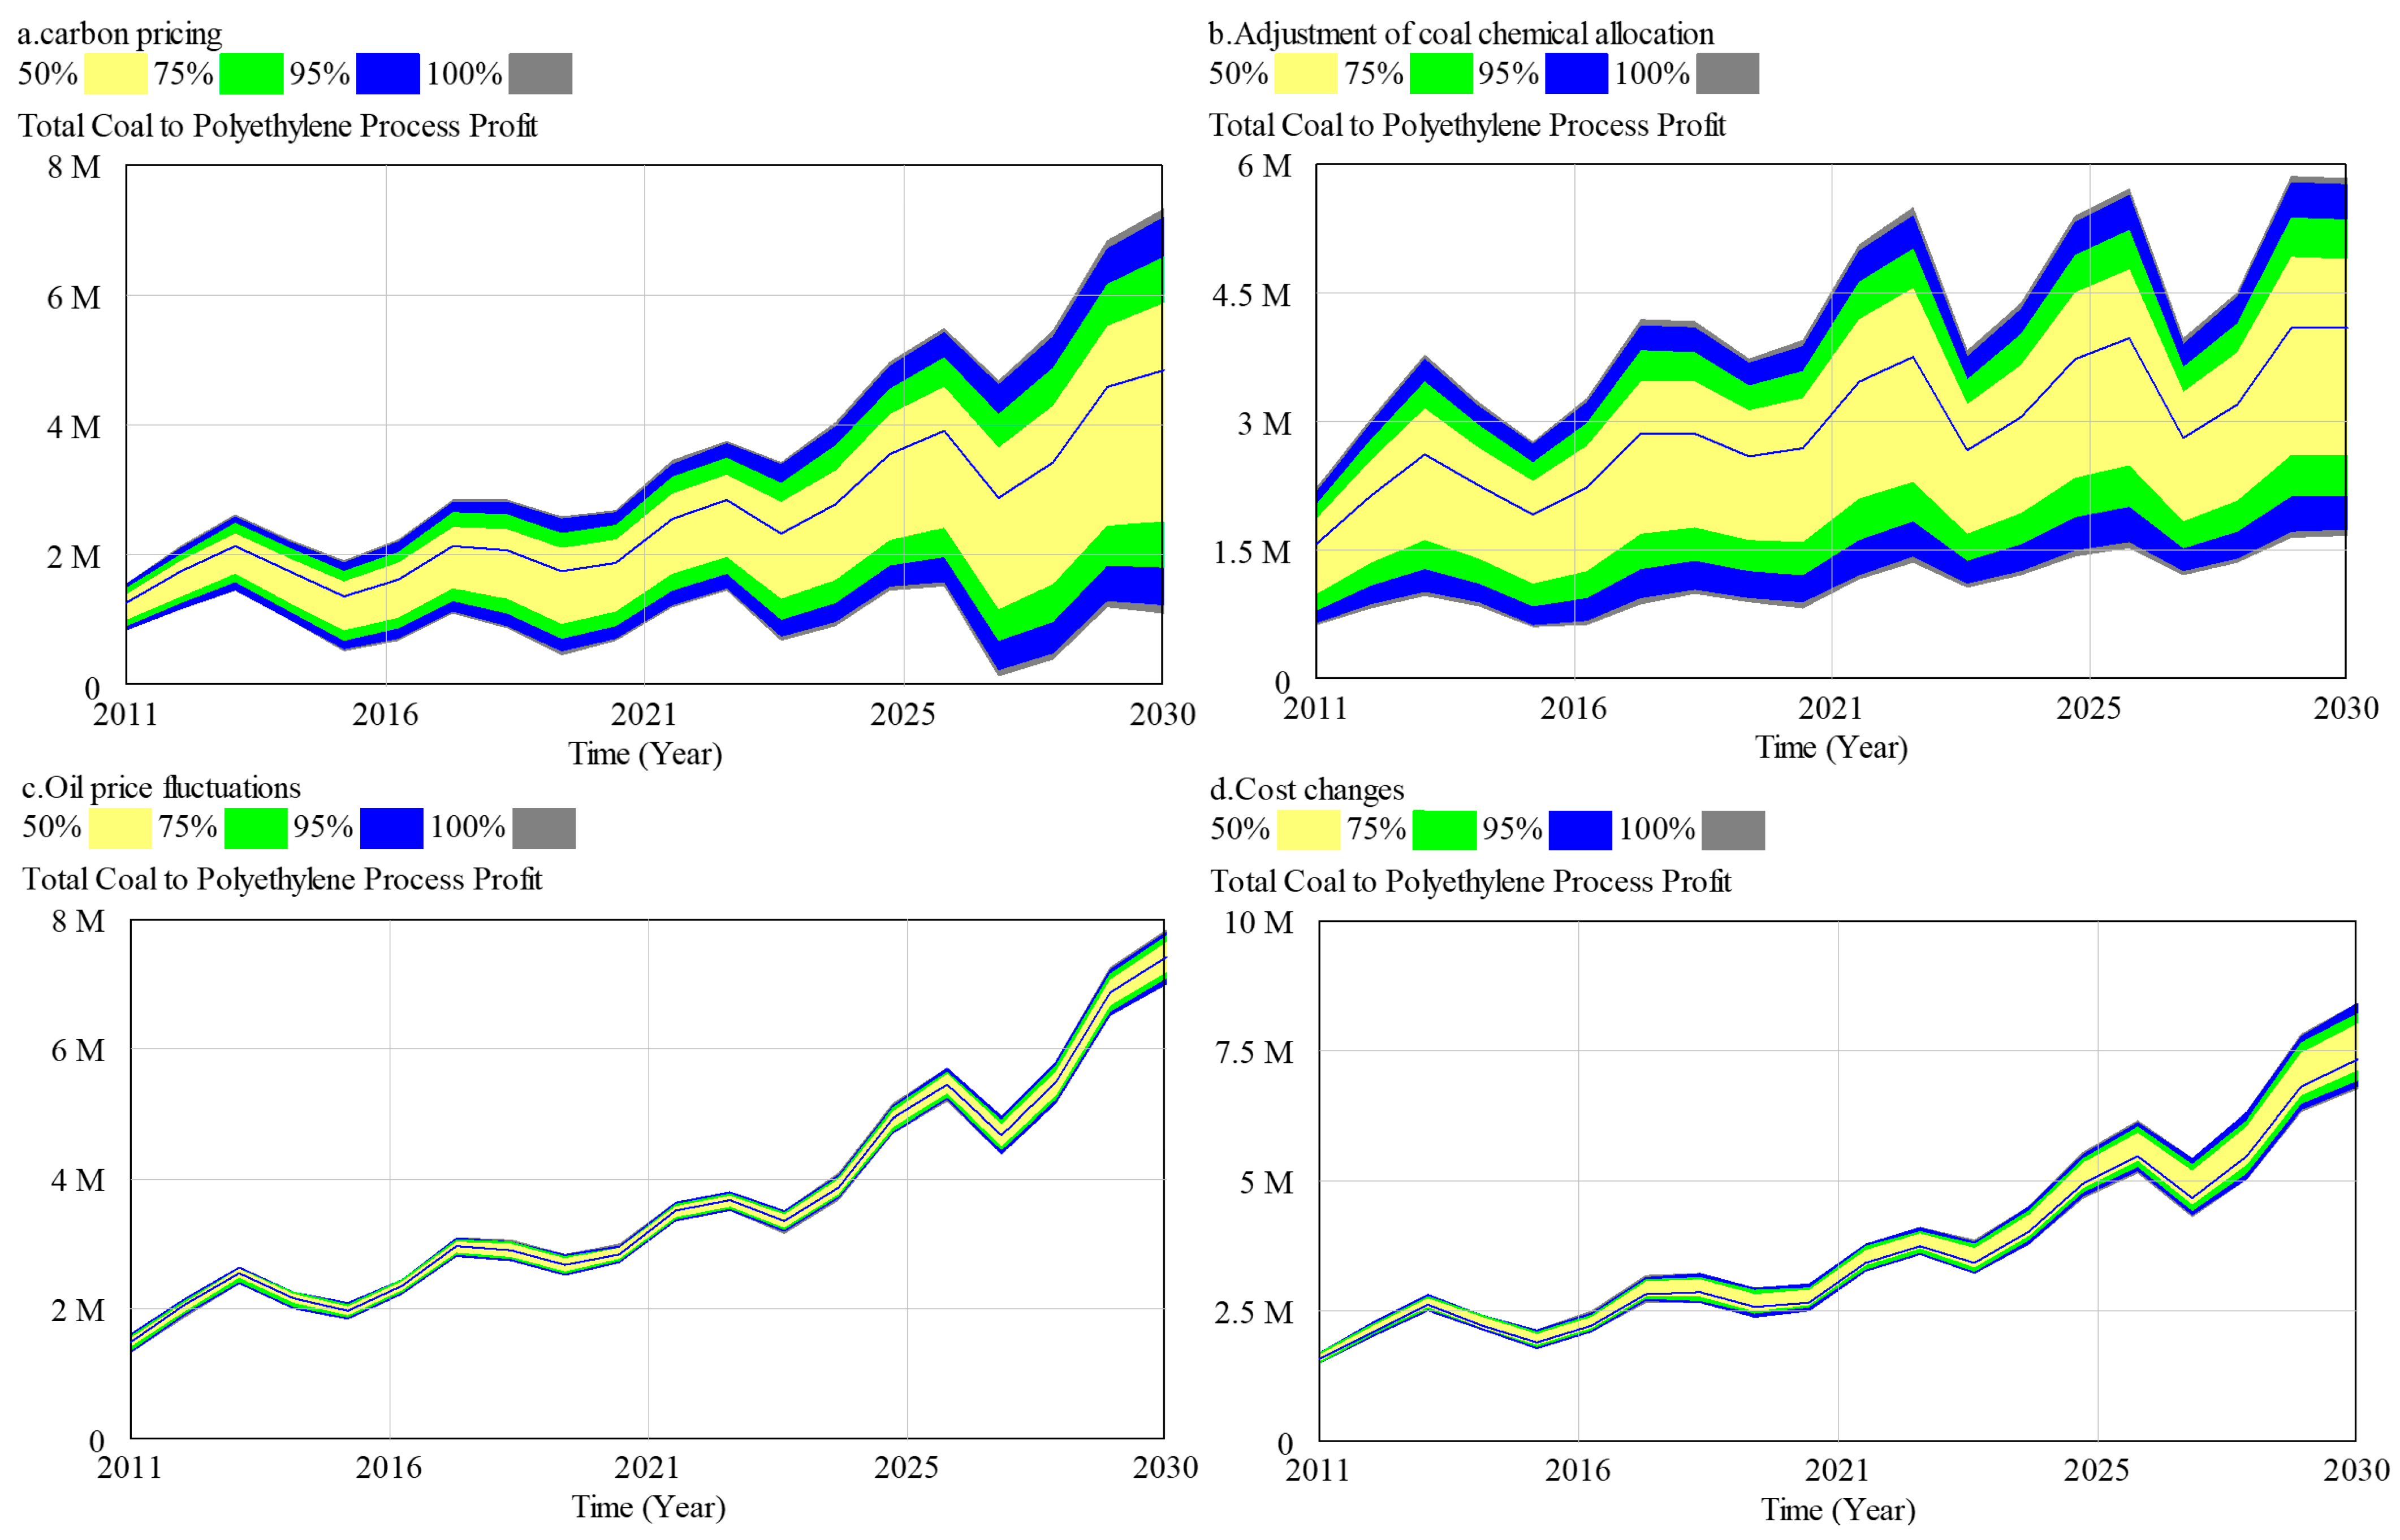
5.2. Monte Carlo Simulation Results Analysis
6. Conclusions
6.1. Findings and Practical Implications
- This study proposes an improved industrial chain value accounting method, which summarizes the total profit of the coal-to-olefin industrial chain into the following six aspects: the profit of the end products, the profit of intermediate products, the profit of the by-products from intermediate node products, the cost of production (including fixed and variable costs), the cost of transportation, and the cost of carbon penalties. This accounting method is embedded into the SD model for selecting expansion directions of the coal-to-olefin industrial chain. By analyzing the historical data from 2011 to 2023 and calibrating the SD model, the proposed decision-making method proves accurate and effective for selecting the industrial chain expansion direction.
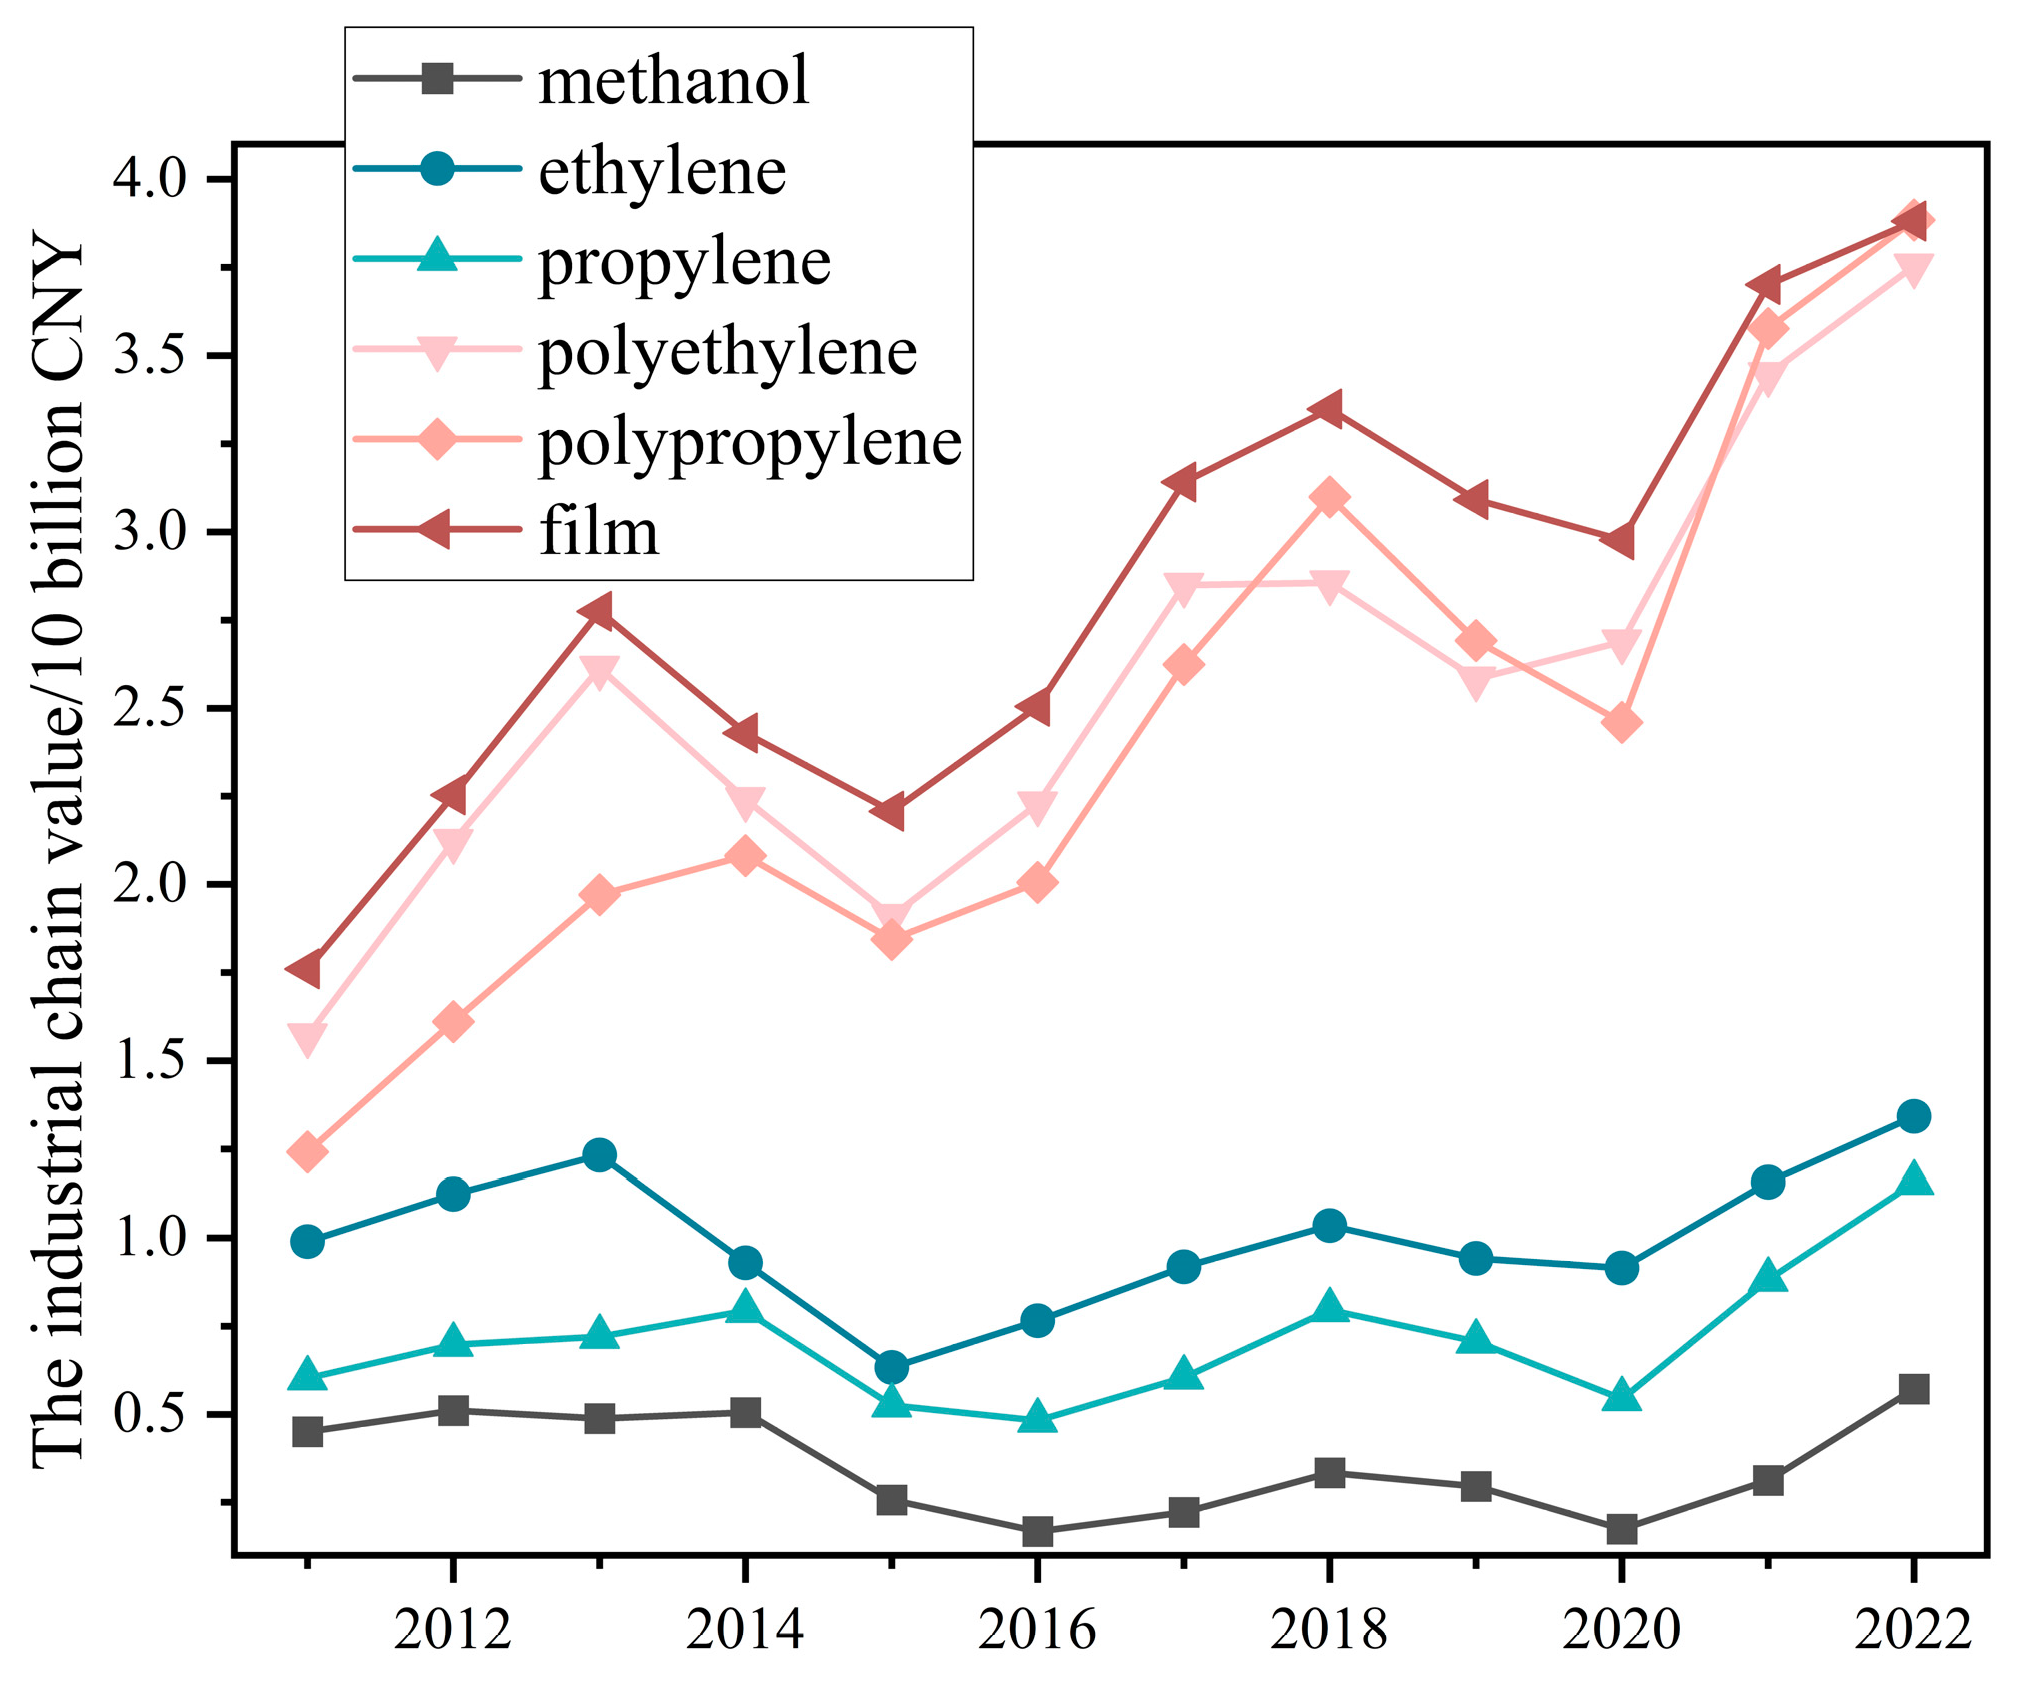
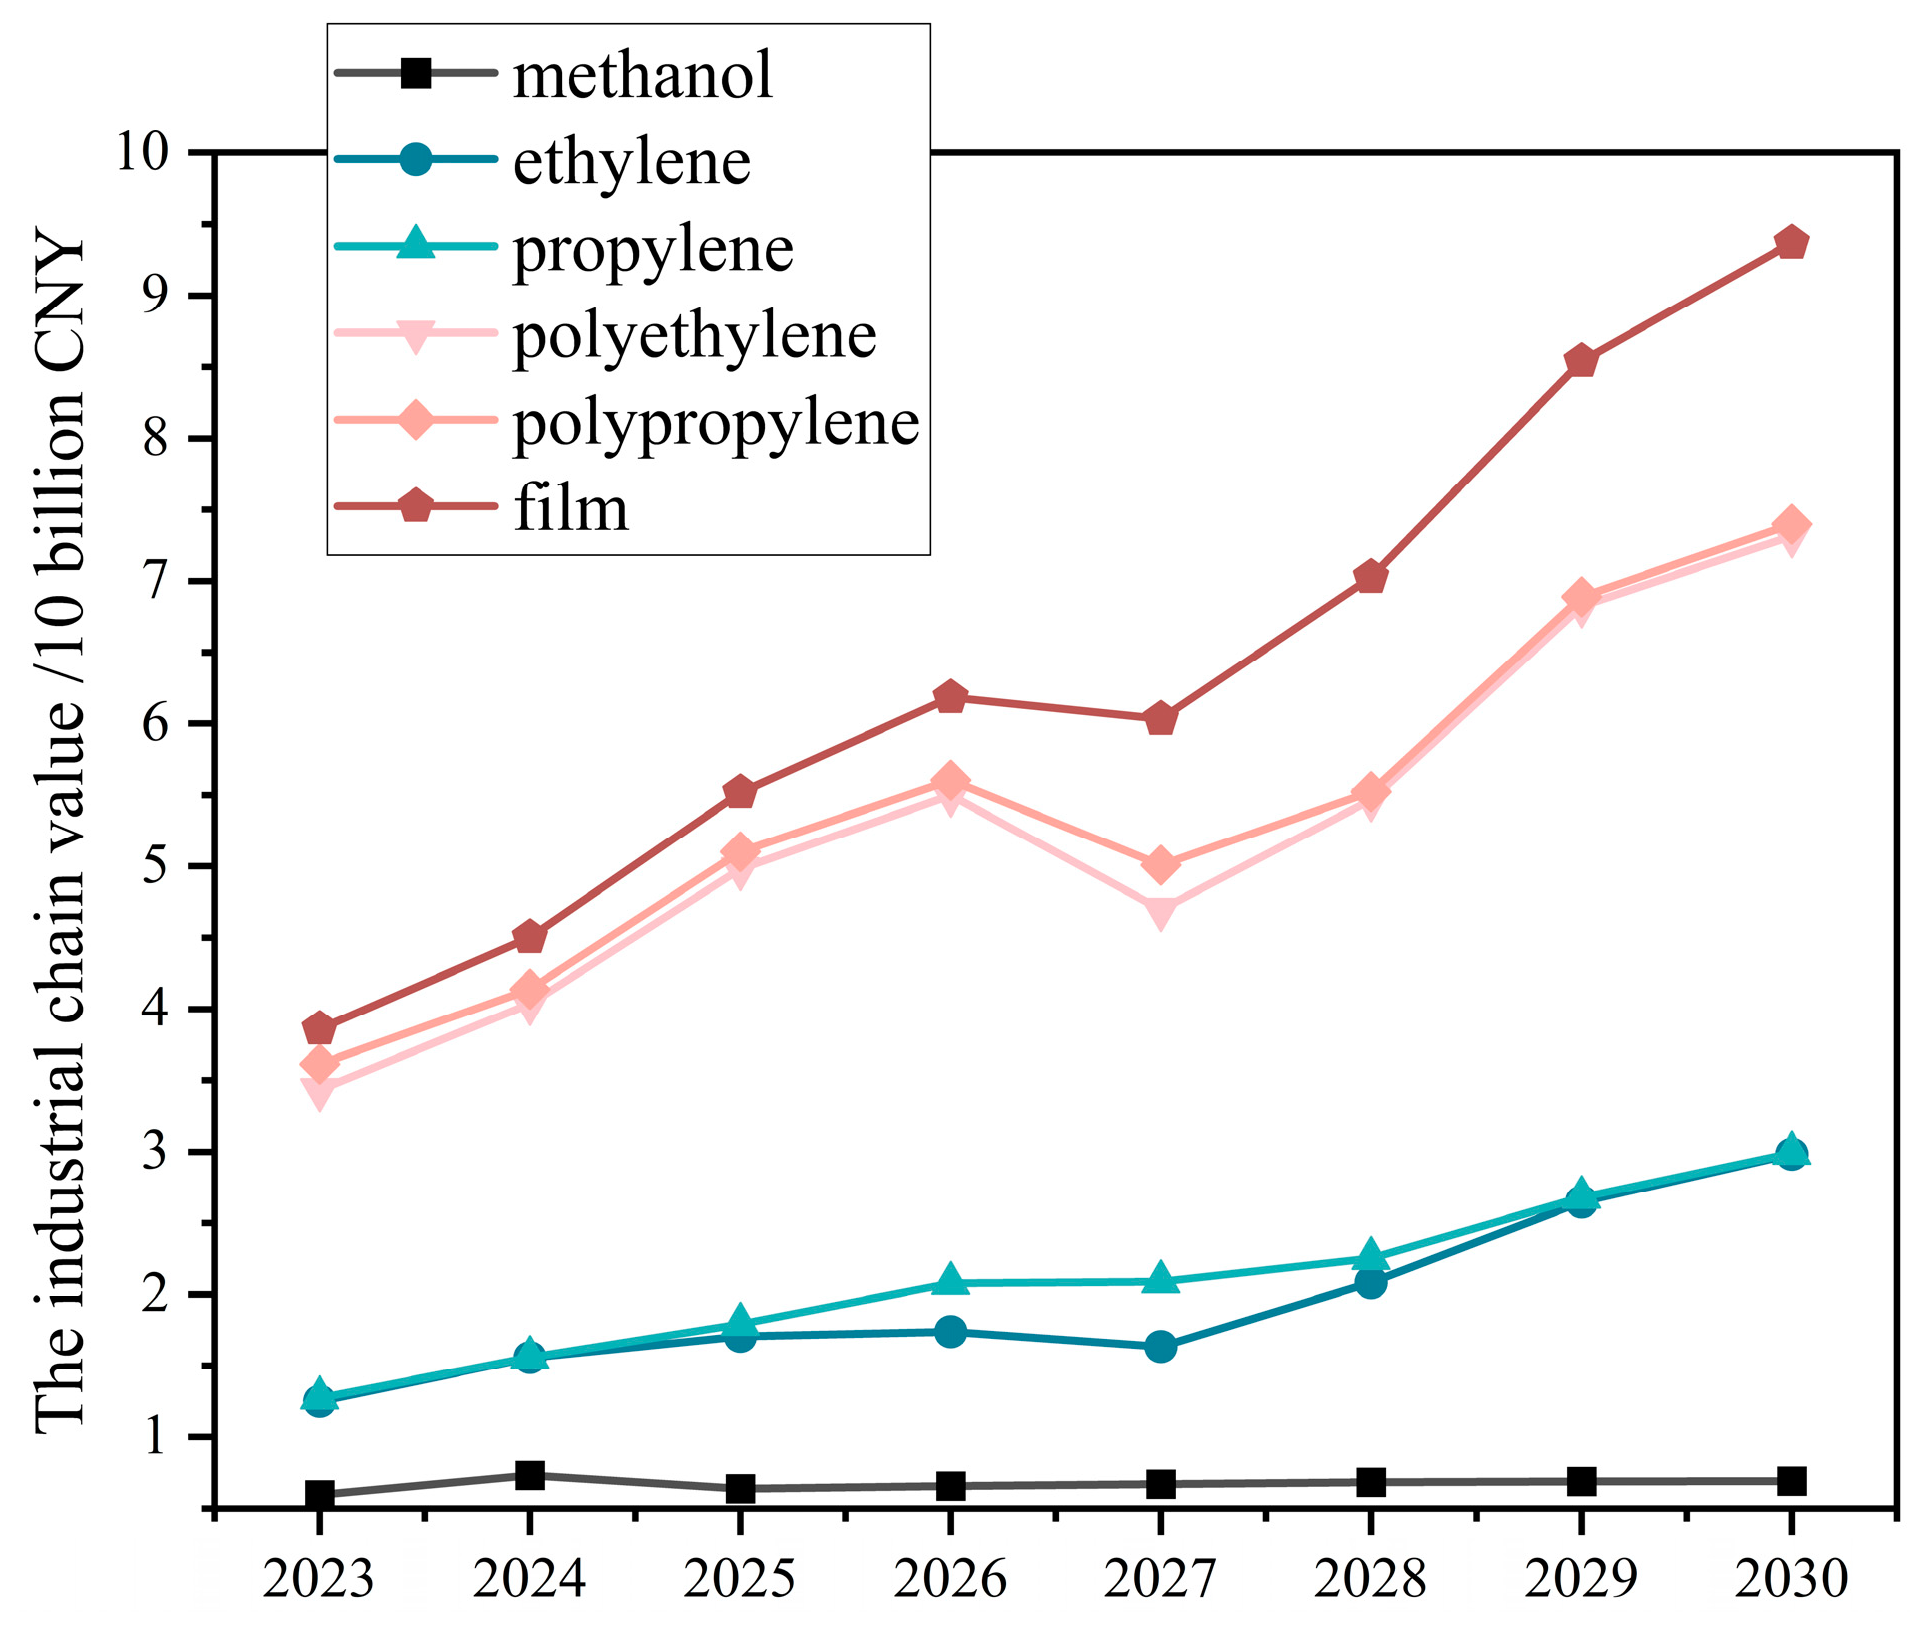
- The industrial chain value of each expansion direction is positively correlated with its expansion degree, i.e., expanding the industrial chain helps to improve its value. From 2011 to 2022, the values of the coal-to-methanol, coal-to-ethene, coal-to-propylene, coal-to-polyethylene, coal-to-polypropylene, and coal-to-film industrial chains differ markedly, and the industrial chain values in 2023 reach 57.2, 134.3, 115.6, 375.5, 388.5, and 38.82 billion, respectively. From 2023 to 2030, the value of the coal-to-methanol industrial chain shows great differences under different scenarios, and the value variation trends of the other industrial chains are basically the same in different scenarios.
- 3.
- The values of Inner Mongolia’s coal-to-olefin industrial chains under the baseline, carbon pricing, oil price fluctuation, and production cost change scenarios rank in descending order as coal-to-film > coal-to-polypropylene > coal-to-polyethylene > coal-to-ethylene > coal-to-propylene > coal-to-methanol. The values of Inner Mongolia’s coal-to-olefin industrial chains under the scenario of adjusting the allocation ratio of the coal chemical industry rank as coal-to-film > coal-to-polypropylene > coal-to-polyethylene > coal-to-propylene > coal-to-ethylene > coal-to-methanol. The risk resistance of Inner Mongolia coal-to-olefin industrial chains rank in descending order as coal-to-propylene > coal-to-ethylene > coal-to-ethylene > coal-to-polyethylene, coal-to-polypropylene, and coal-to-film > coal-to-methanol. Thus, enterprises pursuing high value for production can establish integrated production mode and choose the coal-to-film industry chain; enterprises seeking stable income can choose coal-to-propylene and coal-to-ethylene productions with stronger risk-resistance.
6.2. Theoretical Implications and Research Strengths
6.3. Limitations and Prospects
- During SD modeling, some factors that may affect the value of each coal-to-olefin industrial chain were ignored or simplified due to incomplete or absent statistical data, which may impact the simulation results.
- During scenario simulation, some variables and parameters were set as constants. In real life, however, these parameters change with the system. Although these model parameters were set based on the results of existing research and real-life policy changes, large inaccuracies remained, requiring further optimization.
Author Contributions
Funding
Data Availability Statement
Conflicts of Interest
References
- Xu, Z.G. Review, Reflection and Prospect of the Development of Modern Coal Chemical Industry in China in the Past 25 Years. Coal Sci. Technol. 2020, 48, 1–25. [Google Scholar]
- Yan, G.C.; Wen, L.; Zhang, H. Analysis of the Development Path of Modern Coal Chemical Industry. Chem. Prog. 2022, 41, 6201–6212. [Google Scholar]
- Cheng, J. Industrial Internet Promotes the Modernization of Industrial Chain: Theoretical Logic and Breakthrough Path. Mod. Econ. Res. 2023, 93–102. [Google Scholar] [CrossRef]
- Yang, Y.; Nian, F.Z. Reconstructing a fractal supply chain network based on geographical characteristics. Nonlinear Dyn. 2023, 111, 18113–18128. [Google Scholar] [CrossRef]
- Li, X.G.; Ma, X.B.; Gong, S.Y. The Research on Coal Chemical Industry Chain Development in China Based on Value-Added Model. Adv. Mater. Res. 2010, 143–144, 222–226. [Google Scholar] [CrossRef]
- Sun, G.M. Theoretical paradigm and empirical analysis of industrial extension model. East China Econ. Manag. 2017, 31, 79–83. [Google Scholar]
- Zhang, M.F.; Pan, X.J. Exploring the influence mechanism and countermeasures of coal industry chain extension. China Manag. Informatiz. 2015, 18, 161–162. [Google Scholar]
- Ma, S.C. Research on Value Decision Optimization of Coal Industry Chain Based on Response Surface Method. Master’s Thesis, China University of Geosciences, Beijing, China, 2019. [Google Scholar]
- Jahani, H.; Gholizadeh, H.; Hayati, Z.; Fazlollahtabar, H. Investment risk assessment of the biomass-to-energy supply chain using system dynamics. Renew. Energy 2023, 203, 554–567. [Google Scholar] [CrossRef]
- Song, M.; Zhang, J.; Gao, Y.J.; Zhang, S.F.; Yang, J. Research on energy saving, efficiency improvement and low-carbon development management path of coal industry. Environ. Sci. Manag. 2023, 48, 26–31. [Google Scholar]
- Chen, Y. Research on the development status and policies of modern coal chemical industry in Xinjiang during the 14th Five-Year Plan. Coal Process. Compr. Util. 2024, 7, 72–77. [Google Scholar] [CrossRef]
- Nie, C.; Chen, W.; Peng, S. Strategy of Clean and Efficient Use of China’s Modern Coal Chemical Industry. Resour. Ind. 2024, 26, 6–20. [Google Scholar] [CrossRef]
- Cao, Y.; Zhao, Y.; Wen, L.; Li, Y.; Wang, S.; Liu, Y.; Shi, Q.; Weng, J. System dynamics simulation for CO2 emission mitigation in green electric-coal supply chain. J. Clean. Prod. 2019, 232, 759–773. [Google Scholar] [CrossRef]
- Zhang, W.H. Research on Investment Value Evaluation of Modern Coal to Liquid Project from the Perspective of System. Master’s Thesis, Inner Mongolia University of Technology, Hohhot, China, 2021. [Google Scholar] [CrossRef]
- Zhang, J.W. Analysis of Carbon Emission Reduction Path in Inner Mongolia Modern Coal Chemical Industry. Master’s Thesis, Inner Mongolia University of Technology, Hohhot, China, 2023. [Google Scholar] [CrossRef]
- Yang, G.L. Simulation of Water Energy Food Nexus Based on System Dynamics. Master’s Thesis, Northwest A&F University, Xianyang, China, 2023. [Google Scholar] [CrossRef]
- Peng, S.J.; Yang, S.X. Construction and Verification Analysis of Capacity Optimization Allocation Model of Wind-Hydrogen-Coal Coupling System Based on System Dynamics. Sci. Technol. Manag. Res. 2023, 43, 203–214. [Google Scholar]
- Huang, G.S.; Hu, J.; Li, J.S.; Shi, X.Y.; Ding, W.J. Analysis on the development status and trend of coal-to-olefin technology in China. Chem. Prog. 2020, 39, 3966–3974. [Google Scholar]
- Michael, P. Competitive Strategy; Chen, X.Y., Translator; Huaxia Publishing House: Beijing, China, 2005; pp. 288–310. [Google Scholar]
- Wang, Q.; Xu, X.Y. Research on development path of modern coal chemical industry under background of “emission peak” and “carbon neutrality”. Mod. Chem. Ind. 2021, 41, 1–3+8. [Google Scholar]
- Eggleston, H.S.; Buendia, L.; Miwa, K.; Ngara, T.; Tanabe, K. 2006 IPCC Guidelines for National Greenhouse Gas Inventories; Preparation of National Greenhouse Gas Inventory Plan; Japan Institute of Global Environmental Strategy: Hayama, Japan, 2006; pp. 1–20. [Google Scholar]
- Muflikh, Y.N.; Smith, C.; Aziz, A.A. A systematic review of the contribution of system dynamics to value chain analysis in agricultural development. Agric. Syst. 2021, 189, 103044. [Google Scholar] [CrossRef]
- Gao, D.; Qiu, X.; Zhang, Y.; Liu, P. Life cycle analysis of coal based methanol-to-olefins processes in China. Comput. Amp; Chem. Eng. 2018, 109, 112–118. [Google Scholar] [CrossRef]
- Jin, H.; Li, R.J. System dynamics simulation of rural financial ecological poverty reduction-taking Hebei Province as an example. J. Syst. Sci. 2018, 26, 106–111. [Google Scholar]
- Zhang, Y.Y.; Wang, Y.G.; Tian, Y.J. Comparison of carbon dioxide emissions from typical modern coal chemical processes. Chem. Prog. 2016, 35, 4060–4064. [Google Scholar]
- Li, C.; Bai, H.; Lu, Y.; Bian, J.; Dong, Y.; Xu, H. Life-cycle assessment for coal-based methanol production in China. J. Clean. Prod. 2018, 188, 1004–1017. [Google Scholar] [CrossRef]
- Zhao, Z.; Chong, K.; Jiang, J.; Wilson, K.; Zhang, X.; Wang, F. Low-carbon roadmap of chemical production: A case study of ethylene in China. Renew. Sustain. Energy Rev. 2018, 97, 580–591. [Google Scholar] [CrossRef]
- Tian, Y.; Xie, K.; Qiao, Y.; Zhang, Y. Prospect of coal chemical industry under carbon neutrality constraints. China Foreign Energy 2022, 27, 17–23. [Google Scholar]
- Han, H.M. Value Chain Analysis of Coal Chemical Industry and Its Downstream Related Industries. Chem. Ind. 2010, 28, 7–17. [Google Scholar]
- Yin, S.; Su, J. Inspiration of foreign carbon pricing mechanism experience to China’s realization of “double carbon” goal. Technol. Ind. 2023, 23, 186–190. [Google Scholar]


| Driving Factor | Meaning |
|---|---|
| Zi | The value of the industrial chain when the final product of the coal-to-olefin industrial chain is i. |
| fj | The conversion rate of intermediate product j in the production process. |
| pik | The average price of the by-product k generated by the production process when producing the final product i of the coal-to-olefin industrial chain. |
| pc | Unit price for carbon penalty. |
| Oj | Carbon emissions of intermediate process product j. |
| cif | The variable cost of the final product i in the coal-to-olefin industrial chain. |
| cig | The fixed cost of the final product i in the coal-to-olefin industrial chain. |
| cil | The transportation cost of final product i in the coal-to-olefin industrial chain |
| x | The raw coal required to produce the final product i of the coal-to-olefin industrial chain |
| i | The final product of the coal-to-olefin industrial chain |
| j | The intermediate process product of the industrial chain |
| k | The intermediate by-product of the industrial chain |
| Industrial Chains | 2011 | 2012 | 2013 | 2014 | 2015 | 2016 | 2017 | 2018 | 2019 | 2020 | 2021 | 2022 |
|---|---|---|---|---|---|---|---|---|---|---|---|---|
| Methanol | 0.451 | 0.511 | 0.488 | 0.505 | 0.258 | 0.168 | 0.223 | 0.334 | 0.295 | 0.175 | 0.313 | 0.572 |
| Ethylene | 0.990 | 1.123 | 1.233 | 0.929 | 0.634 | 0.765 | 0.919 | 1.035 | 0.943 | 0.915 | 1.157 | 1.343 |
| Propylene | 0.603 | 0.697 | 0.721 | 0.794 | 0.526 | 0.483 | 0.605 | 0.796 | 0.706 | 0.543 | 0.882 | 1.156 |
| Polyethylene | 1.571 | 2.123 | 2.614 | 2.241 | 1.910 | 2.229 | 2.849 | 2.856 | 2.583 | 2.689 | 3.447 | 3.755 |
| Polypropylene | 1.242 | 1.611 | 1.971 | 2.082 | 1.844 | 2.006 | 2.624 | 3.099 | 2.692 | 2.460 | 3.577 | 3.885 |
| Film | 1.761 | 2.254 | 2.775 | 2.429 | 2.208 | 2.505 | 3.141 | 3.348 | 3.092 | 2.977 | 3.702 | 3.882 |
| Time | For Methanol Conversion (×104 t/Year) | For Ethylene Conversion (×106 t/Year) | ||||
|---|---|---|---|---|---|---|
| Actual Value | Simulated Value | Error (%) | Actual Value | Simulated Value | Error (%) | |
| 2011 | 686.67 | 686.66 | 0 | 283.12 | 281.8 | 0.46 |
| 2012 | 869.98 | 869.99 | 0 | 379.80 | 378.05 | 0.48 |
| 2013 | 1053.30 | 1053.00 | 0.03 | 454.92 | 452.81 | 0.46 |
| 2014 | 1236.61 | 1237.00 | 0.03 | 399.75 | 397.9 | 0.47 |
| 2015 | 1419.92 | 1420.00 | 0.01 | 404.69 | 402.82 | 0.46 |
| 2016 | 1603.23 | 1603.00 | 0.01 | 442.3 | 440.26 | 0.46 |
| 2017 | 1786.54 | 1787.00 | 0.03 | 575.87 | 573.19 | 0.46 |
| 2018 | 1963.32 | 1963.00 | 0.02 | 687.76 | 684.58 | 0.46 |
| 2019 | 2179.52 | 2180.00 | 0.02 | 670.1 | 666.98 | 0.46 |
| 2020 | 2280.48 | 2280.00 | 0.02 | 528.07 | 525.64 | 0.46 |
| 2021 | 2578.89 | 2579.00 | 0 | 552.09 | 549.46 | 0.46 |
| 2022 | 2719.32 | 2680.00 | 1.45 | 552.04 | 549.47 | 0.47 |
| Scenarios | Driving Factors | Assumptions |
|---|---|---|
| Business as usual (S1) | - | Maintain the development trend of the total profit of the coal-to-olefin industrial chain in Inner Mongolia from 2011 to 2022, and each variable works according to the existing setting. |
| Scenarios 2 (S2) | Carbon pricing | From 2023 to 2025 (transition period), the carbon price is levied at 8 to 10 USD/t, gradually increasing to 15 USD/ton from 2026 to 2030. Other parameters are consistent with S1. |
| Scenarios 3 (S3) | Coal chemical allocation ratio adjustment | The allocation ratio of the coal chemical industry will increase by 2% per year from 2023 to 2025 and decrease by 3% per year from 2026 to 2023. Other parameters are consistent with S2. |
| Scenarios 4 (S4) | Oil price fluctuation | Under the baseline scenario, the oil price increases by 10% to 25% per year. To adapt to the long-term 80 USD/barrel price, the increases will be 22.8%, 21.1%, 19.3%, and 17.65% per year, respectively, from 2027 to 2030. Other parameters are consistent with S1. |
| Scenarios 5 (S5) | Production cost change | The production cost will be reduced by 10% per year from 2023 to 2025 and by 15% per year from 2026 to 2030. Other parameters are consistent with S1. |
Disclaimer/Publisher’s Note: The statements, opinions and data contained in all publications are solely those of the individual author(s) and contributor(s) and not of MDPI and/or the editor(s). MDPI and/or the editor(s) disclaim responsibility for any injury to people or property resulting from any ideas, methods, instructions or products referred to in the content. |
© 2024 by the authors. Licensee MDPI, Basel, Switzerland. This article is an open access article distributed under the terms and conditions of the Creative Commons Attribution (CC BY) license (https://creativecommons.org/licenses/by/4.0/).
Share and Cite
Xu, D.; Liu, C.; Du, Q.; Duan, W.; Zhang, C. Expansion Direction Selection of the Coal-to-Olefin Industrial Chain in Inner Mongolia from the Value Chain Perspective. Systems 2024, 12, 537. https://doi.org/10.3390/systems12120537
Xu D, Liu C, Du Q, Duan W, Zhang C. Expansion Direction Selection of the Coal-to-Olefin Industrial Chain in Inner Mongolia from the Value Chain Perspective. Systems. 2024; 12(12):537. https://doi.org/10.3390/systems12120537
Chicago/Turabian StyleXu, Desheng, Chen Liu, Qing Du, Wei Duan, and Chunyan Zhang. 2024. "Expansion Direction Selection of the Coal-to-Olefin Industrial Chain in Inner Mongolia from the Value Chain Perspective" Systems 12, no. 12: 537. https://doi.org/10.3390/systems12120537
APA StyleXu, D., Liu, C., Du, Q., Duan, W., & Zhang, C. (2024). Expansion Direction Selection of the Coal-to-Olefin Industrial Chain in Inner Mongolia from the Value Chain Perspective. Systems, 12(12), 537. https://doi.org/10.3390/systems12120537