Article

Study on the Selection of Takeaway Operating Modes from a Restaurant Perspective

1
School of Management Engineering, Zhengzhou University of Aeronautics, Zhengzhou 450046, China
2
Logistics Research Center, Shanghai Maritime University, Shanghai 201306, China
3
Department of Information Engineering, Xinyang Agriculture and Forestry University, Xinyang 464000, China
*
Author to whom correspondence should be addressed.
Systems 2024, 12(12), 536; https://doi.org/10.3390/systems12120536
Submission received: 9 October 2024 / Revised: 14 November 2024 / Accepted: 20 November 2024 / Published: 2 December 2024

Abstract

:
There are three operational modes for restaurant takeaway services: a takeaway platform combined with restaurant delivery (mode A), a takeaway platform paired with platform delivery (mode B), and a self-established platform with delivery (mode C). In the face of intense market competition, determining how restaurants can select appropriate operational delivery modes to maintain competitiveness and profitability has emerged as a pressing issue. In this paper, we develop game models that encompass a restaurant and food delivery platform to investigate the optimal operational mode for restaurants. Our analysis indicates that when the market size is small, mode B results in the lowest ordering costs, the highest sales volume, and the maximum profit. Conversely, in the context of a large market size, if the commission rate is low, mode A minimizes the ordering costs and maximizes sales volume; if the commission rate is high, mode C minimizes the ordering costs while also achieving the highest sales volume. Notably, we find that as long as the market size is sufficiently large, mode C consistently yields the highest restaurant profits. The outcomes of this study contribute to the theoretical framework surrounding the operation and management of food delivery platforms and offer theoretical guidance and decision-making support for selecting restaurant food delivery operational modes.

1. Introduction

1.1. Background and Motivation

With the widespread adoption of Internet technology, China’s food service industry is undergoing a rapid transformation, especially in the area of food delivery [1,2,3]. The expansion of the online food delivery market and the optimization of services have significantly enhanced consumer experiences, gradually becoming an important part of the catering industry. According to data from 2023, China’s online food delivery market has reached a size of USD 74.2 billion and is expected to grow to USD 184.1 billion by 2032, with a compound annual growth rate of 10.6%1. This growth is driven by urbanization, internet penetration, and changes in consumer lifestyles, particularly the increasing demand for online food delivery services from younger generations [4]. During the COVID-19 pandemic, food delivery services became a major source of income for catering businesses, with a significant increase in order volume [5]. This trend has not slowed down in the post-pandemic era. Major platforms like Meituan and Ele.me have strengthened their market positions by improving service quality and expanding delivery categories. Additionally, companies have begun to enter smaller cities, targeting non-peak consumption times such as afternoon tea and late-night snacks, aiming to explore more growth opportunities [6]. This rapid market development not only offers new business opportunities for traditional catering enterprises but also imposes higher requirements on their digital operations [7,8].
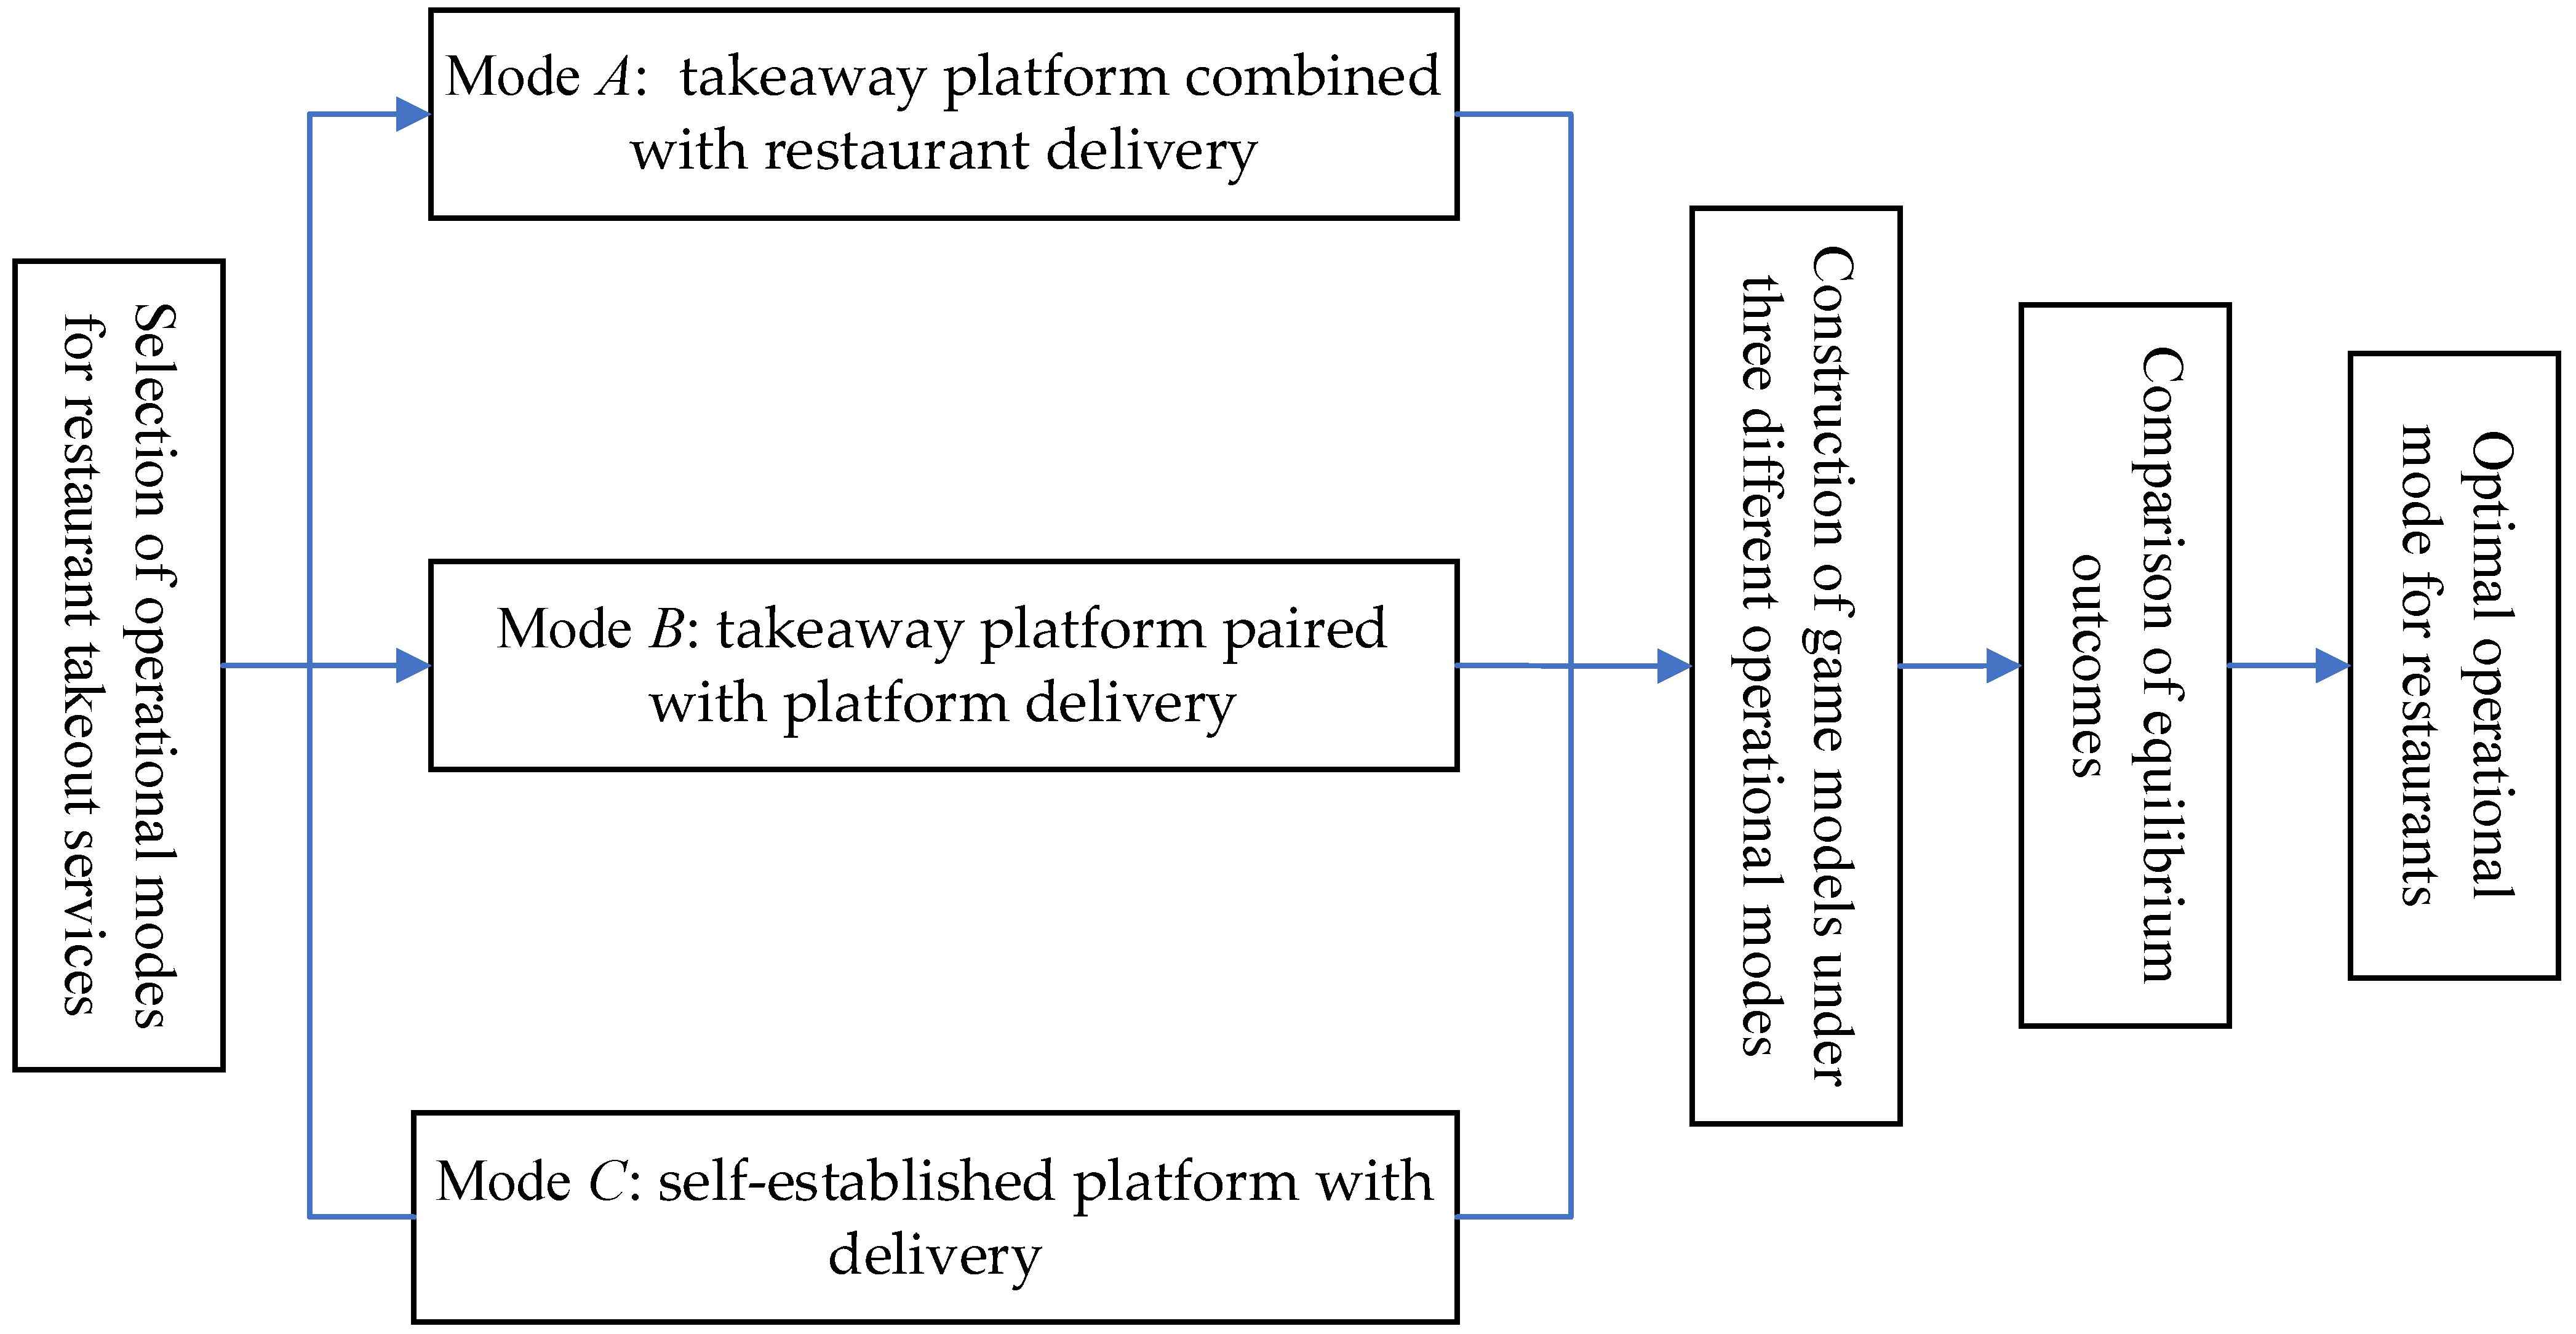
Currently, there are three main operating modes for restaurant food delivery: (1) food delivery platform + restaurant delivery (marked as A); (2) food delivery platform + platform delivery (marked as B); and (3) self-built platform + delivery (marked as C).
For mode A, restaurants rely on their capabilities for delivery, management, and rider training, but they also want to leverage the platform’s traffic for product sales and promotion. In this case, the food delivery platform charges the restaurant a management fee. The advantage of this mode is that restaurants can control the delivery process, avoiding disruptions from holidays or bad weather. However, delivery costs are high, and the delivery range is limited.
For mode B, restaurants sign agreements with food delivery platforms, where the platform is responsible not only for operation and development but also for recruiting, managing, and training riders for unified delivery. The platform takes a commission from the process. Compared to mode A, restaurants are only responsible for providing the products. Many restaurants favor this mode to take advantage of the platform’s traffic. This mode is the most common due to its high marketing exposure and high participation from restaurants. However, as food delivery platforms continue to consolidate, their dominance grows, leading to increased traffic and bidding fees charged to restaurants. This has squeezed the profit margins of restaurants, intensifying the conflict between restaurants and food delivery platforms.
Mode C first appeared in well-established chain restaurants like KFC and McDonald’s. In recent years, with the widespread adoption of smart devices and mobile payments, consumer behavior has changed. Many restaurants are now building platforms through mini-programs on WeChat, avoiding high platform fees and reducing costs, making the “self-built platform + delivery” mode feasible.
Despite the rapid development of the food delivery market presenting new growth opportunities for the restaurant industry, restaurants encounter numerous challenges in selecting an appropriate delivery operational mode. Currently, the majority of research focuses on consumer behavior and market trend analysis, while discussions regarding how restaurants can optimize their operational strategies in response to market dynamics and changes in commission policies remain relatively limited. Particularly in the context of rising commission rates and fluctuating market sizes, how restaurants can formulate effective pricing and operational strategies to maintain competitiveness and profitability remains an unresolved issue. Furthermore, with advancements in technology and shifts in consumer behavior, the role and influence of delivery platforms are continuously evolving, thereby further complicating the decision-making process for restaurants.

1.2. Research Questions and Major Findings

This study attempts to answer the following three questions:
(1)
What impact do market size and commission rates have on restaurant operation modes?
(2)
What are the differences in food pricing, sales, and profit across different operational modes for restaurants?
(3)
Which operational mode should restaurants choose when implementing a food delivery strategy?
To address the above questions, this paper constructs an analytical framework involving a restaurant and a food delivery platform. Game models are developed for three distinct operational modes. We explore the optimal decisions under three operational modes and conduct a comparative analysis. The research framework of this study is illustrated in Figure 1. The findings show that when the market size is small, mode B results in the lowest ordering costs, the highest sales volume, and the maximum profit. Conversely, in the context of a large market size, if the commission rate is low, mode A minimizes the ordering costs and maximizes sales volume; if the commission rate is high, mode C minimizes the ordering costs while also achieving the highest sales volume. Notably, we find that as long as the market size is sufficiently large, mode C consistently yields the highest restaurant profits.

1.3. Contribution Statements and Organization

To the best of our knowledge, this paper is the first to examine the three distinct takeout operational modes, thereby enriching the existing literature on takeout operations management. We derive optimal decisions under each operational mode, conduct comparative analyses, and specifically explore the impacts of market size and commission rates on restaurant selection of takeout operational modes. Furthermore, we consider a unique scenario in which the market size diminishes for restaurants utilizing self-built platforms. This research provides theoretical guidance for takeout businesses in their selection of operational modes, as well as in pricing and service decision-making.
The remainder of this paper is organized as follows. Section 2 provides a brief review of the most recent literature. Section 3 introduces the assumptions and notations pertinent to the model. Section 4 develops three research models and presents the equilibrium results. Section 5 conducts a comparative analysis of these equilibrium results. Section 6 offers an extended analysis of the model. Section 7 concludes the paper. All proofs are placed in the Appendix A.

2. Literature Review

Our work is related to three main research processes in food delivery: (1) market size and consumer behavior, (2) benefit distribution of food delivery platforms, and (3) food delivery operation strategy.

2.1. Market Size and Consumer Behavior

With the increasing prevalence of online ordering, the food delivery market has experienced significant expansion, leading consumers to rely more on food delivery applications for convenient and prompt meal delivery [9,10]. Numerous studies have investigated the relationship between marketing analysis and consumer behavior, with a focus on understanding consumer preferences, purchasing patterns, and decision-making processes [11,12,13]. In particular, these studies have highlighted the impact of technological advancements and evolving consumer values on the retail industry and actual consumption behavior, emphasizing that these factors are reshaping consumption patterns. Within the realm of on-demand food delivery services, Yang et al. [14] addressed challenges in supply and demand management, concentrating on the optimization of customer service areas and driver dispatch zones. Ke et al. [15] formulated a mathematical model to delineate the equilibrium state of the on-demand food delivery market while exploring the effects of meal prices, wage levels, and distribution factors. Furthermore, Ma et al. [16] utilized a time–value framework and zonal pricing model to quantify consumer perceptions regarding the costs associated with on-demand food delivery services, thereby providing additional insights into consumer behavior. Unlike the aforementioned studies, this paper focuses on exploring the impact of market size on the operational mode selection of food delivery businesses.

2.2. Benefit Distribution of Food Delivery Platforms

In recent years, the emergence of on-demand food delivery platforms has prompted scholars to conduct extensive research on their economic and management implications. For example, Liu et al. [17] analyzed the effects of commission caps on the behavior of restaurant owners and platform efficiency through an economic equilibrium model, thereby providing valuable insights for policy formulation. Ji et al. [18] investigated the equilibrium between platform profitability and equitable distribution, underscoring that an excessive focus on profit maximization could undermine ecosystem stability. They recommended a series of regulatory measures to promote fairness and sustainability. Wang et al. [19], employing the principal-agent theory, proposed a profit distribution mechanism that integrates revenue sharing and cost-sharing, thereby optimizing the coordination within the dual-channel model. Likewise, other scholars have examined dual-channel models, enhancing the coordination and sustainability of the interests of platform stakeholders through contractual mechanisms [20,21,22,23]. Consequently, the design of the commission mechanism not only influences the profitability of the platform but also directly impacts the survival of restaurants and the balance and sustainable development of the entire ecosystem. Consistent with the aforementioned literature, this paper also takes into account the profit distribution of food delivery platforms. However, diverging from the previous studies, this paper simultaneously examines the effects of market size and commission rates on the distribution of platform profits.

2.3. Food Delivery Operation Strategy

Currently, a substantial body of the literature has conducted in-depth investigations into the supply chain operational decisions of external sales platforms. Research on online food delivery has progressively transitioned from the early website-based model to a novel online-to-offline paradigm, leveraging mobile applications and drone delivery [24,25,26,27]. In terms of enhancing delivery efficiency, some studies have concentrated on addressing challenges related to high costs and delivery delays [28,29], while others have optimized delivery routes for takeout, taking into account constraints such as delivery vehicle capacity, distance, and time windows [30,31]. For example, Niu et al. [32] examined two delivery strategies available to restaurants on food delivery platforms: utilizing platform delivery services or establishing their delivery systems. Kim et al. [33] investigated single-order instant delivery services, in which couriers directly pick up and deliver food to customers, thereby circumventing disruptions from additional routes. Du et al. [34] discussed just-in-time delivery services with compensation mechanisms implemented by certain food delivery platforms, wherein the platform compensates consumers for delivery delays. Chan et al. [35] reviewed research trajectories related to the sustainable operation of the food delivery business, providing theoretical support for the long-term advancement of the food delivery industry. In contrast to the aforementioned studies, this paper comprehensively explores optimal decision-making under three operational modes and investigates the optimal operational decisions for food delivery merchants who establish their platforms, considering the potential reduction in market size.

2.4. Literature Summary

Although existing research extensively covers various aspects of the food delivery market, studies on how restaurants can select the optimal operational model under dynamic market conditions remain insufficient. Specifically, there is a limited exploration of the comprehensive effects of market size, commission rates, and self-built platforms on restaurant strategy selection, as well as the impact of high commissions on the long-term operations of restaurants and the role of self-built platforms in cost control and brand development. To highlight the literature positioning and research gaps, we summarize the critical difference between our work and the aforementioned closely related studies in Table 1.

3. The Model

The model under study consists of a restaurant and a food delivery platform (such as Meituan or Ele.me). The restaurant can choose from three different operational modes, referred to as modes A, B and C. In mode A, the delivery cost per order is borne by the restaurant, denoted as t; in mode B, the platform charges consumers a delivery fee per order, denoted as s; in mode C, the restaurant also bears a delivery cost per order t, along with an additional handling cost per order, denoted as co. When the restaurant opts to open a store on the platform, the platform charges a commission rate r on each order. The notation used in this paper is explained in Table 2.
Assuming that the demand for the restaurant’s delivery service is a linear function of price, following references [32,36], we derive the demand functions under the three operational modes as follows:
Mode A
Q A = a k p
Mode B
Q B = a k ( p + s )
Mode C
Q C = a k p
Among these variables, a is the size of the restaurant takeaway market, p is the unit price of takeaway products, s is the unit price of platform delivery, and k is the price sensitivity coefficient.
We propose the following assumptions:
Assumption 1.
To achieve the optimal decision and non-negative sales obtained by the model, let  a > max k t 1 r , k c o + t .
Assumption 2
The expense associated with establishing a restaurant’s platform is a one-time investment; therefore, when developing the model, the cost of constructing the platform is excluded from consideration, focusing solely on the cost incurred for processing each individual order for the restaurant.
Assumption 3.
To focus on the research in this paper, it is assumed that the manufacturing cost of each order is zero.

4. Equilibrium Analysis

In this section, we provide the optimal decisions for restaurants and platforms under three modes. Both restaurants and platforms aim to maximize their profits and make independent decisions.

4.1. Mode A

In this mode, the profit functions of restaurants and platforms are as follows:
π R A = 1 r p t Q A
π P A = r p Q A
In this mode, it is solely the responsibility of the restaurant to establish the retail price. This observation leads to the following lemma:
Lemma 1.
The equilibrium results under mode A are as follows: 
p A * = a a r + k t 2 k 1 r , Q A * = a r a + k t 2 r 1 , π R A * = a r a + k t 2 4 k 1 r ,
π P A * = r a a r + k t a a r k t 4 k r 1 2 .
Corollary 1.
(i) p A * t > 0 , Q A * t < 0 , π R A * t < 0 , π P A * t < 0 .
(ii) p A * r > 0 , Q A * r < 0 , π R A * r < 0 . If  a 2 > k 2 t 2 1 + r 1 r 3 , then  π P A * r > 0 ; if  a 2 < k 2 r 2 1 + r 1 r 3 , then  α P A * r < 0 .
(iii) p A * k < 0 , Q A * k < 0 , π R A * k < 0 , π P A * k < 0 .
Corollary 1 elucidates the influence of relevant parameters on the equilibrium results under the mode. According to Corollary 1 (i), as the delivery cost of restaurants increases, food prices rise, orders decrease, and both restaurant and platform profits decrease. This result is very intuitive. When the delivery cost of a restaurant increases, the restaurant will naturally raise food prices to compensate for the loss. The rise in food prices naturally leads to a decrease in orders. This leads to a simultaneous decrease in profits for both restaurants and platforms.
Corollary 1 (ii) indicates that as the commission rate increases, food prices increase, orders decrease, and restaurant profits decrease, but platform profits only increase when the market size is large. For restaurants, increasing commission rates on the platform will result in a loss of profits, and restaurants will naturally raise prices to maintain profits. However, a substantial decline in orders ultimately resulted in decreased profits for restaurants. For platforms, raising commission rates does not inherently lead to increased profitability. It is only when the market size is sufficiently large that increasing the commission rate becomes a more advantageous strategy. This finding presents an intriguing insight for platforms, as it enables them to calibrate commission rates based on restaurant sales.
Corollary 1 (iii) indicates that as the price sensitivity coefficient increases, food prices, sales volume, as well as restaurant and platform profits all decrease. This indicates that when consumers are more sensitive to food prices, it is not conducive to the growth of restaurant and platform revenue.

4.2. Mode B

In this mode, the profit functions of restaurants and platforms are as follows:
π R B = ( 1 r ) p Q B
π P B = ( r p + s ) Q B
In this framework, the decision-making process is segmented into two distinct stages. In the initial stage, the platform establishes the unit logistics price; in the subsequent stage, the restaurant sets the retail price. This structure gives rise to the following lemma:
Lemma 2.
The equilibrium results under mode B are as follows: 
p B * = a 2 k 2 r , s B * = a a r 2 k k r , π R B * = a 2 1 r 4 k r 2 2 , π P B * = a 2 4 k 2 r , Q B * = a 2 2 r .
Corollary 2.
(i) p B * r > 0 , Q B * r > 0 , s B * r < 0 , π R B * r > 0 , π P B * r > 0 .
(ii) p B * k < 0 ,   Q B * k = 0 ,   s B * k < 0 ,   π R B * k < 0 ,   π P B * k < 0 .
Corollary 2 describes the impact of relevant parameters on the equilibrium results under the mode. Corollary 2 (i) indicates that as the commission rate increases, food prices increase, orders increase, and restaurant and platform profits increase simultaneously. This is because when the platform increases the commission rate, restaurants will naturally raise food prices, but at the same time, the platform has lowered the delivery price. For consumers, the current takeaway order price is p B * + s B * . As p B * + s B * r < 0 indicated, when the commission rate increases, the takeaway order price decreases, leading to an increase in sales volume. For restaurants, as food prices rise and sales increase, profits naturally also increase. The corresponding platform profits will also increase. According to Corollary 2 (ii), as the price sensitivity coefficient increases, food prices decrease, and both restaurant and platform sales decrease. Interestingly, the order quantity has not changed ( Q B * k = 0 ).

4.3. Mode C

In mode C, the restaurant profit function is
π R C = p t c o Q C
In this framework, it is solely the responsibility of the restaurant to establish the retail price. This circumstance gives rise to the following lemma.
Lemma 3.
The equilibrium results under the mode C are as follows:
p C * = a + k c o + t 2 k , π R C * = c o k a + k t 2 4 k , π P C * = 0 , Q C * = a k c o + t 2 .
Corollary 3.
(i) p C * t > 0 , Q C * t < 0 , π R C * t < 0 .
(ii) p C * k < 0 ,  Q C * k < 0 ,  π R C * k < 0 .
(iii) p C * c o > 0 ,  Q C * c o < 0 ,  π R C * c o < 0 .
Corollary 3 elucidates the impact of pertinent parameters on the equilibrium outcomes within this framework. According to Corollary 3 (i), an increase in the delivery costs incurred by restaurants results in a corresponding rise in food prices; however, both sales and restaurant profits decline. The rationale underlying this observation is analogous to that presented in Corollary 1 and will not be further discussed here. The conclusion of Corollary 3 (ii) aligns with the findings of Corollaries 1 and 2, indicating that as the price sensitivity coefficient escalates, food prices, order volumes, and restaurant profits all diminish. Furthermore, Corollary 2 (iii) demonstrates that an increase in the processing cost per order at a restaurant leads to higher food prices, a reduction in order volumes, and a decline in restaurant profits. It is evident that, within this mode, restaurants should prioritize efforts to minimize order processing costs.

5. Comparative Analysis
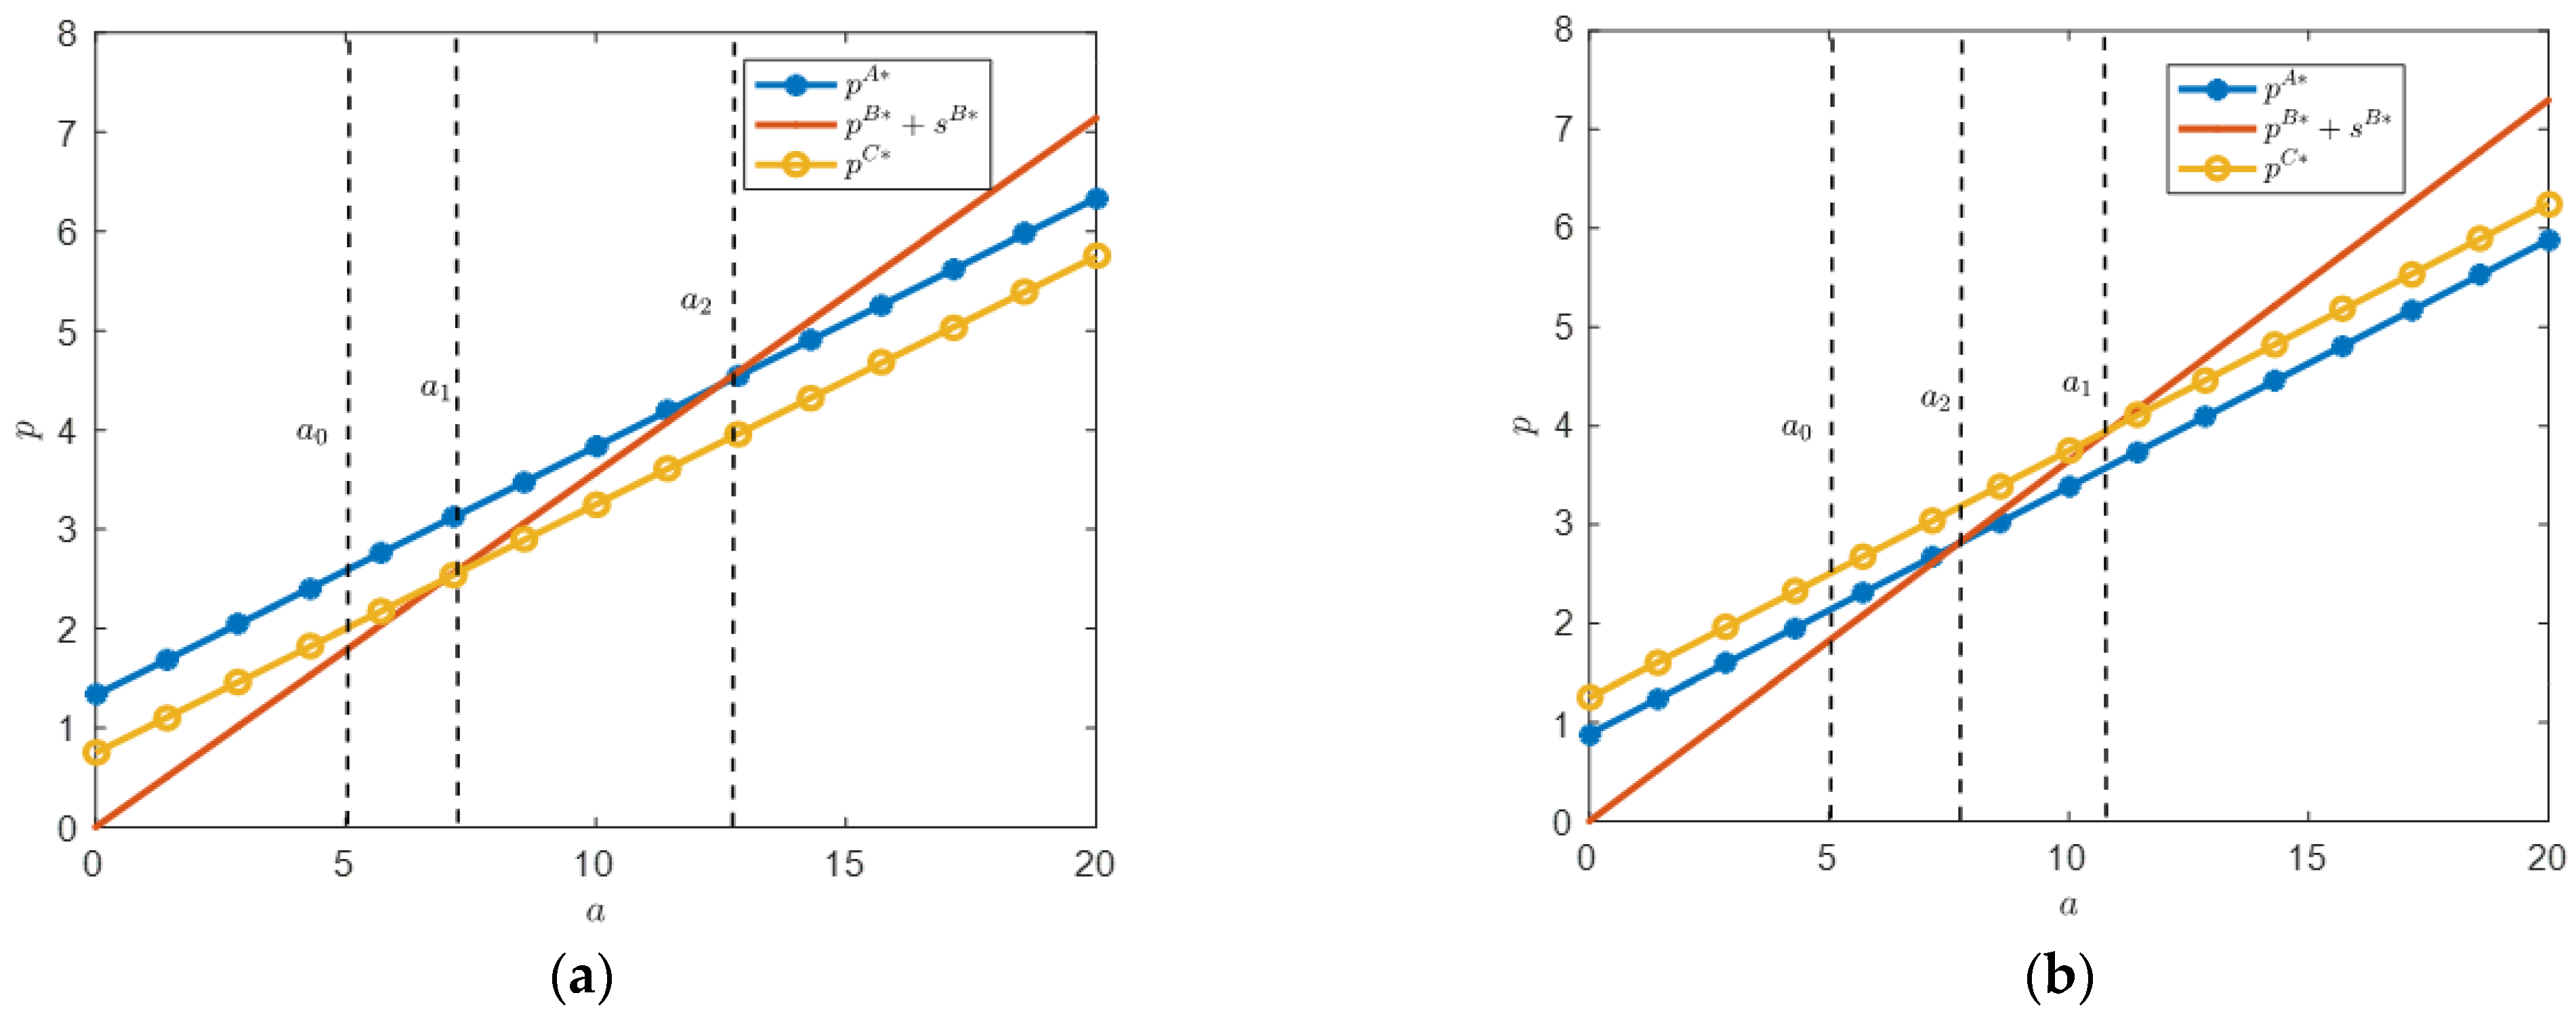
Proposition 1.
(i) When  r > c o c o + t , there is p A * > p C * > p B * . If a > a 2 , then p B * + s B * > p A * > p C * . If a 1 < a < a 2 , then p A * > p B * + s B * > p C * . If a 0 < a < a 1 , then p A * > p C * > p B * + s B * .
(ii) When  r < c o c o + t , there is  p C * > p A * > p B * . If  a > a 1 , then  p B * + s B * > p C * > p A * . If  a 2 < a < a 1 , then    p C * > p B * + s B * > p A * . If  a 0 < a < a 2 , then  p C * > p A * > p B * + s B * .
Where  a 1 = k c o + t r 2 r 1 ,  a 2 = k t 2 r r 1 2 .
Proposition 1 indicates the relationship between food prices under three modes. As shown in Proposition 1, the price under modes A and C is always greater than the price under mode B. This is because the order placement of modes A and C is handled by the restaurant for delivery, and the delivery cost is included in the food price. Under platform delivery, food prices and delivery prices are separated. So, the food prices are relatively low in mode B.
For both A and C, the relationship between food prices mainly depends on commission rates. When the commission rate is high, the price in mode A is higher than that in mode C. This discovery is based on the following facts. In mode A, due to the platform charging commissions, restaurants will naturally set higher food prices when the commission rate is high. In mode C, restaurants build their platforms, and food pricing is no longer troubled by commissions, resulting in naturally lower prices than in mode A. When the commission rate is low, the price in mode A is lower than that in mode C. This is mainly because restaurants have processing costs for each order on their platform. So, it will correspondingly increase food prices.
For consumers, in mode B, the expenditure cost of each order is the food price plus the delivery fee, that is, p B * + s B * . According to Proposition 1 (i), under the premise of a high commission rate, if the market size is large, the order cost under mode B is the highest, while the order cost under mode C is the lowest. If the market size is at a moderate level, the order cost is highest under mode A, while the order cost is still the smallest under mode C. If the market size is small, the order cost under mode A is still the highest, but the order cost under mode B is the smallest. In summary, when the commission rate is high and the market size is relatively large, mode C is most advantageous to consumers. If the market size is relatively small, mode B is most advantageous to consumers.
According to Proposition 1 (ii), when the commission rate is low and the market size is large, the order cost under mode B is the highest, while the order cost under mode A is the lowest. If the market size is at a moderate level, the order cost under mode C is the highest, and the order cost under mode A is still the smallest. If the market size is small, the order cost is highest under mode C and lowest under mode B. At this point, we find that when the market size is large, mode A is most advantageous to consumers. In addition, regardless of how the commission rate changes, mode B is most beneficial to consumers.
Figure 2 depicts the conclusion of Proposition 1. In addition, we find that as the market size increases, food prices gradually increase under the three modes. In other words, when restaurant food meets the tastes of more consumers, restaurants have the motivation to increase food prices.
Based on the conclusion of Proposition 1, we derive Proposition 2, as follows.
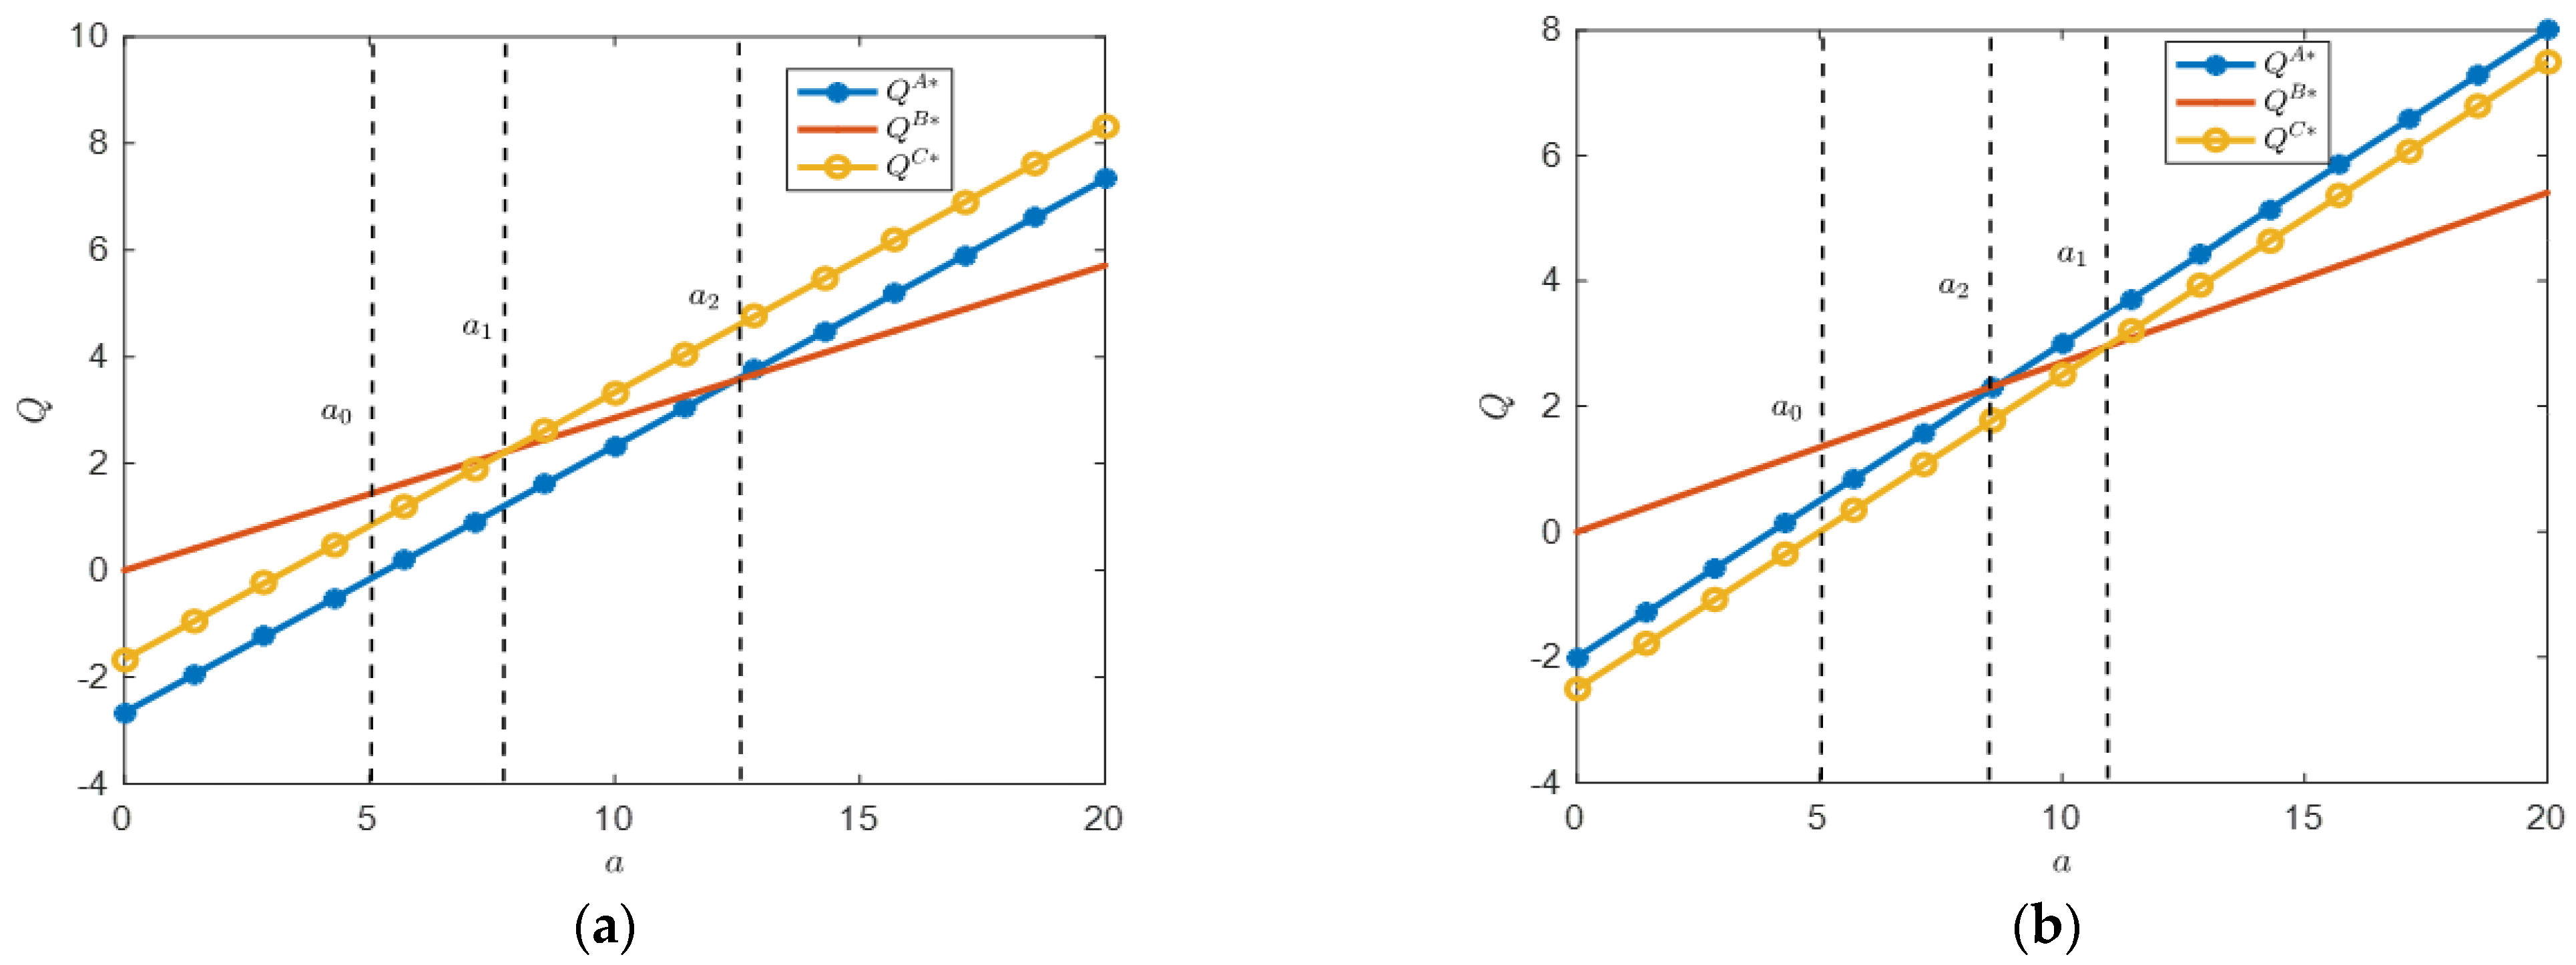
Proposition 2.
(i) When  r > c o c o + t , if  a > a 2 , then  Q B * < Q A * < Q C * ; if  a 1 < a < a 2 , then  Q A * < Q B * < Q C * . If  a 0 < a < a 1 , then  Q A * < Q C * < Q B * .
(ii) When  r < c o c o + t ,if  a > a 1 , then  Q B * < Q C * < Q A * ; if  a 2 < a < a 1 , then  Q C * < Q B * < Q A * ; if  a 0 < a < a 2 , then  Q C * < Q A * < Q B * .
Proposition 2 indicates the relationship between order quantities under three modes. It is easy to derive the conclusion of Proposition 2 from Proposition 1 because, under the premise of unchanged market size, the number of orders mainly depends on the order cost. Figure 3 depicts the impact of market size on food sales at different commission rates. For the sake of simplicity, we will not elaborate here.
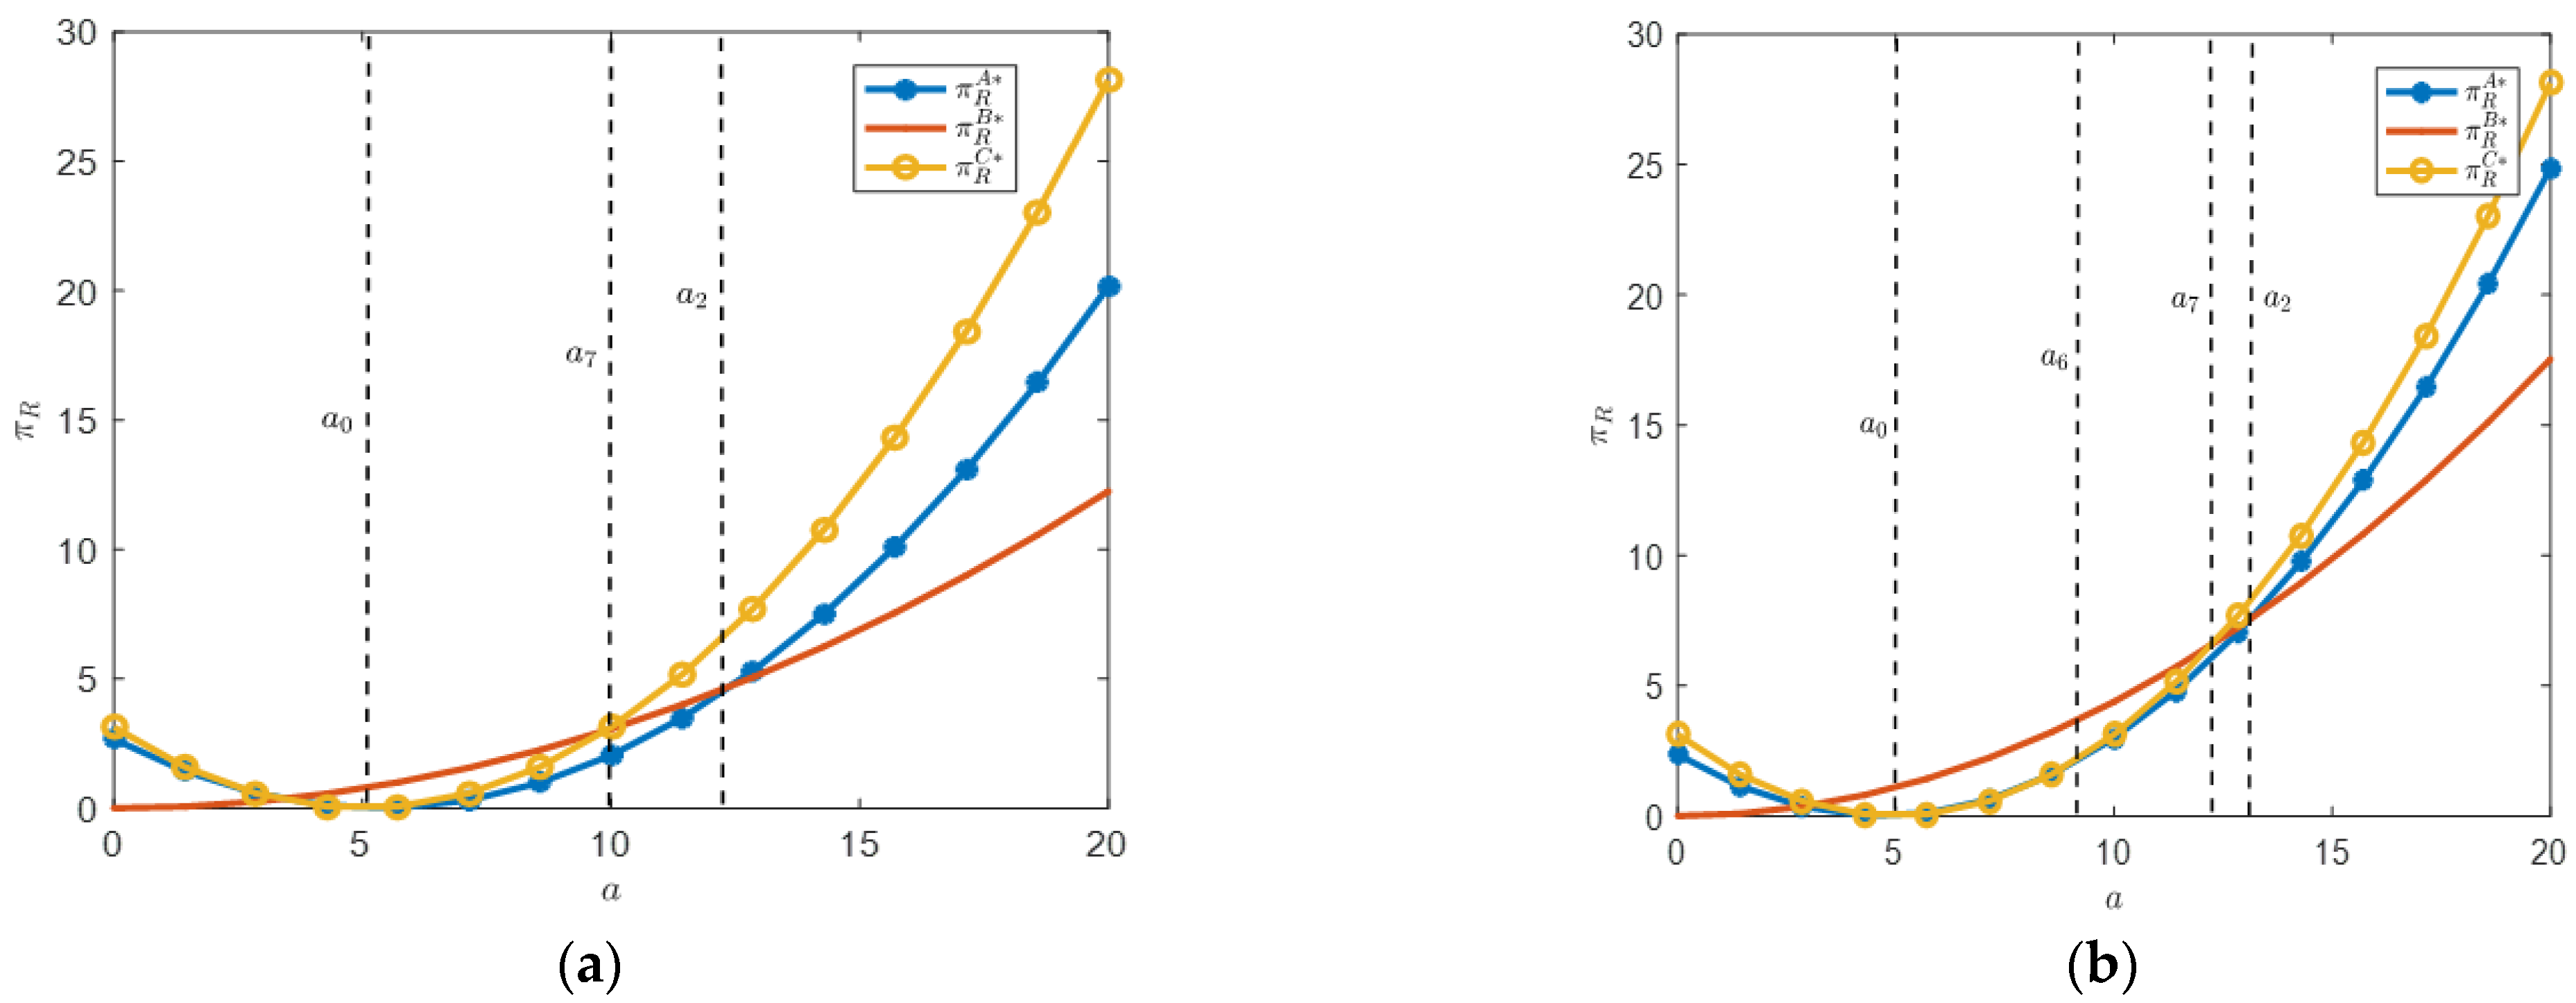
Proposition 3.
(i) When  r > c o c o + t , if  a 0 < a < a 7 , then  π R B * > π R C * > π R A * ; if  a 7 < a < a 2 , then  π R C * > π R B * > π R A * ; if   a > a 2 , then     π R C * > π R A * > π R B * .
(ii) When   r < c o c o + t , if  a 0 < a < a 6 , then   π R B * > π R A * > π R C * ; if   a 6 < a < a 7 , then   π R B * > π R C * > π R A * ; if   a 7 < a < a 2 , then  π R C * > π R B * > π R A * ; if   a > a 2 , then   π R C * > π R A * > π R B * .
Where  a 6 = k r c o c o r + r t c o 1 1 r ,  a 7 = k ( c o + t ) ( r 2 ) r 2 1 r r 2 3 r + 3 .
Proposition 3 indicates the relationship between restaurant profits under three modes. From Figure 3 (i), it can be seen that when the commission rate is high, as the market size increases from small to large, the pattern of restaurants achieving maximum profits starts from B to C. The minimum profit mode for restaurants is from A to B. This indicates that under the premise of a high commission rate on the platform, if the market size is small, restaurants should choose mode B. If the market size is large, restaurants should choose mode C. Therefore, enterprises should determine the delivery operation mode based on the size of the market.
Proposition 3 (ii) indicates that when the commission rate is small, as the market size gradually increases, the modes that generate the maximum restaurant profit still goes from B to C, and the modes that generate the minimum profit go from CAB. Based on Proposition 3 (i), it can be concluded that regardless of how the commission rate changes, mode B and mode C are the potential optimal choices for restaurants. Compared to mode B, mode A only has advantages when the market size is large.
Figure 4 clearly depicts the impact of market size on restaurant profits at different commission rates. We found that restaurant profits are a quadratic function of market size. When the market size exceeds a certain value, as the market size increases, restaurant profits gradually increase. When the market size is large enough, the relationship between restaurant profits under the three modes is satisfied π R C * > π R A * > π R B * ; as the market size continues to increase, the profit gap between the three modes gradually increases. That is to say, when the market size is large, restaurants have the motivation to build their platforms and provide delivery services.
Based on Propositions 1–3, Table 3 summarizes the operational modes corresponding to the maximum and minimum values of order costs, sales volume, and restaurant profitability under various combinations of market size and commission rates.

6. Extension

The establishment of independent food delivery platforms by merchants may result in a relatively smaller overall market size due to various factors, including resource dispersion, inefficiency, and user habits. In this section, we consider the scenario where the market size decreases when a restaurant builds its platform. When a restaurant opens a shop on a food delivery platform, the market size is a , while when it builds its platform, the market size becomes v a , and 0 < v < 1 . We use C ¯ to represent the situation where the market size of self-built restaurant platforms has decreased. At this point, the market demand is Q C ¯ = v a p , and the restaurant profit function is:
π R C ¯ = ( p t c o ) Q C ¯
From this, we obtain Lemma 4.
Lemma 4.
The equilibrium results in the situation are as follows:
p C ¯ * = ν a + k c o + t 2 k ,  π R C ¯ * = c o k ν a + k t 2 4 k ,   Q C ¯ * = ν a k c o + t 2 .
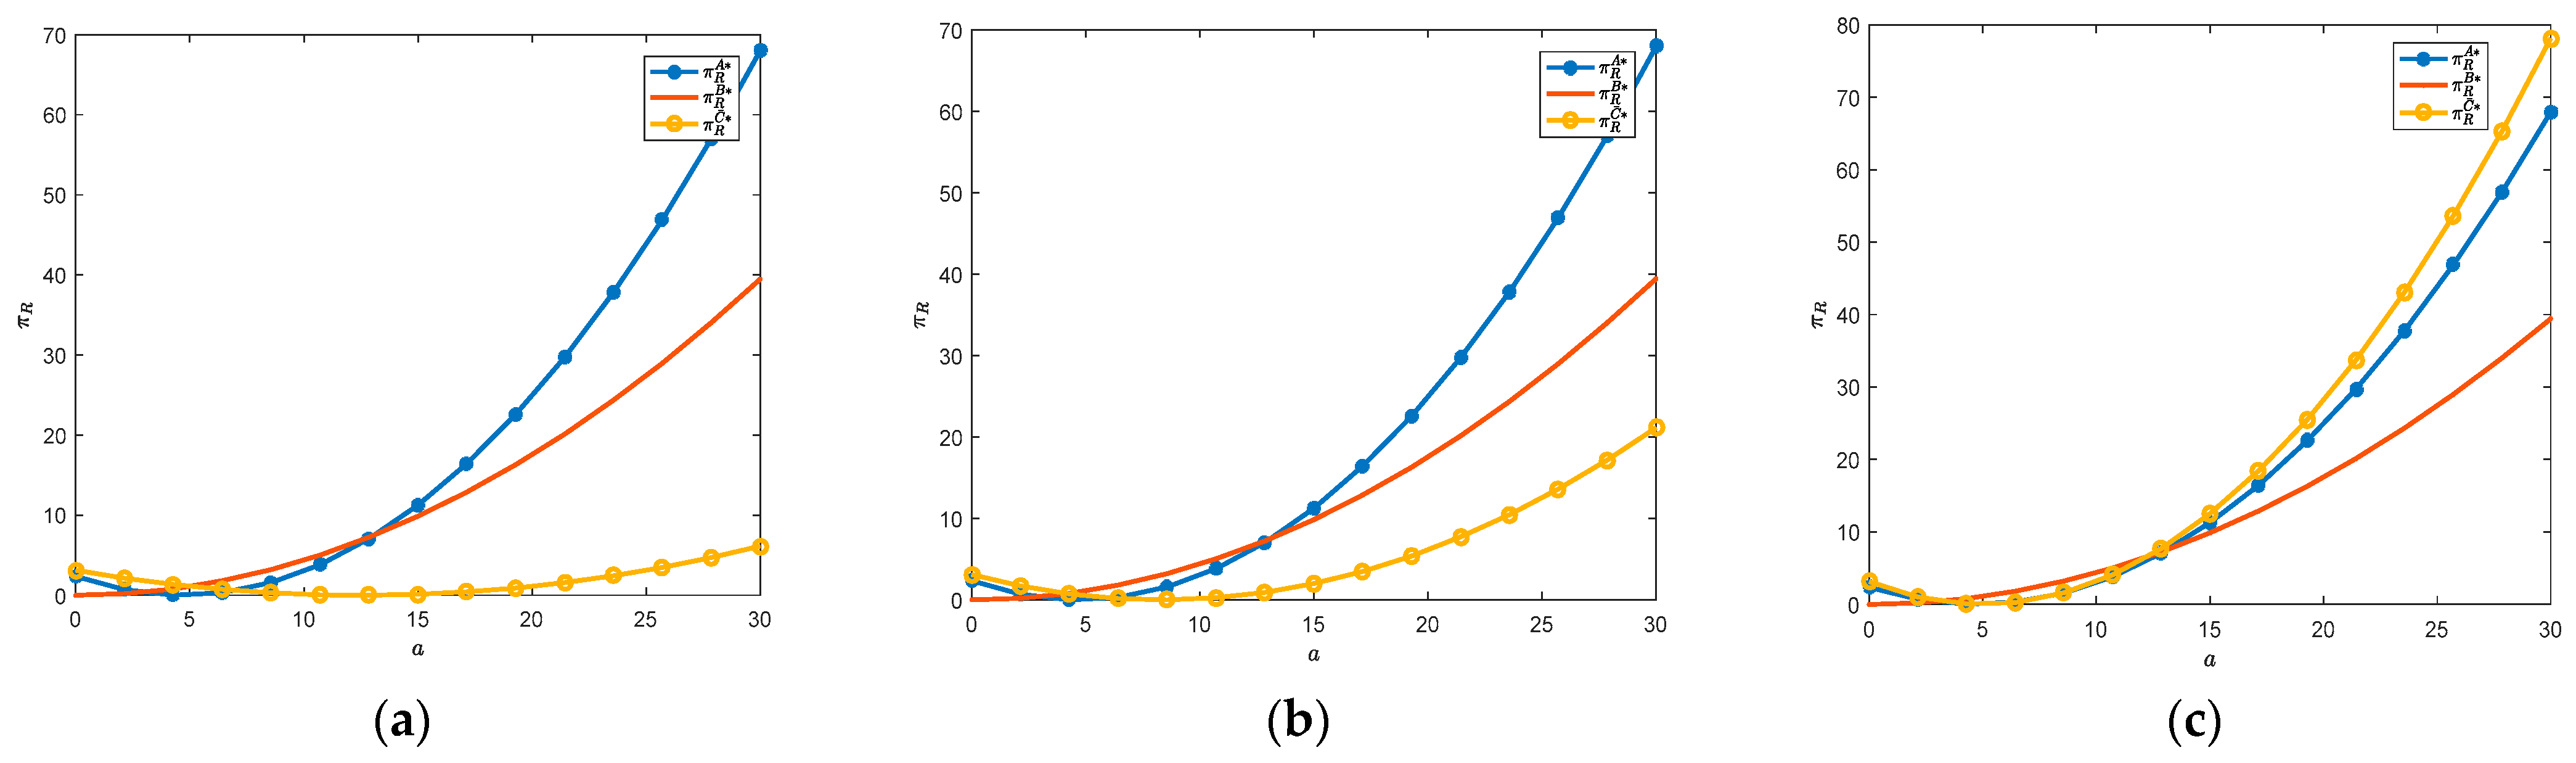
Subsequently, we employ numerical analysis to compare the relationship between restaurant profits under the specified scenario and those under alternative modes A and B. By utilizing the parameters t = 2 , c o = 0.5 , k = 2 , r = 0.15 , we derive Figure 5.
As shown in Figure 5a,b, when v is small, it indicates that the restaurant’s self-built platform has led to a significant reduction in market size. At this point, in the case of a large original market size, the restaurant has the highest profit under mode A. The restaurant has the smallest profit under mode C. That is to say, if the restaurant’s self-built platform leads to a significant reduction in market size, mode A should be the optimal choice for the restaurant. Figure 5c indicates that when v is large, the market size of restaurant self-built platforms does not shrink much. At this point, in the case of a large original market size, the restaurant has the highest profit under mode C. The restaurant has the smallest profit under mode B. From this, it can be seen that if the restaurant’s self-built platform has sufficient traffic, mode C is still the optimal choice for the restaurant.

7. Conclusions

7.1. Summary of Findings

This paper constructs an analysis framework that includes a restaurant and a food delivery platform for the operation modes A, B, and C of restaurant food delivery. The optimal decisions and profits of the restaurant and platform under each operation mode are obtained and compared. Our analysis indicates that when the market size is small, mode B results in the lowest ordering costs, the highest sales volume, and the maximum profit. Conversely, in the context of a large market size, if the commission rate is low, mode A minimizes the ordering costs and maximizes sales volume; if the commission rate is high, mode C minimizes the ordering costs while also achieving the highest sales volume. Notably, we find that as long as the market size is sufficiently large, mode C consistently yields the highest restaurant profits. The research results of this paper enrich the theory of operation and management of food delivery platforms and provide theoretical guidance and decision support for the selection of operation modes for food delivery restaurants.

7.2. Practical and Managerial Implications

First, when restaurants encounter a small market size, they should prioritize mode B (delivery platform + platform delivery). Under this mode, restaurants can leverage the platform’s delivery network to reduce their own delivery costs. Additionally, due to the scale effects of the platform, they can achieve lower ordering costs and higher sales volume, thereby maximizing profits.
Second, in the context of a large market size, restaurants must adjust their operational modes based on the commission rates of the delivery platform. If the commission rate is low, mode A (delivery platform + restaurant delivery) may be the more advantageous choice, as it allows restaurants to control the delivery process, reduce platform fees, and consequently lower ordering costs while increasing sales volume. Conversely, if the commission rate is high, it is advisable to consider mode C (self-built platform + delivery), as it offers the greatest profit margin.
Third, for restaurants aiming to maximize long-term profits, mode C represents a viable long-term strategy if they can expand market size through marketing and brand development initiatives. Although the initial investment in building a self-operated platform may be substantial, mode C is likely to yield sustained profit advantages as market size increases.
Finally, restaurants should maintain operational flexibility by adjusting their strategies in response to market fluctuations and external conditions, such as changes in commission rates and consumer preferences. This may involve dynamically adapting or employing a combination of different operational modes under varying market sizes and commission rate scenarios.

7.3. Limitations and Future Research

This study provides a comprehensive analysis of restaurant food delivery operation modes, yet it has certain limitations that suggest avenues for future research. Two primary aspects that were not fully explored in this paper and that warrant further investigation are the impact of food quality on sales and the issue of dynamic pricing in the food delivery market. By addressing these limitations, future research can provide a more nuanced understanding of the factors that influence the food delivery market and offer more tailored strategies for restaurants and platforms to compete effectively.

Author Contributions

H.L.: Writing—original draft. R.L.: Writing—review and editing. L.L.: Funding acquisition, Formal analysis. S.S.: Investigation, Funding acquisition. Y.L.: Visualization, Resources. C.Z.: Formal analysis, Conceptualization. Y.Y.: Formal analysis, Conceptualization. All authors have read and agreed to the published version of the manuscript.

Funding

This research was funded by the Scientific Research Team Plan of Zhengzhou University of Aeronautics (no. 23ZHTD01013) and the Science and Technology Research Project of Henan Province (no. 242102320308).

Data Availability Statement

Data sharing does not apply to this article.

Acknowledgments

The authors express gratitude for the hard work of the reviewers.

Conflicts of Interest

The authors declare that they have no known competing financial interests or personal relationships that could have appeared to influence the work reported in this paper.

Appendix A

Proof of Lemma A1.
Since 2 π R A p A 2 = 2 k ( r 1 ) < 0 , it is known that π R A is a concave function with respect to p A , and there exists a unique maximum value. Let π R A p A = 0 ; we obtain the optimal retail price p A * = a a r + k t 2 k 1 r . From this, we can infer π R A * , π P A * , Q A * . □
Proof of Lemma A2.
According to 2 π R B p 2 = 2 k ( r 1 ) < 0 , we know that π R B is concave in p . Let π R B p = 0 ; we obtain p ( s ) = α k s 2 k . Substituting p ( s ) into the platform profit function π P B , we obtain 2 π P B s 2 = k r 2 1 < 0 , and know π P B is concave in s . Let π P B s = 0 ; we obtain the optimal unit logistics price s B * = a a r 2 k k r . Substitute s B * into p ( s ) , and we obtain p B * = a 2 k ( 2 r ) . From this, π R B * , π P B * , Q B * can be obtained. □
Proof of Lemma A3.
In this operational mode, it is solely the merchant who is responsible for determining the retail price. From 2 π R C p 2 = 2 k < 0 , we know π R C is concave in p . Let π R C p C = 0 ; we obtain the optimal retail price p C * = a + k ( c o + t ) 2 k . From this, we obtain π R C * , π P C * , Q C * . □
Proof of Corollary A1.
(i) p A * t = 1 2 1 r > 0 , p A * t = k 2 r 1 < 0 , π R A * t = a r a + k t 2 1 r < 0 , π P A * t = k r t 2 1 r 2 < 0 .
(ii) p A * r = t 2 1 r 2 > 0 , Q A * r = k t 2 r 1 2 < 0 , π R A * r = ( a r a + k t ) ( a r a k t ) 4 k 1 r 2 < 0 . Since π P A * r = r 1 3 a 2 + r + 1 k 2 t 2 4 k r 1 3 , we see that if a 2 > k 2 t 2 1 + r 1 r 3 , then π P A * r > 0 ; if a 2 < k 2 t 2 1 + r 1 r 3 , then π P A * r < 0 .
(iii) p A * k = a 2 k 2 < 0 , Q A * k = t 2 r 1 < 0 , π R A * k = a r a + k t a r a k t 4 k 2 r 1 < 0 , π P A * k = r a r + 1 2 + k 2 t 2 4 k 2 1 r 2 < 0 . □
Proof of Corollary A2.
(i) p B * r = a 2 k r 2 2 > 0 , Q B * r = a 2 r 2 2 2 > 0 , π R B * r = a 2 3 r 2 6 r + 2 4 k r 2 2 r + 2 3 > 0 , π P B * r = a 2 4 k r 2 2 > 0 .
(ii) p B * k = a 2 4 k 2 r 2 < 0 , Q B * k = 0 , π R B * k = a 2 r 1 4 k 2 r 2 2 r + 2 2 < 0 , π P B * k = a 2 r 1 4 k 2 r 2 2 < 0 .
(iii) s B * r = a k r 2 2 < 0 , s B * k = a r 1 k 2 r 2 < 0 , p B * + s B * r = a 2 k r 2 2 < 0 . □
Proof of Corollary A3.
(i) p C * t = 1 2 > 0 , Q C * t = k 2 < 0 , π R C * t = a c o k k t 2 < 0 .
(ii) p C * k = a 2 k 2 < 0 , p C * k = a 2 k 2 < 0 , π R C * k = a + c o k + k t a c o k k t 4 k 2 < 0 .
(iii) π R C * c o = a c o k k t 2 < 0 , p C * c o = 1 2 > 0 , Q C * c o = k 2 < 0 . □
Proof of Proposition A1.
From p B * p A * = 1 2 r + r 2 a + 2 r k t 2 k r 1 r 2 < 0 and p B * p C * = k ( c o + t ) ( r 2 ) 1 r < 0 , we obtain p B * < p A * and p B * < p C * . Since p A * p C * = c o r c o + r t 2 ( 1 r ) , we find that if r > c o c o + t , then p A * > p C * ; if r < c o c o + t , then   p A * < p C * . Thus, if r > c o c o + t , then p A * > p C * > p B * ; if r < c o c o + t , then p C * > p A * > p B * .
According to p B * + s B * p C * = ( r 1 ) a + 2 c o k + 2 k t c o k r k r t 2 k ( r 2 ) > 0 , we obtain a > k ( c o + t ) ( r 2 ) r 1 = a 1 . Next, we verify whether a 1 > a 0 and the following two situations are discussed:
(1) If r > c o c o + t , there is a 0 = k t 1 r . Thus, we have a 1 a 0 = k c o r 2 + t r 1 r 1 > 0 , that is a 1 > a 0 .
(2) If r < c o c o + t , there is a 0 = k t + c o . Thus, we have a 1 a 0 = k c o + r r 1 > 0 , that is a 1 > a 0 . According to p B * + s B * p A * = r 1 2 a + r 2 k t 2 k r 1 r 2 > 0 , we get a > k r 2 r r 1 2 = a 2 . Next, we verify whether a 2 > a 0 holds true and the following two situations are discussed:
(3) If r > c o c o + t , there is a 0 = k t 1 r . Thus, we obtain a 2 a 0 = k t r 1 2 > 0 , that is a 2 > a 0 .
(4) If r < c o c o + t , then a 0 = k t + c o . Thus, we have a 2 a 0 = k g 1 ( t ) r 1 2 , where g 1 t = r 2 r 1 t + c o r 2 2 c o r + c o . Because of t > c o , we obtain g 1 t < g 1 c o = c o r 2 r 3 < 0 . Therefore, we conclude that a 2 > a 0 . From a 2 a 1 = k r 2 c o c o r r t r 1 2 , we know if r > c o c o + t , then a 2 > a 1 ; if r < c o c o + t , then a 2 < a 1 .
In conclusion, Proposition 1 is proven. □
Proof of Proposition A2.
Firstly, we compare π R A * and π R B * . We find π R A * π R B * = h 1 ( a ) 4 k 1 r r 2 2 , where h 1 a = 3 a 4 a r 2 k t + a r 2 + k r t a 2 a r 2 k t + a r 2 + k r t and h 1 a is a quadratic function of a , with an upward opening. Let h 1 a = 0 ; we can obtain two roots a 3 = k t ( 2 r ) r 1 2 , a 4 = k t ( 2 r ) r 2 4 r + 3   and   a 3 a 4 = 2 k t ( r 2 ) r 3 1 r 2 > 0 . If r > c o c o + t , there is a 0 = k t 1 r . Thus, we have a 4 a 0 = k t ( r 1 ) ( r 3 ) < 0 , that is a 4 < a 0 . If r < c o c o + t , then a 0 = k t + c o . Thus, we can obtain a 4 a 0 = k g 2 t r 1 r 3 , where g 2 t = r 2 3 r + 1 t + c o r 2 4 c o r + 3 c o . From g 2 t > g 2 c o = 2 r 2 7 r + 4 c o > 0 , we know a 4 < a 0 .
Because of a 3 = a 2 and a 2 > a 0 , therefore, when   a 0 < a < a 2 , there is π R A * < π R B * ; when a > a 2 , there is π R A * > π R B * . When a 0 < a < a 6 , there is π R A * > π R C * ; when a > a 6 , there is π R A * < π R C * .
Therefore, when   a 0 < a < a 7 , then π R B * > π R C * ; when a > a 7 , then π R B * < π R C * .
Next, we compare π R A * and π R C * . We find π R A * π R C * = h 2 ( a ) 4 k ( 1 r ) , where h 2 ( a ) = a 2 1 + r r k 2 r t 2 k 1 + r c o 2 a + 2 k t + k c o and h 2 ( a ) is a quadratic function of a with an opening facing downwards. Let h 2 ( a ) = 0 , we can obtain two roots a 5 = k r c o + c o r + r t c o 1 1 r , a 6 = k r c o c o r + r t c o 1 1 r . If r > c o c o + t , we can obtain a 5 > a 6 and a 0 = k t 1 r , which consequently leads to the conclusion that a 6 < a 5 < a 0 . Therefore, when a > a 0 , we obtain π R A * < π R C * . If r < c o c o + t , then a 5 < a 6 and a 0 = k t + c o , and we infer that a 5 < a 0 < a 6 . Therefore, if a 0 < a < a 6 , then π R A * > π R C * ; if a > a 6 , there is π R A * < π R C * .
Finally, we compare π R B * and π R C * . π R B * π R C * = h 3 ( a ) 4 k ( r 2 ) 2 , where h 3 ( a ) = a 2 3 + 3 + r r + 2 a k 2 + r 2 t k 2 2 + r 2 t 2 + k c o 2 a 2 + r 2 + 8 k 1 + r t 2 k r 2 t c o , and we can obtain two roots a 7 = k ( c o + t ) ( r 2 ) r 2 1 r r 2 3 r + 3 , a 8 = k ( c o + t ) ( r 2 ) r 2 + 1 r r 2 3 r + 3 . Below, we demonstrate the size relationship between a 8 and a 0 .
If r > c o c o + t , then a 0 = k t 1 r . So, we have a 8 a 0 = k g 3 ( t ) r 1 r 2 3 r + 3 , where g 3 t = ( r 2 ) ( r 1 ) r + 1 r 2 c o + r r r + 1 r 4 3 1 r + 5 + 2 1 r 1 t , and g 3 t is an increasing function of t . We can infer that g 3 ( t ) > g 3 ( c o ) = 5 + 4 1 r + r 13 6 1 r + r 9 + 2 1 r + 2 r c o > 0 . Therefore, we obtain a 8 < a 0 .
If r < c o c o + t , then a 0 = k t + c o . Thus, we have a 8 a 0 = k c o + t r 1 r 2 1 r + 1 r r 2 3 r + 3 < 0 , that is a 8 < a 0 .
Below, we demonstrate the size relationship between a 7 and a 0 .
If r > c o c o + t , there is a 0 = k t 1 r . Thus, we have a 7 a 0 = k g 4 t r 1 r 2 3 r + 3 , where g 4 t = r r 2 1 r + 4 r + 3 1 r + 5 2 1 r 1 t r + 1 r + 2 ( r 2 ) ( r 1 ) c o , and g 4 t is the decreasing function of t . We can infer that g 4 ( t ) < g 4 ( c o ) = r r 2 r + 2 1 r + 9 6 1 r 13 + 4 1 r + 5 c o < 0 . Therefore, we conclude that a 7 > a 0 .
If r < c o c o + t , then a 0 = k t + c o . Thus, there is a 7 a 0 = k c o + t r + r 1 r 2 1 r 1 r 2 3 r + 3 > 0 . Therefore, if a 0 < a < a 7 , then π R B * > π R C * ; if a > a 7 , then π R B * < π R C * .
In summary, Proposition 3 is proven. □

Note

1

References

  1. Xia, Y.; Xie, J.; Zhu, W.; Liang, L. Pricing Strategy in the Product and Service Market. J. Manag. Sci. Eng. 2021, 6, 211–234. [Google Scholar] [CrossRef]
  2. Wei, H.; Zhang, L.; Deng, P.; Li, G. Two Tales of Platform Regimes in China’s Food-Delivery Platform Economy. J. Chin. Sociol. 2022, 9, 11. [Google Scholar] [CrossRef] [PubMed]
  3. Sun, X.; Xiang, J.; Gou, J.Q. China’s ShuHai: Digital Transition in the Catering Supply Chain Services. In DIGITAL Enablement and Innovation in China: A Casebook; World Scientific: London, UK, 2019; pp. 83–88. [Google Scholar]
  4. Duthie, C.; Pocock, T.; Curl, A.; Clark, E.; Norriss, D.; Bidwell, S.; McKerchar, C.; Crossin, R. Online on-demand delivery services of food and alcohol: A scoping review of public health impacts. SSM-Popul. Health 2023, 21, 101349. [Google Scholar] [CrossRef]
  5. Zhao, Y.; Bacao, F. Factors Determining Continuous Use of Food Delivery Apps During the 2019 Novel Coronavirus Pandemic. Int. J. Hosp. Manag. 2020, 91, 102683. [Google Scholar] [CrossRef]
  6. Pan, S.Y.; Nie, Q.; Tai, H.C.; Song, X.L.; Tong, Y.F.; Zhang, L.J.; Wu, X.W.; Lin, Z.H.; Zhang, Y.Y.; Ye, D.Y.; et al. Tea and Tea Drinking: China’s Outstanding Contributions to the Mankind. Chin. Med. 2022, 17, 27. [Google Scholar] [CrossRef]
  7. Feng, Q.; Li, M.; Hu, X.; Deng, F. Digital infrastructure expansion and carbon intensity of small enterprises: Evidence from China. J. Environ. Manag. 2024, 366, 121742. [Google Scholar] [CrossRef]
  8. Yao, S. Design of Brand Business Model Based on Big Data and Internet of Things Technology Application. Comput. Intell. Neurosci. 2022, 2022, 9189805. [Google Scholar] [CrossRef]
  9. Liu, M.; Du, S.; Nie, T.; Zhu, Y. Pricing, Channel Design, and Platform Operations with Buy-Online-and-Pick-up-in-Store in Online Food Delivery Market. Int. J. Prod. Econ. 2024, 274, 109293. [Google Scholar] [CrossRef]
  10. Tandon, A.; Kaur, P.; Bhatt, Y.; Mäntymäki, M.; Dhir, A. Why Do People Purchase from Food Delivery Apps? A Consumer Value Perspective. J. Retail. Consum. Serv. 2021, 63, 102667. [Google Scholar] [CrossRef]
  11. Malter, M.S.; Holbrook, M.B.; Kahn, B.E.; Parker, J.R.; Lehmann, D.R. The Past, Present, and Future of Consumer Research. Mark. Lett. 2020, 31, 137–149. [Google Scholar] [CrossRef]
  12. Seghezzi, A.; Winkenbach, M.; Mangiaracina, R. On-Demand Food Delivery: A Systematic Literature Review. Int. J. Logist. Manag. 2021, 32, 1334–1355. [Google Scholar] [CrossRef]
  13. Mahajan, Y.; Mahajan, V.; Kapse, M. Marketing Analytics and Consumer Behavior: A Systematic Literature Review for Future Research Agenda. In Data-Driven Decision Making; Springer: New York, NY, USA, 2024; pp. 151–167. [Google Scholar]
  14. Yang, J.; Lau, H.C.; Wang, H. Optimization of Customer Service and Driver Dispatch Areas for On-Demand Food Delivery. Transp. Res. Part C Emerg. Technol. 2024, 165, 104653. [Google Scholar] [CrossRef]
  15. Ke, J.; Wang, C.; Li, X.; Tian, Q.; Huang, H.-J. Equilibrium Analysis for On-Demand Food Delivery Markets. Transp. Res. Part E Logist. Transp. Rev. 2024, 184, 103467. [Google Scholar] [CrossRef]
  16. Ma, B.; Wong, Y.D.; Teo, C.-C.; Sun, S. Quantifying Consumers’ Cost-Value Trade-Offs on on-Demand Food Delivery Services: Value-of-Time Framework and Partitioned Pricing. J. Retail. Consum. Serv. 2024, 81, 104027. [Google Scholar] [CrossRef]
  17. Liu, Y.; Li, S. An Economic Analysis of On-Demand Food Delivery Platforms: Impacts of Regulations and Integration with Ride-Sourcing Platforms. Transp. Res. Part E Logist. Transp. Rev. 2023, 171, 103019. [Google Scholar] [CrossRef]
  18. Ji, X.; Li, X.; Wang, S. Balance between Profit and Fairness: Regulation of Online Food Delivery (OFD) Platforms. Int. J. Prod. Econ. 2024, 269, 109144. [Google Scholar] [CrossRef]
  19. Wang, X.; Li, R.; Li, W.; Liu, Z. Benefit Distribution of Guaranteed Water Saving Management Contract Based on Principal-Agent Theory. Int. J. Gen. Syst. 2024, 53, 426–452. [Google Scholar] [CrossRef]
  20. Jian, J.; Li, B.; Zhang, N.; Su, J. Decision-Making and Coordination of Green Closed-Loop Supply Chain with Fairness Concern. J. Clean. Prod. 2021, 298, 126779. [Google Scholar] [CrossRef]
  21. Hadadi, Z.; Gholamian, M.R.; Noroozi, M. The Sale Services, Bundling, and Jointly Advertising Strategies under Profit Sharing Contract in Closed-Loop Competitive Supply Chain. Eur. J. Ind. Eng. 2024, 18, 157–190. [Google Scholar] [CrossRef]
  22. Das, R.; Barman, A.; Roy, B.; De, P.K. Pricing and Greening Strategies in a Dual-Channel Supply Chain with Cost and Profit Sharing Contracts. Environ. Dev. Sustain. 2023, 25, 5053–5086. [Google Scholar] [CrossRef]
  23. Karaca, O.; Delikaraoglou, S.; Hug, G.; Kamgarpour, M. Enabling Inter-Area Reserve Exchange through Stable Benefit Allocation Mechanisms. Omega 2022, 113, 102711. [Google Scholar] [CrossRef]
  24. Chen, J.-F.; Wang, L.; Ren, H.; Pan, J.; Wang, S.; Zheng, J.; Wang, X. An Imitation Learning-Enhanced Iterated Matching Algorithm for on-Demand Food Delivery. IEEE Trans. Intell. Transp. Syst. 2022, 23, 18603–18619. [Google Scholar] [CrossRef]
  25. Shankar, A.; Jebarajakirthy, C.; Nayal, P.; Maseeh, H.I.; Kumar, A.; Sivapalan, A. Online Food Delivery: A Systematic Synthesis of Literature and a Framework Development. Int. J. Hosp. Manag. 2022, 104, 103240. [Google Scholar] [CrossRef]
  26. Wang, X.; Wang, L.; Dong, C.; Ren, H.; Xing, K. Reinforcement Learning-Based Dynamic Order Recommendation for on-Demand Food Delivery. Tsinghua Sci. Technol. 2023, 29, 356–367. [Google Scholar] [CrossRef]
  27. Steever, Z.; Karwan, M.; Murray, C. Dynamic Courier Routing for a Food Delivery Service. Comput. Oper. Res. 2019, 107, 173–188. [Google Scholar] [CrossRef]
  28. Ulmer, M.W.; Thomas, B.W.; Campbell, A.M.; Woyak, N. The Restaurant Meal Delivery Problem: Dynamic Pickup and Delivery with Deadlines and Random Ready Times. Transp. Sci. 2021, 55, 75–100. [Google Scholar] [CrossRef]
  29. Teng, R.; Xu, H.; Jin, K.; Luo, T.; Wang, L.; Xing, L. Optimisation of Takeaway Delivery Routes Considering the Mutual Satisfactions of Merchants and Customers. Comput. Ind. Eng. 2021, 162, 107728. [Google Scholar] [CrossRef]
  30. Zheng, J.; Wang, L.; Chen, J.; Wang, X.; Liang, Y.; Duan, H.; Li, Z.; Ding, X. Dynamic Multi-Objective Balancing for Online Food Delivery via Fuzzy Logic System-Based Supply–Demand Relationship Identification. Comput. Ind. Eng. 2022, 172, 108609. [Google Scholar] [CrossRef]
  31. Simoni, M.D.; Winkenbach, M. Crowdsourced On-Demand Food Delivery: An Order Batching and Assignment Algorithm. Transp. Res. Part C Emerg. Technol. 2023, 149, 104055. [Google Scholar] [CrossRef]
  32. Niu, B.; Li, Q.; Mu, Z.; Chen, L.; Ji, P. Platform Logistics or Self-Logistics? Restaurants’ Cooperation with Online Food-Delivery Platform Considering Profitability and Sustainability. Int. J. Prod. Econ. 2021, 234, 108064. [Google Scholar] [CrossRef]
  33. Kim, S.H.; Do Chung, B. Integrated Food Delivery Problem Considering Both Single-Order and Multiple Order Deliveries. Comput. Ind. Eng. 2024, 196, 110458. [Google Scholar] [CrossRef]
  34. Du, Z.; Fan, Z.-P.; Chen, Z. Implications of On-Time Delivery Service with Compensation for an Online Food Delivery Platform and a Restaurant. Int. J. Prod. Econ. 2023, 262, 108896. [Google Scholar] [CrossRef]
  35. Chan, H.L.; Cheung, T.T.; Choi, T.M.; Sheu, J.B. Sustainable Successes in Third-Party Food Delivery Operations in the Digital Platform Era. Ann. Oper. Res. 2023, 1–37. [Google Scholar] [CrossRef]
  36. Xing, P.; He, T.-R. Research on Quality Efforts Strategies for O2O Delivery Service Supply Chain under Three Operating Models. Chin. Manag. Sci. 2020, 28, 115–126. [Google Scholar]
Figure 1. Research framework of this study.
Systems 12 00536 g001
Figure 2. The impact of market size on food prices. (a) r > c o c o + t t = 2 , c o = 0.5 , k = 2 , r = 0.25 ; (b) r < c o c o + t t = 2 , c o = 0.5 , k = 2 , r = 0.15 .
Systems 12 00536 g002
Figure 3. The impact of market size on food sales. (a) r > c o c o + t t = 2 , c o = 0.5 , k = 2 , r = 0.25 ; (b) r < c o c o + t t = 2 , c o = 0.5 , k = 2 , r = 0.15 .
Systems 12 00536 g003
Figure 4. The impact of market size on restaurant profits. (a) r > c o c o + t t = 2 , c o = 0.5 , k = 2 , r = 0.25 ; (b) r < c o c o + t t = 2 , c o = 0.5 , k = 2 , r = 0.15 .
Systems 12 00536 g004
Figure 5. The impact of market size on restaurant profits under different v. (a) v = 0.4; (b) v = 0.6; (c) v = 0.8.
Systems 12 00536 g005
Table 1. Comparison between this study and closely related research.
Market SizeCommission RateOperation Strategy
Platform + Restaurant DeliveryPlatform + Platform DeliverySelf-Built Platform + Delivery
Ke et al. [15]
Liu et al. [9]
Liu and Li [17]
Shankar et al. [25]
Du et al. [34]
Niu et al. [32]
This paper
Table 2. Notations and descriptions.
NotationDescription
kPrice sensitivity coefficient
rCommission rate
aMarket size of food delivery orders
sPlatform delivery price
tThe unit delivery cost incurred by the restaurant during self-delivery
pProduct price
coUnit order processing cost in mode C
Q j The demand in scenario j , j A , B , C , C ¯
π i j The profit of i in scenario j , i R , P , j A , B , C , C ¯
Superscript
A, B, CThree operation modes of takeaway restaurants
C ¯ The scenario in which the market size for restaurant-built platforms and delivery services diminishes
* Equilibrium outcome
Subscript
RFood delivery restaurant
PPlatform
Table 3. Summary of Propositions 1–3.
Order CostsSales VolumeRestaurant Profitability
MaximumMinimumMaximumMinimumMaximumMinimum
Small market size with low commission ratesCBBCBC
Small market size with high commission ratesABABBA
High market size with low commission ratesBAABCB
High market size with high commission ratesBCCBCB
Disclaimer/Publisher’s Note: The statements, opinions and data contained in all publications are solely those of the individual author(s) and contributor(s) and not of MDPI and/or the editor(s). MDPI and/or the editor(s) disclaim responsibility for any injury to people or property resulting from any ideas, methods, instructions or products referred to in the content.

