Abstract
This paper constructs a digital technology multilayer convergence network model to explore the mechanisms of digital technology convergence. The analysis is based on patent data from China’s A-share listed companies from 2012 to 2021. The results show a continuous increase in network scale and structural complexity, with intensified cross-domain interactions. The company collaboration subnetwork evolved from decentralization to a more centralized structure, while the technology convergence subnetwork expanded and became increasingly complex. Core technologies maintained dominant positions, and the co-evolution between companies and technologies showed sustained development. This study reveals intricate interdependencies between technological convergence and company collaboration, providing theoretical insights and practical implications for digital technology innovation and strategic decision-making.
1. Introduction
With the rapid development of new-generation information technologies such as big data, cloud computing, the Internet of Things, blockchain, 5G, and artificial intelligence, the roles of traditional production factors like land, capital, and labor have been constrained to varying degrees. Additionally, the goals of carbon peaking and carbon neutrality have further driven transformations in production methods. As data increasingly become critical production factors, the vigorous development of the digital economy has become an inevitable choice across industries. Meanwhile, technological convergence has emerged as a key marker of the new wave of scientific and technological revolutions, characterized by the nonlinear fusion of diverse knowledge and multidisciplinary intersections [1]. Companies, as primary innovators, achieve cross-domain convergence of digital-related technologies through cross-domain collaboration, accelerating the connection of different types of factors [2], thereby forming complex relationships within the cross-domain convergence network of digital technology. Therefore, an in-depth analysis of the characteristics and evolution of these digital technology convergence networks is crucial for understanding the cross-domain innovation of emerging technologies.
Technological development relies on innovation entities, and technological convergence not only transcends cross-domain technological boundaries but also organizational boundaries. During this process, the collaboration among innovation entities and the convergence of technology form a bidirectional interactive relationship [3]: on the one hand, collaboration promotes technological convergence, facilitating the convergence of knowledge and resources across different fields; on the other hand, technological convergence further stimulates cooperation among innovation entities. This interactive influence constructs a complex network of technological convergence, which cannot be fully captured by a single-layer network. For instance, many companies that independently complete technological convergence appear as isolated nodes in a single-layer collaboration network. Similarly, certain companies that file patents based on a single technology are represented as isolated IPC codes in a single-layer technological knowledge network. These isolated phenomena fail to reveal real-world connections. The advantage of multilayer network analysis lies in its ability to simultaneously integrate different types of nodes and the complex relationships between them [4], a feature that is particularly important when analyzing patent data. Patent data contain multidimensional information such as knowledge, technological innovation, and collaboration between patent holders [5]. By using multilayer network analysis methods, it is possible to study the overall structure and key nodes of networks with multiple attributes more systematically. This approach not only provides richer information compared to single-layer network analysis but also offers a deeper understanding of the dynamic evolution of networks and the relationships between innovation entities.
The innovation of digital technology, as a core driver of China’s digital economy development, directly influences the digital transformation process of traditional companies and plays a critical role in enabling high-quality growth. In this study, we focus on digital technology to explore, first, how the overall cross-domain convergence network of digital technology evolves during the process of cross-domain convergence, and second, how innovation entities and technological elements change throughout the evolution of the digital technology convergence network.
To address these questions, we constructed a digital technology multilayer convergence network based on digital technology patent data. This network is a complex system structure model developed using multilayer network theory, designed to reveal the dynamic interactions that occur across technological domains and organizational boundaries during the digital technology innovation process. By integrating different types of nodes (e.g., company nodes and technology nodes) and various relationships (e.g., company collaborations, technological co-occurrence, and company–technology affiliations), the digital technology multilayer convergence network captures the multidimensional characteristics of digital technology’s convergence and expansion. The digital technology multilayer convergence network reveals the complex co-evolutionary relationships between innovation entities and technologies, allowing for a more precise evaluation of the role of technological innovation in cross-domain collaboration and corporate development.
The main contributions of this paper are as follows:
(1) We integrate multilayer network analysis with patent data to construct a model of digital technology’s cross-domain convergence. This study explores co-evolutionary mechanisms in multilayer networks, analyzing changes in collaboration and technology convergence at different stages—early, mid, and late—and their effects on network evolution. This offers a deeper understanding of the complex dynamics between patent collaboration and technology convergence, bridging theory and practice.
(2) This study empirically validates the interconnections and dependencies among key elements in digital technology innovation. It captures diverse information on both technological domains and innovation entities, providing a theoretical and methodological foundation for future research and practice in multilayer networks.
(3) Unlike many studies that focus on multiple entities, this paper emphasizes the role of companies as primary drivers of digital innovation. Companies, with their market orientation and flexibility in resource allocation, can swiftly respond to market needs, integrate R&D resources, and commercialize innovations more efficiently than other entities like universities or research institutions. This study highlights the unique role of companies in advancing digital technology and offers practical guidance for enhancing innovation capacity and market competitiveness during digital transformation.
2. Literature Review
2.1. Related Research on Multilayer Network Theory
Multilayer network theory is an effective tool for studying complex systems. Its theoretical foundation was first proposed by Mesarovic et al. [6] in their “Theory of Hierarchical, Multi-Level Systems”, which systematically discussed the interactions and coupling relationships between different layers within multi-level systems. With advancements in technology and network science, multilayer network theory has been gradually applied to various fields, such as transportation, social networks, finance, and biological networks [7,8,9]. One notable contribution is the “Holonic Network Theory” proposed by Mella [10], which describes the dual roles of each component within a system—functioning both as an independent entity and as part of the overall system. This theory provides a theoretical framework for understanding multi-level interactions in companies, with particular relevance to resource allocation and risk management.
In recent years, researchers have further expanded the application of multilayer networks, especially in synchronization and systemic risk management. Boccaletti et al. [8] explored chaotic behaviors in complex networks, revealing the role of multilayer networks in information transmission and risk propagation within financial systems. Through analyzing interactions between nodes and information flows, they demonstrated the advantages of multilayer networks in addressing complexity and uncertainty. Dai et al. [11] constructed a multilayer network model based on returns, volatility, and extreme risk, which uncovered the interconnectedness of energy companies under different market conditions and examined the risk transmission mechanisms of multilayer networks during market crises.
Current research has applied various methodologies, such as game theory [12], data-driven logic [13], and information diffusion and behavior-driven logic [14], to preliminarily reveal the evolution patterns and pathways of multilayer networks. These studies systematically analyze node utility, information flow, and the prevalence of different strategies across network layers, thereby elucidating key relationships and structural changes. This has promoted a transition from single-layer to multilayer network research. Such comprehensive analysis of multiple relationships not only deepens our understanding of network structures and their evolutionary characteristics but also provides new insights and approaches for future research.
However, existing studies often rely on single-layer network analysis methods, simplifying multilayer networks into single-layer networks for measurement. This approach fails to fully capture the complexity of multilayer networks and the dynamic evolution of their internal relationships. Although some studies have attempted to apply true multilayer network analysis methods, such as measuring node connectivity and inter-layer coupling degree [15], there is still a lack of research cases closely aligned with practical issues. Therefore, future research could further explore multilayer-specific indicators and methodologies to reveal the multidimensional interactions within complex systems and their applications to real-world problems.
2.2. Related Research on Innovation Network Evolution
Network evolution refers to the dynamic process of changes in nodes and edges within a system over time. Early-stage innovation network research primarily focused on single-layer networks, emphasizing direct relationships and structural characteristics between innovation participants. Chen et al. [15] studied the evolution of single-layer knowledge innovation networks, demonstrating how companies evolve from a single knowledge base to a diversified network structure. Kivelä et al. [16] discussed the addition and removal of nodes and edges in single-layer networks and proposed an evolution model based on weighted graphs to simulate cooperation relationships among different organizations. However, single-layer networks are limited in their ability to capture the complexity of real-world systems, particularly when multiple layers of interactions are present.
Research on innovation network evolution has explored various structural configurations, highlighting the role of multilayer networks in promoting technology convergence. Feng et al. [17] analyze China’s interurban technology cooperation–transfer networks, revealing significant spatial heterogeneity and the U-shaped impact of node degree on innovation capability. Similarly, Cai et al. [18] investigate interprovincial innovation multilayer networks and identify a core–periphery structure, where core provinces dominate resource flows. They emphasize path dependence and the influence of economic and infrastructural factors. At the international level, Yang et al. [19] examine transnational patent networks, highlighting small-world characteristics and hierarchical roles of countries. Their findings reveal developed countries’ dominance and strategic use of transnational patents to maintain technological superiority. Collectively, these studies emphasize the dynamic nature of innovation networks across different spatial scales and their implications for regional and global innovation strategies.
The evolution of innovation networks is driven by both internal and external forces. Internal factors include organizational strategies and network advantages, while external factors encompass policies, regulations, and technological advancements. Mudambi et al. [20] analyzed the evolution of industrial clusters in Ohio over three decades, concluding that knowledge coordination within the network is crucial for long-term sustainability. In research on corporate innovation management, Freire and Gonçalves [21] reviewed the systematic literature on innovation cooperation, emphasizing the role of multilayer networks in technological collaborations. They argued that diversified partnerships enhance innovation performance through cross-level knowledge sharing. This finding is supported by Gkypali et al. [22], whose study indicated that through multilayer cooperation, companies can access more external resources and technological support, significantly improving their innovation capacity. Additionally, external forces such as government policies also influence network evolution. Wei et al. [23] examined the collaborative innovation network in the artificial intelligence industry and proposed a heterogeneous collaborative innovation network model driven by incentives and network responses. These studies suggest that a careful balance of internal and external drivers is essential for the sustainable growth of innovation networks.
2.3. Related Research on Multilayer Networks and Corporate Innovation Management
(1) Multilayer Networks and Technological Innovation
The theory of technological innovation examines how companies use technological advancements to develop new products, services, or processes. Within multilayer networks, innovation is seen as a dynamic process spreading across multiple layers. Boccaletti et al. [8] emphasized that synchronization between layers is vital for driving innovation in complex ecosystems. Companies must align their strategies with changes in digital platforms, manufacturing technologies, and consumer preferences to respond to evolving environments. Dai et al. [11] used multilayer network analysis to study how innovation spreads among interconnected energy companies. Li et al. [24] demonstrated that external factors (political, economic, social, and technological) play a key role in clean energy technology diffusion. Their research suggests that multilayer networks effectively model these interactions, helping companies navigate the market environment and seize opportunities.
(2) Multilayer Networks and Technology Convergence
The theory of technology convergence highlights the integration of diverse technologies and knowledge bases as key drivers of innovation. Traditional research often focuses on single-layer networks within a single domain, which limits understanding of complex cross-domain interactions. In contrast, multilayer networks provide a comprehensive framework to analyze these interactions. Antonelli, Orsatti, and Pialli [25] noted that multilayer networks simulate knowledge flow and convergence across technological domains, helping identify structural bottlenecks that hinder technology convergence. Freire and Gonçalves [21] emphasized that multilayer networks facilitate interdisciplinary collaboration by revealing how companies integrate innovations across various fields, such as pharmaceuticals and information technology. They argued that visualizing these connections helps companies strategically manage technology convergence. Furthermore, Boccaletti et al. [8] found that multilayer networks can detect “isolation effects” where key technologies fail to integrate, thus offering a basis for strategic interventions to improve convergence processes.
(3) Multilayer Networks and Corporate Innovation Cooperation
The relationship between multilayer networks and corporate innovation cooperation is examined from three main perspectives: the promotion of diverse R&D collaborations across multiple layers, the impact of cross-layer interactions on technological innovation and knowledge sharing, and the role of multilayer networks in capturing complex “coopetition” dynamics. These studies collectively demonstrate how multilayer networks facilitate the integration of diverse resources and enhance companies’ innovation capabilities in a highly interconnected environment. Mary B. Rose [26] emphasized that business networks are crucial for company development, industrial innovation, and technological progress by promoting knowledge dissemination and technology diffusion. Gkypali et al. [22] found that diverse R&D collaborations across multiple layers, such as competitors, suppliers, and research institutions, significantly boost innovation performance. Similarly, Dong and Bi [27] highlighted the role of cross-layer interactions in driving breakthrough technological innovation in global value chains. Giovannetti and Piga [28] argued that ICT platforms enhance cross-layer collaborations, improving innovation outcomes through knowledge sharing. Park and Lee [29] showed that even in competitive environments, R&D cooperation with competitors can increase innovation investment, demonstrating how multilayer networks capture complex “coopetition” dynamics for strategic decision-making.
2.4. Research Review
Overall, multilayer network theory provides a novel analytical framework for understanding multidimensional interactions in complex systems and has made significant progress in research fields such as corporate innovation, technology convergence, and cross-organizational collaboration. By introducing a perspective that encompasses multi-level and multidimensional interactions, multilayer network theory reveals structural complexities and dynamic evolutionary characteristics that cannot be captured by single-layer networks, enabling scholars to analyze firms’ behavioral patterns within innovation ecosystems and their capacity to respond to external environments more comprehensively. In existing studies, multilayer networks have been widely applied to understand cross-departmental, cross-domain, and cross-regional innovation cooperation, promoting a theoretical shift from single-layer to multilayer networks and providing strong support for optimizing resource allocation and enhancing competitiveness in dynamic market environments.
Despite the significant progress made in multilayer network theory and its applications, several unresolved issues remain. First, many existing studies still rely on single-layer network analysis methods, simplifying multilayer networks into single-layer networks for measurement and ignoring the information flow and resource allocation mechanisms across different layers. This approach fails to capture the real dynamics and complex characteristics within multilayer networks. In technology convergence research, for instance, many studies still adopt a single-layer network perspective and measure cross-layer technology convergence through simple aggregation of nodes and edges, lacking an in-depth exploration of interaction processes between different technological domains. Such simplification cannot uncover the potential “isolation effect” within multilayer networks, where convergence barriers may arise between different technological modules, thereby constraining firms’ collaborative innovation capacity in a multidimensional technological environment.
Second, although some studies have attempted to apply genuine multilayer network analysis methods (e.g., node coupling degree and inter-layer connectivity), there is still a lack of case studies that closely align with real-world problems. The current literature is mostly focused on constructing theoretical models, lacking detailed analyses of the dynamic evolution of multilayer networks in practical scenarios. Particularly in complex networks involving cross-domain and cross-regional collaborations, researchers need to develop new analytical metrics and models to reveal the evolutionary patterns of different types of relationships in these networks and their impact on firms’ innovation performance. Thus, further exploration is needed on how multilayer-specific indicators and methodologies can uncover complex structural features in real-world problems and how theoretical analyses can be integrated with practical cases to provide more practically oriented research outcomes.
Moreover, existing research on multilayer networks in various application fields such as technological innovation, technology convergence, and corporate collaboration remains fragmented. While some studies have highlighted the role of multilayer networks in synchronization mechanisms, technology diffusion, and cross-layer collaboration, findings from different research domains have yet to achieve effective convergence and dialogue. For example, in technological innovation research, multilayer networks are primarily used to analyze how companies achieve synchronization and coordination across different technological layers. In technology convergence research, multilayer networks depict the process of cross-domain knowledge flow and convergence.
In summary, the multilayer network theory provides a new perspective for understanding company innovation and its dynamic evolution. However, there remains a considerable gap between theoretical approaches and practical applications. Therefore, this study adopts an analytical perspective based on multilayer networks and constructs a digital technology multilayer convergence network using patent data. The objective is to reveal the dynamic interactions across technological domains and organizational boundaries in the process of digital technology innovation.
Based on this, we constructed the research framework diagram as shown in Figure 1 to clarify the research logic and research questions of this study. This study follows a macro–meso–micro perspective to analyze the overall structural evolution characteristics of the digital technology multilayer convergence networks, the evolution characteristics of subnetwork structures, and the evolution of individual nodes within the multilayer network. Accordingly, the research questions are formulated as follows:
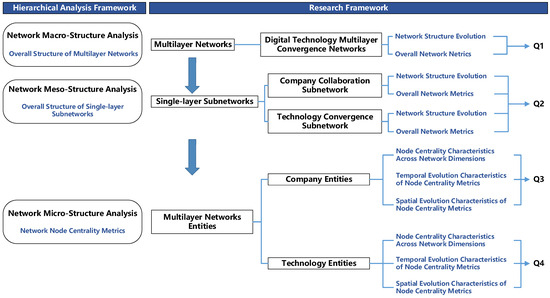
Figure 1.
Research framework diagram.
Q1. How does digital technology evolve dynamically across different technological domains and organizational boundaries, and what are the key patterns of growth, convergence, and efficiency improvement in digital technology multilayer convergence networks?
Q2. How do company collaboration and technological convergence evolve within the context of digital technology innovation, and what mechanisms drive the formation of centralized collaboration patterns and highly integrated systems?
Q3. How do company influence and connectivity evolve within complex digital technology networks, and what factors drive the spatial and temporal disparities in collaboration and innovation capabilities across different regions?
Q4. How does technological convergence reshape the roles and influence of core and emerging technologies in complex digital technology networks, and what are the advantages of using multilayer network metrics to capture these dynamics?
3. Construction and Evolution Mechanism of Multilayer Networks
3.1. Construction of Multilayer Networks
The annual cross-domain convergence network of digital technology was constructed using R 4.3.2, and the muxViz package was employed to calculate the centrality metrics for both the multilayer networks and their individual subnetwork. Additionally, Gephi 0.10.1 was used to visualize the network graphs. The construction process is as follows:
We first extracted multidimensional arrays for the co-occurrence relationships of IPC codes, the co-authorship of patents by companies, and the affiliations between companies, patents, and IPC codes from digital technology patent data. These arrays were then used to construct the digital technology convergence subnetwork, the company collaboration subnetwork, and the affiliation network between the two types of entities. Together, these three networks form a complete digital technology multilayer convergence network. The specific steps for constructing the network are as follows:
Step 1: We obtained and organized patent application information from the listed companies. Following the methodology of Wang et al. [30] and Schillebeeckx et al. [31], we constructed the digital technology network based on the digital technology-related invention patents applied for by companies in each year. This approach is grounded in the following considerations: first, patent activities reflect the technological development direction of companies, and a large number of digital technology-related patent applications indicate significant technological progress in the digital field. Second, only invention patents were considered, as they require rigorous substantive examination, offering a higher degree of innovation compared to utility models or design patents, and better reflecting companies’ digital technology achievements. Finally, the number of patent applications more accurately reflects a company’s level of digital technology innovation in a given year compared to granted patents. We followed the method of Huang [32] to identify digital technology patents. Using the “Strategic Emerging Industries Classification and International Patent Classification Reference Table (2021)” issued by the State Intellectual Property Office (SIPO), we identified patents corresponding to cloud computing, big data, IoT, industrial internet, blockchain, AI, virtual reality, augmented reality, and other digital technology sectors based on their IPC codes.
We matched the SIPO patent data with China’s listed companies and their subsidiaries, following the method of He et al. [33]. Using the Patsnap global patent database, we retrieved and organized patent data for sample companies and their subsidiaries. The detailed steps were as follows: (1) search for name change histories of the sample of listed companies using the CNRDS and CSMAR databases; and (2) query the patent application data for listed companies and their subsidiaries from the Patsnap global patent database to compile a comprehensive dataset of company–year patent records. Ultimately, we obtained 193,625 invention patent applications from 2397 listed companies during the period from 2012 to 2021.
Step 2: Based on the co-occurrence of patent IPC codes, we constructed the digital technology convergence subnetwork. This network is an undirected, unweighted network.
Step 3: Using the co-authorship of patents, we constructed the company collaboration subnetwork, which is also an undirected, unweighted network. In this study, co-authored patents between parent companies and their subsidiaries were not considered as company collaborations. Only co-authorship between different companies was treated as collaboration. To ensure the completeness of the digital technology convergence process, we retained both companies that applied for patents independently and those that co-applied for patents with other patentees. As a result, isolated companies exist in the multilayer network.
Step 4: We linked the digital technology knowledge network with the company collaboration subnetwork based on the ownership relationship between patents and companies, forming a complete multilayer network for the cross-domain convergence of digital technology. This network is undirected and unweighted.
The digital technology multilayer convergence networks represent a systematic structure built on a multilayer network model, designed to capture the complex interactions that occur across technological domains and organizational boundaries during digital technology innovation. By integrating multiple network layers and different types of nodes (such as companies and technology nodes), this network framework reveals the dynamic co-evolutionary patterns among technology convergence, corporate collaboration, and technology layout.
Specifically, the digital technology multilayer convergence networks consist of the following three subnetworks:
(1) Company Collaboration Subnetwork: This subnetwork focuses on companies as the main entities and is constructed based on co-patenting relationships. It reflects the collaborative patterns among innovation entities and their connections in cross-domain technology collaboration.
(2) Technology Convergence Subnetwork: This subnetwork centers on technology nodes, established through co-occurrences of different IPC (International Patent Classification) codes. It represents the cross-domain convergence characteristics, highlighting the pathways of collaborative innovation and knowledge flow among various digital technology fields.
(3) Inter-Layer Network: This network includes both company and technology nodes, built upon the affiliation relationships between companies and their patented technologies. It illustrates how companies are positioned across diverse technological fields and their control over core technologies.
The digital technology multilayer convergence networks can capture cross-layer interactions that cannot be reflected in single-layer networks, thereby uncovering the intricate co-evolutionary relationships between innovation entities and technologies. As a more realistic model of complex systems, multilayer networks capture dynamic associations between heterogeneous nodes and network layers, revealing the crucial role of cross-domain technology collaboration and corporate development. Through a more precise analysis of multilayer structures, this network provides both theoretical and practical insights into the mechanisms of technological evolution in the context of the digital economy.
3.2. Evolution Mechanism of Multilayer Networks
The convergence of digital technology requires technology cross-domain convergence to achieve the fusion of technological knowledge. It also necessitates crossing organizational boundaries to foster collaboration among innovation entities. In the early stages of digital technology convergence, individual innovation entities cannot achieve breakthroughs by relying solely on their own resources [34]. They must establish cross-domain collaborations across organizations and industries, facilitating knowledge exchange and sharing across different fields through technology knowledge search. Technology cross-domain convergence enables the fusion of technological knowledge [35], which further promotes cross-domain cooperation between innovation entities [36]. Due to the uncertainty surrounding emerging technologies and markets, the number of elements and relationships within the digital technology multilayer convergence networks constantly changes. This network is decomposed into the digital technology convergence subnetwork and the company collaboration subnetwork to analyze the relationship between technological convergence and cross-domain collaboration among innovation entities during its evolution.
As shown in Figure 2, the green nodes represent technology entities, while the red nodes indicate innovation entities. In the early stages of the digital technology multilayer convergence networks’ evolution, innovation entities and technology entities remain independent, with no established cooperation or convergence relationships. When fusion between innovation entities and technologies begins, and connections form within the company collaboration subnetwork and the digital technology convergence subnetwork, the network enters its mid-evolution phase. As new innovation entities or technological fields join, and the number of connections both within and between layers increases, the network reaches its late-evolution phase.
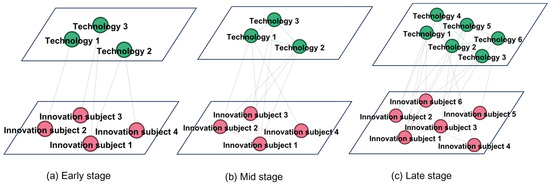
Figure 2.
Evolution process of the multilayer networks: early, mid, and late stages.
Based on this framework, we constructed a patent assignee collaboration network and a patent technology convergence subnetwork, representing the company collaboration subnetwork and the digital technology convergence subnetwork, respectively. The affiliation network between these two subnetworks was built using the relationships between IPC codes, patents, and companies, as shown in Figure 3. The green nodes represent technology entities (i.e., IPC nodes), while the red nodes indicate innovation entities (i.e., company nodes). The data and relationships in each network layer are presented in Table 1.
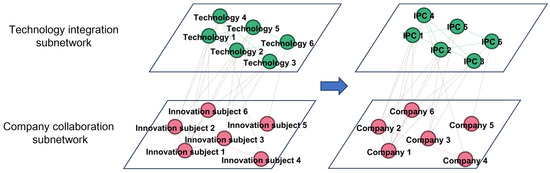
Figure 3.
Digital technology cross-domain convergence network model based on patent data.

Table 1.
Data and relationships related to the digital technology cross-domain convergence networks based on patents.
The company collaboration subnetwork is built upon the cross-domain collaboration relationships among innovation entities. Companies, as innovation entities, are the owners of patents. Co-occurrences of companies on the same patent reflect their collaboration. The number of co-occurrences between companies indicates the frequency of collaboration, which in turn reflects the level of cooperation between them. An increase in co-occurrences suggests that innovation entities are strengthening their cooperation, while a decrease implies that entities are developing independently.
The digital technology convergence subnetwork is constructed based on the cross-domain convergence of digital technologies. The co-occurrence of patent IPC codes reveals the technology convergence phenomena behind technologies and sheds light on the development trends in different technological fields. The frequency of patent IPC co-occurrences indicates the extent of technology convergence between technological fields. Cross-domain convergence of technologies is manifested in patents that span multiple technological fields, with multiple classifications across different technological categories.
The affiliation network is constructed based on the relationships between innovation entities and the technologies they own. The co-occurrence network of companies and patent IPC codes reflects the cross-domain technological relationships of innovation entities. The frequency of co-occurrence between companies and IPC codes indicates the extent to which a company has mastered the technology in a particular patent IPC classification. An increase in the number of patent IPC codes owned by an innovation entity indicates its ongoing cross-domain technological convergence.
4. Data Sources and Research Methods
4.1. Data Sources
This study focuses on A-share listed companies in China’s Shanghai and Shenzhen stock exchanges from 2012 to 2021, along with their patent application information. The sample was filtered using the following criteria: (1) exclusion of companies marked as ST or *ST; (2) exclusion of samples with missing relevant data; and (3) merging the patent application data of parent companies and their subsidiaries. As a result, we obtained a dataset consisting of 193,625 invention patent applications from 2397 listed companies.
We present the changes in basic information for a portion of the sample companies in 2012, 2017, and 2021, as shown in Table 2. Our selection logic was based on identifying the top 10 companies by patent applications in 2012. In some cases, company names have changed due to renaming during the sample period; therefore, company identification should be based on the company code. For more detailed company information, please refer to Table A1 in Appendix A.
Table 2.
Basic information of sample companies (10 in total).
The data sources for this study are as follows: companies’ invention patent application information was retrieved from the Patsnap Global Patent Database, while company data were sourced from the CSMAR database.
The tools used for network construction and the calculation of network metrics were Gephi and R, with Gephi also used for visualization. Data cleaning and statistical analysis were performed using Python 3.11 and STATA 16.0.
4.2. Structural Characteristics and Measurement Methods of Multilayer Networks
Isolating each layer of a coupled system or aggregating them into a traditional network may lead to a network model with weaker explanatory power. In a multilayer network, there are cross-layer paths, meaning that a company node’s neighboring nodes may not only be other company nodes but also technology nodes (IPC codes). Furthermore, a node’s neighbors and the neighbors of its neighbors may be of heterogeneous types. For example, a company node might be connected to a technology node via other company or technology nodes. These unique cross-layer connections provide company nodes with enhanced network penetration capabilities, allowing their influence to spread through multiple pathways. In this study, we identify key nodes in the multilayer network system through measures of multilayer degree centrality, multilayer eigenvector centrality, and multilayer PageRank centrality. The muxViz package in R was used to calculate these multilayer network metrics.
(1) Multilayer Degree Centrality
Multilayer degree centrality measures the number of edges connected to a given node [18]. In the context of multilayer network analysis, this metric extends the scope of calculation to consider correlations across layers and between layers, expressed through a tensor equation. The specific calculation formula is as follows [37]:
The term represents the multilayer adjacency tensor, which captures all interactions between nodes both within and across layers, effectively forming a tensorized representation of the complete multilayer network structure. A tensor is a generalization of scalars and vectors and is used to represent higher-dimensional data. In its simplest form, a tensor can be viewed as a multidimensional array composed of elements of the same type (typically numbers). Scalars, vectors, and matrices can be considered as the simplest 0th-, 1st-, and 2nd-order tensors, respectively. The symbols and represent network layers, where and , with representing the number of layers. The indices and denote nodes, where .
The function operates on each entry of the tensor, returning 1 if the entry is greater than zero, and 0 otherwise. Essentially, this function binarizes the tensor. The term denotes the reduction in the multilayer adjacency tensor into a 2nd order 1-tensor (where all components are set to 1). refers to the aggregate network that accounts for inter-layer connections. Lastly, represents the sum of all edges connected to node in the multilayer network system, excluding the edges connected to .
(2) Multilayer Eigenvector Centrality
Eigenvector centrality is a metric used to measure the importance of a node within a network. It not only takes into account the number of connections a node has but also considers the significance of the nodes it is connected to [38]. A node that is connected to other important nodes will have a higher eigenvector centrality. Specifically, it is calculated through the principal eigenvector of the adjacency matrix, where a node’s centrality is proportional to the centrality of its neighboring nodes. In a single-layer network, eigenvector centrality is computed by identifying a dominant eigenvector from a 2nd-order adjacency tensor. In a multilayer network, this computation extends to a 4th-order tensor, which requires considering the overall interconnection structure across layers. The specific formula is as follows [37]:
Here, represents the largest eigenvalue, while is the eigenvector that encodes the centrality of each node in each layer, considering the overall interconnected structure.
(3) Multilayer PageRank Centrality
PageRank centrality was originally developed for ranking web pages and is used to measure the relative importance of nodes within a network. The core concept is that the importance of a node depends not only on how many other nodes point to it but also on the importance of those pointing nodes. Through iterative calculations, the PageRank score is continuously updated based on the PageRank values of connected nodes, similar to eigenvector centrality, but with the introduction of a damping factor to prevent the concentration of influence [39]. When extended from single-layer to multilayer networks, the approach is essentially based on a multilayer random walk [40]. It accounts for both a node’s jumps to neighboring nodes within the same layer and its transitions to nodes in other layers via inter-layer connections. The specific calculation formula is as follows [37]:
Here, is a constant, typically set to the default value of 0.85, as in Google’s original algorithm [39]. is the number of nodes in each layer, and is the number of layers (dimensions). is a 4th-order tensor where all components are equal to 1. The steady-state solution to the principal equation corresponding to this transition tensor provides the PageRank centrality for interconnected multilayer networks.
5. Analysis of Evolutionary Characteristics of Multilayer Networks
In this study, we used the date of the first patent application as the filing date and plotted the trend in patent application volumes, as shown in Figure 4. Between 2012 and 2014, the number of digital technology-related patent applications showed a slow growth trend, with only modest increases, indicating that digital technology was still in its early stages. Technological innovation and patent activity within the industry were gradually accumulating during this period. From 2015 to 2018, the growth rate accelerated significantly, signaling that digital technology was entering a rapid development phase. Although there were occasional slowdowns, the overall trend continued to rise. From 2019 to 2021, patent applications experienced explosive growth, reflecting the widespread adoption and attention given to digital technology across the country, with innovation activities reaching their peak. Based on the changes in patent application volumes, we divided the evolution of the digital technology multilayer convergence networks into three phases: the emergence phase (2012–2014), the growth phase (2015–2018), and the expansion phase (2019–2021) [41,42].
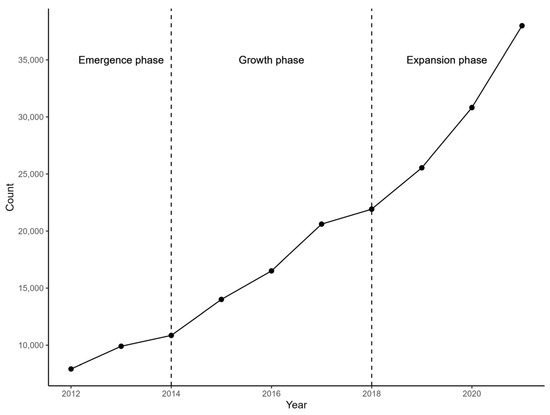
Figure 4.
Trend in digital technology-related patent applications.
5.1. Evolution Characteristics of the Overall Structure of Multilayer Networks
Based on the logic for constructing the digital technology multilayer convergence networks outlined earlier, we used Gephi software and the Yifan Hu algorithm to draw the annual multilayer network diagrams. The Yifan Hu algorithm is an efficient force-directed layout algorithm specifically designed to handle large graphs. Force-directed layout algorithms simulate physical forces within a system, where nodes in the graph are treated as repelling charges, and edges act like springs applying attractive forces between the nodes. The system eventually reaches a dynamic equilibrium, determining the final spatial positions of the nodes. At this point, the network structure represents the aggregated state, showing relationships between multilayer network nodes in a two-dimensional plane. Additionally, we used the Network Splitter 3D algorithm to visualize the structural evolution of the digital technology knowledge network. The Network Splitter 3D algorithm allows users to split the network into different layers or regions based on specific node attributes and display this layered structure in three-dimensional space.
Figure 5 presents the overall structural evolution of the digital technology multilayer convergence networks from 2012 to 2021. Due to space limitations, only the overall network diagrams for 2012, 2017, and 2021 are shown. The upper green nodes represent the digital technology convergence subnetwork, with green edges indicating co-occurrence relationships between knowledge elements. The lower pink nodes represent the company collaboration subnetwork, with pink edges representing co-authored patent relationships between companies. The green nodes represent technology entities, while the red nodes indicate innovation entities. Gray lines show the connections between knowledge elements and companies based on patent ownership. The key observations from the figure are as follows: (1) The network scale increased year by year, the network structure became increasingly complex, and network density rose steadily. This indicates a growing variety of technologies and an increase in collaboration between companies. The possible reasons for this include the fact that (a) companies are combining more fields of technology with digital technology, and (b) more companies are entering the digital technology sector. (2) Compared to the internal connectivity of single-layer networks, the increase in the connectivity density of cross-layer affiliations is more pronounced. This suggests that companies have been increasingly engaging in digital technology R&D activities in recent years. (3) In the early stages of network development, most nodes operated in a decentralized collaboration pattern. Over time, the network evolved from scattered, independent collaborations to a more centralized cooperation model, where one or a few key nodes serve as the hubs. As a result, new central nodes formed in the network, and overall cohesion strengthened.
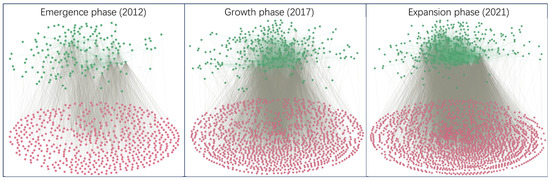
Figure 5.
Structural evolution of the digital technology multilayer convergence networks.
To further analyze the characteristics of the overall network, we calculated the network metrics for each year, as shown in Table 3. The key findings are as follows: (1) The size of the network (number of nodes) and the number of edges (connections) showed a continuous growth trend from 2012 to 2021. This indicates that during the observed period, both the number of entities in the network (technological elements and companies) and the relationships between them (co-occurrence, collaboration, etc.) increased steadily, reflecting the growing frequency and complexity of activities and interactions in the digital technology field. (2) The network diameter, which refers to the length of the shortest path between the two most distant nodes in the network, remained mostly stable between 6 and 7, with a decrease to 5 in 2020. The network diameter represents the maximum shortest path length between two nodes in the network. This relative stability, along with the reduction in 2020, suggests that despite the expanding network size, the maximum distance between nodes has not significantly increased and even decreased in some cases, possibly indicating more efficient dissemination of technological knowledge and innovation within the field. (3) Network density, defined as the ratio of the actual number of edges to the possible number of edges, showed a slight decline over time but remained relatively stable overall. Network density measures the closeness of the network by comparing the actual number of edges to the maximum possible number of edges. The slight decrease may suggest that although the actual number of connections increased with network growth, the rate of increase was slower compared to the possible connections. (4) The modularity index decreased year by year, indicating a shift in the internal structure of the network from a more segmented grouping (high modularity) to a more integrated structure (low modularity). This likely signifies that cross-domain collaboration and technology convergence within the digital technology domain became more common over time. (5) The average clustering coefficient showed an upward trend, indicating an increasing tendency for nodes in the network to form tightly connected groups, also known as triangles or triadic closures. This trend suggests that collaboration and interactions within the network are becoming more cohesive. (6) The average path length, which represents the average shortest path between any two nodes in the network, decreased over time, indicating that the “distance” between any two nodes in the network has shortened. This implies that the efficiency of information or knowledge diffusion within the network has improved.
Table 3.
Overall network metrics.
5.2. Evolution Characteristics of Overall Structure of Single-Layer Subnetwork
5.2.1. Evolution Characteristics of the Company Collaboration Subnetwork
In this study, companies are represented as nodes, and co-authored patent relationships between companies are depicted as edges, forming the company collaboration subnetwork evolution map. To better illustrate the relationships between entities, this section uses an undirected weighted network, where thicker lines indicate higher collaboration frequency between companies, as shown in Figure 6.
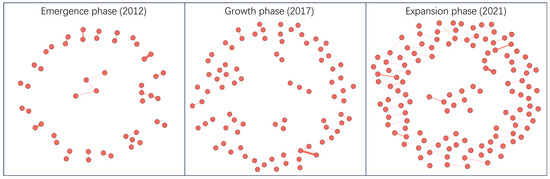
Figure 6.
Evolution of the company collaboration subnetwork.
During the emergence phase, the network structure is relatively fragmented, with lower collaboration frequency between companies, resulting in many small-scale collaboration groups. This reflects that digital technology cooperation among companies was still in its infancy, with a limited scope of collaboration, and interactions between innovation entities had not yet formed a widespread network.
During the growth phase, the structure of the company collaboration subnetwork gradually evolved, with a significant increase in both the number of nodes and edges. Multiple collaboration groups centered around key nodes began to emerge. Some companies (acting as central nodes) occupied prominent positions in the collaboration network, with significantly increased collaboration frequency with other companies The thickness of the weighted edges indicates that the collaboration frequency between core companies increased substantially, while peripheral nodes maintained relatively lower collaboration intensity. This phase demonstrates that cooperation between companies intensified, and the collaboration network gradually expanded from local groups to a broader scale, with some companies taking on a leading role in technological collaboration.
During the expansion phase, while the main network structure still consisted of small-scale groups, these collaboration groups expanded significantly. Some smaller groups exhibited high-frequency collaboration, indicating that certain companies had established fixed partnerships. At this stage, collaboration was no longer confined to localized “core–periphery” structures, but instead, multiple groups became highly interconnected, marking the onset of a boom in company technological collaboration. The connectivity of the collaboration network increased significantly, and interactions among collaboration entities became more frequent, resulting in highly coordinated technological innovation activities. Across the three phases shown in the network evolution map, it is clear that the company collaboration subnetwork evolved from a decentralized to a more centralized structure, with collaboration relationships gradually transitioning from scattered to more cohesive.
Compared to Figure 5, the number of nodes in the company collaboration subnetwork in Figure 5 is significantly smaller than the number of company nodes in the multilayer network. This is because many companies in the multilayer network independently achieve technological convergence, which appears as isolated nodes in the company collaboration subnetwork. These companies, which are not involved in co-authored patents, are removed from the subnetwork, greatly reducing the number of nodes in the company collaboration subnetwork. This reduction reflects the focus of the company collaboration subnetwork on cooperation and interactions between companies, rather than on individual companies’ independent innovation activities. As a result, the nodes in the subnetwork only represent companies that have established collaborative relationships, while the multilayer network captures a broader range of independent innovators who are not involved in such collaborations. The multilayer network can reveal complex interactions across different layers, providing a more comprehensive and accurate representation of the network structure. This multidimensional analysis helps to understand the role and influence of isolated companies—those that do not directly collaborate with others but still contribute through technological innovation—within the innovation ecosystem.
The changing trends in network structure metrics are shown in Table 4. First, the breadth of company collaboration expanded as the network evolved through different stages. The number of nodes and edges gradually increased over time, with a notable rise from 2019 to 2021, indicating that more companies joined the collaboration network, and cooperative relationships grew. The number of nodes increased from 48 in 2012 to 125 in 2021, and the number of edges rose from 34 to 79. This growth trend suggests that the scale and scope of the company collaboration subnetwork continued to expand, with more companies progressively entering the collaborative system. The network diameter showed a fluctuating upward trend, indicating that the maximum span of the company collaboration subnetwork increased over these years. Overall, the diameter of the network fluctuated only slightly, suggesting that the distances between companies in different years remained relatively stable. Network density gradually declined over the analysis period, possibly due to the expansion of the network as more new companies joined.
Table 4.
Structural characteristics of the company collaboration subnetwork.
Second, the depth of company collaboration increased as the network evolved, reflected by the growing frequency and intensity of collaboration. The total collaboration weight increased steadily from 831 in 2012 to 8010 in 2021, with a significant rise between 2019 and 2021. This indicates that, as the network expanded, collaboration frequency between companies increased markedly, and relationships became more tightly knit. The clustering coefficient exhibited more fluctuation, showing a decline followed by a recovery between 2012 and 2016, peaking at 0.7500 in 2018. This indicates that local collaboration networks were highly cohesive during this period but then declined to 0.1034 by 2021. This decline could be attributed to the addition of new companies to the network, leading to more dispersed collaboration relationships and a weakening of local clustering effects. The average path length generally trended downward, from 1.3950 in 2012 to 1.0580 in 2018, indicating shorter collaboration distances between companies and improved collaboration efficiency. Although there was a slight increase during the expansion phase, overall collaboration efficiency remained high. In summary, both the breadth and depth of company collaboration increased as the network expanded, and despite some fluctuations in local cohesion, collaboration frequency and efficiency continued to grow.
5.2.2. Evolution Characteristics of the Technology Convergence Subnetwork
In this study, technologies (represented by IPC codes) are depicted as nodes, and the co-occurrence relationships between IPC codes as edges, forming the technology convergence subnetwork evolution map. To better illustrate the relationships between entities, this section uses an undirected weighted network, where thicker lines indicate higher co-occurrence frequencies between IPC codes, as shown in Figure 7.
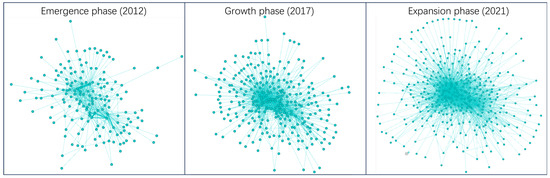
Figure 7.
Evolution of the technology convergence subnetwork.
During the emergence phase, the technology convergence subnetwork had already formed a relatively complete structure, unlike the company collaboration subnetwork, which featured many small, fragmented groups. However, most of the edges in the network were thin, indicating weak associations between technologies, with cross-domain convergence still in its early stages. At this point, technological convergence was often based on innovations within single domains, primarily concentrated within their respective fields, lacking cross-domain convergence. The application of digital technologies was relatively limited, and most companies or research institutions had not yet fully realized the potential for technological convergence, resulting in a relatively small and simple network structure.
In the growth phase, the technology convergence subnetwork began to expand significantly, with multiple central groups emerging within the network. These nodes, representing specific technological fields, developed more frequent co-occurrence relationships with other technologies, indicating that the subnetwork was expanding beyond individual fields to encompass multiple technological domains.
During the expansion phase, the complexity and connectivity of the technology convergence subnetwork increased dramatically, and the convergence of technologies across fields entered a highly concentrated stage. The frequency of co-occurrences between technologies rose sharply, as reflected in the diagram by denser nodes and thicker edges, indicating high-frequency interactions between technologies. This dynamic led the technology convergence subnetwork to evolve into a highly interconnected and complex system. Unlike the company collaboration subnetwork, the technology convergence subnetwork not only reflected an increase in collaboration frequency but also demonstrated greater diversity and complexity in cross-domain innovations. At this stage, technological convergence depended not only on company collaboration but also on the deep combination of patent technologies and cross-domain innovations, which represents a key distinction between the technology convergence subnetwork and the company collaboration subnetwork.
The changing trends in network structure metrics are shown in Table 5. First, the breadth of technological convergence expanded progressively with the evolution of the network. Both the number of nodes and edges showed significant growth over the entire period, with a sharp increase from 2019 to 2021. This indicates that more technological elements (IPC codes) were involved in the technology convergence subnetwork, and co-occurrence relationships between technological elements continued to grow. The number of nodes increased from 167 in 2012 to 359 in 2021, while the number of edges rose from 5525 to 33,355. This growth trend demonstrates the continuous expansion of the technology convergence subnetwork, with more technological fields gradually entering the convergence system. The rapid development of the digital technology sector, in particular, has driven cross-domain technological convergence. Between 2012 and 2014, the network diameter fluctuated, reaching 16 in 2013, but the overall trend has been downward in the following years, reducing to 9 by 2021. This suggests that, over time, connections between technological fields became increasingly tighter, and cross-domain technological collaboration became more direct. Especially after 2019, as digital technology emerged as a core integrating force, it significantly shortened the distance between technologies. Network density initially declined and then increased during the analysis period. Between 2012 and 2015, network density dropped from 0.3986 to 0.2218, possibly due to the addition of new technological fields that decreased network connectivity. However, starting in 2016, the density began to recover, reaching 0.4275 in 2020 and 0.5191 in 2021. This indicates that connections between technological fields became increasingly close, particularly with the influence of digital technology, which significantly strengthened convergence relationships across different fields and greatly enhanced the overall connectivity of the technology convergence subnetwork.
Table 5.
Structural characteristics of the technology convergence subnetwork.
Second, as the technology convergence subnetwork expanded, the depth of convergence between technologies also increased significantly, with co-occurrence frequencies and local clustering structures becoming more cohesive. The total weight, reflecting the co-occurrence frequency between technological fields, experienced a sharp rise—from 653,917 in 2012 to 20,531,777 in 2021, with particularly accelerated growth after 2019. This trend indicates that co-occurrence relationships between technological fields have become increasingly frequent, greatly enhancing the synergy of innovation. The clustering coefficient fluctuated during the analysis period. In 2012, it was 0.2838 and remained relatively high, reaching 0.3090 in 2021. This reflects strong local clustering within the technology convergence subnetwork, indicating that technological convergence occurred not only at the overall network level but also within smaller subgroups that exhibited tight interactions. As digital technology penetrated multiple fields, several technological domains formed clustered collaborations. The tightness of these local networks underscores the increasing depth of technological convergence. The average path length shortened each year, indicating that the average distance between technological fields decreased, leading to more efficient interactions within the technology convergence subnetwork.
5.3. Evolution Characteristics of Network Entities in Multilayer Networks
In this section, we focus on analyzing the dynamic changes in the evolution characteristics of individual entities within the multilayer network, with two primary areas of work: First, we compare the structural metric evolution trends in network entities in both single-layer and multilayer networks, exploring the advantages of multilayer networks in capturing complex network relationships and dynamic evolution. Second, we present the spatiotemporal evolution characteristics of individual network entities, revealing the co-evolution processes of companies and technology entities in different spatiotemporal contexts.
5.3.1. Evolution Characteristics of Company Entities
(1) Node Centrality Characteristics Across Network Dimensions
We compared different types of multilayer network metrics with their traditional single-layer counterparts. To maintain consistent measurement standards, both the multilayer network and the single-layer subnetwork are modeled as undirected, unweighted networks in this section.
Figure 8 illustrates the ranking differences between companies based on various centrality metrics (degree centrality, eigenvector centrality, and PageRank centrality) across different years (2012, 2017, and 2021). The vertical axis of each subplot represents the stock codes of listed companies. The red bars represent the multilayer network metric values, while the blue bars show the single-layer network metric values. The final ranking is determined by the sum of the two types of metrics.
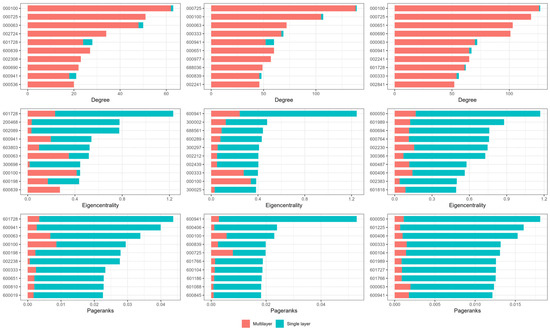
Figure 8.
Stacked visualization of multilayer network metrics for company entities.
Several key insights emerge from the figure. First, there are noticeable differences between the rankings in single-layer and multilayer networks. For example, in terms of degree centrality, the metric for TCL Technology Group Corporation (000100) in the multilayer network is significantly higher than in the single-layer network. This indicates that within the multilayer network structure, TCL Technology has established a broader range of connections, engaging in various digital technologies and creating extensive links across different fields through technological collaboration. The single-layer network fails to fully capture this cross-domain collaboration advantage. Additionally, some companies that rank highly in the single-layer network, such as China Mobile Communications Group Guangdong Co., Ltd. (600941), rank lower in the multilayer network, indicating that their role within the more complex structure of the multilayer network is relatively weaker, as they have not formed widespread cross-layer collaborations. On the other hand, BOE Technology Group Co., Ltd. (000725), exhibits significantly higher degree centrality in the multilayer network compared to the single-layer network. This may be due to BOE’s increasing importance in the digital technology sector, where cross-domain collaborations have significantly boosted the number of nodes it connects with.
Second, differences in rankings emerge based on various metrics. ① Some nodes rank highly in only one or a few metrics. For example, BOE Technology Group (000725) ranks high in degree centrality but struggles to enter the top ranks for eigenvector centrality and PageRank centrality. Based on BOE’s single-layer degree centrality and PageRank centrality data, the company engages in fewer collaborations with other companies and holds a large number of technological elements. However, the importance or authority of these elements in the digital technology field is relatively low, which does not significantly enhance its global influence. ② Eigenvector centrality rankings tend to fluctuate more compared to the other two metrics, which are relatively stable. In Figure 7, only TCL Technology Group (000100) and China Mobile Communications Group Guangdong Co., Ltd. (600941), consistently rank in the top 10 for eigenvector centrality, while rankings fluctuate for other companies. Throughout network evolution, new companies frequently enter the rankings. Eigenvector centrality takes into account not only the number of direct connections a node has but also the importance of those connected nodes. The feedback loop effect of eigenvector centrality causes a node’s centrality to increase when connected to other high-centrality nodes, further enhancing the centrality of its connected nodes. As a result, any change in the network, especially involving high-impact nodes, rapidly affects the entire network due to this feedback mechanism. This effect is particularly evident during network evolution, as the addition of new nodes and the formation of new connections between important nodes quickly shift the distribution of centrality, leading to frequent adjustments in the eigenvector centrality rankings. In contrast, degree centrality is based solely on the number of direct connections, making it more stable. If a company maintains a high number of collaborations with other nodes, even if those nodes have lower influence, its degree centrality remains high. Degree centrality rankings do not fluctuate significantly due to changes in the overall network structure, as they focus only on the number of collaborations, not the influence of the collaborating nodes. While PageRank centrality is similar to eigenvector centrality in that it depends on the quality and authority of connections, its calculation emphasizes the stable “authority” transmission. Since PageRank is computed through multiple iterations to establish a node’s authority, new nodes take time to establish sufficient transmission effects through high-authority nodes. As a result, PageRank is slower to change and does not respond as immediately to global network changes as eigenvector centrality does.
Through graphical comparison, we can observe that the values of eigenvector centrality and PageRank in the single-layer network are significantly higher than those for degree centrality in the same network. The possible reasons for this are as follows: In our analysis, the number of nodes in the company collaboration subnetwork is much smaller than the number of company nodes in the multilayer network. According to the concepts and definitions of these metrics, the number of nodes and network connectivity significantly impact the results of eigenvector centrality and PageRank calculations. In the company collaboration subnetwork, due to the smaller number of nodes, the network is denser, meaning that the remaining companies form more high-impact connections with each other. Additionally, the removal of isolated nodes increases the density of the company collaboration subnetwork in the single-layer network. As a result, in the single-layer network, companies with higher eigenvector centrality and PageRank values are often those that maintain collaborations with other high-impact nodes in the remaining dense network.
In contrast, in the multilayer network, due to the larger number of nodes and the more dispersed nature of the network, companies’ eigenvector centrality and PageRank values tend to be lower. This is because their connected counterparts may not occupy equally central positions within the larger, more complex network.
(2) Temporal Evolution Characteristics of Node Centrality Metrics
Figure 9 illustrates the evolution of the annual average network metrics for all companies within the multilayer network, aiming to analyze the trends in centrality metrics of companies over time.
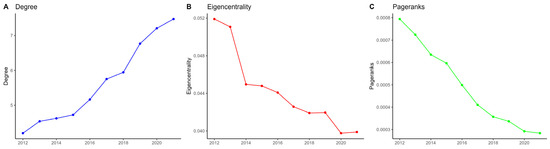
Figure 9.
Evolution process of multilayer network metrics for company entities: multilayer degree centrality, multilayer eigenvector centrality, and multilayer PageRank centrality.
As shown in the figure, degree centrality steadily increased from 2012 to 2021, with a notable rise after 2018. This indicates that, over time, companies’ connections within the multilayer network expanded, and company collaborations and technological convergence became more widespread. An increasing number of companies actively engaged in collaborations within the multilayer network, particularly in patent cooperation and cross-domain technology convergence, leading to more direct collaboration relationships and patent ownership ties. Since the multilayer network integrates both company collaborations and technological convergence layers, companies could participate in a broader range of collaborations across different layers, enhancing their multilayer degree centrality. This trend aligns with the increasing number of digital technology-related patent applications shown in Figure 3.
Multilayer eigenvector centrality, on the other hand, consistently declined from 2012 to 2021. This suggests that while some companies continued collaborating with others, their partners’ importance or influence might have weakened, leading to a decrease in their overall global influence within the network. The decline in eigenvector centrality could reflect changes in the collaboration and technology structures within the network. Initially, some companies gained high multilayer eigenvector centrality by collaborating with influential companies and holding key digital technology elements. However, as more companies and technological elements entered the network, its complexity increased, and relationships between companies became more dispersed. Some companies that previously collaborated with high-impact firms may have shifted to partnering with lower-impact companies, while many companies focusing on independent digital technology innovation entered the network, contributing to the decline in multilayer eigenvector centrality.
Multilayer PageRank centrality was relatively high in 2012 but showed a continuous decline over the following years, reaching its lowest level by 2021. This suggests that the transmissive influence companies gained through collaborations with high-authority nodes diminished over time. Similar to the decline in multilayer eigenvector centrality, the drop in multilayer PageRank centrality may be attributed to changes in collaboration patterns within the multilayer network. As a large number of companies joined the multilayer network system each year, those that had previously collaborated with influential firms began expanding their partnerships to include lower-impact companies. Additionally, the network absorbed many companies engaging in independent digital technology innovation, which led to a gradual decrease in multilayer PageRank centrality over time.
To comprehensively examine the evolutionary characteristics of multilayer network metrics for corporate entities, this study further investigates the dynamic trends in key network metrics in selected representative companies. The selection criteria for these representative firms are based on their ranking within the top five positions of the annual multilayer network metrics scores. The results are shown in Table 6.
Table 6.
Evolutionary trends in multilayer network metrics for core companies.
The analysis of Table 6 reveals significant evolutionary trends in the multilayer network metrics (multilayer degree centrality, multilayer eigenvector centrality, and multilayer PageRank centrality) for core companies, highlighting their dynamic changes within the digital technology multilayer convergence networks from both temporal and metric perspectives. From the temporal dimension, certain companies maintained a strong centrality position over time. For example, Sinopec Corp. (000100) consistently ranked at the top in terms of multilayer degree centrality in 2012, 2017, and 2021, with its centrality rising from 62 to 126, indicating a continuous expansion of its collaborations and technological footprint, thus consolidating its status as a core company. Similarly, BOE Technology Group Co., Ltd. (000725), peaked at 138 in 2017, slightly declining to 119 in 2021, reflecting its extensive linkages and innovation presence across multiple technological fields. This evolution can be attributed to its deep investments in display technology and semiconductor materials, alongside multidimensional corporate partnerships.
In contrast, ZTE Corporation (000063) experienced fluctuations in its multilayer degree centrality, increasing from 48 in 2012 to 72 in 2017, only to decline to 70 by 2021. This fluctuation may be linked to sanctions in international markets and changes in the policy environment, which likely constrained its global presence and collaboration model, thereby affecting its interactive capabilities within the multilayer network. Similarly, Haier Smart Home Co., Ltd. (600690), demonstrated a notable upward trend post-2017, with its multilayer degree centrality rising from 60 in 2017 to 103 in 2021. This can be attributed to strategic investments and a broad layout in emerging digital technologies like smart home systems and the Internet of Things (IoT), significantly enhancing its interactive capabilities and influence within the multilayer network.
From a metric dimension, the three metrics in Table 6 highlight different facets of influence within the multilayer network. Multilayer degree centrality measures the number of direct connections in the network; thus, companies ranking higher in this metric tend to have numerous direct collaborators across various partnerships and technological linkages. BOE and Sinopec’s top ranks indicate their broad direct partnerships across different subnetworks. In contrast, multilayer eigenvector centrality considers not only the quantity but the quality of connections, meaning companies with higher eigenvector centrality (e.g., ZTE and BOE) may have fewer direct connections but are linked to influential core nodes within the network, granting them substantial influence and authority. Lastly, multilayer PageRank centrality emphasizes the level of “trust” within the overall network, assessing a company’s significance across hierarchical layers. Haier’s rise in this metric post-2017 (from 0.2471 to 0.2638 by 2021) suggests it became a more “trusted” player across the multilayer networks, likely due to its expanding business landscape and widespread application of emerging digital technologies like IoT in its product offerings.
Overall, the evolution in rankings and metric variations of these core companies across different time points reflects a complex interplay of technological layout, collaboration strategies, and external environmental factors.
(3) Spatial Evolution Characteristics of Node Centrality Metrics
Figure 10 presents the trends in degree centrality of companies across different regions of China (eastern, central, and western regions). China’s eastern, central, and western regions exhibit distinct economic characteristics and variations in terms of company innovation collaboration, digital economy development, and digital technology patent applications. Overall, the eastern region, supported by a strong economic foundation, abundant technological resources, and robust policy backing, leads in digital economy and technological innovation. The central region, while having certain advantages in absorbing industrial transfers and promoting local innovation, still lags behind the eastern region in overall technological capacity and innovation capabilities. In contrast, the western region remains relatively weak in digital technology and company collaboration but has been steadily developing in recent years due to policy guidance and increased infrastructure investments.
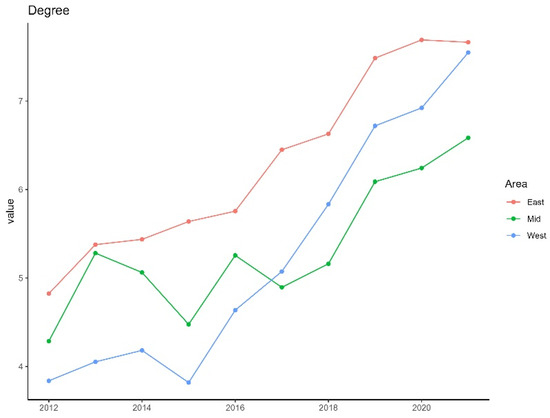
Figure 10.
The trend in the multilayer degree centrality metric among companies located in different regions of China.
As shown in the figure, there are noticeable regional differences in the multilayer degree centrality trends. The multilayer degree centrality of companies in the eastern region (red line) steadily increased from 2012 to 2021, with a particularly significant growth rate after 2016. This suggests that companies in the eastern region have established more direct connections in both collaboration networks and technological convergence, reflecting their strong collaboration capabilities and higher levels of technological convergence. The eastern region, which includes economically developed provinces and cities such as Beijing, Shanghai, Jiangsu, Zhejiang, and Guangdong, forms the core area of China’s economic growth. With a high concentration of companies and strong industrial clustering effects, companies in this region hold a leading position in the application and R&D of digital technologies. The regional collaboration networks, exemplified by the Beijing–Tianjin–Hebei region, the Yangtze River Delta, and the Guangdong–Hong Kong–Macau Greater Bay Area, are highly active. Companies in these areas leverage various forms of collaboration, such as upstream and downstream supply chain partnerships and innovation alliances, to drive technological R&D and market expansion.
Companies in the central region (green line) experienced more fluctuation in degree centrality, peaking in 2014 before declining, but then rising again after 2018. This indicates some instability in the central region’s collaboration activity, likely influenced by various factors. The central region, including provinces such as Henan, Hubei, and Hunan, plays an important role in receiving industrial transfers from the eastern region and developing emerging industries. The region is transitioning from a traditional manufacturing base to a more technology-intensive industrial structure. However, its overall digital economy development is relatively underdeveloped compared to the eastern region. Company innovation collaboration in the central region mainly focuses on absorbing technological spillovers from the eastern region, with partnerships predominantly in the manufacturing and electronic information technology sectors. The innovation networks in this area heavily rely on provincial-level policies and financial support, and the overall collaboration mechanisms still need improvement.
In contrast, companies in the western region (blue line) saw accelerated growth in multilayer degree centrality after 2016, and especially after 2018, catching up rapidly with companies in the eastern region. This reflects significant progress in collaboration and technological convergence in the western region, driven by policy support and regional economic development. The western region, which includes inland provinces such as Sichuan, Shaanxi, and Chongqing, has a relatively low level of economic development, weak technological innovation capacity, and an underdeveloped industrial base. Due to geographical and historical constraints, economic growth and digital economy development in the western region rely heavily on national policies and financial support. Company innovation collaboration is mainly concentrated in traditional industries and resource-based sectors, with limited cross-domain technological cooperation. In recent years, however, driven by the “Western Development Strategy,” there has been an increasing trend in collaboration in the digital economy and technological innovation in this region.
Overall, companies in the eastern region maintained a leading position throughout the period, while those in the western region experienced the fastest growth in recent years. Companies in the central region, despite showing some volatility, gradually improved their performance over time.
Our analysis of the multilayer network metric trends for companies in the eastern, central, and western regions highlights significant spatial differences in regional economic characteristics and digital technology layouts, as illustrated in Table 7.
Table 7.
The evolutionary trends in the multilayer degree centrality among core companies across different regions of China.
From a temporal perspective, companies in the eastern region exhibit consistently high multilayer degree centrality values and maintain a dominant position over the years. For example, BOE Technology Group Co., Ltd. (000725), ranked the highest with degree centrality values of 138 in 2017 and 119 in 2021, while Sinopec Corp. (000100) led in 2012 and 2021 with values of 62 and 126, respectively. This trend indicates that companies in the eastern region have sustained a strong capacity for collaborative innovation and an extensive technological layout in the multilayer network over time. This can be attributed to the region’s robust economic foundation and abundant technological resources, enabling companies to actively engage in cross-domain and inter-company technological collaborations. Additionally, the favorable policy environment and infrastructure advantages in key eastern regions, such as Beijing, Shanghai, and Guangdong Province, have provided favorable conditions for these companies to maintain their interactions in the multilayer networks.
In comparison, while the multilayer degree centrality of central region companies has shown improvement, the overall level still lags behind that of the eastern region. For example, a company in Hubei Province (601766) saw its multilayer degree centrality increase from 9 in 2012 to 25 in 2017 and further to 37 in 2021, indicating a gradually growing role in absorbing industrial transfer from the eastern region and enhancing regional technological innovation. However, compared to the eastern region, central region companies remain constrained by limitations in overall technological capacity and innovation potential. This disparity may be linked to the innovation environment and industrial structure of the central region, which is traditionally dominated by manufacturing industries. Although there have been active efforts to develop emerging industries in recent years, the breadth and depth of digital economic infrastructure and cross-domain technological collaborations still need further enhancement.
For the western region, companies show relatively low overall multilayer degree centrality values, but certain companies have exhibited notable growth trends. For example, a company in Sichuan (600839) ranked first among western region companies in 2012 with a degree centrality value of 27, which increased to 46 in 2017 and 48 in 2021, suggesting a gradual strengthening of cross-domain collaborative capacity within the multilayer network. This change may be driven by the implementation of the “Western Development” policy, which has gradually improved infrastructure and technological resources, thereby enhancing the impact of western companies in technological innovation and the digital economy. Nevertheless, the overall digital economic development level in the western region remains relatively low, with a limited number of companies, and these companies still face challenges in building inter-company and cross-technological collaborations, resulting in weaker influence within the multilayer networks.
From a spatial dimension, Table 7 reveals that companies in the eastern region have consistently maintained an absolute advantage in the multilayer network at various time points, while companies in the central and western regions are relatively marginal. The developed economy and strong technological resource concentration in the eastern region contribute to dense and extensive network connections for its companies. In contrast, the economic development level and industrial structures in the central and western regions differ, leading to more volatile network positions for companies. Particularly under the influence of industrial policies, while the multilayer degree centrality of companies in the central and western regions has increased, it still falls short of the level achieved by companies in the eastern region.
5.3.2. Evolution Characteristics of Technology Entities
(1) Node Centrality Characteristics Across Network Dimensions
Figure 11 illustrates the differences in the rankings of various technologies based on different centrality metrics (degree centrality, eigenvector centrality, and PageRank centrality) for the years 2012, 2017, and 2021.
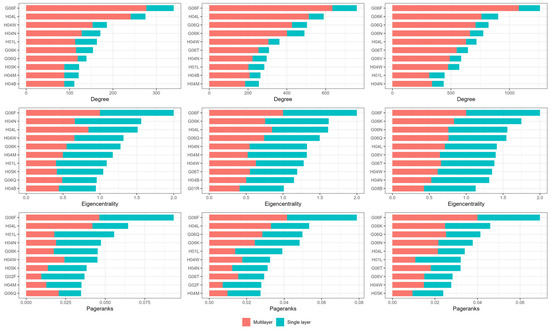
Figure 11.
Stacked visualization of multilayer network metrics for technology entities.
From the figure, several key observations can be made. First, there are notable differences between the rankings in single-layer and multilayer networks. ① In the multilayer degree centrality comparison, G06F (electronic data processing) ranks high in both the single-layer and multilayer networks, indicating that this technology holds a central position with many direct connections in both types of networks. However, for some other IPC codes, there are differences between the degree centrality in single-layer and multilayer networks. For example, H04L (transmission of digital information) has a higher degree centrality in the multilayer network than in the single-layer network, suggesting that this technology plays a more important role in multilayer collaboration and technological convergence, likely reflecting its dual activity in both technology and corporate collaborations. ② The differences between the rankings in eigenvector centrality and PageRank centrality are even more pronounced between the single-layer and multilayer networks. For instance, G06F has higher eigenvector and PageRank centrality in the multilayer network, reflecting its close association with multiple technologies and strong influence within corporate collaboration networks. In contrast, certain IPC codes like H04B (wireless communication technology) have higher centrality in the single-layer network but rank lower in the multilayer network, indicating weaker associations with other companies in the multilayer network and more frequent use by only a few companies.
Second, some key technologies maintain their dominant influence in the multilayer network. G06F (electronic data processing systems), H04L (transmission or communication of digital information), G06K (data recognition and processing), H04W (wireless communication networks), and G06Q (data processing for business, administrative, or management purposes) consistently rank high in degree centrality, eigenvector centrality, and PageRank centrality throughout the period. This reflects their widespread application and global influence in both technological convergence and corporate collaboration. These technologies not only hold a strong influence within their respective technological fields but also continue to enhance their role in cross-domain innovation and corporate cooperation through collaboration and convergence with other technologies. This underscores how the combined forces of technological convergence and corporate collaboration have driven the continuous evolution and dominant position of these core technologies.
Third, technological convergence has altered influence rankings. Over time, certain IPC codes have shown significant changes in their rankings across different centrality metrics. For example, G06K (data recognition and processing) was only highly ranked in eigenvector centrality in 2012, but by 2017 and 2021, its ranking had dramatically improved across all three metrics. This indicates that data recognition technology has gained increasing influence during the process of technological convergence, particularly in its importance to corporate collaboration and cross-domain applications. Technological convergence has expanded the application areas of these key technologies, increasing their influence not only within their own technology convergence subnetwork but also across the broader multilayer network through corporate collaboration.
Fourth, fluctuations in PageRank and eigenvector centrality reflect shifts in technological authority. Some IPC codes experience considerable volatility in PageRank and eigenvector centrality rankings. For instance, H04L (digital information transmission) performed well in both 2012 and 2017, but its PageRank ranking dropped in 2021. This could indicate that, as technology evolves, the authority of digital information transmission in cross-layer collaboration has gradually been replaced by emerging technologies, particularly as high-authority node connections have shifted towards other fields, such as data recognition and processing technologies. These changes in ranking reflect how, during the process of technological convergence, companies have progressively shifted their collaborative focus toward newer and more forward-looking technological fields.
(2) Temporal Evolution Characteristics of Node Centrality Metrics
Figure 12 shows the annual evolution of the average network metrics for all technology entities within the multilayer network, aiming to analyze the trends in centrality metrics of technology entities over time.
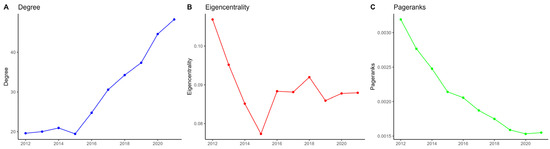
Figure 12.
Evolution process of multilayer network metrics for technology entities: multilayer degree centrality, multilayer eigenvector centrality, and multilayer PageRank centrality.
First, multilayer degree centrality exhibits a continuous upward trend, with accelerated growth, particularly after 2016. This suggests a significant increase in the number of direct connections between technology entities over time, indicating a broadening scope of technological convergence. Second, multilayer eigenvector centrality was relatively high in 2012 but experienced considerable fluctuations afterward, reflecting dynamic changes in the influence of technology entities. Although the breadth of collaboration expanded, the tight connections with high-impact technologies weakened, resulting in instability in eigenvector centrality. Finally, multilayer PageRank centrality peaked in 2012 and declined each year thereafter, showing a gradual weakening of authority transmission among technology entities in the network. This decline may be due to the introduction of emerging technologies and the diffusion of influence from authoritative nodes.
Overall, these centrality metrics reflect the dynamic changes in the roles and influence of technology entities within the multilayer network. Specifically, they highlight the increasing interconnectedness and expanding reach of these entities (multilayer degree centrality), the fluctuating prominence and shifting influence within key technological clusters (multilayer eigenvector centrality), and the gradual dilution of centralized authority as new technologies emerge and influence becomes more distributed (multilayer PageRank centrality).
Table 8 illustrates the evolutionary trends in core technologies in terms of multilayer degree centrality, multilayer eigenvector centrality, and multilayer PageRank centrality. It further highlights the dynamic shifts in different technologies within digital technology multilayer convergence networks and their varying levels of importance over time.
Table 8.
Evolutionary trends in multilayer network metrics for core technologies.
From a temporal perspective, G06F (electronic data processing) consistently holds a leading position across all three metrics from 2012 to 2021, indicating its growing centrality and stability within the network. Specifically, its multilayer degree centrality increased significantly from 277 in 2012 to 1080 in 2021, reflecting an expanding capacity for cross-domain collaborations in the patent co-occurrence network. This growth may be attributed to the widespread application and rapid advancements in computing, data processing, and artificial intelligence, which have solidified G06F’s connectivity and relevance across diverse subnetworks.
In contrast, H04L (digital information transmission) and H04W (wireless communication networks) have also experienced significant increases in centrality metrics over the years, yet they were overtaken by other technologies in 2021. For instance, H04L’s multilayer degree centrality rose from 241 in 2012 to 629 in 2021, while H04W’s value increased from 153 to 710 over the same period. However, by 2021, G06K (optical recognition) and G06N (neural network models) surpassed them. This shift suggests that as technology convergence deepens, the impact of traditional communication technologies is being increasingly eclipsed by emerging fields like computer vision and artificial intelligence. This trend could be linked to the rapid expansion of technologies related to data processing, intelligent recognition, and automation within the digital economy, making these newer technologies more dominant in innovation networks.
In terms of multilayer eigenvector centrality, G06F remained the highest (1.000) throughout the three periods, reinforcing its solid central position in the network. H04L, while ranking second in 2012, dropped to fifth in 2021. This indicates that although H04L maintains significant cross-network influence, its overall weight in the network has diminished. Meanwhile, G06K and G06Q (data processing for business management) saw marked improvements in eigenvector centrality, rising from 0.548 and 0.021 in 2012 to 0.836 and 0.761 in 2021, respectively. This trend suggests that G06K and G06Q are gaining prominence as core technologies in multilayer networks, potentially due to their growing relevance in digital economy fields such as image recognition, smart manufacturing, and data management.
For the multilayer PageRank centrality metric, G06F similarly held the highest score in each year but saw a decline from 1.000 in 2017 to 0.040 in 2021. This indicates that although it remains a core technology, its relative “voting power” in the network has weakened. This reduction could be due to the emergence of other key technologies (e.g., G06N) that have gained prominence and thus diluted G06F’s influence across the multilayer network. Technologies such as G06N and G06Q saw their PageRank values increase to 0.025 and 0.022 in 2021, reflecting their strengthening ties and increased significance in cross-domain collaborations. The rise of these technologies demonstrates their growing role as critical nodes in the process of technology convergence and network expansion.
In summary, Table 8 reveals distinct evolutionary characteristics of core technologies in the multilayer network over time. G06F has consistently shown strong centrality across all three metrics, highlighting its dominant role in cross-domain and cross-network convergence. Meanwhile, traditional communication technologies like H04L and H04W have gradually been replaced by newer fields, such as G06K (computer vision) and G06N (artificial intelligence), indicating a dynamic shift in the digital technology network toward emerging technologies. This trend suggests that, as digital economies and technological frontiers continue to advance, these emerging technologies are becoming the primary drivers of cross-domain innovation and collaboration.
(3) Spatial Evolution Characteristics of Node Centrality Metrics
Figure 13 illustrates the trends in degree centrality of technology entities across different regions of China (eastern, central, and western regions). As shown in the figure, technological convergence multilayer degree centrality in the eastern, central, and western regions exhibits a general upward trend, with a significant increase in the number of direct connections between technology entities in the collaboration network, especially after 2016.
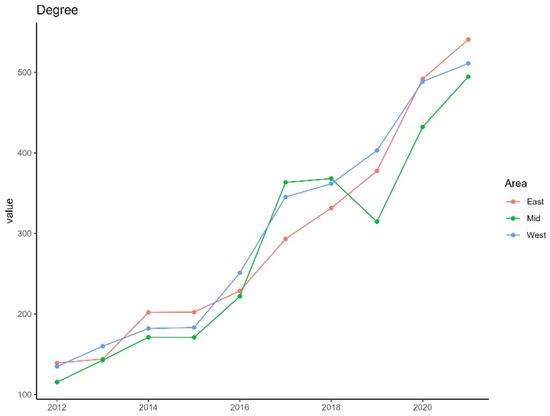
Figure 13.
Trends in the multilayer degree centrality metric of technological nodes across different regions of China.
The eastern region (red line) shows steady growth and consistently maintains a high level of multilayer degree centrality in technological convergence throughout the period, reflecting its strong capacity for cooperation and innovation in the field of digital technology. The central region (green line) experiences fluctuating growth. Although in some years (e.g., 2016) its degree of technological convergence surpassed that of the eastern and western regions, it subsequently experienced a noticeable decline, indicating some instability in its technological collaboration efforts. In contrast, the western region (blue line) demonstrates significant growth in technological convergence degree centrality, with accelerated growth, particularly after 2016. This suggests rapid progress in technological cooperation and innovation, gradually narrowing the gap with the eastern region.
Overall, the multilayer degree centrality of technological convergence in all three regions is on the rise, reflecting deepening technological collaboration. However, the speed and stability of development vary across regions.
The analysis of Table 9 shows distinct temporal and spatial variations in core IPCs across China’s eastern, central, and western regions, revealing how technology convergence is influenced by these factors. G06F (electronic data processing) saw a remarkable increase across all regions, particularly in the eastern region, where its frequency soared from 6940 in 2012 to 99,823 in 2021, reflecting its growing importance in digital technologies. H04L (digital information transmission) displayed notable growth in the eastern and central regions, whereas the western region lagged behind. H01L (semiconductor devices) also exhibited rapid growth in the eastern and central regions, driven by regional industrial upgrading efforts. Spatially, the eastern region remains the primary hub for core technologies, benefiting from strong economic foundations and policy support. The central region experienced more volatility in its technological evolution due to its transitional role in absorbing industrial transfers. The western region, despite its lower frequencies, showed accelerated growth in recent years, largely due to national policy support and infrastructure investments. These patterns suggest that while the eastern region continues to lead, the central and western regions are gradually strengthening their positions, yet they still face significant gaps compared to the eastern region.
Table 9.
The evolutionary trends in the multilayer degree centrality among core technologies across different regions of China.
6. Conclusions and Discussion
6.1. Conclusions
This study examines the structural evolution of both overall networks and individual entities, using data from Chinese A-share listed companies and their patent filings from 2012 to 2021. The main conclusions are as follows:
(1) The digital technology multilayer convergence network has evolved to enhance convergence, efficiency, and cross-domain collaboration among diverse technological fields and companies. The analysis of the digital technology multilayer convergence network from 2012 to 2021 reveals several key trends and transformations. First, the overall network size and complexity increased significantly, indicating an expansion in both the diversity of technological fields involved and the number of companies participating in digital technology innovation. The network structure evolved from a scattered and decentralized pattern to a more centralized and cohesive model, characterized by the emergence of key nodes that serve as collaboration hubs. This transition points to a growing concentration of resources and partnerships around central players in the network. Second, the network’s cross-layer connectivity density showed a more pronounced increase compared to the individual subnetworks, reflecting intensified cross-domain interactions and collaboration between technology domains and companies. Third, while the network diameter remained relatively stable, the decrease in average path length and the increase in clustering coefficient indicate that the efficiency of knowledge dissemination and collaboration has improved over time. Finally, the declining modularity index suggests a reduction in the segmentation of the network, implying more integrated cross-domain collaborations and a stronger focus on technology convergence within the digital technology sector.
(2) The company collaboration subnetwork evolved from a fragmented and decentralized structure into a more centralized and cohesive network, characterized by increased collaboration intensity, enhanced connectivity, and broader convergence among companies. The evolution of the company collaboration subnetwork can be summarized into three main phases: emergence, growth, and expansion. Initially, the subnetwork was fragmented, with limited collaboration between companies forming small-scale groups, reflecting the early stage of digital technology cooperation. As the network entered the growth phase, both the number of nodes and collaboration frequency increased significantly, forming a core–periphery structure where key companies began to take central roles. During the expansion phase, the network structure shifted from localized collaboration groups to a more interconnected and cohesive pattern, with high-frequency collaboration between multiple groups, indicating a boom in technological collaboration activities. Over time, the collaboration subnetwork evolved from a decentralized to a more centralized and integrated structure, enhancing both collaboration intensity and connectivity among companies. In addition, the depth of collaboration, measured by total collaboration weight, increased dramatically, suggesting that partnerships not only expanded in scale but also became more robust and efficient. The network metrics further illustrate these changes, with a fluctuating but overall decreasing clustering coefficient, declining average path length, and growing network diameter, indicating an increase in collaboration breadth and a shift towards broader, more dispersed networks.
(3) The technology convergence subnetwork evolved from a weakly connected structure into a highly interconnected and complex system, characterized by increased cross-domain interactions, tighter connections, and enhanced innovation efficiency driven by digital technology growth. The evolution of the technology convergence subnetwork reveals distinct phases of structural transformation: emergence, growth, and expansion. Initially, the subnetwork featured a relatively complete but weakly connected structure, with low cross-domain convergence and limited digital technology applications. As the network entered the growth phase, cross-domain interactions increased significantly, resulting in the formation of multiple central technological clusters that expanded beyond single fields. During the expansion phase, the subnetwork developed into a highly interconnected system with a substantial increase in the frequency and diversity of cross-domain technology convergence, driven by the rapid growth of digital technologies. The network metrics reflect these changes, showing a continuous rise in the number of nodes and edges, a reduction in network diameter, and increasing network density, indicating tighter and more direct connections between technological fields. Furthermore, the growing total co-occurrence weight and high clustering coefficient highlight a deepening of local technological convergence and an intensification of cross-domain innovation, making the subnetwork a complex system with enhanced efficiency and synergy in technology convergence.
(4) The comparison between single-layer and multilayer network centrality rankings shows that accurately assessing companies’ influence and roles in complex digital technology networks requires considering cross-domain collaborations and multilayer interactions. The analysis of company entities’ evolution within the multilayer network reveals distinct structural characteristics and varying roles of firms based on different centrality metrics (degree, eigenvector, and PageRank centrality). First, companies display significant ranking differences between single-layer and multilayer networks. Some firms, like TCL Technology and BOE Technology, demonstrate higher centrality in the multilayer network due to their extensive cross-domain collaborations, while others, such as China Mobile, show lower rankings, reflecting weaker roles in cross-layer interactions. Second, the impact of centrality metrics varies, with degree centrality showing more stability over time, while eigenvector centrality fluctuates rapidly due to its sensitivity to changes in connected nodes’ importance. PageRank centrality, although similar to eigenvector centrality, exhibits more stable rankings due to its reliance on iterative calculations of authority. Finally, the smaller scale and denser structure of the single-layer network result in higher eigenvector centrality and PageRank values, emphasizing the impact of local collaborations. In contrast, the larger and more dispersed multilayer network structure leads to lower centrality values, highlighting the differences in influence and connectivity among firms across the multilayer network.
(5) The temporal evolution of centrality metrics shows that companies’ connectivity and influence within the digital technology multilayer network depend on their collaboration scope, strategic positioning, and responses to external changes. The temporal evolution of centrality metrics for companies within the digital technology multilayer network reveals dynamic changes in their connectivity and influence patterns. Degree centrality exhibited a continuous upward trend, indicating an expansion in direct collaborations and cross-domain technology convergence, particularly after 2018. In contrast, both eigenvector and PageRank centralities declined steadily, suggesting a weakening of companies’ global influence and authoritative roles within the network as new firms entered, and collaboration patterns became more dispersed. The analysis of representative firms shows varying trends in centrality, reflecting the impact of strategic investments, collaboration shifts, and external factors such as international sanctions. For instance, firms like BOE Technology and Sinopec maintained high degree centrality due to their broad partnerships, while Haier Smart Home demonstrated a rise in PageRank centrality, indicating increased trust and influence in the digital innovation landscape.
(6) The regional disparities in company degree centrality evolution highlight that company collaboration and technological convergence in the digital technology multilayer network are significantly influenced by economic foundations, resource availability, and policy support. The temporal and spatial evolution of company degree centrality in the digital technology multilayer network reveals significant regional disparities and dynamic changes over time. Companies in the eastern region consistently maintain a dominant position with higher degree centrality values, reflecting strong collaborative capabilities and advanced digital technology convergence. This is driven by the region’s robust economic foundation, abundant technological resources, and favorable policy environment. The central region shows fluctuating trends, gradually improving its collaboration activities, but still lags behind the eastern region due to its relatively weaker technological capacity and innovation potential. The western region, while starting from a low base, has experienced accelerated growth in recent years, driven by national policy support and infrastructure investments. However, it remains limited in terms of cross-domain collaborations and overall innovation capacity compared to the eastern region.
(7) Technological convergence in the multilayer network reshapes the influence and importance of core and emerging technologies. The analysis of the evolution characteristics of technology entities in the multilayer network reveals significant differences in technology centrality rankings between single-layer and multilayer networks. Technologies such as G06F (data processing systems) and H04L (transmission of digital information) exhibit higher degree centrality in the multilayer network, reflecting their critical roles in cross-domain collaborations. Core technologies like G06F, H04L, and G06Q maintain high rankings across multiple centrality metrics, demonstrating their strong and stable influence in technological convergence and corporate collaborations. Additionally, certain technologies, like G06K (data recognition and processing), have increased their influence significantly over time due to expanding applications in cross-domain innovation. Conversely, some technologies experience declines in their PageRank and eigenvector centrality, indicating shifts in technological authority as newer fields gain prominence.
(8) The evolving influence and importance of technologies in the multilayer network indicate that traditional communication technologies are being replaced by emerging fields such as artificial intelligence and computer vision, which are now the primary drivers of cross-domain collaboration and innovation. The temporal evolution of technology entities in the multilayer network reveals distinct patterns of change in their centrality metrics, highlighting the dynamic shifts in influence and importance of different technologies. Core technologies such as G06F (data processing) consistently maintained high rankings across all centrality metrics, reflecting their critical role in technological convergence and cross-domain innovation. However, traditional communication technologies like H04L (digital information transmission) and H04W (wireless communication networks) have gradually been surpassed by emerging technologies such as G06K (computer vision) and G06N (neural networks), which have gained prominence in the network.
(9) The spatial evolution of technological convergence in China reveals that regional disparities in collaboration capabilities result in varying speeds and stability of technological development across the eastern, central, and western regions. The spatial evolution of technological convergence in China’s eastern, central, and western regions shows distinct growth patterns in degree centrality, reflecting regional disparities in technological collaboration capabilities. The eastern region consistently maintains a high degree of technological convergence, indicating its strong and stable capacity for innovation and collaboration. The central region, while experiencing periods of rapid growth, shows fluctuations and instability in its convergence efforts. Meanwhile, the western region, starting from a low base, has shown accelerated growth in technological convergence since 2016, gradually narrowing the gap with the eastern region.
6.2. Discussion
6.2.1. Management Recommendations for Companies
(1) Strengthen cross-domain technological collaboration. Companies should actively engage in cross-domain collaborations to leverage the benefits of technology cross-domain convergence. By forming strategic partnerships and participating in digital technology multilayer convergence networks, companies can enhance their technological influence and create new opportunities for cross-domain applications.
(2) Prioritize investment in emerging core technologies. Companies should prioritize investment in emerging core technologies such as artificial intelligence, computer vision, and data processing to stay competitive. Focusing on these technologies will enable firms to build core competencies and respond to the shifting dynamics of digital technology convergence.
(3) Develop a centralized innovation strategy. As digital technology multilayer convergence networks become more centralized, companies should establish centralized innovation strategies to consolidate resources around key technological areas. This includes creating dedicated R&D units to focus on high-impact core technologies and building internal networks to facilitate cross-departmental knowledge sharing.
(4) Enhance participation in multilayer networks. Companies should aim to enhance their positions within multilayer networks by integrating across different technological domains and corporate collaborations. This will increase their overall network centrality and allow them to influence multiple sectors simultaneously.
(5) Adapt to regional technological dynamics. Companies in different regions should adapt their innovation strategies based on local technological dynamics and resource availability. Companies in less developed regions should seek external partnerships and leverage national policies to enhance their technological capacity and cross-domain collaboration.
6.2.2. Management Recommendations for Government
(1) Promote cross-regional technological convergence. Governments should develop policies to promote cross-regional technological convergence, especially between developed and less developed regions. Encouraging inter-regional collaboration can help balance the development of digital technology and reduce regional disparities.
(2) Support the development of emerging technology clusters. Governments should focus on supporting the development of clusters in emerging core technologies, such as artificial intelligence, big data, and intelligent manufacturing. Providing targeted funding and creating innovation hubs can stimulate rapid growth in these strategic areas.
(3) Facilitate multilayer network participation for SMEs. Smaller companies often struggle to participate in complex multilayer networks. Governments can create platforms and policy incentives to facilitate the integration of small- and medium-sized companies (SMEs) into these networks, helping them access larger collaboration ecosystems.
(4) Create innovation-friendly policy environments. Governments should create innovation-friendly environments through favorable policies, streamlined regulatory frameworks, and tax incentives to encourage companies to invest in R&D and participate in technology cross-domain convergence activities.
(5) Establish national platforms for cross-domain collaboration. Governments should establish national-level platforms to facilitate cross-domain collaboration and technology convergence. These platforms can serve as hubs for information sharing, resource integration, and cross-domain innovation, enhancing the overall efficiency of digital technology development.
Author Contributions
Conceptualization, T.L. and Q.W.; data curation, T.H. and Q.W.; formal analysis, T.L. and Q.W.; funding acquisition, T.L.; investigation, Q.W.; methodology, Q.W.; project administration, T.L.; resources, Q.W.; software, Q.W. and T.H.; supervision, T.L.; validation, Q.W. and Q.T.; visualization, Q.W., T.H. and Q.T.; writing—original draft preparation, Q.W.; writing—review and editing, Q.W., T.L. and Q.T.; All authors have read and agreed to the published version of the manuscript.
Funding
This research was funded by the Ministry of Education of the People’s Republic of China, grant number 19YJC630129.
Data Availability Statement
Please ask the corresponding author for study data.
Conflicts of Interest
The authors declare no conflicts of interest.
Appendix A
Table A1.
Basic information of sample companies (120 in total).
Table A1.
Basic information of sample companies (120 in total).
| Code | Year | Company Name | Turnover (RMB) | Net Profit (RMB) | Number of Employees (People) | Number of Patent Applications | Multilayer Degree Centrality |
|---|---|---|---|---|---|---|---|
| 000063 | 2012 | ZTE Corporation | 86,254,456,000 | 2,243,093,000 | 143,957 | 1546 | 48 |
| 000063 | 2017 | ZTE Corporation | 101,233,182,000 | −1,407,869,000 | 133,797 | 2106 | 72 |
| 000063 | 2021 | ZTE Corporation | 101,450,670,000 | 4,721,692,000 | 139,256 | 1005 | 70 |
| 000725 | 2012 | BOE Technology Group Co., Ltd. | 12,741,413,562 | 693,677,317 | 22,980 | 512 | 51 |
| 000725 | 2017 | BOE Technology Group Co., Ltd. | 68,895,658,963 | 2,045,170,759 | 185,586 | 2804 | 138 |
| 000725 | 2021 | BOE Technology Group Co., Ltd. | 135,552,569,729 | 4,528,270,416 | 217,713 | 3312 | 119 |
| 000100 | 2012 | TCL Technology Group Corporation | 60,751,550,000 | 1,671,051,000 | 69,054 | 474 | 62 |
| 000100 | 2017 | TCL Technology Group Corporation | 106,473,500,000 | 2,137,540,000 | 225,366 | 1033 | 105 |
| 000100 | 2021 | TCL Technology Group Corporation | 76,677,238,000 | 5,065,204,000 | 197,935 | 1599 | 126 |
| 000938 | 2012 | H3C Technologies Co., Ltd. | 5,315,084,588.89 | 44,381,480.47 | 605 | 191 | 7 |
| 000938 | 2017 | Unigroup Guoxin Microelectronics Co., Ltd. | 27,709,709,064.34 | 1,193,527,377.35 | 37,329 | 368 | 20 |
| 000938 | 2021 | Unisplendour Software Systems Co., Ltd. | 60,083,923,906.80 | 3,064,460,359.72 | 51,441 | 331 | 25 |
| 000977 | 2012 | Inspur Electronic Information Industry Co., Ltd. | 1,232,801,706.77 | 76,803,544.85 | 1448 | 94 | 16 |
| 000977 | 2017 | Inspur (Beijing) Electronic Information Industry Co., Ltd. | 12,667,745,961.86 | 283,541,472.05 | 11,103 | 1344 | 57 |
| 000977 | 2021 | Inspur Electronic Information Industry Co., Ltd. | 63,037,990,367.04 | 1,508,972,147.09 | 22,263 | 406 | 39 |
| 002396 | 2012 | Fujian Centerm Information Co., Ltd. | 2,644,270,656.53 | 267,358,410.04 | 5757 | 94 | 15 |
| 002396 | 2017 | Fujian Star-Net Communication Co., Ltd. | 5,687,658,283.03 | 557,400,415.01 | 26,950 | 97 | 17 |
| 002396 | 2021 | Fujian Star-Net Ruijie Communications Co., Ltd. | 10,304,234,309.56 | 593,439,594.46 | 33,880 | 125 | 28 |
| 600601 | 2012 | Founder Technology Group Co., Ltd. | 6,221,835,725.56 | 152,275,751.91 | 11,652 | 66 | 17 |
| 600601 | 2017 | Zhuhai Founder PCB Co., Ltd. | 6,613,713,691.58 | 67,038,464.62 | 16,018 | 36 | 8 |
| 600601 | 2021 | Zhuhai Founder Technology Hi-Density PCB Co., Ltd. | 5,972,546,390.58 | −920,983,996.95 | 13,680 | 40 | 16 |
| 600690 | 2012 | Qingdao Haier Air Conditioner Co., Ltd. | 73,852,551,822.20 | 3,650,647,741.81 | 115,954 | 55 | 22 |
| 600690 | 2017 | Haier Smart Home Co., Ltd. | 119,132,261,662.60 | 6,695,980,185.55 | 153,792 | 81 | 32 |
| 600690 | 2021 | Haier Smart Home Co., Ltd. | 209,723,430,081.03 | 11,329,152,124.25 | 209,748 | 1790 | 101 |
| 600498 | 2012 | Fiberhome Telecommunication Technologies Co., Ltd. | 7,051,573,294.35 | 512,079,972.22 | 17,247 | 52 | 9 |
| 600498 | 2017 | FiberHome Telecommunication Technologies Co., Ltd. | 17,361,078,282.69 | 794,621,525.68 | 27,465 | 136 | 21 |
| 600498 | 2021 | Fiberhome Telecommunication Technologies Co., Ltd. | 21,074,437,344.29 | 142,865,318.55 | 33,228 | 161 | 27 |
| 002373 | 2012 | Beijing Qianfang Technology Group Co., Ltd. | 638,872,098 | 12,304,148.23 | 701 | 48 | 14 |
| 002373 | 2017 | Beijing Qi’anxin Group Co., Ltd. | 2,344,834,887.05 | 412,216,570.43 | 5182 | 37 | 14 |
| 002373 | 2021 | Beijing Qianfang Technology Co., Ltd. | 9,418,895,592.43 | 1,151,417,937.74 | 21,270 | 144 | 26 |
| 600536 | 2012 | China Standard Software Co., Ltd. | 2,349,756,963.61 | 150,809,852.48 | 11,121 | 46 | 7 |
| 600536 | 2017 | Guangzhou Zhongruan Information Technology Co., Ltd. | 4,529,778,511.92 | 118,506,980.11 | 13,550 | 95 | 13 |
| 600536 | 2021 | Chinasoft International Limited | 7,408,151,562.49 | 165,010,221.56 | 24,158 | 90 | 11 |
| 002308 | 2012 | Vtron Group Co., Ltd. | 909,991,943.76 | 258,385,221.31 | 1274 | 45 | 23 |
| 002308 | 2017 | Vtron Group Co., Ltd. | 1,050,631,623.47 | 182,776,966.28 | 7308 | 14 | 9 |
| 002308 | 2021 | Vtron Group Co., Ltd. | 640,838,989.91 | 30,920,754.94 | 2528 | 12 | 5 |
| 600839 | 2012 | Sichuan Changhong Electric Co., Ltd. | 52,003,328,326.13 | 311,656,262.71 | 127,237 | 45 | 27 |
| 600839 | 2017 | Sichuan Changhong Electric Co., Ltd. | 67,175,343,225.71 | 1,159,434,277.68 | 120,713 | 233 | 46 |
| 600839 | 2021 | Sichuan Changhong Electric Co., Ltd. | 94,448,167,904.45 | 235,023,396.72 | 98,838 | 138 | 48 |
| 600198 | 2012 | Xi’an Datang Telecom Co., Ltd. | 5,352,960,205.70 | 187,022,904.36 | 9859 | 41 | 15 |
| 600198 | 2017 | Xi’an Datang Telecom Co., Ltd. | 7,229,672,814.11 | −1,807,559,173.73 | 6371 | 36 | 17 |
| 600198 | 2021 | Datang Microelectronics Technology Co., Ltd. | 1,626,308,698.67 | −1,691,521,800.79 | 2905 | 15 | 6 |
| 002387 | 2012 | Visionox Display Technology Co., Ltd. | 857,204,906.20 | 102,822,651.55 | / | 39 | 14 |
| 002387 | 2017 | Visionox Technology Co., Ltd. | 159,157,619.38 | 26,185,425.90 | 5046 | 110 | 23 |
| 002387 | 2021 | Visionox Technology Co., Ltd. | 3,434,331,072.15 | 254,875,078.14 | 19,794 | 164 | 37 |
| 600060 | 2012 | Hisense Visual Technology Co., Ltd. | 23,523,723,550.20 | 1,711,798,844.96 | 45,998 | 38 | 14 |
| 600060 | 2017 | Hisense Visual Technology Co., Ltd. | 31,832,456,026.90 | 1,789,156,287.10 | 40,352 | 96 | 25 |
| 600060 | 2021 | Hisense Visual Technology Co., Ltd. | 39,314,718,113.16 | 1,525,567,216.96 | 36,770 | 273 | 37 |
| 000727 | 2012 | Nanjing Huashuichuan Electronic Technology Co., Ltd. | 729,701,500.55 | −27,937,482.30 | 3789 | 36 | 16 |
| 000727 | 2017 | TPV Technology Co., Ltd. | 1,576,591,996.21 | 83,454,880.78 | 24,151 | 74 | 13 |
| 000727 | 2021 | Nanjing Huarui Technology Co., Ltd. | 68,555,500,818.17 | 1,017,554,047.69 | 68,202 | 9 | 12 |
| 300002 | 2012 | Beijing Shenzhou Taiyue Software Co., Ltd. | 1,157,258,089.53 | 351,196,493.68 | 4567 | 36 | 7 |
| 300002 | 2017 | Beijing Shenzhou Taiyue Software Co., Ltd. | 2,936,581,930.55 | 469,059,073.76 | 12,678 | 47 | 13 |
| 300002 | 2021 | Beijing Shenzhou Taiyue Technology Co., Ltd. | 3,595,794,691.29 | 327,347,435.86 | 8367 | 41 | 13 |
| 000016 | 2012 | Konka Group Co., Ltd. | 16,217,619,883.23 | 24,179,368.02 | 20,798 | 33 | 14 |
| 000016 | 2017 | Konka Group Co., Ltd. | 20,299,348,136.21 | 92,175,358.08 | 53,466 | 8 | 6 |
| 000016 | 2021 | Konka Group Co., Ltd. | 50,351,836,554.87 | 540,073,462.44 | 48,714 | 61 | 33 |
| 000050 | 2012 | Tianma Microelectronics Co., Ltd. | 4,614,967,219 | 257,435,132 | 7198 | 32 | 12 |
| 000050 | 2017 | Shanghai Tianma Microelectronics Co., Ltd. | 10,736,756,430.53 | 569,177,393.37 | 49,623 | 136 | 18 |
| 000050 | 2021 | Tianma Microelectronics Co., Ltd. | 29,232,745,052.03 | 1,474,521,450.09 | 80,391 | 323 | 44 |
| 002594 | 2012 | BYD Company Limited | 48,826,919,000 | 1,595,076,000 | 166,411 | 31 | 18 |
| 002594 | 2017 | BYD Company Limited | 103,469,997,000 | 5,480,012,000 | 602,847 | 74 | 33 |
| 002594 | 2021 | BYD Company Limited | 156,597,691,000 | 6,013,963,000 | 864,558 | 102 | 35 |
| 600050 | 2012 | Beijing Telecom Planning & Design Institute Co., Ltd. | 215,518,511,458 | 4,187,965,385 | 434,871 | 30 | 9 |
| 600050 | 2017 | Beijing Institute of Telecom Planning & Design Co., Ltd. | 274,196,782,481 | 479,916,340 | 530,058 | 49 | 8 |
| 600050 | 2021 | Unicom Huasheng Co., Ltd. | 303,838,070,591 | 12,524,922,876 | 535,312 | 265 | 40 |
| 002185 | 2012 | Tian Shui Hua Tian Electronic Group Co., Ltd. | 1,308,920,880.27 | 79,778,168.87 | 5515 | 29 | 2 |
| 002185 | 2017 | Tianshui Huatian Technology Co., Ltd. | 5,475,027,849.36 | 413,280,817.05 | 36,783 | 16 | 9 |
| 002185 | 2021 | Tianshui Huatian Technology Co., Ltd. | 8,382,084,225 | 820,191,998.55 | 88,797 | 34 | 13 |
| 600100 | 2012 | Tongfang Co., Ltd. | 20,962,049,866.56 | 868,525,565.79 | 29,457 | 28 | 17 |
| 600100 | 2017 | Tsinghua Tongfang Co., Ltd. | 27,174,336,861.87 | 4,700,784,866.28 | 27,161 | 70 | 25 |
| 600100 | 2021 | Tongfang Co., Ltd. | 25,907,048,214.04 | 312,622,584.42 | 23,180 | 68 | 26 |
| 300077 | 2012 | Nationz Technologies Inc. | 571,376,200.87 | 107,714,577.2 | 680 | 26 | 10 |
| 300077 | 2017 | Nationz Technologies Inc. | 706,124,094.84 | 101,244,154.02 | 2557 | 11 | 9 |
| 300077 | 2021 | National Integrated Circuit Co., Ltd. | 379,707,203.30 | −6,535,064.34 | 3180 | 10 | 8 |
| 600406 | 2012 | NARI Technology Co., Ltd. | 4,660,016,950.72 | 856,170,369.12 | 5314 | 26 | 9 |
| 600406 | 2017 | NARI Technology Development Co., Ltd. | 28,248,377,857.25 | 3,536,974,476 | 11,795 | 131 | 20 |
| 600406 | 2021 | NARI Technology Co., Ltd. | 38,502,411,143.75 | 5,211,653,369.90 | 19,243 | 312 | 34 |
| 600271 | 2012 | Aerospace Information Co., Ltd. | 11,539,776,579.11 | 1,281,695,620.66 | 27,590 | 24 | 10 |
| 600271 | 2017 | Aerospace Information Co., Ltd. | 25,613,776,557.12 | 2,208,959,088.01 | 41,768 | 114 | 23 |
| 600271 | 2021 | Aerospace Information Co., Ltd. | 21,812,692,364.86 | 2,078,010,115.33 | 39,038 | 298 | 30 |
| 600485 | 2012 | Beijing Zhongchuang Measurement & Control Co., Ltd. | 257,430,184.74 | 21,237,376.59 | 943 | 23 | 5 |
| 600485 | 2017 | Beijing Xinwei Telecom Technology Co., Ltd. | 3,087,968,844.13 | 1,599,895,630.01 | 3859 | 45 | 7 |
| 600485 | 2021 | Beijing Zhongchuang Information Technology Co., Ltd. | 23,211,512.02 | −349,319,536.58 | / | 2 | 1 |
| 600879 | 2012 | Beijing Microelectronics Technology Institute Co., Ltd. | 3,508,897,565.37 | 169,339,299.42 | 15,852 | 23 | 17 |
| 600879 | 2017 | Beijing Microcore Technology Co., Ltd. | 11,548,064,683.34 | 506,617,563.70 | 30,284 | 91 | 29 |
| 600879 | 2021 | Beijing Era Minxin Technology Co., Ltd. | 14,008,586,045.50 | 529,624,816.93 | 31,296 | 127 | 47 |
| 000810 | 2012 | Skyworth Digital Holdings Limited | 1,243,996,271.26 | 75,203,360.30 | 2763 | 22 | 14 |
| 000810 | 2017 | Shenzhen Skyworth Digital Technology Co., Ltd. | 5,927,091,441.29 | 527,061,662.11 | 17,934 | 27 | 14 |
| 000810 | 2021 | Skyworth Digital Technology Co., Ltd. | 8,507,806,781.17 | 354,102,471.66 | 22,905 | 13 | 10 |
| 002241 | 2012 | Goertek Inc. | 4,077,000,282.02 | 556,067,130.02 | 0 | 22 | 16 |
| 002241 | 2017 | GoerTek Inc. | 19,287,807,649.88 | 1,608,949,366.19 | 140,541 | 116 | 46 |
| 002241 | 2021 | Goertek Inc. | 57,742,742,893.96 | 2,851,887,114.18 | 287,340 | 249 | 65 |
| 002439 | 2012 | Venustech Group Inc. | 426,383,674.66 | 60,297,487.80 | 2167 | 22 | 4 |
| 002439 | 2017 | Beijing Venustech Inc. | 1,927,370,350.14 | 261,193,380.15 | 11,343 | 10 | 4 |
| 002439 | 2021 | Venustech Group Inc. | 3,646,745,336.77 | 810,005,639.34 | 19,761 | 12 | 3 |
| 600460 | 2012 | Hangzhou Silan Microelectronics Co., Ltd. | 1,545,988,665.82 | 155,717,887.82 | 6158 | 21 | 11 |
| 600460 | 2017 | Hangzhou Silan Microelectronics Co., Ltd. | 2,375,053,756.57 | 91,643,101.82 | 10,949 | 12 | 3 |
| 600460 | 2021 | Silan Microelectronics Co., Ltd. | 4,280,561,779.48 | −22,636,636.57 | 13,760 | 36 | 13 |
| 000551 | 2012 | Shenzhen Skyworth LCD Device (Shenzhen) Co., Ltd. | 2,486,798,588.96 | 84,723,519.41 | 6 | 20 | 12 |
| 000551 | 2017 | Shenzhen Skyworth Digital Technology Co., Ltd. | 2,282,154,186.11 | 107,173,271.44 | 10,077 | 22 | 12 |
| 000551 | 2021 | Shenzhen Skyworth Digital Technology Co., Ltd. | 3,213,346,174.94 | 203,562,774.61 | 8398 | 10 | 8 |
| 600745 | 2012 | Wingtech Technology Co., Ltd. | 674,966,386 | 196,066,586.99 | 3350 | 20 | 12 |
| 600745 | 2017 | Wingtech Technology Co., Ltd. | 13,416,913,528.56 | 191,657,040.24 | 7191 | 19 | 12 |
| 600745 | 2021 | Wingtech Technology Co., Ltd. | 51,706,626,949.92 | 2,459,606,006.08 | 63,350 | 94 | 30 |
| 600019 | 2012 | Baoshan Iron & Steel Co., Ltd. | 222,504,684,693.73 | 7,735,800,167.04 | 65,196 | 19 | 11 |
| 600019 | 2017 | Meishan Steel Co., Ltd. | 246,169,451,839.91 | 9,339,042,267.21 | 114,308 | 10 | 9 |
| 600019 | 2021 | Baosteel Co., Ltd. | 281,519,220,481.50 | 14,053,241,991.8 | 90,810 | 88 | 24 |
| 000400 | 2012 | XJ Electric Co., Ltd. | 4,362,305,057.28 | 304,182,644.36 | 5489 | 18 | 7 |
| 000400 | 2017 | XJ Electric Co., Ltd. | 9,607,009,637.50 | 940,486,134.87 | 16,986 | 36 | 11 |
| 000400 | 2021 | XJ Electric Co., Ltd. | 11,191,201,681.05 | 802,630,209.78 | 16,374 | 57 | 16 |
| 002415 | 2012 | Hangzhou Hikvision Digital Technology Co., Ltd. | 5,231,639,749.77 | 1,482,482,923.78 | 8074 | 18 | 8 |
| 002415 | 2017 | Hangzhou Hikvision Digital Technology Co., Ltd. | 31,934,544,088.82 | 7,424,223,078.64 | 78,990 | 83 | 25 |
| 002415 | 2021 | Hangzhou Hikvision Digital Technology Co., Ltd. | 63,503,450,891.78 | 13,678,319,472.17 | 158,256 | 297 | 39 |
| 002236 | 2012 | Zhejiang Dahua Technology Co., Ltd. | 2,205,208,207.08 | 375,560,849.13 | 3238 | 17 | 10 |
| 002236 | 2017 | Zhejiang Dahua Technology Co., Ltd. | 13,329,094,010.82 | 1,810,152,288.31 | 35,382 | 42 | 15 |
| 002236 | 2021 | Zhejiang Dahua Technology Co., Ltd. | 26,465,968,181.10 | 3,935,241,656.29 | 68,601 | 689 | 48 |
| 002371 | 2012 | North Huachuang Technology Group Co., Ltd. | 1,155,992,985.74 | 158,074,656.14 | 2751 | 17 | 17 |
| 002371 | 2017 | NAURA Technology Group Co., Ltd. | 1,622,387,417.9 | 137,947,831.72 | 11,286 | 11 | 9 |
| 002371 | 2021 | Beijing Morningchip Technology Co., Ltd. | 6,056,043,031.20 | 631,093,131 | 24,479 | 161 | 48 |
| 600588 | 2012 | Yonyou Network Technology Co., Ltd. | 4,122,161,666 | 550,846,066 | 26,150 | 17 | 3 |
| 600588 | 2017 | Yonyou Network Technology Co., Ltd. | 5,113,348,861 | 244,169,080 | 30,388 | 23 | 7 |
| 600588 | 2021 | Yonyou Network Technology Co., Ltd. | 8,528,442,665 | 1,048,236,964 | 41,996 | 36 | 11 |
| 600728 | 2012 | Gatton Technology Group Co., Ltd. | 626,086,304.15 | 46,740,408.29 | 942 | 17 | 7 |
| 600728 | 2017 | Guangdong Fineway Technology Co., Ltd. | 2,848,194,879.42 | 124,706,489.71 | 4442 | 1 | 1 |
| 600728 | 2021 | Kadokawa Media (Group) Co., Ltd. | 4,286,485,469.75 | 79,747,049.55 | 5128 | 36 | 12 |
| 600845 | 2012 | Shanghai Baosight Software Co., Ltd. | 3,145,455,229.92 | 247,818,767.54 | 7185 | 17 | 10 |
| 600845 | 2017 | Baosight Software Co., Ltd. | 3,960,273,298.06 | 365,060,422.56 | 8239 | 14 | 13 |
| 600845 | 2021 | Shanghai Baosight Software Co., Ltd. | 10,225,041,913.62 | 1,427,937,644.67 | 10,693 | 70 | 20 |
| 002138 | 2012 | Shenzhen Sunlord Electronics Co., Ltd. | 550,434,646.48 | 80,114,888.48 | 2148 | 16 | 6 |
| 002138 | 2017 | Shenzhen Sunlord Electronics Co., Ltd. | 1,736,258,766.50 | 358,051,432.76 | 13,770 | 8 | 5 |
| 002138 | 2021 | Shenzhen Sunlord Electronics Co., Ltd. | 3,476,609,084.59 | 597,114,850.02 | 19,836 | 23 | 12 |
| 300250 | 2012 | Wangjing Technology (Suzhou) Co., Ltd. | 125,582,073.86 | 35,082,568.37 | 719 | 16 | 6 |
| 300250 | 2017 | Hangzhou Initial Data Technology Co., Ltd. | 450,584,052.42 | 136,213,096.51 | 2688 | 5 | 5 |
| 300250 | 2021 | Netjoy Technology Co., Ltd. | 407,750,424.52 | −368,935,263.85 | 2729 | 10 | 5 |
| 300353 | 2012 | Beijing Eastcompeace Technology Co., Ltd. | 125,310,072.38 | 37,836,951.73 | 334 | 16 | 3 |
| 300353 | 2017 | Beijing Eastwind Digital Technology Co., Ltd. | 661,805,588.03 | 120,734,916.35 | 4302 | 54 | 9 |
| 300353 | 2021 | Beijing EastSoft Technology Co., Ltd. | 534,959,995.61 | −920,555,250.39 | 4899 | 47 | 14 |
| 002017 | 2012 | Eastcompeace Technology Co., Ltd. | 933,865,061.55 | 33,044,510.13 | 1996 | 15 | 9 |
| 002017 | 2017 | Eastcompeace Technology Co., Ltd. | 1,496,767,853.97 | 87,208,314.02 | 6519 | 12 | 8 |
| 002017 | 2021 | Dongxin Peace Technology Co., Ltd. | 1,062,684,714.42 | 36,730,044.72 | 4887 | 7 | 6 |
| 600118 | 2012 | Aerospace Dongfanghong Satellite Co., Ltd. | 3,611,261,072.42 | 257,268,454.37 | 7445 | 14 | 6 |
| 600118 | 2017 | Aerospace Star Technology Application Co., Ltd. | 6,337,264,554.55 | 460,689,614.15 | 4722 | 17 | 14 |
| 600118 | 2021 | Tianjin Hengdian Space Power Co., Ltd. | 7,007,404,413.07 | 426,463,573.57 | 6545 | 47 | 28 |
| 002230 | 2012 | Iflytek Co., Ltd. | 557,013,530.69 | 132,590,814.43 | 1668 | 13 | 5 |
| 002230 | 2017 | Iflytek Co., Ltd. | 3,320,476,689.57 | 496,778,331.51 | 26,181 | 59 | 21 |
| 002230 | 2021 | iFlytek Co., Ltd. | 13,024,657,865.85 | 1,441,784,003.24 | 43,936 | 378 | 37 |
| 002405 | 2012 | Beijing NavInfo Co., Ltd. | 867,124,465.32 | 308,114,770.33 | 4948 | 13 | 8 |
| 002405 | 2017 | Beijing Navinfo Co., Ltd. | 1,585,306,335.51 | 116,258,904.80 | 14,286 | 10 | 9 |
| 002405 | 2021 | Beijing Siwei Tuxin Technology Co., Ltd. | 2,147,655,643.19 | −356,993,757.91 | 13,062 | 38 | 18 |
| 601231 | 2012 | Universal Scientific Industrial Co., Ltd. | 12,707,589,804.50 | 451,759,446.86 | 25,728 | 13 | 7 |
| 601231 | 2017 | Universal Scientific Industrial (Shanghai) Co., Ltd. | 23,983,883,716.87 | 806,266,321.83 | 33,018 | 7 | 6 |
| 601231 | 2021 | Universal Scientific Industrial (Shanghai) Co., Ltd. | 47,696,228,222.53 | 1,733,565,231.97 | 49,548 | 11 | 11 |
| 601766 | 2012 | CRRC Zhuzhou Institute Co., Ltd. | 80,710,806,825 | 4,743,239,677 | 222,259 | 13 | 9 |
| 601766 | 2017 | CRRC Changchun Railway Vehicles Co., Ltd. | 229,721,597,000 | 13,894,413,000 | 484,387 | 41 | 25 |
| 601766 | 2021 | CRRC Changchun Railway Vehicles Co., Ltd. | 227,656,041,000 | 13,823,060,000 | 448,386 | 83 | 30 |
| 300124 | 2012 | Shenzhen Inovance Technology Co., Ltd. | 1,054,026,834.36 | 346,438,705.72 | 1834 | 12 | 6 |
| 300124 | 2017 | Shenzhen Inovance Technology Co., Ltd. | 3,660,045,212.97 | 980,170,451.17 | 21,725 | 7 | 5 |
| 300124 | 2021 | Shenzhen Inovance Technology Co., Ltd. | 11,511,316,766.18 | 2,181,697,584.96 | 57,955 | 33 | 15 |
| 600131 | 2012 | Beijing SinoPower Information Technology Co., Ltd. | 671,146,456.89 | 127,598,800.03 | 1831 | 12 | 5 |
| 600131 | 2017 | Anhui Jiuyuan Software Co., Ltd. | 1,136,610,564.86 | 158,484,867.35 | 1802 | 68 | 10 |
| 600131 | 2021 | Anhui Ji Yuan Software Co., Ltd. | 7,011,055,714.32 | 606,865,140.61 | 2352 | 86 | 24 |
| 002583 | 2012 | Hytera Communications Corporation Limited | 1,243,451,534.72 | 146,019,696.41 | 2373 | 11 | 8 |
| 002583 | 2017 | Hytera Communications Corporation Limited | 3,435,503,330.27 | 401,828,371.83 | 26,790 | 52 | 12 |
| 002583 | 2021 | Hytera Communications Corporation Limited | 6,109,220,863.51 | 95,298,636.49 | 19,695 | 69 | 18 |
| 600654 | 2012 | Shanghai Hugong Auto Electric Co., Ltd. | 1,321,538,600.37 | 107,394,958.89 | 5850 | 11 | 10 |
| 600654 | 2017 | Shanghai Hugong Auto Electric Co., Ltd. | 3,434,062,036.16 | 247,152,277.79 | 22,410 | 1 | 3 |
| 600654 | 2021 | Shanghai Hugong Auto Electric Co., Ltd. | 3,014,328,624.31 | −182,335,142.27 | 23,416 | 3 | 5 |
| 600651 | 2012 | Shanghai Yaming Lighting Co., Ltd. | 1,975,214,446.19 | 182,340,852.27 | 8062 | 10 | 14 |
| 600651 | 2017 | Shanghai Feilo Acoustics Co., Ltd. | 7,177,952,083.97 | 328,005,483.42 | 10,363 | 8 | 10 |
| 600651 | 2021 | Jiangsu Yaming Lighting Co., Ltd. | 4,433,482,129.70 | 432,960,675.16 | 7278 | 13 | 16 |
| 002129 | 2012 | Tianjin Huano Semiconductor Technology Co., Ltd. | 2,549,977,944.51 | 219,945,396.03 | / | 9 | 6 |
| 002129 | 2017 | Tianjin Huanke Semiconductor Technology Co., Ltd. | 6,783,335,284.24 | 403,888,182.47 | 22,866 | 1 | 3 |
| 002129 | 2021 | Tianjin Zhonghuan Semiconductor Co., Ltd. | 19,056,776,100.59 | 1,475,511,030.88 | 40,771 | 27 | 13 |
| 300098 | 2012 | Tianjin ZTE Software Co., Ltd. | 196,102,510.31 | 30,433,096.02 | 1009 | 9 | 6 |
| 300098 | 2017 | Gosuncn Technology Group Co., Ltd. | 1,307,666,649.48 | 315,764,916.47 | 8892 | 3 | 5 |
| 300098 | 2021 | Gosuncn Technology Group Co., Ltd. | 2,326,086,511.15 | −1,115,805,734.04 | 8853 | 23 | 10 |
| 000651 | 2012 | Zhuhai Gree Electric Appliances Co., Ltd. | 83,155,474,504.59 | 5,297,340,543.07 | 80,411 | 8 | 10 |
| 000651 | 2017 | Zhuhai Gree Electric Appliances Inc. | 108,302,565,293.70 | 15,566,453,677.60 | 256,001 | 271 | 60 |
| 000651 | 2021 | Gree Electric Appliances, Inc. of Zhuhai | 168,199,204,404.53 | 22,279,242,195.27 | 246,038 | 983 | 103 |
| 002465 | 2012 | Guangzhou Haige Communications Group Inc. | 999,597,698.02 | 236,512,342.50 | 2230 | 8 | 4 |
| 002465 | 2017 | Guangzhou Haige Communications Group Inc. | 4,118,734,127.45 | 607,858,164.67 | 28,101 | 9 | 11 |
| 002465 | 2021 | Guangzhou Haige Communications Group Incorporated Company | 5,122,064,843.56 | 582,487,607.91 | 23,274 | 37 | 20 |
| 600410 | 2012 | Beijing Sinotrans Technology Co., Ltd. | 5,083,873,518.85 | 244,844,180.04 | 9911 | 8 | 4 |
| 600410 | 2017 | Huasheng Industrial Development Co., Ltd. | 4,800,033,043.15 | 39,981,401.88 | 8270 | 5 | 2 |
| 600410 | 2021 | Beijing Teamsun Technology Co., Ltd. | 3,901,169,825.50 | 441,368,254.81 | 4904 | 1 | 1 |
| 600637 | 2012 | Besttone Holding Co., Ltd. | 1,335,465,234.81 | 355,648,927.04 | 2976 | 8 | 6 |
| 600637 | 2017 | Shanghai Media & Entertainment Group Co., Ltd. | 19,445,486,379.41 | 3,196,303,206.44 | 11,000 | 4 | 9 |
| 600637 | 2021 | BesTV Network Technology Development Co., Ltd. | 10,033,351,988.04 | 1,561,119,320.99 | 13,968 | 1 | 2 |
| 600718 | 2012 | Neusoft Corporation | 5,751,249,330 | 423,545,552 | 44,806 | 8 | 8 |
| 600718 | 2017 | Neusoft Corporation | 7,734,848,084 | 1,704,646,737 | 30,365 | 83 | 13 |
| 600718 | 2021 | Neusoft Corporation | 7,621,987,666 | −16,522,959 | 37,754 | 155 | 26 |
| 000527 | 2012 | Guangdong Midea Electric Appliances Co., Ltd. | 93,108,058,260 | 4,551,458,790 | 69,242 | 7 | 10 |
| 000527 | 2017 | Guangdong Midea Refrigeration Equipment Co., Ltd. | / | / | / | 237 | 43 |
| 000527 | 2021 | Guangdong Midea Refrigeration Equipment Co., Ltd. | / | / | / | 180 | 29 |
| 000801 | 2012 | Shenzhen Jiuzhou Electronic Co., Ltd. | 2,234,730,122.40 | 60,047,818.17 | 4128 | 7 | 10 |
| 000801 | 2017 | Sichuan Jiuzhou Electric Group Co., Ltd. | 3,915,732,878.59 | 198,935,242.28 | 14,382 | 18 | 15 |
| 000801 | 2021 | Sichuan Jiuzhou Electronic Technology Co., Ltd. | 3,299,940,240.89 | 101,044,112.83 | 10,380 | 28 | 20 |
| 002281 | 2012 | Wuhan Fiberhome Technologies Group Co., Ltd. | 2,072,301,812.19 | 162,777,101.94 | 3973 | 7 | 7 |
| 002281 | 2017 | Wuhan FiberHome Technologies Co., Ltd. | 4,059,214,645.61 | 273,936,635.08 | 12,524 | 36 | 14 |
| 002281 | 2021 | Wuhan FiberHome Technologies Group | 6,046,017,103.97 | 452,398,906.50 | 12,969 | 41 | 21 |
| 300188 | 2012 | Xiamen Meiya Pico Information Co., Ltd. | 268,515,584.75 | 61,504,981.78 | 868 | 7 | 8 |
| 300188 | 2017 | Xiamen Meiya Pico Information Co., Ltd. | 997,908,503.38 | 178,742,819.06 | 7149 | 23 | 7 |
| 300188 | 2021 | Meiya Pico Information Co., Ltd. | 2,386,098,335.14 | 400,659,003.66 | 12,566 | 112 | 15 |
| 000990 | 2012 | Shijiazhuang Chengzhi Yonghua Display Materials Co., Ltd. | 2,986,842,750.42 | 30,415,475.19 | 2509 | 6 | 4 |
| 000990 | 2017 | Shijiazhuang Chengzhi Yonghua Display Material Co., Ltd. | 2,574,040,702.37 | 145,956,756.84 | 13,620 | 4 | 2 |
| 000990 | 2021 | Shijiazhuang Chinglian Display Materials Co., Ltd. | 9,731,805,769.39 | 348,651,710.54 | 13,268 | 33 | 8 |
| 002179 | 2012 | AVIC Optoelectronics Technology Co., Ltd. | 1,866,358,387.54 | 198,592,340.86 | 16,036 | 6 | 2 |
| 002179 | 2017 | AVIC Optoelectronics Co., Ltd. | 5,854,802,051.16 | 776,488,985.52 | 36,442 | 27 | 7 |
| 002179 | 2021 | China Aviation Optoelectronics Technology Co., Ltd. | 10,305,222,374.39 | 1,531,372,795.39 | 46,019 | 47 | 15 |
| 002384 | 2012 | Suzhou Dongshan Precision Manufacturing Co., Ltd. | 1,176,966,839.70 | 49,544,513.13 | 4106 | 6 | 8 |
| 002384 | 2017 | Suzhou Victon Electronic Co., Ltd. | 8,403,297,216.84 | 149,133,887.18 | 35,721 | 3 | 4 |
| 002384 | 2021 | Suzhou Dongshan Precision Manufacturing Co., Ltd. | 28,093,409,430.26 | 1,537,187,184 | 59,886 | 26 | 26 |
| 300205 | 2012 | Wuhan Tianyu Information Industry Co., Ltd. | 656,021,927.02 | 29,343,609.86 | 1432 | 6 | 5 |
| 300205 | 2017 | Wuhan Tianyu Information Industry Co., Ltd. | 1,627,326,894.26 | 4,523,306.02 | 7989 | 10 | 4 |
| 300205 | 2021 | Wuhan Tianyu Information Industry Co., Ltd. | 1,693,529,679.18 | −63,154,180.65 | 6993 | 46 | 14 |
| 300324 | 2012 | Beijing Sinovel Wind Group Co., Ltd. | 298,665,994.74 | 43,224,357.27 | 503 | 6 | 3 |
| 300324 | 2017 | Beijing Bewinner Technology Co., Ltd. | 2,188,775,876.25 | 599,968,804.88 | 15,578 | 14 | 8 |
| 300324 | 2021 | Beijing Sciyons Digital Technology Co., Ltd. | 2,797,614,020.70 | −1,246,656,921.73 | 9753 | 3 | 4 |
| 600183 | 2012 | Guangdong Shengyi Technology Co., Ltd. | 5,876,903,981.40 | 480,268,421.25 | 10,989 | 6 | 3 |
| 600183 | 2017 | Shengyi Technology Co., Ltd. | 8,538,321,095.20 | 760,643,887.22 | 17,574 | 11 | 2 |
| 600183 | 2021 | Shengyi Electronics Co., Ltd. | 14,687,341,460.15 | 1,800,202,825.79 | 22,914 | 17 | 9 |
| 600775 | 2012 | Nanjing Panda Electronics Co., Ltd. | 2,142,395,293.37 | 116,095,381.95 | 7102 | 6 | 7 |
| 600775 | 2017 | Nanjing Panda Electronics Co., Ltd. | 3,702,763,356.54 | 169,009,661.65 | 10,684 | 18 | 17 |
| 600775 | 2021 | Nanjing Panda Electronics Co., Ltd. | 3,952,265,022.15 | 117,781,200.59 | 9351 | 19 | 22 |
| 600855 | 2012 | Beijing Aerospace Changfeng Co., Ltd. | 1,012,380,154.13 | 38,826,988.23 | 2179 | 6 | 4 |
| 600855 | 2017 | Beijing Aerospace Changfeng Co., Ltd. | 1,133,253,405.89 | 68,658,301.15 | 2158 | 29 | 14 |
| 600855 | 2021 | Beijing Aerospace Changfeng Co., Ltd. | 2,763,054,509.04 | 113,537,018.77 | 3416 | 31 | 19 |
| 000547 | 2012 | Chongqing Golden View Electronic Co., Ltd. | 408,753,586.70 | 134,129,173.14 | 1052 | 5 | 3 |
| 000547 | 2017 | Chongqing Jinmei Communication Co., Ltd. | 2,042,099,952.94 | 279,570,138.81 | 5818 | 13 | 7 |
| 000547 | 2021 | Chongqing Jinmei Communication Co., Ltd. | 4,246,553,566.86 | 830,556,969.74 | 8750 | 20 | 13 |
| 000636 | 2012 | Guangdong Fenghua High-tech Co., Ltd. | 2,081,893,700.76 | 165,063,163.27 | 6983 | 5 | 6 |
| 000636 | 2017 | Guangdong Fenghua Advanced Technology Holding Co., Ltd. | 2,774,347,241.04 | 93,413,944.75 | 20,091 | 8 | 6 |
| 000636 | 2021 | Guangdong Fenghua Advanced Technology Holding Co., Ltd. | 4,331,979,621.51 | 372,490,629.39 | 26,052 | 14 | 6 |
| 002313 | 2012 | SIMCom Wireless Solutions (Shanghai) Co., Ltd. | 1,333,112,131.14 | 147,783,745.24 | 4943 | 5 | 2 |
| 002313 | 2017 | Sunsea AIoT Technology Co., Ltd. | 2,706,793,456.27 | 89,907,322.58 | 7602 | 3 | 2 |
| 002313 | 2021 | Longsung Technology (Shanghai) Co., Ltd. | 3,940,145,054.70 | −781,998,174.83 | 8321 | 8 | 6 |
| 002475 | 2012 | Luxshare Precision Industry Co., Ltd. | 2,555,567,715.02 | 369,326,202.23 | / | 5 | 2 |
| 002475 | 2017 | Luxshare Precision Industry Co., Ltd. | 13,762,595,894.39 | 1,182,066,031.40 | 163,926 | 7 | 5 |
| 002475 | 2021 | Luxshare Precision Industry Co., Ltd. | 92,501,259,211.54 | 7,491,014,735.42 | 684,456 | 36 | 30 |
| 300074 | 2012 | Huaping Information Technology Co., Ltd. | 126,404,382.09 | 50,613,078.32 | / | 5 | 3 |
| 300074 | 2017 | Huaping Information Technology Co., Ltd. | 341,738,284.50 | 75,272,348.46 | 2108 | 8 | 9 |
| 300074 | 2021 | Huapin Smart Information Technology (Shenzhen) Co., Ltd. | 445,330,381.87 | 25,269,224.39 | 2847 | 4 | 3 |
| 300079 | 2012 | Beijing Digital Video Co., Ltd. | 441,532,705.67 | 204,908,717.36 | / | 5 | 5 |
| 300079 | 2017 | Beijing Digital Video Technology Co., Ltd. | 1,474,848,649.35 | 242,145,887.62 | 4011 | 12 | 9 |
| 300079 | 2021 | Beijing Digital Video Technology Co., Ltd. | 986,667,922.96 | 95,882,697.14 | 2127 | 9 | 10 |
| 300130 | 2012 | Shenzhen Xinguodu Technology Co., Ltd. | 341,596,897.96 | 75,726,386.86 | 1118 | 5 | 6 |
| 300130 | 2017 | Shenzhen Xinguodu Technology Co., Ltd. | 1,126,545,907.37 | 144,307,975.14 | 5553 | 3 | 3 |
| 300130 | 2021 | Shenzhen Xinguodu Technology Co., Ltd. | 2,632,361,743.29 | 85,109,652.60 | 8463 | 13 | 12 |
| 300297 | 2012 | Bluedon Information Security Technologies Co., Ltd. | 278,770,826.35 | 52,320,390.32 | 633 | 5 | 4 |
| 300297 | 2017 | Blue Shield Information Security Technology Co., Ltd. | 1,573,504,560.72 | 323,856,004.21 | 8394 | 12 | 6 |
| 300297 | 2021 | Guangdong Lander Ligong Information Technology Co., Ltd. | 1,045,544,313.46 | −1,110,203,260.11 | 1347 | 3 | 8 |
| 600028 | 2012 | China Petroleum & Chemical Corporation | 2,505,683,000,000 | 76,864,000,000 | 376,201 | 5 | 6 |
| 600028 | 2017 | China Petroleum & Chemical Corporation (Sinopec) | 1,930,911,000,000 | 59,170,000,000 | 1,004,421 | 58 | 25 |
| 600028 | 2021 | China Petroleum & Chemical Corporation (Sinopec) | 2,104,724,000,000 | 42,097,000,000 | 788,139 | 164 | 44 |
| 600031 | 2012 | Shanghai Sany Technology Co., Ltd. | 50,776,301,000 | 9,361,556,000 | 69,774 | 5 | 9 |
| 600031 | 2017 | Sany Automobile Manufacturing Co., Ltd. | 23,280,072,000 | 163,799,000 | 28,298 | 1 | 4 |
| 600031 | 2021 | Sany Heavy Industry Co., Ltd. | 99,342,410,000 | 15,864,990,000 | 47,390 | 64 | 29 |
| 600261 | 2012 | Zhejiang Yangfan Lighting Group Co., Ltd. | 2,354,433,783.71 | 220,339,530.66 | 14,437 | 5 | 5 |
| 600261 | 2017 | Zhejiang Yankon Lighting Appliance Co., Ltd. | 4,393,123,514.51 | 462,942,634.80 | 20,392 | 14 | 6 |
| 600261 | 2021 | Zhejiang Yankon Group Co., Ltd. | 4,820,894,277.47 | 484,896,337.27 | 12,730 | 12 | 10 |
| 600288 | 2012 | Beijing Zhongkeda Yang Science and Technology Development Co., Ltd. | 4,084,484,815.58 | 146,191,920.54 | 6583 | 5 | 4 |
| 600288 | 2017 | China Great Wall Technology Group Co., Ltd. | 2,686,413,993.59 | 54,588,262.53 | 5126 | 1 | 1 |
| 600288 | 2021 | China Great Wall Technology Group Co., Ltd. | 2,315,175,744.25 | 83,519,332.22 | 4927 | 7 | 6 |
| 600487 | 2012 | Jiangsu Hengtong Optical Electric Co., Ltd. | 6,688,643,740.85 | 304,065,200.74 | 15,064 | 5 | 6 |
| 600487 | 2017 | Jiangsu Hengtong Optic-Electric Co., Ltd. | 19,300,546,444.93 | 1,523,127,437.5 | 34,414 | 38 | 17 |
| 600487 | 2021 | Jiangsu Hengtong Optic-Electric Co., Ltd. | 32,384,143,494.70 | 1,159,003,994.55 | 30,862 | 45 | 27 |
| 000066 | 2012 | China Great Wall Technology Group Co., Ltd. | 76,467,965,366 | 474,429,273.83 | 45,962 | 4 | 3 |
| 000066 | 2017 | Shenzhen Great Wall Kaifa Technology Co., Ltd. | 74,172,807,065.05 | 561,506,429.45 | 43,688 | 11 | 10 |
| 000066 | 2021 | Chongqing Changan Automobile Co., Ltd. | 14,446,088,072.53 | 974,585,489.85 | 52,689 | 21 | 18 |
| 000156 | 2012 | Huanxi Media Group Limited | 1,293,774,877.45 | 119,092,960.44 | 3938 | 4 | 3 |
| 000156 | 2017 | Wasu Media Holding Co., Ltd. | 3,081,183,980.30 | 600,611,286.20 | 14,811 | 2 | 3 |
| 000156 | 2021 | Digital China Information Service Co., Ltd. | 7,577,647,859.63 | 951,714,202.27 | 36,220 | 3 | 5 |
| 000555 | 2012 | Digital China Information Service Company | 99,867,062.20 | 618,390.16 | 9 | 4 | 4 |
| 000555 | 2017 | Digital China Information Service Company Ltd. | 8,014,312,755.85 | 255,125,697.22 | 29,826 | 11 | 11 |
| 000555 | 2021 | China Zhenhua Group Yuncai Electronics Co., Ltd. | 10,685,976,832 | 466,382,950.29 | 40,083 | 35 | 10 |
| 000625 | 2012 | Chongqing Changan Automobile Co., Ltd. | 26,551,846,548.17 | 925,649,313.33 | 18,333 | 4 | 3 |
| 000625 | 2017 | Chongqing Changan Automobile Co., Ltd. | 78,542,441,757.19 | 10,276,594,658.84 | 45,149 | 24 | 21 |
| 000625 | 2021 | Guangzhou GRG Metrology & Test Co., Ltd. | 84,565,544,146.58 | 3,288,478,642.70 | 133,935 | 140 | 42 |
| 000733 | 2012 | China Zhenhua Group Yuncore Electronic Co., Ltd. | 3,339,397,310.92 | 49,079,170.79 | 7584 | 4 | 3 |
| 000733 | 2017 | China Zhenhua Group Science and Technology Co., Ltd. | 6,589,049,796.14 | 187,951,959.46 | 29,489 | 34 | 14 |
| 000733 | 2021 | Jiangsu Horizon Data Technology Co., Ltd. | 3,949,731,031.60 | 602,498,310.89 | 24,835 | 41 | 24 |
| 002152 | 2012 | Guangzhou GRG Metrology & Test Institute Co., Ltd. | 2,089,467,431.67 | 507,442,933.40 | 9458 | 4 | 7 |
| 002152 | 2017 | Guangzhou GRG Metrology & Test Co., Ltd. | 4,423,649,958.72 | 891,655,450.08 | 72,831 | 7 | 6 |
| 002152 | 2021 | Sichuan Huajing Technology Co., Ltd. | 6,410,765,033.61 | 849,033,695.40 | 82,926 | 45 | 16 |
| 002253 | 2012 | Sichuan University Jishi Software Co., Ltd. | 172,832,176.92 | 52,172,861.25 | 573 | 4 | 2 |
| 002253 | 2017 | Sichuan Dazheng Precision Co., Ltd. | 315,945,847.85 | 42,864,726.99 | 1830 | 1 | 1 |
| 002253 | 2021 | Kunshan Maidich Measuring Fixture Technology Co., Ltd. | 357,347,106.37 | 73,668,072.20 | 1902 | 2 | 2 |
| 300128 | 2012 | Suzhou Kingboard Technology Co., Ltd. | 1,193,721,712.93 | 113,323,873.46 | 2133 | 4 | 3 |
| 300128 | 2017 | Au Optronics Corporation | 2,973,195,437.16 | 53,444,599.49 | 7806 | 2 | 2 |
| 300128 | 2021 | Guangzhou Haige Communications Group Incorporated Company | 1,364,232,745.17 | 26,868,962.97 | 3681 | 3 | 3 |
| 300209 | 2012 | Suzhou Tianze Information Technology Co., Ltd. | 160,194,201.92 | 55,607,662.50 | 314 | 4 | 5 |
| 300209 | 2017 | Jiangsu Seacoast Data Technology Co., Ltd. | 724,101,070.91 | 90,294,520.91 | 4040 | 1 | 1 |
| 300209 | 2021 | Shanghai Road & Bridge Group Co., Ltd. | 5,026,531,094.60 | −874,647,474.52 | 6504 | 3 | 3 |
| 300310 | 2012 | Guangdong YiTong Century Technology Co., Ltd. | 522,034,953.12 | 64,243,528.29 | 2156 | 4 | 4 |
| 300310 | 2017 | Yitong Century Technology Co., Ltd. | 1,820,949,946.65 | 166,709,148.74 | 21,873 | 6 | 7 |
| 300310 | 2021 | Inspur Software Co., Ltd. | 2,214,399,584.98 | 16,717,548.93 | 18,630 | 7 | 11 |
| 600756 | 2012 | Inspur Software Co., Ltd. | 560,885,665.97 | 11,249,833.69 | 2533 | 4 | 3 |
| 600756 | 2017 | Inspur Software Co., Ltd. | 1,368,406,316.97 | 113,343,297.95 | 4007 | 26 | 7 |
| 600756 | 2021 | Jishi Media Co., Ltd. | 1,328,897,567.58 | −86,149,501.20 | 2902 | 97 | 14 |
| 600820 | 2012 | Shanghai Municipal Engineering Design Institute (Group) Co., Ltd. | 19,691,366,450.08 | 1,149,555,706.74 | 13,356 | 4 | 7 |
| 600820 | 2017 | Shanghai Urban Construction Design & Research Institute Co., Ltd. | 28,828,468,837.93 | 1,676,554,916.37 | 18,810 | 5 | 7 |
| 600820 | 2021 | MCC Jingcheng Engineering Technology Co., Ltd. | 54,014,221,313.37 | 2,299,826,970.06 | 31,530 | 34 | 25 |
| 601618 | 2012 | China Metallurgical South Engineering Technology Co., Ltd. | 230,178,204,000 | 3,712,567,000 | 380,701 | 4 | 3 |
| 601618 | 2017 | China Third Metallurgical Group Co., Ltd. | 219,557,579,000 | 5,969,647,000 | 326,321 | 34 | 21 |
| 601618 | 2021 | Newland Digital Technology Co., Ltd. | 400,114,623,000 | 9,382,357,000 | 323,559 | 114 | 48 |
| 601929 | 2012 | Jishi Media Co., Ltd. | 1,514,822,686.14 | 384,974,683.49 | 11,424 | 4 | 4 |
| 601929 | 2017 | Beijing Jishi Huibo Technology Co., Ltd. | 2,214,702,428.70 | 374,360,456.98 | 14,378 | 1 | 1 |
| 601929 | 2021 | Wasu Media Holding Co., Ltd. | 1,971,042,781.01 | 62,650,623.03 | 13,152 | 2 | 3 |
| 000823 | 2012 | Shantou Ultrasonic Electronic Circuit (Plant II) Co., Ltd. | 3,293,112,968.13 | 224,840,035.79 | 6087 | 3 | 3 |
| 000823 | 2017 | Shantou Ultrasonic Printed Circuit Board Co., Ltd. | 3,532,559,927.28 | 232,726,856.89 | 19,961 | 1 | 1 |
| 000823 | 2021 | Shantou Ultrasonic Printed Circuit Board Co., Ltd. | 5,168,552,776.03 | 366,112,804 | 21,504 | 15 | 14 |
| 000997 | 2012 | Newland Digital Technology Co., Ltd. | 974,813,555.66 | 87,610,198.91 | 2625 | 3 | 5 |
| 000997 | 2017 | Newland Digital Technology Co., Ltd. | 3,543,922,751.49 | 486,386,560.06 | 9987 | 18 | 9 |
| 000997 | 2021 | 3NOD Communications Technology Co., Ltd. | 6,356,950,910.91 | 502,239,156.15 | 19,853 | 38 | 19 |
| 002115 | 2012 | Sunwave Communications Co., Ltd. | 1,120,975,668.23 | 115,351,590.34 | 2739 | 3 | 3 |
| 002115 | 2017 | Sunwave Communications Co., Ltd. | 988,764,597.01 | 25,140,539.69 | 3465 | 6 | 5 |
| 002115 | 2021 | Tongfu Microelectronics Co., Ltd. | 8,738,054,190.48 | 2,610,786.25 | 3360 | 23 | 12 |
| 002153 | 2012 | Beijing Weidian Internet Service Co., Ltd. | 720,871,724.09 | 274,334,016.16 | 1222 | 3 | 4 |
| 002153 | 2017 | SISS Software Co., Ltd. | 2,662,608,134.04 | 405,797,847.51 | 11,485 | 5 | 5 |
| 002153 | 2021 | Qilu Bank Co., Ltd. | 3,317,319,888.57 | 11,069,316.06 | 16,017 | 2 | 2 |
| 002156 | 2012 | Tongfu Microelectronics Co., Ltd. | 1,622,046,684.09 | 49,028,221.73 | 4100 | 3 | 3 |
| 002156 | 2017 | Tongfu Microelectronics Co., Ltd. | 4,591,656,651.56 | 236,705,088.44 | 30,417 | 11 | 2 |
| 002156 | 2021 | Shenzhen Zowee Technology Co., Ltd. | 10,768,700,029.40 | 388,510,516.02 | 50,211 | 66 | 13 |
| 002197 | 2012 | Shenzhen ZTECOM Security Co., Ltd. | 677,480,693.05 | 69,267,765.43 | 1394 | 3 | 3 |
| 002197 | 2017 | Shenzhen ZTE Communications Co., Ltd. | 1,795,906,799.75 | 50,308,658 | 6084 | 4 | 5 |
| 002197 | 2021 | Focus Technology Co., Ltd. | 1,328,743,408.73 | 11,563,913.44 | 3405 | 26 | 19 |
| 002315 | 2012 | Focus Technology Co., Ltd. | 426,736,657.53 | 163,127,106.24 | 1920 | 3 | 2 |
| 002315 | 2017 | Focus Technology Co., Ltd. | 683,971,923.34 | 107,744,493.77 | 5978 | 9 | 4 |
| 002315 | 2021 | Hanwang Technology Co., Ltd. | 1,129,744,169.15 | 171,063,450.95 | 7089 | 13 | 6 |
| 002362 | 2012 | Hanwang Technology Co., Ltd. | 533,193,131.14 | −496,780,809.66 | 435 | 3 | 3 |
| 002362 | 2017 | Hanwang Technology Co., Ltd. | 415,626,507.81 | 24,484,909.93 | 4269 | 1 | 2 |
| 002362 | 2021 | Nanchang O-Film Tech Co., Ltd. | 1,555,160,536.99 | 189,248,293.42 | 6936 | 4 | 4 |
| 002456 | 2012 | OFILM Group Co., Ltd. | 1,245,198,774.6 | 20,708,658.77 | 11,569 | 3 | 5 |
| 002456 | 2017 | O-Film Technology Co., Ltd. | 26,746,418,937.61 | 716,936,763.96 | 125,478 | 154 | 34 |
| 002456 | 2021 | Shenzhen Infinova Limited | 48,349,701,025.62 | −1,853,683,331.53 | 53,919 | 66 | 35 |
| 002528 | 2012 | Shenzhen Infinova Limited | 354,913,551.01 | 42,754,332.45 | 1544 | 3 | 2 |
| 002528 | 2017 | Shenzhen Infinova Technology Co., Ltd. | 1,978,711,114.25 | −421,981,197.09 | 4920 | 14 | 10 |
| 002528 | 2021 | Beijing E-Hualu Information Technology Co., Ltd. | 5,195,916,646.84 | −50,547,119.2 | 2979 | 10 | 9 |
| 300212 | 2012 | Beijing E-Hualu Information Technology Co., Ltd. | 408,060,950.14 | 68,026,741.35 | 871 | 3 | 4 |
| 300212 | 2017 | Beijing E-Hualu Information Technology Co., Ltd. | 2,249,479,002.98 | 194,435,816.16 | 5370 | 9 | 5 |
| 300212 | 2021 | Shanghai Hanway Electronic Co., Ltd. | 2,587,025,984.53 | 573,180,005.90 | 5663 | 42 | 14 |
| 300284 | 2012 | Jiangsu Sukchonlink Technology Co., Ltd. | 1,267,982,980.97 | 130,561,228 | 2219 | 3 | 4 |
| 300284 | 2017 | Jiangsu JKO Energy Science and Technology Development Co., Ltd. | 4,201,259,613.19 | 414,014,775.24 | 26,928 | 1 | 3 |
| 300284 | 2021 | Jiangsu Dingsheng New Material Co., Ltd. | 5,499,359,958.70 | 414,749,382.06 | 22,811 | 9 | 11 |
| 300327 | 2012 | Shanghai Belling Co., Ltd. | 372,952,308.03 | 63,700,998.54 | 313 | 3 | 5 |
| 300327 | 2017 | Shanghai Haoxin Technology Co., Ltd. | 517,702,356.17 | 106,812,041.63 | 943 | 1 | 2 |
| 300327 | 2021 | Shenzhen Dihui Electronics Co., Ltd. | 1,012,256,028.41 | 200,107,024.15 | 1266 | 2 | 3 |
| 300331 | 2012 | Suzhou SVISION Technology Group Co., Ltd. | 254,594,875.49 | 40,415,814.44 | 492 | 3 | 2 |
| 300331 | 2017 | Suzhou Sudawei Grid Group Co., Ltd. | 415,723,449.88 | 27,939,260.67 | 5881 | 15 | 11 |
| 300331 | 2021 | FAW Car Co., Ltd. | 1,392,279,392.33 | 41,792,361.17 | 8319 | 17 | 12 |
| 600104 | 2012 | SAIC Motor Corporation Limited | 433,095,484,273.94 | 34,989,631,033.19 | 6796 | 3 | 5 |
| 600104 | 2017 | SAIC Motor Corporation Limited | 746,234,636,304.31 | 43,959,051,525.79 | 401,921 | 26 | 23 |
| 600104 | 2021 | SAIC Motor Corporation Limited | 723,042,589,215.28 | 29,188,050,869.17 | 455,217 | 249 | 49 |
| 600166 | 2012 | Beijing Foton Motor Co., Ltd. | 51,645,734,937.85 | 1,152,389,085.33 | 62,128 | 3 | 5 |
| 600166 | 2017 | BAIC Foton Motor Co., Ltd. | 46,532,069,535.53 | 512,127,860.24 | 62,729 | 20 | 19 |
| 600166 | 2021 | BAIC Motor Corporation Limited | 57,765,402,949.37 | 140,704,289.32 | 42,196 | 12 | 12 |
| 600268 | 2012 | Nanjing Guodian Nanzi Electric Network Automation Co., Ltd. | 3,204,148,957.15 | 255,125,518.7 | 9952 | 3 | 4 |
| 600268 | 2017 | NARI Technology Co., Ltd. | 5,893,489,455.37 | 154,675,493.75 | 8200 | 7 | 8 |
| 600268 | 2021 | Guodian Nanjing Automation Co., Ltd. | 5,032,029,717.72 | 238,006,254.39 | 7672 | 20 | 16 |
| 600571 | 2012 | Shenzhen Sinosun Technology Co., Ltd. | 678,947,588.19 | 49,321,368.47 | 5939 | 3 | 2 |
| 600571 | 2017 | China Software & Technology Service Co., Ltd. | 1,385,272,501.07 | 141,320,685.13 | 14,329 | 4 | 5 |
| 600571 | 2021 | Sundray Technologies Co., Ltd. | 1,266,211,833.69 | 107,027,776.33 | 15,133 | 10 | 7 |
References
- Chunlin, J.; Longchuan, J.; Guangyao, Z.; Lab, W. Research on Innovation Network Evolution of OLED Technology Based on Patent Information. J. Intell. 2019, 38, 75–81. (In Chinese) [Google Scholar]
- Fleming, L.; Waguespack, D.M. Brokerage, Boundary Spanning, and Leadership in Open Innovation Communities. Organ. Sci. 2007, 18, 165–180. [Google Scholar] [CrossRef]
- Yue, S. Research on the formation mechanism of China’s artificial intelligence industry innovation network based on knowledge flow. New Econ. 2021, 05, 45–50. (In Chinese) [Google Scholar]
- Boccaletti, S.; Bianconi, G.; Criado, R.; Del Genio, C.I.; Gómez-Gardenes, J.; Romance, M.; Sendina-Nadal, I.; Wang, Z.; Zanin, M. The Structure and Dynamics of Multilayer Networks. Phys. Rep. 2014, 544, 1–122. [Google Scholar] [CrossRef] [PubMed]
- Tang, Y.; Lou, X.; Chen, Z.; Zhang, C. A Study on Dynamic Patterns of Technology Convergence with IPC Co-Occurrence-Based Analysis: The Case of 3D Printing. Sustainability 2020, 12, 2655. [Google Scholar] [CrossRef]
- Mesarovic, M.D.; Macko, D.; Takahara, Y. Theory of Hierarchical, Multilevel, Systems; Elsevier: Amsterdam, The Netherlands, 2000. [Google Scholar]
- Battiston, F.; Nicosia, V.; Latora, V. Structural Measures for Multiplex Networks. Phys. Rev. E 2014, 89, 032804. [Google Scholar] [CrossRef]
- Boccaletti, S.; Pisarchik, A.N.; Del Genio, C.I.; Amann, A. Synchronization: From Coupled Systems to Complex Networks; Cambridge University Press: Cambridge, UK, 2018. [Google Scholar]
- Atallah, M.J.; Blanton, M. Algorithms and Theory of Computation Handbook, Volume 2: Special Topics and Techniques; CRC: Boca Raton, FL, USA, 2009. [Google Scholar]
- Mella, P. The Holonic Revolution. Holons, Holarchies and Holonic Networks. The Ghost in the Production Machine; Pavia University Press: Pavia, Italy, 2009. [Google Scholar]
- Dai, Z.; Tang, R.; Zhang, X. A New Multilayer Network for Measuring Interconnectedness among the Energy Firms. Energy Econ. 2023, 124, 106880. [Google Scholar] [CrossRef]
- Wang, Z.; Wang, L.; Szolnoki, A.; Perc, M. Evolutionary Games on Multilayer Networks: A Colloquium. Eur. Phys. J. B 2015, 88, 124. [Google Scholar] [CrossRef]
- Liu, M.; Tu, Z.; Xu, X.; Wang, Z.; Wang, Y. A Data-Driven Approach for Constructing Multilayer Network-Based Service Ecosystem Models. Softw. Syst. Model. 2023, 22, 919–939. [Google Scholar] [CrossRef]
- Wu, B. The Influence of Different Government Policies on the Co-Evolution of Information Dissemination, Vaccination Behavior and Disease Transmission in Multilayer Networks. Chaos Solitons Fractals 2024, 180, 114522. [Google Scholar] [CrossRef]
- Chen, Y.; Xu, Y.; Zhai, Q. The Knowledge Management Functions of Corporate University and Their Evolution: Case Studies of Two Chinese Corporate Universities. J. Knowl. Manag. 2019, 23, 2086–2112. [Google Scholar] [CrossRef]
- Kivelä, M.; Arenas, A.; Barthelemy, M.; Gleeson, J.P.; Moreno, Y.; Porter, M.A. Multilayer Networks. J. Complex Netw. 2014, 2, 203–271. [Google Scholar] [CrossRef]
- Feng, Z.; Cai, H.; Chen, Z.; Zhou, W. Influence of an Interurban Innovation Network on the Innovation Capacity of China: A Multiplex Network Perspective. Technol. Forecast. Soc. Change 2022, 180, 121651. [Google Scholar] [CrossRef]
- Cai, H.; Wang, Z.; Wang, W. Spatiotemporal Investigation and Determinants of Interprovincial Innovation Network from a Multilayer Network Perspective. Technol. Anal. Strateg. Manag. 2024, 36, 2171–2186. [Google Scholar] [CrossRef]
- Yang, W.; Yu, X.; Zhang, B.; Huang, Z. Mapping the Landscape of International Technology Diffusion (1994–2017): Network Analysis of Transnational Patents. J. Technol. Transf. 2021, 46, 138–171. [Google Scholar] [CrossRef]
- Mudambi, R.; Mudambi, S.M.; Mukherjee, D.; Scalera, V.G. Global Connectivity and the Evolution of Industrial Clusters: From Tires to Polymers in Northeast Ohio. Ind. Mark. Manag. 2017, 61, 20–29. [Google Scholar] [CrossRef]
- Ferreira Freire, J.A.; Goncalves, E. Cooperation in Innovative Efforts: A Systematic Literature Review. J. Knowl. Econ. 2022, 13, 3364–3400. [Google Scholar] [CrossRef]
- Gkypali, A.; Filiou, D.; Tsekouras, K. R&D Collaborations: Is Diversity Enhancing Innovation Performance? Technol. Forecast. Soc. Chang. 2017, 118, 143–152. [Google Scholar]
- Wei, F.; Sheng, D.; Lili, W. Evolutionary Model and Simulation Research of Collaborative Innovation Network: A Case Study of Artificial Intelligence Industry. Discret. Dyn. Nat. Soc. 2018, 2018, 4371528. [Google Scholar] [CrossRef]
- Li, F.; Cao, X.; Ou, R. A Network-Based Evolutionary Analysis of the Diffusion of Cleaner Energy Substitution in Enterprises: The Roles of PEST Factors. Energy Policy 2021, 156, 112385. [Google Scholar] [CrossRef]
- Antonelli, C.; Orsatti, G.; Pialli, G. The Knowledge-Intensive Direction of Technological Change. Eurasian Bus. Rev. 2023, 13, 1–27. [Google Scholar] [CrossRef]
- Rose, M.B. Firms, Networks and Business Values: The British and American Cotton Industries since 1750; Cambridge University Press: Cambridge, UK, 2000; Volume 8. [Google Scholar]
- Dong, C.; Bi, K. On Innovation Performance of Low-Carbon Technology Breakthrough Innovation Network in Manufacturing Industry under the Global Value Chain: A Case Study Based on Chinese Manufacturing Industries. IEEE Access 2020, 8, 174080–174093. [Google Scholar] [CrossRef]
- Giovannetti, E.; Piga, C. The Multifaceted Nature of Cooperation for Innovation, ICT and Innovative Outcomes: Evidence from UK Microdata. Eurasian Bus. Rev. 2023, 13, 639–666. [Google Scholar] [CrossRef]
- Park, B.; Lee, C.-Y. Does R&D Cooperation with Competitors Cause Firms to Invest in R&D More Intensively? Evidence from Korean Manufacturing Firms. J. Technol. Transf. 2023, 48, 1045–1076. [Google Scholar] [CrossRef]
- Wang, C.; Rodan, S.; Fruin, M.; Xu, X. Knowledge Networks, Collaboration Networks, and Exploratory Innovation. Acad. Manag. J. 2014, 57, 484–514. [Google Scholar] [CrossRef]
- Schillebeeckx, S.J.D.; Lin, Y.; George, G.; Alnuaimi, T. Knowledge Recombination and Inventor Networks: The Asymmetric Effects of Embeddedness on Knowledge Reuse and Impact. J. Manag. 2021, 47, 838–866. [Google Scholar] [CrossRef]
- Huang, X.; Wang, H.; Sun, Y.; Yu, L. Digital technology and the upgrading of enterprise export quality: Evidence from patent text machine learning. J. Quant. Technol. Econ. 2023, 40, 69–89. (In Chinese) [Google Scholar] [CrossRef]
- He, Z.-L.; Tong, T.W.; Zhang, Y.; He, W. Constructing a Chinese Patent Database of Listed Firms in China: Descriptions, Lessons, and Insights. J. Econ. Manag. Strategy 2018, 27, 579–606. [Google Scholar] [CrossRef]
- Kim, E.; Cho, Y.; Kim, W. Dynamic Patterns of Technological Convergence in Printed Electronics Technologies: Patent Citation Network. Scientometrics 2014, 98, 975–998. [Google Scholar] [CrossRef]
- Zhao, Y.; Chen, Q.; Guo, B. Mechanisms of cross-border expansion of core companies in an innovation ecosystem: A longitudinal case analysis from the perspective of social embedding. Nankai Bus. Rev. 2022, 25, 52–65. (In Chinese) [Google Scholar]
- Sasaki, H.; Sakata, I. Identifying Potential Technological Spin-Offs Using Hierarchical Information in International Patent Classification. Technovation 2021, 100, 102192. [Google Scholar] [CrossRef]
- De Domenico, M.; Solé-Ribalta, A.; Omodei, E.; Gómez, S.; Arenas, A. Ranking in Interconnected Multilayer Networks Reveals Versatile Nodes. Nat. Commun. 2015, 6, 6868. [Google Scholar] [CrossRef]
- Wasserman, S. Social Network Analysis: Methods and Applications; The Press Syndicate of the University of Cambridge: Cambridge, UK, 1994. [Google Scholar]
- Brin, S.; Page, L. The Anatomy of a Large-Scale Hypertextual Web Search Engine. Comput. Netw. ISDN Syst. 1998, 30, 107–117. [Google Scholar] [CrossRef]
- De Domenico, M.; Solé-Ribalta, A.; Gómez, S.; Arenas, A. Navigability of Interconnected Networks under Random Failures. Proc. Natl. Acad. Sci. USA 2014, 111, 8351–8356. [Google Scholar] [CrossRef]
- Van Zeebroeck, N.; Van Pottelsberghe de la Potterie, B. Filing Strategies and Patent Value. Econ. Innov. New Technol. 2011, 20, 539–561. [Google Scholar] [CrossRef]
- Sun, Y. The Structure and Dynamics of Intra- and Inter-Regional Research Collaborative Networks: The Case of China (1985–2008). Technol. Forecast. Soc. Chang. 2016, 108, 70–82. [Google Scholar] [CrossRef]
Disclaimer/Publisher’s Note: The statements, opinions and data contained in all publications are solely those of the individual author(s) and contributor(s) and not of MDPI and/or the editor(s). MDPI and/or the editor(s) disclaim responsibility for any injury to people or property resulting from any ideas, methods, instructions or products referred to in the content. |
© 2024 by the authors. Licensee MDPI, Basel, Switzerland. This article is an open access article distributed under the terms and conditions of the Creative Commons Attribution (CC BY) license (https://creativecommons.org/licenses/by/4.0/).