
Global Industrial Chain Resilience Research: Theory and Measurement

Abstract
:1. Introduction
2. Literature Review
3. Theoretical Model
3.1. Consumer Preferences
3.2. Production and Technology
3.3. Global Industrial Chain Production
3.4. Network and Resilience
4. Data Source and Variable Construction
4.1. Data Source
4.2. Variable Construction
4.2.1. Global Industrial Chain Resilience
4.2.2. Cost of Iceberg Trading
4.2.3. Domestic Value Added Share
4.2.4. Human Capital Index
4.2.5. Labor Force Elasticity
4.2.6. Total Factor Productivity
5. Discussion
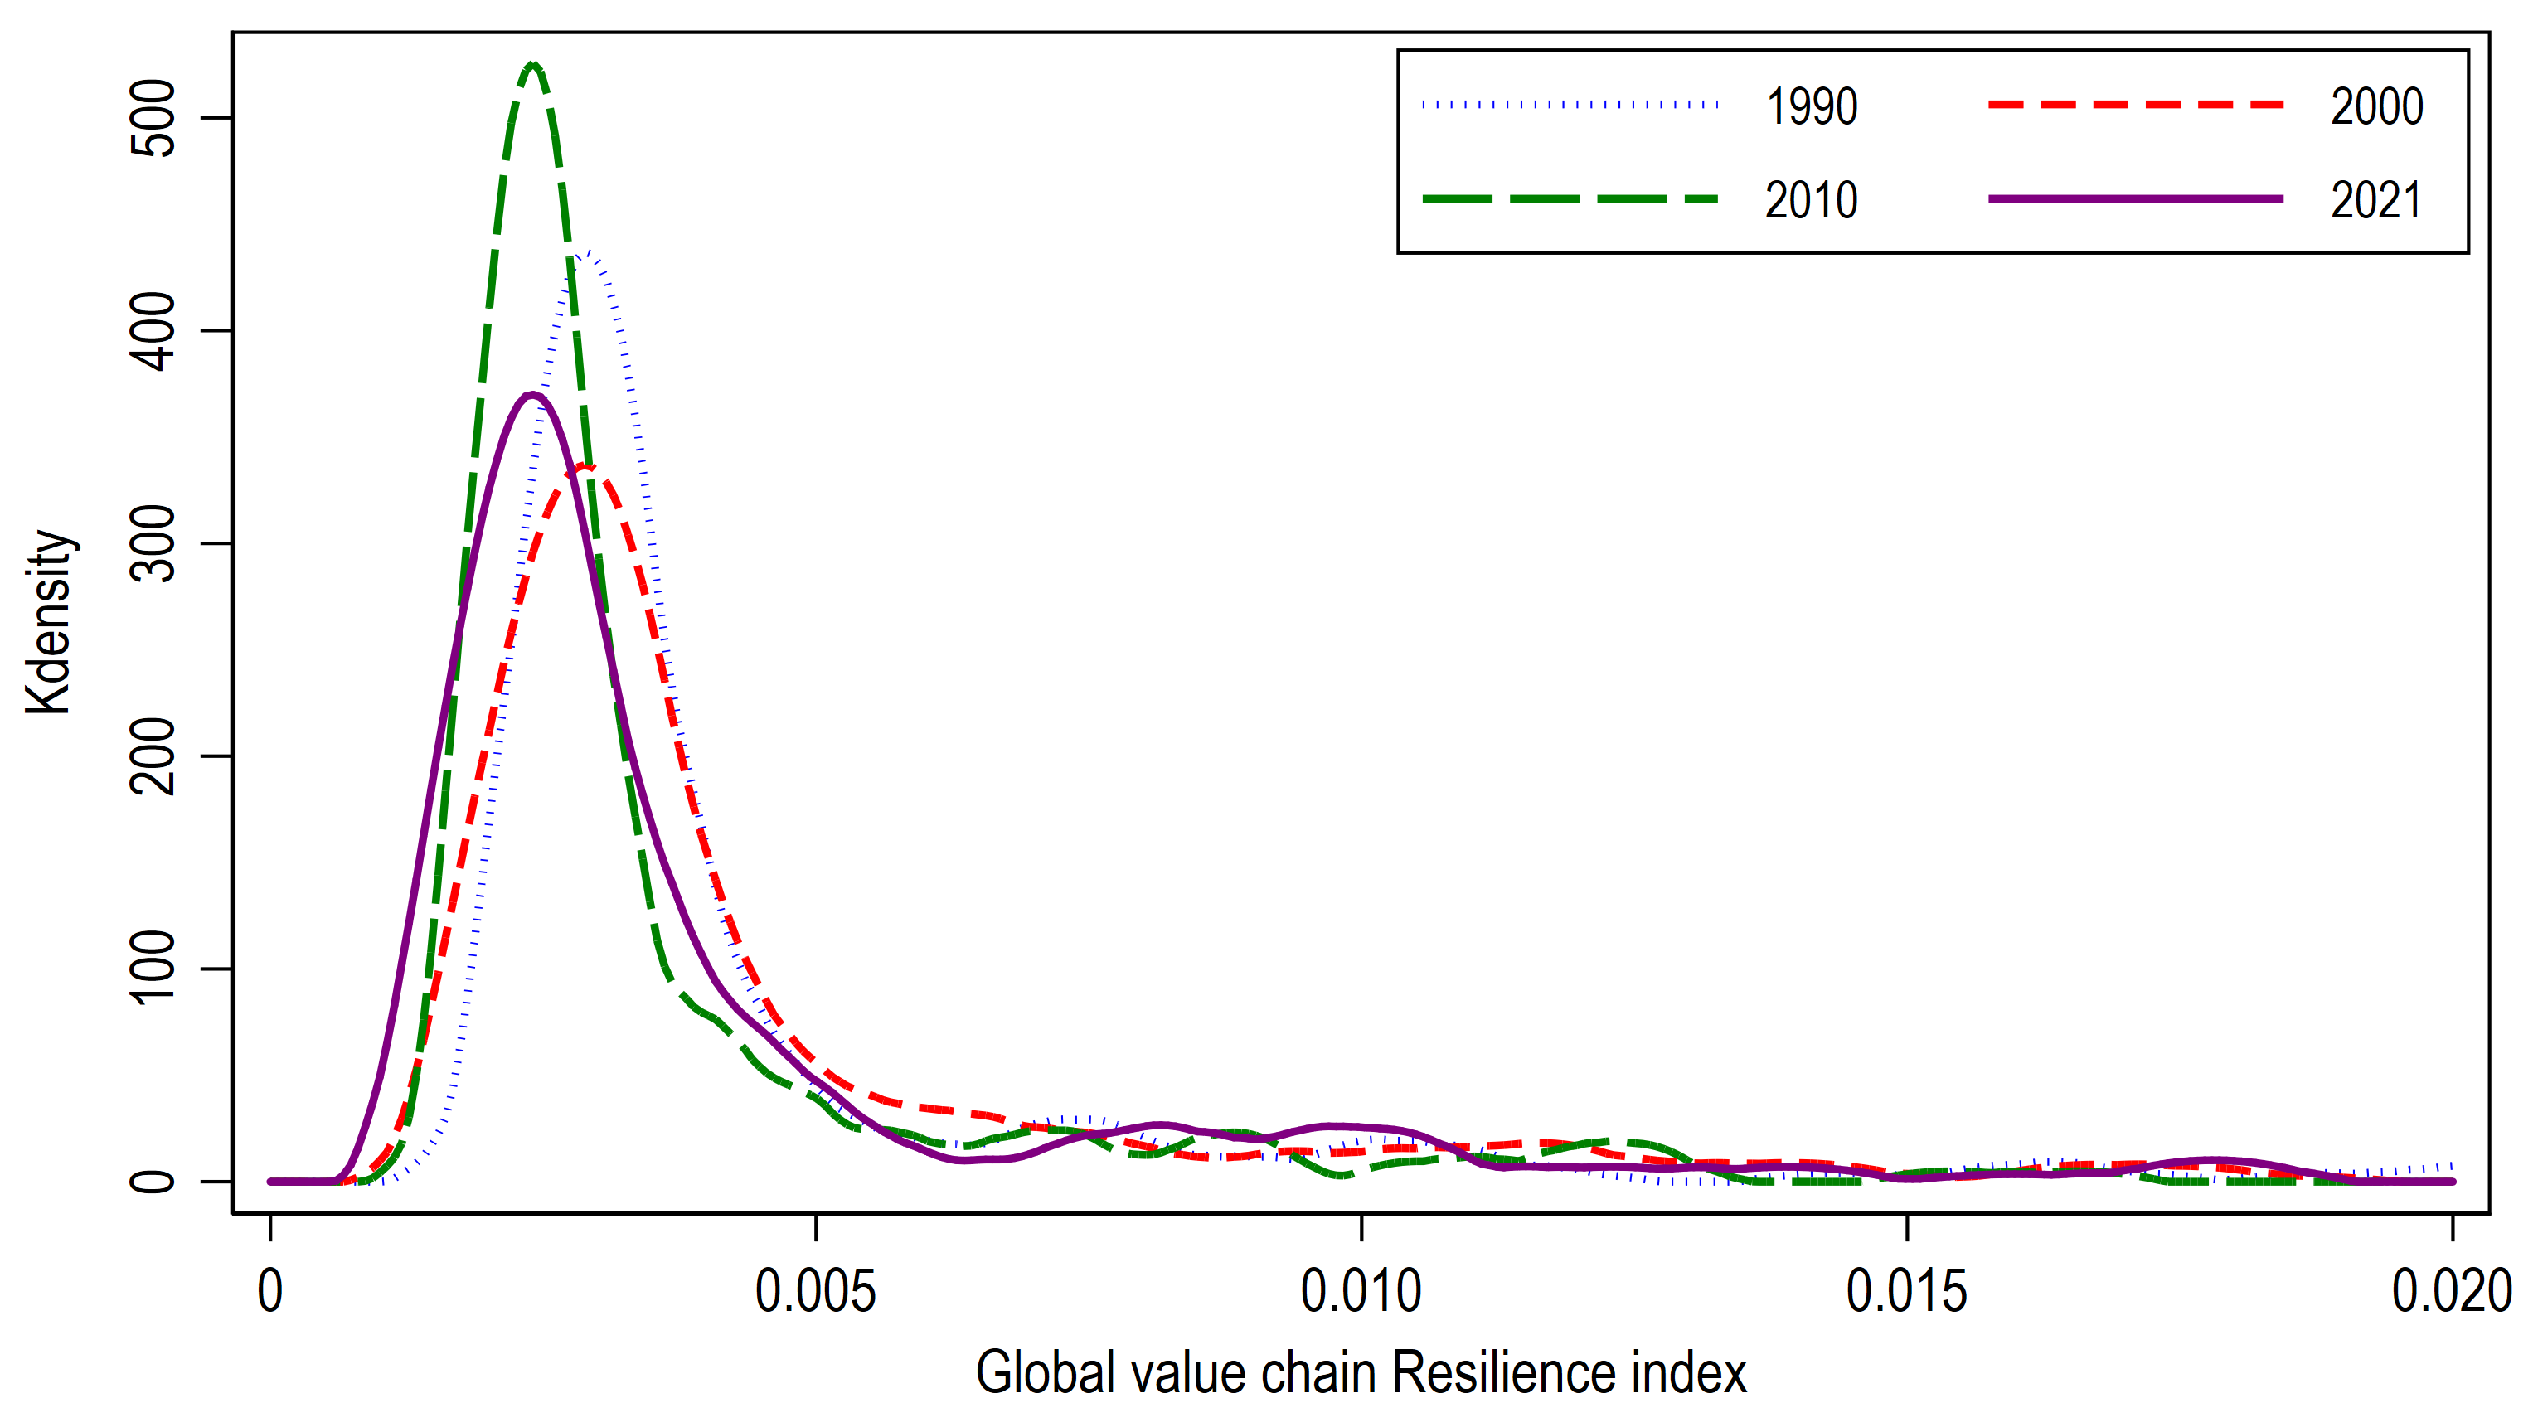
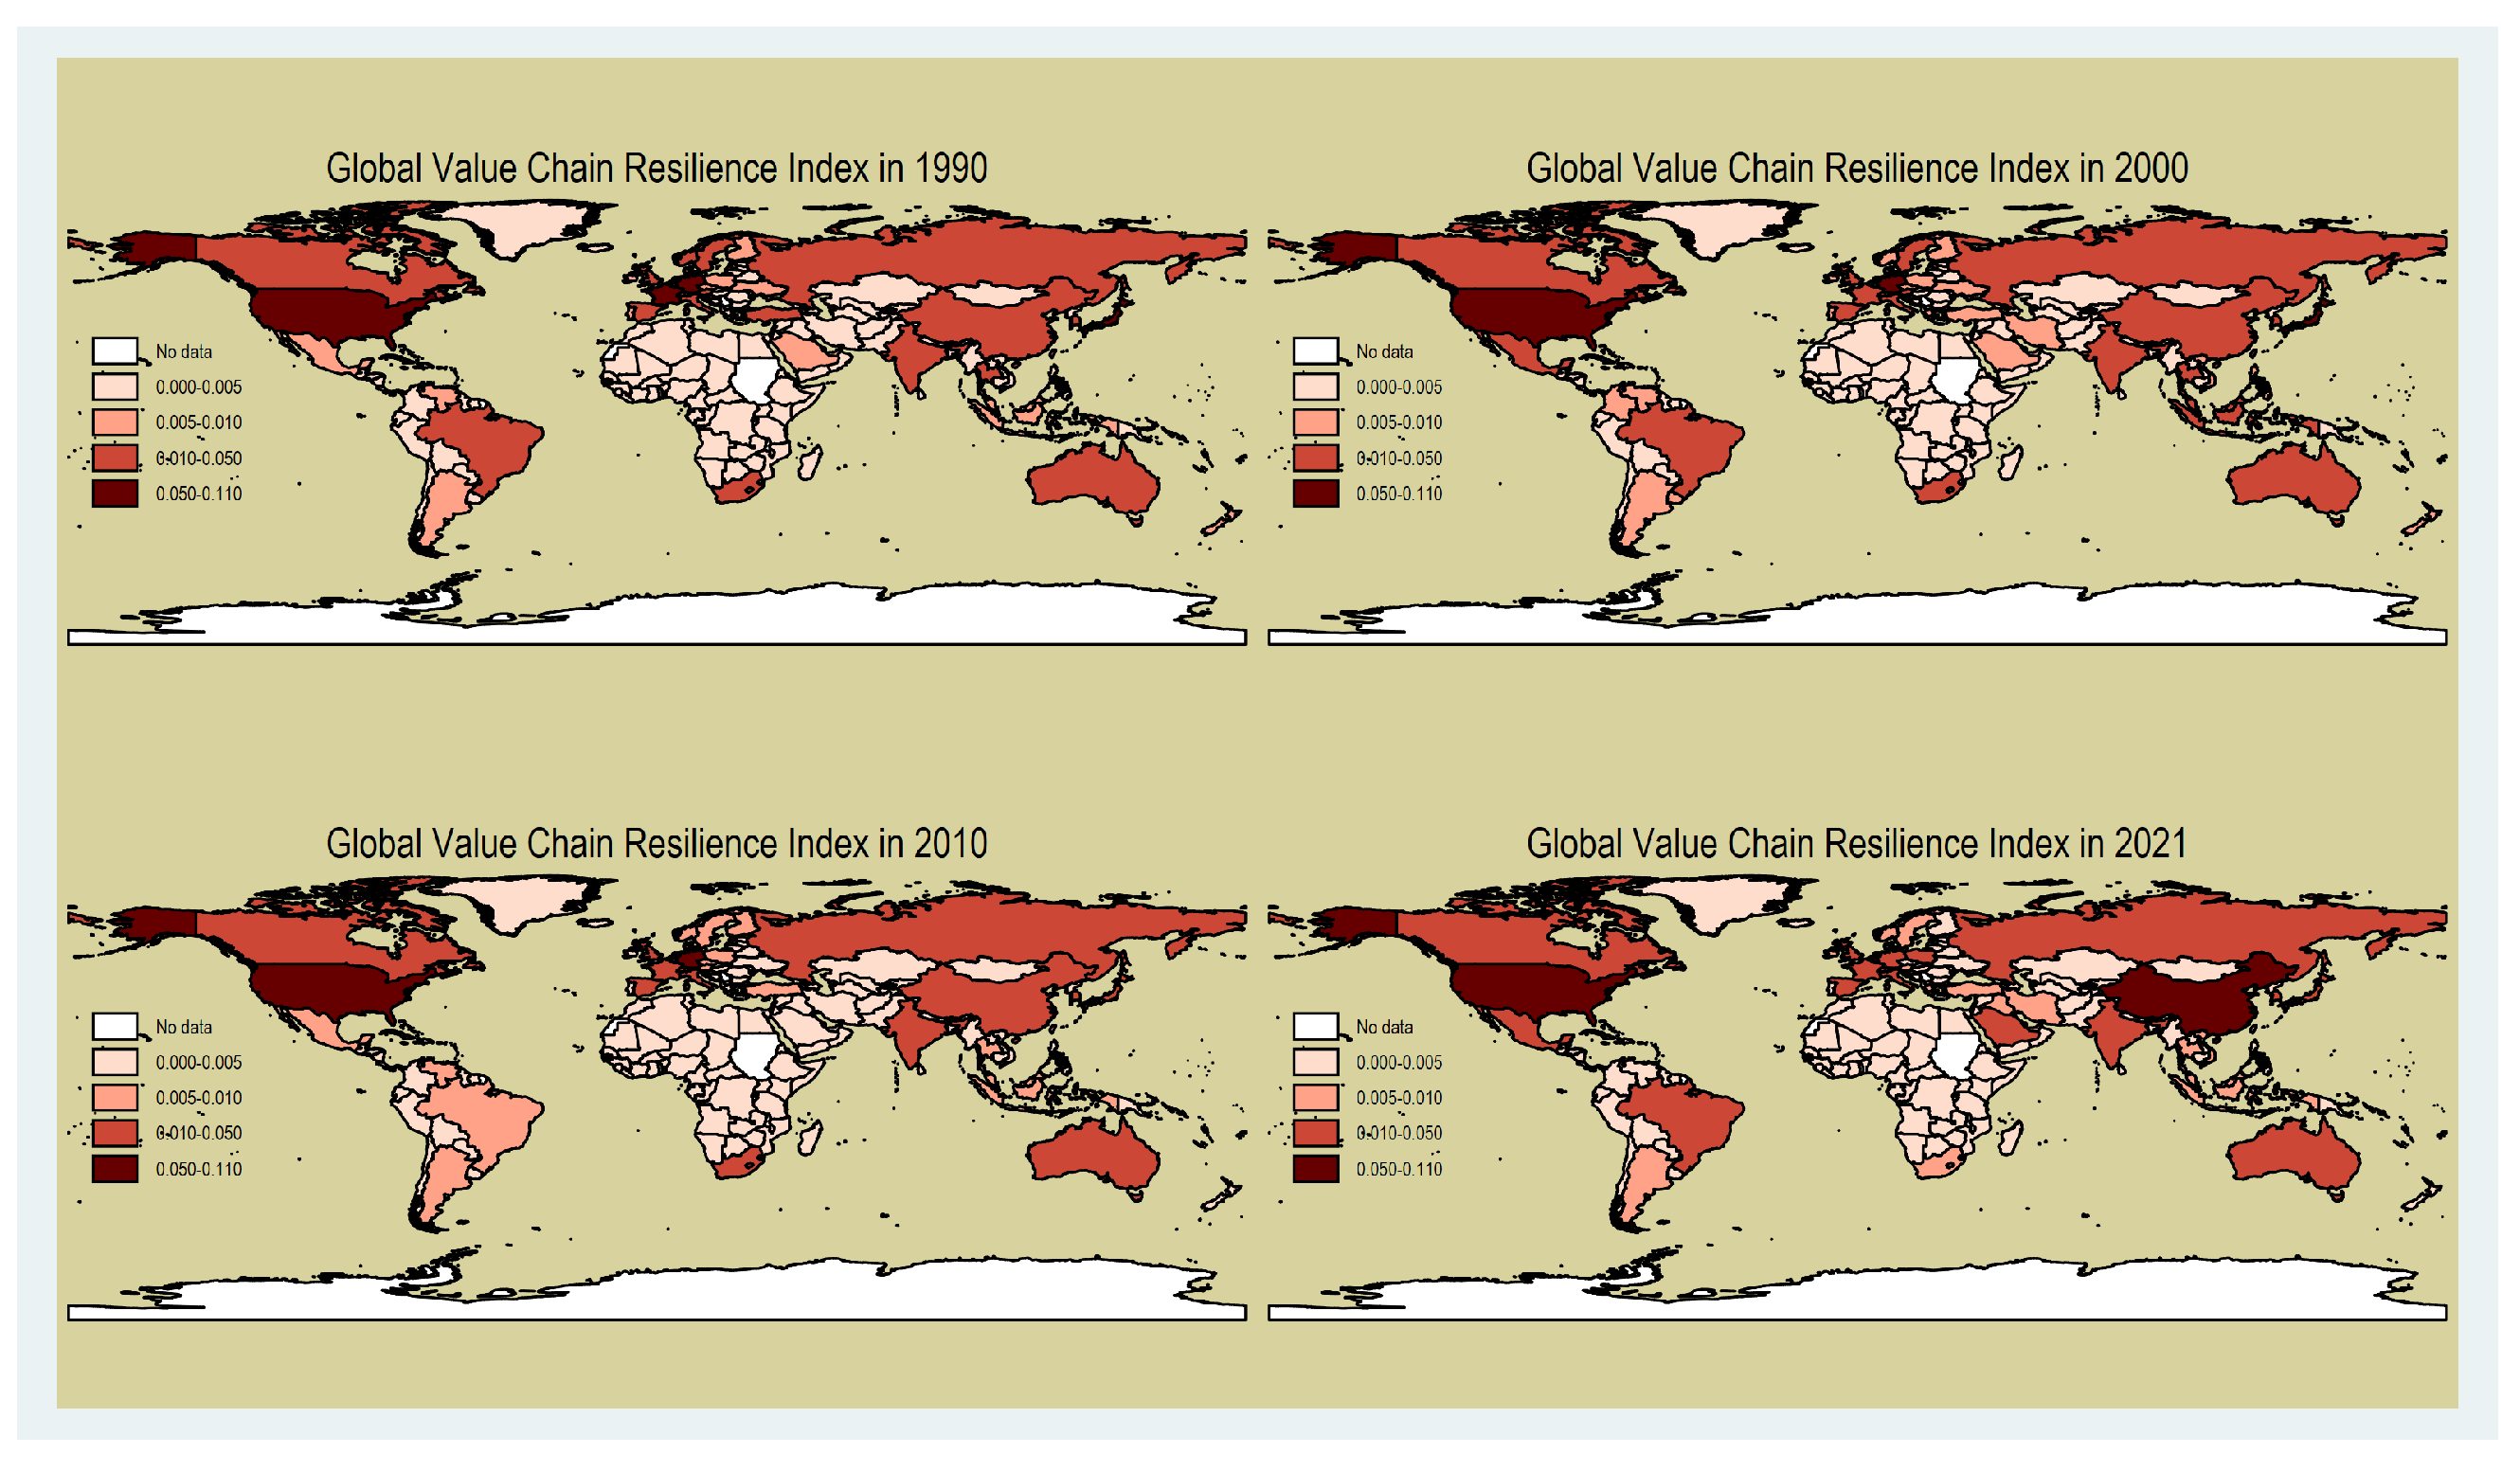
5.1. Spatial Analysis
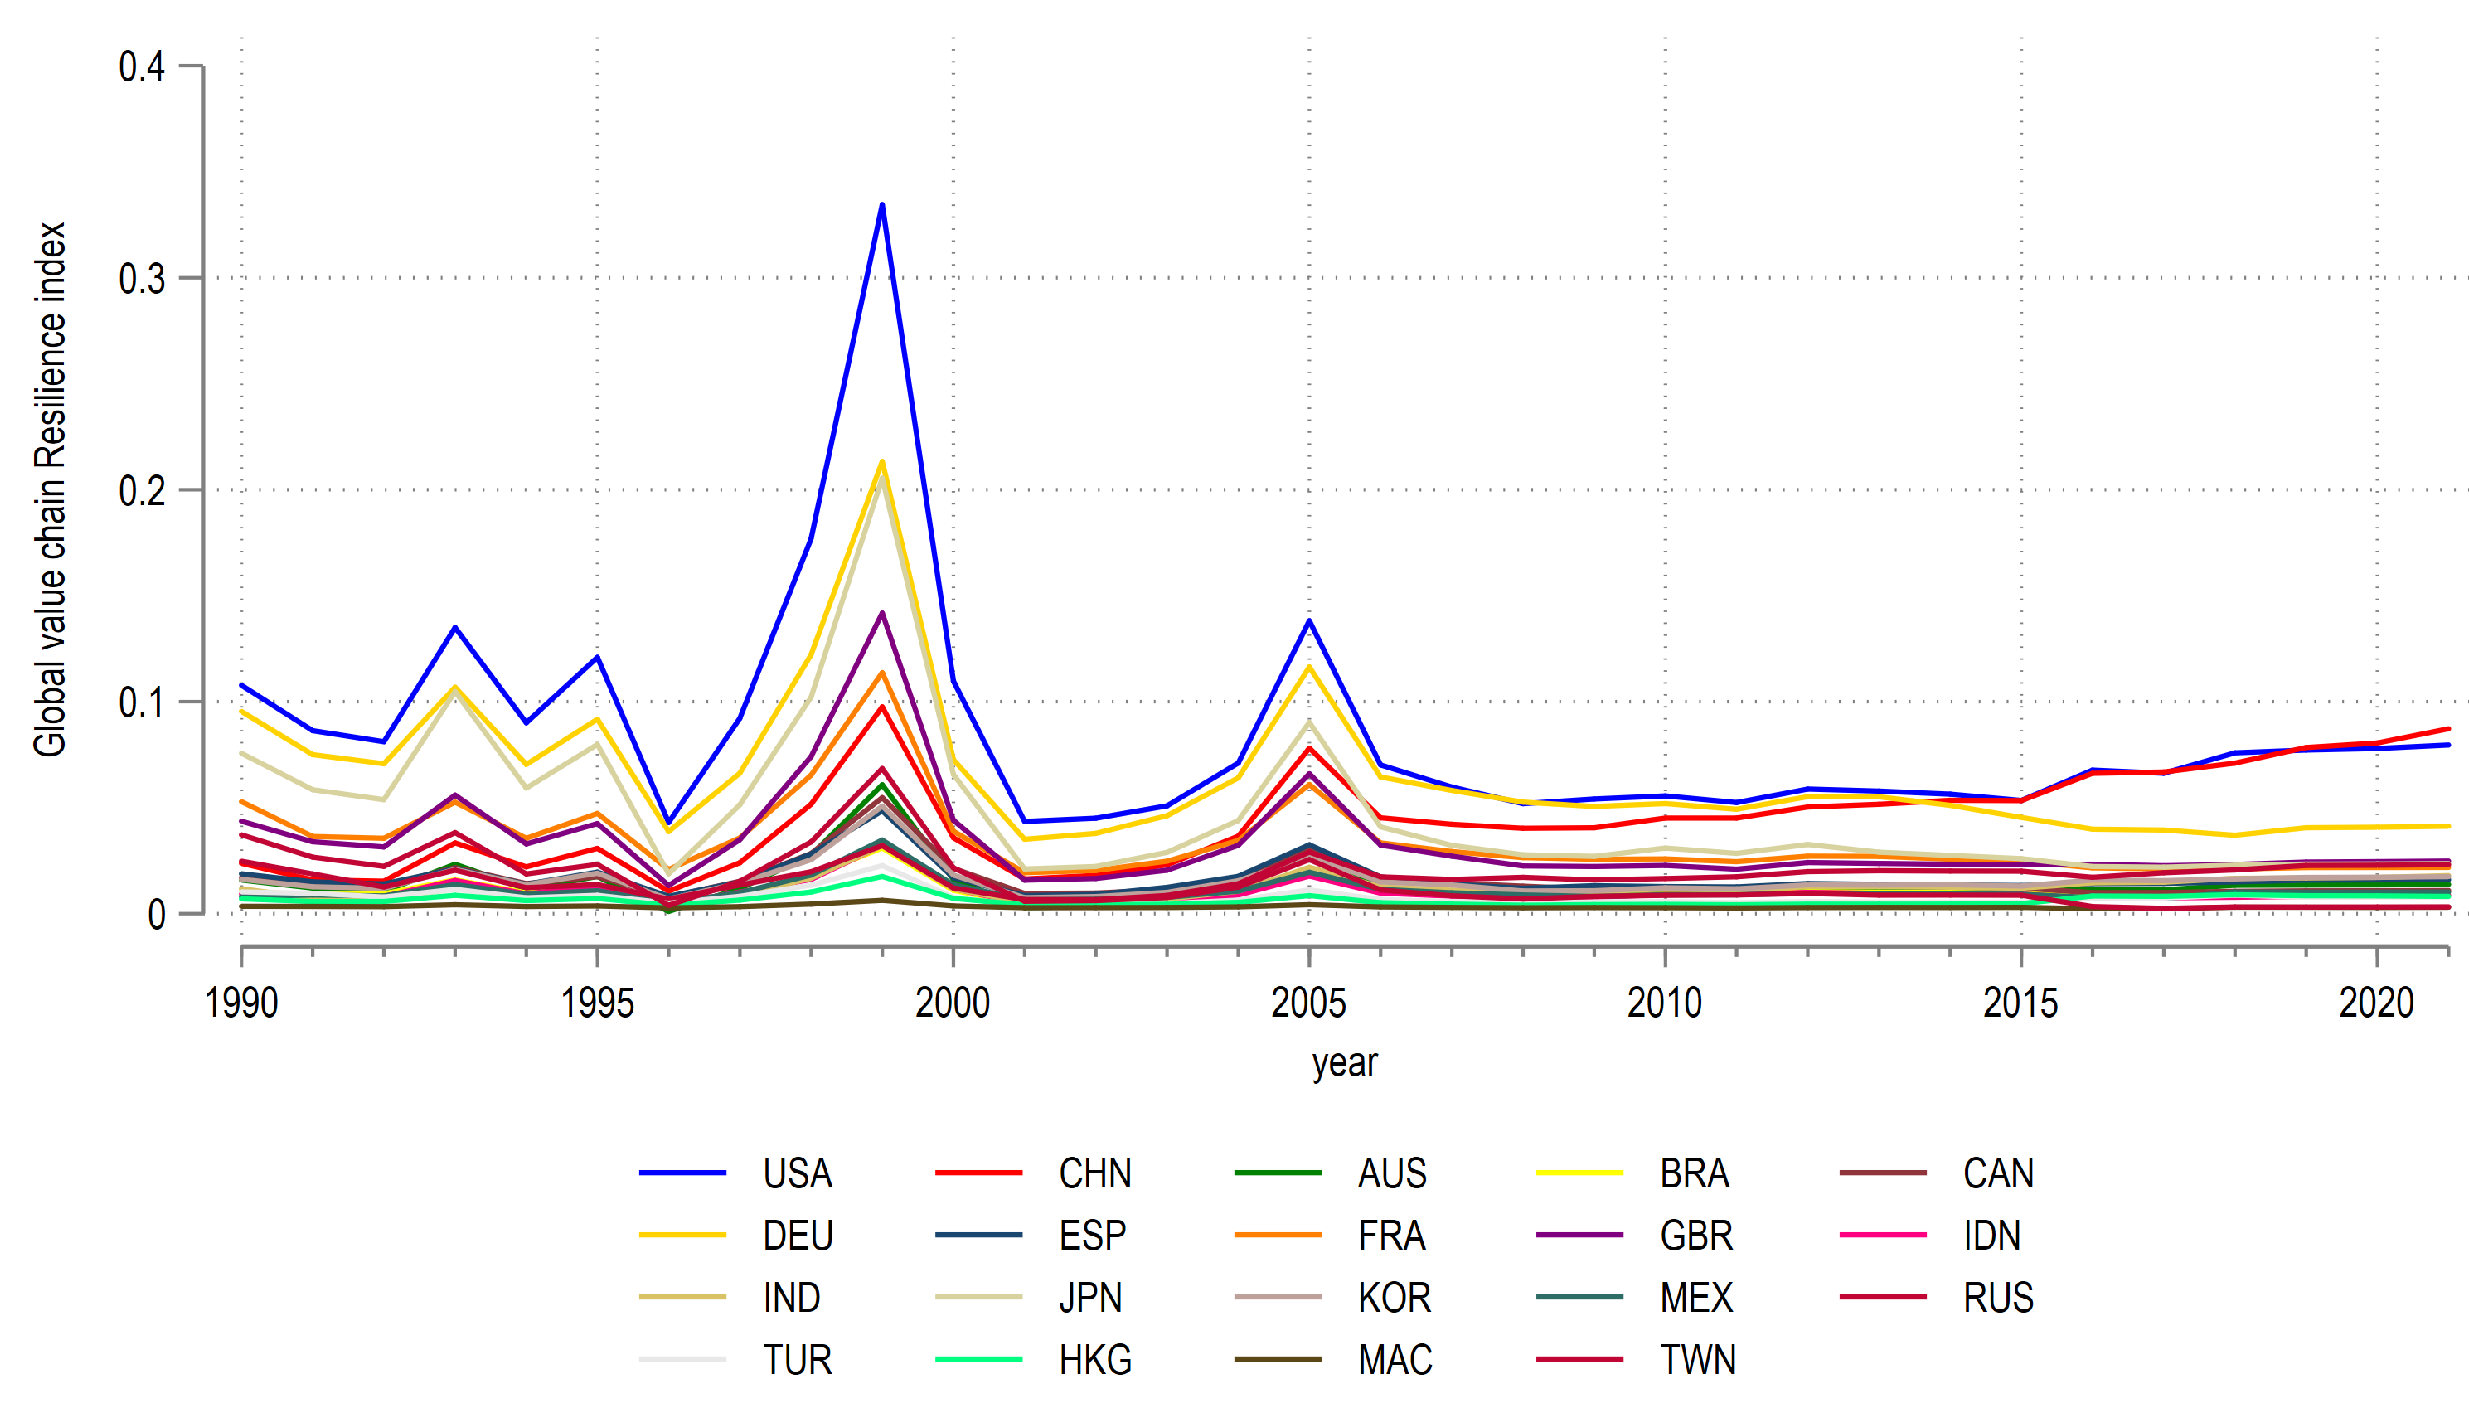
5.2. Temporal Trend
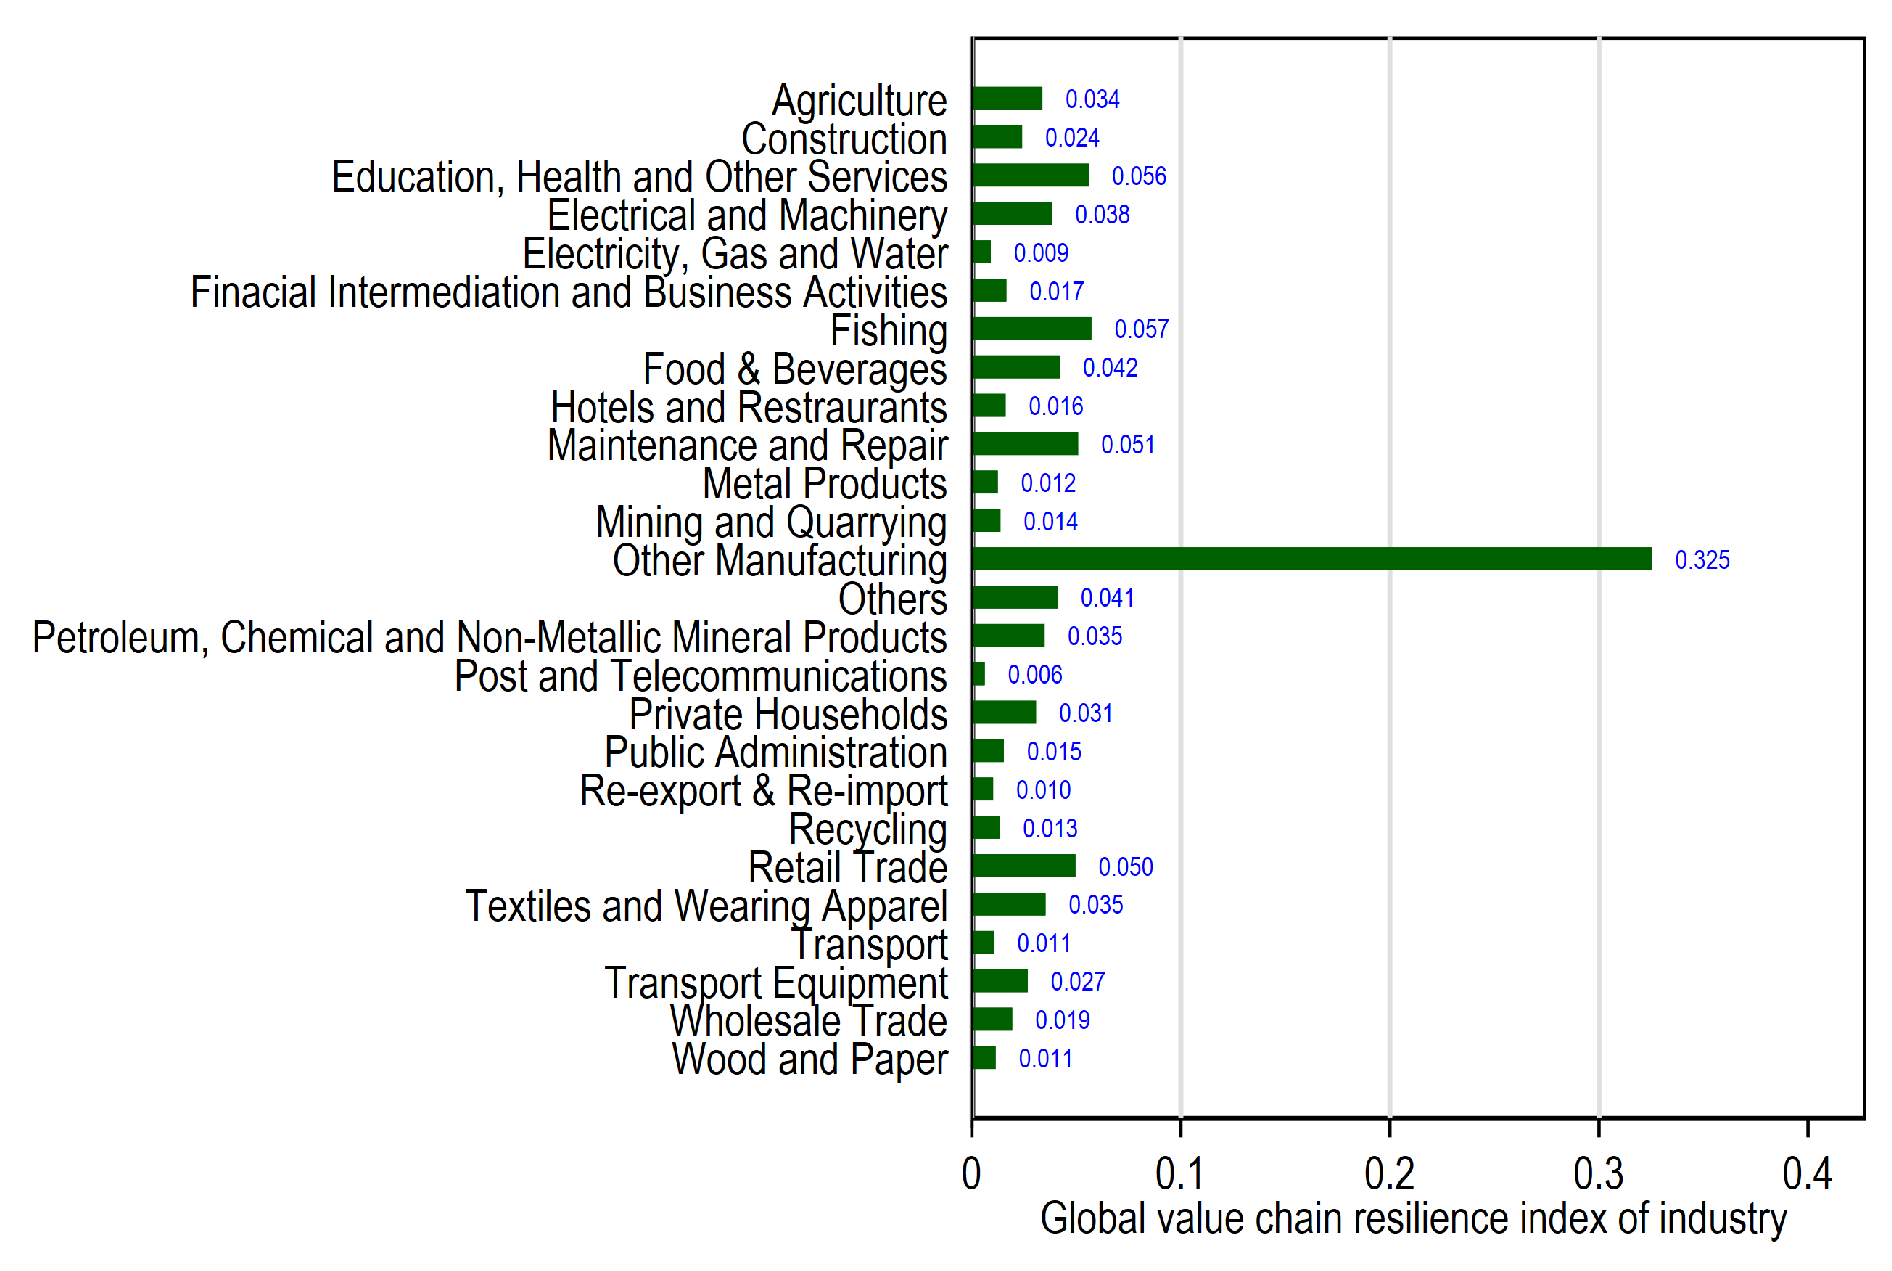
5.3. Impact Factors
6. Conclusions and Recommendation
6.1. Conclusions
6.2. Recommendation
Author Contributions
Funding
Institutional Review Board Statement
Informed Consent Statement
Data Availability Statement
Acknowledgments
Conflicts of Interest
| 1 | Factor utilization costs encompass factors such as factor input costs and Iceberg trade costs. |
| 2 | Openness includes various Iceberg trade costs associated with international trade, such as transportation costs, tariff barriers, and cultural differences. |
| 3 | This table represents a simplified illustration of the Eora MRIO, which does not include the intra-industry input–output relationships within the table. For the specific structure and detailed industry classifications, please refer to the official website at http://worldmrio.com. |
| 4 | To highlight the significant portion of resilience distribution (referred to as head classes), values below 0.02 representing less frequent occurrences (tail classes) were excluded from the analysis. |
References
- Sharma, A.; Kumar, V.; Borah, S.B.; Adhikary, A. Complexity in a multinational enterprise’s global supply chain and its international business performance: A bane or a boon? J. Int. Bus. Stud. 2022, 53, 850–878. [Google Scholar] [CrossRef]
- Sharma, A.; Pathak, S.; Borah, S.B.; Adhikary, A. Collaboration strategies in buyer-supplier relational (BSR) networks and sustainable firm performance: A trade-off story. Int. J. Prod. Econ. 2022, 253, 108558. [Google Scholar] [CrossRef]
- Zeng, K.; Sebold, K.; Lu, Y. Global value chains and corporate lobbying for trade liberalization. Rev. Int. Organ. 2020, 15, 409–443. [Google Scholar] [CrossRef]
- Stiller, Y. Bargaining Power in a Globalized World: The Effect of Global Value Chains in Trade Negotiations. Bus. Politics 2023, 25, 173–194. [Google Scholar] [CrossRef]
- Shen, Z.M.; Sun, Y. Strengthening supply chain resilience during COVID-19: A case study of JD.com. J. Oper. Manag. 2023, 69, 359–383. [Google Scholar] [CrossRef]
- Christopher, M.; Peck, H. Building the Resilient Supply Chain. Int. J. Logist. Manag. 2004, 15, 1–14. [Google Scholar] [CrossRef]
- Ali, A.; Mahfouz, A.; Arisha, A. Analysing supply chain resilience: Integrating the constructs in a concept mapping framework via a systematic literature review. Supply Chain Manag. Int. J. 2017, 22, 16–39. [Google Scholar] [CrossRef]
- Hussain, G.; Nazir, M.S.; Rashid, M.A.; Sattar, M.A. From supply chain resilience to supply chain disruption orientation: The moderating role of supply chain complexity. J. Enterp. Inf. Manag. 2023, 36, 70–90. [Google Scholar] [CrossRef]
- Wieland, A.; Wallenburg, C.M. The influence of relational competencies on supply chain resilience: A relational view. Int. J. Phys. Distrib. Logist. Manag. 2013, 43, 300–320. [Google Scholar] [CrossRef]
- Tukamuhabwa, B.R.; Stevenson, M.; Busby, J.; Zorzini, M. Supply chain resilience: Definition, review and theoretical foundations for further study. Int. J. Prod. Res. 2015, 53, 5592–5623. [Google Scholar] [CrossRef]
- Zahra, S.A.; Petricevic, O.; Luo, Y. Toward an action-based view of dynamic capabilities for international business. J. Int. Bus. Stud. 2022, 53, 583–600. [Google Scholar] [CrossRef]
- Katsaliaki, K.; Galetsi, P.; Kumar, S. Supply chain disruptions and resilience: A major review and future research agenda. Ann. Oper. Res. 2022, 319, 965–1002. [Google Scholar] [CrossRef] [PubMed]
- Pu, G.; Li, S.; Bai, J. Effect of supply chain resilience on firm’s sustainable competitive advantage: A dynamic capability perspective. Environ. Sci. Pollut. Res. 2023, 30, 4881–4898. [Google Scholar] [CrossRef] [PubMed]
- Yabe, T.; Rao, P.S.C.; Ukkusuri, S.V.; Cutter, S.L. Toward data-driven, dynamical complex systems approaches to disaster resilience. Proc. Natl. Acad. Sci. 2022, 119, e2111997119. [Google Scholar] [CrossRef] [PubMed]
- Ponomarov, S.Y.; Holcomb, M.C. Understanding the concept of supply chain resilience. Int. J. Logist. Manag. 2009, 20, 124–143. [Google Scholar] [CrossRef]
- Yaqin, Y.; Li, W. The effects of supply chain risk information processing capability and supply chain finance on supply chain resilience: A moderated and mediated model. J. Enterp. Inf. Manag. 2022, 35, 1592–1612. [Google Scholar] [CrossRef]
- Singh, C.S.; Soni, G.; Badhotiya, G.K. Performance indicators for supply chain resilience: Review and conceptual framework. J. Ind. Eng. Int. 2019, 15, 105–117. [Google Scholar] [CrossRef]
- Chen, J.; Wen, H. The application of complex network theory for resilience improvement of knowledge-intensive supply chains. Oper. Manag. Res. 2023. online ahead of print. [Google Scholar] [CrossRef]
- Ivanov, D. Viable supply chain model: Integrating agility, resilience and sustainability perspectives—Lessons from and thinking beyond the COVID-19 pandemic. Ann. Oper. Res. 2022, 319, 1411–1431. [Google Scholar] [CrossRef]
- Zamani, E.D.; Smyth, C.; Gupta, S.; Dennehy, D. Artificial intelligence and big data analytics for supply chain resilience: A systematic literature review. Ann. Oper. Res. 2023, 327, 605–632. [Google Scholar] [CrossRef]
- Sturm, S.; Hohenstein, N.O.; Hartmann, E. Linking entrepreneurial orientation and supply chain resilience to strengthen business performance: An empirical analysis. Int. J. Oper. Prod. Manag. 2023. online ahead of print. [Google Scholar] [CrossRef]
- Das, D.; Datta, A.; Kumar, P.; Kazancoglu, Y.; Ram, M. Building supply chain resilience in the era of COVID-19: An AHP-DEMATEL approach. Oper. Manag. Res. 2022, 15, 249–267. [Google Scholar] [CrossRef]
- Ivanov, D.; Blackhurst, J.; Das, A. Supply chain resilience and its interplay with digital technologies: Making innovations work in emergency situations. Int. J. Phys. Distrib. Logist. Manag. 2021, 51, 97–103. [Google Scholar] [CrossRef]
- Dolgui, A.; Ivanov, D.; Sokolov, B. Reconfigurable supply chain: The X-network. Int. J. Prod. Res. 2020, 58, 4138–4163. [Google Scholar] [CrossRef]
- Shishodia, A.; Sharma, R.; Rajesh, R.; Munim, Z.H. Supply chain resilience: A review, conceptual framework and future research. Int. J. Logist. Manag. 2021, 34, 879–908. [Google Scholar] [CrossRef]
- Sarkar, B.; Guchhait, R. Ramification of information asymmetry on a green supply chain management with the cap-trade, service, and vendor-managed inventory strategies. Electron. Commer. Res. Appl. 2023, 60, 101274. [Google Scholar] [CrossRef]
- Antràs, P.; Gortari, A. On the Geography of Global Value Chains. Econometrica 2020, 88, 1553–1598. [Google Scholar] [CrossRef]
- Caliendo, L.; Parro, F. Estimates of the Trade and Welfare Effects of NAFTA. Rev. Econ. Stud. 2015, 82, 1–44. [Google Scholar] [CrossRef]
- Melitz, M. The Impact of Trade on Intra-Industry Reallocations and Aggregate Industry Productivity. Econometrica 2003, 71, 1695–1725. [Google Scholar] [CrossRef]
- Billingsley, P. Probability and Measure, 3rd ed.; Wiley Series in Probability and Mathematical Statistics; Wiley: New York, NY, USA, 1995. [Google Scholar]
- Eaton, J.; Kortum, S. Technology, Geography, and Trade. Econometrica 2002, 70, 1741–1779. [Google Scholar] [CrossRef]
- Baldwin, R.; Venables, A.J. Spiders and snakes: Offshoring and agglomeration in the global economy. J. Int. Econ. 2013, 90, 245–254. [Google Scholar] [CrossRef]
- Aslam, A.; Novta, N.; Rodrigues-Bastos, F. Calculating Trade in Value Added. In International Monetary Fund (IMF) Research Paper Series; International Monetary Fund: Washington, DC, USA, 2017. [Google Scholar]
- Head, K.; Ries, J. Increasing Returns versus National Product Differentiation as an Explanation for the Pattern of U.S.-Canada Trade. Am. Econ. Rev. 2001, 91, 858–876. [Google Scholar] [CrossRef]
- Barro, R.J.; Lee, J.W. A new data set of educational attainment in the world, 1950–2010. J. Dev. Econ. 2013, 104, 184–198. [Google Scholar] [CrossRef]
- Patrinos, H.; Psacharopoulos, G. Returns to Investment in Education: A Further Update. Educ. Econ. 2004, 12, 111–134. [Google Scholar] [CrossRef]
- Wasserman, S.; Faust, K. Social Network Analysis: Methods and Applications.; Cambridge University Press: Cambridge, UK, 1994. [Google Scholar]


| Input Use & Value Use | Final Use | Total Use | ||||||
| Country 1 | ⋯ | Country J | Country l | ⋯ | Country J | |||
| Output supplied | Country 1 | ⋯ | ⋯ | |||||
| ⋮ | ⋮ | ∵ | ⋮ | ⋮ | ∵ | ⋮ | ⋮ | |
| Country J | ⋯ | ⋯ | ||||||
| Value added | ||||||||
| Gross output | … | |||||||
| Variable | N | Mean | SD | Min | Max |
|---|---|---|---|---|---|
| -country | 6048 | 0.010 | 0.010 | 0.000 | 0.330 |
| -industry | 832 | 0.004 | 0.006 | 0.000 | 0.350 |
| Ice_cost | 6048 | 9.69 | 8.99 | 2.99 | 281.20 |
| DVA_share | 6048 | 0.61 | 4.64 | −182.20 | 1.17 |
| 4320 | 2.42 | 0.70 | 1.03 | 4.35 | |
| 3450 | 0.65 | 0.24 | 0.070 | 1.53 | |
| Labor_share | 4077 | 0.51 | 0.12 | 0.09 | 0.90 |
| lnGDP | 5070 | 11.08 | 2.02 | 5.30 | 16.84 |
| (1) | (2) | |
|---|---|---|
| Degree | ||
| L. Ice_cost | ** | *** |
| (0.0002) | (0.0011) | |
| L. DVA_share | 0.0005 | 0.0035 *** |
| (0.0004) | (0.0013) | |
| L. H C | 0.0041 *** | 0.0443 *** |
| (0.0009) | (0.0064) | |
| L. T F P | 0.0045 *** | 0.0364 *** |
| (0.0009) | (0.0052) | |
| L. Labor_share | ** | 0.0345 *** |
| (0.0018) | (0.0102) | |
| Constant | *** | |
| (0.0028) | (0.0201) | |
| Country Fixed Effects | Yes | Yes |
| Year Fixed Effects | Yes | Yes |
| N | 3450 | 3450 |
| 0.751 | 0.936 |
Disclaimer/Publisher’s Note: The statements, opinions and data contained in all publications are solely those of the individual author(s) and contributor(s) and not of MDPI and/or the editor(s). MDPI and/or the editor(s) disclaim responsibility for any injury to people or property resulting from any ideas, methods, instructions or products referred to in the content. |
© 2023 by the authors. Licensee MDPI, Basel, Switzerland. This article is an open access article distributed under the terms and conditions of the Creative Commons Attribution (CC BY) license (https://creativecommons.org/licenses/by/4.0/).
Share and Cite
Ma, L.; Li, X.; Pan, Y. Global Industrial Chain Resilience Research: Theory and Measurement. Systems 2023, 11, 466. https://doi.org/10.3390/systems11090466
Ma L, Li X, Pan Y. Global Industrial Chain Resilience Research: Theory and Measurement. Systems. 2023; 11(9):466. https://doi.org/10.3390/systems11090466
Chicago/Turabian StyleMa, Li, Xiumin Li, and Yu Pan. 2023. "Global Industrial Chain Resilience Research: Theory and Measurement" Systems 11, no. 9: 466. https://doi.org/10.3390/systems11090466
APA StyleMa, L., Li, X., & Pan, Y. (2023). Global Industrial Chain Resilience Research: Theory and Measurement. Systems, 11(9), 466. https://doi.org/10.3390/systems11090466