Article

A Novel Methodology for Estimating Technology Value and Importance of Factors in Market-Based Approach

1
Department of Industrial and Management Engineering, Hanyang University, Ansan 15588, Republic of Korea
2
Division of Data Analysis, Korea Institute of Science and Technology Information, Seoul 02456, Republic of Korea
*
Author to whom correspondence should be addressed.
Systems 2023, 11(9), 439; https://doi.org/10.3390/systems11090439
Submission received: 26 June 2023 / Revised: 18 August 2023 / Accepted: 21 August 2023 / Published: 23 August 2023
(This article belongs to the Special Issue Research and Practices in Technological Innovation Management Systems)

Abstract

:
Technology valuation methods are classified into income-based, cost-based, and market-based approaches depending on the perspective of valuing technology. The market approach evaluates the value of technology by referring to cases in which similar technologies have been traded before. In this study, we use prior technology transaction data to estimate the technology value based on the market approach and to identify influential factors to the estimated value. To this end, we adopt a multivariate k-nearest neighbor (MKNN) regression model to accommodate mixed-type input variables aiming at estimating multivariate technology values, selecting influencing factors, and the relative importance of the selected factors. In addition, we can optimize the number of transaction cases k in k-NN regression. Our proposed regression model outperforms an embedding model with cosine similarity in predicting multivariate response variables. In addition, we illustrate how to select and assess the influential factors based on the real-life dataset.

1. Introduction

As corporate technological capability is recognized as a key factor in determining competitive advantage, technological alliances and transactions among companies are actively occurring. Accordingly, various efforts are being pursued to evaluate the value of technology and link it to transactions. Technology valuation methods are broadly classified into income-based, cost-based, and market-based approaches, depending on the perspective of valuing the technology. The income-based approach involves evaluating the target technology by discounting the future cash flows that will be obtained when commercializing it to the present value, whereas the cost-based approach calculates the value of technology based on the reproduction cost or alternative cost of the target technology. By contrast, the market-based approach evaluates the value of the target technology by referring to cases in which similar technologies have been traded [1]. With the adoption of international accounting standards, the market-based approach, which is internationally recommended and evaluates the value of technology based on market information, has been recognized as a highly valid method. To perform a technology valuation using a market-based approach, a process similar to that shown in Figure 1 is necessary [2]. First, comparable technology asset transaction information from the past must be collected, and comparability between the target technology and comparison cases must be analyzed to ensure the reliability of the data. Therefore, a value adjustment process is necessary. However, because of security concerns, it is often challenging to secure technology transaction information or transaction amounts themselves. Even if comparable cases exist, research on determining the comparability and similarity between the target technology and previous transaction cases remains insufficient [2].
In this regard, research has been conducted on technology valuation models using market-based approaches. Kang et al. [3] conducted a study that calculated the similarity between technologies using patent classification codes and keyword information, and Kang et al. [1] developed a market replacement cost approach to evaluate the value of the technology being assessed based on the cost of similar projects extracted from keyword information. Lim et al. [4] developed a conceptual model to calculate the market value of a technology based on a technology transfer system that included technology, technology value, and market value. However, most of these studies do not evaluate the value of technology based on actual technology transaction cases.
In prior research utilizing technology transaction cases, Sung et al. [5] proposed a method to explain the relationship between patent value factors and the transaction amount by using regression analysis. Kim et al. [6] explained the relationship between influential factors and royalty rates by assuming technology impact factors as independent variables and royalty rates as dependent variables using logistic regression models. However, previous studies have been limited in that they assume there is only a single response variable to be predicted, such as a royalty rate. The approaches may not be applicable when we have a multivariate response, such as upfront payments and royalty rates, that should be considered simultaneously in the running royalty method. In addition, the existing studies do not estimate the relative importance of the influential factors because the studies select the influential factors that have statistically significant effects on the univariate response variable based on regression analysis.
Therefore, in this study, we propose a method for predicting multivariate technology value, such as upfront payment and running royalty rate, and for evaluating the relative importance of influential factors to the multivariate response variables. To achieve this, we applied Gower’s similarity [7], which is suitable for mixed-type data, as shown in Figure 2, and used MkNN regression models to explain the relationship between influential factors and technical fees, including upfront payments and royalty rates. We used Tabu Search encoding solutions and a genetic algorithm to select influential factors that affect technical fees and simultaneously derive their weights and transaction case k. The contribution of this study can be summarized as follows.
  • We propose a new technology valuation method that can be applicable when we have transaction datasets that have multiple responses, such as upfront payment and royalty rate.
  • We propose methods to evaluate the relative importance of influential factors to the multivariate response.
  • Also, the proposed method can identify the optimal number k of previous transaction cases to compare.
The remainder of this paper is organized as follows. In Section 2, we introduce previous studies on analyzing influential factors affecting technology value and evaluate the importance of independent variables using regression models in the market approach. In Section 3, we propose a method for selecting the influential factors that affect technical fees, determining the weights of key influential factors, and identifying the number of case studies through multivariate regression analysis based on the k-nearest neighbor and genetic algorithms. Section 4 evaluates the importance of the key influential factors in technology value by fitting the proposed model to actual technology transaction data. Finally, Section 5 discusses the limitations of the market approach and summarizes the research results, practical applications, and implications.

2. Related Work

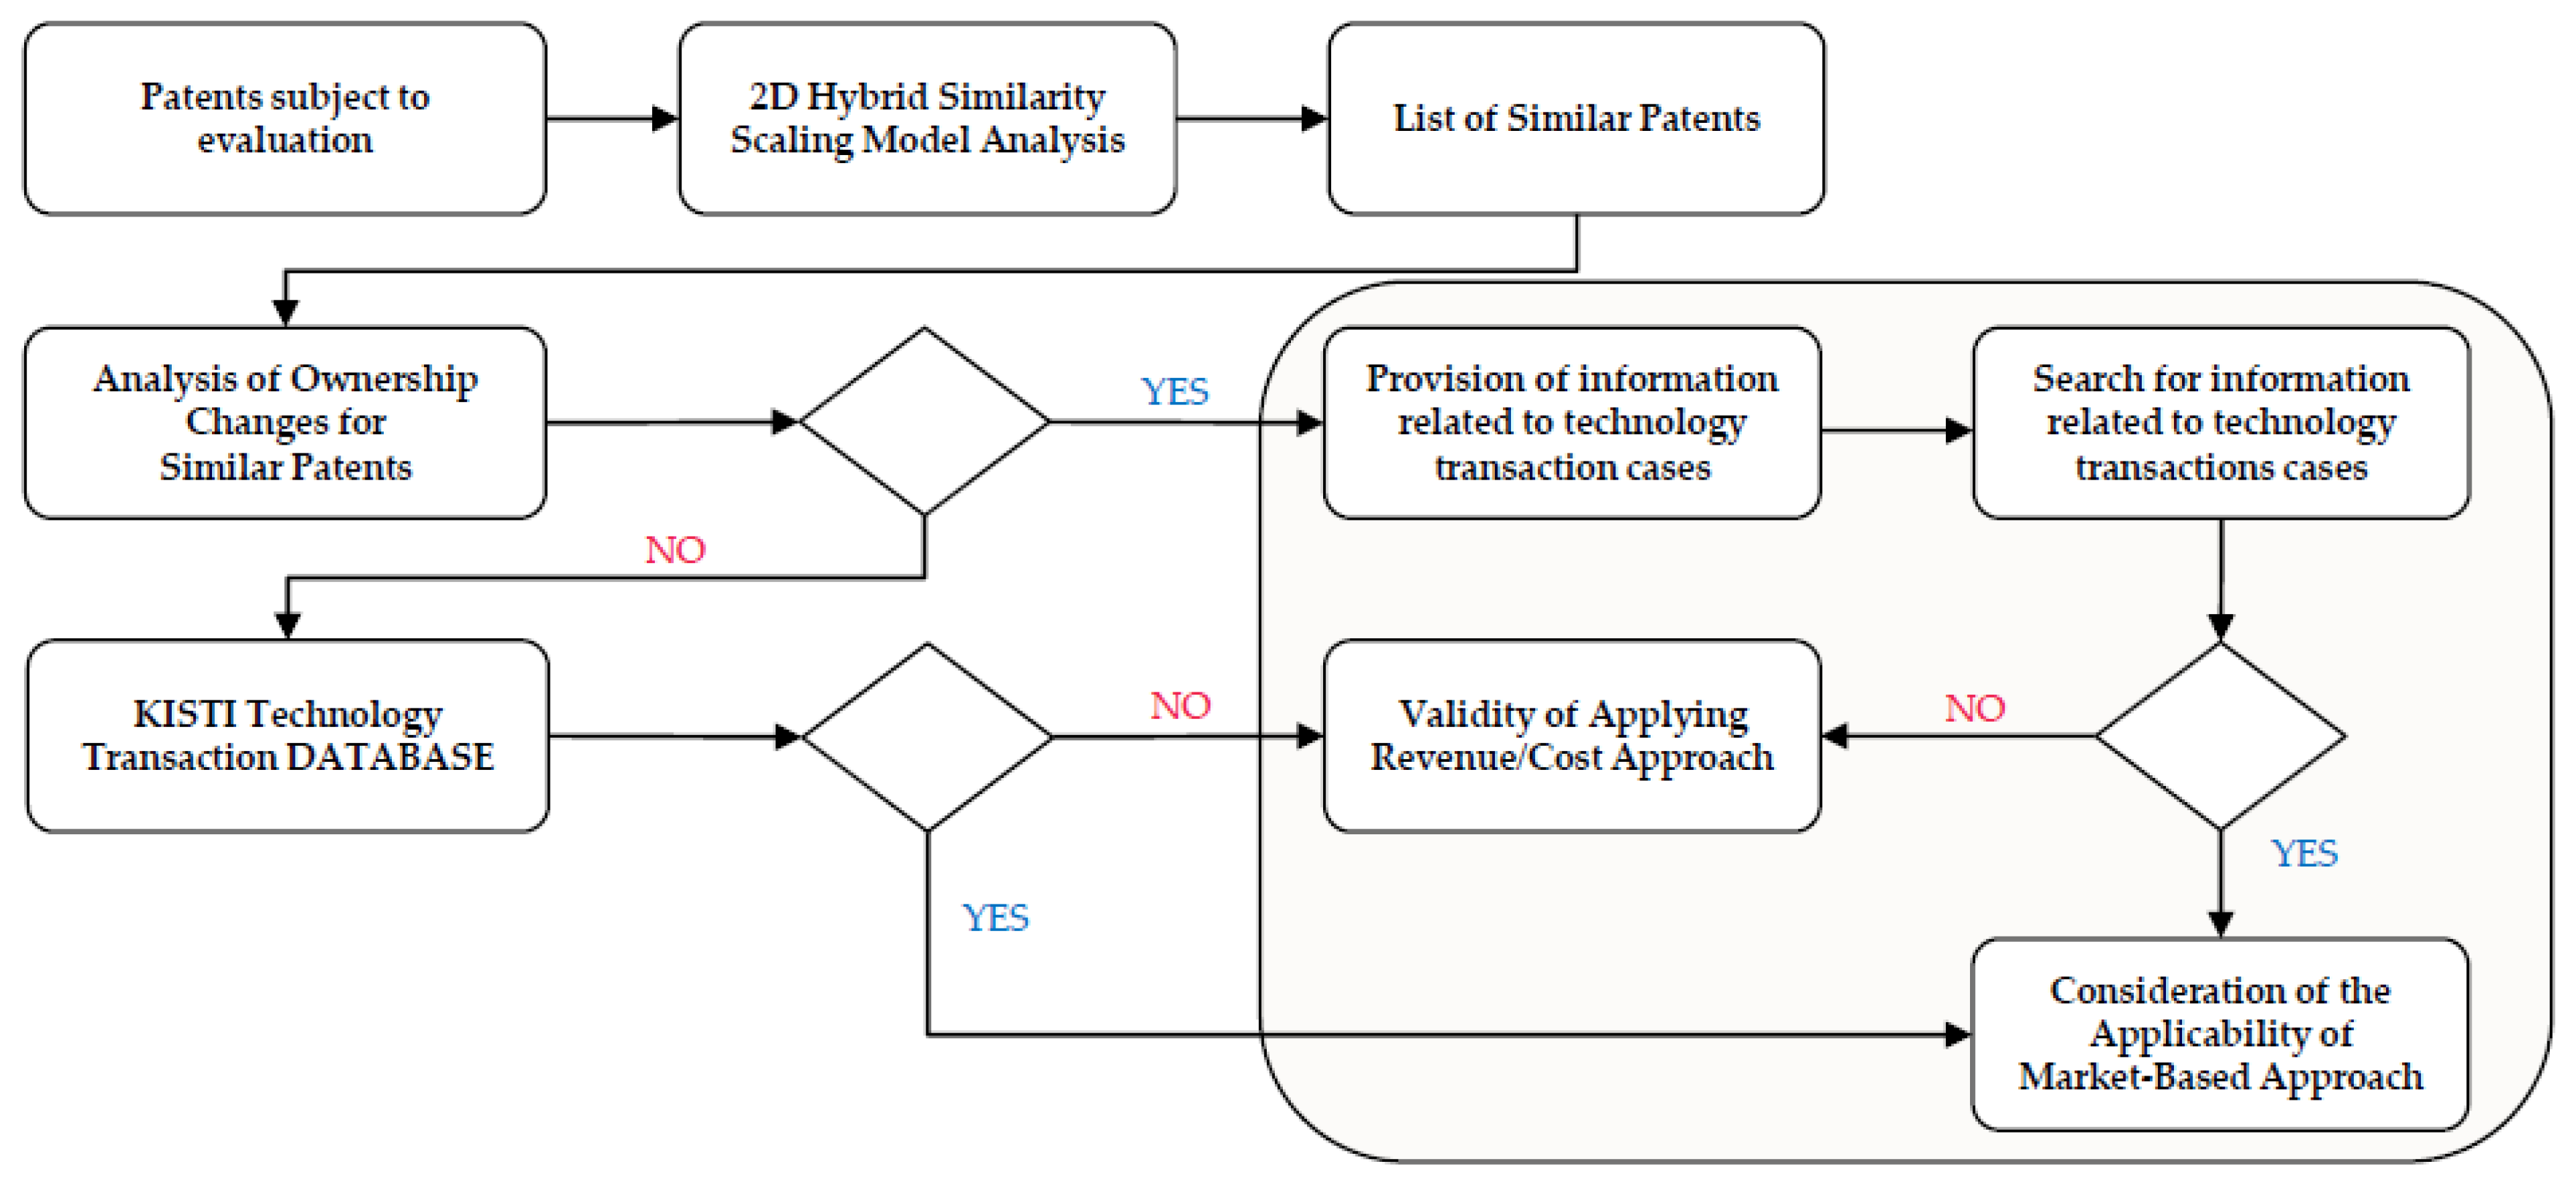
2.1. Market-Based Technology Valuation Method

Some studies have been conducted on technology valuation models using market-based approaches. Kang et al. [3] conducted a study that calculated the similarity between technologies using patent classification codes and keyword information. Kang et al. [1] developed a market replacement cost approach to evaluate the value of the technology being assessed based on the cost of similar projects extracted from keyword information. Lim et al. [4] developed a conceptual model to calculate the market value of a technology based on a technology transfer system that included technology, technology value, and market value. However, these studies are qualitative studies that do not evaluate the value of technology based on actual technology transaction cases.
To resolve this issue, some research employed the real-life technology transaction dataset [5,6]. As mentioned in the introduction, these studies cannot handle the multiple response variables because they employed a univariate regression analysis. In this study, we tackle this issue by proposing a new regression method that handles the running royalty rate dataset.

2.2. Identification of Key Influential Factors in Technology Valuation

Generally, studies on influential factors for technology and patent valuation can be classified into qualitative methods based on expert judgment and quantitative methods using regression analysis with actual cases. Qualitative methods include hierarchical analysis, the Delphi method, the expert opinion method, and sensory test [8]. Meng et al. [9] evaluated the factors influencing the adoption of precision pesticide technology in apple production areas in China using an expert opinion method. Park [10] compared the superiority and competitiveness of technologies using a hierarchical analysis, and Kim et al. [11] extracted the key factors influencing patent value using the Delphi method. Park and Wagh [12] proposed a method that uses intellectual property indices to apply the rating method. However, because these qualitative approaches are based on the subjective judgments of experts, they have limitations in terms of reliability owing to differences in expert opinions or the absence of objective evaluation criteria.
Quantitative methods that utilize statistical techniques based on actual technology transaction data are predominant in extracting the key influential factors. Sung et al. and Kim et al. [5,6] proposed a method for explaining the relationship between influential factors and technical fees and for selecting significant factors through linear regression analysis. Lee [13] performed a study that extracted and estimated the importance of influential factors related to technicality, ownership, and marketability through factor analysis, whereas Park [14] analyzed the differences in technical fees based on influential factors using ANOVA and t-tests. Reitzig [15] presented the factors influencing patent valuation using multivariate statistical techniques.
Research utilizing actual technology transaction data has mostly employed statistical methods to select key influential factors. However, these studies have limitations in evaluating the importance of the influential factors of technology value. To address this need, this study investigated methods for estimating the importance of independent variables using regression analysis and genetic algorithms.

2.3. Estimation of Relative Importance of Input Variables of Regression Model

The importance of the independent variables can be measured through regression analysis by decomposing the coefficient of determination. Azen and Budescu [16] proposed General Dominance Weights that decompose the coefficient of determination by using the repeated sequential sum of squares for a given input variable. Eriksson et al. [17] extracted the relative importance of input variables based on the loadings of the predictor and response variables calculated using Partial Least Squares on a given dataset. Johnson [18] decomposed the coefficient of determination of the model through principal component regression.
As mentioned previously, to apply the transaction case comparison method, it is necessary to secure case information comparable to the evaluated technology through the transactions of similar technologies. In this case, the similarity of cases must be high to ensure the accuracy of the evaluated technology’s value, and the k-nearest neighbor method is widely used for this purpose [19]. Burkhard [20] states that these similarity criteria significantly impact accurately evaluating the value of the evaluated technology.
The k-nearest neighbor (k-NN) method is generally criticized for having lower predictive performance than other artificial intelligence methods. However, predictive performance can be improved by weighing the importance of the input variables [21]. Therefore, the performance of the k-NN regression model is heavily influenced by the determination of the input variable weights. To build a reliable k-NN regression model, an accurate determination of the input variable weights is necessary [22].
In existing prediction models that use k-nearest neighbor regression, methods such as equal weighting, gradient descent, regression analysis, and the analytic hierarchy process (AHP) are used to estimate the weights of input variables. However, these methods have limitations in that they can cause mathematical errors when optimizing multiple input/output variables, or the weights can change based on the subjective judgments of experts. To overcome these limitations, various studies have utilized genetic algorithms, which are optimization methods used to solve optimization problems. Park et al. [23] used a genetic algorithm to estimate the attribute weights of an initial-stage construction cost prediction model using k-nearest neighbor regression, and Ji et al. [24] proposed a k-nearest neighbor method based on genetic algorithms. Chiu et al. [25] used genetic algorithms to select weights for input variables in the k-nearest neighbor method for customer relationship management in insurance companies. Shin and Han [26] applied genetic algorithms to select input variable weights for the k-nearest neighbor method for corporate bond evaluation. Based on these previous studies, this study combines k-nearest neighbor regression and genetic algorithms to estimate the importance of technology value-influential factors.

3. Analysis of the Importance of Technology Value Influential Factors Using Regression Analysis Based on k-Nearest Neighbor Method

This section proposes a method for analyzing the relationship between technology value-influencing factors and transaction prices based on the k-nearest neighbor regression model. We then evaluate the importance of technology value as an influential factor in transaction prices.

3.1. Estimating Running Royalty Using k-Nearest Neighbor Regression Analysis

The k-nearest neighbor regression estimates the dependent variable of the test data based on the dependent variable values of the most similar training data. In this study, the MkNN regression method was used to predict the value of the evaluated technology by utilizing the values of past transactions that were most similar to the evaluated technology. Previous studies have recognized this approach as significant [27].
The k-nearest neighbor method estimates the results for a new input based on the given input and output of the learning data. This method estimates the value of the evaluation target technology by using the value information of the k most similar transactions. The method for constructing the model is as follows:
In technology transactions using the running royalty method, the data have the characteristic of having a multivariate dependent variable. Table 1 provides a representative example of the technology transaction data. We assume that there are N mixed technology transaction datasets consisting of l technology value-influencing factors and d-dimensional royalties. While royalties consist of two dependent variables, prepaid and royalty rates, the independent variables are mixed-type data.
To reflect the characteristics of such data, we utilized an MkNN regression analysis model and applied Gower similarity suitable for mixed-type data to evaluate the similarity between technologies. Specifically, for the i -th training data and j -th test data vectors of the l-dimensional technology value impact factors (hereinafter referred to as variables) x i and x j , and the vectors of the technical fees y1 and y2, the Gower similarity is defined in Equation (1).
S i j = k = 1 P w k δ k , i , j k = 1 P w k
where S i j represents the Gower similarity between x i and x j , and w k is a weight representing the importance of the k -th variable k = 1 , , P . δ k , i , j is a function that represents the similarity between the two values of variable k , x i k and x j k , and takes a value of 0 or 1 if variable k is a nominal variable, and generally measures similarity by calculating the difference between variables if variable k is a continuous variable. In this case, variables with large differences from the other variables have small similarities, whereas variables with small differences have large similarities.
For example, the formula for calculating the value of δ k between two transaction cases i and j when the k -th variable is a continuous variable is defined as Equation (2).
δ k , i , j = x i , k x j , k r k
where w k represents the weight of the k -th variable, indicating its importance, and δ k , i and δ k , j represent the k -th variable value of the transaction d i and d j , respectively. r k is a parameter that indicates the range of variable k , and is generally set as the difference between the maximum and minimum values of the variable. If the k -th variable is nominal, x i , k and x j , k can be represented as 1 if they are the same and 0 if they are different, as shown in Equation (3).
δ k , i , j = 1 , x i k = x j k 0 , o t h e r w i s e
Thus, Gower similarity is a consistent similarity measurement method that can be applied to variables, whether categorical or continuous, by calculating the weighted average of the differences between variables for the training data ( d i ) and test data ( d j ).
However, there is a limitation in that it gives the same weight to each variable regardless of its importance, as it takes the average of variable-specific similarities. Therefore, in this study, we aim to develop a similarity measure that assigns relative weights to the Gower Similarity by assigning weights that minimize the difference between the upfront payments and royalty rate of the test technology and similar technologies, as shown in Equation (4).
Using Equation (1), the method for predicting the running royalty of the evaluated target technology by utilizing the importance of each influential factor in transaction case k is shown in Equation (4). where let j be the observation value of the evaluation target technology and y ^ j represents the predicted running royalty for the j -th evaluation target technology. First, the k transaction cases (i.e., N k j ), most being similar to the j -th evaluation target technology, were selected, and the similarity between the k transaction cases and the j -th evaluation target technology was calculated as S i j . The weighted sum of the calculated similarity for the running loyalty of learning data y i , multiplied by the weight is the predicted running loyalty for the evaluation target technology.
y j ^ = i N k j S i j y i

3.2. Problem Definition for Estimating Importance of Key Influential Factors

In the previous section, we obtained similar transaction data through MkNN regression analysis using a similarity calculation method suitable for mixed-type data. However, because the same weight was used regardless of the importance of each influential factor during the similarity calculation process, it is necessary to identify the key influential factors and estimate the optimal weight for each factor to minimize the difference between the running loyalty of the evaluated technology and that of similar technologies and to facilitate the interpretation of the results [28]. In addition, selecting the optimal value of k for a similar transaction is an important issue. However, because the value of k is estimated based on training data, there are no theoretical guidelines. In general, one of the multiple k values that minimize the misclassification rate is selected using cross-validation [29].
In this study, we utilize a hybrid tabu search algorithm, which modifies the chromosome representation method of the existing genetic algorithm, to simultaneously identify key influential factors, estimate weights of each key factor, and determine the optimal number of similar cases k to consider [30].
The existing approach uses a genetic algorithm suitable for k-nearest neighbor classification models, whereas this study proposes a new objective function suitable for MkNN regression models by extending the existing approach.
The objective function used in the MkNN regression model was proposed to select key influential factors, estimate the weights for each influential factor, and use the k-nearest neighbor for the test data to minimize the root mean squared error (RMSE). The optimization function is defined in Equation (5).
M i n x , w , k O b j x , w , k = RMSE w + α · P e n a l t y w , RMSE w = 1 2 n i = 1 n y 1 i y ^ 1 i x , w , k 2 + y 2 i y ^ 2 i x , w , k 2 , P e n a l t y w = i = 1 k 1 w 2 · w i 2 .
where RMSE w is a measure of model accuracy in an MkNN regression model with two available royalties using the running royalty method as the dependent variable. It is calculated by selecting the key influential factors, estimating the weights for each factor, and choosing the k-nearest transaction cases to minimize the RMSE.
The P e n a l t y w function is used to limit the number of selected key influential factors and is defined as the sum of the squares of each weight vector w i normalized by the L 2 norm of w , as shown in Equation (5). where k represents the number of selected key influencing factors. This represents the efficiency of simplifying the model by using the minimum number of key influential factors. The adjustment coefficient α is a hyperparameter that controls the impact of P e n a l t y w and plays an important role in preventing overfitting and improving generalization performance by controlling the complexity of the model [31]. In this experiment, the adjustment coefficient was fixed at 0.01 through preliminary experiments but can be adjusted as needed.

3.3. Estimation of Key Influential Factor Importance

In this section, we examine the procedure for estimating the weights of key influential factors using a genetic algorithm that incorporates the objective function of Equation (5) and Algorithm 1.
In this experiment, the chromosomes used were composed of an encoding solution for the hybrid tabu search algorithm; as shown in Figure 3, the total length of the chromosome was twice the initial number of key influential factors plus one 2 l + 1 . First, to select key influential factors, a binary encoding method was used with a total of l bits of 0 or 1 in the chromosome ( x 1 to x i ). Each bit of the binary-encoded chromosome with a value of one represents a selected key influential factor, whereas a value of zero represents an unselected factor. Second, a real encoding method was used for the key influential factor weights in the chromosome ( w 1 to w l ), which contained a column of real values ranging from 1.0 to 10.0. The total l real values represent the weight of each corresponding variable, with only the weights of the selected variables used in the variable selection chromosome. Third, for the part of the chromosome used to determine the optimal k value, values of 3, 5, 7, 9, and 11 were selected. In classification problems, any odd number can be selected as a possible k value; however, because this study deals with multivariate regression problems and proposes a new methodology, a value less than or equal to 11 was used. However, the range of k values can be adjusted as required.
Prior to generating the initial solution, all the influential factors were normalized to the range [1.0, 10.0], as shown in Equation (6), to prevent bias.
x i , j = x i , j m i n k = 1 , , N x k , j m a x k = 1 , , N x k , j m i n k = 1 , , N x k , j
where x i , j represents the normalized value of the j -th influential factor for the i -th transaction.
A binary integer representing the initial number of influential factors ( l ) was generated using a random number generator. Similarly, l random numbers are generated in the range of 1.0 to 10.0 to create initial weights for each influential factor. The initial value for transaction case k is set using random initialization. This process was repeated N times to generate the initial population P 0 composed of 2 l + 1 · N solutions. The generated initial solutions are structured as shown in Figure 4.
Reproduction is the process of selecting superior solutions based on the objective function value among solutions within the current generation (population) and preserving them for the next generation. The fit of each solution was calculated using Equation (7):
g t = 1 n i = 1 n f i t , f i ( t ) = ( y 1 i y ^ 1 i t ( x , w , k ) ) 2 + ( y 2 i y ^ 2 i t x , w , k ) 2 + α · P e n a l t y w .
where g t is the sum of the fitness values of all solutions within the current population at time t . In this study, the fitness function was defined based on Equation (5), which reflects the characteristics of the solution. Therefore, g t measures how well the solutions within the initial population minimize the difference between the transaction price of the evaluation target technology and that of similar transactions. The roulette-wheel selection method was then used to select solutions with high fitness.
The roulette-wheel selection method sets higher probabilities for solutions with higher fitness to select high-fitness solutions while maintaining diversity among the solutions. The selection probability of each solution was calculated using Equation (8):
P ( X = s i t ) = f i t g t , 1 i N
where s i ( t ) represents the matrix that denotes the composition of the i -th solution within the initial population, and P ( X = s i ( t ) ) indicates the probability of selecting the i -th solution at the current time t . This probability is calculated as the ratio of the fitness f i ( t ) of the solution to the sum of the fitness values of all the solutions in the initial population g t . Based on these selection probabilities, good solutions are selected and preserved for the next generation, and this process is used to generate an initial population for the next generation.
In this study, a one-point crossover method was used to generate new offspring from randomly selected pairs of parent chromosomes from selected solutions. The one-point crossover method cuts parent chromosomes at one point and exchanges the cut parts to create two offspring. This crossover operation plays an important role in generating new solutions and maintaining diversity.
First, a pair of parent solutions were randomly selected from the initial population. Subsequently, the probability of crossover (crossover rate) P c was used to determine whether a crossover occurred. A random number r 0,1 is generated, and if r P c , a crossover is performed, and if r > P c , the selected parent pair remains as offspring. Then, a crossover point c 1 , l 1 is randomly selected, and genes between c + 1 , l are exchanged to generate two offspring, where l denotes the number of variables in the initial population. This process was repeated until the temporary population P ~ t + 1 at time t + 1 was filled with N solution. In addition, to select trading case k , if the selected parent pair has different k values, genes are exchanged, and if the k values are the same, the parent’s genes are inherited. Using this method, the key influential factors, their weights, and solutions for trading case k are crossed, and the generated offspring are added to the temporary population P ~ t + 1 .
During the evolutionary process, the reproductive and crossover operators strengthen the population, causing solutions to become more similar to each other. If this phenomenon occurs early in the generation, it can lead to a lack of diversity in solutions, resulting in suboptimal or locally optimal solutions. To prevent this, a mutation operator is used to prevent certain components of all solutions from being fixed and to expand the search area. In this study, a widely used standard mutation (simple mutation) was used as follows.
First, a gene was sequentially selected from each chromosome of the temporary population P ~ t + 1 . Then, based on the mutation rate P m , the occurrence of mutations in the selected gene was determined based on the mutation rate Pm. To do this, a random number r 0,1 is generated, and if r P m , a mutation occurs. If the selected gene was 1’, it was flipped to ‘0, and if it was ‘0, it was flipped to ‘1’. However, when r > P m , no gene reversal occurred. If the chromosomal gene is a float, when a mutation occurs, it is replaced with a randomly selected float within a specified range. Finally, the selected genes were duplicated in the temporary population P t + 1 . This operation continues until all genes of all chromosomes have been checked, and the loop is repeated 2 l + 1 · N times. The P m · 2 l + 1 · N genes were randomly mutated in each generation, and this process generated a new temporary population, P t + 1 . This temporary population generation process is repeated until a predetermined maximum number of generations T is reached.
Algorithm 1. Short-term of the Proposed Methodology
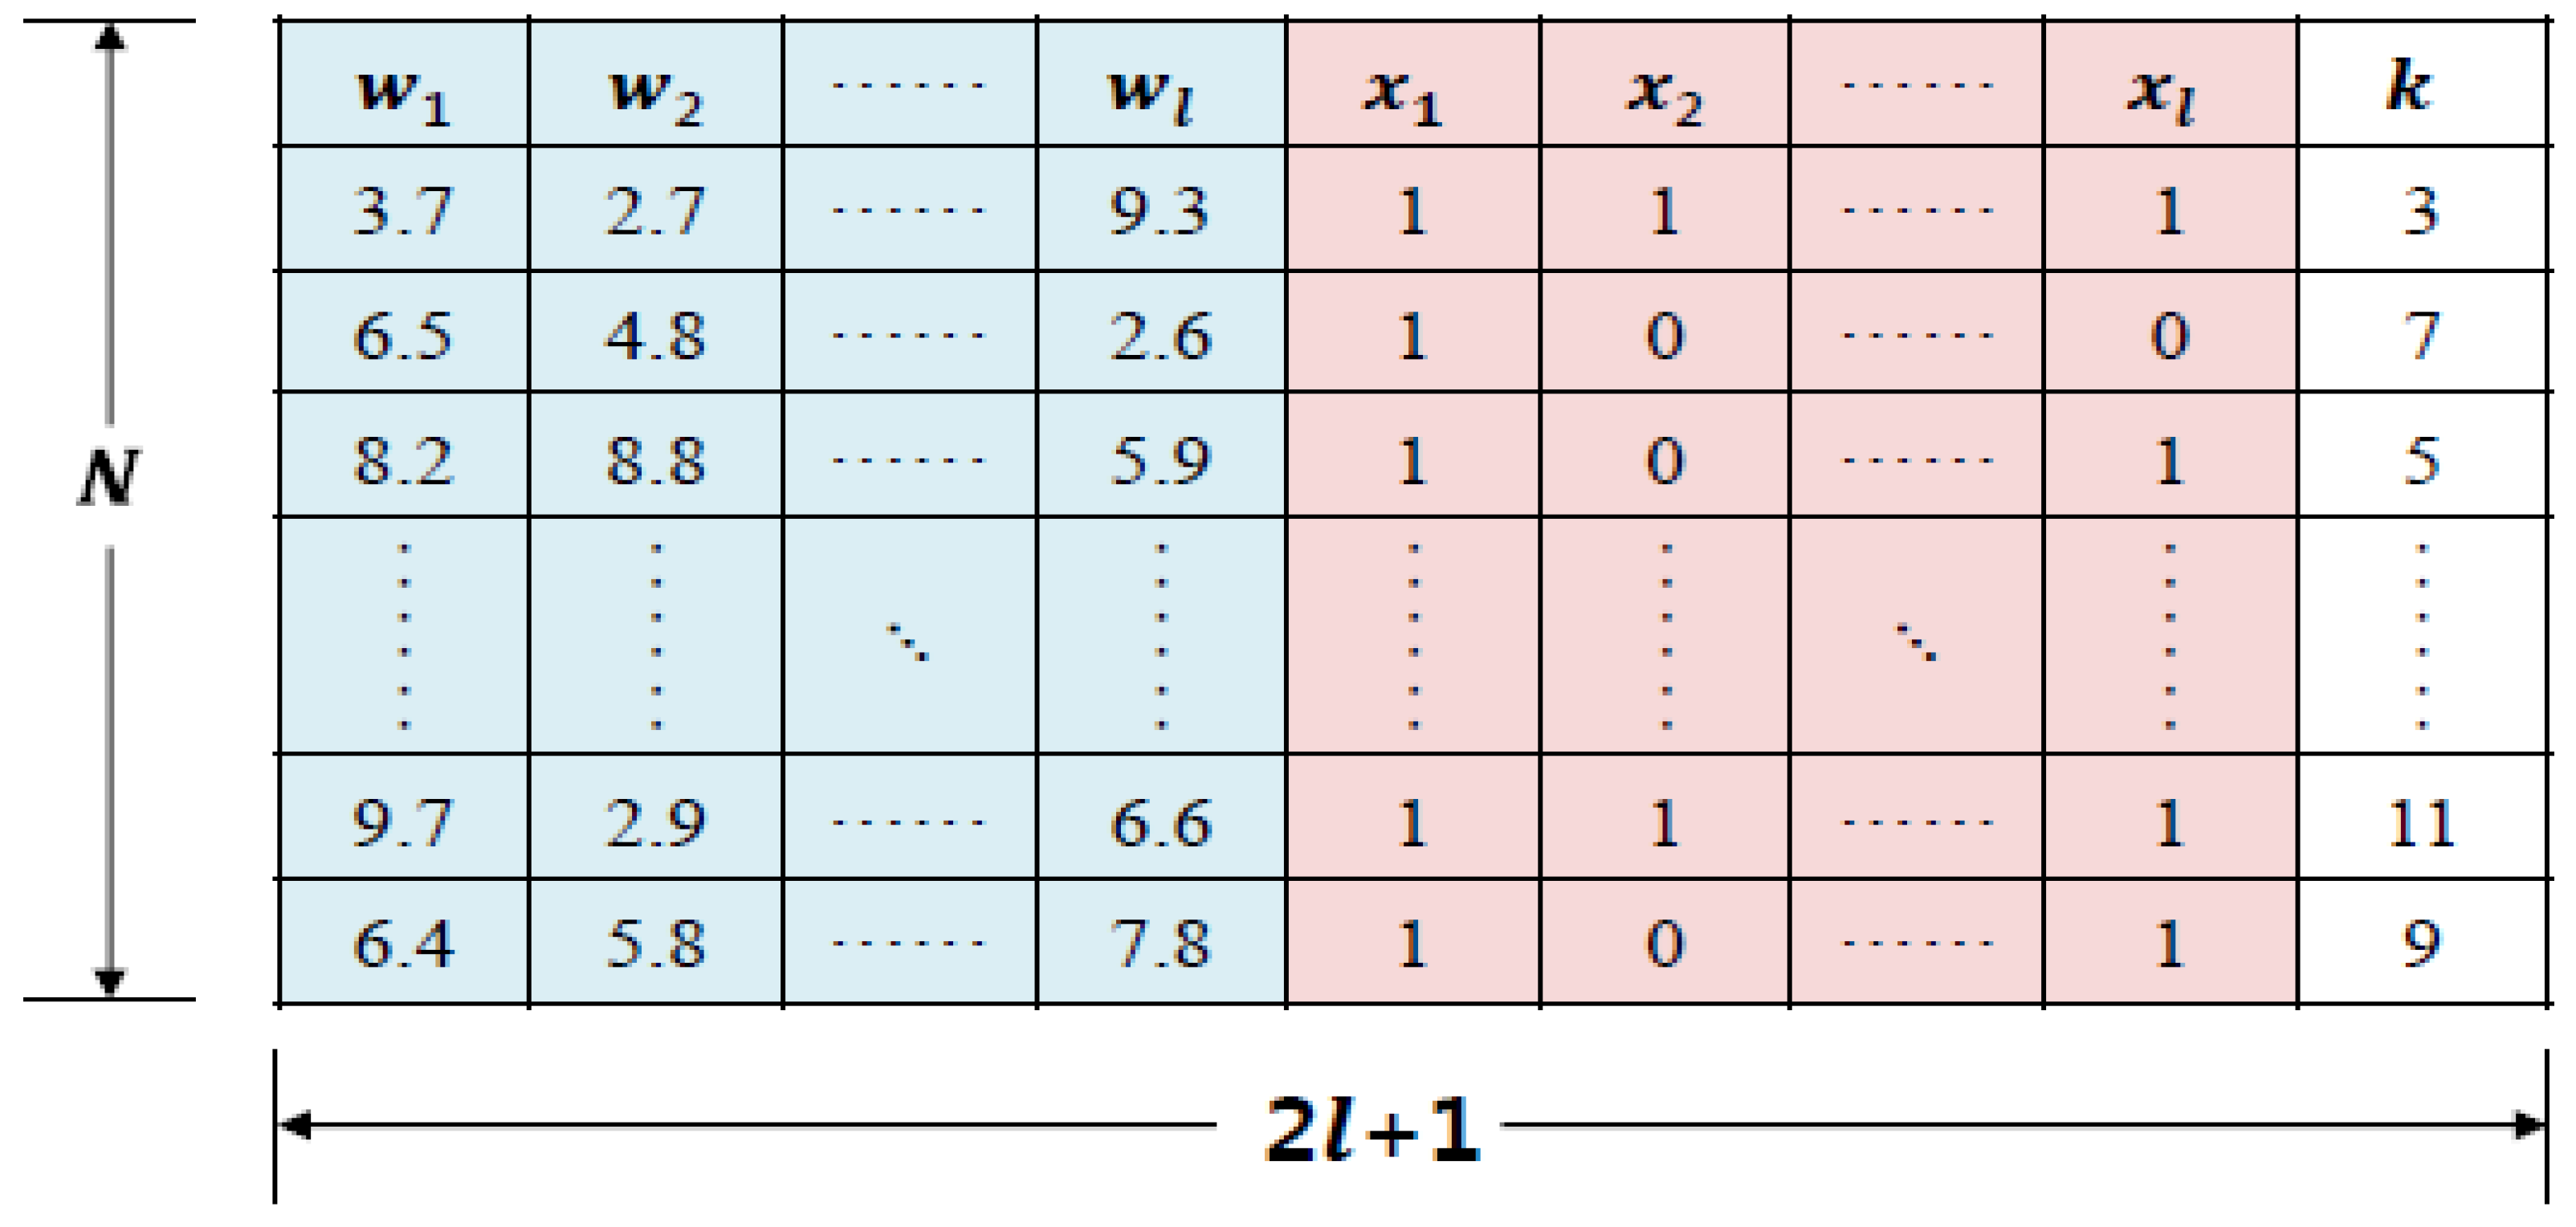
S :          Solution matrix
δ :          Gower Similarity(using Equations (2) and (3))
w k :       Weight for the k -th subset
N k j :   Neighboring outputs of the j -th output
y i :        Target value for the i -th input
y ^ j :        Predicted value for the j -th output
N :        Total number of samples
Begin
1.Initialize S and w .
2.Repeat until convergence criteria is met:
3.   for each output j in S  do:
4.     Compute y ^ j using Equation (4).
5.     for each input i in N k j  do:
6.         Compute δ k , i , j using Equation (1).
7.     End For
8.     Update S i j using Equation (1).
9.    End For
10.    Compute RMSE and Penalty using Equation (5).
11.    Compute the objective function O b j x , w , k using RMSE and P e n a l t y .
12.    Update w using a suitable optimization algorithm to minimize O b j x , w , k .
13.  End Repeat.
  End

4. Experiment

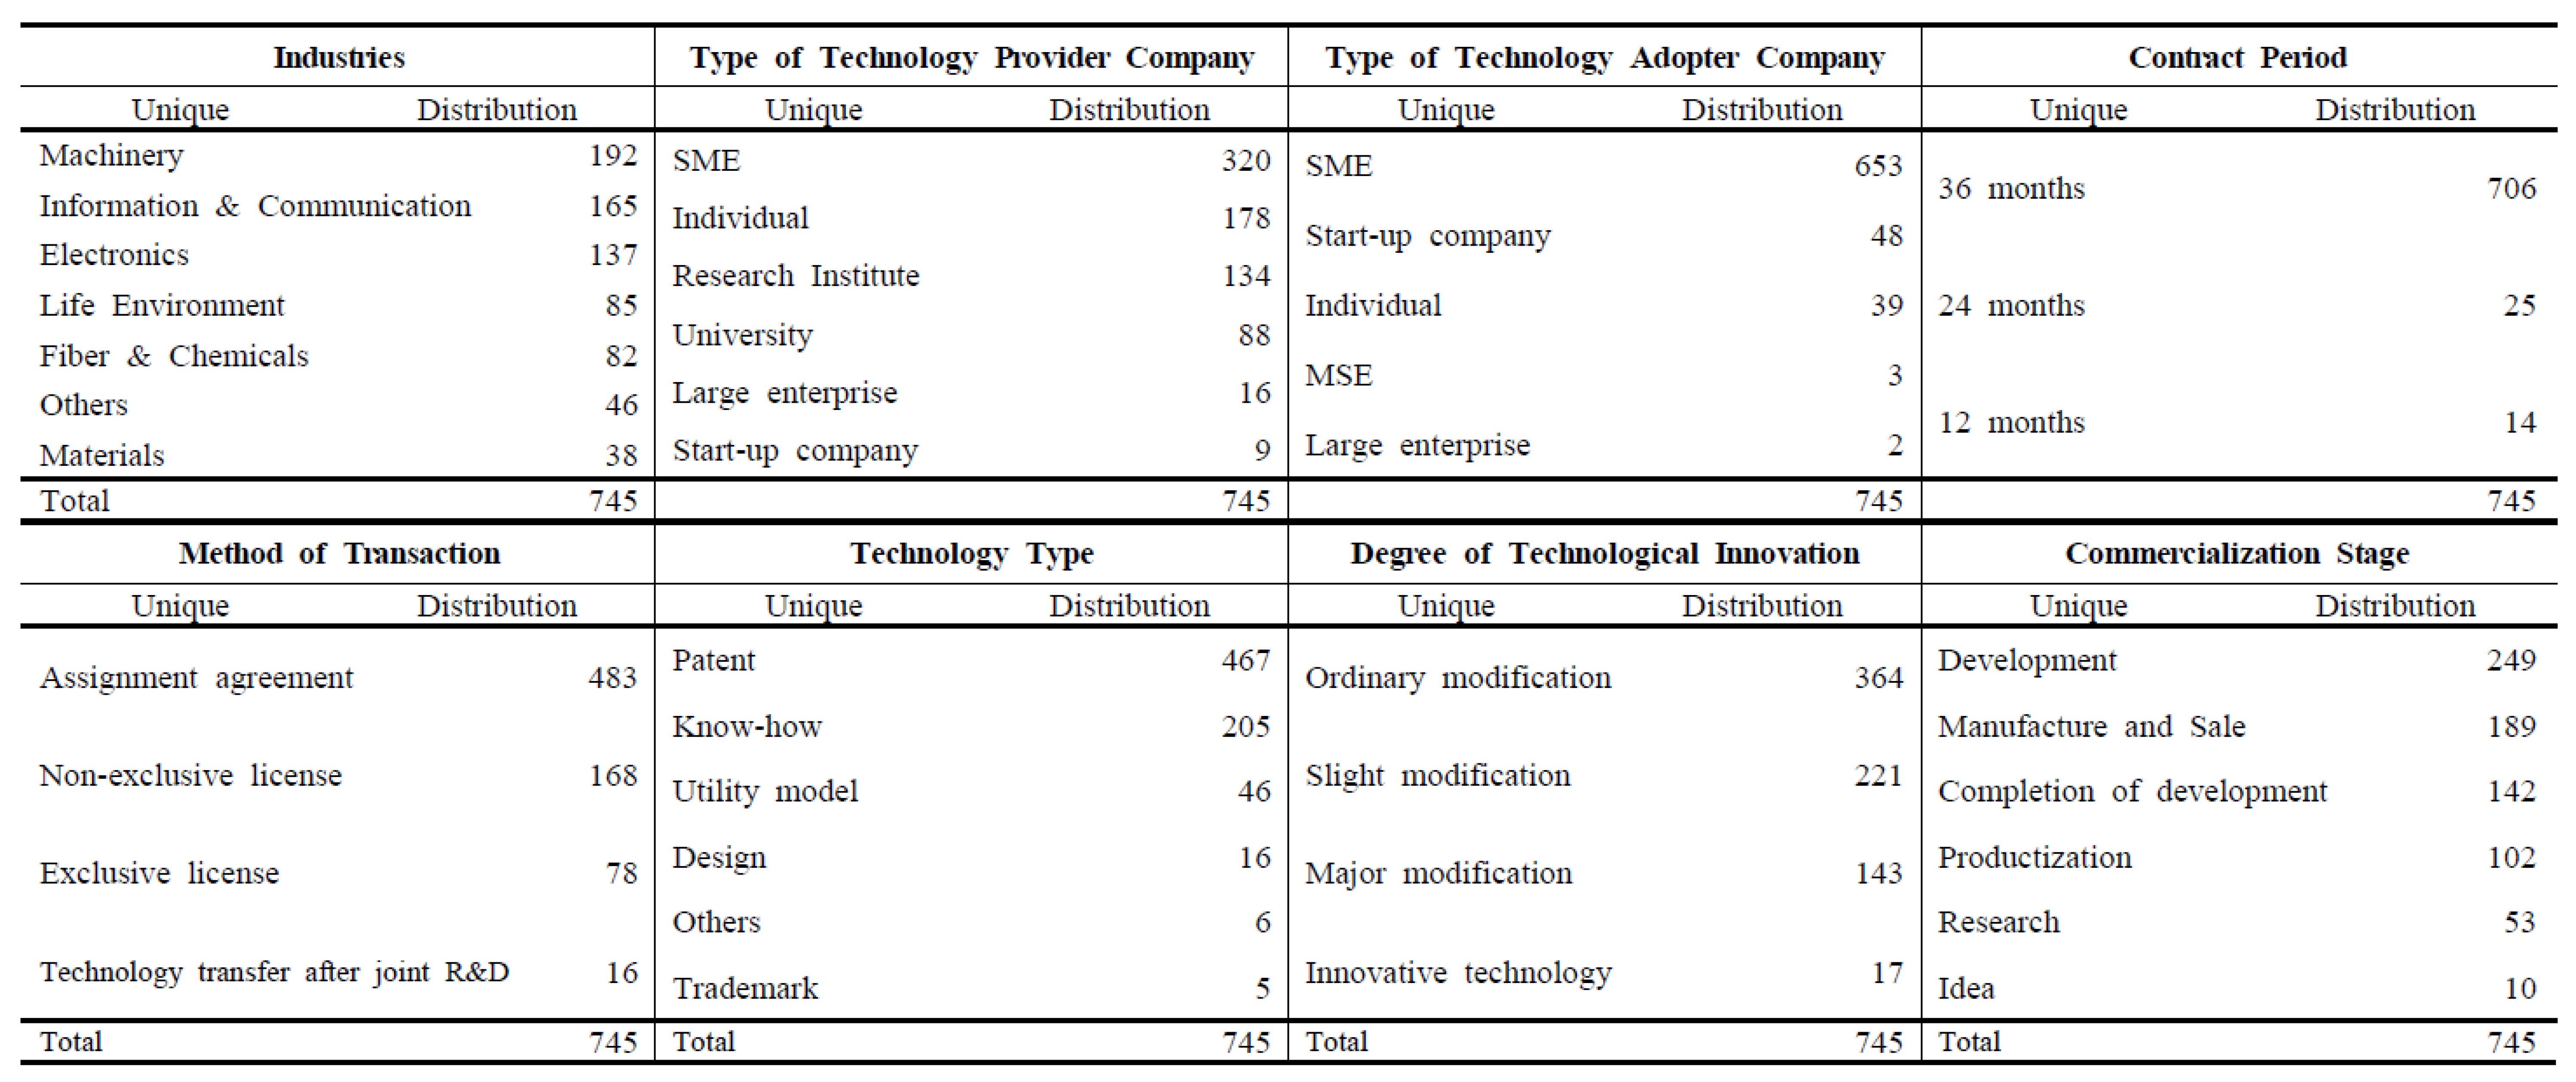
4.1. Data Description

Test text: this study utilizes actual transaction data from technology markets classified by industry. The data comprised 1516 cases, and data analysis was performed on 745 cases using the running loyalty method after removing missing values. Additionally, to complement the distribution difference between upfront payments and royalty rates, both variables were standardized for scaling. The specific technical factors and contents of the running royalties used in the data analysis are listed in Table 2.

4.2. Estimated Importance of Key Influential Factors

In this study, the proposed method is applied to actual transaction cases of the running royalty method in a technology market classified by industry to evaluate the contribution of technical value-influencing factors to prepaid fees and royalty rates. Prior to the importance analysis, the parameters of the MkNN regression model, such as the number of transaction cases k , selection of key influential factors, and weights of key influential factors, were optimized based on the RMSE value. When the RMSE value is minimized, the same transaction cases k and key influential factors are converged and selected. The weight of each key influential factor is calculated by averaging and then calculated as the relative weight of each key influential factor with respect to the overall key influential factors, as shown in Equation (9).
w i * = ( w i w j )
where w i * represents the average weight of the i -th key influential factor.
Table 3 presents the estimated significance of the key influential factors, their corresponding weights, and the outcomes of transaction case k. These results were derived using the proposed method for actual transaction cases under the running royalty method.
To verify the appropriateness of the results in Table 3, we examined the distribution of technical fees by the technology provider company type and contract period, which are key influencing factors. As shown in Figure 5, although the distribution of upfront payments is relatively larger for ‘Individual’ cases and that of royalty rate is relatively larger for ‘University’ cases, the difference is not significant. For the contract period, the effect of upfront payments is negligible as the contract period increases, whereas the royalty rate increases. This is presumed to be because longer contract periods offer more benefits from royalty programs [32,33,34].
Investigating the remaining factors of influence, it was determined that, aside from a few outliers, as depicted in Figure 6, there were no significant deviations in the distribution of running royalty. In the context of upfront payments, notable distributions were observed among ‘Large enterprise’ within the technology provider types, as well as ‘Innovative technology’ within the degree of technology innovation. This tendency is presumably attributed to the prevalent practice of ‘Large enterprise’ opting for upfront lump-sum payments and the ‘Innovative technology’ often adopting such payment models.
Similarly, concerning royalty rates, the ‘Trademark’ technology type exhibited a pronounced distribution. This phenomenon can be attributed to the inherent nature of ‘Trademark’ technologies, which frequently involve the payment of a fraction of ongoing sales as royalties. The comprehensive analysis presented above adds further depth to the insights gleaned from Table 3.

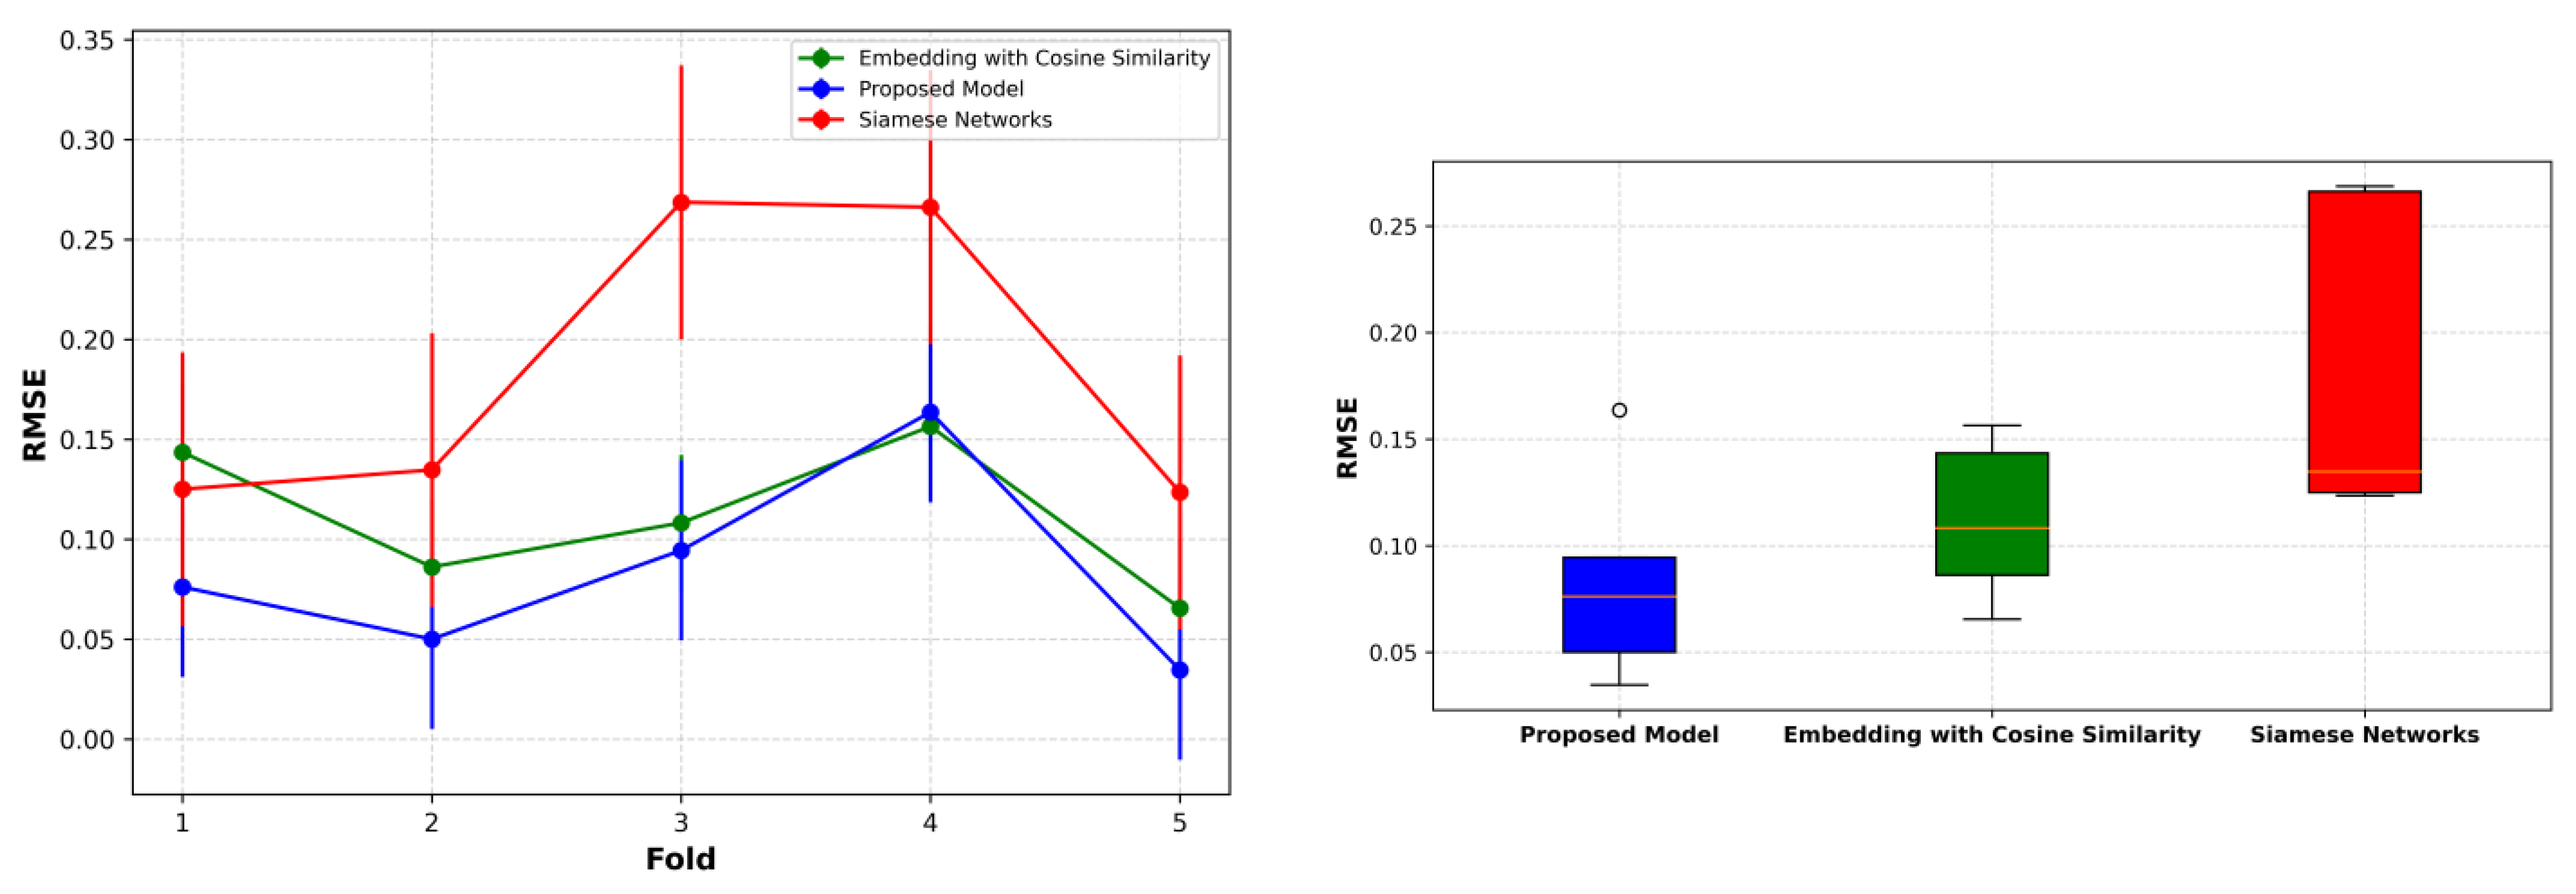
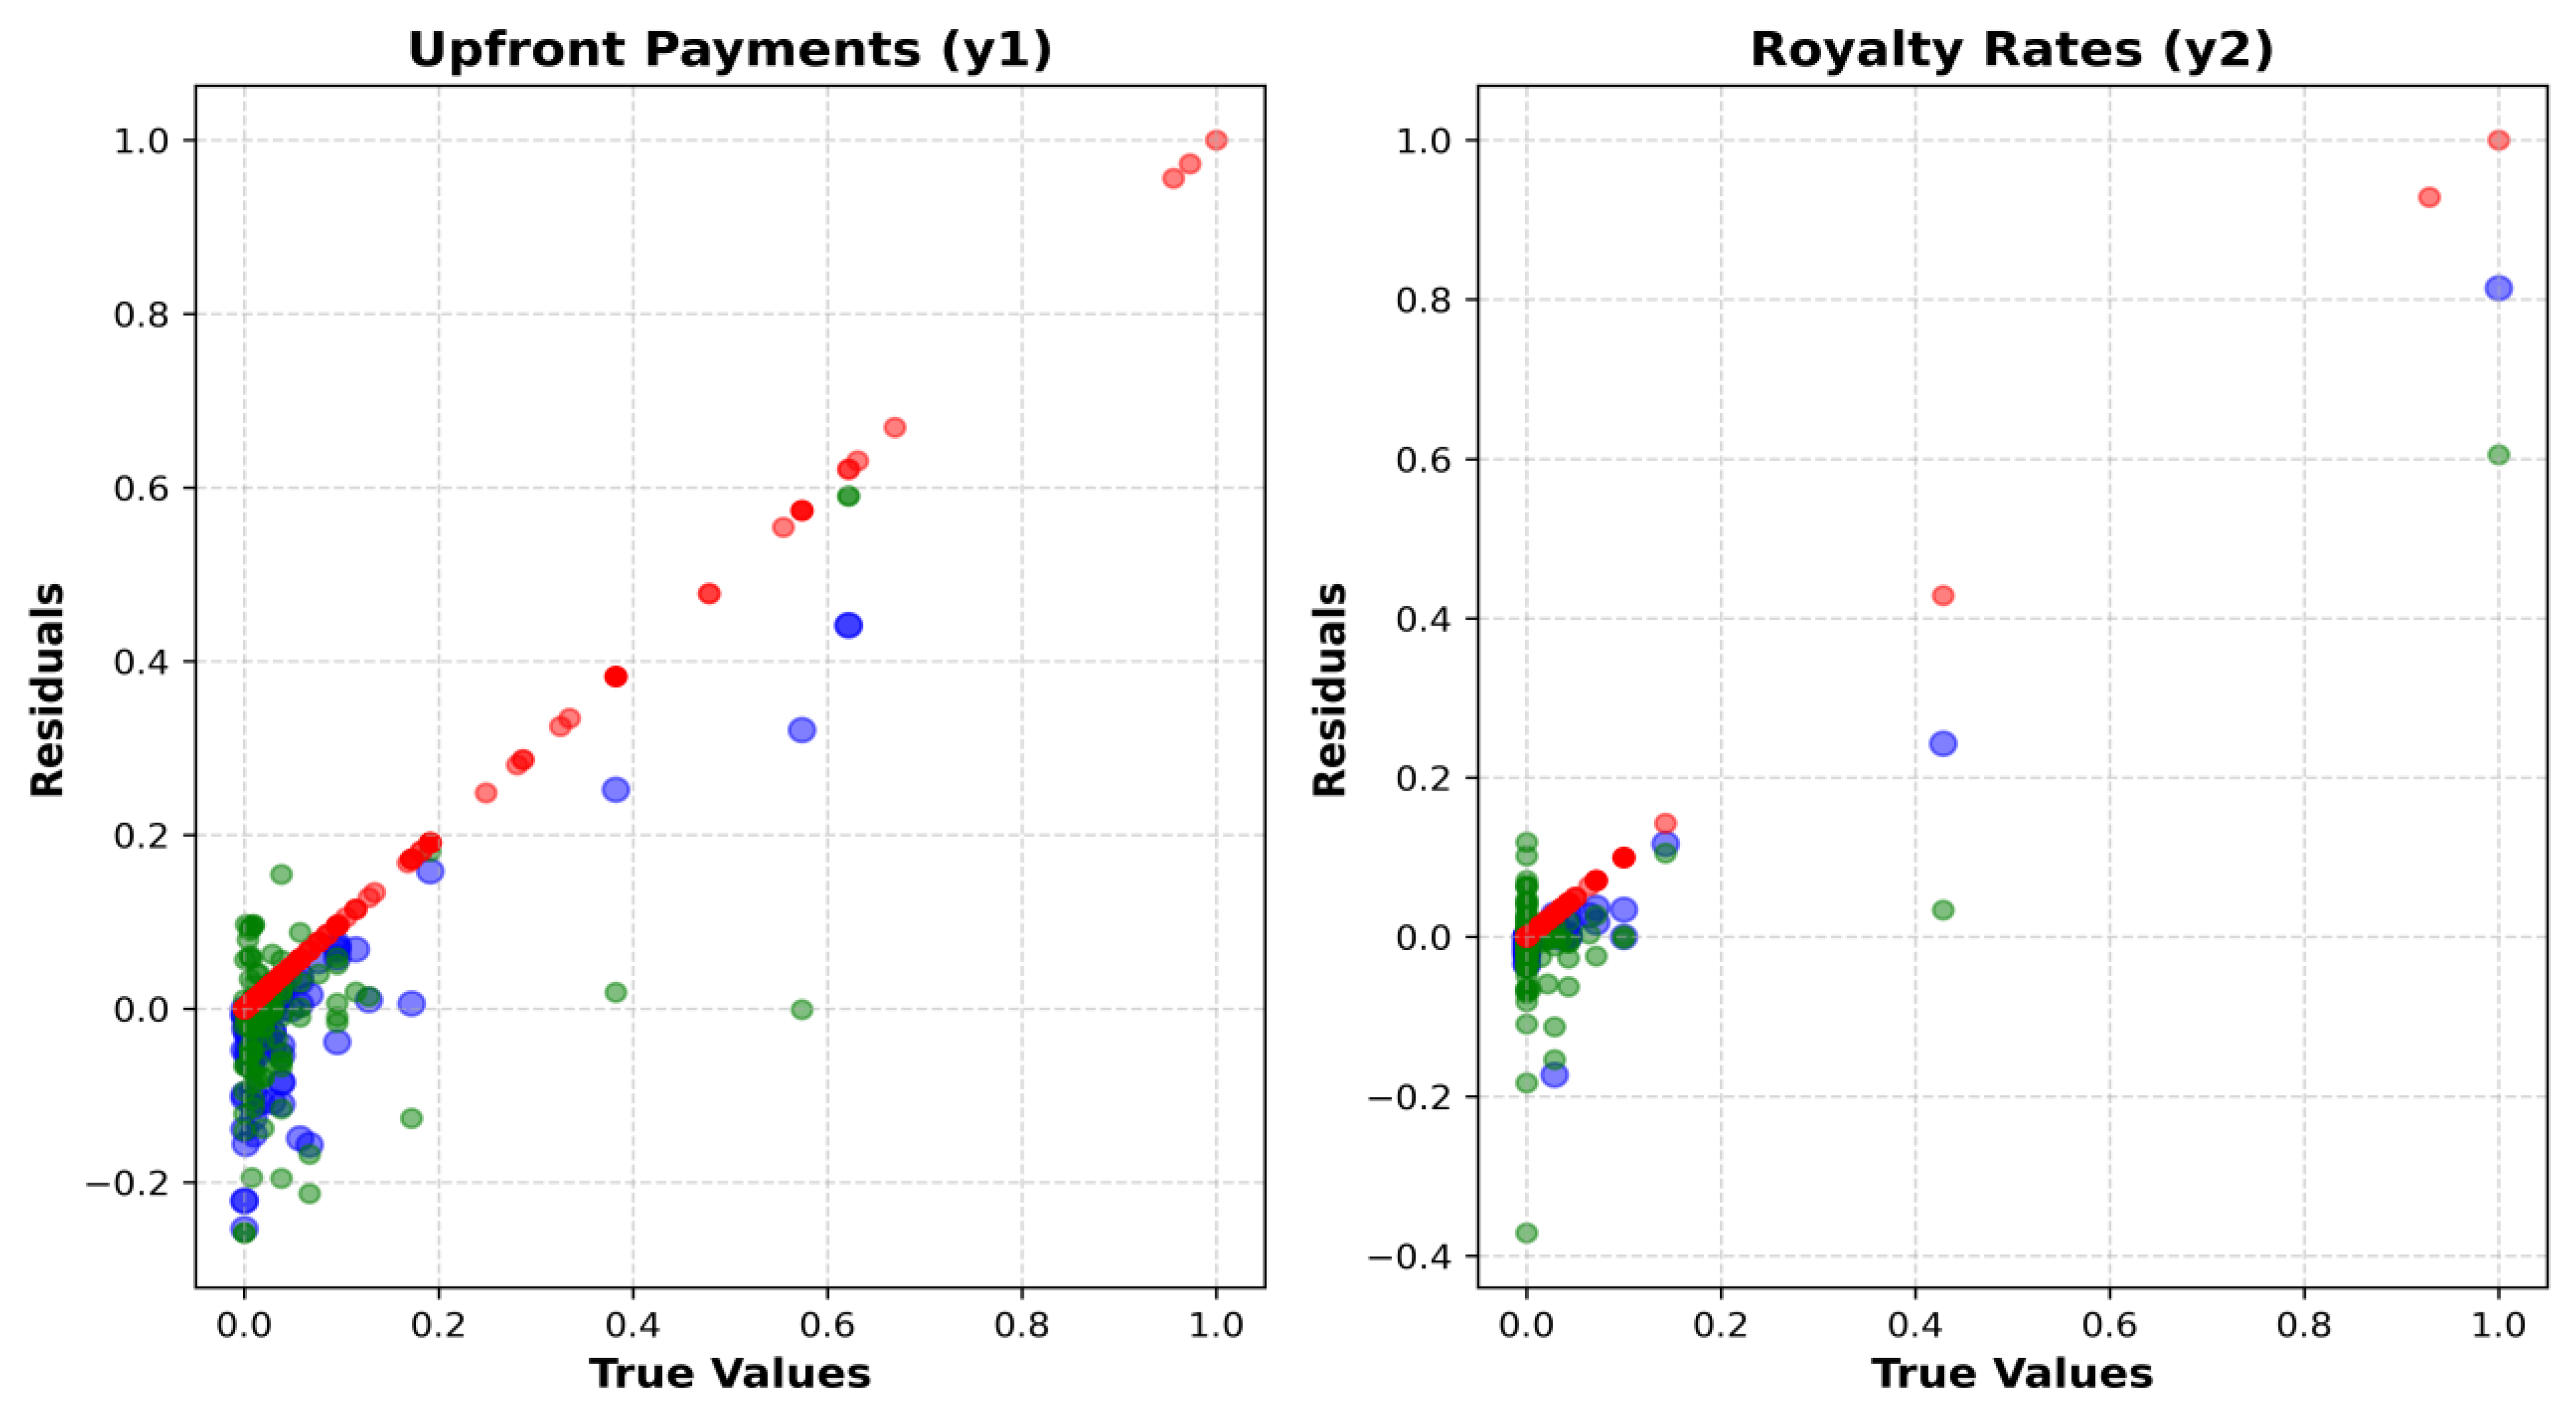
4.3. Benchmarking with State-of-the-Art Methods

In this section, to provide a more comprehensive assessment of our proposed methodology, we demonstrate, through benchmarking results of the Embedding with Cosine Similarity model and the Siamese Networks model, that the proposed method is well-suited for a market-based approach.
The approach involved utilizing embedding techniques to transform mixed-type input variables into a continuous vector space, thereby enhancing their compatibility with computational models. Specifically, the Embedding with Cosine Similarity model [35] was selected for this task. This selection was based on a tailored neural network architecture, as shown in Table 4, designed to generate informative embeddings from the diverse input variables.
The Siamese Network [36], designed to learn embeddings, focused on creating embeddings that capture inherent data patterns. This was achieved by minimizing the Euclidean distance between similar samples and simultaneously maximizing the distance between dissimilar ones, as outlined in Table 4.
In the first line graph of Figure 7, the X-axis corresponds to each fold in a five-fold cross-validation, while the Y-axis represents the RMSE performance indicators for each model. Through this visualization, we can discern performance differences and consistencies among the three models. The Boxplot graph allows us to examine the distribution of performance levels among the models. The final graph displays the residuals between predicted and actual technology royalties for each model. For both ‘upfront payments’ and ‘royalty rates’, as the residual graphs for each model scatter randomly within a specific range, we can consider the predictive accuracy of the models to be relatively higher. Table 5 quantitatively summarizes these findings.
A comprehensive view of the benchmarking results indicates that the proposed model is suitable for identifying faithful and analogous transaction cases, as required to execute a market-based approach, as depicted in Figure 1.
On the other hand, state-of-the-art methods can enhance predictive performance through fine-tuning hyperparameters. In this study, grid search was employed to measure the RMSE based on fine-tuning for each parameter within a certain range. The best hyperparameters were determined by identifying the ones that yielded the lowest RMSE. The results are presented in Table 6.
The comparison between fine-tuned state-of-the-art methods and the proposed model, using best-selected hyperparameters, is shown in Table 7 and Figure 8. State-of-the-art methods consistently improved predictive performance. Particularly, the Embedding with Cosine Similarity model outperformed the proposed methodology, with enhanced predictive ability and reduced deviation. Despite advancements, the performance gap between the proposed methodology and the latest approaches remains relatively small, as depicted in Figure 8’s boxplot. Thus, there is limited incentive to exclusively favor the latest techniques for acquiring a similar mixed-type dataset.
In addition, modern neural network-based approaches encounter challenges in identifying key influential factors, determining relative weights, and ensuring interpretability. These difficulties arise due to the complexities of feature space transformation, adaptive weight learning, and interpretability issues. Consequently, the proposed methodology, complemented by the MKNN model and genetic algorithms, contributes by addressing these challenges. It allows for the identification of key influential factors, derivation of relative weights, and simultaneous determination of transaction case k .
Table 8 presents the prediction outcomes of the running royalty using the Proposed Method’s Reduced Model, which is constructed using the two identified key influential factors, as well as the Weighted Model that incorporates relative weights within the Reduced Model. When predicting technical fees based on transaction cases, gaining insights into which factors are important and their relative significance can enhance prediction performance, as demonstrated in Table 8. Furthermore, Table 9 showcases the results of a statistical hypothesis test, specifically a t-test at a significance level of 0.05, to determine the significance of the observed performance improvements. The analysis revealed a statistically significant improvement in performance.

4.4. Case Study

In this section, our objective is to demonstrate to the audience that the proposed methodology outperforms state-of-the-art methods across diverse industries, as evidenced by case study presentations. Figure 9 presents the variable distribution of the real-life dataset employed in this study. Due to the relatively small dataset size, which presented training challenges for both the proposed methodology and state-of-the-art methods, we directed our case study efforts towards subsets of the ‘industry’ variable, specifically, Machinery and Information and Communication.
Figure 10 and Table 10 illustrate the results of predicting technical fees in the ‘Machinery’ sector, while Figure 11 and Table 11 depict the results in the ‘Information & Communication’ sector, both representing various industries.
In both sectors, the performance of the proposed methodology appears promising. However, this is attributed to training on a small dataset, resulting in suboptimal performance for state-of-the-art methods due to underfitting. Nonetheless, as previously discussed, a robust model trained through fine-tuning is expected to yield improved outcomes. Nevertheless, in real industrial settings, technical transaction information is often confidential, making it challenging to acquire. For internationally recognized ‘market-based approach’ technology valuation based on a limited dataset, a more standardized methodology is essential. Thus, the proposed methodology in this study presents a comprehensive approach, with the importance of identifying key influencing factors varying based on industry and company data.

5. Conclusions

5.1. Discussion

The method and results proposed in this study are anticipated to be valuable for identifying key factors and evaluating their significance as weights for assessing the value of technology based on future technology transaction data.
However, the constrained quantity of technology transaction data and the factors analyzed in this study present challenges in ensuring the reliability of the outcomes. The nature of data may differ according to the company or industry, and such variations can impact the identification of key factors. It is important to note that the key influencing factors identified in this study are constrained by the foundation of prior technology transaction data, thus emphasizing the significance of interpreting the research findings within the context of the specific data attributes of individual companies or industries.
In addition, research should be conducted to develop comparison methods that can adjust for similarities applicable to market approaches and secure comparability in the field of intellectual property [37,38]. Therefore, it is anticipated that the proposed method will comply with global standards following the introduction of international standards and international accounting standards.

5.2. Contributions

The market approach evaluates the value of technology by referring to cases in which similar technologies have been traded before. In this study, we use prior technology transaction data to estimate the technology value based on the market approach and to identify influential factors to the estimated value. To this end, we adopt a multivariate k-nearest neighbor (MKNN) regression model to accommodate mixed-type input variables aiming at estimating multivariate technology values, selecting influencing factors, and the relative importance of the selected factors. In addition, we can optimize the number of transaction cases k in k-NN regression.
  • We propose a new technology valuation method that can be applicable when we have transaction datasets that have multiple responses, such as upfront payment and royalty rate.
  • We propose methods to evaluate the relative importance of influential factors to the multivariate response.
  • Also, the proposed method can identify the optimal number k of previous transaction cases to compare.
Upon conducting a comprehensive benchmarking analysis against state-of-the-art methods, we have validated the efficacy of our proposed methodology on a real-life dataset encompassing mixed data types. This thorough examination underscores the aptitude of our approach within the context of a market-based valuation.
This study proposes a reliable technology valuation method that complies with international standards from a practical standpoint, supports evaluators’ decision-making, and contributes to the improvement of evaluation quality. Additionally, from an academic standpoint, it is important to use a similarity calculation method suitable for mixed-type data and estimate the key influencing factors and their importance in the running royalty method. However, this study has limitations in that the number of transaction cases is very small, and more influencing factors are required to improve the accuracy of the predicted value. In future research, we plan to develop a more sophisticated and reliable technology valuation model that considers changes in the value of technology transaction prices over time by considering the time of occurrence of technology transactions and incorporating an adjustment procedure.

Author Contributions

Conceptualization, J.Y. and B.K.; methodology, J.Y. and B.K.; software, J.Y. and A.B.; validation, J.Y. and B.K.; formal analysis, J.Y. and B.K.; investigation, J.Y. and A.B.; resources, H.P. and J.L.; data curation, H.P., J.L. and B.K.; writing—original draft preparation, J.Y.; writing—review and editing, J.Y. and B.K.; visualization, J.Y.; supervision, B.K.; project administration, J.Y.; funding acquisition, B.K. All authors have read and agreed to the published version of the manuscript.

Funding

This paper was supported by Korea Institute for Advancement of Technology (KIAT) grant funded by the Korea Government (MOTIE) (P0008691, HRD Program for Industrial Innovation). This work was supported by the National Research Foundation of Korea (NRF) grant funded by the Korea government (MIST) (NRF-2022R1F1A1063273). The authors would like to thank the editor and reviewers for their valuable and constructive comments.

Data Availability Statement

Regarding the dataset, we regret to inform you that due to security reasons and upon the request of the data provider, we are unable to make it publicly available.

Conflicts of Interest

The authors declare no conflict of interest.

References

  1. Kang, P.; Geum, Y.J.; Park, H.W.; Kim, S.K.; Sung, T.E.; Lee, H.Y. A market substitution cost approach for technology valuation. J. Korean Inst. Ind. Eng. 2015, 41, 150–161. [Google Scholar]
  2. Kim, K.H.; Shim, W.; Kang, J.S.; Park, H.W.; Moon, Y.H. Analyzing the observation of technical transaction information for the application of market access approach. In Proceedings of the Korea Society for Technology Innovation Annual Conference, 2012; pp. 54–62. [Google Scholar]
  3. Kang, J.; Lee, H.J.; Moon, Y.H. Systematic monitoring of competitors’ patents using 2-dimensional hybrid similarity method. In Proceedings of the 2011 ACM Symposium on Research in Applied Computation, Miami, FL, USA, 2–5 November 2011; pp. 252–254. [Google Scholar]
  4. Lim, S.M.; Kim, S.K.; Park, H.W. A Study on a Conceptual Model for Technology Valuation Based on Market Approach. J. Korea Soc. Innov. Technol. Manag. 2015, 18, 204–231. [Google Scholar]
  5. Sung, T.E.; Kim, D.S.; Jang, J.M.; Park, H.W. An Empirical Analysis on Determinant Factors of Patent Valuation Technology Transaction Prices. J. Korea Soc. Innov. Technol. Manag. 2016, 19, 254–279. [Google Scholar]
  6. Kim, S.K.; Lee, H.; Park, H.W. Application of Market Approach Based on Technology Transfer Case Information. In Proceedings of the Korea Technology Innovation Society Conference, 2012; pp. 323–340. [Google Scholar]
  7. Gower, J.C. A general coefficient of similarity some of its properties. Biometrics 1971, 27, 857–871. [Google Scholar] [CrossRef]
  8. Kim, Y.G.; Park, S.T.; Lee, S.J. A Study On Valuation Factors of Patent. Soc. Digit. Policy Manag. 2009, 7, 63–70. [Google Scholar]
  9. Meng, Y.; Li, W.J.; Shan, J.; Jing, C.; Chang, Q.; Glyn, J.; Frewer, L.J. Precision pesticide technology adoption influencing factors among farmers: Evidence from apple producing regions in China. Integr. Agric. J. 2023, 22, 292–305. [Google Scholar]
  10. Park, S. Analysis of the Relative Importance of Patent Valuation Criteria for Product Categories. Ph.D. Thesis, Chungbuk National University, Cheongju-si, Republic of Korea, 2010. [Google Scholar]
  11. Kim, Y.G.; Park, S.T.; Lee, S.J. Selection of important factors for Patent Valuation using Delphi Method. Entrue J. Inf. Technol. 2010, 9, 7–17. [Google Scholar]
  12. Park, W.G.; Smita, W. Index of Patent Rights. In Economic Freedom of the World: 2002 Annual Report; 2002; pp. 33–43. Available online: https://www.fraserinstitute.org/research/economic-freedom-of-the-world-2002-annual-report (accessed on 20 August 2023).
  13. Lee, K. A Study on the Technology Value Evaluation Based on Patent Information. Master’s Thesis, Ajou University, Suwon, Republic of Korea, 2013. [Google Scholar]
  14. Park, H.W. An Empirical Study of Determinants of Technology Value in Korea. J. Korea Technol. Innov. Soc. 2005, 8, 623–649. [Google Scholar]
  15. Reitzig, M. What determines patent value? Insights from the semiconductor industry. Res. Policy 2003, 32, 13–26. [Google Scholar] [CrossRef]
  16. Azen, R.; Budescu, D.V. The dominance analysis approach for comparing predictors in multiple regression. Psychol. Methods 2003, 8, 129. [Google Scholar] [CrossRef]
  17. Eriksson, L.; Johansson, E.; Kettaneh-Wold, N.; Wold, S. Multi-and Megavariate Data Analysis; Umetrics Academy: Umeå, Sweden, 2001; p. 43. [Google Scholar]
  18. Johnson, J.W. A heuristic method for estimating the relative weight of predictor variables in multiple regression. Multivar. Behav. Res. 2000, 35, 1–19. [Google Scholar] [CrossRef] [PubMed]
  19. Chiu, C. A case-based customer classification approach for direct marketing. Expert Syst. Appl. 2002, 22, 163–168. [Google Scholar] [CrossRef]
  20. Burkhard, H.D. Similarity distance in case-based reasoning. Fundam. Inform. 2001, 47, 201–215. [Google Scholar]
  21. Roh, T.H.; Yoo, M.H.; Han, I.G. Integration rough set theory case-based reasoning for the corporate credit evaluation. J. Inf. Syst. 2005, 14, 41–65. [Google Scholar]
  22. Doğan, S.Z.; Arditi, D.; Murat Günaydin, H. Using decision trees for determining attribute weights in a case-based model of early cost prediction. J. Constr. Eng. Manag. 2008, 134, 146–152. [Google Scholar] [CrossRef]
  23. Park, M.; Sung, K.; Lee, H.; Ji, S.; Kim, S. Schematic Cost Estimation Method using Case-Based Reasoning: Focusing on Determining Attribute Weight. Korean J. Constr. Eng. Manag. 2010, 11, 22–31. [Google Scholar] [CrossRef]
  24. Ji, S.H.; Park, M.; Lee, H.S. Cost estimation model for building projects using case-based reasoning. Can. J. Civ. Eng. 2011, 38, 570–581. [Google Scholar] [CrossRef]
  25. Chiu, C.; Chang, P.C.; Chiu, N.H. A case-based expert support system for due-date assignment in a wafer fabrication factory. J. Intell. Manuf. 2003, 14, 287. [Google Scholar] [CrossRef]
  26. Shin, K.S.; Han, I. Case-based reasoning supported by genetic algorithms for corporate bond rating. Expert Syst. Appl. 1999, 16, 85–95. [Google Scholar] [CrossRef]
  27. Kuo, R.J.; Kuo, Y.P.; Chen, K.Y. Developing a diagnostic system through integration of fuzzy case-based reasoning fuzzy ant colony system. Expert Syst. Appl. 2005, 28, 783–797. [Google Scholar] [CrossRef]
  28. Hall, M.A. Correlation-based feature selection of discrete numeric class machine learning. In Proceedings of the Seventeenth International Conference on Machine Learning, San Francisco, CA, USA, 29 June–2 July 2000; pp. 359–366. [Google Scholar]
  29. Park, J.S.; Heo, K. Optimal k-Nearest Neighbor Classifier Using Genetic Algorithm. Commun. Stat. Appl. Methods (CSAM) 2010, 17, 17–27. [Google Scholar]
  30. Tahir, M.A.; Bouridane, A.; Kurugollu, F. Simultaneous feature selection feature weighting using Hybrid Tabu Search/k-nearest neighbor classifier. Pattern Recognit. Lett. 2007, 28, 438–446. [Google Scholar] [CrossRef]
  31. Punch, W.F., III; Goodman, E.D.; Pei, M.; Chia-Shun, L.; Hovl, P.D.; Enbody, R.J. Further Research on Feature Selection Classification Using Genetic Algorithms. In Proceedings of the International Conference on Genetic Algorithms (ICGA), San Francisco, CA, USA, 15–19 July 1993; pp. 557–564. [Google Scholar]
  32. Lee, Y.; Lee, C.-L. A Study on Antecedents Outcome Variables of Switching Costs: Focusing on the Moderating Effect of Service Contract Type. Mark. Res. 2005, 20, 1–28. [Google Scholar]
  33. Yoojae, L.; Cheongrim, L. Antecedents consequences of switching costs: The moderating role of service subscription types. Korean J. Mark. 2005, 20, 1–28. [Google Scholar]
  34. Lee, J.H.; Kim, E.; Sung, T.E.; Shin, K. Factors affecting pricing in patent licensing contracts in the biopharmaceutical industry. Sustainability 2018, 10, 3143. [Google Scholar] [CrossRef]
  35. Zhou, K.; Ethayarajh, K.; Card, D.; Jurafsky, D. Problems with cosine as a measure of embedding similarity for high frequency words. arXiv 2022, arXiv:2205.05092. [Google Scholar]
  36. Habibi, M.; Starlinger, J.; Leser, U. Tabsim: A siamese neural network for accurate estimation of table similarity. In Proceedings of the 2020 IEEE International Conference on Big Data (Big Data), Atlanta, GA, USA, 10–13 December 2020; pp. 930–937. [Google Scholar]
  37. Kim, M.S.; Lee, C.H.; Choi, J.H.; Jang, Y.J.; Lee, J.H.; Lee, J.; Sung, T.E. A study on intelligent technology valuation system: Introduction of kibo patent appraisal system ii. Sustainability 2021, 13, 12666. [Google Scholar] [CrossRef]
  38. Kim, B.; Gazzola, G.; Yang, J.; Lee, J.M.; Coh, B.Y.; Jeong, M.K.; Jeong, Y.S. Two-phase edge outlier detection method for technology opportunity discovery. Scientometrics 2017, 113, 1–16. [Google Scholar] [CrossRef]
Figure 1. Similar technology transaction information observation process for market approach suitability analysis method.
Systems 11 00439 g001
Figure 2. Procedure for estimating the importance of key influential factors in technology value for the application of transaction comparison method.
Systems 11 00439 g002
Figure 3. Configuration of the encoding solution for hybrid Tabu search.
Systems 11 00439 g003
Figure 4. Form of the initial solution.
Systems 11 00439 g004
Figure 5. Distribution of running royalty by key influencing factors.
Systems 11 00439 g005aSystems 11 00439 g005b
Figure 6. Distribution of running royalty by influencing factors.
Systems 11 00439 g006aSystems 11 00439 g006bSystems 11 00439 g006c
Figure 7. Benchmark results of proposed method and state-of-the-art methods.
Systems 11 00439 g007aSystems 11 00439 g007b
Figure 8. Benchmark results of proposed method and fine-tuned state-of-the-art methods.
Systems 11 00439 g008
Figure 9. Distribution of technology transaction cases by influential factors.
Systems 11 00439 g009
Figure 10. Technical fee prediction results in ‘Machinery’.
Systems 11 00439 g010
Figure 11. Technical fee prediction results in ‘Information & Communication’.
Systems 11 00439 g011
Table 1. Example of mixed type technology transaction data.
Variable SeparationVariable InitialsVariable Type
Technology
Influential
Factors
x1Categorical variable
x2Nominal variable
xlOrdinal variable
Technical Feey1Continuous variable
y2Continuous variable
Table 2. Influential factors and the running royalty.
Variable SeparationVariable InitialsVariable Type and Description
Technology
Influential Factors
IndustryNominal variables
(Machinery, Materials, Life Environment, Fiber and Chemicals, Electronics, Information and Communication, Others)
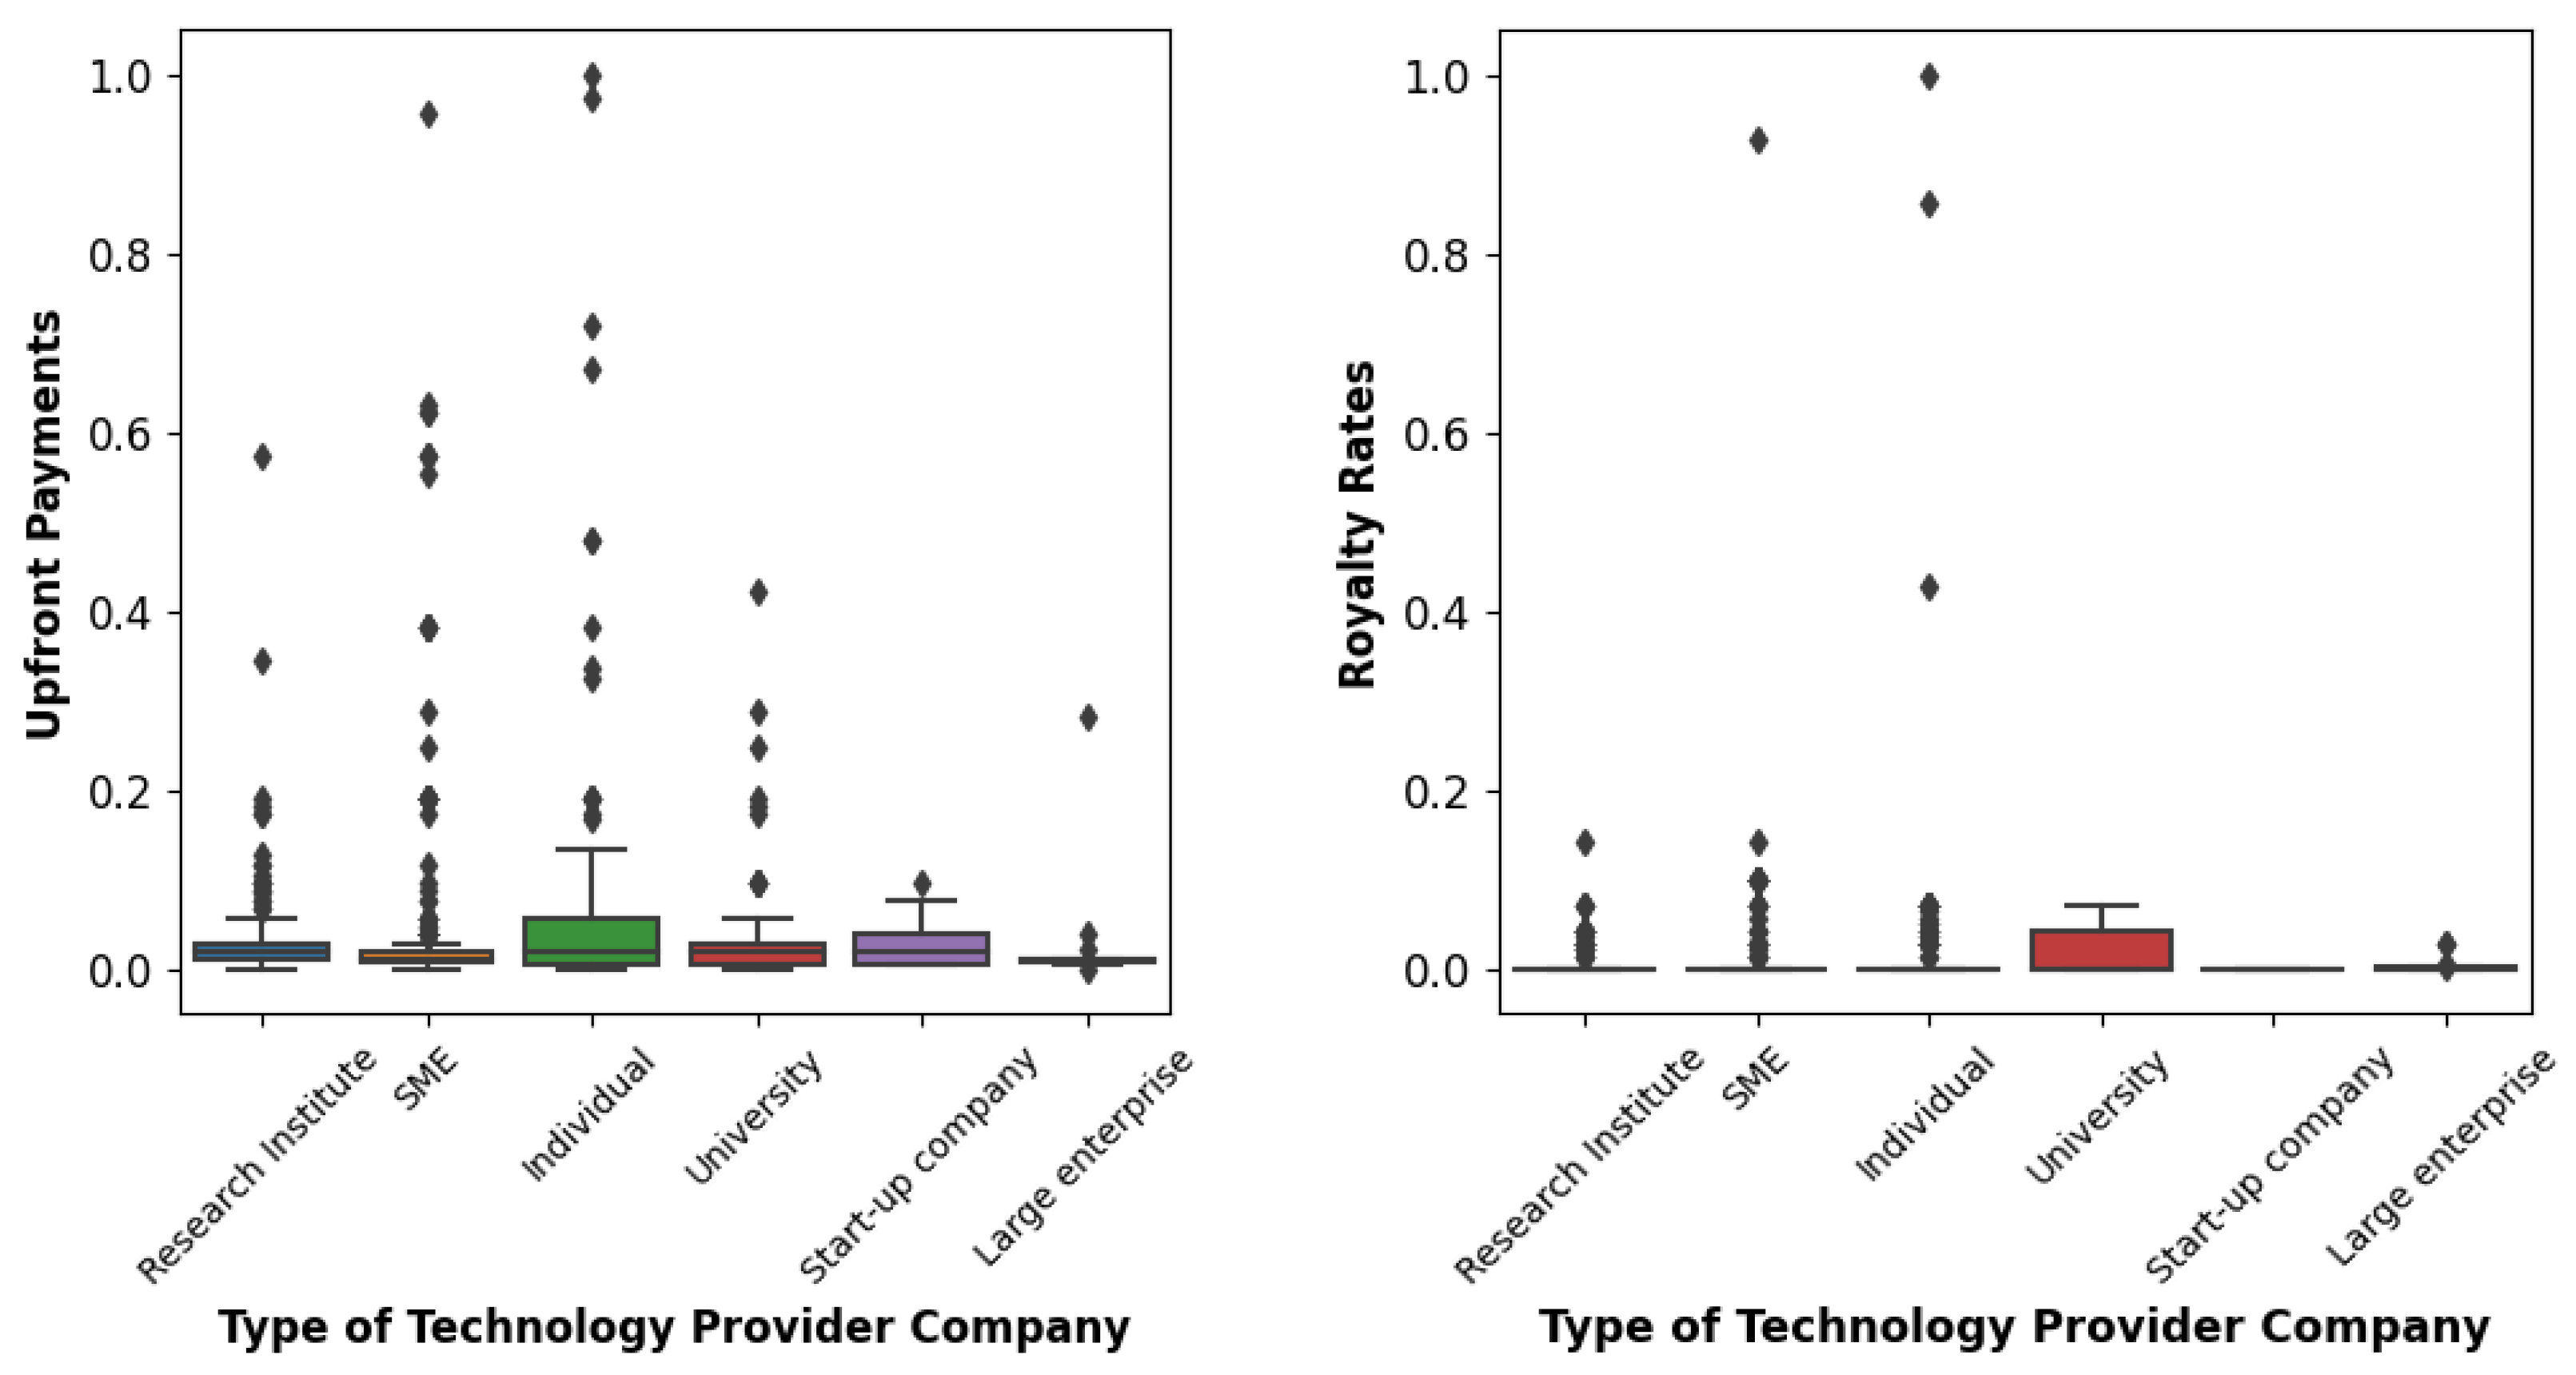
Type of Technology Provider CompanyNominal variables
(Large enterprise, University, Small and Medium-sized Enterprises (SME), Start-up company, Research Institute, Individual)
Type of Technology Adopter CompanyNominal variables
(Individual, Start-up company, SME,
Medium-sized enterprise (MSE), Large enterprise)
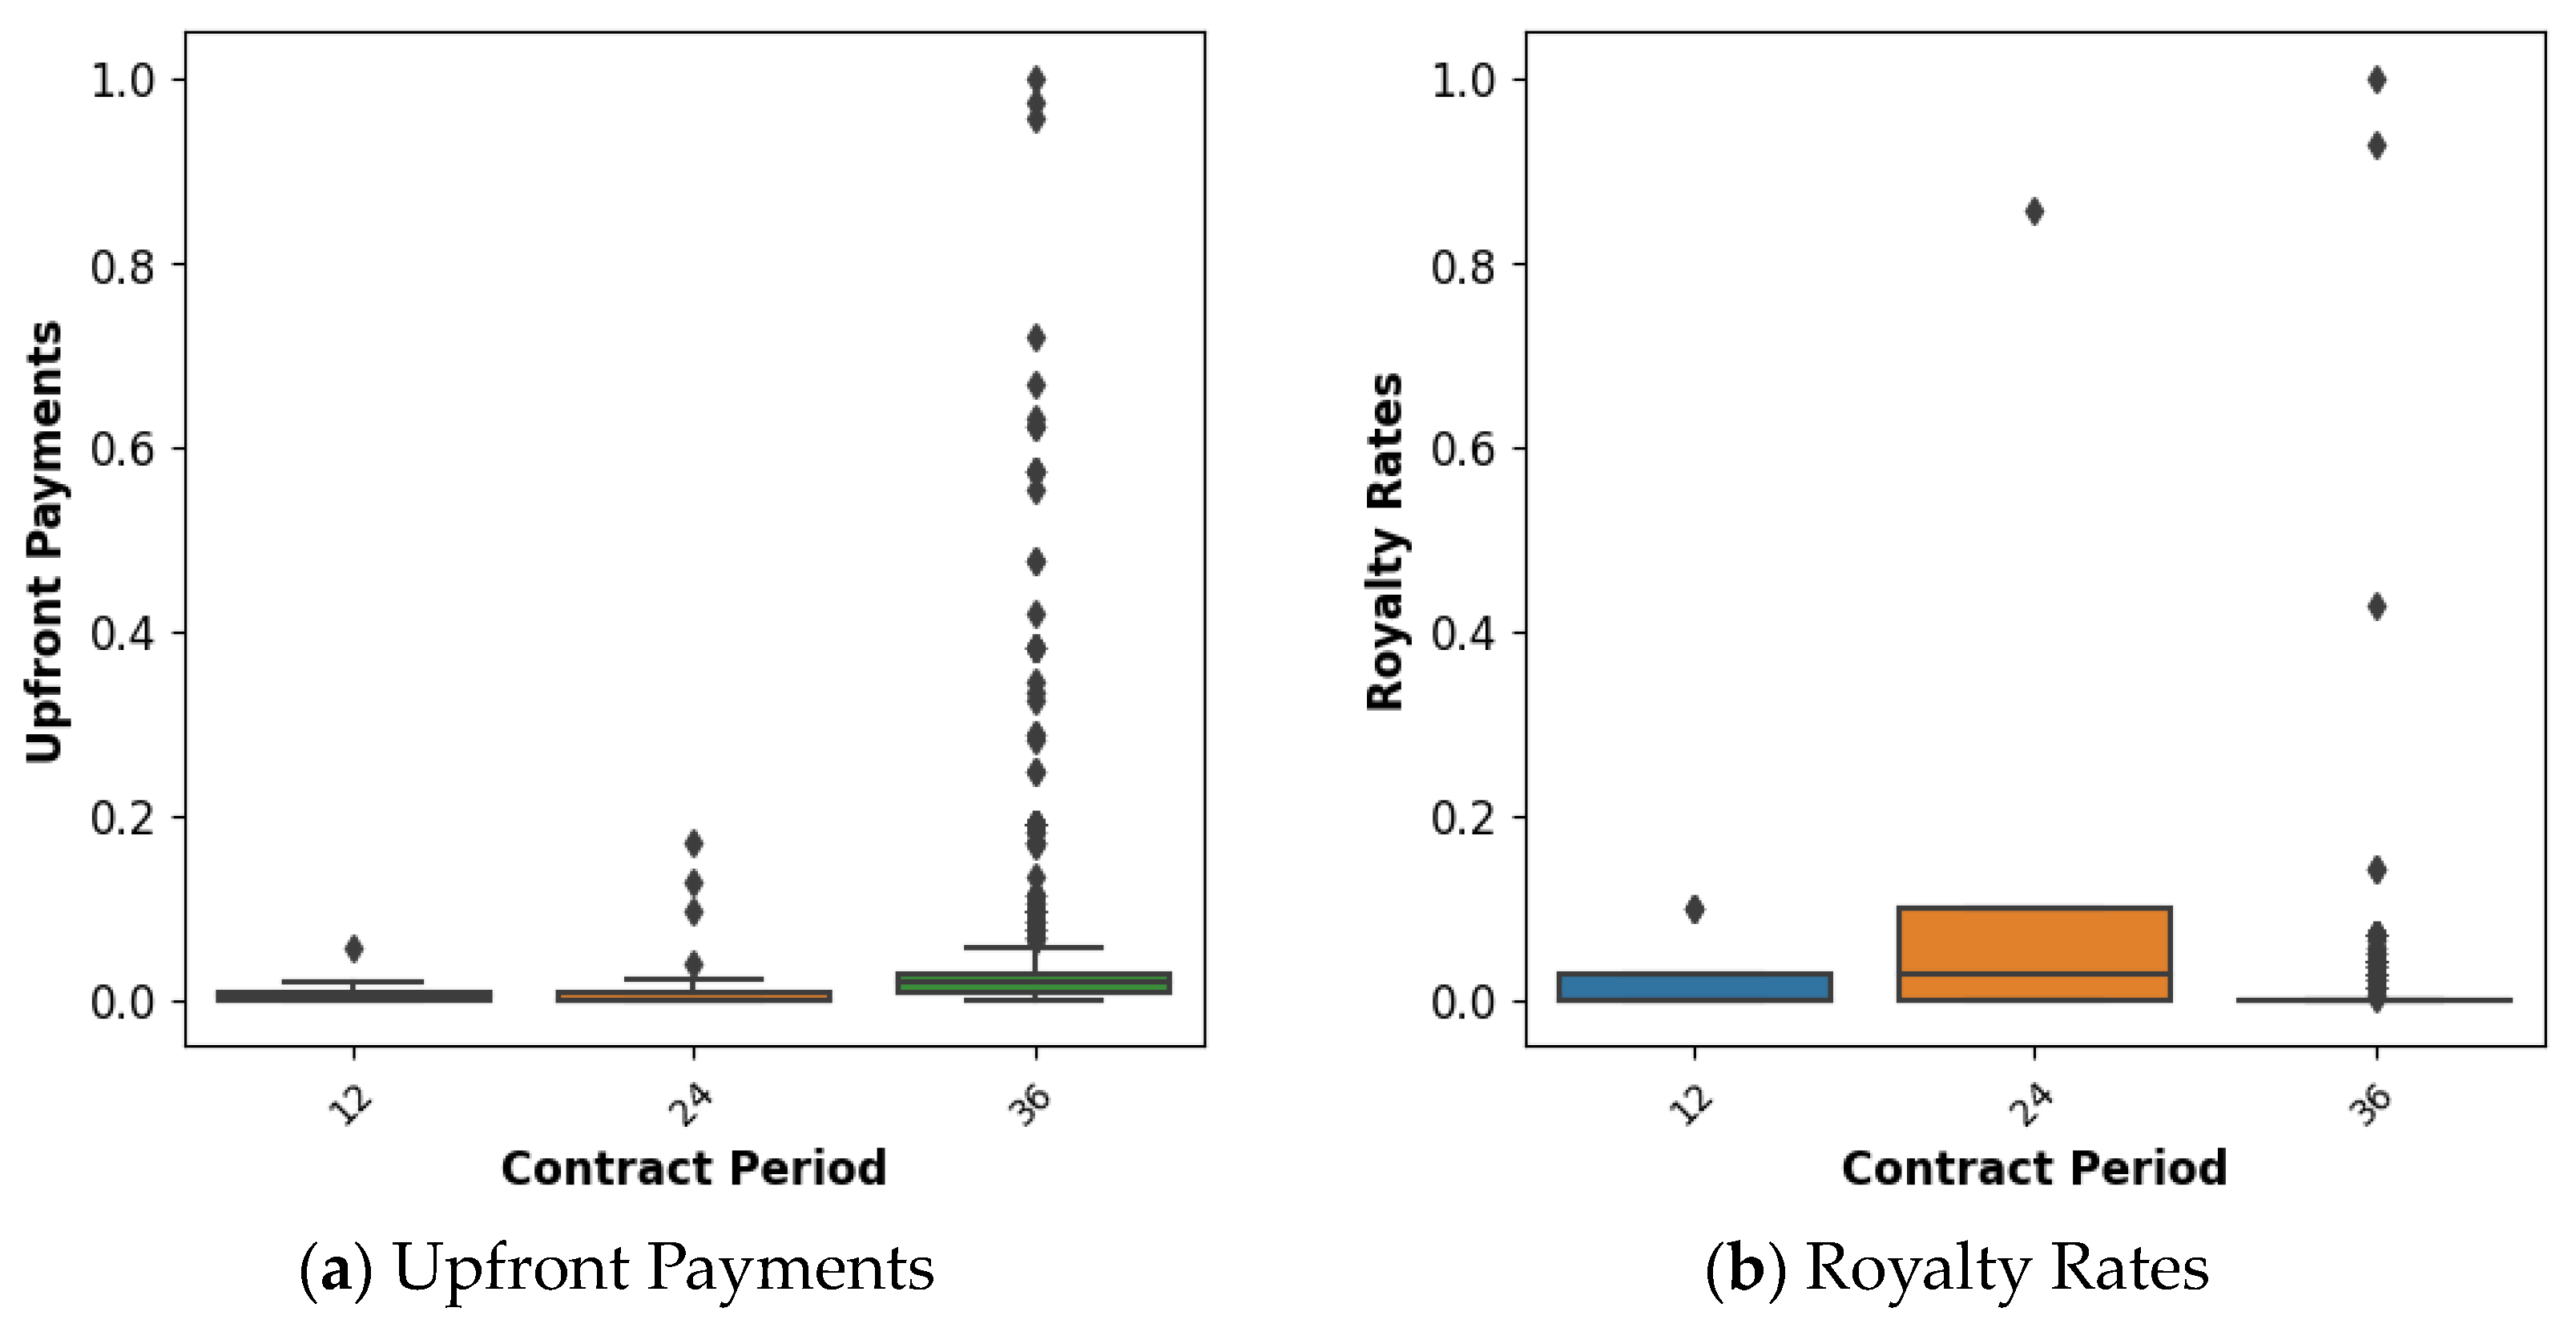
Contract PeriodContinuous variables
(12, 24, 34 (months))
Method of TransactionNominal variables
(Assignment agreement, Exclusive license,
Non-exclusive license, Technology transfer after joint R&D)
Technology TypeNominal variables
(Patent, Utility model, Design, Trademark, know-how, Others)
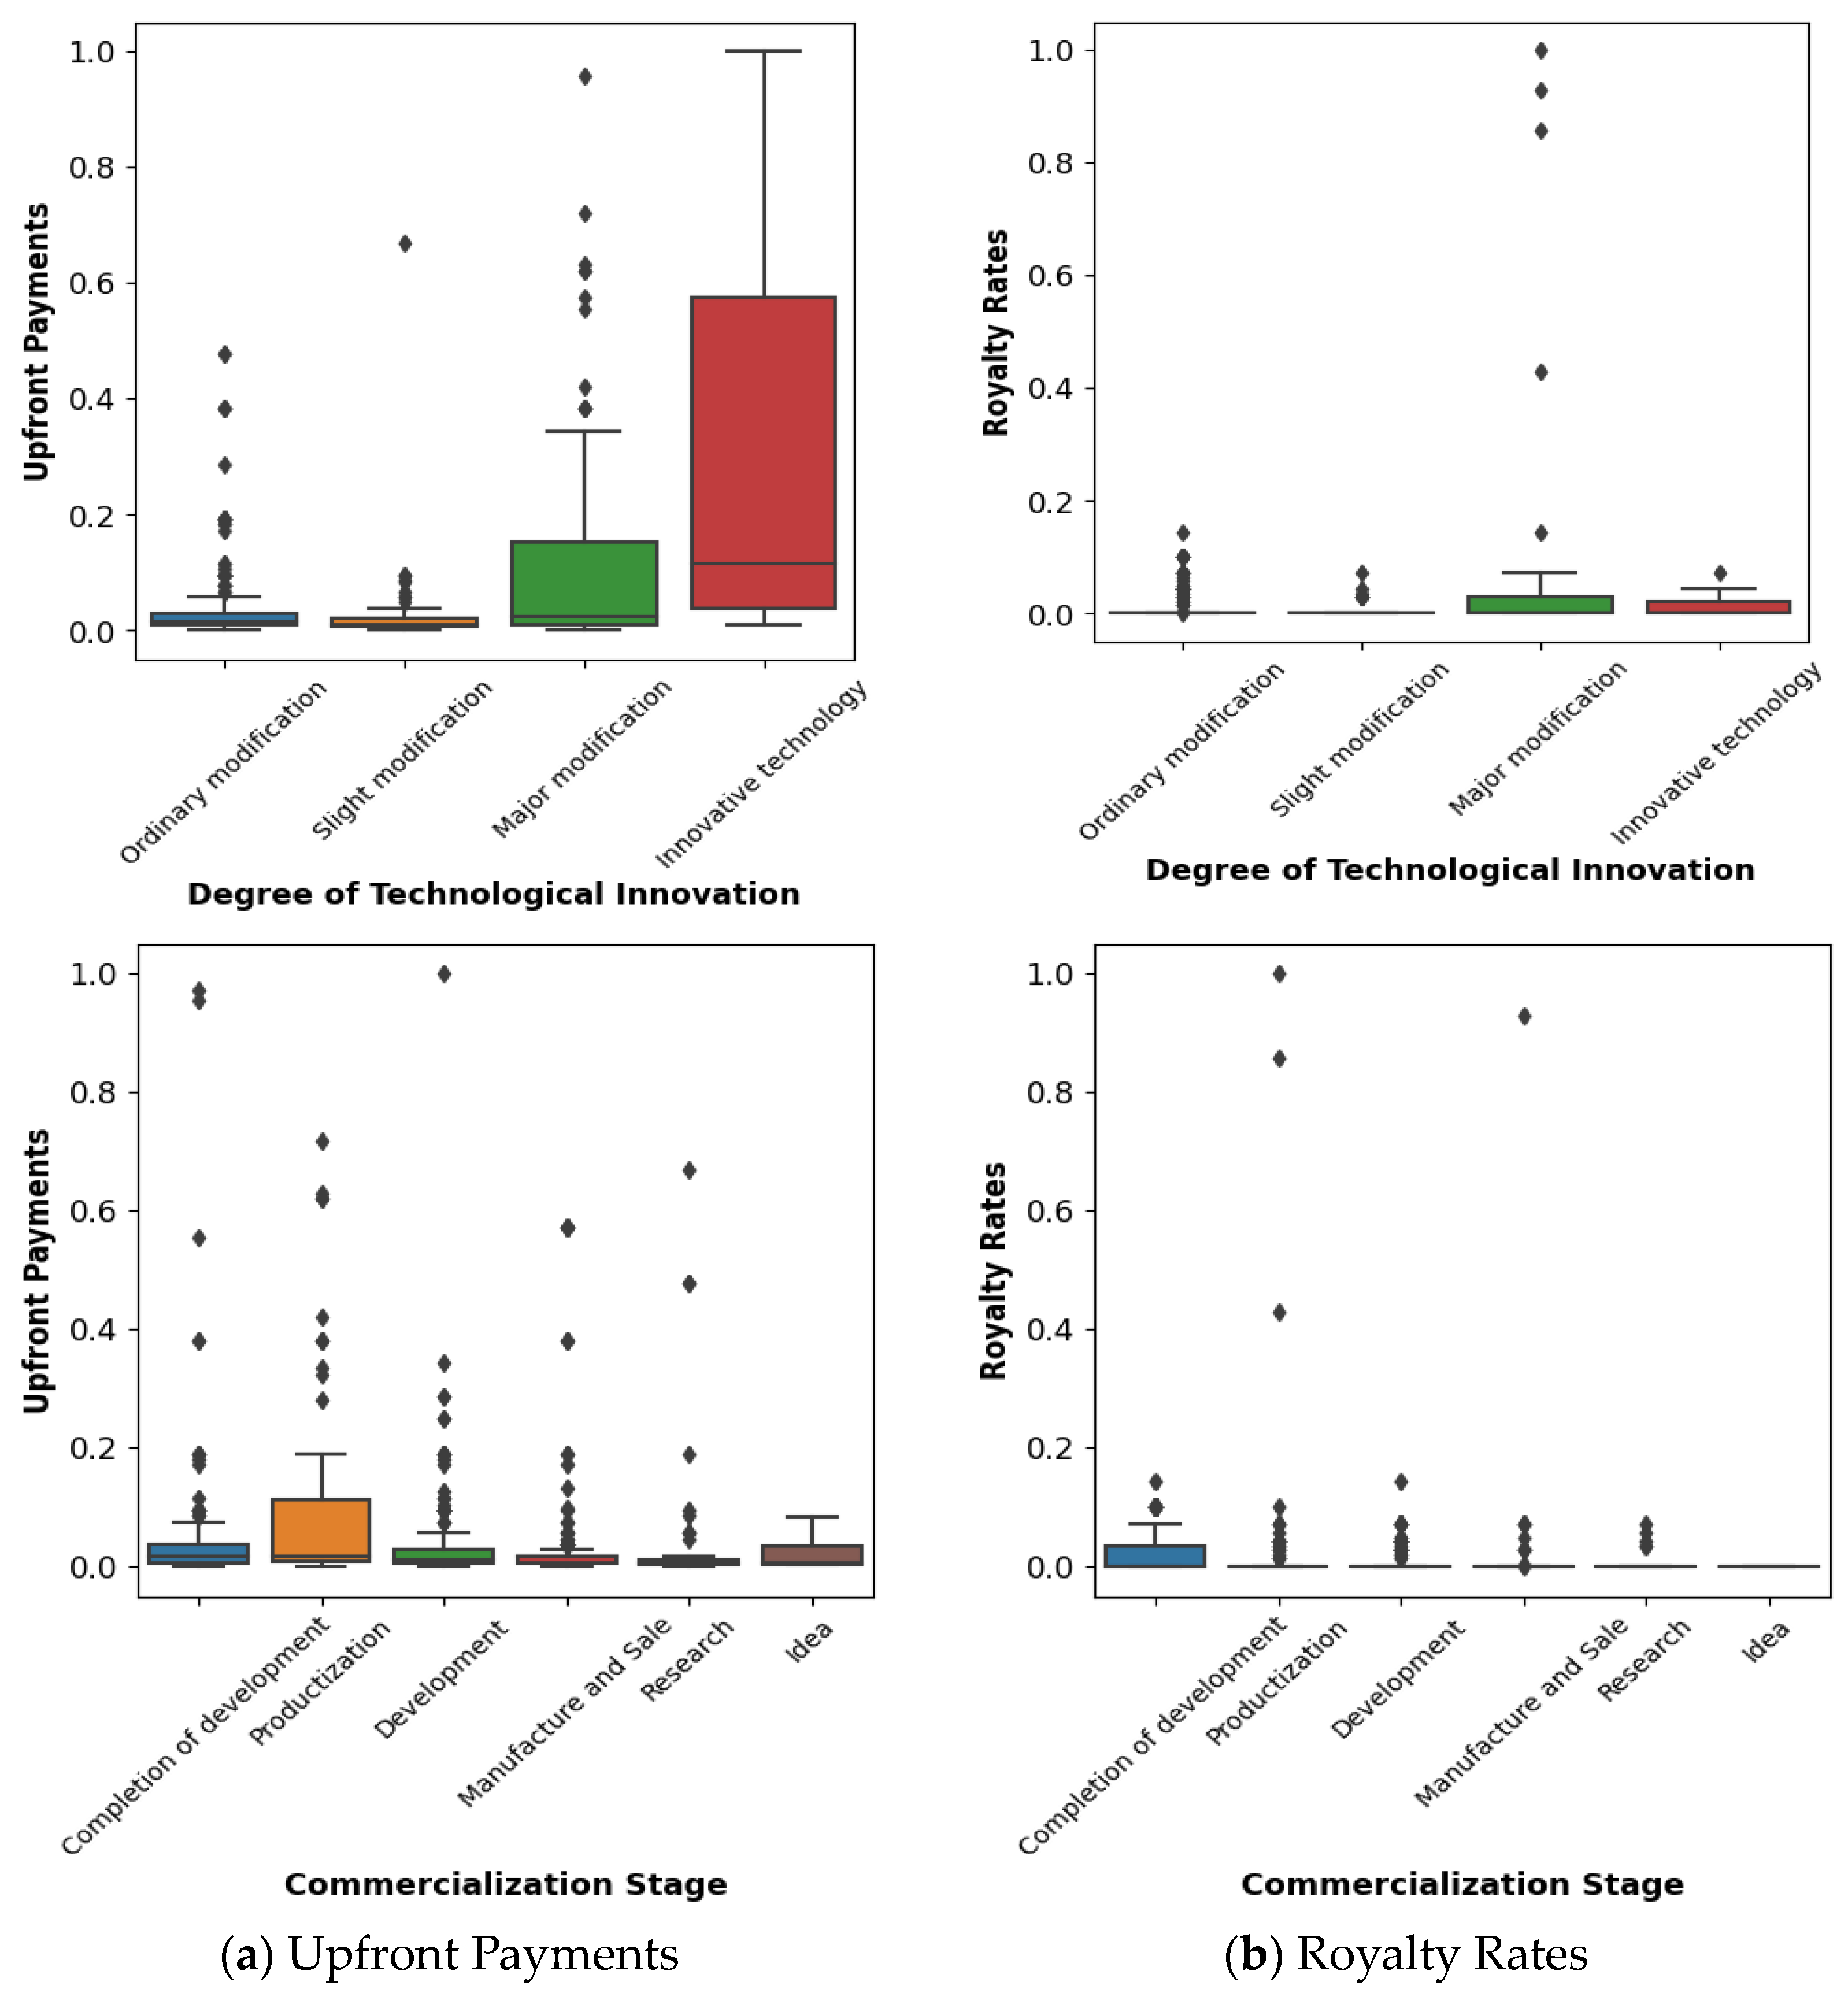
Degree of Technological InnovationOrdinal variables
(Slight modification, Ordinary modification,
Major modification, Innovative technology)
Commercialization StageOrdinal variables
(Idea, Research, Development, Completion of development, Productization, Manufacture and Sale)
Running Royalty MethodUpfront PaymentsContinuous variables
(0 KRW to 523,000,000 KRW)
Royalty RatesContinuous variables
(0–70%)
Table 3. Estimated key influential factors, importance, and transaction case k.
Key Influential FactorsImportanceTransaction Case k
Type of Technology Provider Company0.5155
Contract Period0.485
Table 4. Model architectures of state-of-the-art methods.
ModelEmbedding with Cosine SimilaritySiamese Networks
Input
layer
- Nominal: One-hot encoded
- Ordinal: Label Encoded
- Continuous: Min–Max Scaled
- Anchor: Reference instance
- Positive: Similar to the anchor
- Negative: Dissimilar to the anchor
Hidden layer- Dense layer with 128 neurons
- ReLU loss function
- Adam optimizer
- Four Dense layers with
128, 64, 32, and 16 neurons
- Triplet loss function
- Adam optimizer
Output
layer
- Upfront payments (y1) node
- Royalty rates (y2) node
- Embedding representation for each of the input instances
Table 5. Validation results of similarity for mixed-type data.
FoldProposed ModelEmbedding with
Cosine Similarity
Siamese Networks
#10.07010.08540.0989
#20.08930.09980.1443
#30.07840.09410.1308
#40.06170.08340.0989
#50.07810.08310.1305
Mean0.07550.08920.1207
STD0.01030.00740.0206
Table 6. Results of fine-tuning for state-of-the-art methods.
HyperparametersEmbedding with
Cosine Similarity
Siamese Networks
RangeBestRangeBest
Learning Rate(0.001, 0.01, 0.1)0.01(0.001, 0.01, 0.1)0.001
Batch Size(16, 32, 64)16(16, 32, 64)32
Hidden Unit(64, 128, 256)256(32, 64, 128)128
Hidden layers-(1, 2, 3)3
RMSE 0.0648 0.0986
Table 7. Performance verification results for fine-tuned state-of-the-art methods.
ModelProposed ModelFine-Tuned Embedding with Cosine SimilarityFine-Tuned
Siamese Networks
#10.04800.06980.0990
#20.02370.08020.1067
#30.09820.07190.0989
#40.05150.05850.0991
#50.15090.06850.1037
Mean0.07450.06980.1015
STD0.05050.00780.0036
Table 8. Validation results of the importance of influential factors.
FoldReduced Model
#10.1080.1090.1090.1080.108
#20.0740.0730.0730.0730.073
#30.0960.0960.0960.0960.096
#40.0850.0850.0850.0850.085
#50.1090.1090.1090.1090.109
Mean0.0940.0940.0940.0940.094
STD0.0150.0160.0160.0150.015
FoldWeighted Model
#10.1060.1030.1040.1050.105
#20.0710.0680.0680.0690.070
#30.0940.0910.0910.0920.092
#40.0840.0850.0850.0850.085
#50.1050.1040.1050.1060.106
Mean0.0920.0900.0910.0910.092
STD0.0150.0150.0150.0150.015
Table 9. Performance comparison of reduced model and weighted model.
kt-Statisticp-Value
34.706790.00926
53.933660.01705
73.91940.01726
93.810320.01893
113.833490.01856
Table 10. Performance comparison in ‘Machinery’.
ModelProposed ModelEmbedding Wit
Cosine Similarity
Siamese Networks
#10.07010.08550.0989
#20.08930.10260.1655
#30.07840.10030.0989
#40.06170.07550.1280
#50.07810.08550.0989
Mean0.07550.08990.1180
STD0.01030.01140.0294
Table 11. Performance comparison in ‘Information & Communication’.
ModelProposed ModelEmbedding with Cosine SimilaritySiamese Networks
#10.07610.14350.1250
#20.05000.08620.1347
#30.09440.10820.2686
#40.16360.15640.2661
#50.03460.065560.1235
Mean0.08370.11200.1836
STD0.05030.03810.0766
Disclaimer/Publisher’s Note: The statements, opinions and data contained in all publications are solely those of the individual author(s) and contributor(s) and not of MDPI and/or the editor(s). MDPI and/or the editor(s) disclaim responsibility for any injury to people or property resulting from any ideas, methods, instructions or products referred to in the content.

