Article

Predictive Analytics for Enterprise Innovation of Retail Energy Market Modeling of Integrated Demand Response and Energy Hubs

1
School of Accounting, Guizhou University of Commerce, Guiyang 550014, China
2
School of Accounting, Nanjing University of Finance and Economics, Nanjing 210023, China
3
Electrical Engineering Department, Islamic Azad University, Safashahr Branch, Safashahr 719343, Iran
*
Author to whom correspondence should be addressed.
Systems 2023, 11(8), 432; https://doi.org/10.3390/systems11080432
Submission received: 1 July 2023 / Revised: 26 July 2023 / Accepted: 9 August 2023 / Published: 18 August 2023
(This article belongs to the Section Systems Engineering)

Abstract

:
Many combined heat and power (CHP) energy hubs work within the following heat load mode in the wintertime to supply the request for heat, and renewable energy has been often restricted in the unified energy network (UEN) markets. The power Internet of Things (PIoTs) has enabled UEN to transmit data increasingly frequently. As a result of flexible connections among various UEN networks, renewable energy increases its accommodation capacity considerably. Thus, the purpose of the study is to optimize UEN within the backdrop of PIoTs. According to the impact of PIoTs on UEN, this paper develops the combined demand response (DR) process and the layout of the important parts of UEN. Afterward, this study develops a bi-level economic dispatching process based on the cyber-physical systems of PIoTs and UEN. In the dispatching process, the higher level optimizes the total UEN function; the lower level optimizes the demand-side equipment output and combined DR. Then, the gray wolf optimization scheme is used to solve the bi-level dispatch. Lastly, the standard UEN and the practical network have been used to verify the efficiency of the suggested process.

1. Introduction

Increasingly, power consumption and production efficiency are becoming more and more important in the world’s power transformation as a result of the exhaustion of fossil fuels and an increase in environmental consciousness. The use of renewable energy sources (RES) has been rising, but primary power utilization performance must be enhanced [1]. This paper aims at updating the current layout of the design and function of the power supply systems and at developing a unified energy network (UEN), enabling, based on hierarchy, the use of initial energy sources and centralized planning of second energy sources like electrical and heat power (EHP) [2,3].
As a result of the power Internet of Things (PIoTs), all parts of the power grid are able to utilize developed data and communication technologies to connect energy facilities (EFs) to people and things as well as objects and objects. PIoTs are a wireless sensor network (WSN) with a massive amount of powerful, intelligent sensors that develop based on IoT [4]. As a result of developed metering technologies, the forecasting of initiatives and the detection of faults in different EFs will be possible, ensuring the safety of multiple EFs. The integrated energy system improves the performance of the maintenance of different EFs and enables online monitoring of the system’s operational state [5]. The demand side (DS) is where PIoTs adopt critical technologies like edge computing to realize the flexibility of access, connection, and the ability to make intelligent local decisions. The standardization and intelligence of the function and maintenance of EFs have been achieved through the use of a uniform protocol standard and data layout [6,7]. Through the use of a large data mining scheme, the PIoTs encourage UEN and consumer exchange with information, enable the detailed utilization of energy utilization information, and create a green, carbonless, secure, and effective UEN [8].
Over the past decade, studies on the optimum UEND have focused on EHP couplings [9] in order to achieve the most economic performance and to accommodate more RESs. Ref. [10] calculated carbon dioxide and nitrogen-containing gas emissions as part of the integrated energy system and then developed an eco-economic optimum scheduling layout. The referenced study investigates the optimal operation of a regional integrated energy system while considering demand response strategies. It likely addresses the challenge of reducing carbon dioxide and nitrogen-containing gas emissions as part of the system’s eco-economic optimization. By integrating demand response mechanisms, the research aims to enhance the system’s efficiency, responsiveness, and sustainability. The study may explore how demand response actions can be intelligently scheduled within the energy system to achieve an eco-economic balance, leading to reduced greenhouse gas emissions and improved overall performance. Such insights can contribute significantly to the development of environmentally friendly and economically viable energy management strategies for sustainable energy systems.
Two main issues are posed to conventional dispatching methods based on centralized and parallel structures with the development of PIoTs. (1) PIoTs significantly enhance the capacity of the dispatch center to handle loads. This would greatly increase the number of measurements, the frequency of data acquisition, the kinds of data acquisition, and the quality of the information. As a result of all of these differences, there is an exponential increase in the volume of measured information on the DS [11]. In the conventional intensive planning framework, operational performance and computation speed would be reduced [12]. (2) With the advancement of smart meters that have the capability of functioning as “multi-meters in one”, information collection for gas, thermal, and electrical systems is being allied instead of separated [13]. In order to exchange data among various networks, nodes not only interact among component ties but also load ties, and all the systems are closely coupled. The maximum load movement and use of renewable energy (RE) would be vastly enhanced if the flexibility of loads and complementarities among various energy demands could be effectively utilized. The conventional dispatching approach is unable to provide the frequent exchange of power and data among various power systems. The UEN can use the bi-level optimization (BLO) approach to solve the issues described previously. A BLO layout for a virtual electrical plant has been developed in ref. [14]. The lower level consists of the interior components controlled by the virtual electrical plant, whereas the higher step involves optimum dispatching of the whole network. The PIoT’s effect on the energy network has not been taken into account.
This study presents an optimum planning layout based on the hierarchy for the UEN with HD and ED according to PIoTs. Upper-level dispatching (ULD) aims at minimizing the total costs of the UEN, and the lesser step aims at optimizing the function of the controllable components of the load section. The dispatching approach is compatible with the PIoT’s physical framework, and it could take complete advantage of the load flexibility. The study makes the following contributions: (1) A detailed analysis of the PIoT framework has been conducted, and a layout of the UEN and critical EFs has been developed. (2) A new integrated DR approach has been presented under the PIoT framework. According to the novel communications method, the new integrated DR provides greater flexibility among various power systems, which can better match the optimization goals of the border calculation terminuses (BCTs). (3) The BLO approach for UEN dispatching (UEND) has been presented for fitting the emerging cyber-physical network within the PIoTs framework. In this method, the higher stage corresponds to the entire UEND, and the lower stage has been applied to optimize the DS edge computing terminals. (4) An optimal dispatching algorithm has been presented that combines gray wolf optimization algorithm (GWOA) and mixed-integer linear programming (MILP) in order to address the dispatch issue.
The remaining sections of the study are: Part 2 explains the hierarchical framework of the UEN and its impact on PIoTs. Loads, networks, and critical EFs are modeled in Part 3. Part 4 proposes a BLO dispatching layout for UEN. Part 5 provides the method of dispatching. The simulation outcomes of the scenario are demonstrated in Part 6, and Part 7 provides the conclusion of the study.

2. Hierarchical Architecture of UEN within the Framework of PIoTs

2.1. PIoTs Structure

PIoTs are composed of four stages: application, platform, network, and conception [4]. A description of the four layers is provided below.
Data accumulation terminuses, BCTs, and other border apparatuses are all part of the perception layer. Holographic conception and optimum DS control are possible with this. Communication technology among conception apparatuses and BCTs differs depending on the application scenario, like PLC, Ethernet, or others. In the system stages, data has been transmitted from the load section to the dispatch station over 4G, 5G, WSN, and other wired processes. The platform layer shares, analyzes, and processes the information uploaded from the BCTs. The platform layer is responsible for communication among BCTs and dispatch stations. APPs or other processes are used to realize communication among the consumers and the UEN in the requisition stage. This layer contains the UEN operation center as well.

2.2. Dispatching Architecture of UEN within PIoTs

Through the implementation of PIoTs, the UEN’s sensory capability has been significantly enhanced. There are several kinds of load-stage information that is gathered, including power consumption like temperature, voltage/frequency, EHP, and so on. Similarly, the frequency of measurements has increased from once a day to once an hour to once every 15 min or more [15]. As a result, the amount of UEN load-stage data would rapidly rise. As long as the entire load-stage data is transmitted to the dispatching station for computation, the amount of information that needs to be transmitted will increase, as will the time and price of the dispatching station’s computation. Cloud-edge scheduling is used to address this issue. As soon as load-stage data is collected, edge computing is used to perform preliminary computations, and then the outcomes are transmitted to the dispatching station for allied planning. It will reduce aggregation in communication, improve the computation velocity of the dispatching station, and ensure the privacy of users.
As a result, the UEN must be dispatched hierarchically to fully exploit the cloud-edge architecture and load-stage multiple-energy data. Figure 1 depicts the suggested UEN hierarchical dispatching architecture using PIoTs. Edge computing EFs handle lower-level dispatching (LLD). The mutable loads’ control and equipment, like distributed generation, electric boilers (EBs), and energy storage systems (ESSs), allow the multiple-energy supplement in the limited domain and mutable responses to higher-stage signals so that a multiple-energy requisition is transmitted to the higher-stage. The UEND center handles the ULD. According to the data uploaded via the border calculation devices, the optimum output of the controllable EFs in the UEN, like renewable, heat, electric, and combined heat and power unit (CHPU) producers, has been calculated. The load stage has been controlled by the market, like DR. As a result, the UEN’s power performance has been enhanced, and its operating costs have decreased. UEND is heavily influenced by the uncertainty of the loads, or RE. In order to handle uncertainty in UEND, robust/fortuitous optimizations [16,17] are employed.
In our study, the distributed dispatch center plays a crucial role in coordinating and optimizing the decentralized edge devices within the cloud-edge scheduling framework. While the edge devices operate in a decentralized manner, the distributed dispatch center serves as a central control entity responsible for managing the overall system. The key functions of the distributed dispatch center include:
-
Resource Allocation: The center allocates resources efficiently among the various edge devices based on real-time demand, energy availability, and other relevant parameters. This ensures that resources are optimally utilized across the network;
-
Task Scheduling: It schedules tasks and workload distribution among the edge devices, taking into account their capabilities and processing power. By doing so, it aims to minimize latency, enhance responsiveness, and improve overall system performance;
-
Load Balancing: The distributed dispatch center monitors the workload of individual edge devices and ensures that the workload is evenly distributed. Load balancing helps prevent the overburdening of specific devices and maximizes resource utilization;
-
Energy Management: It manages the energy resources of the edge devices, considering their power consumption patterns and energy availability. This helps prolong the devices’ operational time and reduce overall energy waste;
-
Fault Tolerance and Redundancy: The center implements fault tolerance mechanisms and redundancy strategies to ensure system stability and reliability. It can reroute tasks and resources in the event of failures or disruptions, minimizing downtime and improving system resilience;
-
Data Aggregation and Analysis: The distributed dispatch center collects data from various edge devices, aggregates it, and performs data analysis. This data-driven approach enables the center to make informed decisions for optimizing the entire cloud-edge system.
Overall, the distributed dispatch center acts as the brains of the cloud-edge scheduling architecture, orchestrating the activities of the edge devices and ensuring efficient, reliable, and scalable operation. Its centralized control and coordination contribute significantly to the successful implementation of cloud-edge computing paradigms in various applications and domains.
In cloud-edge computing, the architecture involves two distinct time scales: cloud scheduling and edge scheduling. These time scales are designed to optimize different aspects of the system and coordinate their operations effectively.
-
Cloud Scheduling: Cloud scheduling operates on a relatively longer time scale, typically in the order of minutes to hours. It involves resource allocation, task scheduling, and workload management at the centralized cloud data centers. This longer time scale allows the cloud infrastructure to plan and allocate resources efficiently based on historical data, predicted workloads, and user demands. Cloud scheduling optimizes resource utilization and ensures that the cloud data centers operate at peak efficiency, catering to a wide range of applications and services.
-
Edge Scheduling: Edge scheduling operates on a much shorter time scale, typically in the order of milliseconds to seconds. It takes place at the edge devices, or nodes, closer to the end-users, or IoT devices. Edge scheduling focuses on real-time decision-making, task offloading, and handling tasks with low latency requirements. The shorter time scale enables quick responses to changing conditions, such as dynamic user mobility and varying network conditions. Edge scheduling aims to minimize latency, reduce data transmission to the cloud, and ensure a seamless user experience for time-sensitive applications.
The coordination between cloud scheduling and edge scheduling is achieved through the cloud-edge architecture’s hierarchical design and communication mechanisms. Here’s how it works:
Task Offloading Decision: When a task is generated by an end-user or device, the cloud-edge architecture evaluates the task’s characteristics and urgency. Tasks that require immediate processing or low latency are identified and offloaded to nearby edge devices through edge scheduling. Less time-sensitive or computationally intensive tasks may be sent to the centralized cloud data centers for processing through cloud scheduling;
Data Processing Location: The architecture determines the most appropriate location for data processing based on factors such as task requirements, data sensitivity, and network conditions. Critical data that needs immediate processing is handled at the edge, while less time-sensitive data may be transmitted to the cloud data centers for processing;
Dynamic Resource Allocation: The cloud-edge architecture continuously monitors the workload, resource availability, and network conditions at both the cloud and edge levels. It dynamically allocates resources to handle varying demands, balancing the load between cloud data centers and edge devices. This adaptive resource allocation ensures optimal performance and efficient utilization of resources;
Feedback Loop: There is a feedback loop between the cloud and edge components, allowing them to exchange information and adapt to changing conditions. For instance, edge devices can provide real-time data on their current capabilities, while cloud data centers can share information about resource availability and workload predictions. This feedback loop enables coordinated decision-making and resource management across the entire architecture.
In summary, the cloud-edge architecture coordinates cloud scheduling and edge scheduling by dynamically allocating tasks, resources, and data processing based on the nature of the tasks, time sensitivity, and real-time conditions. This hierarchical approach optimizes the performance of both cloud data centers and edge devices, providing an efficient and responsive computing environment for diverse applications and services.

3. Layout of the UEN within the Energy Hub Architecture

3.1. Unified Load and DR Layout within PIoTs

In general, the electric load (EL) is greater in the daytime and lower overnight, and because of the low temperatures overnight, the heat load (HL) differs from the EL. This means that the EL and the HL complement each other well.
The next formula is used to calculate the temperature variation of a residential building [18]:
T i , t + Δ t b u i = ( T t a m + H i , t l o a d / R a i r ) ( 1 e Δ t s t e p / τ i b u i ) + T i , t b u i · e Δ t s t e p / τ i b u i
In which, T t a m shows the ambient temperature at time t ; T i , t b u i indicates the internal temperature of the building in tie i at epoch t ; R a i r represents the thermic conductivity of air in the building; H i , t l o a d shows the thermal energy (TE) delivered to the tie i at epoch t , therefore the TE consumption of the load; τ i b u i shows the coefficient of thermic insulation of the building in tie i ; Δ t s t e p indicates the time step of information acquisition.
The formula shows that when all the other parameters remain unchanged and the indoor temperature remains stable, the TE delivered to the node should be altered in response to the surrounding temperature. Due to the human body’s lack of sensitivity to temperature, slight variations in indoor temperatures across a given range will not have a huge effect on residents’ satisfaction [19].
In general, demand–cost elasticity is used to describe the sensitivity of demand to cost [20]. It is possible to increase or decrease the HL without adversely impacting the indoor temperature, but it usually cannot be shifted to another period; therefore, it can often be determined via the self-traction, as shown in Equation (2).
E i , t t h = ρ t h H i , t l o a d , o r i Δ H i , t l o a d ρ t D R , h
In which, E i , t t h shows the self-traction of heat demand (HD) in tie i at epoch t ; ρ t h indicates the heat cost at time t ; H i , t l o a d , o r i shows the primary HD prior to DR in tie i at epoch t ; ρ t D R , h indicates the cost of thermal DR at time t ; Δ t i , t l o a d shows the alteration of HL following DR in tie i at epoch t .
The HL following DR is defined via Equation (3).
H i , t l o a d = H i , t l o a d , o r i [ 1 + E i , t t h ( ρ t D R , h ρ t h ) ]
In which H i , t l o a d shows the HL following DR in tie i at epoch t .
Self-traction and cross-traction could express the sensitivity of electric demand (ED) to cost, as shown in Equations (4) and (5).
E i , t t e = ρ t e P i , t l o a d , o r i Δ P i , t l o a d ρ t D R , e
E i , t τ e = ρ τ e P i , t l o a d , o r i Δ P i , t l o a d ρ τ D R , e
In which, E i , t t e shows the ED’s self-traction in tie i at epoch. E i , t τ e indicates the cross-traction of ED in tie i at epoch t ; ρ t e shows the electric cost at epoch t ; P i , t l o a d , o r i indicates the primary ED prior to DR in tie i at epoch t; ρ t D R , e shows the cost of electrical DR at epoch t ; Δ P i , t l o a d shows the alteration of EL following DR in tie i at epoch t . The EL following DR is defined via Equation (6)
P i , t l o a d = P i , t l o a d , o r i [ 1 + E i , t t e ( ρ t D R , e ρ t e ) + τ t d , τ t E i , t t e ( ρ t D R , e ρ t e ) ]
In which, P i , t l o a d shows the EL following DR in tie i at epoch t .
This formula is used to model the EB:
P i , t E B = η i E B H i , t E B
In which, P i , t E B shows the electric power used with the EB in tie i at epoch t ; η i E B indicates the conversion performance of the EB in tie i ; and H i , t E B shows the output of the EB in tie i at epoch t .

3.2. Unified Power Flow Computation Process of UEN within PIoTs

Formulas for continuity and head loss are included in the hydraulic layout, as shown in Equations (8) and (9).
m i , t q = l L i , t i n ,   s m l , t s l L i , t o u t , s m l , t s m i , t q = l L i , t i n ,   s m l , t r l L i , t o u t , s m l , t r
l L j , t + , s K l , t s m l , t s | m l , t s | = l L j , t , s K l , t s m l , t s | m l , t s | l L j , t + , r K l , t r m l , t r | m l , t r | = l L j , t , r K l , t r m l , t r | m l , t r |
In which m i , t q shows the total flow amount delivered to tie i at epoch t ; m l , t s and m l , t r indicate the total flow amount in supply and return pipelines (SRPs) l at epoch t , respectively; L i , t i n ,   s , L i , t o u t , s , L i , t i n , r and L i , t o u t , r show the groups of SRPs in which flow can inject to the tie i or leave tie i respectively; L j , t + , s , L j , t , s , L j , t + , r and L j , t , r define the groups of SRPs in which path is corresponding to or contrary to the path of loop j respectively; K l , t s and K l , t r indicate resistance ratios of SRPs l at epoch t respectively, and they have corresponded to the attrition ratio, diameter, length and total flow amount of the pipeline [21].
Node temperatures, pipeline temperatures, and node mixtures are included in the thermal layout:
H i , t = C P m i , t q ( T l , t s T l , t o )
T l , t o u t , s = T t a m + ( T l , t i n , s T l , t s o l i d ) e λ l L l p i p e m l , t s C P T l , t o u t , r = T t a m + ( T l , t i n , r T l , t s o l i d ) e λ l L l p i p e m l , t r C P
( l L i , t o u t ,   s m l , t s ) T i , t s + m l , t q T i , t s = l L i , t i n ,   s ( m l , t s T l , t e n d , s ) ( l L i , t o u t ,   r m l , t r ) T i , t r = m l , t q T i , t o l L i , t i n ,   r ( m l , t r T l , t e n d , r )
In which, C P shows the particular heat capacity of water ( C P = 4.182 × 10 3   M J   k g 1 ° C 1 ) ; T i , t r , T i , t o , and T i , t s indicate the reflux, egress and prepare temperatures in tie i at epoch t ; T l , t i n , s , T l , t o u t , s , T l , t i n , r and T l , t o u t , r indicate the hot water flow temperature in/out of SRPs l at epoch t ; λ l shows the pipeline’s total heat transmit ratio l per agent length; L l p i p e shows the length of pipeline l .
The Newton-Raphson procedure is used to solve the combined power flow formulas, which combine the EHP flow formulas into one formula set. Equation (13) is used to express the iteration formula of the Newton-Raphson process.
x ( k + 1 ) = x ( k ) J 1 Δ F
In which k shows the iteration number. x indicates the state parameters vector; Δ F represents the entire unconformities vector. J shows the Jacobian matrix.
It should be noted that this research is centered around the optimization of the unified energy network (UEN) within the context of cyber–physical systems (CPS) and the power Internet of Things (PIoTs). By leveraging the capabilities of CPS and PIoTs, the study aims to create a smart and interconnected energy infrastructure that efficiently manages power generation, transmission, and consumption. The integration of CPS allows for real-time monitoring and control of physical energy assets through digital communication and data exchange, enabling seamless coordination between various components of the UEN. The study proposes a novel unified power flow computation process within PIoTs for the UEN, combining both hydraulic and thermal layouts. The continuity and head loss equations are formulated, considering the total flow amount in supply and return pipelines and the impact of resistance ratios. The Newton–Raphson procedure, a well-known numerical method in CPS, is employed to solve the combined power flow formulas, demonstrating the utilization of computational techniques in optimizing energy distribution. To enhance the UEN’s performance in PIoT environments, a hierarchical dispatch architecture is adopted to alleviate data transfer pressure. The bi-level economic dispatching process, with CPS as the backbone, effectively optimizes the UEN’s total function at the higher level while simultaneously optimizing the demand-side equipment output and combined demand response (DR) at the lower level. Through the integration of CPS and PIoTs, the dispatch process allows users to respond to cost signals and convert multi-energy demands, all while maintaining user satisfaction and reducing operation costs. Overall, this study exemplifies the synergy between CPS and PIoTs in achieving an optimal UEN layout, providing valuable insights into the future of cyber-physical energy systems.

3.3. Layout of Critical Apparatuses in UEN

3.3.1. Layout of CHPU

Steam is extracted from the prompt-pressure cylinder of the CHPU and used to regulate the heat-to-power factor [22].
In line AB, the CHPU is operating at the maximum consecutive turbine scale. Equation (14) is used to express the relationship among EHP outputs.
P i , t C H P = H i , t C H P / Z + η e F i n
In which Z shows a coefficient that is related to the performance of the prompt-pressure cylinder; η e shows the electric performance for the CHPU; F i n shows the fuel input amount for the CHPU. Considering the situation, the heat-to-power factor of the CHPU remains constant, and the relation among the EHP outputs is defined via Equation (15).
P i , t C H P = H i , t C H P / c m
In which c m shows the heat-to-power rate of the CHPU.

3.3.2. Layout of the ESS

Equation (16) is used to express the state of charge (SOC) of electrical ESS facilities (EESSFs):
S O C i , t e = η i s , e S O C i , t 1 e + η i c h r , e P i , t c h r , e P i , t d i s , e
In which S O C i , t e shows the EESSF’s SOC in tie i at epoch t ; η i s , e indicates its ESS performance; η i c h r , e shows its charging performance; P i , t c h r , e and P i , t d i s , e indicate the EESSF’s discharge/charge power in tie i at epoch t . Equation (17) is used to calculate the SOC [23].
S O C i , t h = η i s , h S O C i , t 1 h + η i c h r , h P i , t c h r , h H i , t d i s , h
In which, S O C i , t h shows the SOC of the heat storage boiler (HSB) in tie i at epoch t ; η i s , h indicates its ESS performance; η i c h r , h shows its charging performance; P i , t c h r , h and H i , t d i s , h indicate the HSB’s discharge/charge power in tie i at epoch t .

4. Objective Function (OF)

Equation (18) is used to express the OF of the combined dispatch layout:
min C upper = t = 1 t d ( i N source C i , t s o u r c e + i N L C i , t D R + C t b u y ,   u p p e r + i N re C i , t a b a n )
In which C upper shows the total price of the ULD; t d shows the number of dispatch cycles; N source indicates the group of entire energy resource ties; N L shows the group of entire load ties; N r e represents the group of whole RE producer ties; C i , t s o u r c e shows the price of the resource EFs like CHPUs, conventional producers, or heat resources in tie i at epoch t ; C i , t D R shows the DR compensation paid via the dispatch center to the loads in node i at time t ; C i , t a b a n shows the penalty for RE restriction in tie i at epoch t ; C t b u y ,   u p p e r shows the price of buying electrical energy from zonular UEN to the bulk grid (BG).
Equation (19) is used to express the price of generators or heat resources [21].
C i , t s o u r c e = c 0 , i + c 1 , i P i , t s o u r c e + c 2 , i ( P i , t s o u r c e ) 2 + c 3 , i H i , t s o u r c e + c 4 , i ( H i , t s o u r c e ) 2 + c 5 , i ( P i , t s o u r c e H i , t s o u r c e )
In which, C i , t s o u r c e shows the price of producer or heat resource in tie i at epoch t ; P i , t s o u r c e and H i , t s o u r c e indicate the producer output or heat resource in tie i at epoch t ; c 0 , i , c 1 , i , c 2 , i , c 3 , i , c 4 , i and c 5 , i indicate price computation coefficients and are specified via the units. Equation (20) is used to express the DR compensation:
i N L C i , t D R = i N L ( ρ t D R , e ( Δ H i , t l o a d ) + ρ t D R , h ( Δ P i , t l o a d ) )
In which ρ t D R , h and ρ t D R , e show thermal and electric DR compensators costs at epoch t, respectively. The compensator’s cost is adjusted in order to adjust the load stage. Equation (21) is used to express the penalty for RE curtailment.
i N re C i , t a b a n = ρ a b a n i N re P i , t a b a n
In which ρ a b a n shows the penalty cost for RE curtailment; P i , t a b a n indicates the curtailment value in tie i at epoch t . Equation (22) has been used to express the price of buying electrical energy from the zonular UEN to the BG.
C t b u y ,   u p p e r = ρ t e ,   u p p e r P t b u y , u p p e r
In which ρ t e shows the electric cost of the BG at epoch t ; P t b u y , u p p e r indicates the value of power bought via the UEN from the BG at epoch t .

4.1. The of for LLD

LLD has been intended to satisfy residents’ EHP needs with minimal impact on their satisfaction. The cost has been reduced by dispatching load-level facilities (LSFs) optimally. Equation (23) is used to express the OF of the LLD.
min C t l o w e r = t = 1 t d C i , t b u y , l o w e r C i , t D R + C i , t E B
In which C i , t l o w e r shows the total price of the LLD in tie i at epoch t ; C i , t b u y , l o w e r indicates the price of buying heat and electric energy from the UEN in tie i at epoch t ; C i , t E B shows the operation price of the EB in tie i at epoch t .
Equation (24) is used to express the operation price of the EB.
C i , t E B = c 0 , i + c 1 , i H i , t E B + c 2 , i ( H i , t E B ) 2
Equation (25) is used to express the price of buying EHP from the UEN.
C i , t b u y , l o w e r = ρ t e · ( P i , t l o a d + P i , t E B ) + ρ t h ( H i , t l o a d H i , t E B )
In which ρ t e shows the electric price at time t and ρ t h indicates price of heat at epoch t .

4.2. Limitations

4.2.1. Limitations of ULD

(1)
Power flow Limitations.
UEN power transitions should comply with EHP flow restrictions. The TE flow restrictions are the TE flow computation formulas, which are Equations (8) to Equations (12), (26) and (27) and are used to express the electrical power flow restrictions.
P i = U i j = 1 n e U j ( G e ( i , j ) c o s δ i j + B e ( i , j ) s i n δ i j )
Q i = U i j = 1 n e U j ( G e ( i , j ) c o s δ i j B e ( i , j ) s i n δ i j )
In which P i shows active power and   Q i indicates reactive power delivered to node i . U i shows the voltage of tie i ; δ i shows the angle; G e and B e refer to the real and imaginary parts of the acceptance matrix; n e shows the overall number of electric nodes.
(2)
Utilization limitations of generators and thermic resources
The output domain of the heat resources and generators is constant. Meanwhile, the ascendant limitations of the thermic resources and generators should be investigated, like Equations (28)–(31).
P i m i n P i , t s o u r c e P i m a x
H i m i n H i , t s o u r c e H i m a x
P i , t s o u r c e P i , t 1 s o u r c e P i u , r a m p ,   P i , t s o u r c e P i , t 1 s o u r c e P i l , r a m p
H i , t s o u r c e H i , t 1 s o u r c e H i u , r a m p , H i , t s o u r c e H i , t 1 s o u r c e H i l , r a m p
where, P i m i n , P i m a x , H i m i n and H i m a x define the minimum and maximum output of the generators and thermic resources in tie i at epoch t ; P i u , r a m p , P i l , r a m p , H i u , r a m p and H i l , r a m p describe the upper and lower limitations of the ascendant amount of the generators and thermic resources in tie i at epoch t .
(3)
Spinning reserve (SR) limitations
Investigating the uncertainties of the loads and RE, the UEND must comply with the SR restrictions, like Equations (32)–(34).
0 r u i , t min [ P i u , r a m p , P i m a x P i , t s o u r c e ] ,   i N r e s
0 r d i , t min [ P i d , r a m p , P i , t s o u r c e P i m i n ] , i N r e s
i N r e s r u i , t S R u   , i N r e s r d i , t S R d
where r u i , t and r d i , t describe the SR volume generated through the generators in tie i at epoch t ; N r e s is the tie group that is able to generate SR. S R u and S R d present the SR demand of the UEN.
(4)
Limitations of EESSFs
The limitations of the EESSFs primarily contain the SOC limitations of the EESSFs and the limitations of discharge/charge power, based on Equations (35)–(37).
S O C i m i n , e S O C i , t e S O C i m a x , e
0 P   i , t c h r , e P   i c h r , e , m a x
0 P   i , t d i s , e P   i d i s , e , m a x
In which, S O C i m a x , e shows the maximum and S O C i m i n , e indicates the minimum SOC of the EESSF in tie i at epoch t ; P   i c h r , e , m a x shows the maximum charging and P   i d i s , e , m a x indicates the maximum discharge power of the EESSF in tie i at epoch t .

4.2.2. Limitations of LLD

(1)
Temperature Limitations of the building
It is important that load-stage dispatching follow the assumption that temperatures will not be overly influenced. Equation (38) is used to express the temperature limitation in the building.
T i b u i , l T i b u i T i b u i , u
In which T i b u i , u shows the upper limit and T i b u i , l indicates lower bound of the internal temperature in tie i .
(2)
DR restrictions
Equations (39) and (40) express the limitations on the load’s response to the cost signal.
ϕ i h , l H i , t l o a d , o r i H i , t l o a d ϕ i h , u H i , t l o a d , o r i
ϕ i e , l P i , t l o a d , o r i P i , t l o a d ϕ i e , u P i , t l o a d , o r i
In which ϕ i h , l , ϕ i h , u , ϕ i e , l and ϕ i e , u show the DR participated ratios of the loads in tie i ; H i , t l o a d , o r i and P i , t l o a d , o r i indicate the load’s TE and ED in tie i at epoch t prior DR, respectively.
(3)
Limitations of alteration EFs
EBs and HSBs are the main alteration EFs on the load stage. EBs’ outputs are completely flexible; therefore, only the output limitations have been taken into account, according to Equation (41).
0 H i E B H i m a x , E B
In which H i m a x , E B shows the maximum EB’s output in tie i . Equations (42)–(44) are used to express the limitations of HSBs.
S O C i m i n , h S O C i , t h S O C i m a x , h
0 P   i , t c h r , h P   i c h r , h , m a x
0 H   i , t d i s , h H   i d i s , h , m a x
In which, S O C i m a x , h shows the maximum SOC of the HSB in tie i and S O C i m i n , h indicates the minimum SOC of the HSB in tie i ; P i c h r , h , m a x shows the maximum charging power of the HSB in tie i at epoch t , and H i d i s , h , m a x indicates the maximum discharging power of the HSB in tie i at epoch t .

5. Solution for the BLO Issue

This paper defines the dispatching process using a cloud-edge dispatching architecture. UEND centers handle the ULD, and load-stage edge computing handles the LLD. The LLD is unable to send all the gathered data to the upper level because of the limitations of the data transfer and the computational volume of the planning station. Just the consumer’s HD and ED of energy are sent to the top stage, following the dispatch of different controllable EFs. In spite of the fact that the ULD center is unable to directly control the LSFs, the cost signal is sent to the LLD, and the LLD is affected, thus indirectly controlling the LSFs.
Because of the UEN’s power flow computation, ULD is highly non-linear, so the problem can be solved by using heuristic algorithms like PSO (particle swarm optimization) and GA (genetic algorithms). For faster convergence and to avoid obtaining a local optimum solution, the GWOA [24] has been applied for solving the optimum ULD layout.

6. Scenario

6.1. Unified 33-Ties Electrical and 13-Ties Thermal Systems

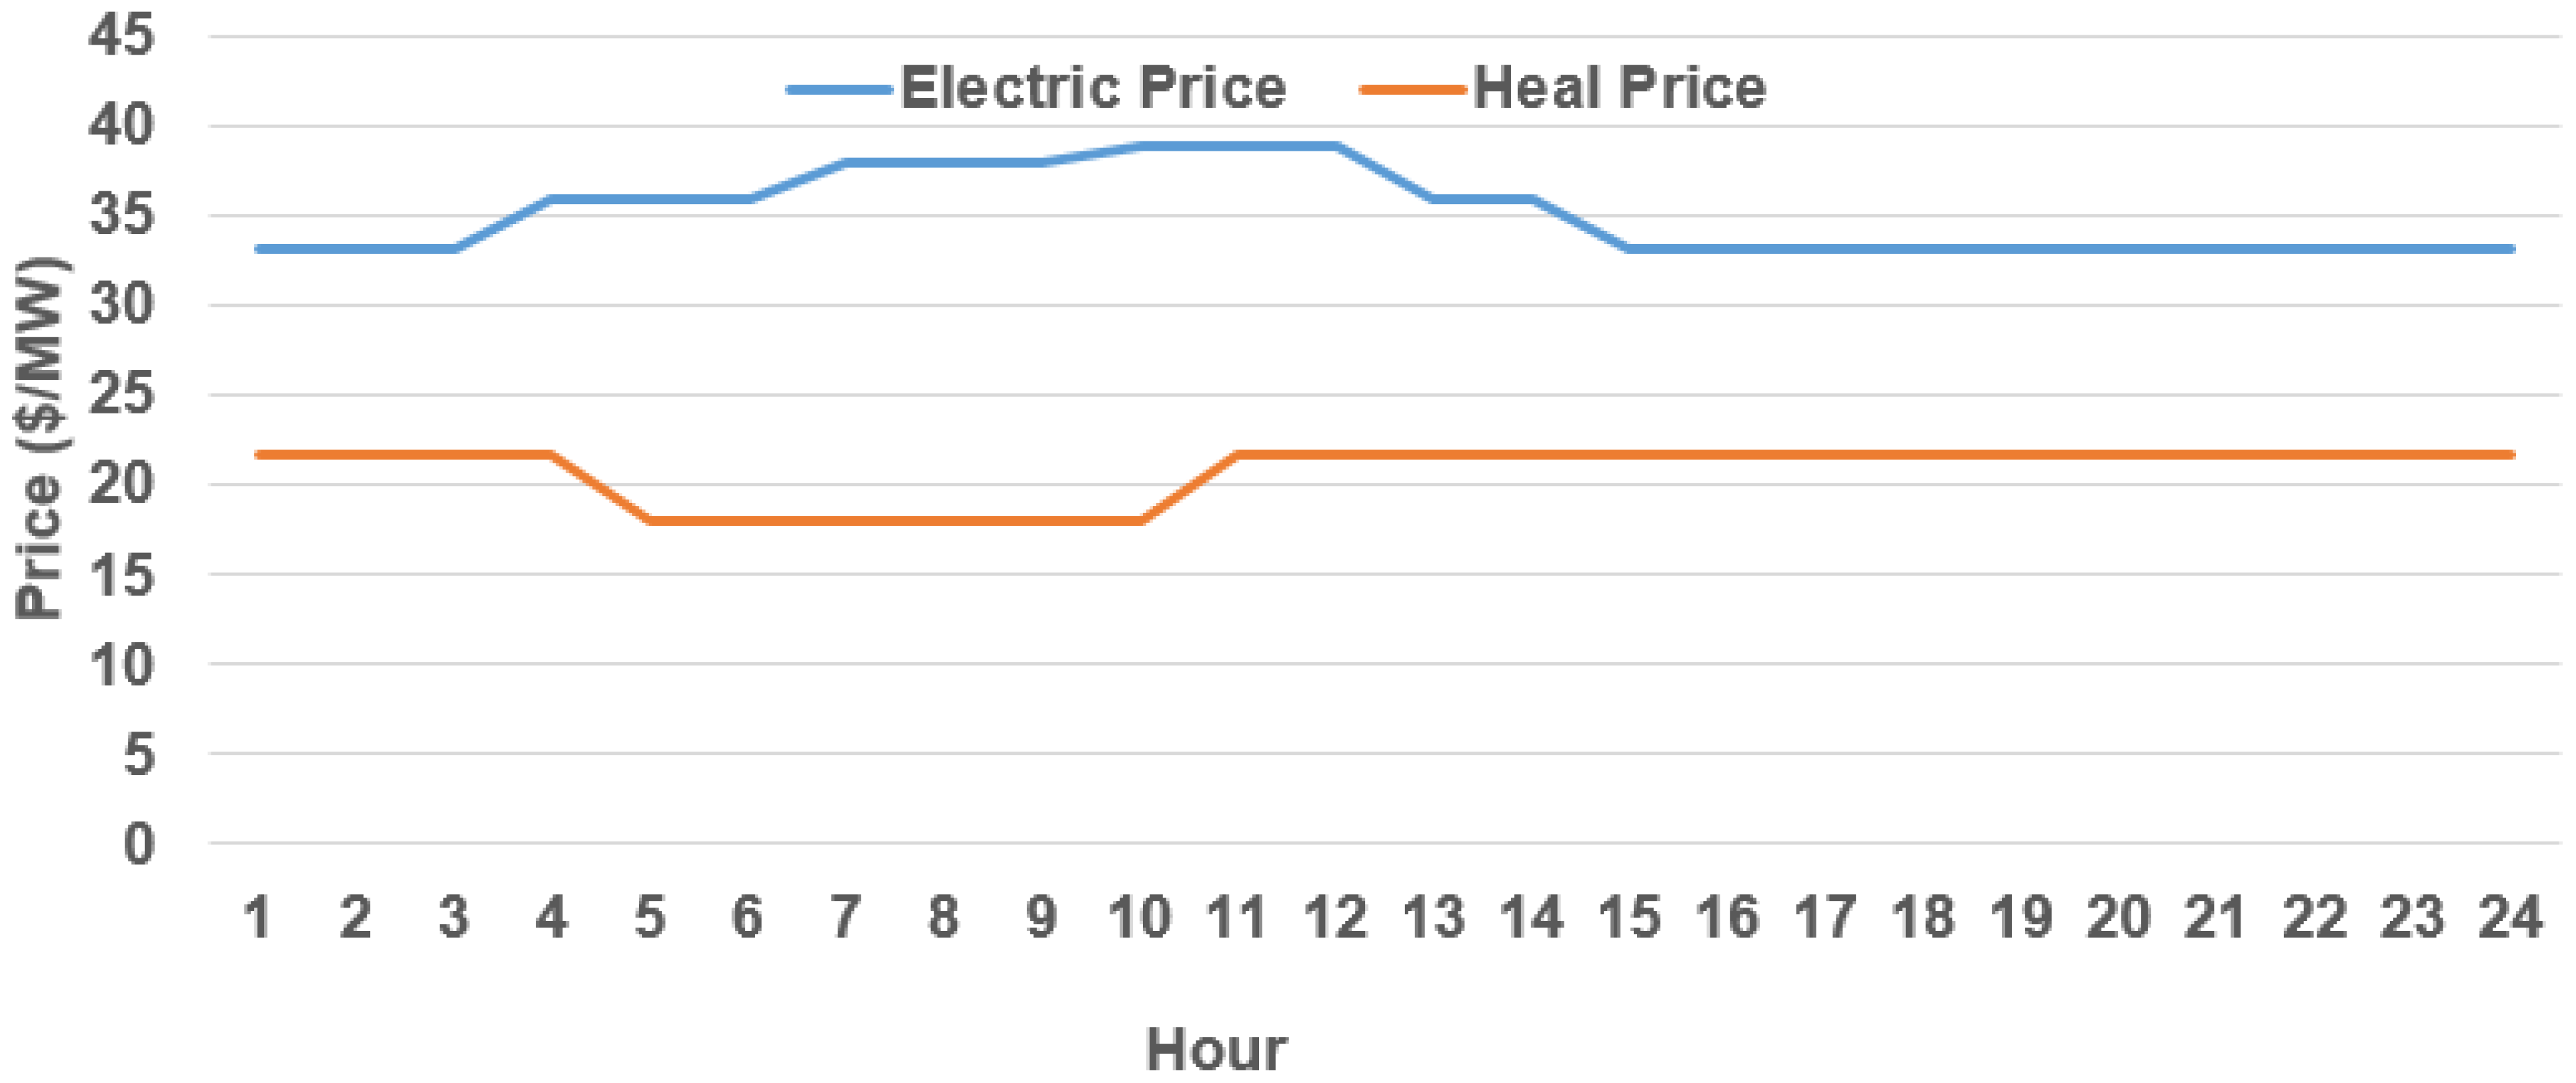
Figure 2 shows the initial scenario of this study. There are 33 nodes in the electric system. Tie E 0 has been linked to the BG. The ties E 24 and E 32 have been linked to the CHPU, respectively. Tie E 31 has been linked to the wind turbine (WT). Ref. [25] provides information about the system’s topology and other details. In the CHPU, CHPU-1 has a more rapid output adjustment, but at a greater cost. Most often, it has been applied to regulate peaks. CHPU-2 has a lower cost compared to CHPU-1 and has been mostly utilized to supply energy. The TE system in the UEN includes the 13-tie thermic system. Ref. [26] contains more information. The load nodes are ties H 2 , H 3 , H 4 , H 6 , H 7 , H 8 , H 9 , and H 10 . Each load node has an EB. Tie H 12 has been linked to the thermic resource whose output is fixed. Figure 2 shows ties in the same dashed box as being in the same area. Electrical ties in the same region power these EBs, which have been considered loads via the grid. Table 1 shows the coefficients of the EFs [26]. Figure 3 illustrates the electric and heating prices. Multi-energy dispatch is categorized into three scenarios.
Scenario one. comparison case, on the DS, it is impossible to interact among various energy networks. There is a conventional parallel-centralized dispatch scheme.
Scenario two. Integrated DR is used to interact with the dispatch center with loads, while LLD is not possible.
Scenario three. This case performs the flexible interchange among the dispatch center and the loads, as well as the interchange among various energy networks, and also performs LLD and ULD.
(1)
Dispatching outcomes for Scenario two
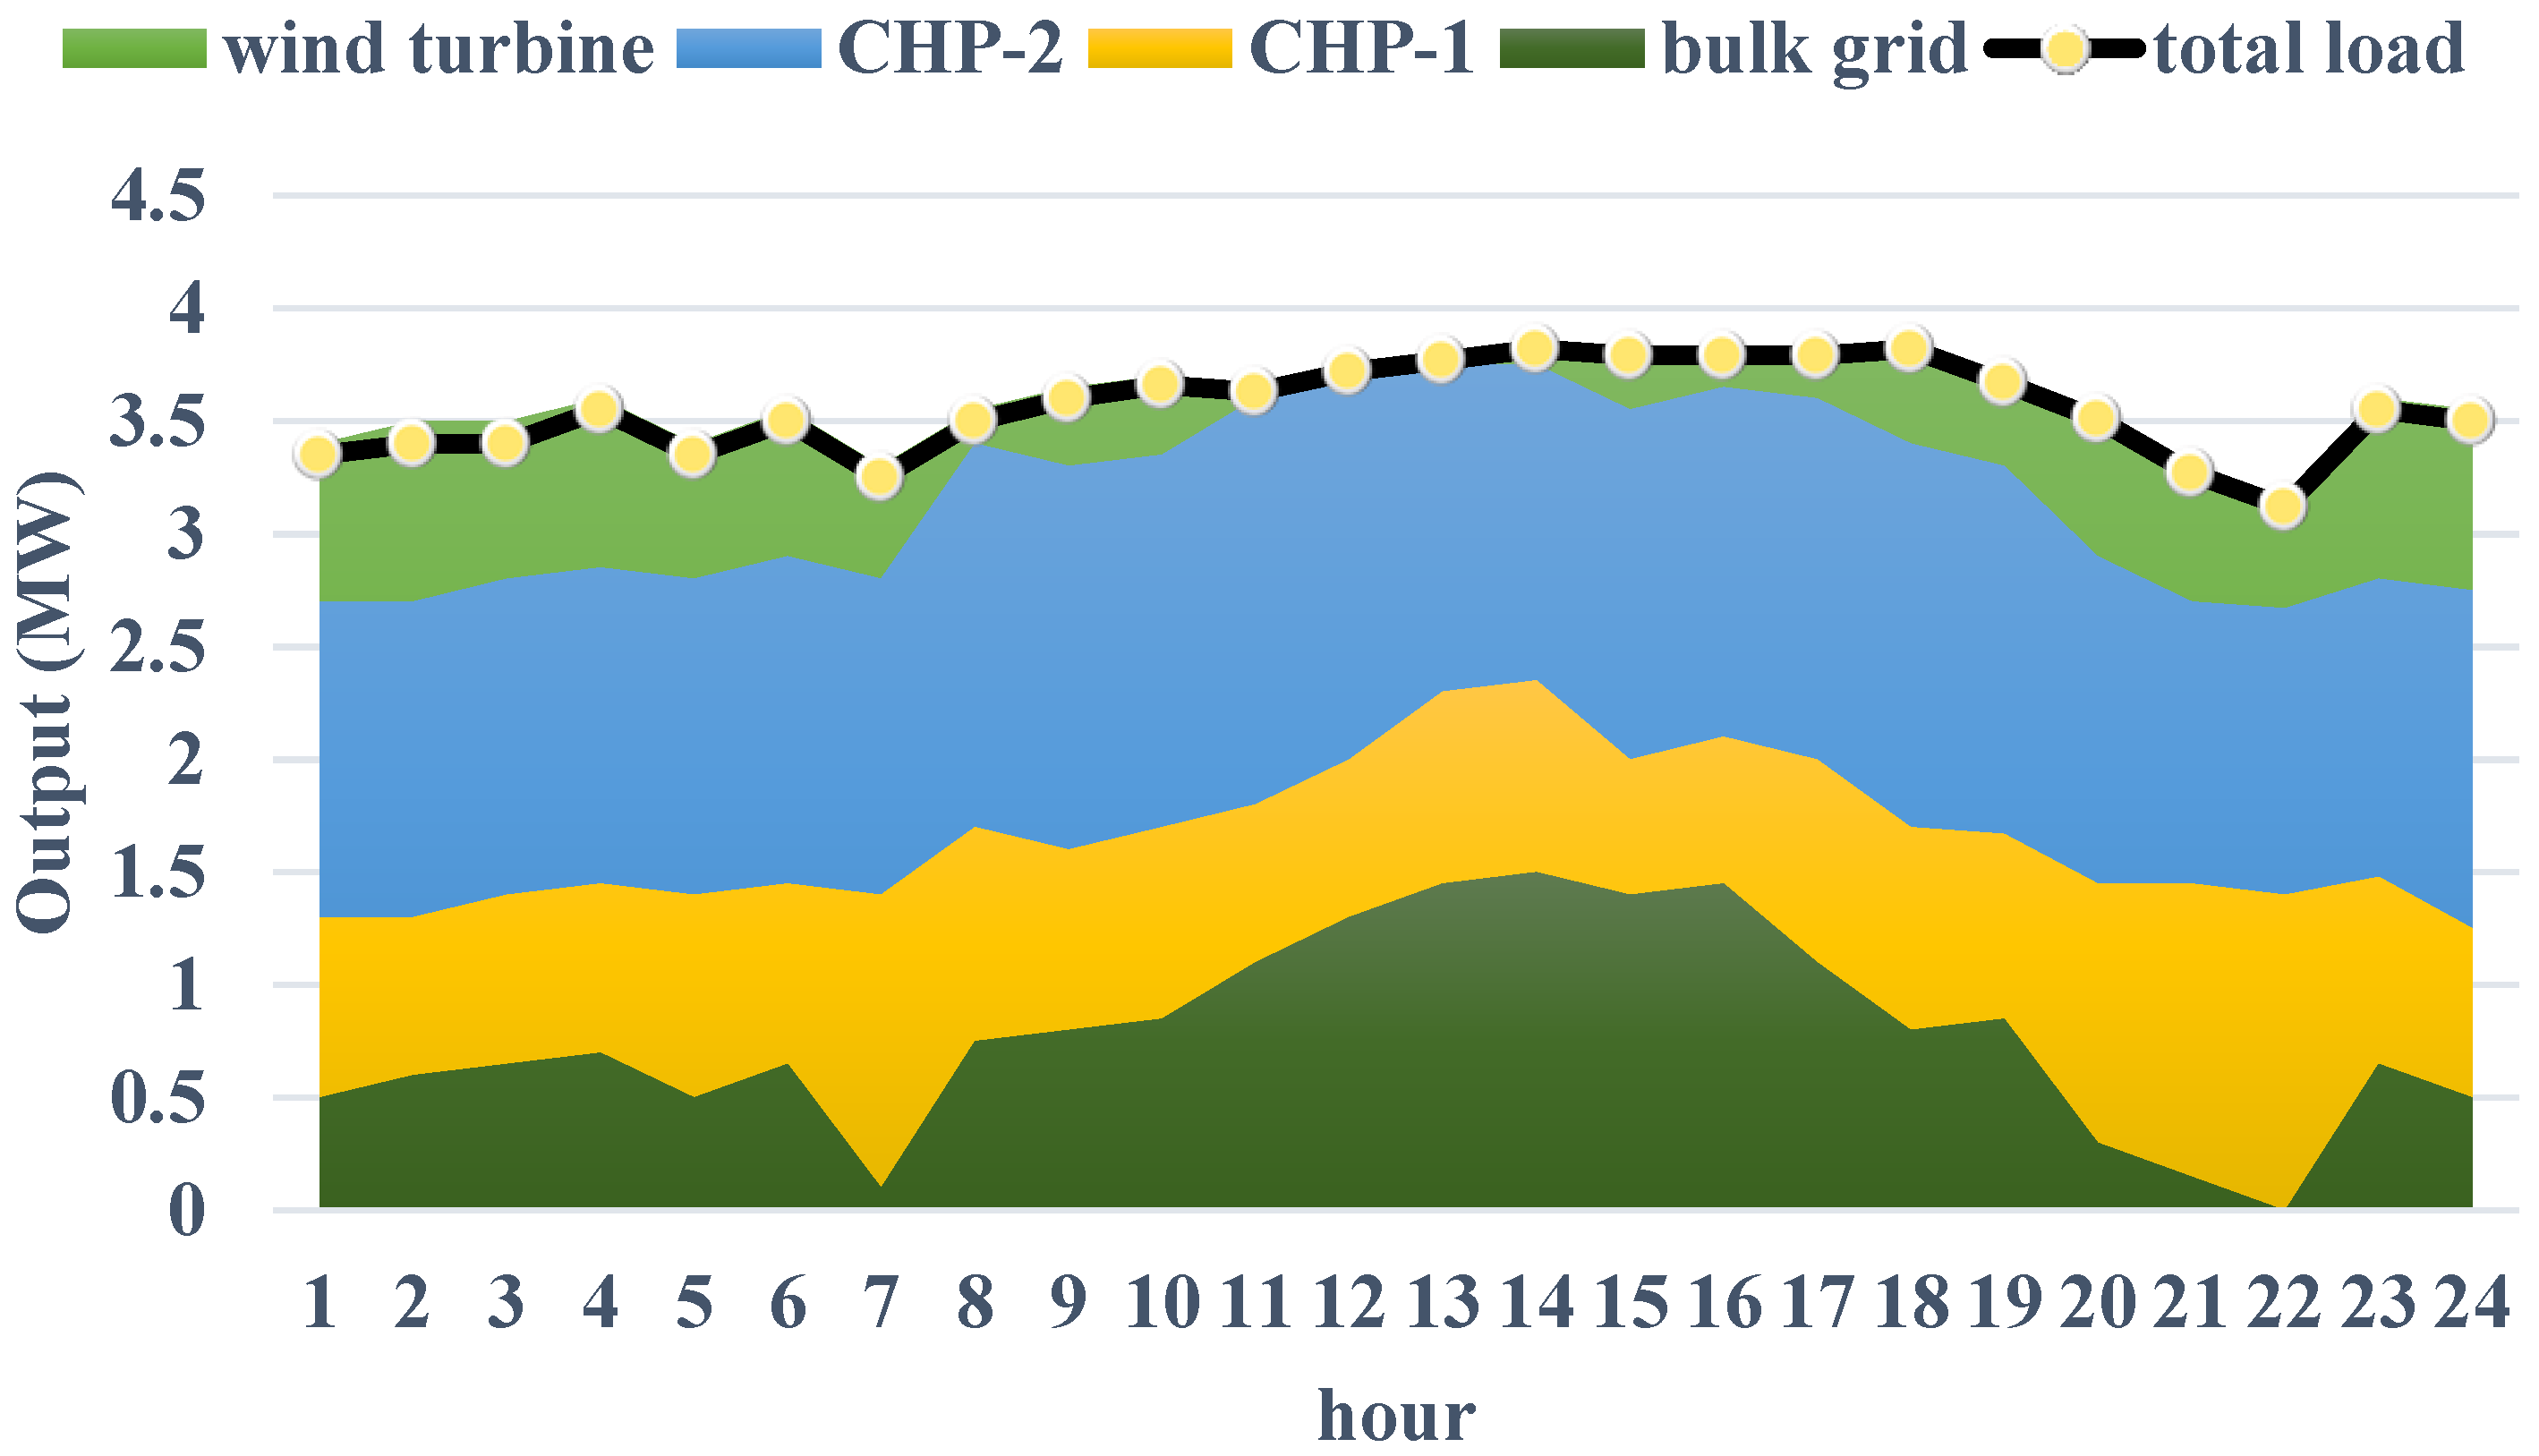
Figure 4 shows the output of the units at various time intervals in scenario 2. Figure 5 shows the accessible WT’s power during every interval, the real output of the WT in scenario one, and the real output of the WT in scenario two. In the nighttime, there is often a lot of WT’s power available. At that time, there is low ED but a high demand for heat, resulting in a rise in the CHPU’s output.
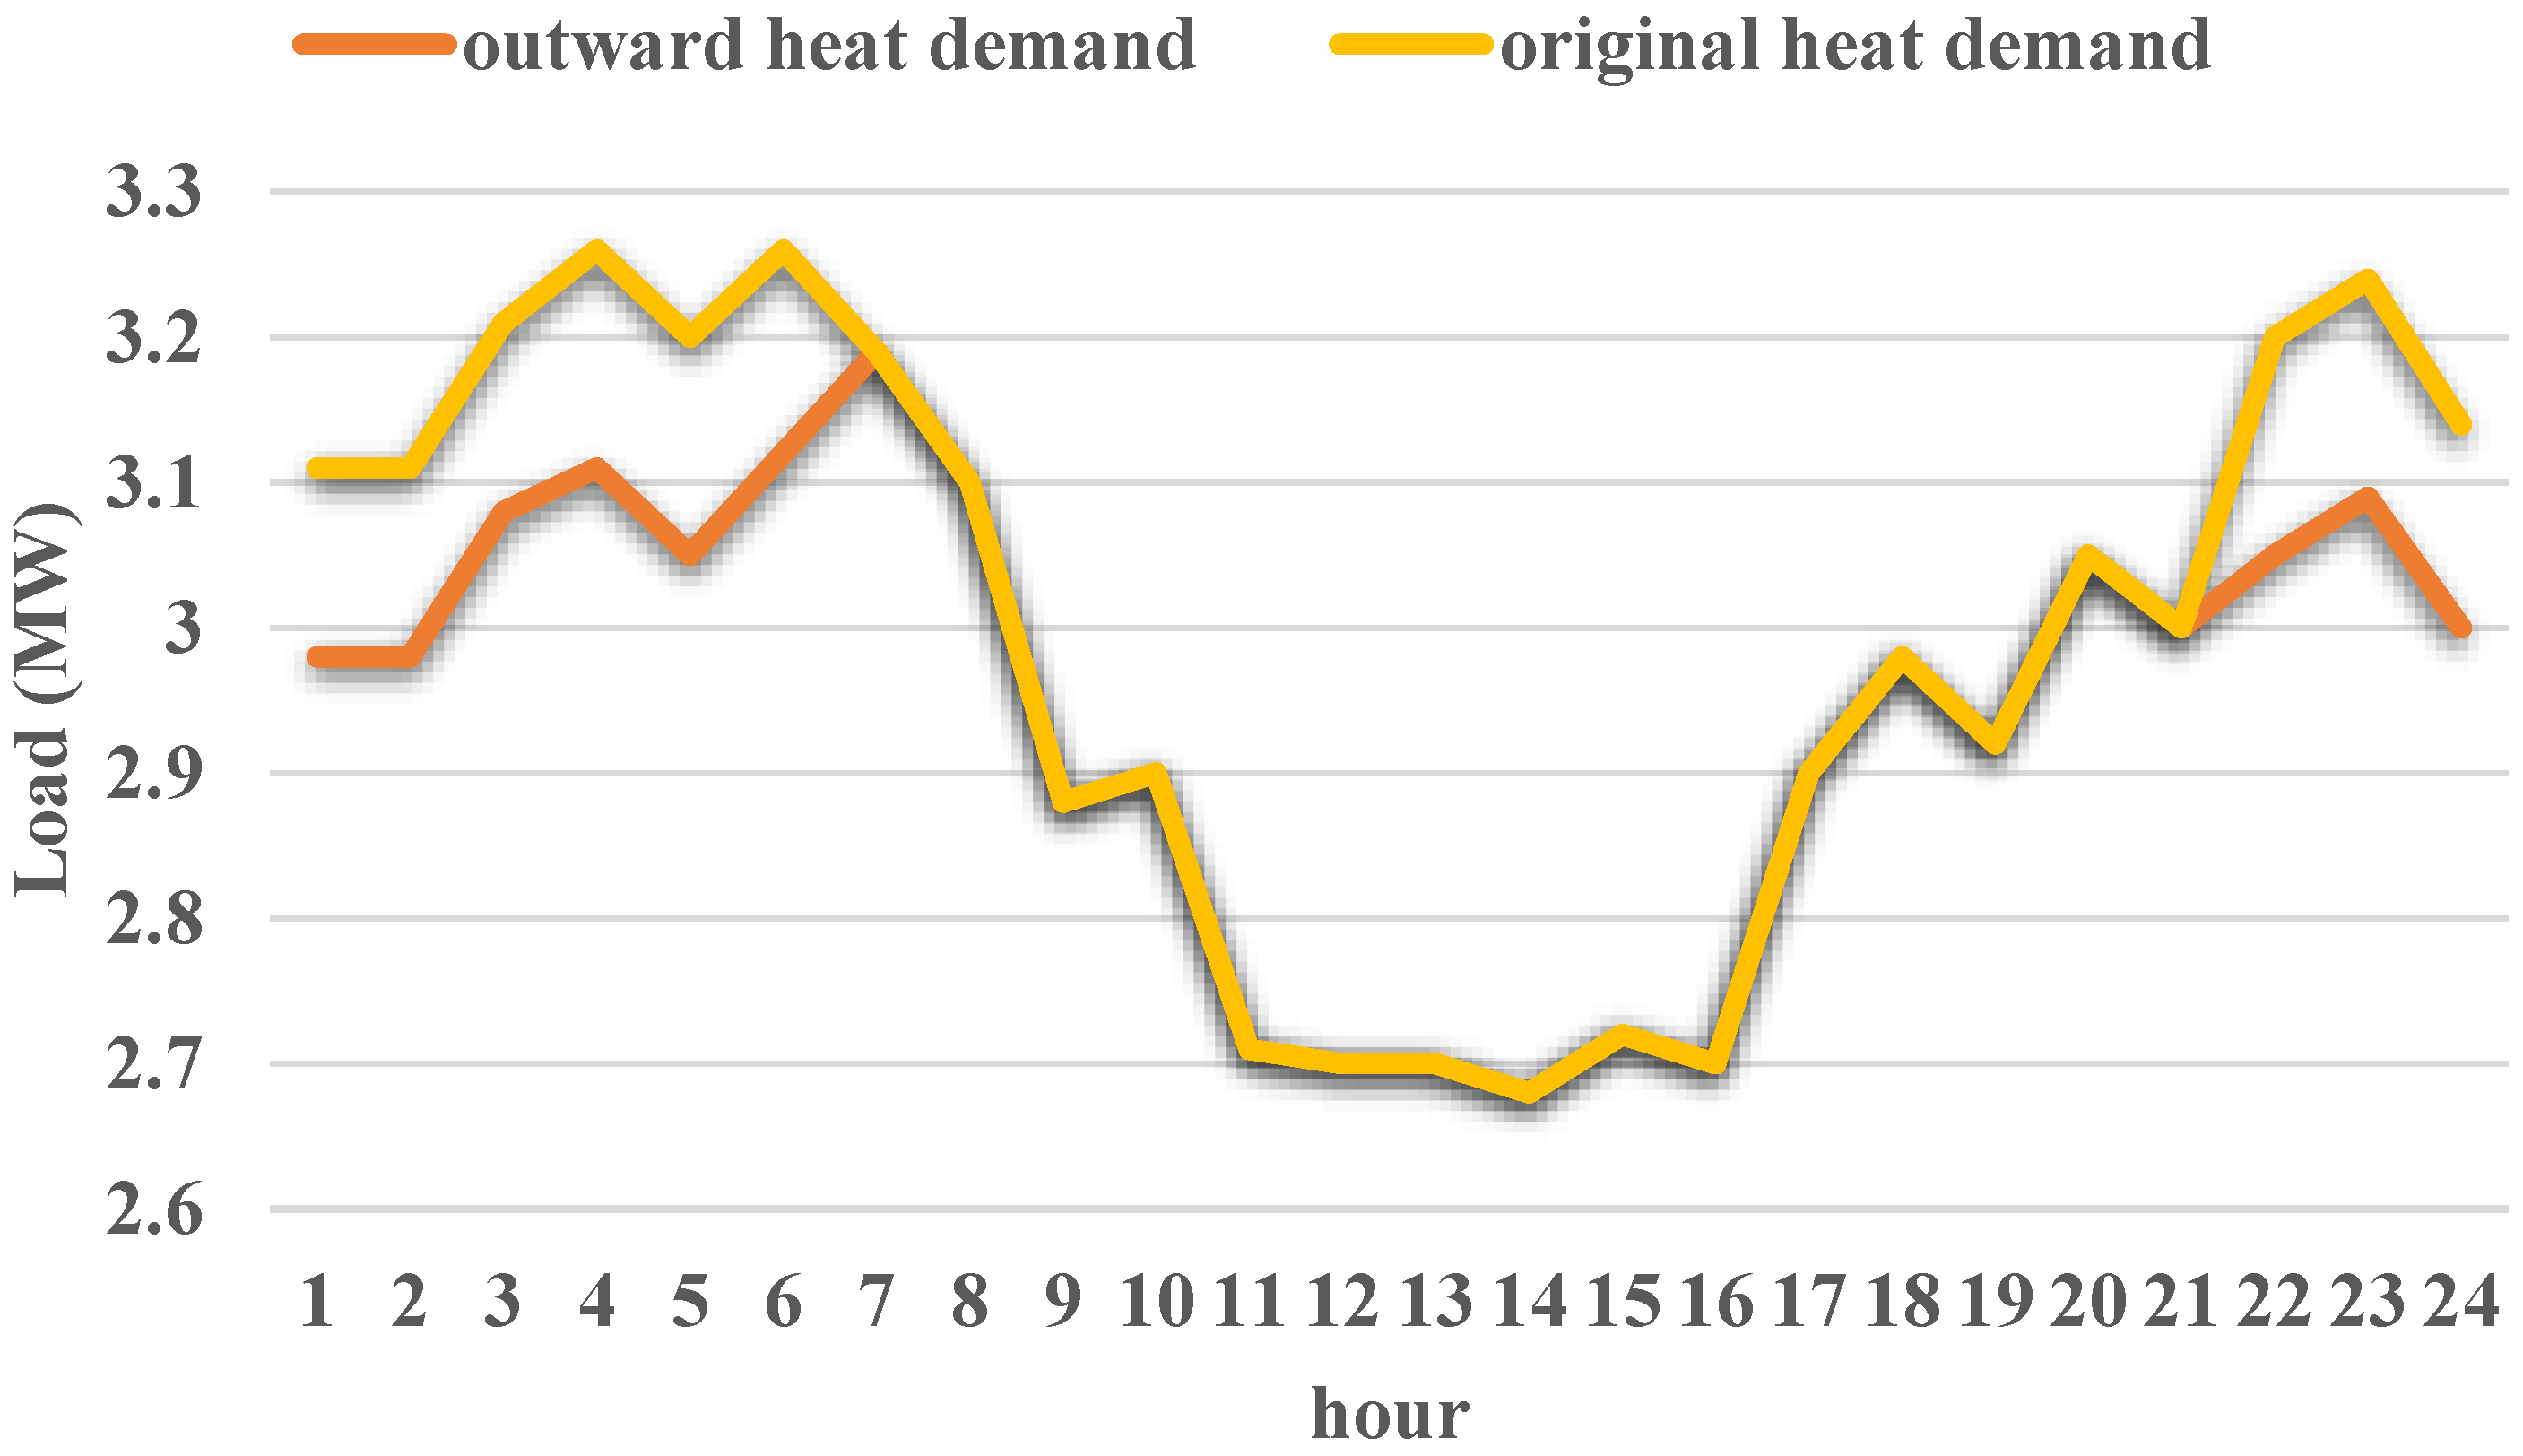
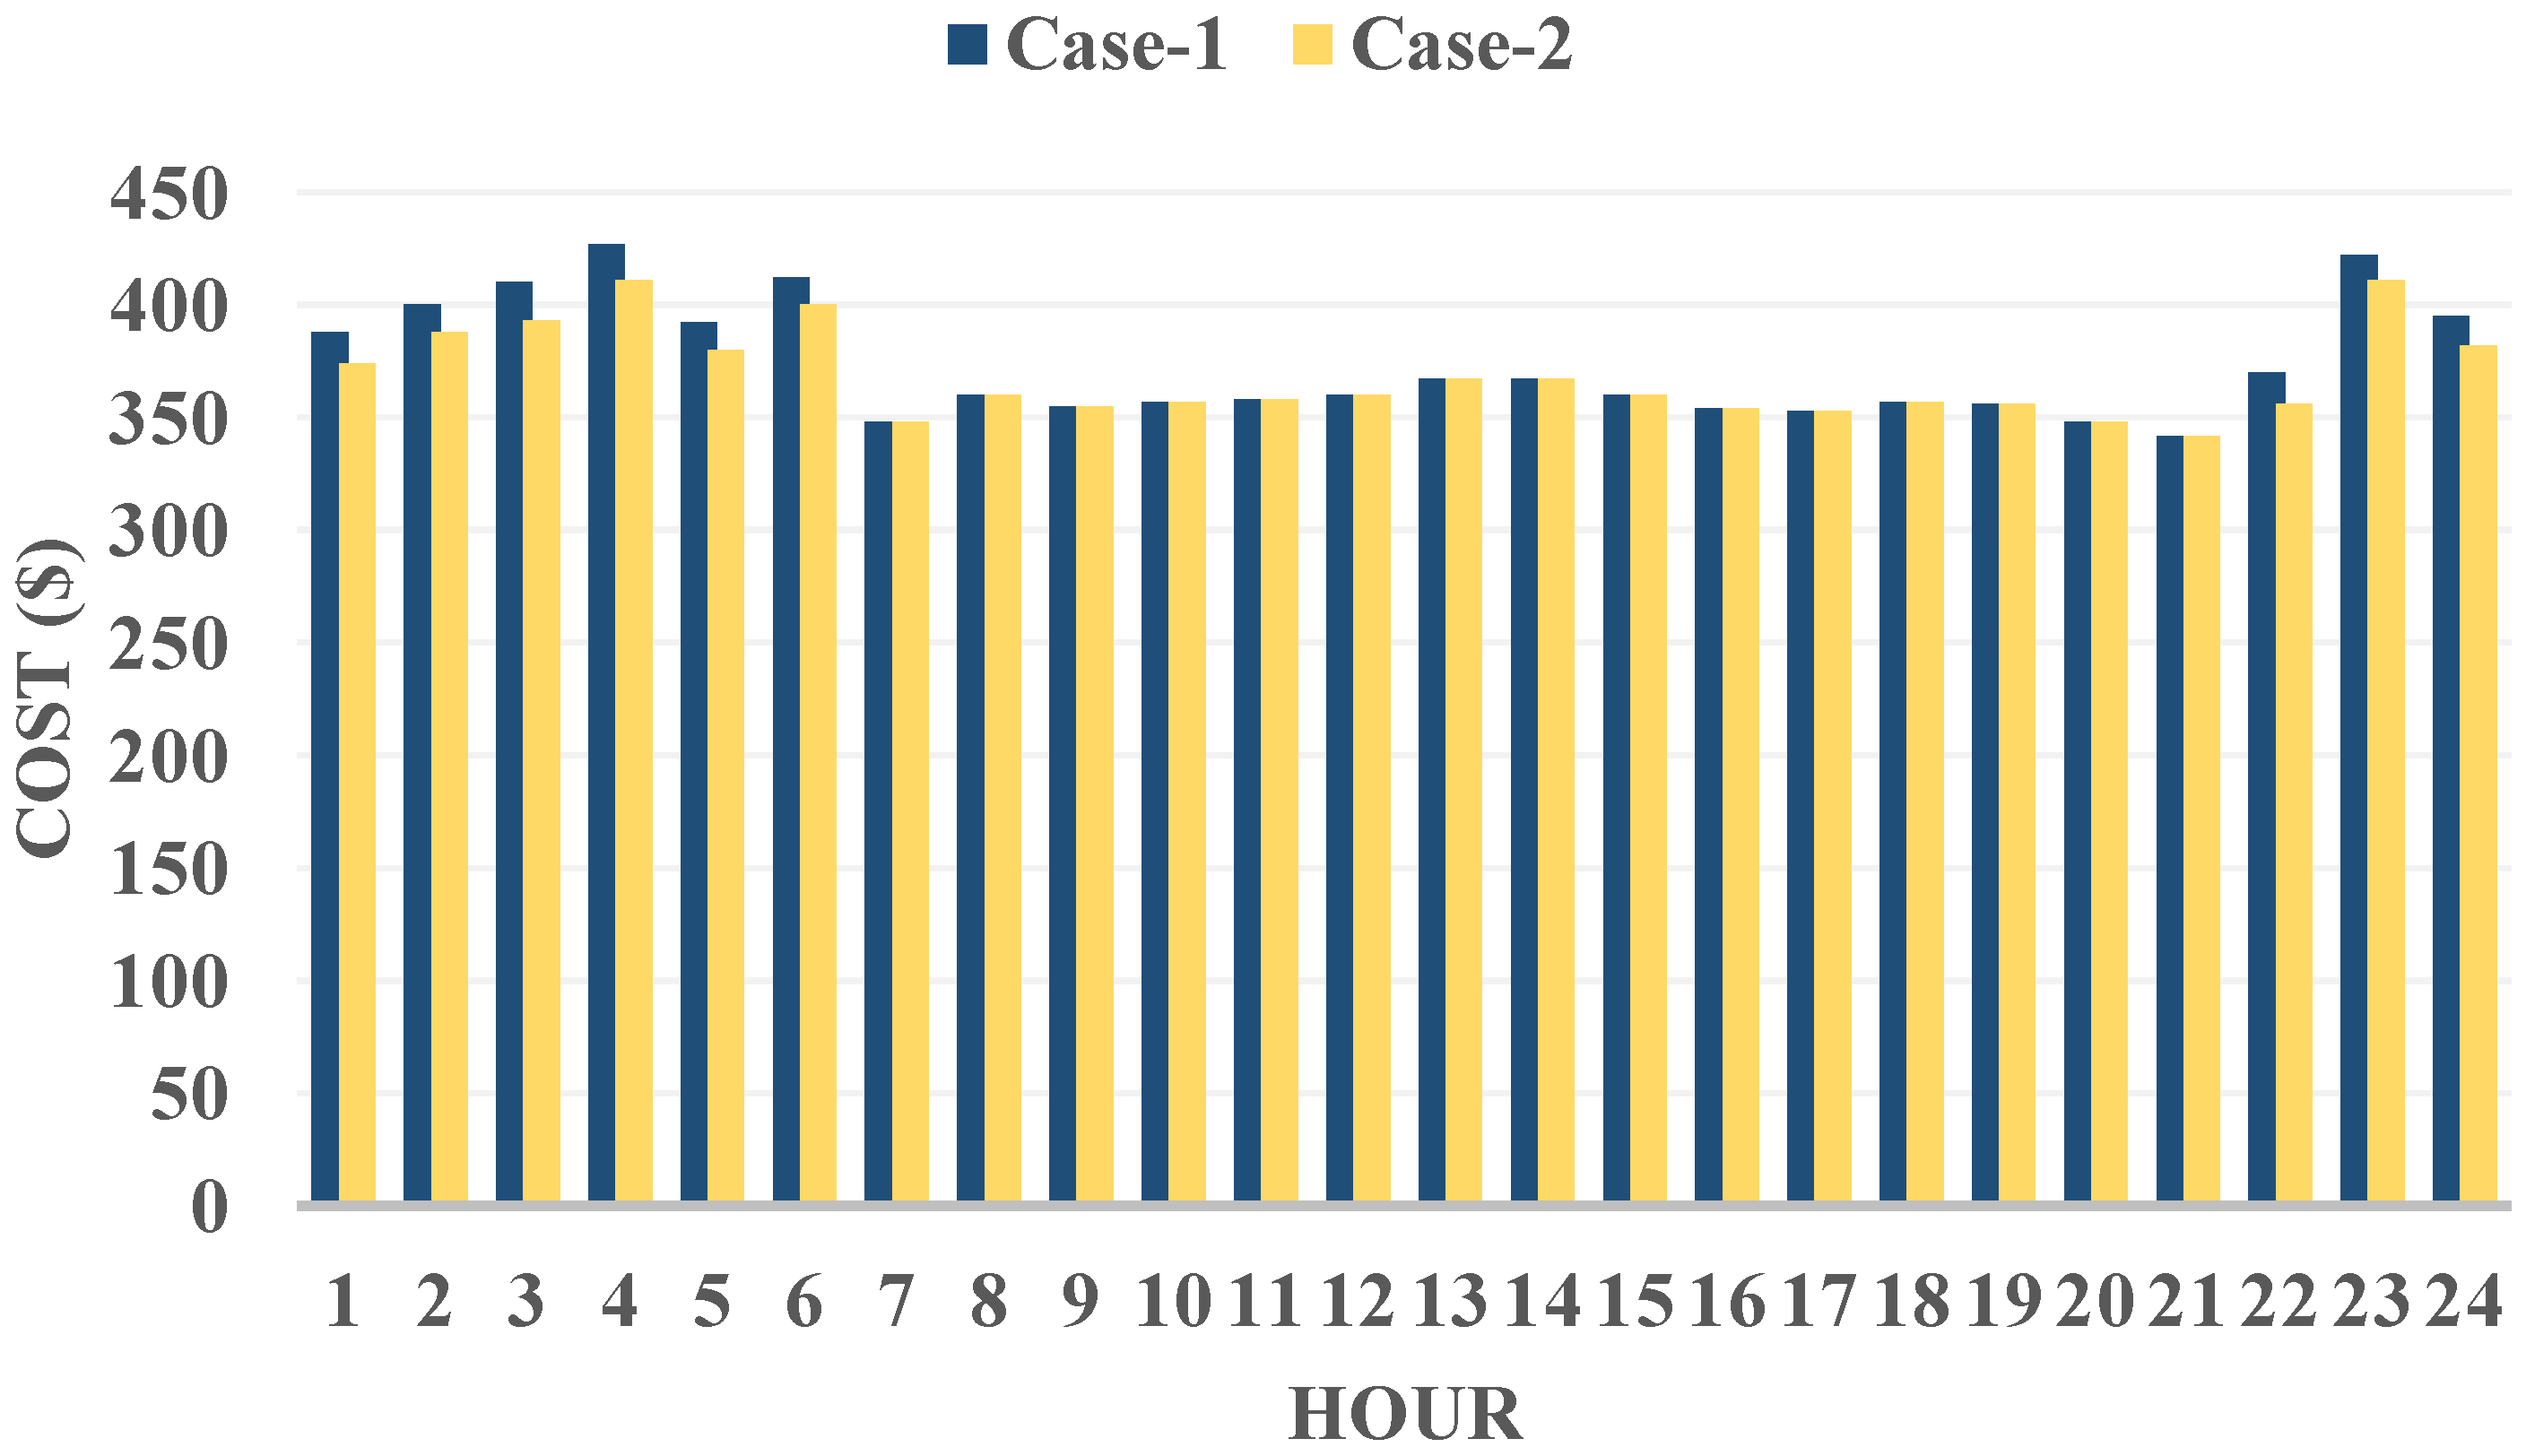
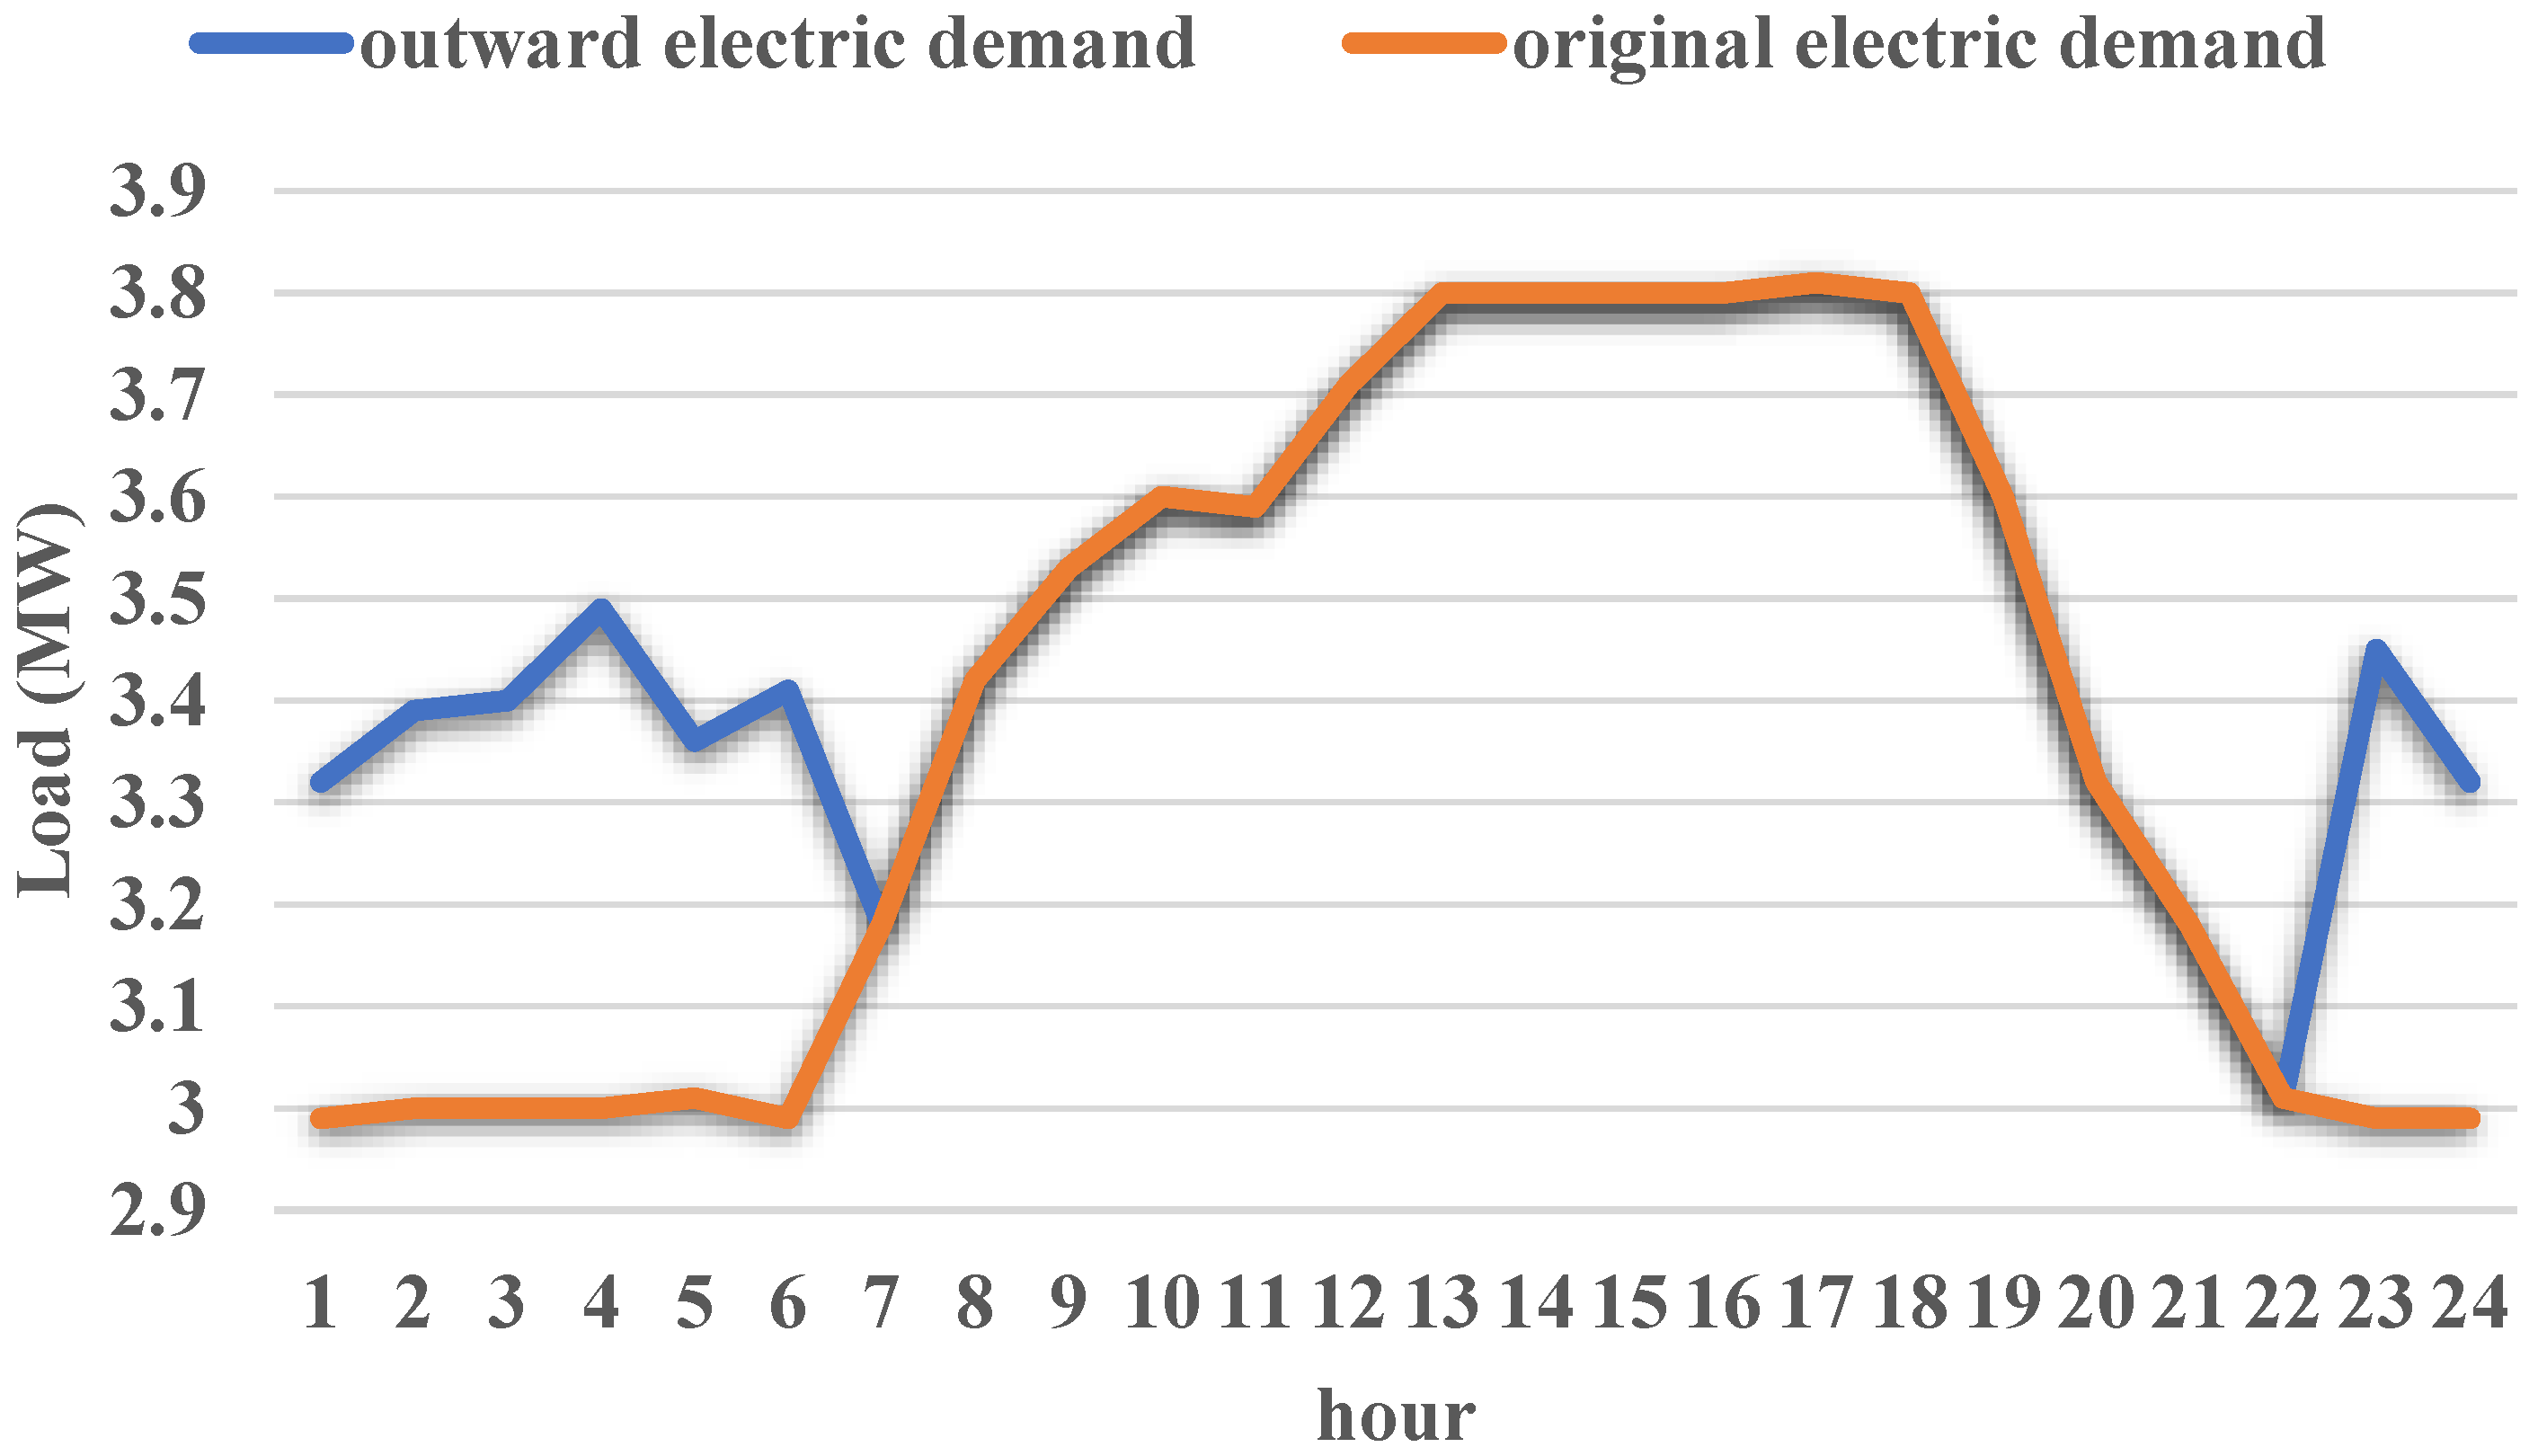
The main HD and the HD following the unified dispatch (UD) over various time periods are shown in Figure 6. The decrease in HD occurs mostly overnight whenever there is significant WT curtailment. Figure 7 shows the utilization cost curve of the UEN at various times. In the scenario of this study, the penalty cost of curtailing RE would be significant for promoting the accommodation of RE.
It should be noted that the proposed bi-level economic dispatching process offers several key advantages over the referenced bi-layer energy optimal scheduling and multi-time scale economic scheduling methods. Firstly, it capitalizes on the integration of power Internet of Things (PIoTs), allowing real-time data transmission within unified energy networks, leading to better adaptability in dynamic energy demand and supply scenarios. Secondly, the process incorporates a combined demand response (DR) strategy, optimizing both the output of demand-side equipment and integrating DR, resulting in improved load balancing and reduced peak demand. Additionally, our method optimizes the total UEN function at a higher level, considering interactions and dependencies among network components. The use of the gray wolf optimization scheme enables quick convergence to near-optimal solutions. Lastly, the proposed process is rigorously tested and verified on standard UEN and practical network scenarios, ensuring its efficiency in real-world applications. Overall, our bi-level dispatching process promises to be a practical and effective solution for energy scheduling in smart grids and microgrids [27,28].
(2)
Dispatching outcomes for Scenario 3
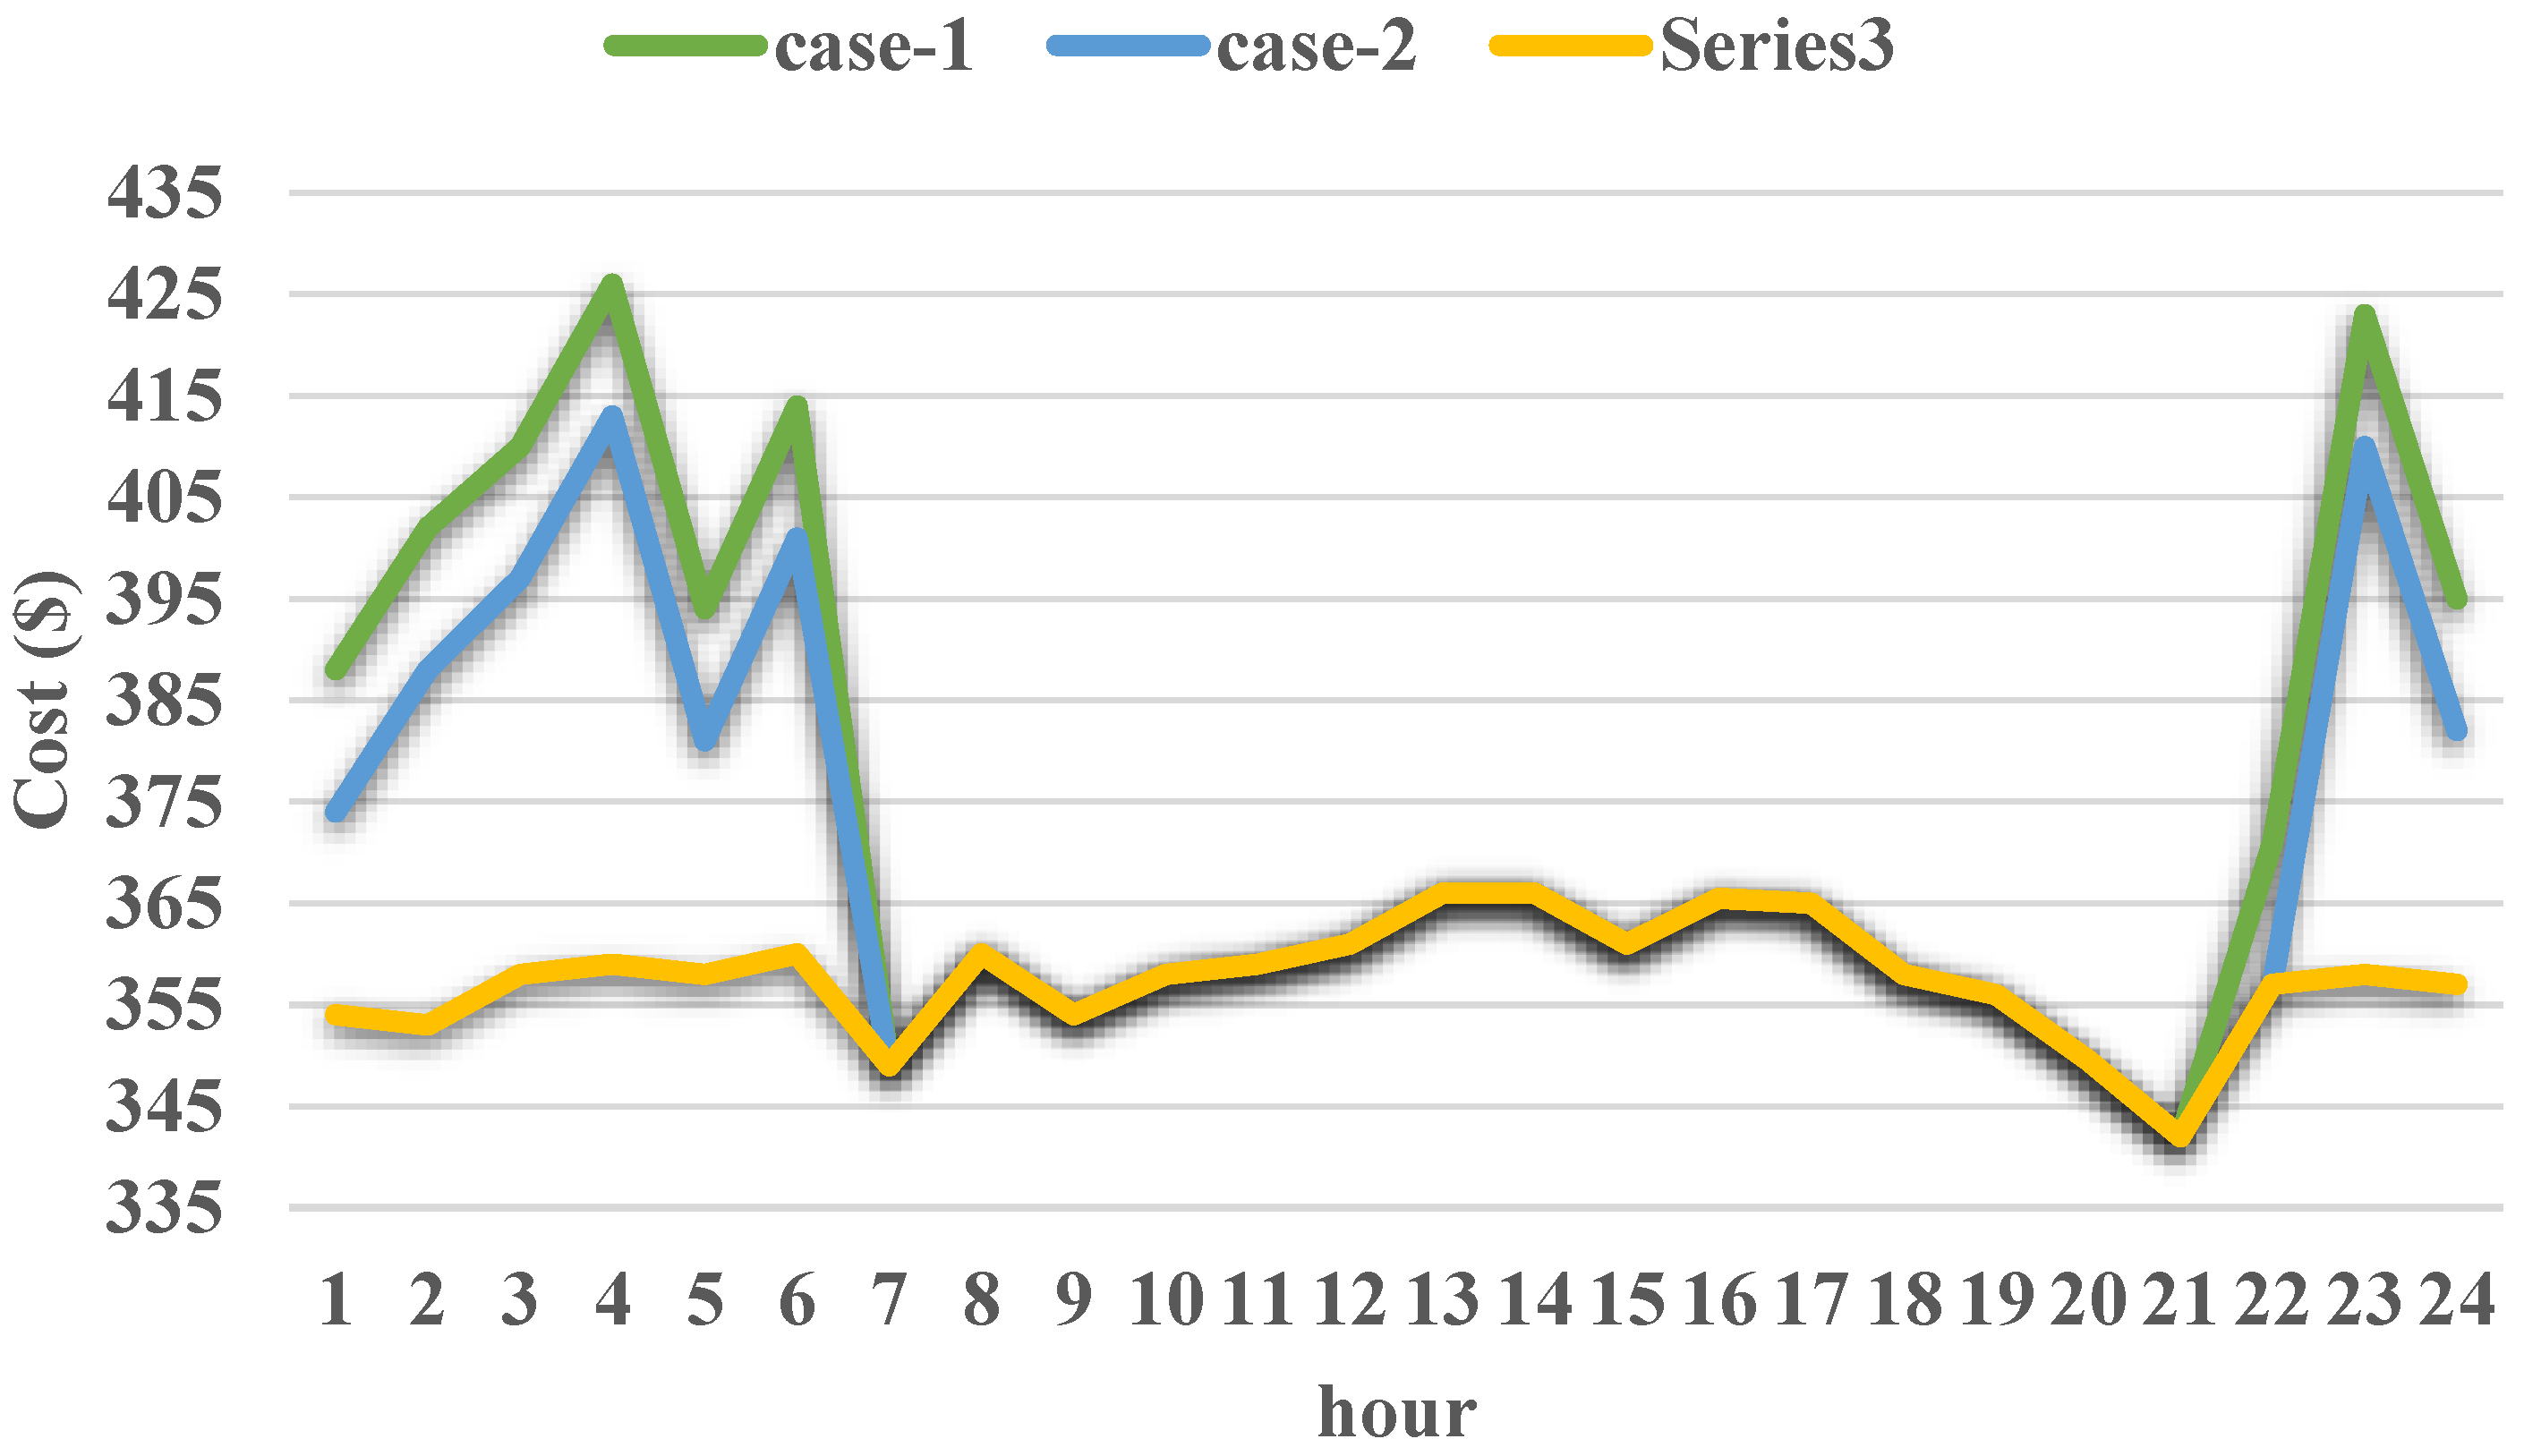
Figure 8 shows the output at various intervals in scenario 3 for the units. Figure 9 shows the accessible WT’s power at every interval, the real output of the WT in scenario one, and the real output of the WT in scenario 3. Figure 8 and Figure 9 show that, in scenario 3, there is almost no WT curtailment overnight. In comparison to scenarios 1 and 2, the UEN is capable of handling RE much more effectively, and the optimization impact can be clearly seen. Figure 10 shows the DR cost in scenario 2 and scenario 3 at various intervals. Figure 10 shows that if EBs are viewed as controllable EFs at the load stage, the heat-electric conversion will be increasingly flexible, and dispatch space will be greater. Scenario three has a lesser DR cost than Case 2, so residents’ need for TE will not be decreased significantly, and their satisfaction will not be compromised significantly. On the other hand, Figure 9 shows that in scenario 3, the UEN accommodates additional RE, thus providing a better scheduling impact.
Figure 11 and Figure 12 show the ED and HD prior to and following the UD in scenario 3. The yellow area of the figures represents the power used and produced via the EBs or other EFs on the DS. Figure 13 illustrates the utilization cost curve of the UEN at various intervals. Figure 13 shows that during intervals in which WTs are not curtailed, all three scenarios have the same operating costs. As a result of high WT’s power reduction at night, both scenarios two and three improve the accommodation of RE; however, scenario three further considers the interactions among various energy networks on the load stage.

6.2. Actual UEN

The TE system consists of a 44-tie thermal system, which contains one heat resource tie and 43 load ties. These nodes each have an EB. The electric system has one WT’s farm, one CHPU, and one conventional coal-fired generator. In addition, EESSF has been applied to the UEN to improve the dispatch’s flexibility.
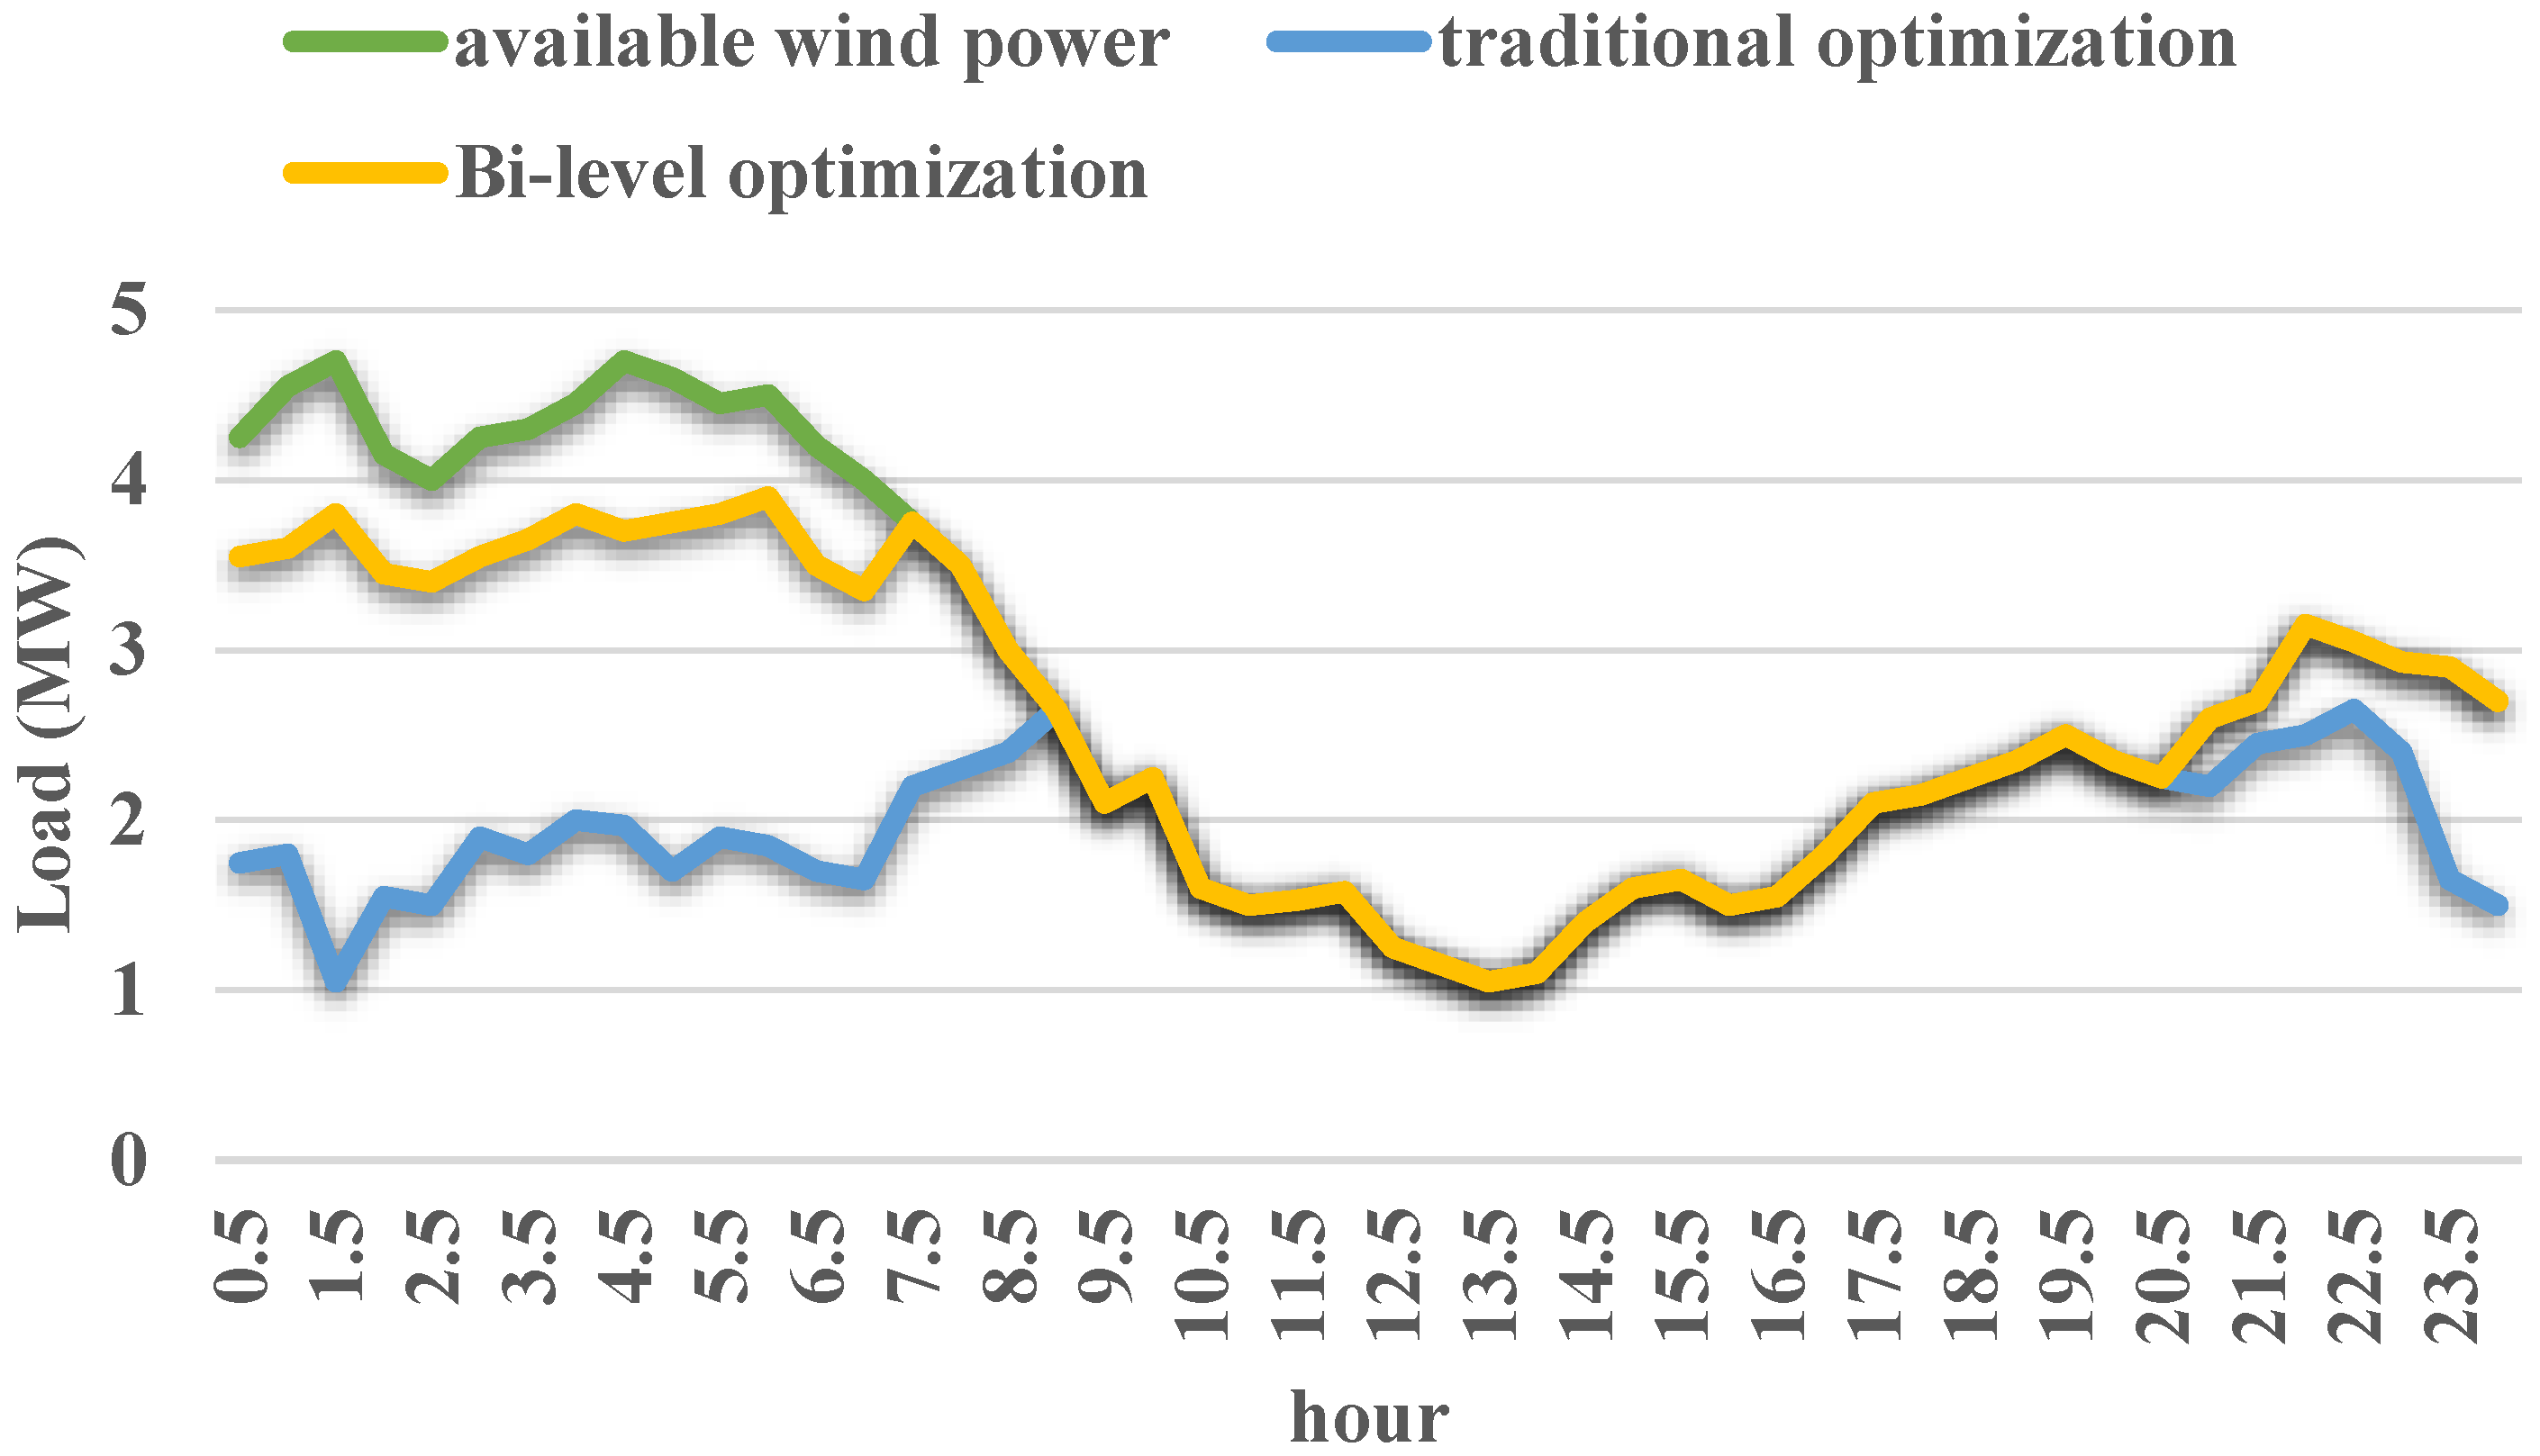
Figure 14 shows the accessible WT’s power and the real WT’s farm output. The UEN accommodates more WT power than conventional methods due to the mutable dispatch of LSFs and unified DR.

7. Conclusions

An UEND layout that works well in PIoT environments is presented in this study. The conventional UEND layout is enhanced to fully utilize the load-resource interplay and the multiple-energy supplement on the DS. In addition, the study adopts a hierarchical dispatch architecture to alleviate the data transfer pressure of PIoTs.
According to scenarios, the ULD optimizes the energy resource output of the UEN, and integrated DR has been used to adjust the multiple-energy demand. UEN’s operation costs are also reduced. By using the LLD, the multiple-energy requisition of the load responds to the upper-level cost curve without seriously compromising the users’ satisfaction. As the energy market has developed and the PIoTs scheme has been deployed, loads are able to both respond to cost signals by altering their energy demand and additionally transform the multi-energy demand into ED using coupling EFs. In addition to reducing the effect on the users’ satisfaction, the dispatch center’s DR compensation price will decrease, the UEN’s capability of accommodating RE will improve, and the operation cost will be reduced. When load-stage flexibility is fully taken into account, the suggested dispatch process provides guidelines for the optimum UEND with wide PIoTs.

Author Contributions

Conceptualization, X.Z., R.K. and Y.W.; methodology, X.Z. and Y.W.; software, X.Z., Y.W. and R.K.; validation, X.Z., Y.W. and R.K.; formal analysis, X.Z. and Y.W.; investigation, X.Z. and R.K.; resources, X.Z. and Y.W.; data curation, R.K.; writing—original draft preparation, X.Z., Y.W. and R.K.; writing—review and editing, X.Z., Y.W. and R.K.; visualization, X.Z., Y.W. and R.K.; supervision, X.Z., Y.W. and R.K.; project administration, X.Z., Y.W. and R.K.; funding acquisition, Y.W. All authors have read and agreed to the published version of the manuscript.

Funding

This research received no external funding.

Data Availability Statement

Not applicable.

Conflicts of Interest

The authors declare no conflict of interest.

References

  1. Salehi, J.; Namvar, A.; Gazijahani, F.S. Scenario-based Co-Optimization of neighboring multi carrier smart buildings under demand response exchange. J. Clean. Prod. 2019, 235, 1483–1498. [Google Scholar] [CrossRef]
  2. Dabbaghjamanesh, M.; Kavousi-Fard, A.; Zhang, J. Stochastic modeling and integration of plug-in hybrid electric vehicles in reconfigurable microgrids with deep learning-based forecasting. IEEE Trans. Intell. Transp. Syst. 2020, 22, 4394–4403. [Google Scholar] [CrossRef]
  3. Dabbaghjamanesh, M.; Moeini, A.; Kavousi-Fard, A.; Jolfaei, A. Real-time monitoring and operation of microgrid using distributed cloud–fog architecture. J. Parallel Distrib. Comput. 2020, 146, 15–24. [Google Scholar] [CrossRef]
  4. Zhao, H.; Wang, Z.; Zhu, M.; Zhou, X.; Li, Y.; Zhang, T.; Yuan, H. Application of 5G communication technology in ubiquitous power internet of things. In Proceedings of the 2020 Asia Energy and Electrical Engineering Symposium (AEEES), Chengdu, China, 29 May 2020; IEEE: Piscataway, NJ, USA, 2000; pp. 618–624. [Google Scholar]
  5. Ahmad, T.; Zhang, D. Using the internet of things in smart energy systems and networks. Sustain. Cities Soc. 2021, 68, 102783. [Google Scholar] [CrossRef]
  6. Alowaidi, M. Fuzzy efficient energy algorithm in smart home environment using Internet of Things for renewable energy resources. Energy Rep. 2022, 8, 2462–2471. [Google Scholar] [CrossRef]
  7. Mohammadi, M.; Kavousi-Fard, A.; Dabbaghjamanesh, M.; Farughian, A.; Khosravi, A. Effective management of energy internet in renewable hybrid microgrids: A secured data driven resilient architecture. IEEE Trans. Ind. Inform. 2021, 18, 1896–1904. [Google Scholar] [CrossRef]
  8. Kong, X.; Sun, F.; Huo, X.; Li, X.; Shen, Y. Hierarchical optimal scheduling method of heat-electricity integrated energy system based on Power Internet of Things. Energy 2020, 210, 118590. [Google Scholar] [CrossRef]
  9. Li, P.; Li, S.; Yu, H.; Yan, J.; Ji, H.; Wu, J.; Wang, C. Quantized event-driven simulation for integrated energy systems with hybrid continuous-discrete dynamics. Appl. Energy 2022, 307, 118268. [Google Scholar] [CrossRef]
  10. Guo, Z.; Zhang, R.; Wang, L.; Zeng, S.; Li, Y. Optimal operation of regional integrated energy system considering demand response. Appl. Therm. Eng. 2021, 191, 116860. [Google Scholar] [CrossRef]
  11. Dabbaghjamanesh, M.; Kavousi-Fard, A.; Mehraeen, S.; Zhang, J.; Dong, Z.Y. Sensitivity analysis of renewable energy integration on stochastic energy management of automated reconfigurable hybrid AC–DC microgrid considering DLR security constraint. IEEE Trans. Ind. Inform. 2019, 16, 120–131. [Google Scholar] [CrossRef]
  12. Dabbaghjamanesh, M.; Kavousi-Fard, A.; Mehraeen, S. Effective scheduling of reconfigurable microgrids with dynamic thermal line rating. IEEE Trans. Ind. Electron. 2018, 66, 1552–1564. [Google Scholar] [CrossRef]
  13. Li, P.; Wang, Z.; Wang, J.; Yang, W.; Guo, T.; Yin, Y. Two-stage optimal operation of integrated energy system considering multiple uncertainties and integrated demand response. Energy 2021, 225, 120256. [Google Scholar] [CrossRef]
  14. Vahedipour-Dahraie, M.; Rashidizadeh-Kermani, H.; Shafie-Khah, M.; Catalão, J.P. Risk-averse optimal energy and reserve scheduling for virtual power plants incorporating demand response programs. IEEE Trans. Smart Grid 2020, 12, 1405–1415. [Google Scholar] [CrossRef]
  15. Yang, W.; Li, N.; Qi, Y.; Qardaji, W.; McLaughlin, S.; McDaniel, P. Minimizing private data disclosures in the smart grid. In Proceedings of the 2012 ACM Conference on Computer and Communications Security, Raleigh, NA, USA, 16–18 October 2012; pp. 415–427. [Google Scholar]
  16. Luo, L.; Abdulkareem, S.S.; Rezvani, A.; Miveh, M.R.; Samad, S.; Aljojo, N.; Pazhoohesh, M. Optimal scheduling of a renewable based microgrid considering photovoltaic system and battery energy storage under uncertainty. J. Energy Storage 2020, 28, 101306. [Google Scholar] [CrossRef]
  17. Talebi, A.; Sadeghi-Yazdankhah, A.; Mirzaei, M.A.; Mohammadi-Ivatloo, B. Co-optimization of electricity and natural gas networks considering ac constraints and natural gas storage. In Proceedings of the 2018 Smart Grid Conference (SGC), Sanandaj, Iran, 28 November 2018; IEEE: Piscataway, NJ, USA, 2018; pp. 1–6. [Google Scholar]
  18. Nezhad, A.E.; Rahimnejad, A.; Gadsden, S.A. Home energy management system for smart buildings with inverter-based air conditioning system. Int. J. Electr. Power Energy Syst. 2021, 133, 107230. [Google Scholar] [CrossRef]
  19. Zhu, M.; Li, J. Integrated dispatch for combined heat and power with thermal energy storage considering heat transfer delay. Energy 2022, 244, 123230. [Google Scholar] [CrossRef]
  20. Khan, H.W.; Usman, M.; Hafeez, G.; Albogamy, F.R.; Khan, I.; Shafiq, Z.; Khan, M.U.; Alkhammash, H.I. Intelligent optimization framework for efficient demand-side management in renewable energy integrated smart grid. IEEE Access 2021, 9, 124235–124252. [Google Scholar] [CrossRef]
  21. Wei, Z.; Sun, J.; Ma, Z.; Sun, G.; Zang, H.; Chen, S.; Zhang, S.; Cheung, K.W. Chance-constrained coordinated optimization for urban electricity and heat networks. CSEE J. Power Energy Syst. 2018, 4, 399–407. [Google Scholar] [CrossRef]
  22. Vandermeulen, A.; van der Heijde, B.; Helsen, L. Controlling district heating and cooling networks to unlock flexibility: A review. Energy 2018, 151, 103–115. [Google Scholar] [CrossRef]
  23. Rezaie, B.; Reddy, B.V.; Rosen, M.A. Configurations for multiple thermal energy storages in thermal networks. Int. J. Process Syst. Eng. 2015, 3, 191–206. [Google Scholar] [CrossRef]
  24. Mirjalili, S.; Mirjalili, S.M.; Lewis, A. Grey wolf optimizer. Adv. Eng. Softw. 2014, 69, 46–61. [Google Scholar] [CrossRef]
  25. Reddy, A.S.; Reddy, M.D.; Reddy, Y.K. Feeder Reconfiguration of Distribution Systems for Loss Reduction and Emissions Reduction using MVO Algorithm. Majlesi J. Electr. Eng. 2018, 12, 1–8. [Google Scholar]
  26. Ayele, G.T.; Haurant, P.; Laumert, B.; Lacarriere, B. An extended energy hub approach for load flow analysis of highly coupled district energy networks: Illustration with electricity and heating. Appl. Energy 2018, 212, 850–867. [Google Scholar] [CrossRef]
  27. Zhang, J.; Kong, D.; He, Y.; Fu, X.; Zhao, X.; Yao, G.; Teng, F.; Qin, Y. Bi-layer energy optimal scheduling of regional integrated energy system considering variable correlations. Int. J. Electr. Power Energy Syst. 2023, 148, 108840. [Google Scholar] [CrossRef]
  28. Zhang, J.; Qin, D.; Ye, Y.; He, Y.; Fu, X.; Yang, J.; Shi, G.; Zhang, H. Multi-time scale economic scheduling method based on day-ahead robust optimization and intraday MPC rolling optimization for microgrid. IEEE Access 2021, 9, 140315–140324. [Google Scholar] [CrossRef]
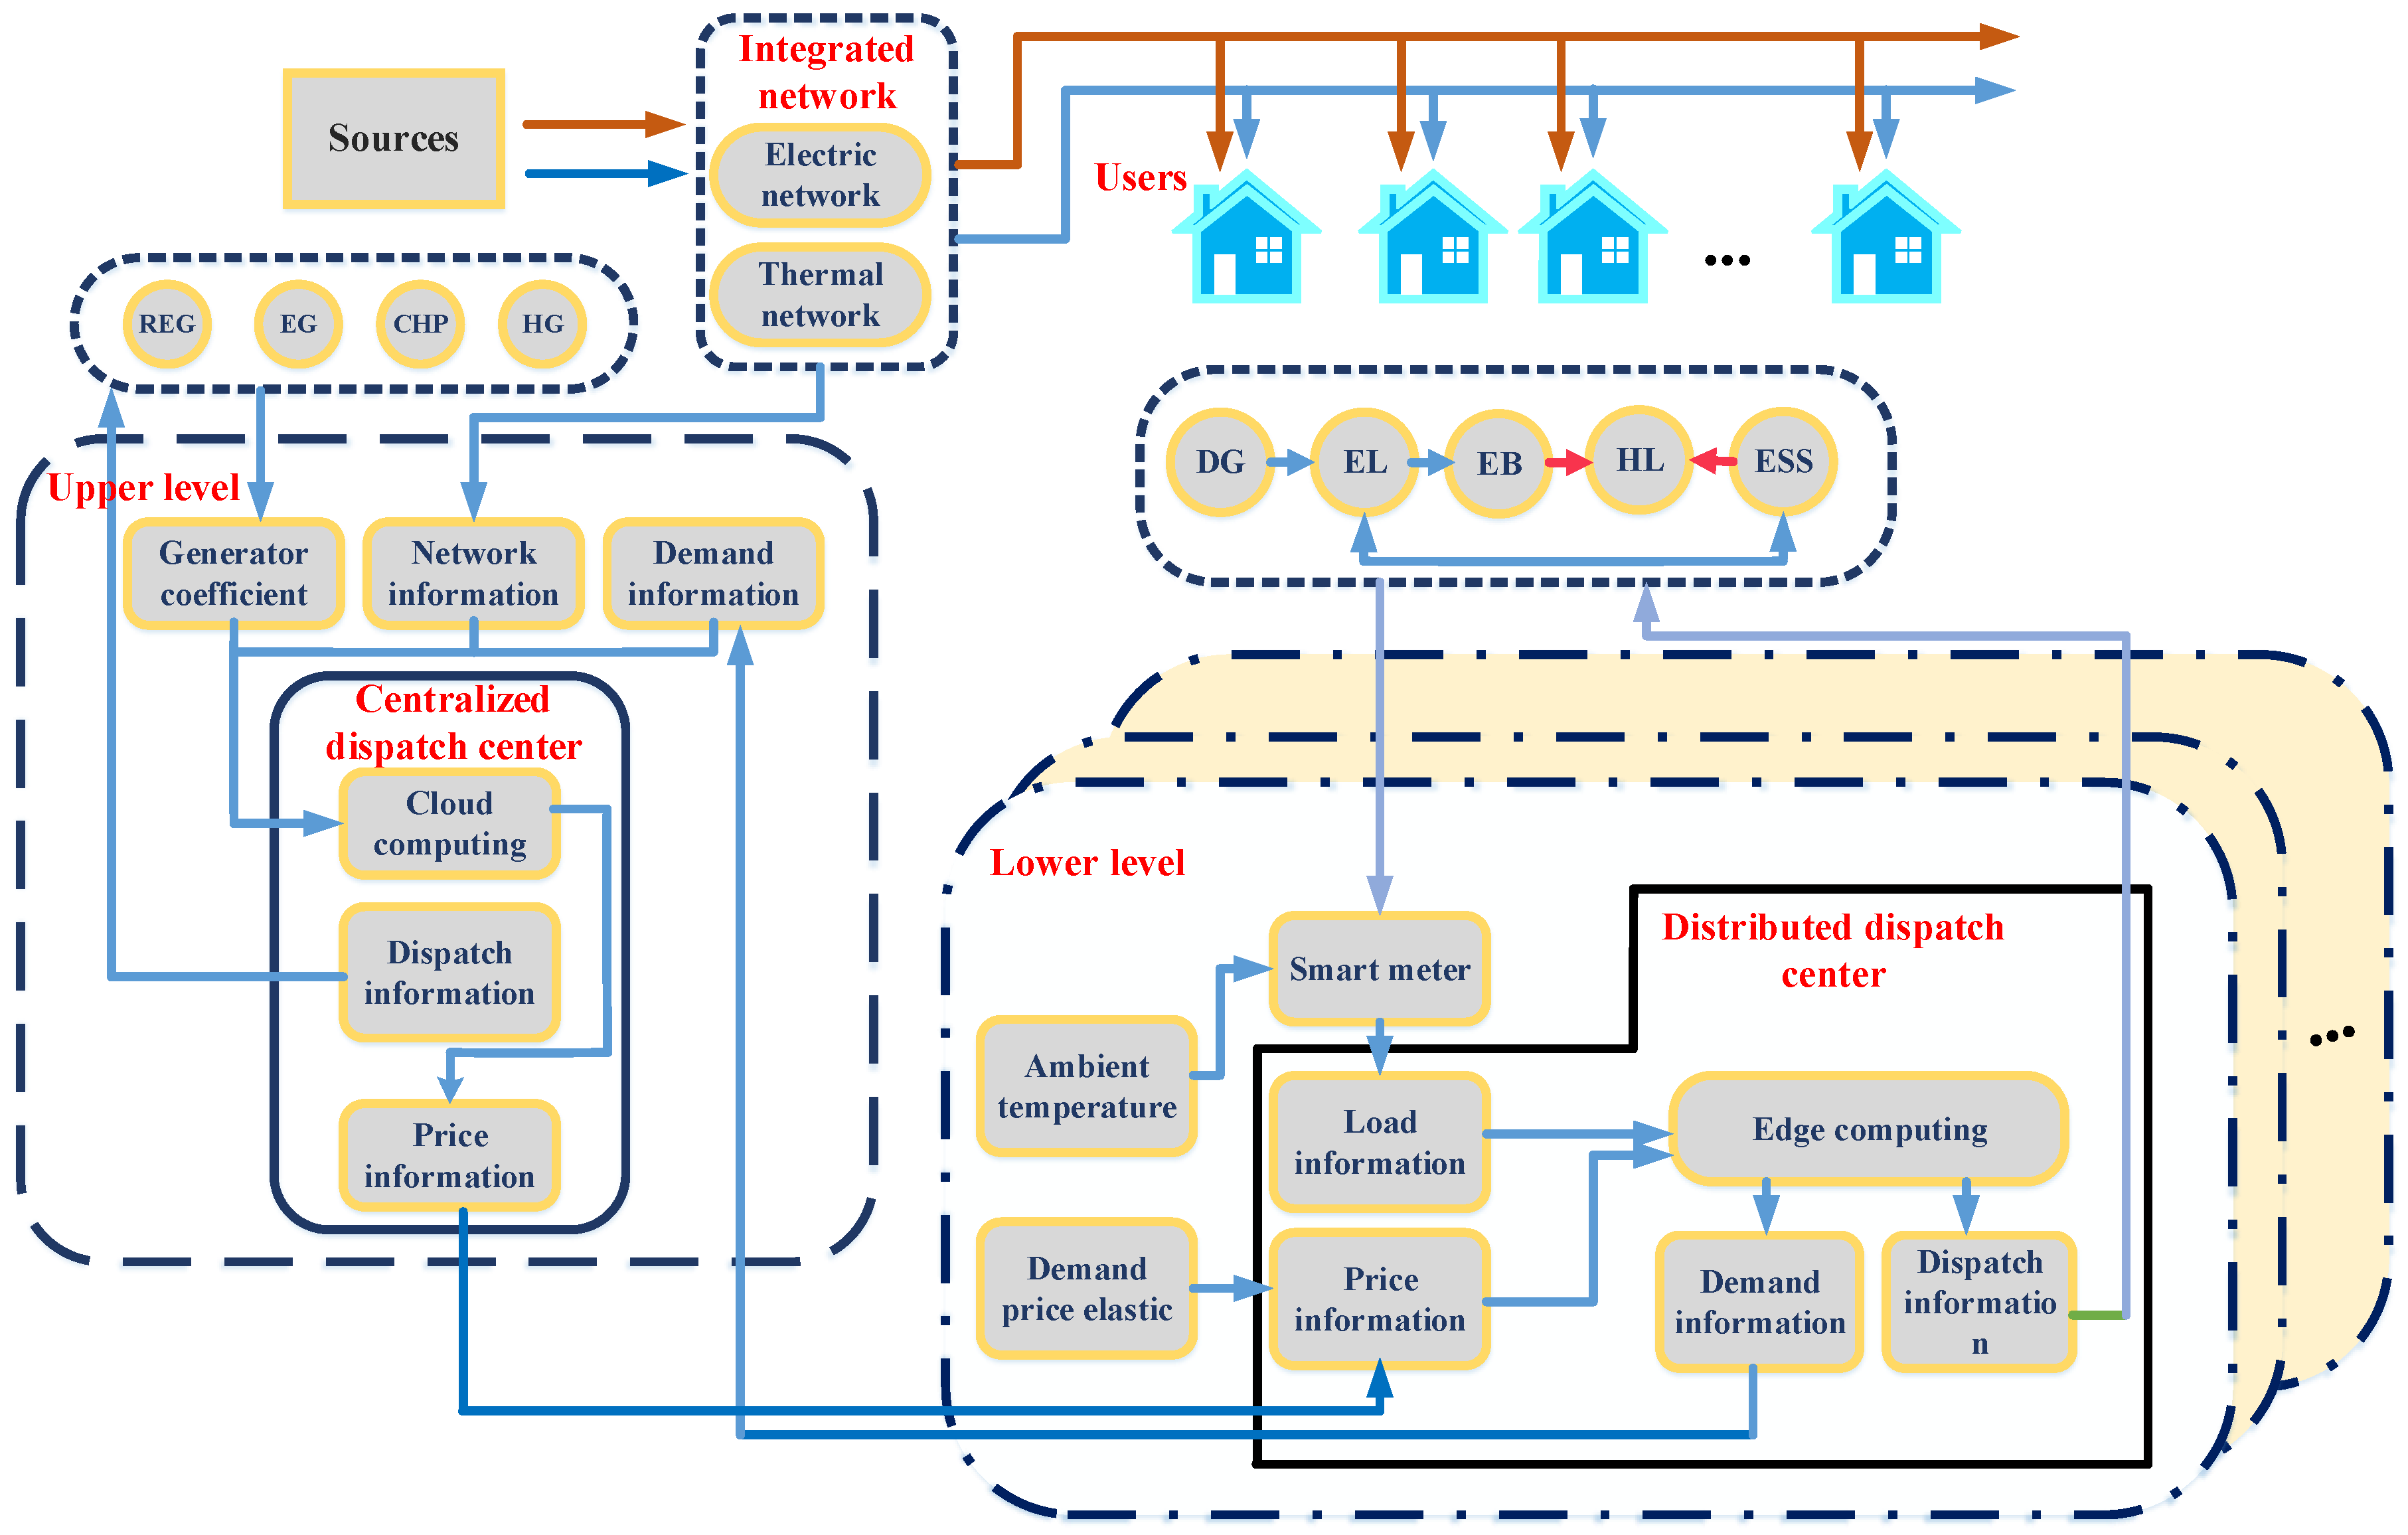
Figure 1. Hierarchical UEND architecture with PIoTs in the energy hub concept.
Systems 11 00432 g001
Figure 2. The topology of the scenario.
Systems 11 00432 g002
Figure 3. Electrical and thermic prices at various times.
Systems 11 00432 g003
Figure 4. The output of the units in scenario-2.
Systems 11 00432 g004
Figure 5. Comparing the WT’s power accommodation in scenario-1 and scenario-2.
Systems 11 00432 g005
Figure 6. Comparing the HD prior to and following the UD.
Systems 11 00432 g006
Figure 7. Operation cost at various time periods in scenario-1 and scenario-2.
Systems 11 00432 g007
Figure 8. The output of the agents in scenario-3.
Systems 11 00432 g008
Figure 9. Comparing the WT’s power accommodation in scenario-1 and scenario-2.
Systems 11 00432 g009
Figure 10. The DR price in scenario-2 and scenario-3.
Systems 11 00432 g010
Figure 11. Comparing the ED prior to and following the UD.
Systems 11 00432 g011
Figure 12. Comparing the HD prior to and following the UD.
Systems 11 00432 g012
Figure 13. Operation cost in various time intervals in scenario-1, scenario-2 and scenario-3.
Systems 11 00432 g013
Figure 14. WT’s power accommodation at various optimization processes.
Systems 11 00432 g014
Table 1. Ratios of EFs.
EFsEBCHPU-1CHPU-2Heat Resource
Cost
computation
coefficients
c 0 0505025
c 1 1.41512.512
c 2 6211
c 3 -1.51.2-
c 4 -0.10.1-
c 5 -0.50.5-
Coupling
coefficients
Z --8.3-
c m -1.3--
Minimum
output (MW)
H 0.050.201.1
E −0.050.150.42
Maximum
output (MW)
H 0.050.651.451.1
E −0.050.50.6
Disclaimer/Publisher’s Note: The statements, opinions and data contained in all publications are solely those of the individual author(s) and contributor(s) and not of MDPI and/or the editor(s). MDPI and/or the editor(s) disclaim responsibility for any injury to people or property resulting from any ideas, methods, instructions or products referred to in the content.