1. Introduction
E-commerce has become a popular way to shop. The global e-commerce market is expected to exceed USD 5.7 trillion in 2022 and continue to grow in the coming years [
1]. China has the world’s largest group of digital shoppers (850 million people); online retail sales in China are even higher at CNY 13.79 trillion in 2022, while cross-border e-commerce imports and exports (including B2B) are CNY 2.11 trillion, both showing steady growth, according to the national online retail market development condition published by the Chinese Ministry of Commerce in 2023 [
2]. As a result, online shopping has become a revolutionary way for customers to shop and an important alternative to the traditional market [
3]. It is well known that the majority of customers who visit shopping websites tend to end their visit by simply browsing. This poses a challenge to retailers looking to increase their market share and profitability. As a result, there is a focus on improving purchase session rates based on insights into shopping site browsing behaviour. In particular, identifying which customer sessions result in purchases has become a key focus for improving conversion rates. Even a small increase in customer purchase conversion rates can be highly profitable for merchants [
4,
5,
6].
Understanding online shopping behaviour and gaining insight into customers’ decision-making processes can improve the customer experience and increase sales. With the rapid development of the e-commerce industry, it is now possible to record and obtain session logs and behavioural traces of customer groups on shopping websites. Clickstream datasets, which are considered to reflect customers’ shopping preferences, have greatly improved in usability [
7,
8,
9]. This makes it possible to analyse customers’ shopping intentions and provides a new approach to understanding customers’ decision-making behaviour. Previous studies have identified a phased approach to general customer shopping behaviour, including an information-gathering stage, a consideration stage and a selection stage [
10]. In reality, these stages generate massive clickstream datasets as customers repeatedly land on the shopping platform, capturing their browsing and clicking behaviour. Compared to other methods, clickstream datasets offer the advantage of data retention and can be used to predict customer purchase decision-making behaviour and infer intent.
Learning and analysing customers’ historical consumption behaviour has been the focus of most studies on understanding customers’ shopping behaviour [
11,
12,
13,
14]. However, these findings mainly focus on identifying and predicting the shopping behaviour of customer groups with consumption experience on the platform, based on their historical behaviour records. However, there are customer groups of customers who have not registered on the platform or have no historical purchase information, but who still play a critical role in driving revenue and sales. Unfortunately, due to a lack of historical consumption records and purchasing information, these groups have received less research attention. There is still much research to be carried out on inferring purchase intentions and predicting the behaviour of customer groups who have no historical purchase information. It has been found that predicting purchase intent using historical information is challenging for numbers of occasional online shoppers [
15,
16]. For the purposes of this paper, therefore, ‘anonymous shoppers’ are defined as those with no previous purchase record. Understanding the purchase intentions of anonymous visitors is crucial as they account for almost half of online purchases, including occasional and unidentified repeat shoppers. Previous studies have primarily focused on anonymous customers and have mined session clickstream datasets to identify known patterns, which are typical cases of frequent visitors with known purchase intentions [
16]. This approach effectively boosts the purchase conversion rates and revenues for online retailers. However, there is still a need to explore effective ways to predict the purchase intent of anonymous visitors and improve the shopping experience for all customer groups.
Customer behaviour on e-commerce platforms can be categorised into two types: implicit feedback behaviour and explicit feedback behaviour. Implicit feedback behaviour includes actions such as clicking, favouriting and adding to the shopping basket, which do not directly reflect the customer’s preferences for products. On the other hand, explicit feedback behaviour provides a direct indication of customers’ preferences for products through activities such as giving praise or leaving bad reviews. These behaviours provide valuable information that e-commerce platforms can use to infer customers purchase intent and design personalised recommendation systems [
17,
18]. Group psychology also plays an important role in influencing customer behaviour. When people are in an unfamiliar environment, the views and information of social groups can have a strong influence on their behaviour patterns [
19,
20]. The feedback behaviour of customer groups on products reflects their preferences to some extent, which in turn influences product trends. Changing product trends can have a significant impact on top-selling products [
21,
22] as they reflect the popularity of the product on the website and dynamic changes in customer preferences [
15,
16].
The aim of this study is to construct a prediction model of customers’ purchase intentions based on group feedback behaviour and to investigate the cumulative effect of the model on purchase intentions under different time windows. To achieve this, we used customer clickstream datasets from Jingdong Mall, a well-known comprehensive shopping platform in China. Various machine learning algorithms were applied during the session to test the predictive performance of the model. The ultimate goal was to predict the purchase behaviour of anonymous customers, which can help improve the purchase conversion rate.
2. Related Work
There are several recent studies that analyse customers’ online behaviour, such as their historical purchases [
11,
12,
13], page view history [
23], page view rating and time, search behaviour [
24], and psychological perceptions [
25,
26,
27], to understand consumer behaviour and preferences. The advantage of these studies is that the experimental data are more intuitive and easier to handle, but the disadvantage is that the generalisation and application of the study’s findings are poor, and they do not provide a better perception and representation of what consumers really think inside. Clickstream data, which are naturally generated as customers browse online shopping sites, can provide direct or indirect feedback on their willingness and preferences. This has become a popular method for analysing customer behaviour. Currently, applications of clickstream datasets have focused primarily on customer profiling [
28], customer segmentation [
29,
30], and the prediction of consumer behaviour [
31,
32]. However, these studies often fail to account for change over time and customer interest drift, even when recognising that product trends can influence product popularity. As a result, there is still a research gap in measuring product trends based on clickstream datasets and using them to predict customer purchase intentions. This research will use clickstream data to investigate the prediction of consumer purchase intent, taking into account product popularity, and thus fill the research gap.
The implicit feedback behaviours of customer groups have been used to describe product trends and predict the purchase intentions of anonymous customers [
15,
16]. For example, Bogina et al. [
33] constructed product tendencies from the clicking behaviour of customer groups at different times to predict customers’ purchase intentions during sessions. Mokryn et al. [
16] used behavioural datasets on viewed and clicked products to differentiate product trend degree features and combined them with time features to predict customers’ purchase intentions in the current session. Similarly, Esmeli et al. [
15] used behavioural datasets to determine product popularity and predict the purchase intentions of anonymous customers in early sessions based on the minimum and maximum popularity of each session. These studies confirm the role of implicit feedback behaviours based on customer groups in predicting purchase intent. Unfortunately, these studies have the disadvantage of considering only a single type of feedback behaviour, such as browsing clicks, while ignoring other types of implicit feedback behaviours, such as adding to cart, following, commenting, etc. Our research will attempt to fill this gap by further considering multiple types of implicit feedback behaviours in the trend-measure construct, and by exploring the possibility of applying multiple behavioural trend measures to predict the purchase intention of anonymous customers.
In addition, the explicit feedback behaviour of customer groups can influence the electronic word-of-mouth of products and further influence customers’ purchase behaviour or intentions [
34,
35,
36,
37,
38]. Explicit feedback from customers can be positive (good reviews) or negative (bad reviews). When customers browse goods, positive and negative reviews are directly presented to them as a quality signal, which can influence their purchase intentions and decisions [
39,
40,
41]. These show that the number of positive and negative reviews of a product can reflect changes in the electronic word of mouth about the product. It helps to capture the dynamic preferences of customer groups for products and, in turn, recommends customers’ preferred products to facilitate purchase behaviour. However, these studies have not yet defined and explored the nature of the changing trends in positive and negative reviews and, in particular, they have not used review changes to construct variables that reflect electronic word-of-mouth trends. Therefore, our research will attempt to address this shortcoming by proposing to construct variables that characterise eWOM change trends based on review changes and define them as Product Popularity (POP).
Previous studies can be mainly classified as questionnaire surveys or psychological experiments, and are usually based on static data, such as a single type of explicit consumer behaviour characteristic, past shopping experiences, and online review texts, without considering the cumulative effect over time and implicit feedback behaviour data. This study focuses more on dynamic trends and cumulative effects over time, taking into account multiple types of implicit behaviours, and conducts research on predicting customers’ purchase intentions based on popularity and the degree of trend.
4. Data Analysis and Results
The aim of this study is to develop a model for predicting customer purchase intentions based on product tendency and popularity in the form of group feedback. We also seek to investigate the cumulative effect of the model on purchase intention over different time windows. Inspired by Mokryn et al. [
16], we conduct three sets of comparative experiments to confirm its validity and applicability. For the classification task of predicting the purchase intention of anonymous visitors, we train a set of machine learning classifiers to evaluate the effects of different dynamic features, as shown in
Table 3,
Table 4 and
Table 5.
The time window for the dynamic in the experiments is set from 2 to 6 days. The three groups of experiments include four main types of features: product tendency, product popularity, session time features, and session clickstream features. Product tendency includes the CT variable and the MBT variable, while product popularity includes the POP variable. Session time features include month (M), festival (FES), and session dwell time of a session (DT). Experimental group 1 consists of three experiments: control group, with the CT variable, and with the MBT variable, as shown in
Table 1. Group 2 consists of two experiments: control group and with the POP variable, as shown in
Table 2. Finally, group 3 consists of three experiments: control group, with the CT variable and POP variable, and with the MBT variable and POP variable, as shown in
Table 3.
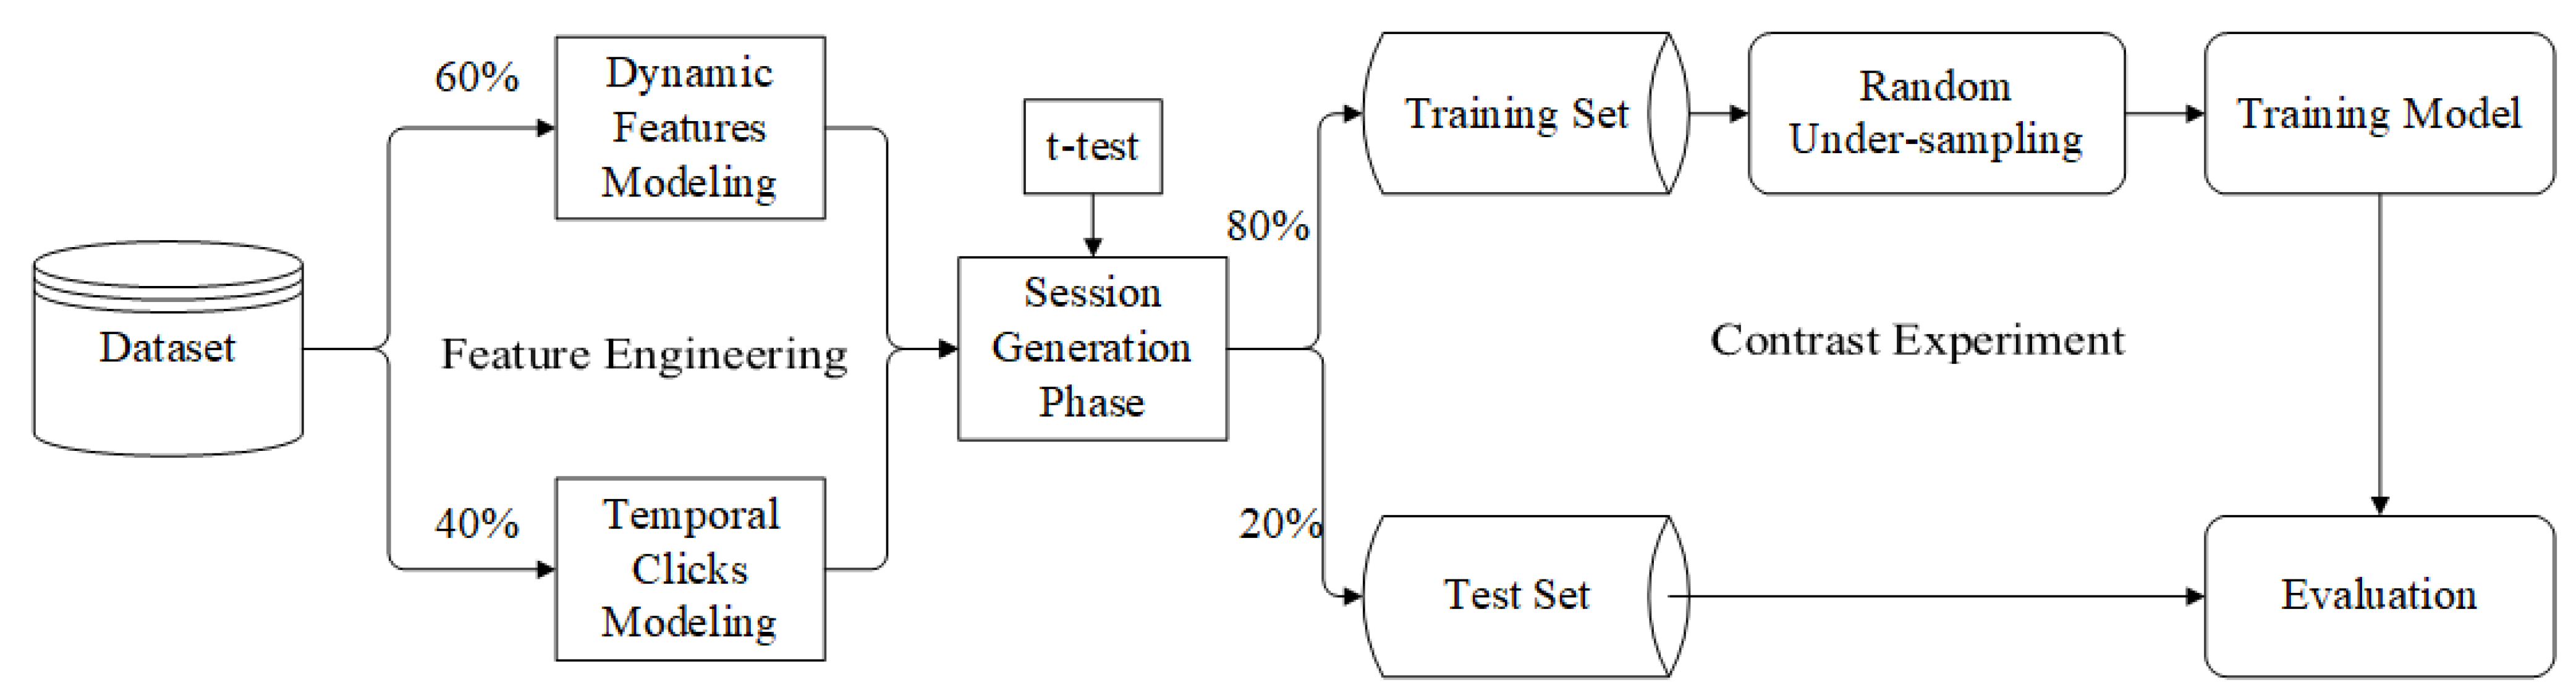
Figure 2 shows our research process, which is mainly divided into two parts: feature engineering and comparative experiments. In the first part, we use 60% of the data to learn the dynamic features of the product and construct the lookup table of product tendency (CT, MBT) and product popularity (POP) under different dates and time windows. The remaining 40% is then used to generate the anonymous visitor session dataset. Finally, we calculate the dynamic variable (CT, MBT and POP) based on the lookup table of product tendency and product popularity. In the second part, we use 80% of the session dataset as the training set and 20% as the test set. In both datasets, the number of sessions ending with a purchase is similar to the number of sessions ending without a purchase. Due to the relatively large proportion of sessions ending with no purchase in the training set, we randomly down-sample them to reduce data imbalance and train a better model. We sequentially train 120 models based on different time windows (ranging from 2 to 6 days) and different experimental groups (6 models in total) using logistic regression (LR), random forest (RF), histogram-based gradient boosting (HGBDT) and XGBoost (XGB) classifiers. Finally, we evaluate and compare the models based on their F1 values on the test set.
4.1. The Effect of Product Trendiness over Different Window Sizes
In experimental group 1, we use the purchase intention prediction model based on session time and clickstream characteristics as a control group. We evaluate the predictive quality of the model without product tendency and with the CT variable and MBT variable included under different time windows. Specifically, we evaluate the predictive performance of the model with the CT variable and MBT variable replacing product tendency over different time windows. For each scenario, the prediction performance is compared and the four different classifiers are compared separately.
The F1 value is used for the classification performance of the model.
Table 6 shows the prediction performance of different classifiers for anonymous customers’ purchase intentions across different time windows and product tendencies. Among the three classifiers (HGBT, RF, and XGB), both the CT model and MBT model significantly improve the prediction performance of customers’ purchase intentions compared to the control group in each time window. Similarly, the predictive quality of the control groups’ integrated classifiers decreases as the time window increases. In addition, the tendency of multi-type behaviour is better than just browsing tendency alone. The above results show that the MBT model, based on the implicit feedback behaviours of multiple groups, is more useful for predicting purchase intentions than the CT model alone, which is based on product browsing and clicking behaviour.
4.2. The Effect of Product Popularity over Different Window Sizes
Table 7 illustrates the predictive performance of the different classifiers for anonymous customer purchase intentions across different time windows and product popularity features. For each time window with different integrated classifiers, the POP variable group outperforms the control group in terms of prediction. Product popularity significantly improves the classifier’s prediction quality of anonymous customers’ purchase intentions. These results demonstrate that the POP variable is useful in determining anonymous shoppers’ purchase intentions by taking into account the dynamic changes in the electronic word-of-mouth of products.
4.3. The Synergistic Promotion Effect of Product Trendiness and Popularity
We combined the POP variable with the CT variable and the MBT variable to evaluate the predictive performance of the classifiers on anonymous users’ purchase intentions. The results show that the POP variable synergistically improves the prediction of anonymous users’ purchase intentions in both the CT variable and the MBT variable (see
Table 8). Furthermore, the predictive quality of the MBT-POP model is better than that of the CT-POP in all time windows, indicating that the MBT-POP model has the best predictive performance among all groups (F1 = 0.9031). Compared to similar studies by Mokryn et al. (2019), the MBT-POP model performs better across all time windows and achieves optimal prediction accuracy with only a 2-day time window. These results highlight the importance of considering multi-behaviour with the MBT variable and the POP variable when predicting the purchase intentions of anonymous visitors.
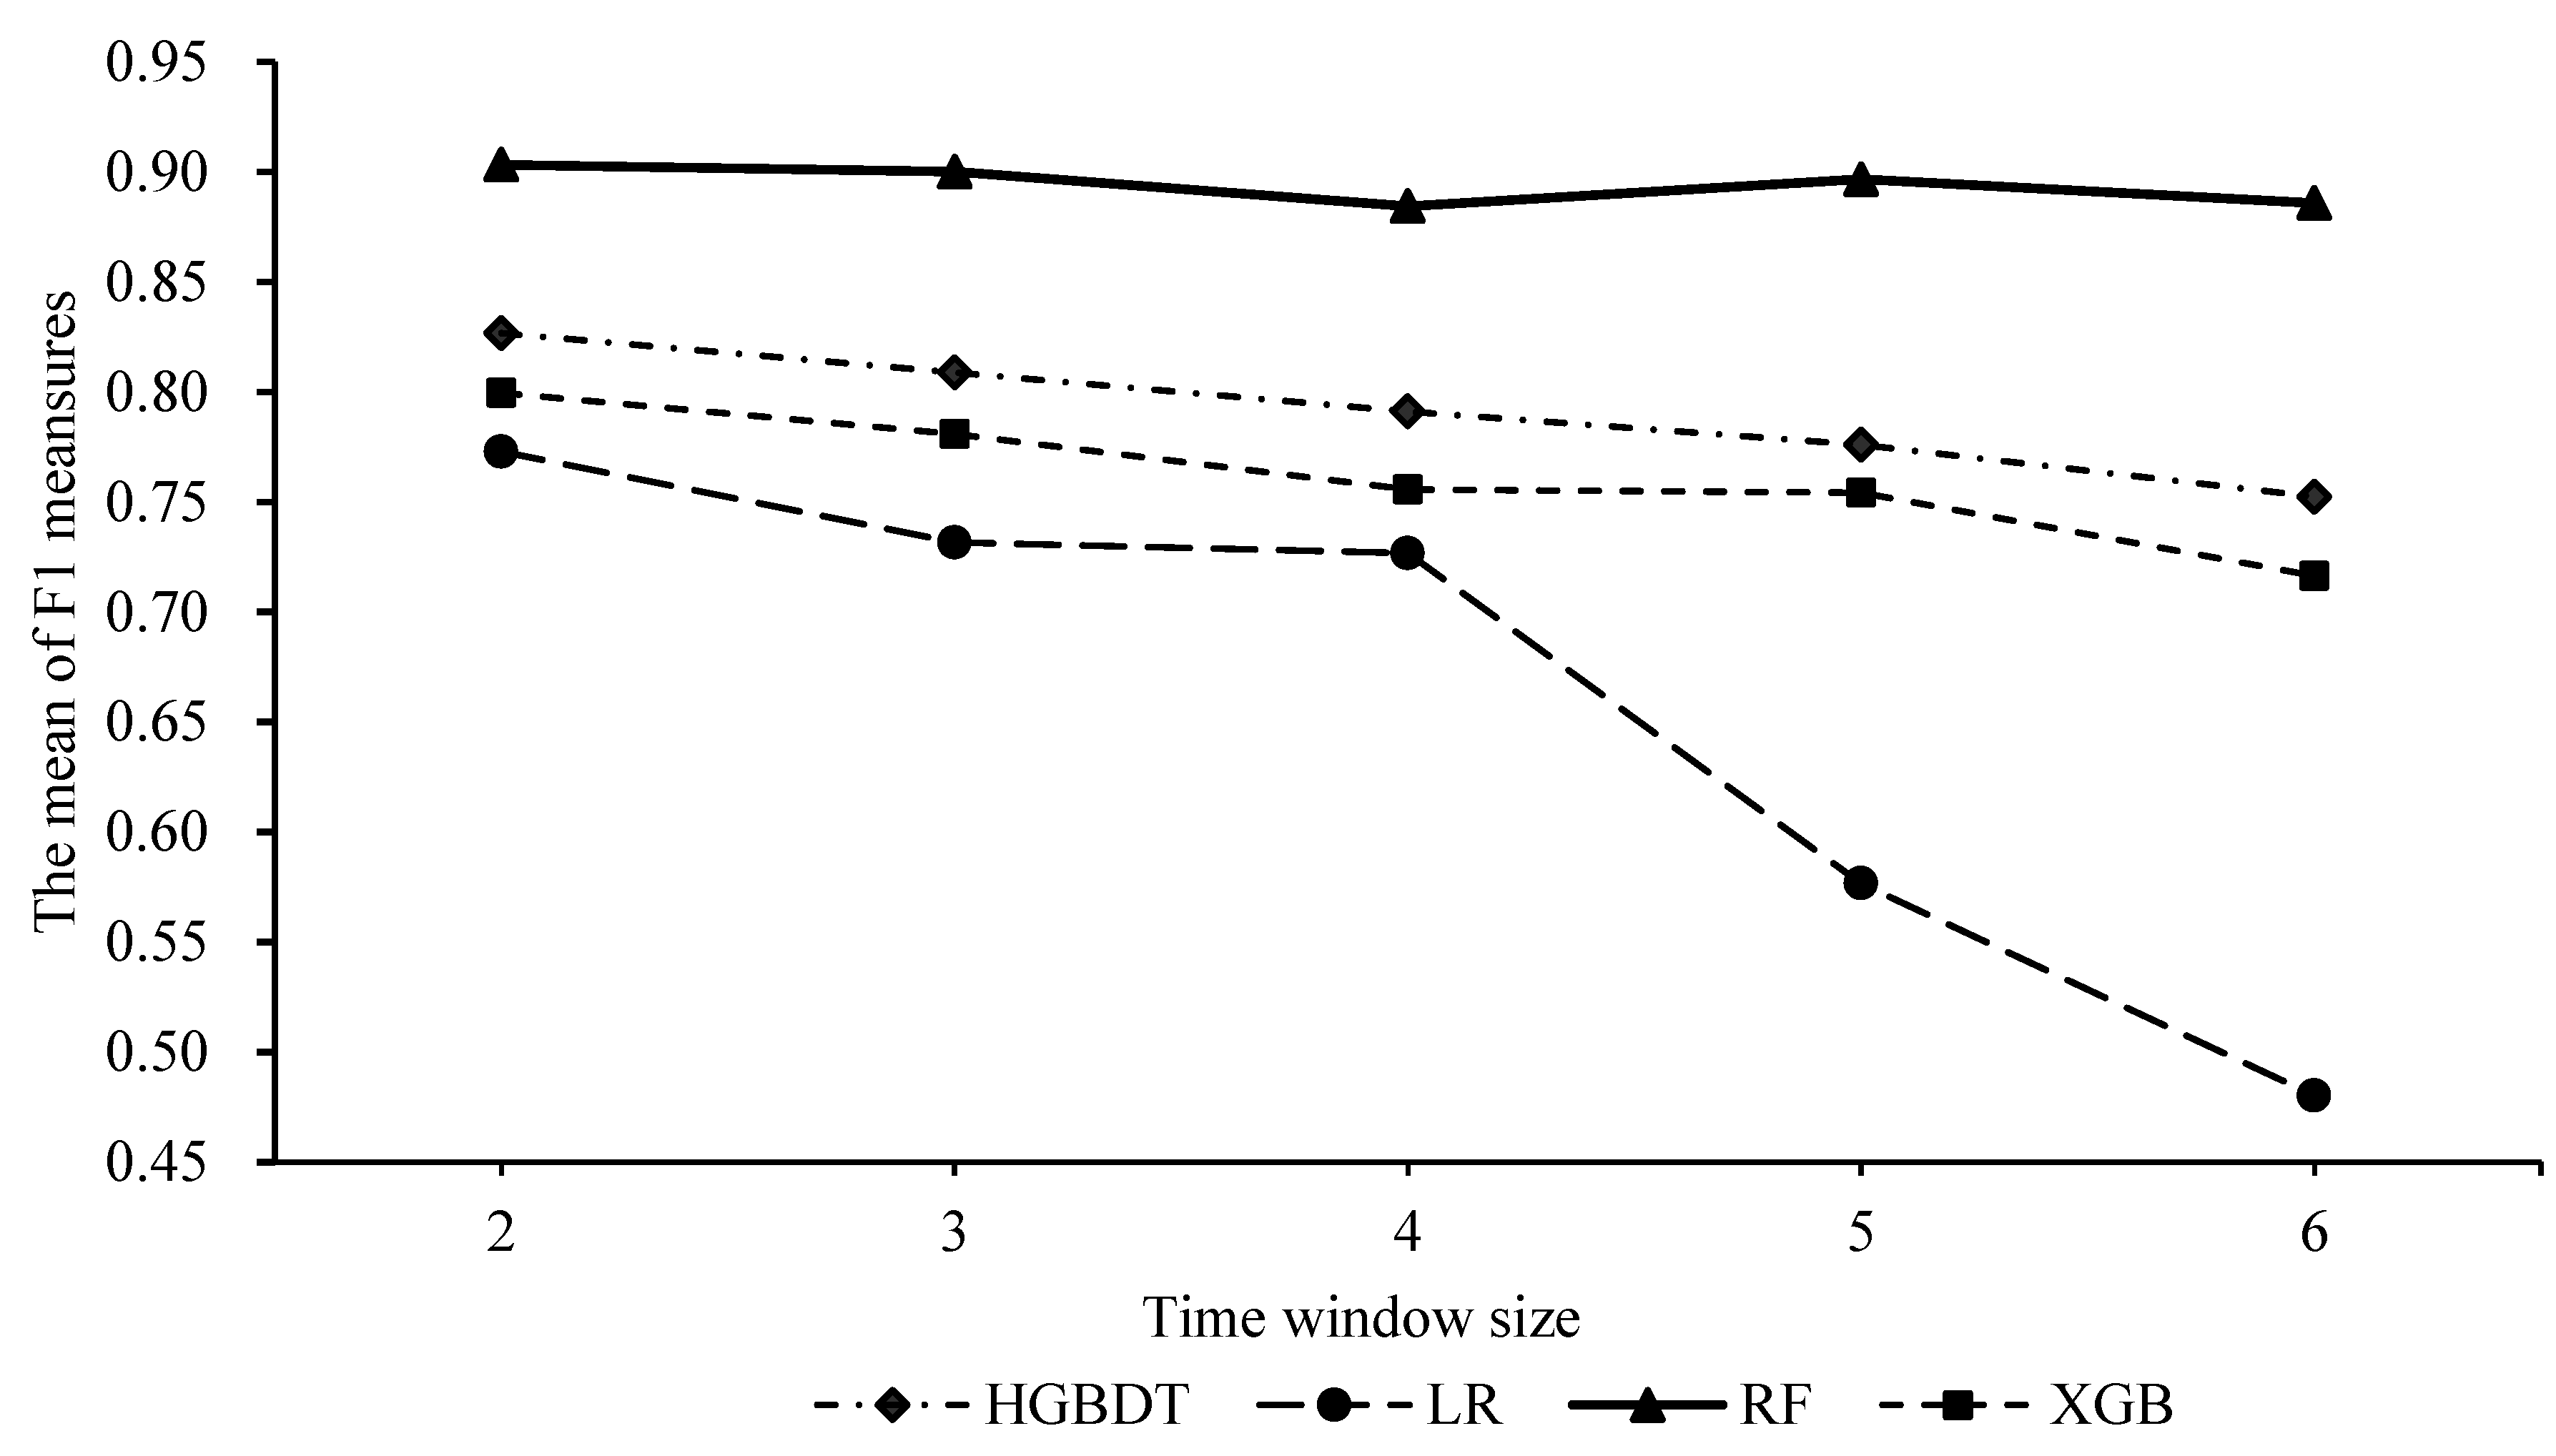
Figure 3 shows the average prediction quality (mean F1) of all experiments conducted in different time windows for the four classifiers. Specifically, the mean F1 score of the ith classifier in the jth time window is shown:
The random forest algorithm shows the best overall prediction performance of all classifiers, suggesting its suitability for predicting the purchase intent of anonymous customers.
Comparing the experimental results of the three groups, we obtain the best performance with the random forest classifier of the MBT-POP model and a sliding time window of 2 days (F1 value of 0.9031). It is worth noting that as the sliding time window increases, the F1 value gradually decreases, indicating the importance of recent information in predicting anonymous customers’ purchase intentions.
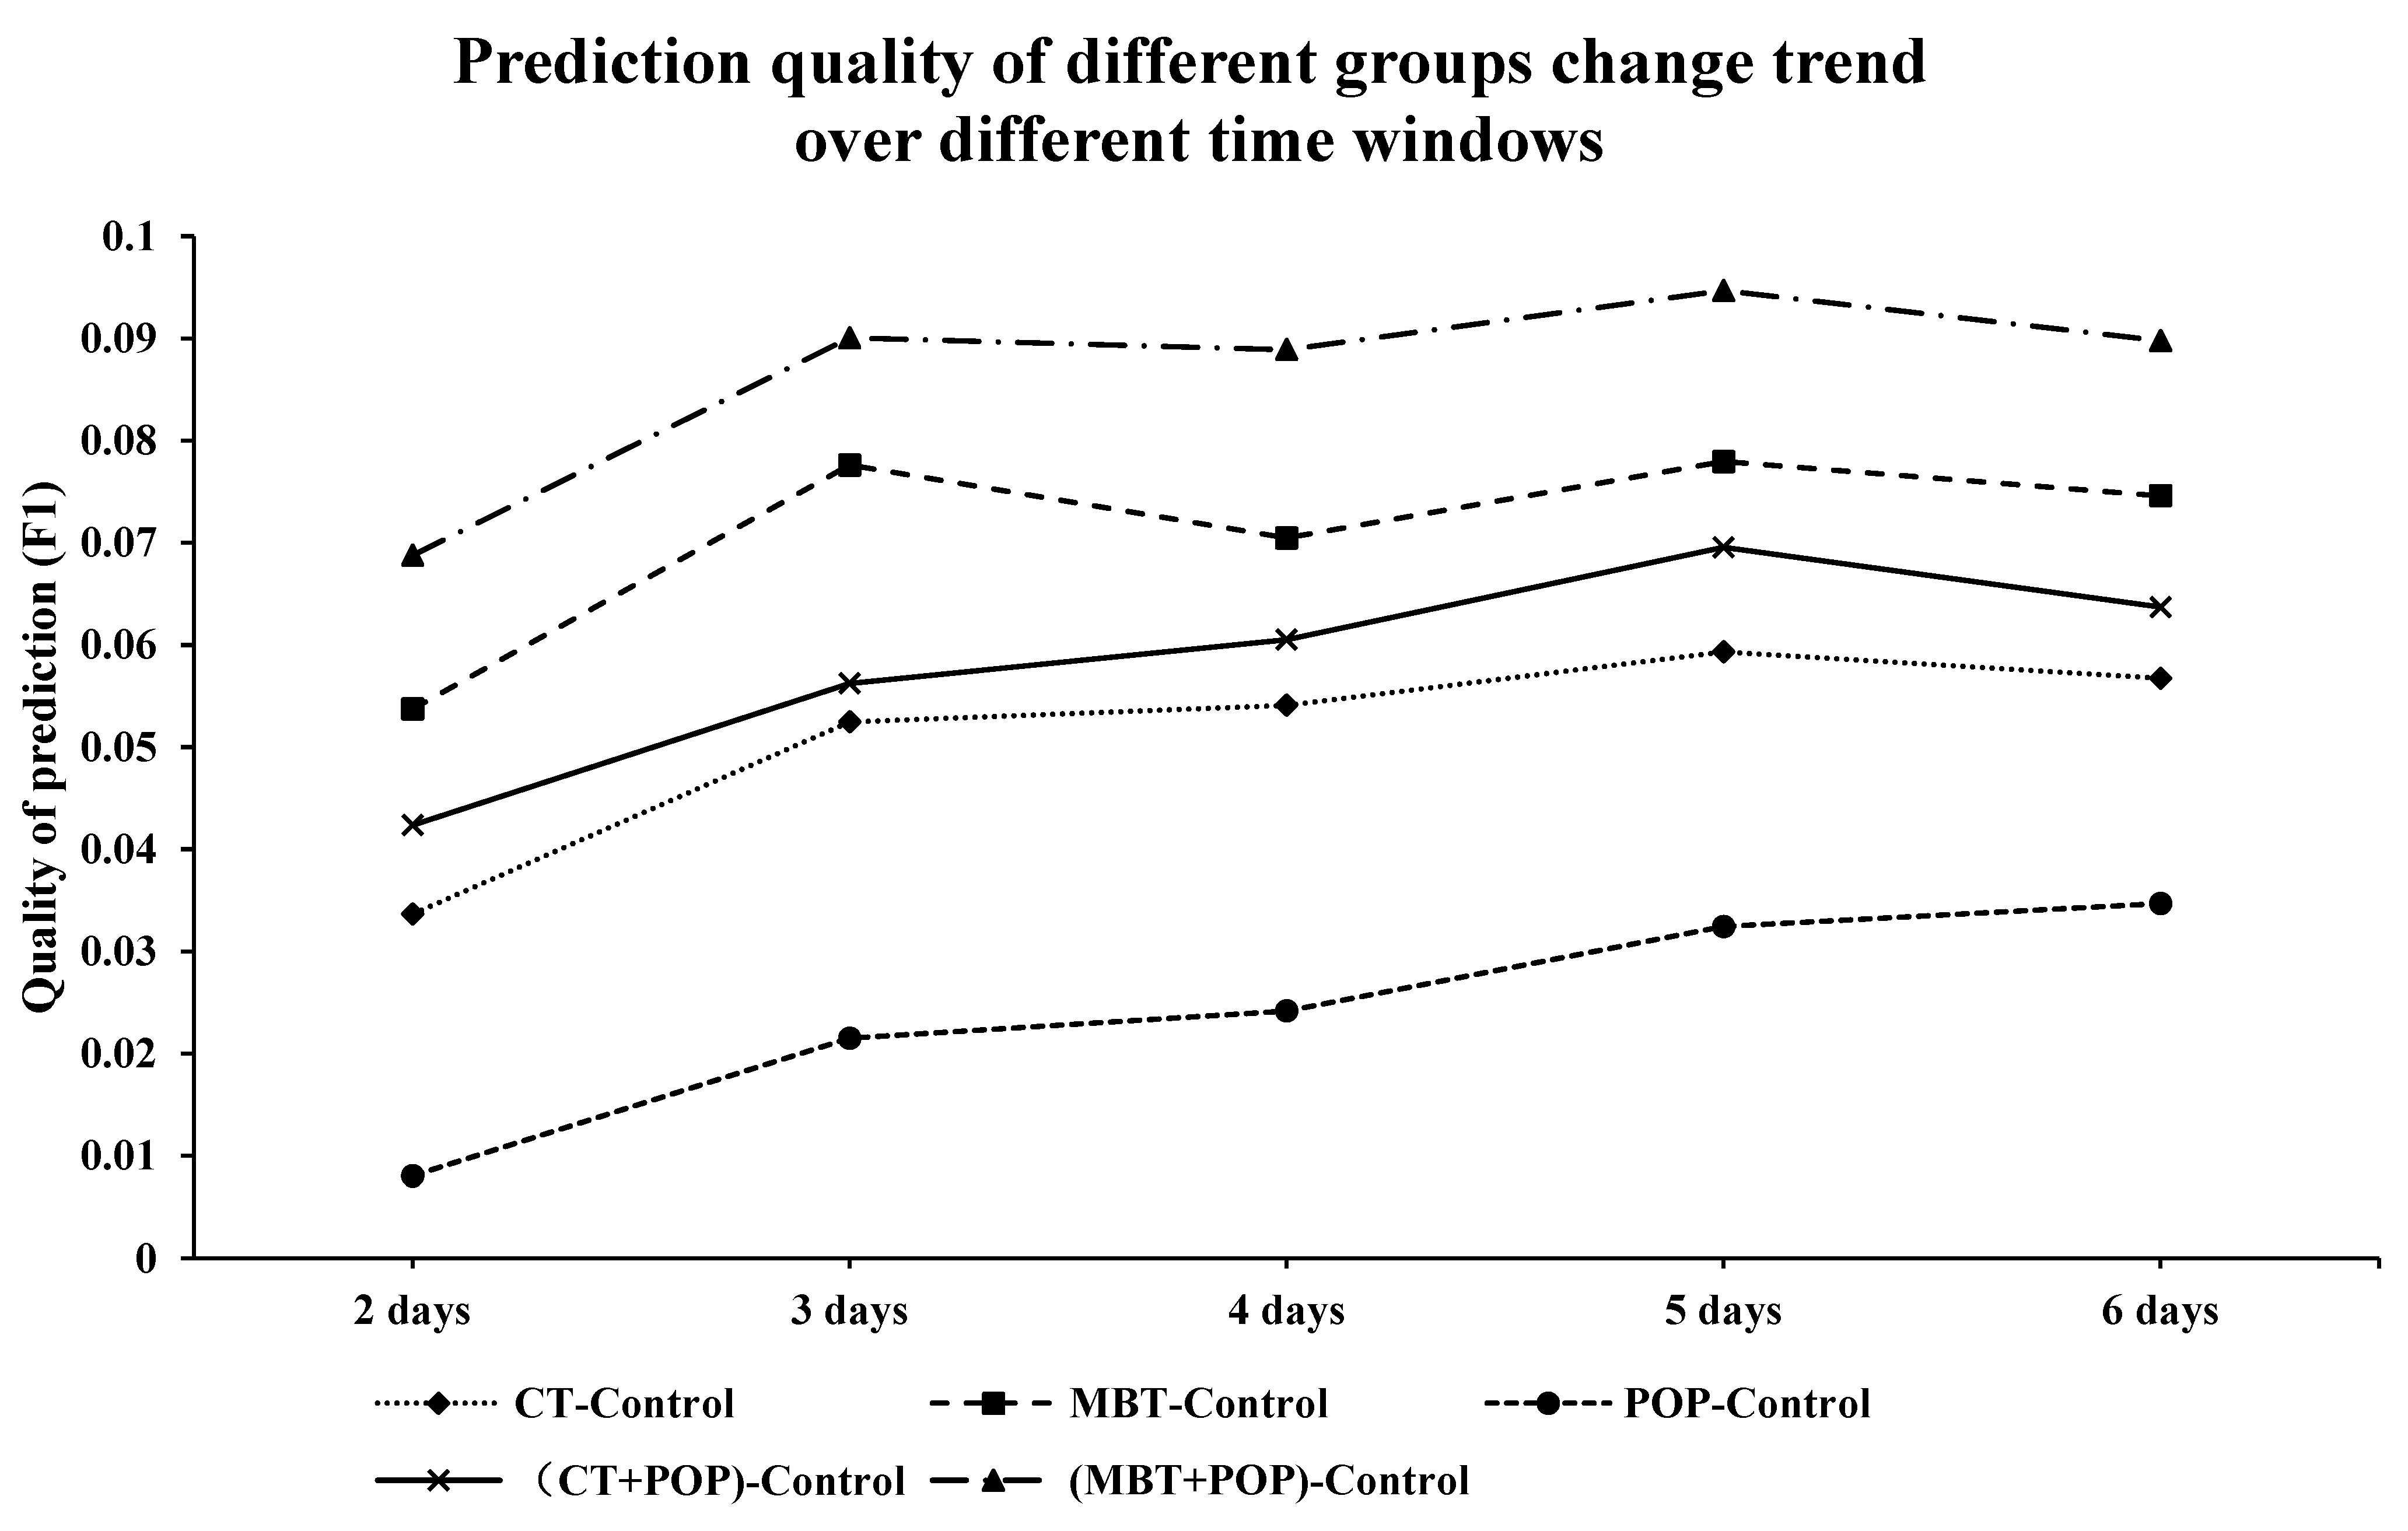
To investigate how the model improves the quality of purchase intention predictions, we compare the prediction performance of the tendency and popularity models under the random forest classifier with control groups.
Figure 4 illustrates how well the best-performing random forest classifier improves the prediction performance of purchase intentions under different feature combinations. The vertical axis in
Figure 4 reflects the difference in F1 values between the tendency or popularity model and the control group. Of all the models, the MBT-POP model shows the most significant improvement in prediction quality across all selected time windows. Despite the small number of sessions containing trend products within a time window of 5 to 6 days [
16,
33], the MBT-POP model achieves an F1 value of 0.8966 for predicting purchase intentions, which is 9.47% higher than that of the control group. This result suggests that the MBT-POP model still shows excellent predictive performance even with small sample data.
5. Discussion and Implication
5.1. Discussion
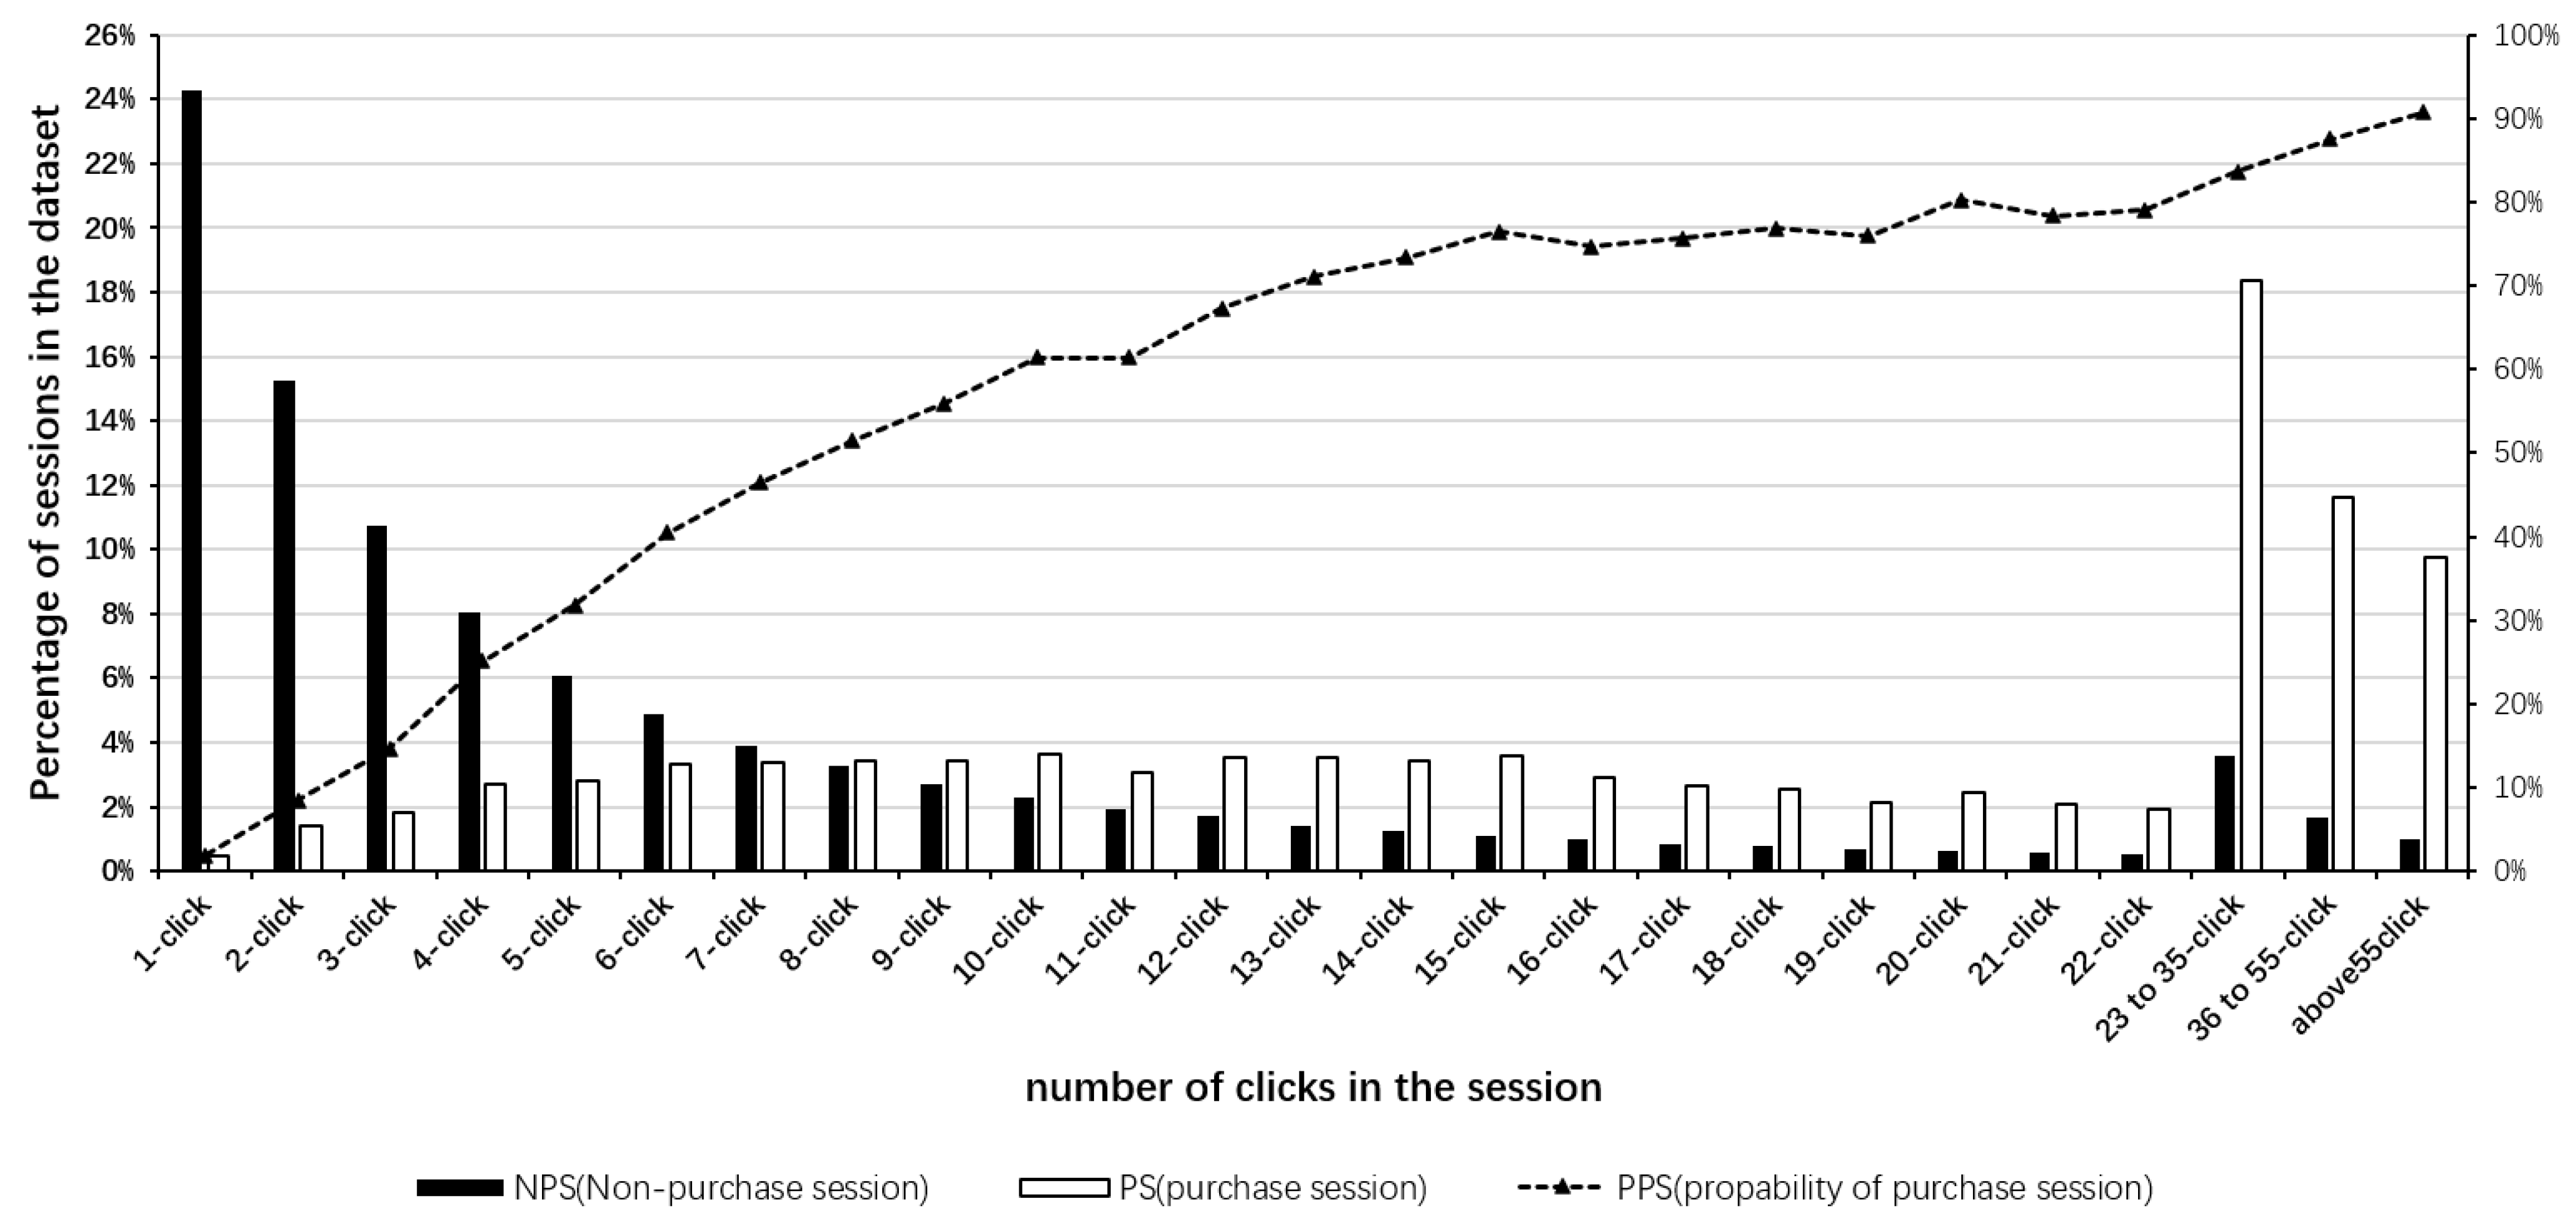
The aim of this study was to investigate the factors that influence the purchase intentions of anonymous customers. Previous research on online consumer behaviour has primarily focused on inferring preferences from historical and repurchased customers, which is not applicable to determining the purchase intentions of anonymous visitors with limited historical purchase records, occasional online shoppers, and cold-start users. By identifying the factors that influence the purchase intent of anonymous visitors, we can gain a better understanding of occasional visitors, who account for nearly half of all online purchases and are critical to increasing conversion rates and revenues for online retailers. Using data-driven empirical research, we find that factors such as product tendency, popularity, temporal characteristics and clickstream characteristics based on group feedback behaviours significantly influence the purchase intent of anonymous visitors. Through exploratory analysis (
Figure 1), we observe that when the cumulative number of clicks in the current session does not exceed 8, the cumulative proportion of non-purchase sessions reaches 76.40%, while only 19.36% of sessions end in purchases. However, when the number of clicks exceeds 8, the number of sessions ending with a purchase exceeds the number of sessions ending without a purchase, and the probability of sessions ending with a purchase continues to increase with the number of clicks. Before making a purchase decision, customers often evaluate the degree of fit between perceived product value and their own needs, which takes time and effort. We therefore use the number of clicks and time spent to predict the purchase intent of anonymous visitors at the session level.
From the perspective of the dynamic features of products and sessions, we conduct further analysis to explore the impact of product tendency, based on the implicit feedback behaviour of groups, and product popularity, based on dynamic changes in electronic word-of-mouth, on the prediction of anonymous visitors’ purchase intentions. Using session time and clickstream features as controls, we conduct three sets of comparative experiments to address the three sub-questions related to our overall research objective, as outlined in
Section 4. These experiments have confirmed the effectiveness and applicability of our research.
5.2. Theoretical and Practical Implications
First, we show that the predictive performance of the MBT model, which considers multiple types of behaviour, is significantly superior to that of the CT model, which only considers browsing and clicking behaviour. This highlights the importance of product tendency based on consumer information from various implicit feedback behaviours in reflecting the dynamic preferences of anonymous customers. During the consumer-decision process, received information can stimulate preference drift, leading to dynamic changes in consumer preferences, which are directly reflected in different types of clicking behaviour during the shopping journey. By considering multiple types of behaviours, our model can better capture the dynamic changes in consumer preferences, ultimately improving the accuracy of predicting customer behaviour.
Second, our experiment examines the impact of product popularity on the prediction of purchase intentions. We find that including the POP variable of popularity in any time window significantly improves the predictive accuracy of anonymous users’ purchase intentions. By tracking the changes in positive and negative reviews, product popularity reflects the identification trends of customer groups for products, which essentially indicates the dynamic trend of electronic word-of-mouth. As the number of positive reviews gradually increases over time, it indicates that customers’ appreciation of the products is growing, providing insight into their willingness to purchase based on the level of electronic word-of-mouth and customer recognition.
In conclusion, our research highlights the synergistic role of product tendency and popularity based on group feedback behaviour in predicting anonymous customers’ purchase intentions. As mentioned earlier, product popularity reflects customer identification trends and electronic word-of-mouth, while product tendency reveals customer behavioural patterns and dynamic preferences from a behavioural flow perspective. By combining these two factors, we obtain a comprehensive purchase signal from customers’ implicit and explicit feedback. Therefore, considering product tendency and popularity together is more effective and synergistic than focusing on either factor alone.
Furthermore, considering the perspective of machine learning classifiers in our study, we identify the random forest algorithm as a top performing model. The predictive power of anonymous customers’ purchase intentions increases with more recent information. In the random forest classifier of the MBT-POP model, we achieve an optimal prediction quality (F1 value) of 0.9031, which corresponds to an optimal time window of 2 days. In addition, we investigate how the combination of different features can improve the quality of purchase intention prediction. As shown in
Section 4.3, the MBT-POP model shows the greatest improvement in model prediction performance. This highlights the effectiveness of using two dynamic features based on multi-type behaviour to determine the purchase intentions of anonymous visitors. In particular, our results indicate that customers’ purchase intentions are influenced by fashion products and public reputation, suggesting a social influence on purchasing behaviour.
Our research has important practical implications. First, we suggest that product tendency and popularity can be used to design recommendation algorithms that target customers who are infrequent or first-time visitors to e-commerce sites. Second, we recommend that merchants emphasise the social attributes of their products and focus on strengthening their word-of-mouth marketing strategies.
6. Conclusions
We present a novel approach to predicting the purchase intent of anonymous customer groups using clickstream datasets to construct customer behaviour tendency and product popularity. By considering these factors, we introduce a new perspective to identify changes in behavioural tendency and product popularity, which helps to detect customer intention and preference drift. In addition, we discover the optimal prediction time scale and machine learning methods, which we apply to independent datasets from the real e-commerce industry to efficiently identify the behavioural intentions of anonymous customer groups. The MBT-POP model achieves the best prediction accuracy by considering product tendency and popularity under the random forest algorithm with a time window of 2 days. These findings provide practical opportunities for structuring a real-time recommendation system based on predicting anonymous customers’ purchase intentions. However, there are some limitations to this study. Due to the limitations of the dataset, our research cannot obtain more information related to product reputation, such as retailer reputation and brand effects, which could allow for us to have a more comprehensive definition of product popularity. In future studies, we will continue to explore the predictive performance and applicability of customer feedback information for different customer types and behaviours. We will also refine the analysis of how different implicit feedback behaviours (browsing, favouriting, commenting, adding to cart) affect the prediction of anonymous customer purchase intentions, and how product tendency affects these predictions.


