
Which Hierarchical Levels of Value Description of Design Concepts Enhance Anticipated UX? Effects of Product Type on User Expectations


Abstract
1. Introduction
2. Methods
2.1. Participants
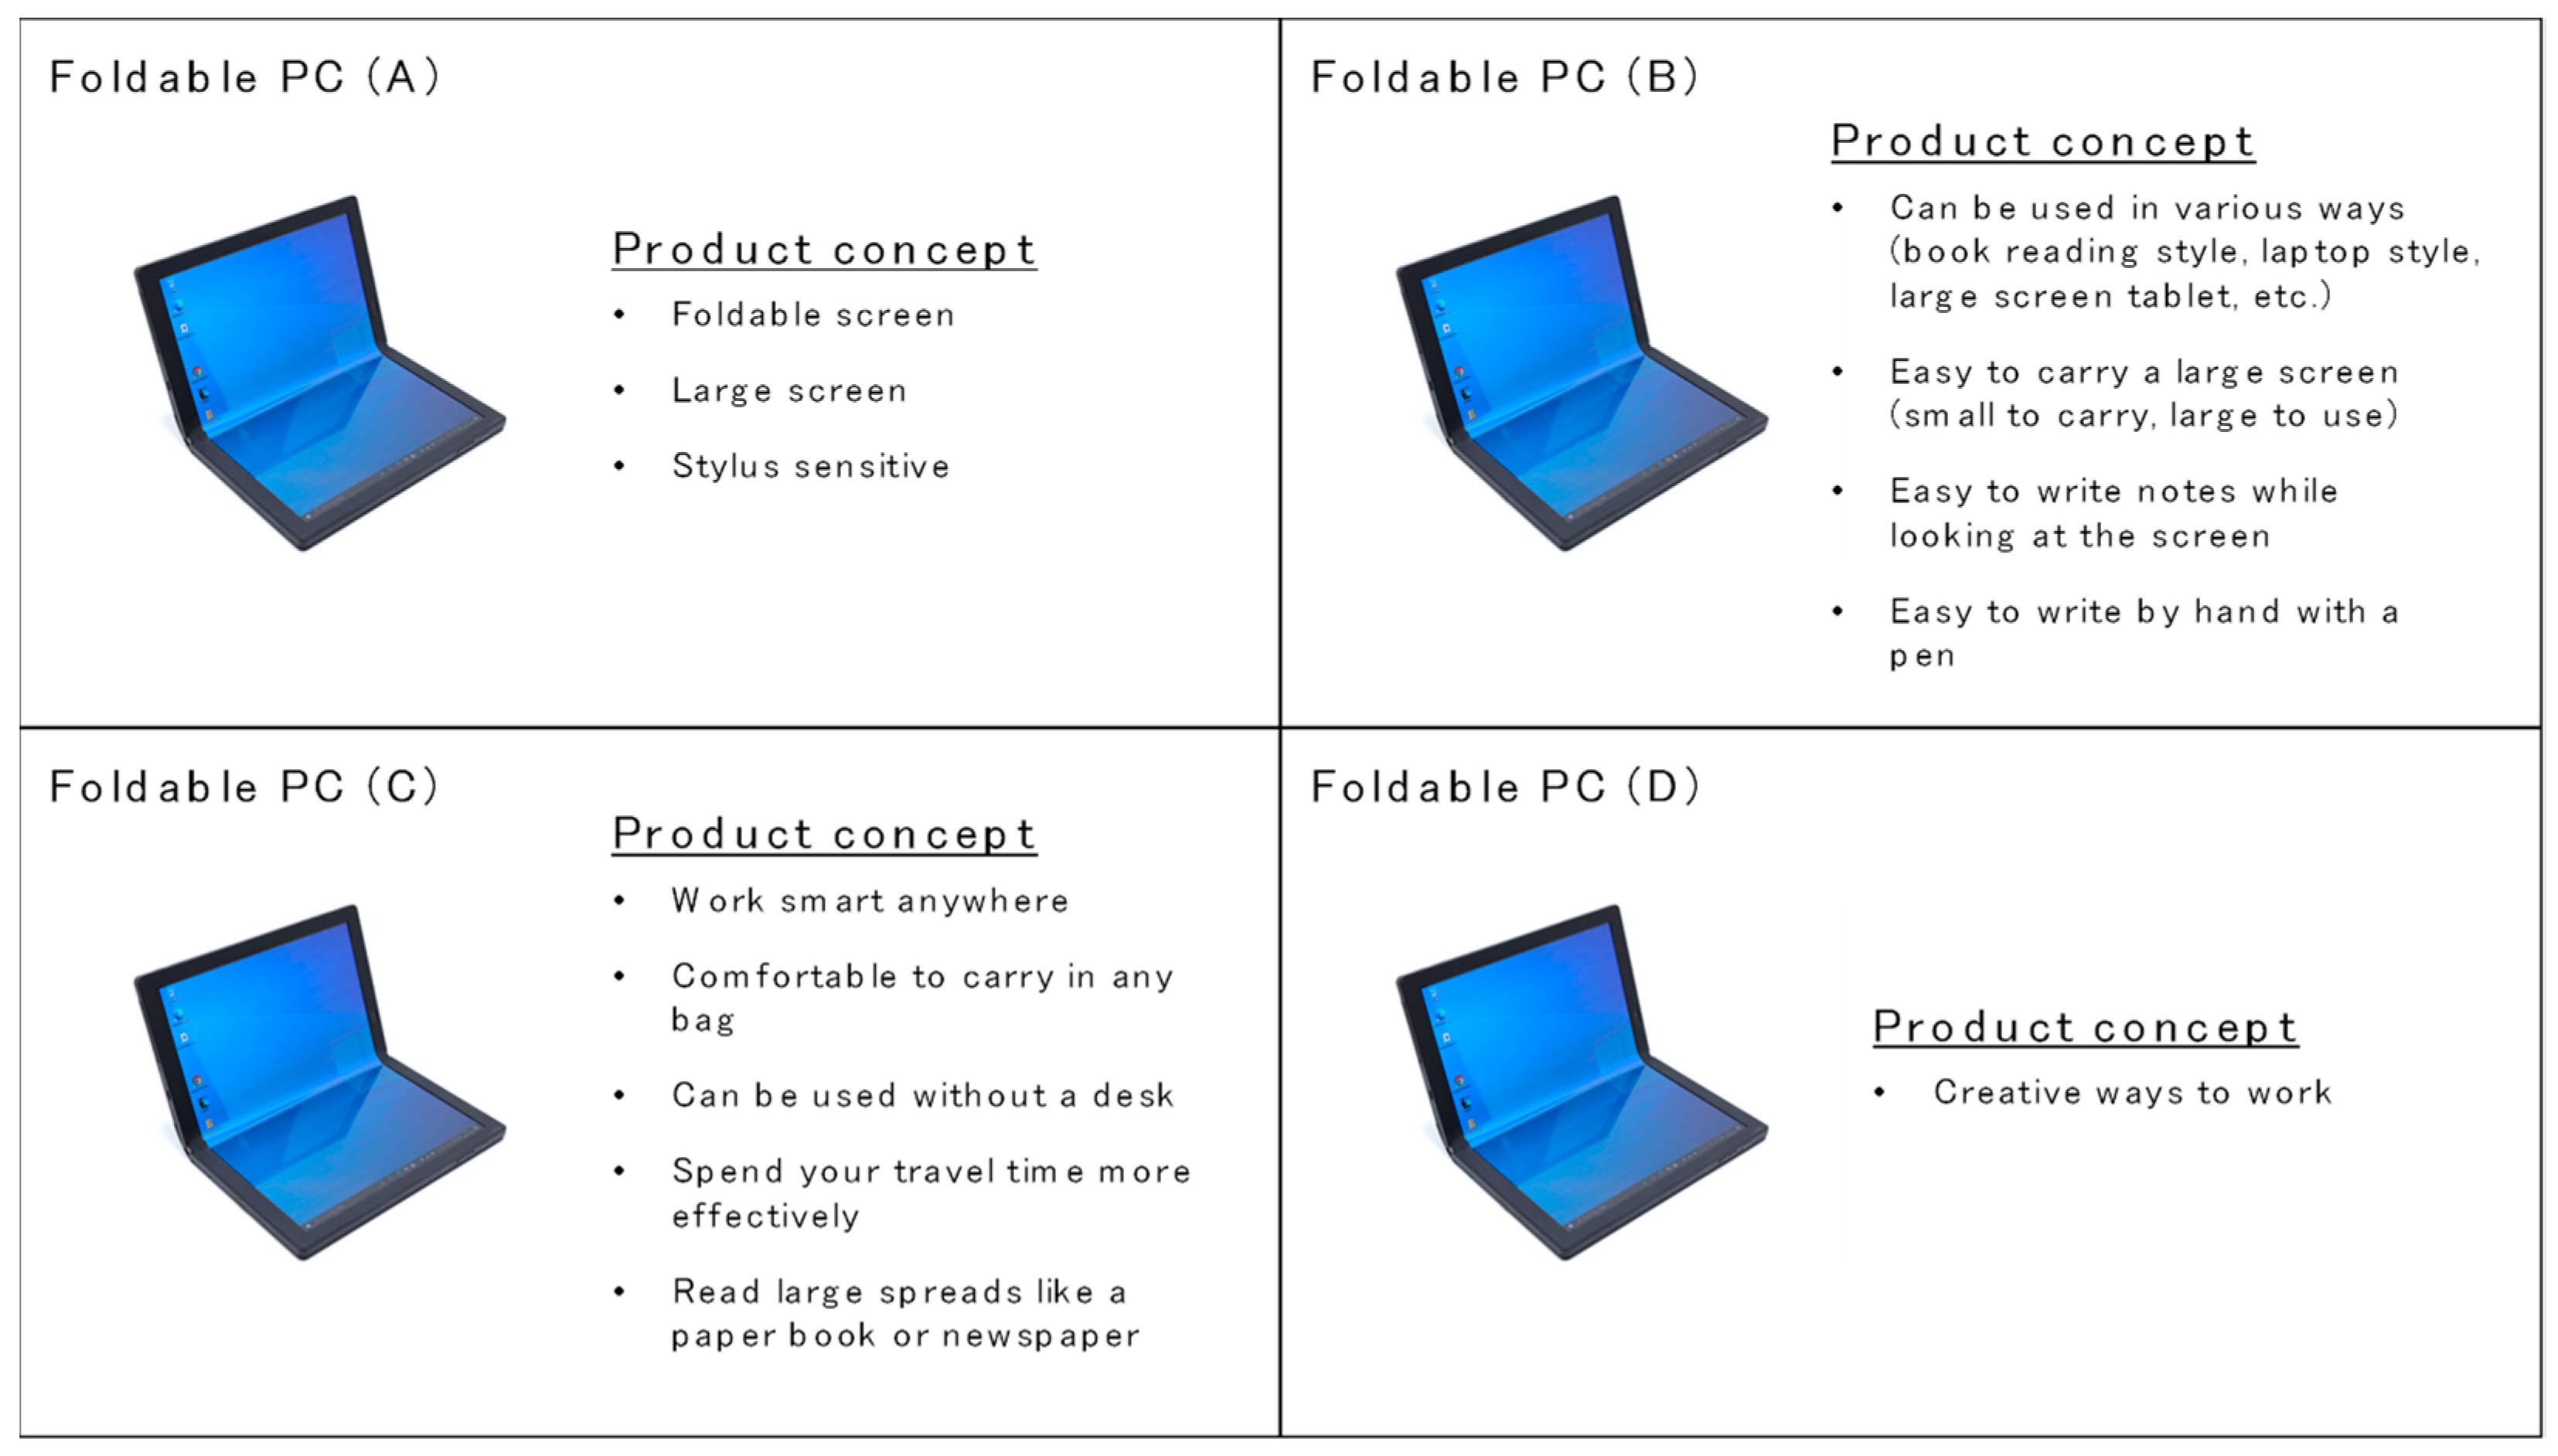
2.2. Tasks
2.3. Design and Procedure
2.4. Measurement Items
2.4.1. Estimated Index of the Degree of Anticipated UX
2.4.2. Ease of Imagining Usage
2.4.3. Product Involvement
2.5. Statistical Analysis
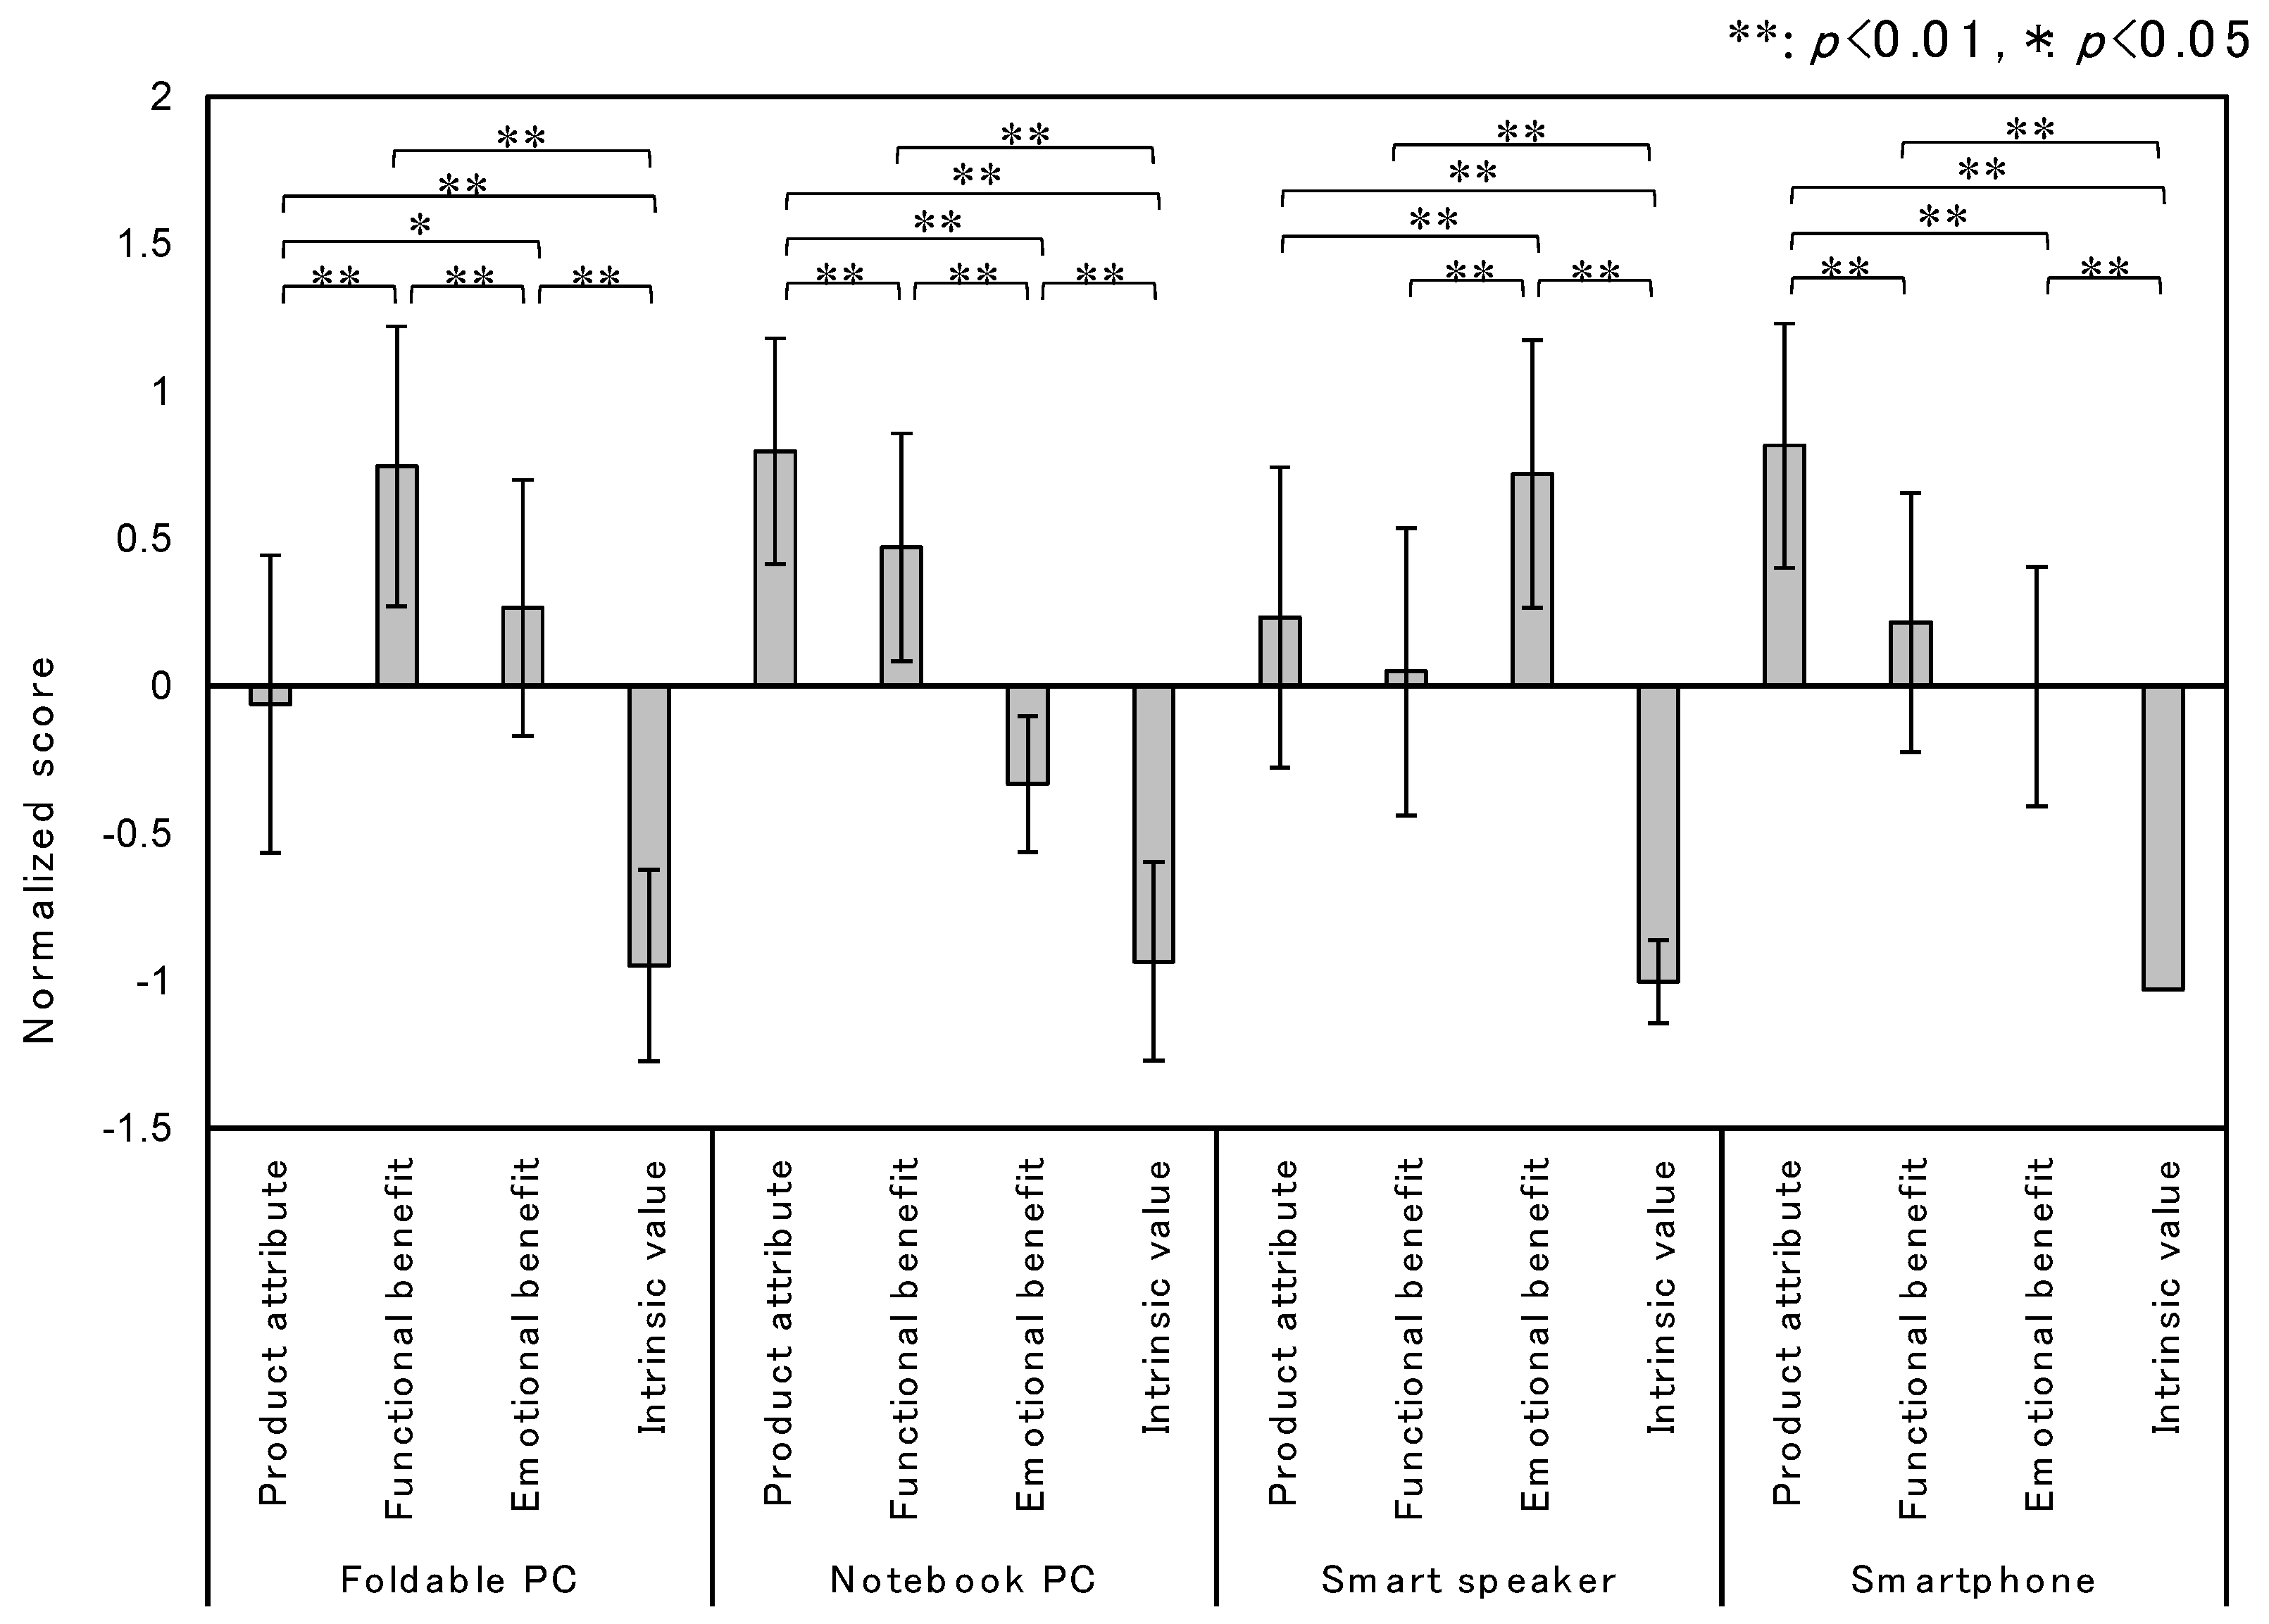
3. Results
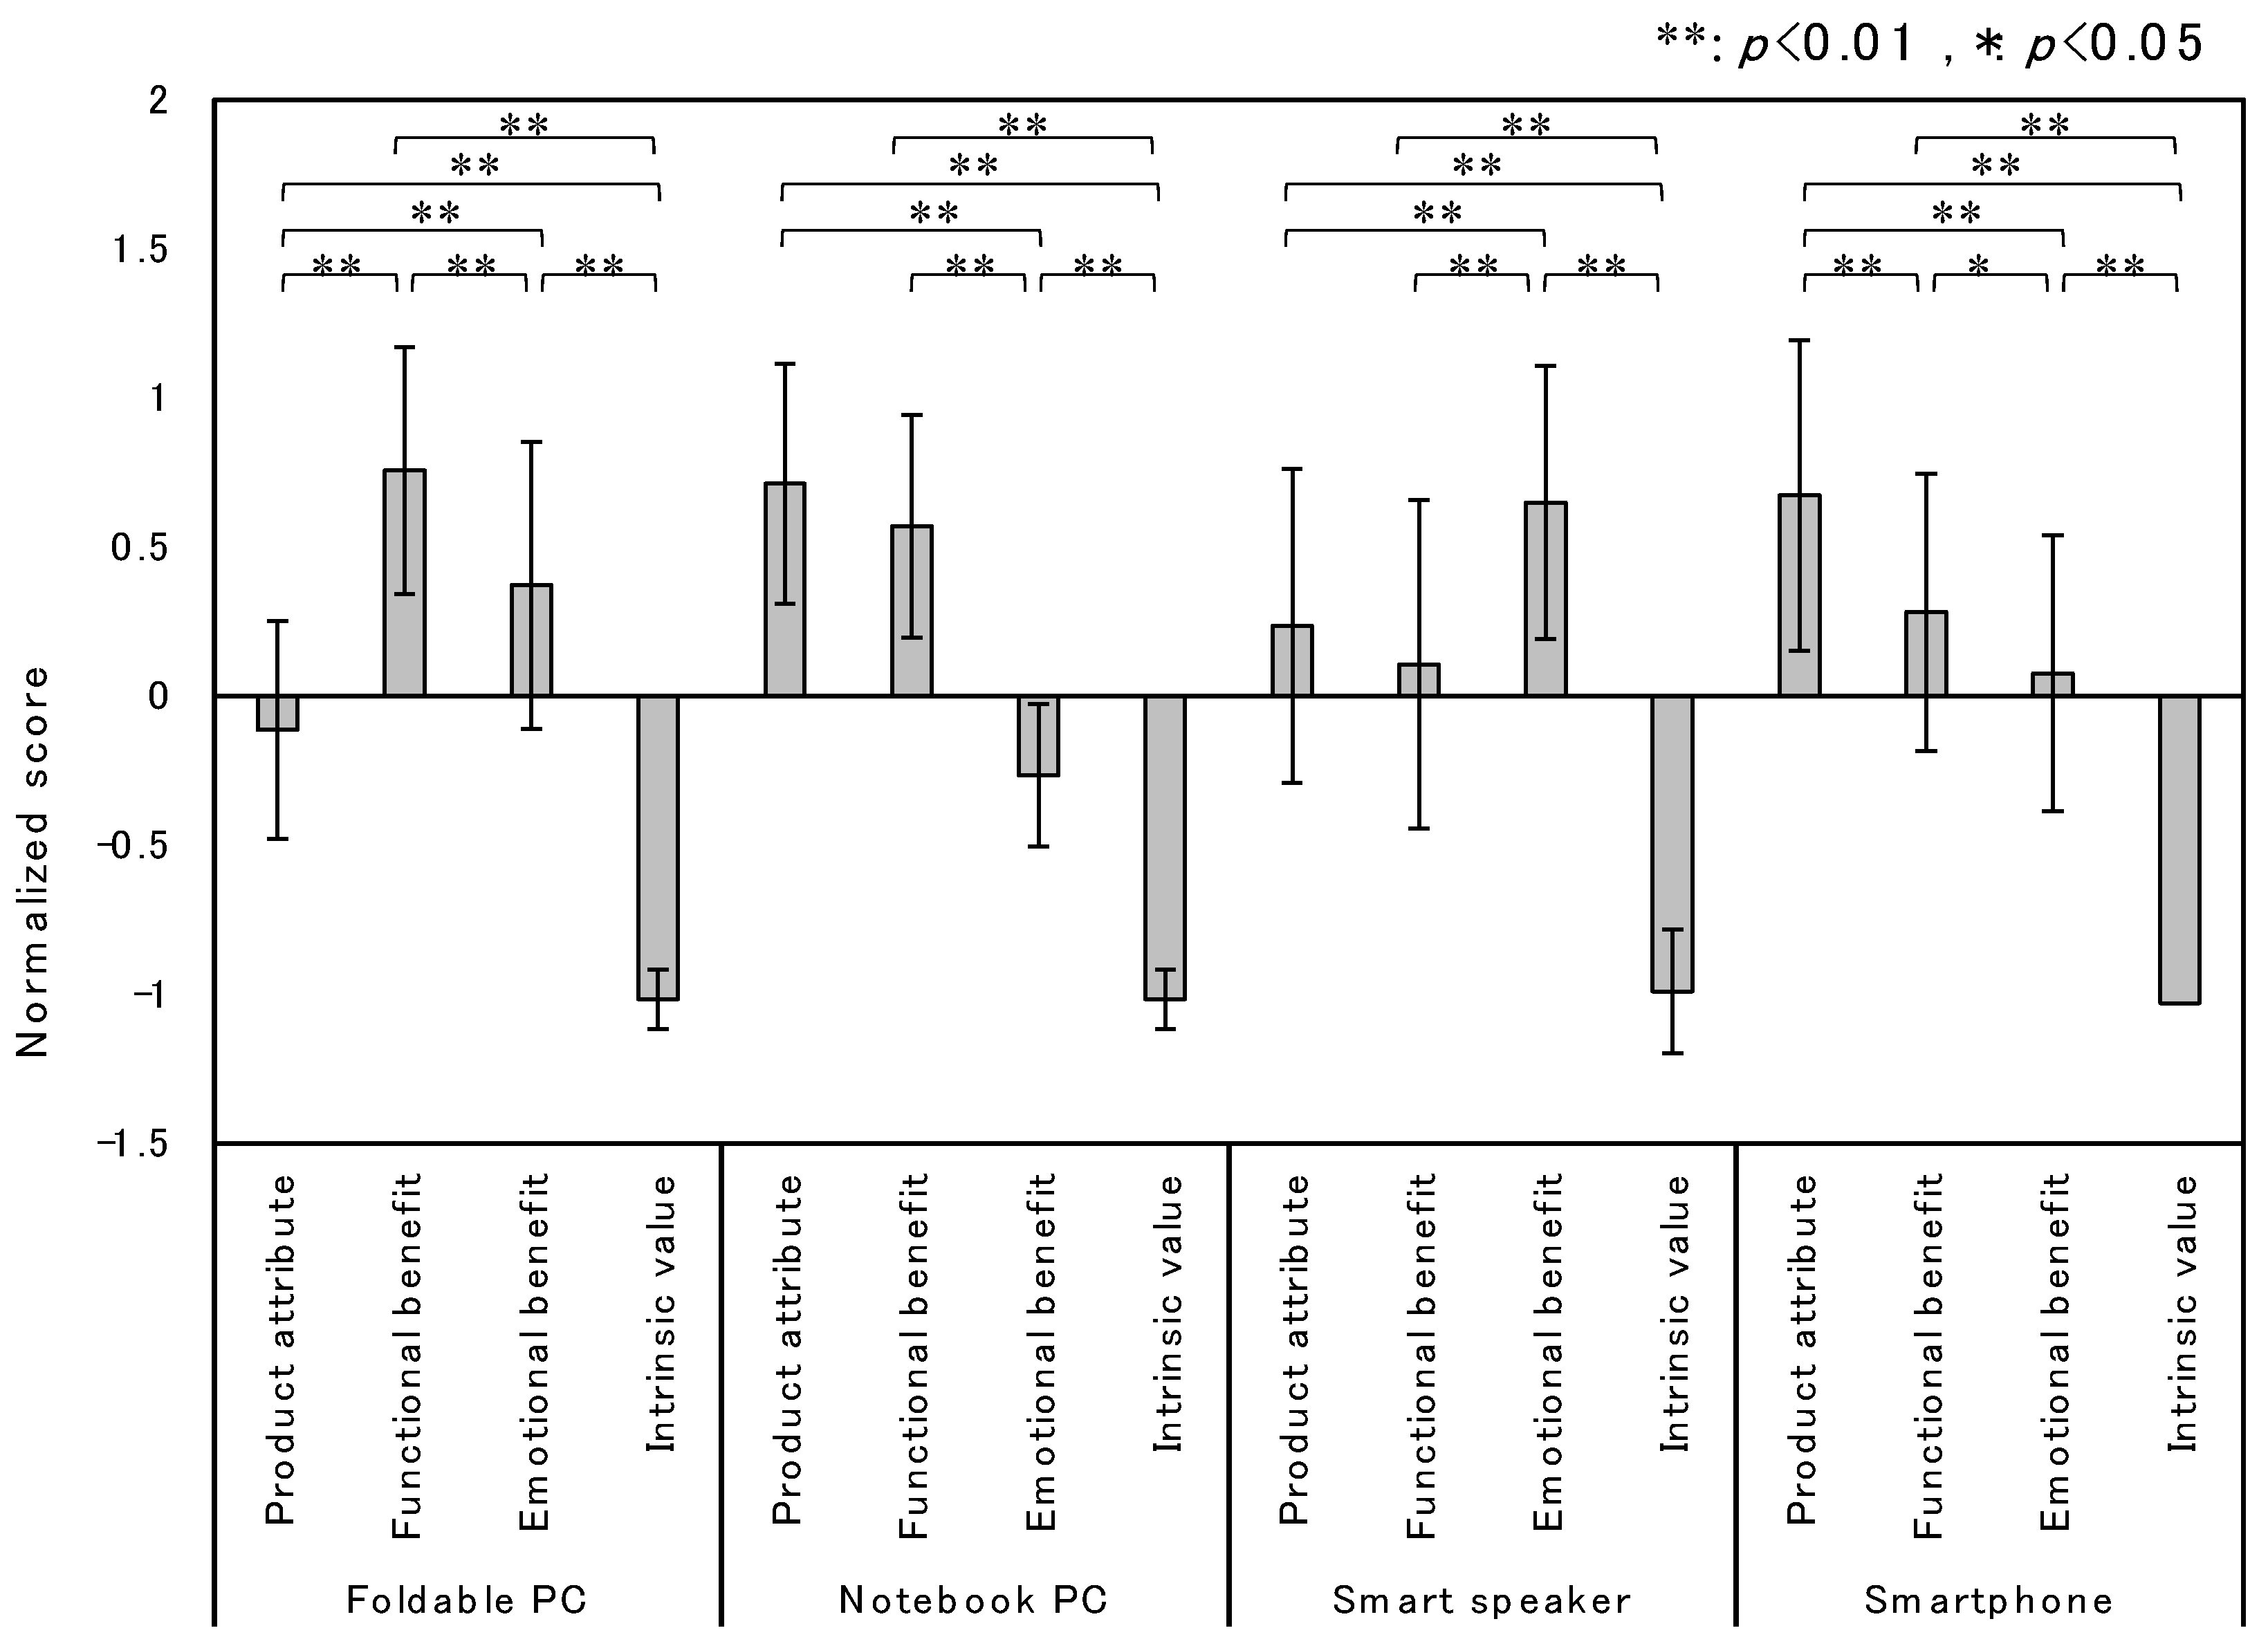
3.1. Degree of Usableness
3.2. Degree of Usefulness
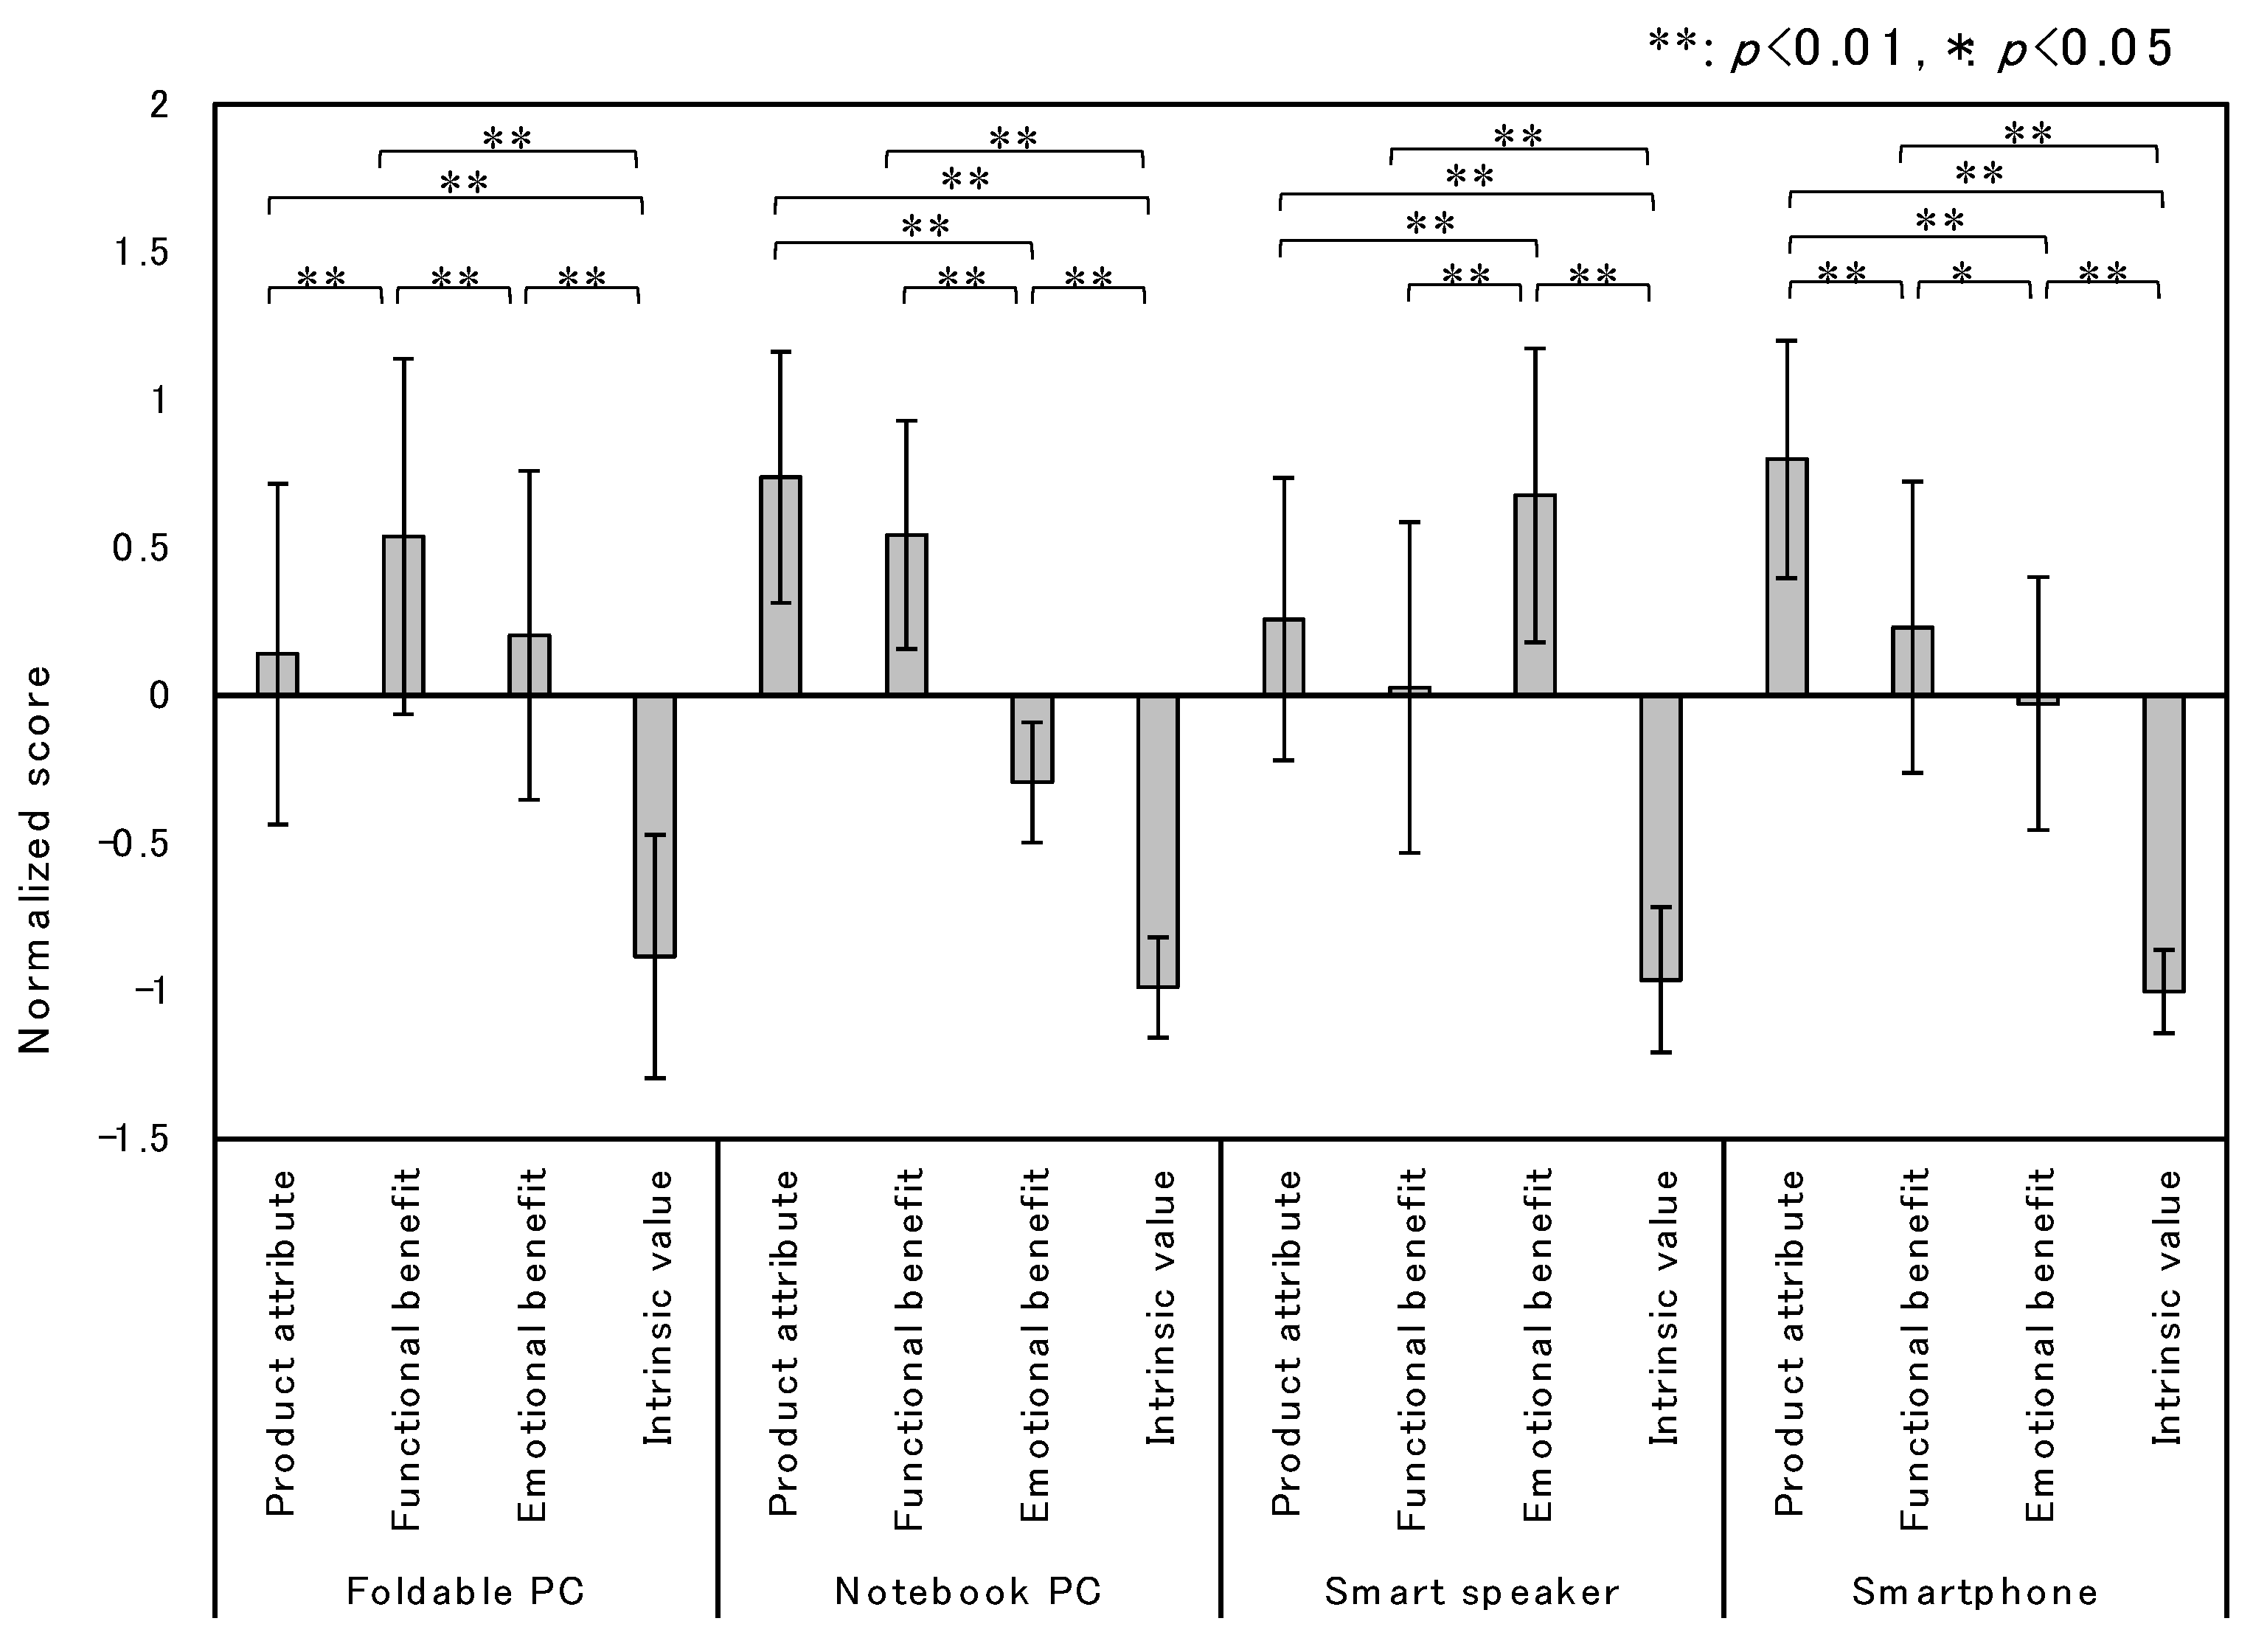
3.3. Degree of Desirableness
3.4. Degree of Willingness to Use
3.5. Ease of Imagining Usage
4. Discussion
5. Conclusions
Author Contributions
Funding
Data Availability Statement
Conflicts of Interest
References
- Maslow, A.H. A Theory of Human Motivation. Psychol. Rev. 1943, 50, 370–396. [Google Scholar] [CrossRef]
- Hancock, P.A.; Pepe, A.A.; Murphy, L.L. Hedonomics: The power of positive and pleasurable ergonomics. Ergon. Des. 2005, 13, 8–14. [Google Scholar] [CrossRef]
- Krippendorff, K. The Semantic Turn: A New Foundation for Design; CRC Press: Boca Raton, FL, USA, 2006. [Google Scholar]
- Pine, B.J.; Gilmore, J.H. Welcome to the experience economy. Harv. Bus. Rev. 1998, 76, 97–105. [Google Scholar] [PubMed]
- Schmitt, B. Experiential marketing. J. Mark. Manag. 1999, 15, 53–67. [Google Scholar] [CrossRef]
- Norman, D.A. The Psychology of Everyday Things; Basic Books: New York, NY, USA, 1988. [Google Scholar]
- Norman, D.A. Emotional Design: Why We Love (or Hate) Everyday Things; Basic Books: New York, NY, USA, 2003. [Google Scholar]
- Jordan, P.W. Human factors for pleasure in product use. Appl. Ergon. 1998, 29, 25–33. [Google Scholar] [CrossRef]
- Hassenzahl, M.; Platz, A.; Burmester, M.; Lehner, K. Hedonic and Ergonomic Quality Aspects Determine a Software’s Appeal. In Proceedings of the CHI2000, Hague, The Netherlands, 1–6 April 2000; pp. 201–208. [Google Scholar]
- Levy, J. UX Strategy: How to Devise Innovative Digital Products that People Want; O’Reilly Media: Sebastopol, CA, USA, 2015. [Google Scholar]
- Gothelf, J.; Seiden, H. Lean UX: Designing Great Products with Agile Teams; O’Reilly Media: Sebastopol, CA, USA, 2021. [Google Scholar]
- Ando, M. User Experience Design Textbook; Maruzen Publishing: Tokyo, Japan, 2016. (In Japanese) [Google Scholar]
- Hassenzahl, M.; Diefenbach, S.; Göritz, A. Needs, affect, and interactive products–Facets of user experience. Interact. Omput. 2010, 22, 353–362. [Google Scholar] [CrossRef]
- Kujala, S.; Väänänen-Vainio-Mattila, K. Value of information systems and products: Understanding the users’ perspective and values. J. Inf. Technol. Theory Appl. 2009, 9, 23–39. [Google Scholar]
- Pucillo, F.; Cascini, G. A framework for user experience, needs and affordances. Des. Stud. 2014, 35, 160–179. [Google Scholar] [CrossRef]
- Karapanos, E.; Martens, J.; Hassenzahl, M. Reconstructing experiences with iScale. Int. J. Hum. Comput. Stud. 2012, 70, 849–865. [Google Scholar] [CrossRef]
- Kujala, S.; Roto, V.; Väänänen-Vainio-Mattila, K.; Karapanos, E.; Sinnelä, A. UX curve: A method for evaluating long-term user experience. Interact. Comput. 2011, 23, 473–483. [Google Scholar] [CrossRef]
- Varsaluoma, J.; Kentta, V. Draw UX: Web-Based Research Tool for Long-Term User experience Evaluation. In Proceedings of the NordiCHI2012, Copenhagen, Denmark, 14–17 October 2012; pp. 769–770. [Google Scholar]
- Feng, L.; Wei, W. An Empirical Study on User Experience Evaluation and Identification of Critical UX Issues. Sustainability 2019, 11, 2432. [Google Scholar] [CrossRef]
- Jones, A.; Thoma, V. Determinants for successful agile collaboration between UX designers and software developers in a complex organization. Int. J. Hum.-Comput. Interact. 2019, 35, 1914–1935. [Google Scholar] [CrossRef]
- Kashi, P.; Feldt, R.; Nilsson, A. Integrating UX principles and practices into software development organizations: A case study of influencing events. J. Syst. Softw. 2019, 154, 37–58. [Google Scholar] [CrossRef]
- Wilkinson, C.R.; De Angeli, A. Applying user centred and participatory design approaches to commercial product development. Des. Stud. 2014, 35, 614–631. [Google Scholar] [CrossRef]
- Luther, L.; Tiberius, V.; Brem, A. User Experience (UX) in Business, Management, and Psychology: A Bibliometric Mapping of the Current State of Research. Multimodal Technol. Interaction 2020, 4, 18. [Google Scholar] [CrossRef]
- Roto, V.; Law, E.; Vermeeren, A.; Hoonhout, J. User Experience White Paper–Bringing Clarify to the Concept of User Experience. 2011. Available online: https://experience.aalto.fi/wp-content/uploads/2020/04/UX-WhitePaper.pdf (accessed on 7 April 2023).
- Yogasara, T.; Popovic, V.; Kraal, B.; Chamorro-Koc, M. General Characteristics of Anticipated User Experience (AUX) with Interactive Products. In Proceedings of the IASDR2011, Delft, The Netherlands, 31 October–4 November 2011; pp. 1–11. [Google Scholar]
- Noborio, K.; Ando, M. The Expressive Method of Concept Evaluation of Effect in UX Design. Trans. Hum. Interface Soc. 2017, 19, 87–96. (In Japanese) [Google Scholar]
- Ando, M. Significance of Value Transmission on UX Design. IPSJ SIG Tech. Rep. 2016, 103, 1–8. (In Japanese) [Google Scholar]
- Yamaoka, T. Manufacturing Attractive Products Logically by Using Human Design Technology: A Case of Japanese Methodology. In Human Factors and Ergonomics in Consumer Product Design: Methods and Techniques; Karwowski, W., Soares, M.M., Stanton, N.A., Eds.; CRC Press: Boca Raton, FL, USA, 2011; pp. 21–36. [Google Scholar]
- Doi, T. Value-centered design process for UX enhancement–A case study in the development of a notebook PC. Ergon. Des. 2021, 29, 26–31. [Google Scholar]
- Ando, M. Designing for User Experience: An Approach to Design Touchpoints for Product & Service with the Goal of Experience-value. J. Jpn. Soc. Des. Eng. 2020, 55, 7–13. (In Japanese) [Google Scholar]
- Sanui, J. Visualization of users’ requirements: Introduction of the Evaluation Grid Method. In Proceedings of the 3rd Design & Decision Support Systems in Architecture & Urban Planning Conference, Spa, Belgium, 18–21 August 1996; pp. 365–374. [Google Scholar]
- Reynolds, T.J.; Gutman, J. Advertising is image management. J. Advert. Res. 1984, 24, 27–38. [Google Scholar]
- Ueda, T. Marketing Research Logic and Techniques, 4th ed.; Nippon Hyoron Sya: Tokyo, Japan, 2010. (In Japanese) [Google Scholar]
- Haley, E. Remembering the FCB Grid: Thinking, Feeling, and Involvement in the Age of Social Media. J. Advert. 2022, 51, 323–335. [Google Scholar] [CrossRef]
- Ando, M. A Qualitative Approach for Psychological Factors in Use of Interactive Products. Trans. Hum. Interface Soc. 2010, 12, 345–355. (In Japanese) [Google Scholar]
- Null, R.L.; Cherry, K.F. Universal Design; Professional Publications Inc: Belmont, CA, USA, 1998. [Google Scholar]
- Yamazaki, K.; Yamaoka, T.; Saitoh, S.; Yanagida, K.; Okada, A.; Nomura, M.; Horino, S. Practical Universal Design Guidelines: A New Proposal. In Handbook of Standards and Guidelines in Ergonomics and Human Factors; Karwowski, W., Ed.; CRC Press: Boca Raton, FL, USA, 2005. [Google Scholar]
- Ando, M. A Role of a Product Involvement in Use of Interactive Product. IPSJ SIG Tech. Rep. 2008, 130, 69–74. (In Japanese) [Google Scholar]
- Sato, M. Introduction to Sensory Testing; JUSE Press: Tokyo, Japan, 1978; pp. 74–76. (In Japanese) [Google Scholar]
- Shimizu, H. An introduction to the statistical free software HAD: Suggestions to improve teaching, learning and practice data analysis. J. Media Inf. Commun. 2016, 1, 59–73. (In Japanese) [Google Scholar]
- Zhao, M.; Hoeffiler, S.; Dahl, D. Visualization and new product evaluation: The role of memory-and imagination-focused visualization. Adv. Consum. Res. 2007, 34, 235–237. [Google Scholar] [CrossRef]
- Petrova, P.K.; Ciadini, R.b. Fluency of consumption imagery and the backfire effects of imagery appeals. J. Consum. Res. 2005, 32, 442–452. [Google Scholar] [CrossRef]
- Hernandez, J.M.C.; Wright, S.A.; Rodrigues, F.F. Attributes versus benefits: The role of construal levels and appeal type on the persuasiveness of marketing messages. J. Advert. 2015, 44, 243–253. [Google Scholar] [CrossRef]
- Trope, Y.; Liverman, N. Construal-level theory of psychological distance. Psychol. Rev. 2010, 117, 440–463. [Google Scholar] [CrossRef]
- Van den Hende, E.A.; Dahl, D.W.; Schoormans, J.P.L.; Snelders, D. Narrative transportation in concept tests for really new products: The moderating effect of reader-protagonist similarity. J. Prod. Innov. Manag. 2012, 29, 157–170. [Google Scholar] [CrossRef]
- Huang, S.L.; Lin, Y.H. Exploring consumer online purchase and search behavior: An FCB grid perspective. Asia Pac. Manag. Rev. 2022, 27, 245–256. [Google Scholar] [CrossRef]
- Ruiz, S.; Sicilia, M. The impact of cognitive and/or affective processing styles on consumer response to advertising appeals. J. Bus. Res. 2004, 57, 657–664. [Google Scholar] [CrossRef]


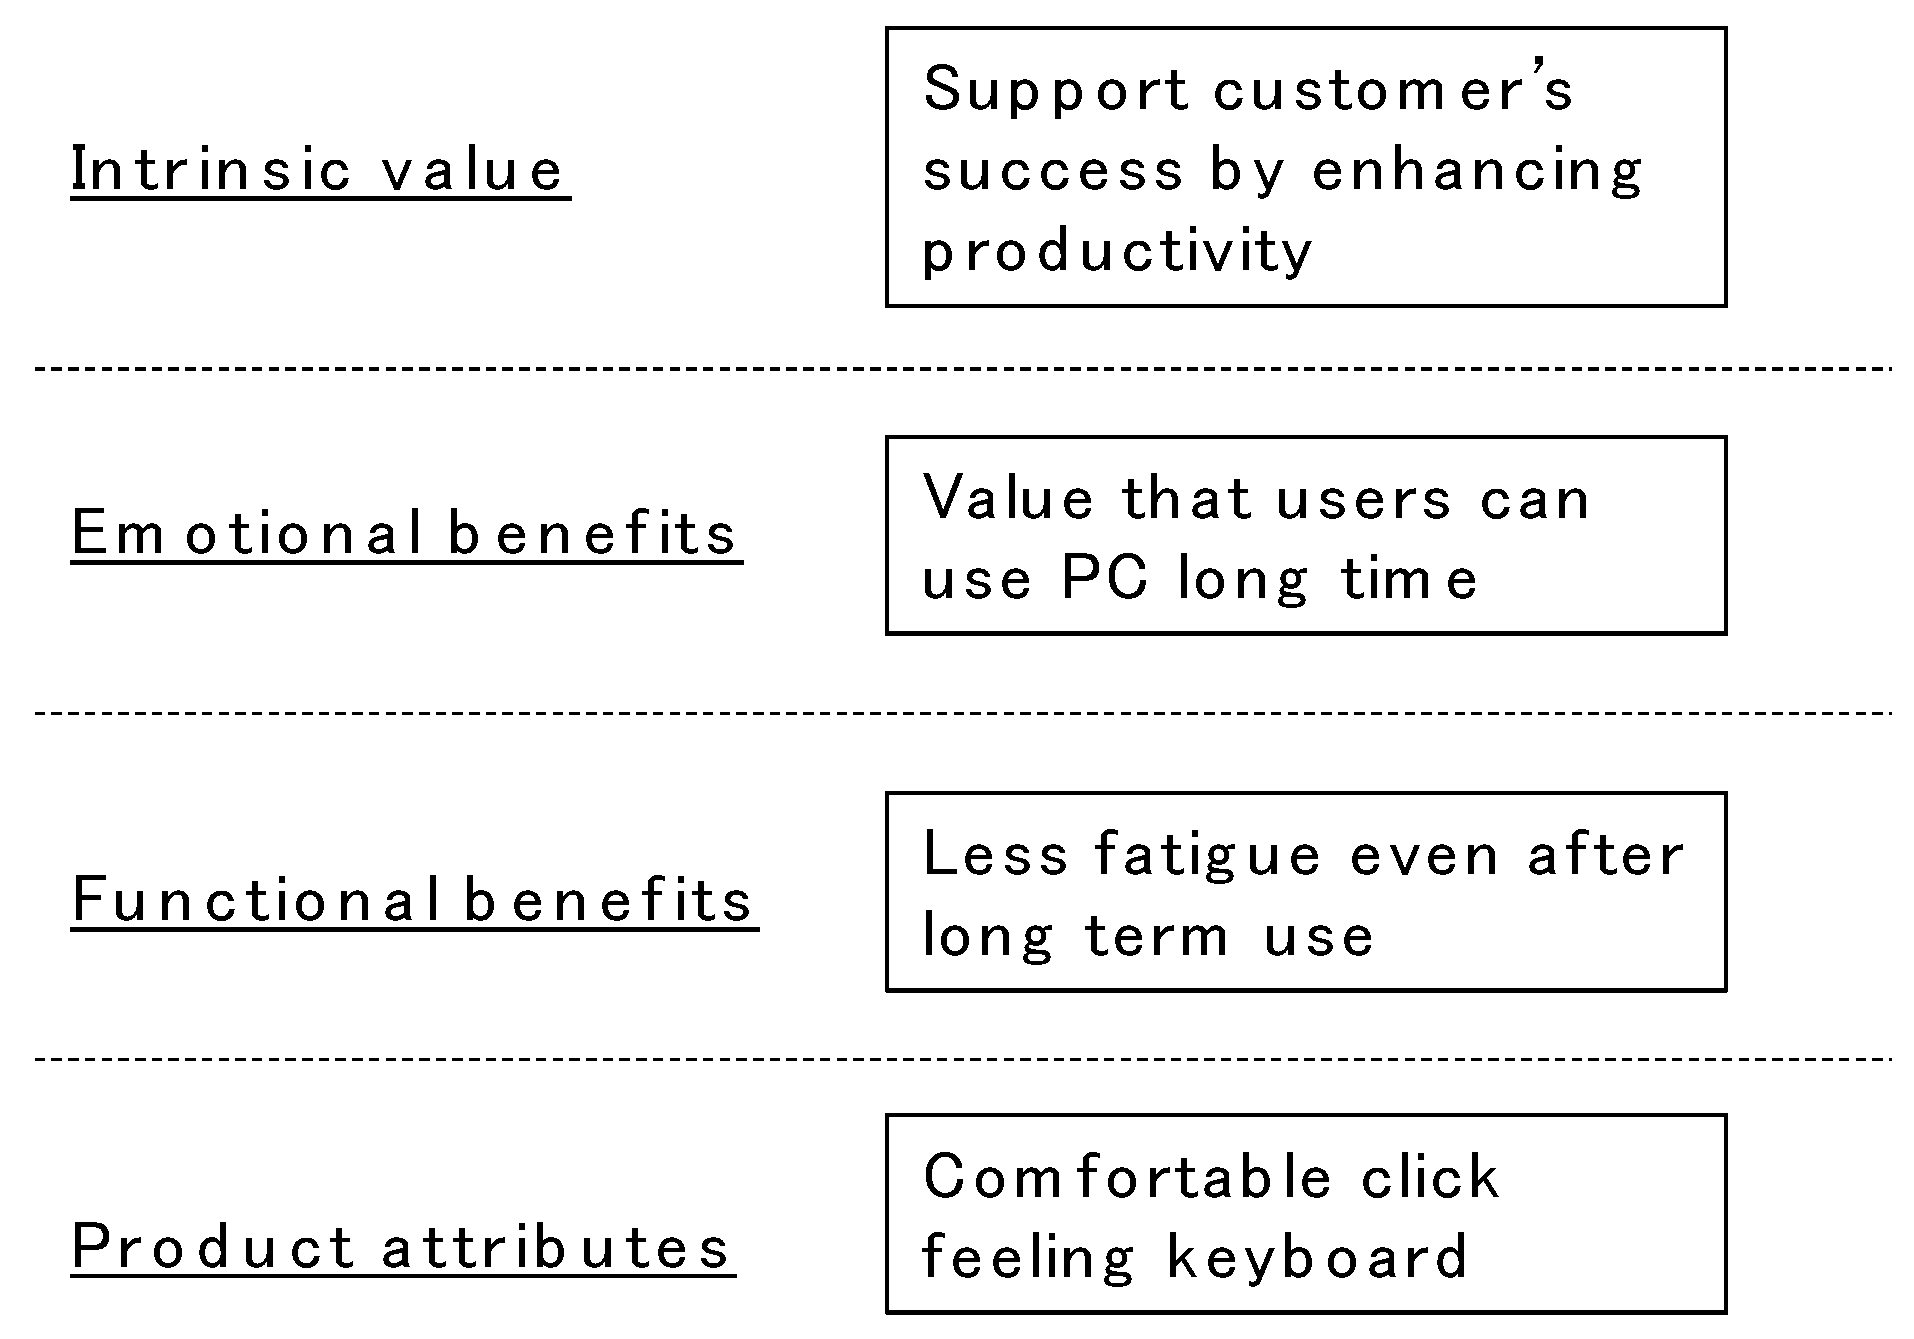
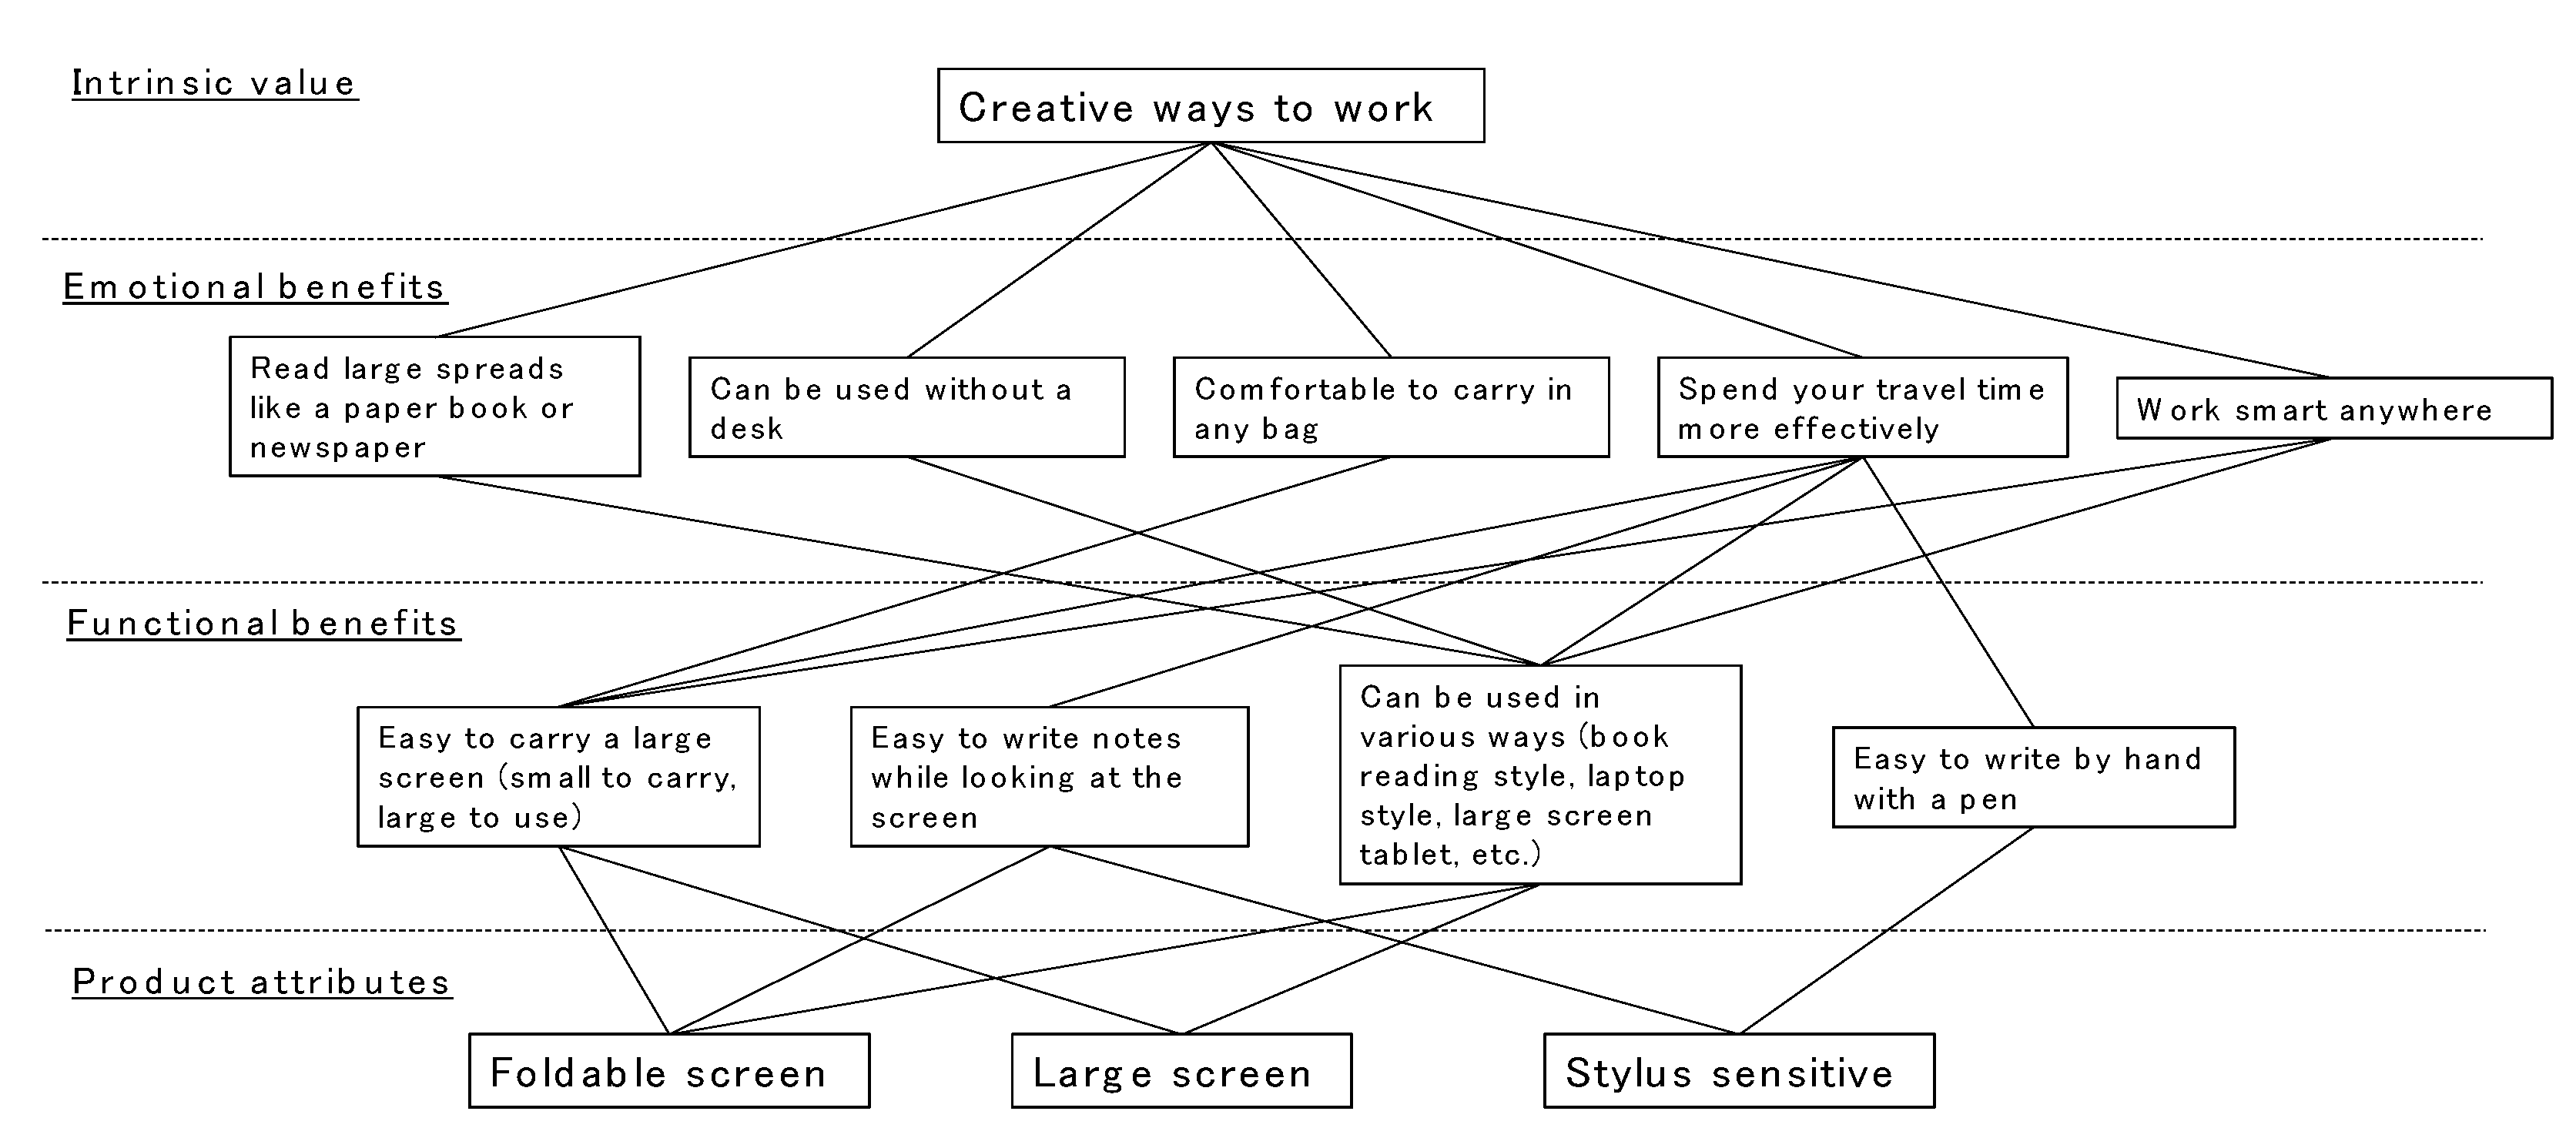
| Value Expression Level | Definition |
|---|---|
| Product attribute | Physical characteristics of the product |
| Functional benefit | Objective and functional utility related to the function of the product derived directly from its attributes |
| Emotional benefit | Subjective utility of the user as perceived by objective benefits |
| Intrinsic value | Intrinsic needs of the user |
| Introductory Phase | Mature Phase | |
|---|---|---|
| Mainly business use (thinking type) | Foldable PC | Notebook PC |
| Mainly home life use (emotional type) | Smart speaker | Smartphone |
| Please rank the above Foldable PCs (A)~(D) in order of their usableness to you, with #1 being the most usable product. |
| Please rank the above Foldable PCs (A)~(D) in order of their usefulness to you, with #1 being the most useful product. |
| Please rank the above Foldable PCs (A)~(D) in order of their desirableness to you, with #1 being the most desirable product. |
| Please rank the above Foldable PCs (A)~(D) in order of your willingness to use them, with #1 being the product you feel most motivated to use. |
| Q1 | I find this product a pleasure to use. |
| Q2 | This product is related to my hobbies and interests. |
| Q3 | I can imagine myself actively using the product. |
| Q4 | This product reflects my personality. |
| Q5 | I would like to have a new model when it is released. |
| Q6 | I am very interested in new models when they are released. |
| Q7 | I have a general knowledge of the functions of new models. |
| Q8 * | I cannot imagine what effect this product will have on my life. |
| Q9 * | I do not know how to use this product. |
| Q10 * | I cannot imagine how to use this product for my own benefit. |
Disclaimer/Publisher’s Note: The statements, opinions and data contained in all publications are solely those of the individual author(s) and contributor(s) and not of MDPI and/or the editor(s). MDPI and/or the editor(s) disclaim responsibility for any injury to people or property resulting from any ideas, methods, instructions or products referred to in the content. |
© 2023 by the authors. Licensee MDPI, Basel, Switzerland. This article is an open access article distributed under the terms and conditions of the Creative Commons Attribution (CC BY) license (https://creativecommons.org/licenses/by/4.0/).
Share and Cite
Doi, T.; Doi, S. Which Hierarchical Levels of Value Description of Design Concepts Enhance Anticipated UX? Effects of Product Type on User Expectations. Systems 2023, 11, 230. https://doi.org/10.3390/systems11050230
Doi T, Doi S. Which Hierarchical Levels of Value Description of Design Concepts Enhance Anticipated UX? Effects of Product Type on User Expectations. Systems. 2023; 11(5):230. https://doi.org/10.3390/systems11050230
Chicago/Turabian StyleDoi, Toshihisa, and Sayoko Doi. 2023. "Which Hierarchical Levels of Value Description of Design Concepts Enhance Anticipated UX? Effects of Product Type on User Expectations" Systems 11, no. 5: 230. https://doi.org/10.3390/systems11050230
APA StyleDoi, T., & Doi, S. (2023). Which Hierarchical Levels of Value Description of Design Concepts Enhance Anticipated UX? Effects of Product Type on User Expectations. Systems, 11(5), 230. https://doi.org/10.3390/systems11050230