Article

A Multivariate Deep Learning Model with Coupled Human Intervention Factors for COVID-19 Forecasting

1
School of Management, Lanzhou University, Lanzhou 730000, China
2
Research Center for Emergency Management, Lanzhou University, Lanzhou 730000, China
3
College of Atmospheric Sciences, Lanzhou University, Lanzhou 730000, China
*
Author to whom correspondence should be addressed.
Systems 2023, 11(4), 201; https://doi.org/10.3390/systems11040201
Submission received: 1 March 2023 / Revised: 10 April 2023 / Accepted: 13 April 2023 / Published: 17 April 2023
(This article belongs to the Special Issue Human–AI Teaming: Synergy, Decision-Making and Interdependency)

Abstract

:
Artificial intelligence (AI) technology plays a crucial role in infectious disease outbreak prediction and control. Many human interventions can influence the spread of epidemics, including government responses, quarantine, and economic support. However, most previous AI-based models have failed to consider human interventions when predicting the trend of infectious diseases. This study selected four human intervention factors that may affect COVID-19 transmission, examined their relationship to epidemic cases, and developed a multivariate long short-term memory network model (M-LSTM) incorporating human intervention factors. Firstly, we analyzed the correlations and lagged effects between four human factors and epidemic cases in three representative countries, and found that these four factors typically delayed the epidemic case data by approximately 15 days. On this basis, a multivariate epidemic prediction model (M-LSTM) was developed. The model prediction results show that coupling human intervention factors generally improves model performance, but adding certain intervention factors also results in lower performance. Overall, a multivariate deep learning model with coupled variable correlation and lag outperformed other comparative models, and thus validated its effectiveness in predicting infectious diseases.

1. Introduction

With global warming, ecological changes, and urbanization in recent decades, an increasing number of pathogenic microorganisms have mutated, making outbreaks of major infectious diseases more frequent, increasing by one or more species per year [1]. For example, SARS, influenza A(H1N1), H7N9, Ebola hemorrhagic fever, and COVID-19 have triggered a series of major public health outbreaks. These diseases pose a serious threat to human health, social stability, and public safety due to characteristics such as high infectivity and their rapid, wide-ranging transmission.
Since the outbreak of COVID-19, researchers have been increasingly interested in the application of AI techniques to COVID-19 responses [2]. Examples include AI-based diagnosis of viral images and symptoms [3,4,5], prediction of the number of cases [6,7,8], intelligent contact tracing [9], and artificial intelligence-assisted drug discovery [10]. Particularly, a majority of studies have been dedicated to the use of machine learning techniques to predict the number of infections. For instance, Ly et al. [11] used an adaptive neuro-fuzzy inference system to predict COVID-19 cases in the UK and showed that data from Spain and Italy could improve the prediction ability. Based on time series data reported from 1 March 2020 to 30 April 2020, Parbat et al. [12] used support vector regression (SVR) to forecast coronavirus cases in India in 2019. Furthermore, deep learning techniques have been widely used in the prediction of COVID-19, especially the LSTM [13]. The LSTM is an extension of recurrent neural networks (RNNs), which rely on persistent prior knowledge and typically have short-term memory. Shastri et al. [14] used the LSTM to predict confirmed cases of COVID-19 and resulting deaths in both India and the United States. A mean absolute percentage error (MAPE) calculation showed that the prediction error rate for the LSTM model was 2.0 to 3.3%. Kırbaş et al. [15] used the LSTM model to predict COVID-19 cases in eight European countries. Despite the differences in human behavior, applied measures, and available data in each country/region, the LSTM outperformed ARIMA and NARNN in predicting COVID-19 cases. Mohamed et al. [16] applied several deep learning models to predict the COVID-19 outbreak in Egypt, and they found that the LSTM model showed the best performance in forecasting cumulative infections for one week and one month in advance. Devaraj et al. [17] assessed the reliability and practical implications of several AI-based models. In comparison to other algorithms considered, the stacked LSTM model had higher prediction accuracy and reliability in forecasting cumulative infections one week and one month ahead.
The above studies have shown that the LSTM algorithm is capable of accurately predicting COVID-19 epidemics. However, these studies lack consideration of possible human intervention factors that influence epidemic development when training AI models, such as government response, implementation of epidemic prevention and control measures, stringency, and economic support. Several studies have determined that non-pharmaceutical interventions by the state can significantly affect infectious disease epidemics [18,19]. It has been demonstrated that strict prevention and control measures are more effective in suppressing infectious disease epidemics, emphasizing the importance of dynamic human interventions. Hence, it is generally accepted that human intervention can influence epidemic development trends in different ways, so it is necessary to take human intervention factors into account when developing AI-based epidemic prediction models. To this end, we proposed a multivariate long short-term memory model (M-LSTM) coupled with human-influencing factors for effective infectious disease prediction. Firstly, we collected data on non-pharmaceutical interventions during the COVID-19 outbreak from Oxford University’s Oxford COVID-19 Government Response Tracker (OxCGRT) [20]. These four indexes were selected as the main factors for human intervention: overall government response, containment and health, stringency, and economic support. Subsequently, we analyzed the correlations and lagged effects between four human factors and epidemic cases in three representative countries: the United States, the United Kingdom, and India. On this basis, a multivariate epidemic prediction model (M-LSTM) was developed. Multi-group experiments were conducted to assess the prediction performance of multiple different human-influenced factor coupling schemes. Finally, the epidemic prediction model with the best-coupled variables was determined.
The contribution of our work can be summarized by the two following aspects.
(1) The relationship between human intervention factors—such as government response—and epidemic changes is unclear. Therefore, in this paper, we analyzed the correlation and lag between the four human intervention factors and data on the COVID-19 epidemic. It was found that there were significant negative correlations and lags between these two factors.
(2) To accurately predict the epidemic trend, we proposed a novel multivariate deep learning prediction model (M-LSTM) by coupling the information of human intervention factors to provide more reliable epidemic prediction results.

2. Methods and Data

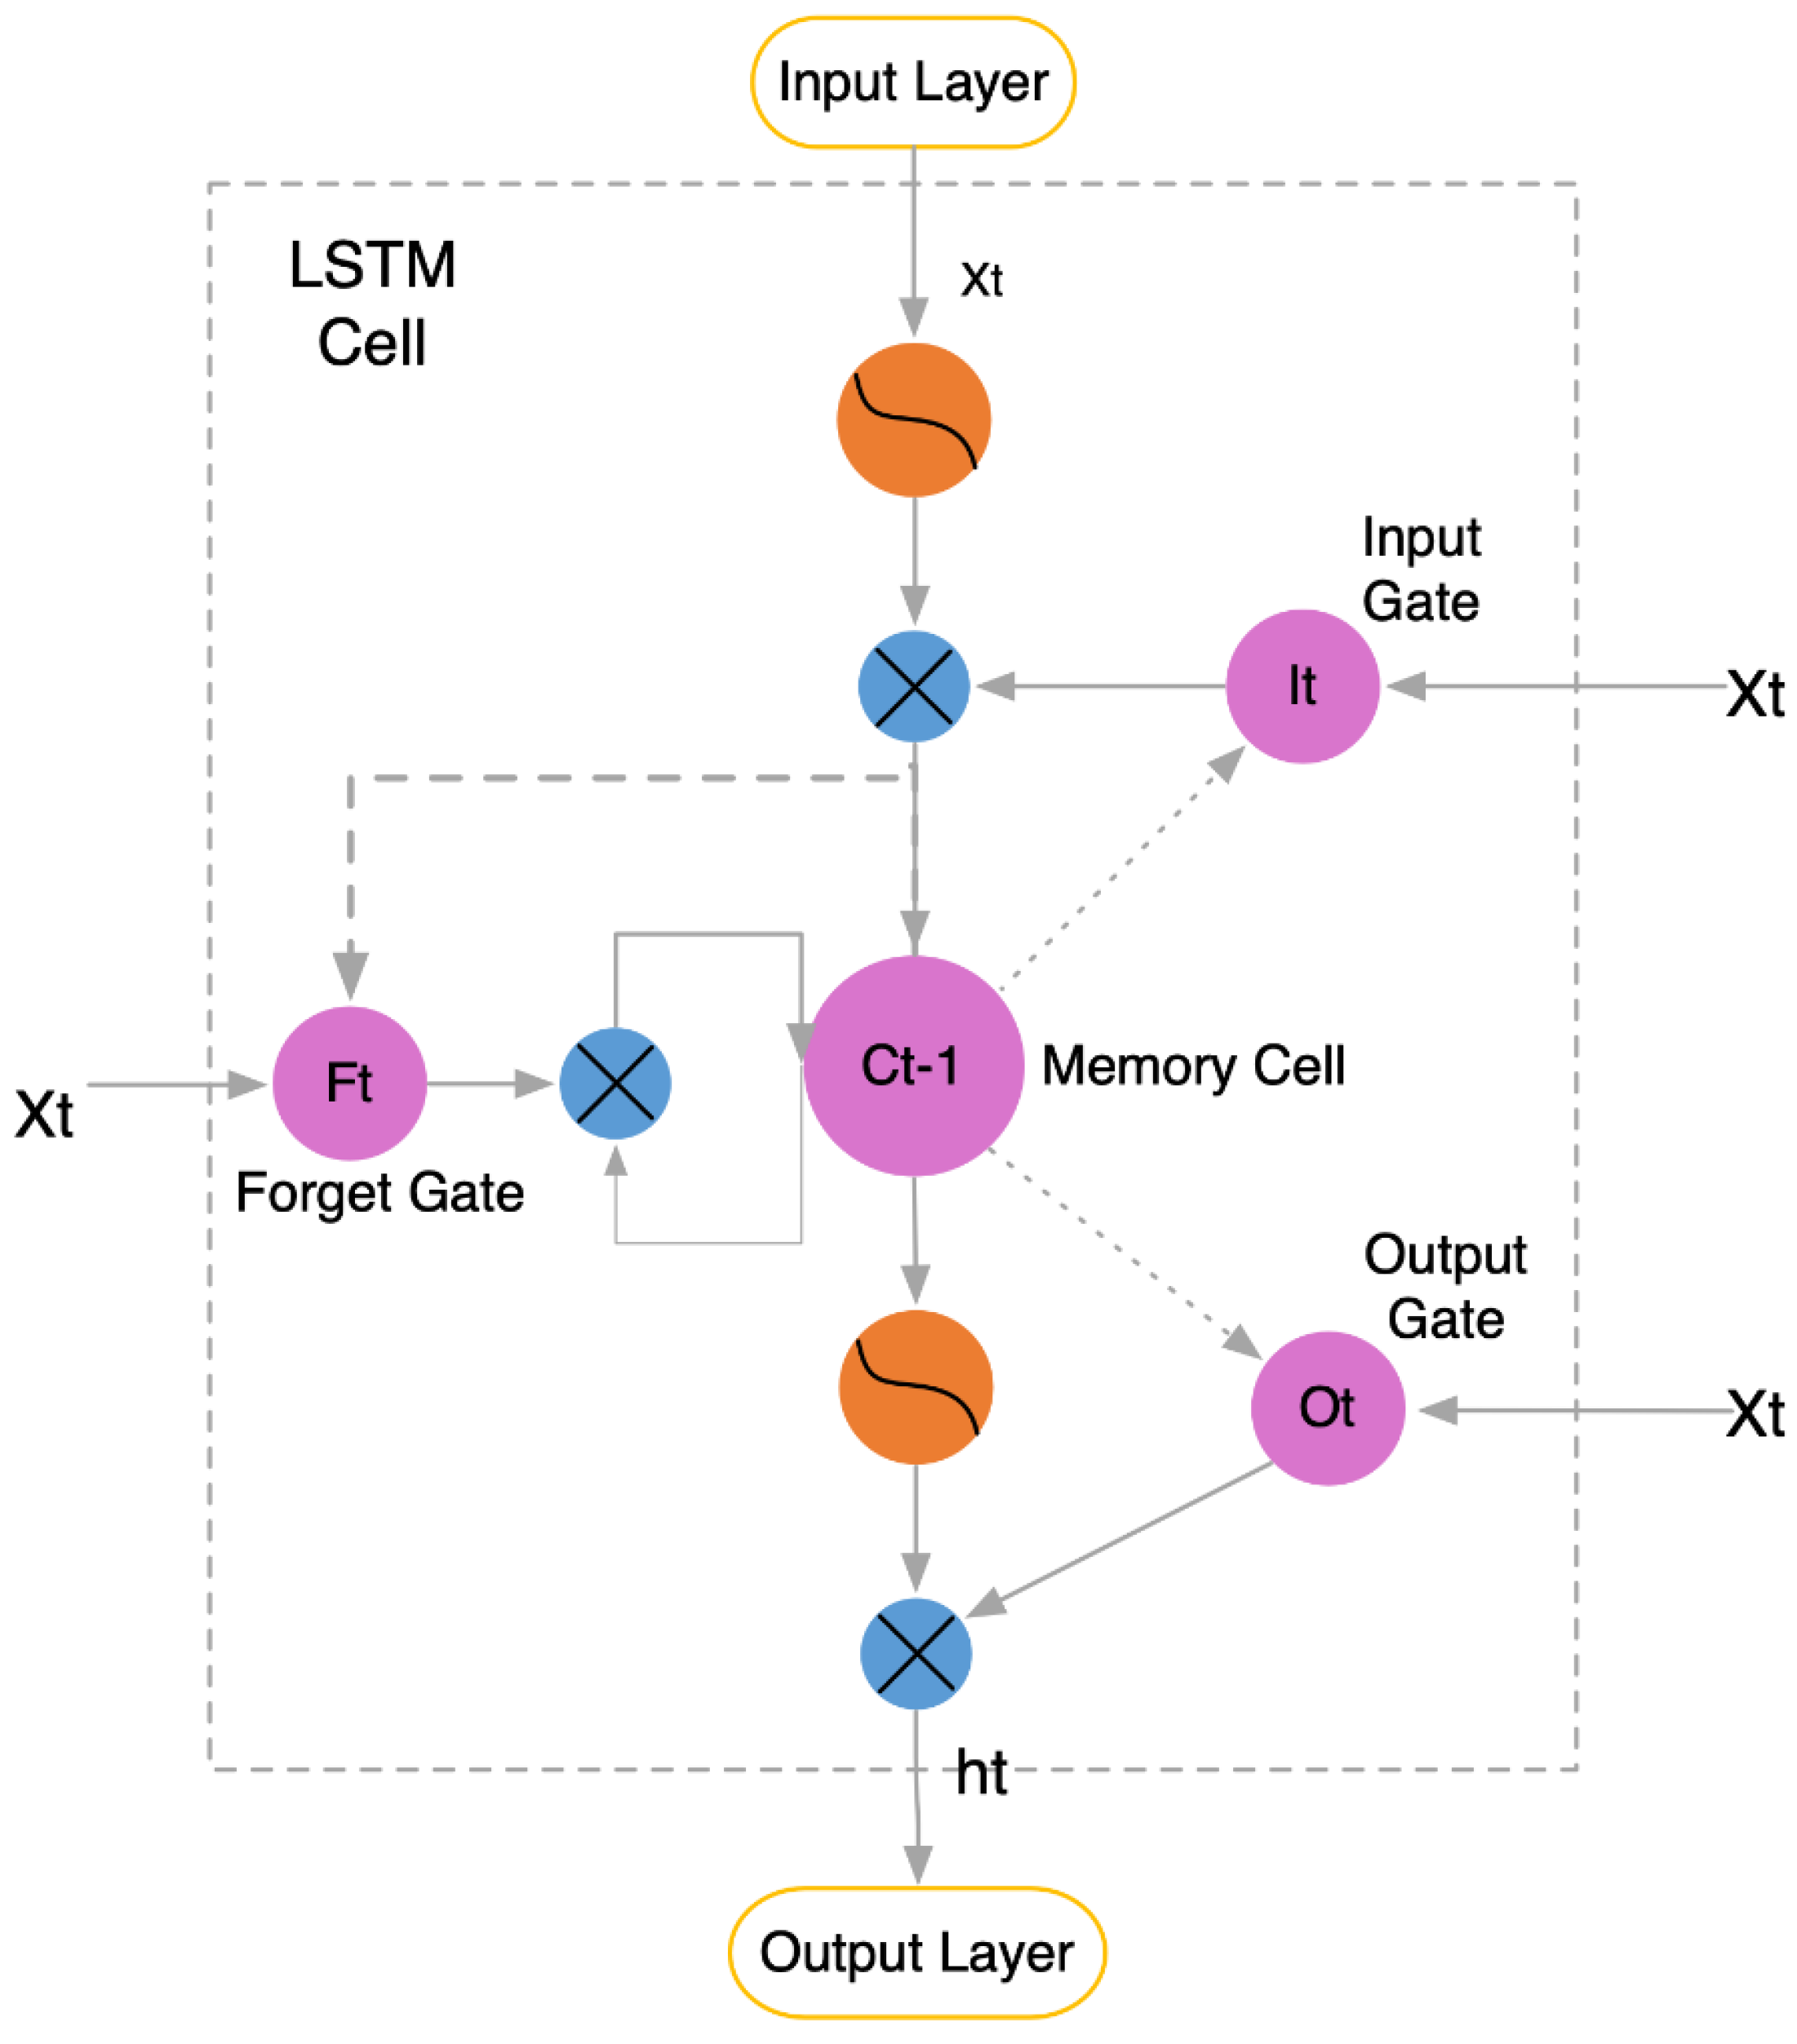
2.1. LSTM Model Principles

LSTMs, which are a special type of RNN, can learn long-term dependence. Hochreiter and Schmidhuber proposed the long short-term memory neural network, which overcomes the gradient vanishing problem and performs well in a variety of problems [21]. In the LSTM network, three gates determine the behavior of the memory unit. These gates are the input gate, the output gate, and the forgetting gate, which control whether to update or discard the data. By eliminating the disadvantages associated with the general recursive neural model of excessive weight influence and easy gradient disappearance, the network can converge more quickly and efficiently. Prediction accuracy can be effectively improved. In the LSTM network model, in addition to the hidden-layer neurons, there is a memory cell ct, which is used to encode the memory of recorded information until it reaches the time step ‘t’.
The process layer equations of the LSTM network are shown below, and the LSTM schematic is shown in Figure 1.
Input gate:
i t = sigmoid _ activation ( V i z t 1 + W i x t + b i )
Forgetting gate:
f t = sigmoid _ activation ( V f z t 1 + W f x t + b f )
Output gate:
o t = sigmoid _ activation ( V o z t 1 + W o x t + b o )
Memory cell:
c ˜ t = sigmoid _ activation ( V c z t 1 + W c x t + b c )
c t = f t c t 1 + i t c ˜ t
Final output:
h t = o t tanh _ activation ( c t )
where xt and zt are the input and output of the LSTM connectivity layer at time t; Wi, Wf, Wo, and Wc are the weights of input gate, forgetting gate, output gate, and memory cell, respectively; Vi, Vf, Vo, and Vc are the cyclic layer weight matrices of the input gate, forgetting gate, output gate, and memory cell, respectively; and bi, bf, bo, and bc are the deviation coefficients of the input gate, forgetting gate, output gate, and memory cell, respectively. The operator represents multiplication by elements.
The LSTM neural network training process is divided into the following steps: Step 1: at time step ‘t’, the forgetting gate f t is passed through the new input x t and the function of the previous hidden state z t 1 . If the forgetting gate value is close to 1, then the information from the last memory cell c t 1 will be retained and vice versa; Step 2: the new input state and the function of the previous hidden state from the input gate i t are added to the memory cell to obtain it; Step 3: the output gate decides what information should be obtained from the LSTM memory cell to simulate a new hidden state z t .

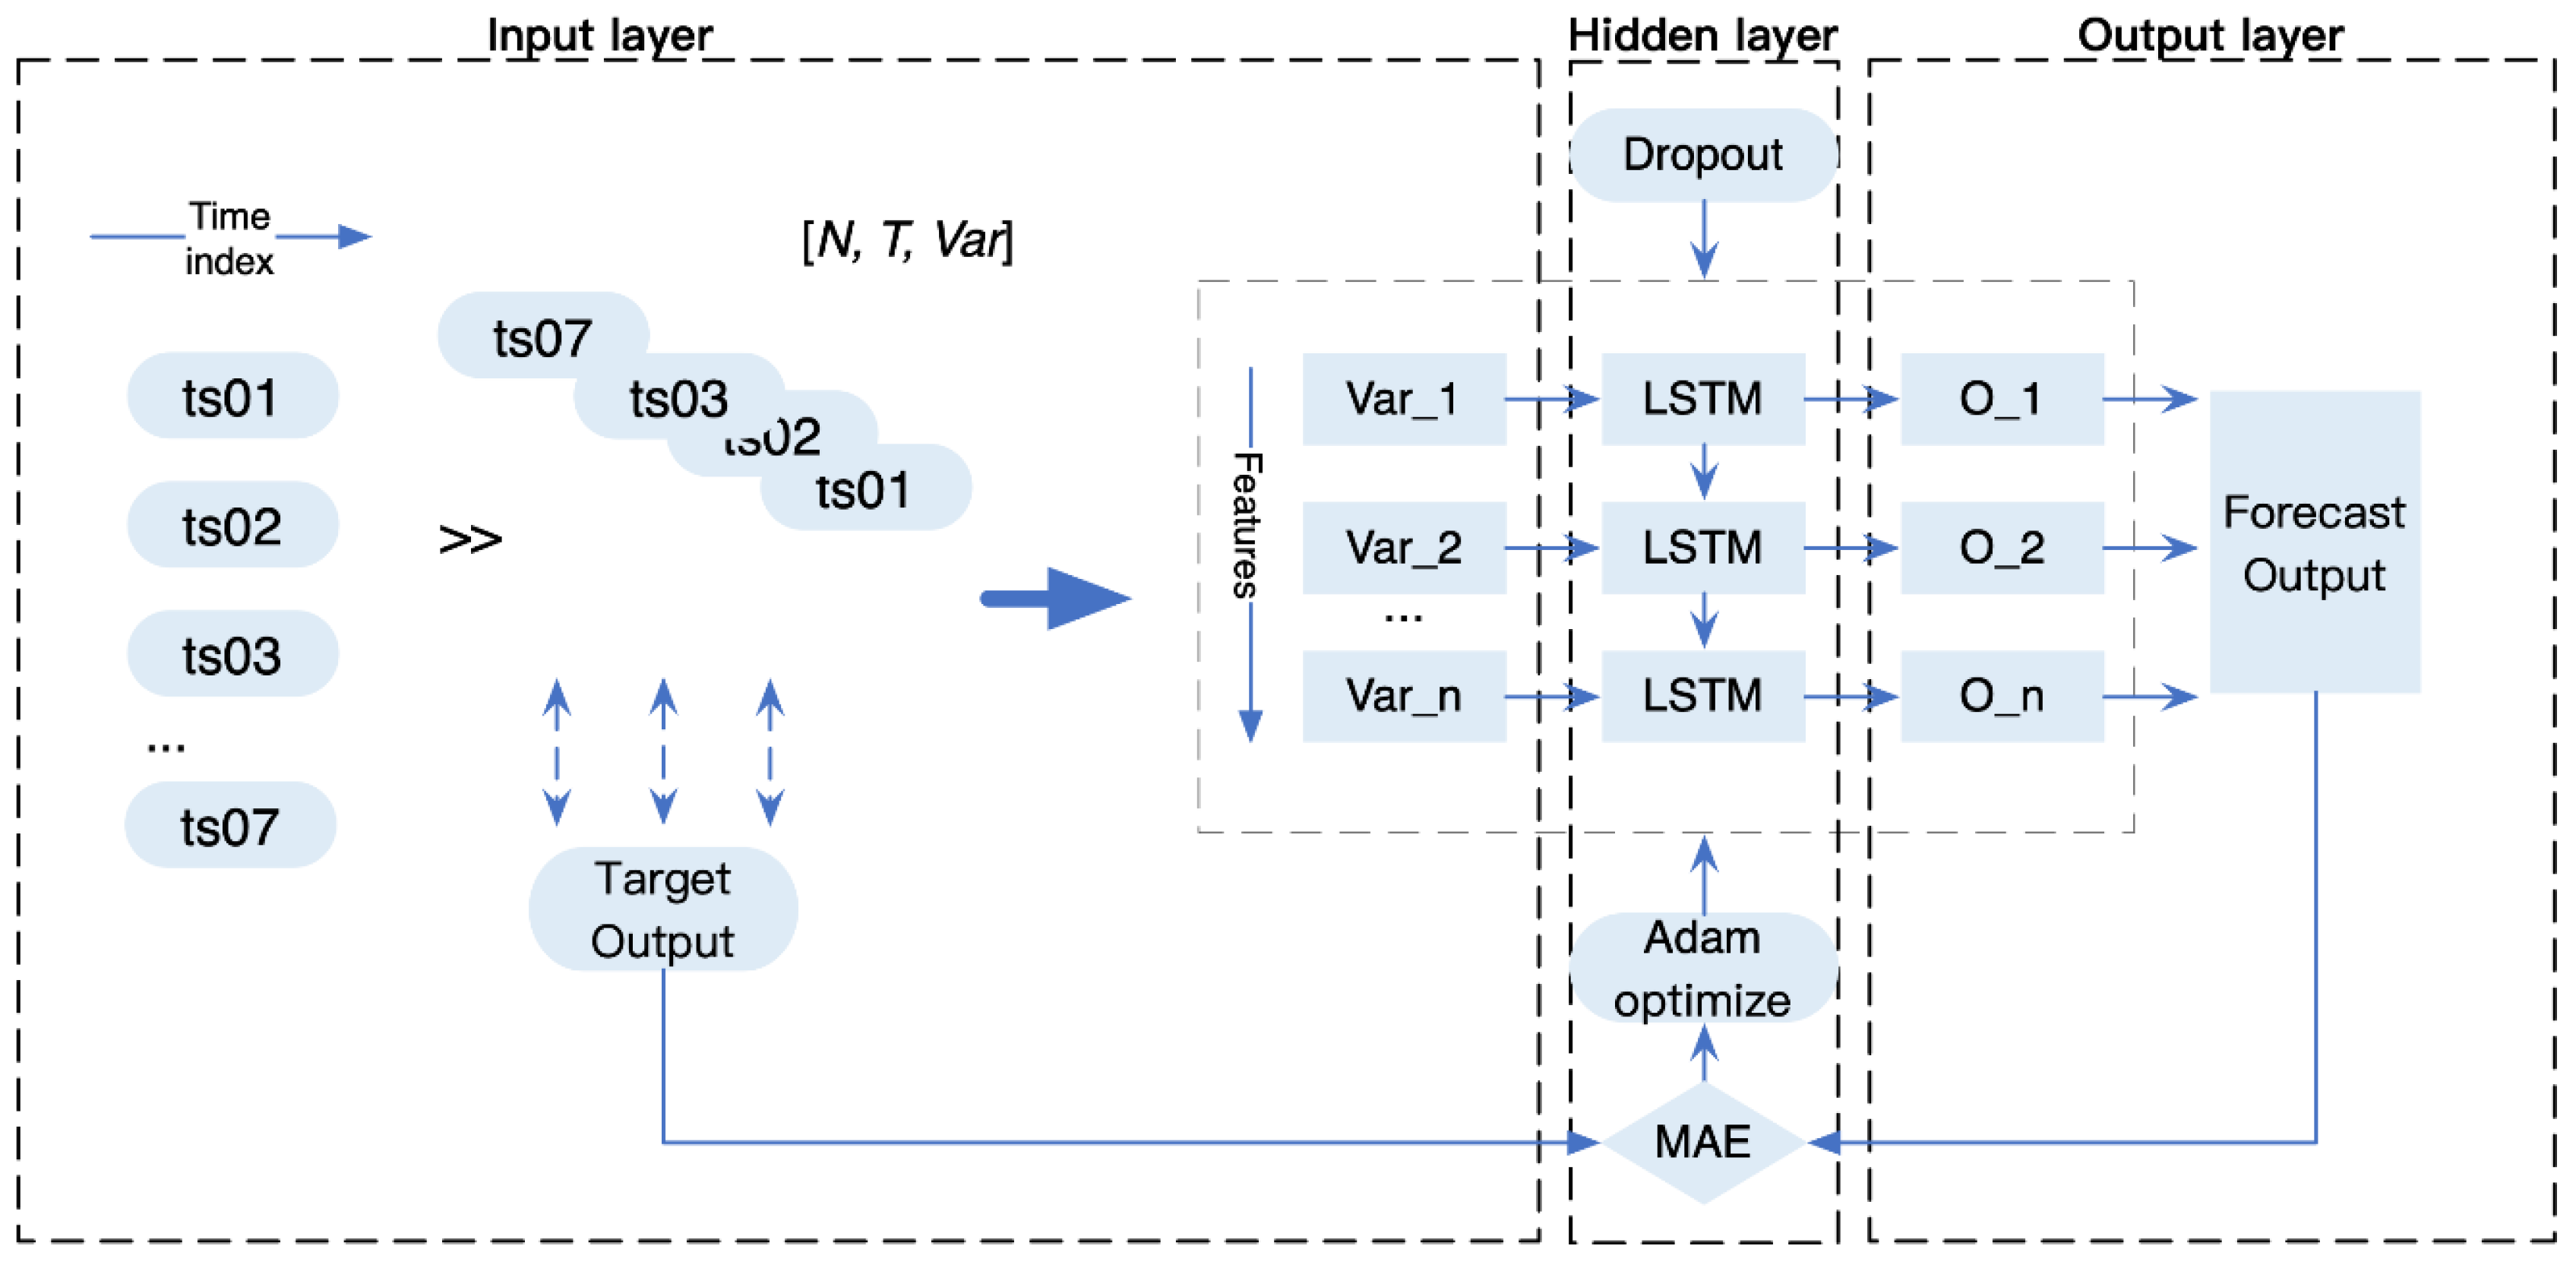
2.2. Multivariate Epidemic Prediction Model with Coupled Human Factors

This paper proposes a multivariate LSTM (M-LSTM) epidemic prediction model that combines correlation and lag between human factors to address actual changes in the epidemic. Figure 2 illustrates the topology of the network structure of the model, which consists of three layers: input, hidden, and output.
According to the M-LSTM model structure, the model training input set needs to be determined first. The three-dimensional input array is formed as [N, T, Var]. Among them, N is the size of the input samples. The variables (Var) of the input layer are selected by calculating correlations between confirmed cases and deaths with the four human influence factors. Then, considering correlations and lags between variables, multivariate forecasts based on correlation thresholds were constructed. For example, the M-LSTM (R_thred > 0.7) indicated that human-influenced variables with correlation thresholds greater than 0.7 were to be screened as inputs. The rolling time window method was used to generate time series samples. The time window T was set to 7 days (the historical data from the first 7 days were used as model inputs (denoted as ts01, ts02, …, ts07), and the future day sample values were the target outputs). Additionally, alignment time was determined based on the time lag between the four human intervention factors and the number of confirmed cases and fatalities. Subsequently, the hidden layer was composed of a 2-layer LSTM structure consisting of 64 neuron nodes in the first layer and 32 neuron nodes in the second layer. To mitigate the overfitting phenomenon during model training, the Dropout algorithm was added to the hidden layer to remove random units and connections from the neural network during training. The mean absolute error (MAE) was selected as the loss function, and the Adam algorithm was used to create optimized parameters for each node’s learning; then, the error was reduced by iterating and adjusting the weights until convergence was achieved. Finally, the prediction results were provided by the output layer, and the inverse normalization process reduced the results to the format of the original data.

2.3. Data Collection

2.3.1. COVID-19 Data Collection

Prediction model accuracy depends on historical data, so sufficient historical data on the outbreak are required. In this study, we collected data from the open dataset Our World in Data (COVID-19 cases), which contains global daily data from the European Centre for Disease Prevention and Control (ECDC) [22]. As a representative sample of the epidemic situation in the Americas, Asia, and Europe, we selected three countries whose populations have been most heavily affected by the COVID-19 epidemic. These countries were the United States, the United Kingdom, and India. For these three countries, daily confirmed cases and deaths per 100,000 population were collected from 1 April 2020 to 1 April 2022. The calculation formulas were as follows:
c o m f i r m e d   c a s e s   p e r   100   t h o u s a n d = c o m f i r m e d   c a s e s   p e r   d a y T o t a l   P o p u l a t i o n × 100 , 000
d e a t h s   p e r   100   t h o u s a n d = d e a t h s   p e r   d a y T o t a l   P o p u l a t i o n × 100 , 000

2.3.2. Human Intervention Data Collection

In this paper, data regarding human intervention measures for COVID-19 were collected through the Oxford COVID-19 Government Response Tracker (OxCGRT) [20]. OxCGRT provides a systematic, longitudinal measure of government responses to COVID-19 since 1 January 2020. Through standardized indicators, the project monitors national and subnational governments’ policies and interventions. It also creates a suite of composite indices to quantify the extent of these human responses. The data mainly cover public information on 20 indicators of government response to COVID-19 measures, of which C1–C8 record information about containment and closure policies; these consist of 8 policy indicators, including school suspension, work stoppage, public event cancellation, assembly restriction, public transportation closure, home quarantine, domestic travel restriction, and international travel control. E1–E4 record economic policies and include citizens’ income support, debt and contract relief, fiscal measures, foreign aid, and 4 other indicators. H1–H7 record health system policies, include public information campaigns, COVID-19 screening, close contact tracing, emergency investments in health care services and vaccines, facial protection, and recent vaccination policies.
Various combinations of these indicators provide four composite indices that reflect the intervention policies in place in a given area. Each index comprises a number of individual policy indicators, as shown in Table 1. For each indicator, an ordinal score was calculated, with half a point deducted for policies that were more targeted than generic. Each value was scaled by its maximum value to produce a score from 0 to 100, with missing values contributing 0, to produce the overall index. This calculation is described as follows:
i n d e x = 1 k j = 1 k I j
where k is the number of component indices in a composite index and Ij is the score of a single index.
Each single score I for each indicator j on each day was calculated as follows:
I j , t = 100 × v j , t 0.5 ( F j f j , t ) N J
where Nj is the maximum value of the indicator, if that indicator has a flag (Fj = 1 if the indicator has a flag variable, or 0 if the indicator does not have a flag variable); vj,t is the recorded policy value on the ordinal scale; and fj,t is the recorded binary flag for that indicator.
Finally, these indicators were aggregated into four composite indices. The first was the overall government response index (OGRI), which recorded the changes in government response measures across indicators that become stronger or weaker over the course of an outbreak; second, the containment and health index (GHI), which combined measures such as lockdown restrictions, testing policies, contact tracing, short-term investments in health care, and investments in vaccines; third, the economic support index (ESI), which recorded indicators such as income support and debt relief; and fourth, the original policy intensity index, the stringency index (SI), which captured the stringency of blockade policies that primarily restricted people’s behavior. In this paper, we collected four indexes (OGRI, GHI, SI, and ESI) from 1 March 2021 to 31 December 2022 in three countries, namely, the USA, the UK, and India, to represent the human impact factors.

3. Experiment

The experiments were divided into two parts: analysis of the relationship between human-influenced factors and epidemic changes and AI model prediction analysis. This experiment examined the correlations and lags between the four human-influenced factors and the number of confirmed epidemic cases and deaths in order to develop a multivariate epidemic prediction model. The second experiment compared the performance of the univariate and multivariate epidemic prediction models after incorporating human-influenced factors. We used Python3.7 as the experimental programming language and Tensorflow as the algorithm platform on a CPU Intel i7 with 8 GB of RAM.

3.1. Evaluation Metrics

In order to assess the predictive validity of the proposed model, three widely used error evaluation metrics, namely, mean absolute error (MAE), root mean square error (RMSE), and goodness of fit (R2), were selected as error metrics to measure the degree of deviation of the predicted values from the actual values, calculated as follows:
M A E = 1 N n = 1 N | y n y n |
R M S E = ( 1 N n = 1 N ( y n y n ) 2 ) 1 / 2
R 2 = 1 - n = 1 N ( y n y ^ n ) n = 1 N ( y n y ¯ )

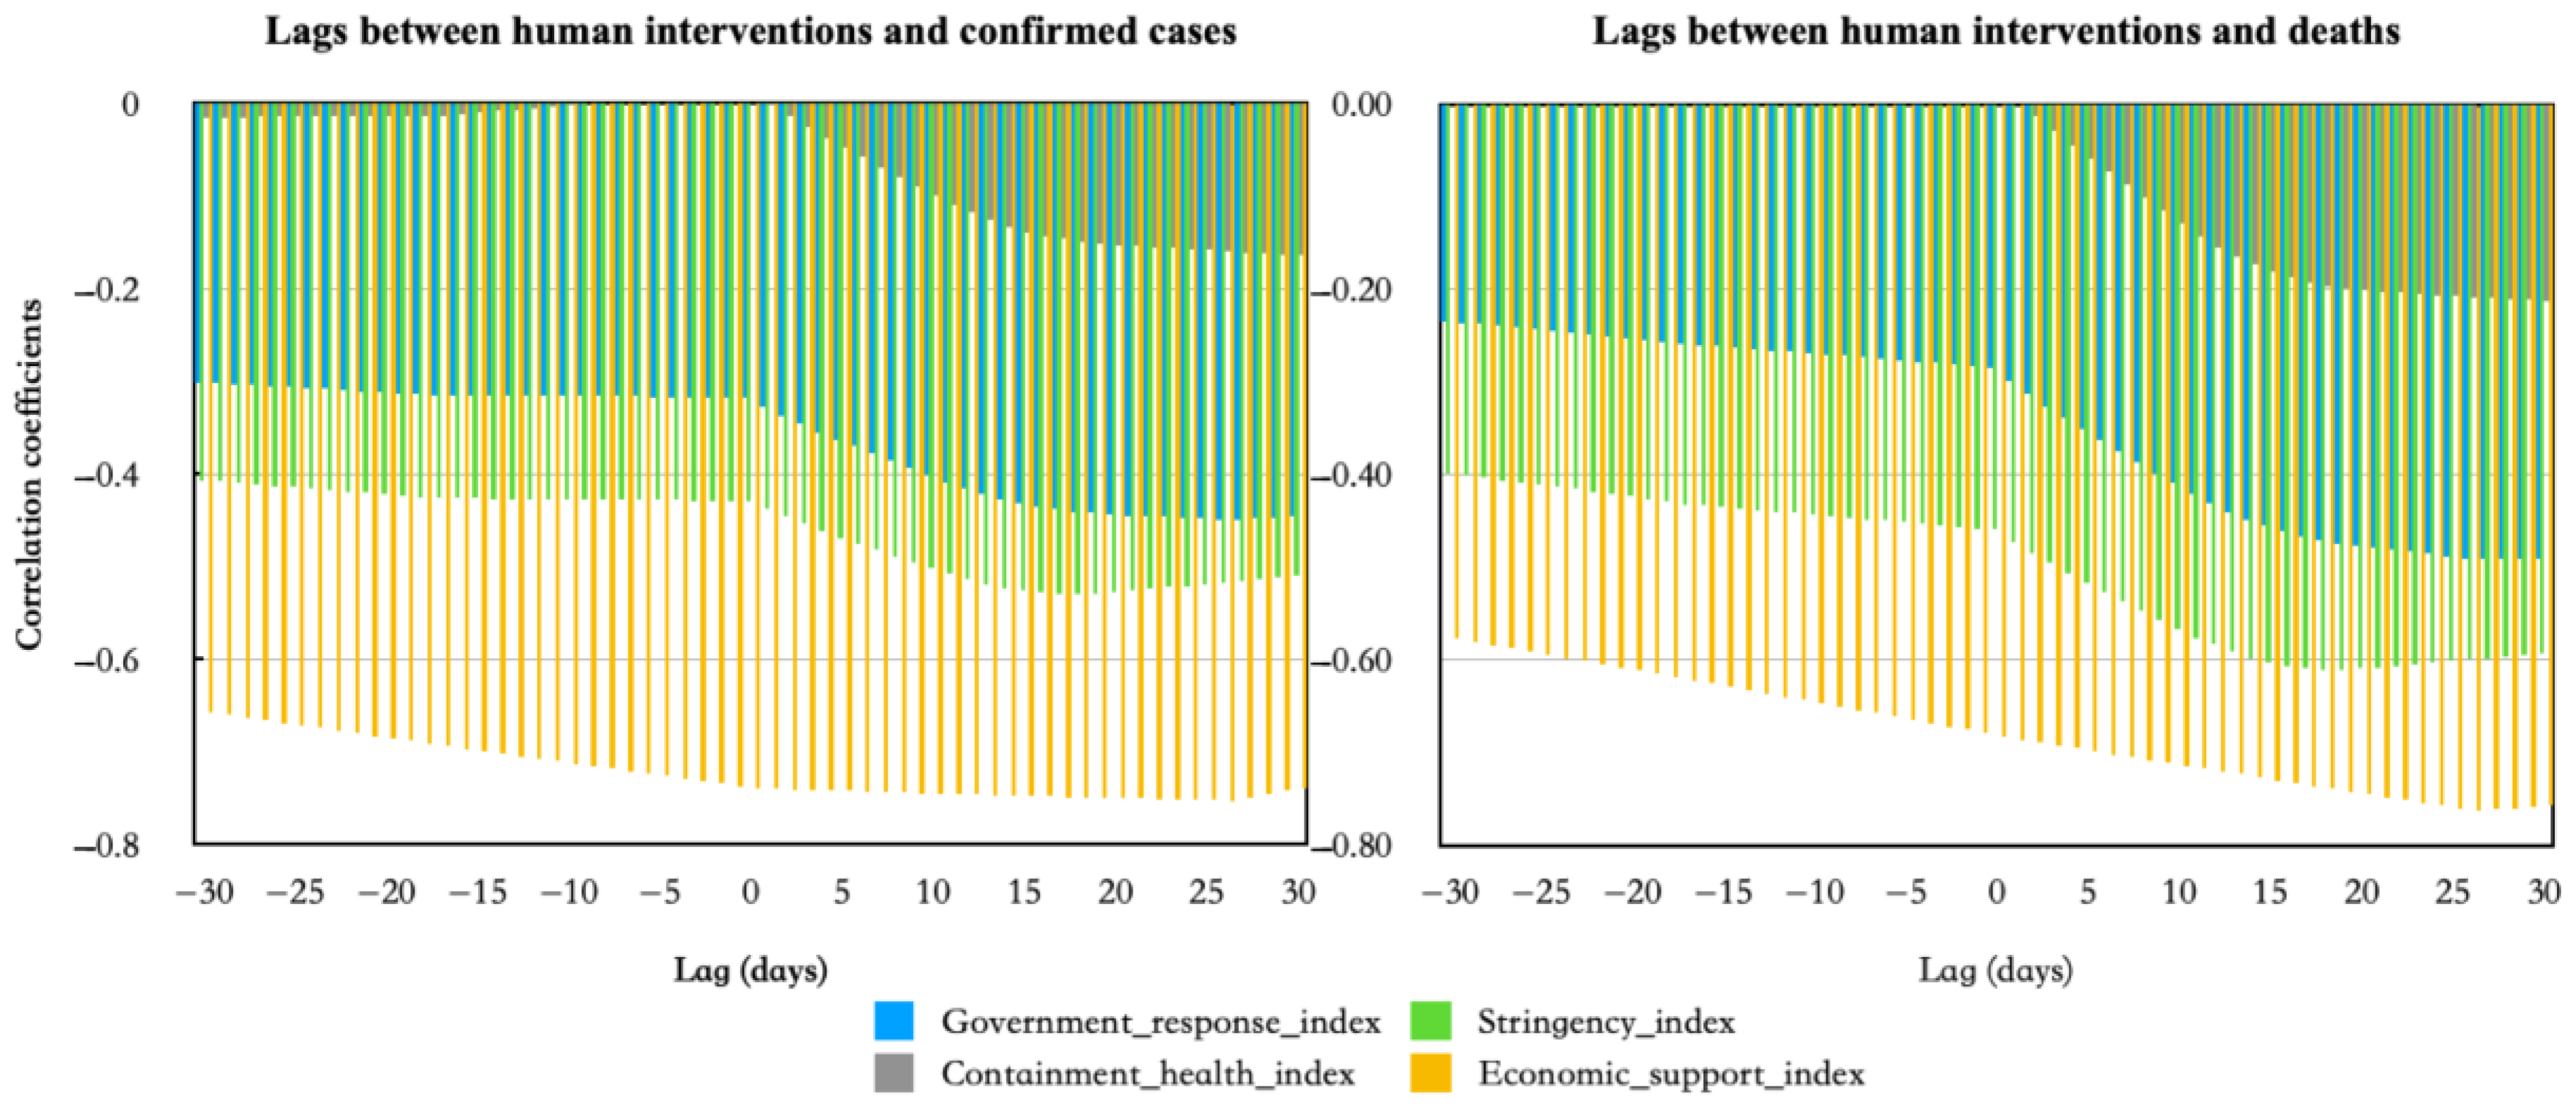
3.2. Results of Correlation and Lag between Human Influences and COVID-19 Epidemic

The Pearson correlation coefficients between the epidemic data and the current indicators of human influences in the three selected countries are shown in Table 2. The results show that the correlation coefficients between the four human influence indicators and the number of confirmed cases and deaths were statistically significant (p < 0.05), suggesting that there is a significant correlation between epidemic changes and epidemic prevention policy indicators. Specifically, the government response index, stringency index, containment and health index, and economic support index were negatively correlated with the number of confirmed cases and deaths in three countries. Accordingly, government prevention and control measures, including response, policy intensity, lockdown restrictions, testing policies, contact tracing, vaccine investments, and economic support contributed to reducing the number of confirmed cases and deaths. In terms of overall correlation with the epidemic data, the economic support index had the highest correlation, followed by the stringency index and the government response index. Moreover, there were differences among the countries in the correlations between the four types of indices and the number of confirmed cases and deaths, reflecting the effects of different types of epidemic prevention and control policies.
The cross-correlation function (CCF) is used to calculate the lagged correlation between human impacts and the COVID-19 epidemic. The CCF is the degree of correlation between two time series at any two different moments. It was assumed that there were two time series, Xt, t = 1, 2, 3, …, and Yt, t = 1, 2, 3, … Then, the correlation between moment t and moments t + n was the nth-order cross-correlation, which was given using the following equation:
c c f n = ( x t x ¯ t ) ( y t + n Y ¯ t + n ) ( x t x ¯ t ) 2 ( y t + n Y ¯ t + n ) 2
Figure 3, Figure 4 and Figure 5 show the lagged correlations between the four different human factor indices and the number of confirmed cases and deaths in the three countries. It can be seen that lagged effects existed between the four different human intervention factors and the epidemic case data in all three countries. With the increasing number of lag days, the negative correlation between the four human factors and confirmed cases and deaths increased. This demonstrated that human intervention was not immediately effective in controlling the epidemic and took some time to become so. The correlation coefficients generally increased rapidly from 0 to 15 days after the lag, and then the correlations leveled off as the lag days increased. The results indicate that human interventions produced better results around 15 days after they were implemented.
Moreover, there were differences in the lagged effects between the four different human intervention indices and COVID-19 cases across the three countries. In the United States, there were significant lags between the four human intervention factors and the number of confirmed cases and deaths, with an average lag period of between 15 and 30 days; in the United Kingdom, there were notable lags between the four human intervention factors and the number of deaths, but insignificant lags with the number of confirmed cases, with no lagged correlation between the economic support index and confirmed cases. In India, the government response index, stringency index, and containment and health index all had significant lags with confirmed cases and deaths of between 9 and 12 days. Conversely, the economic support index had a substantial impact on the number of confirmed cases and deaths, indicating that early government support helped to control the outbreak.

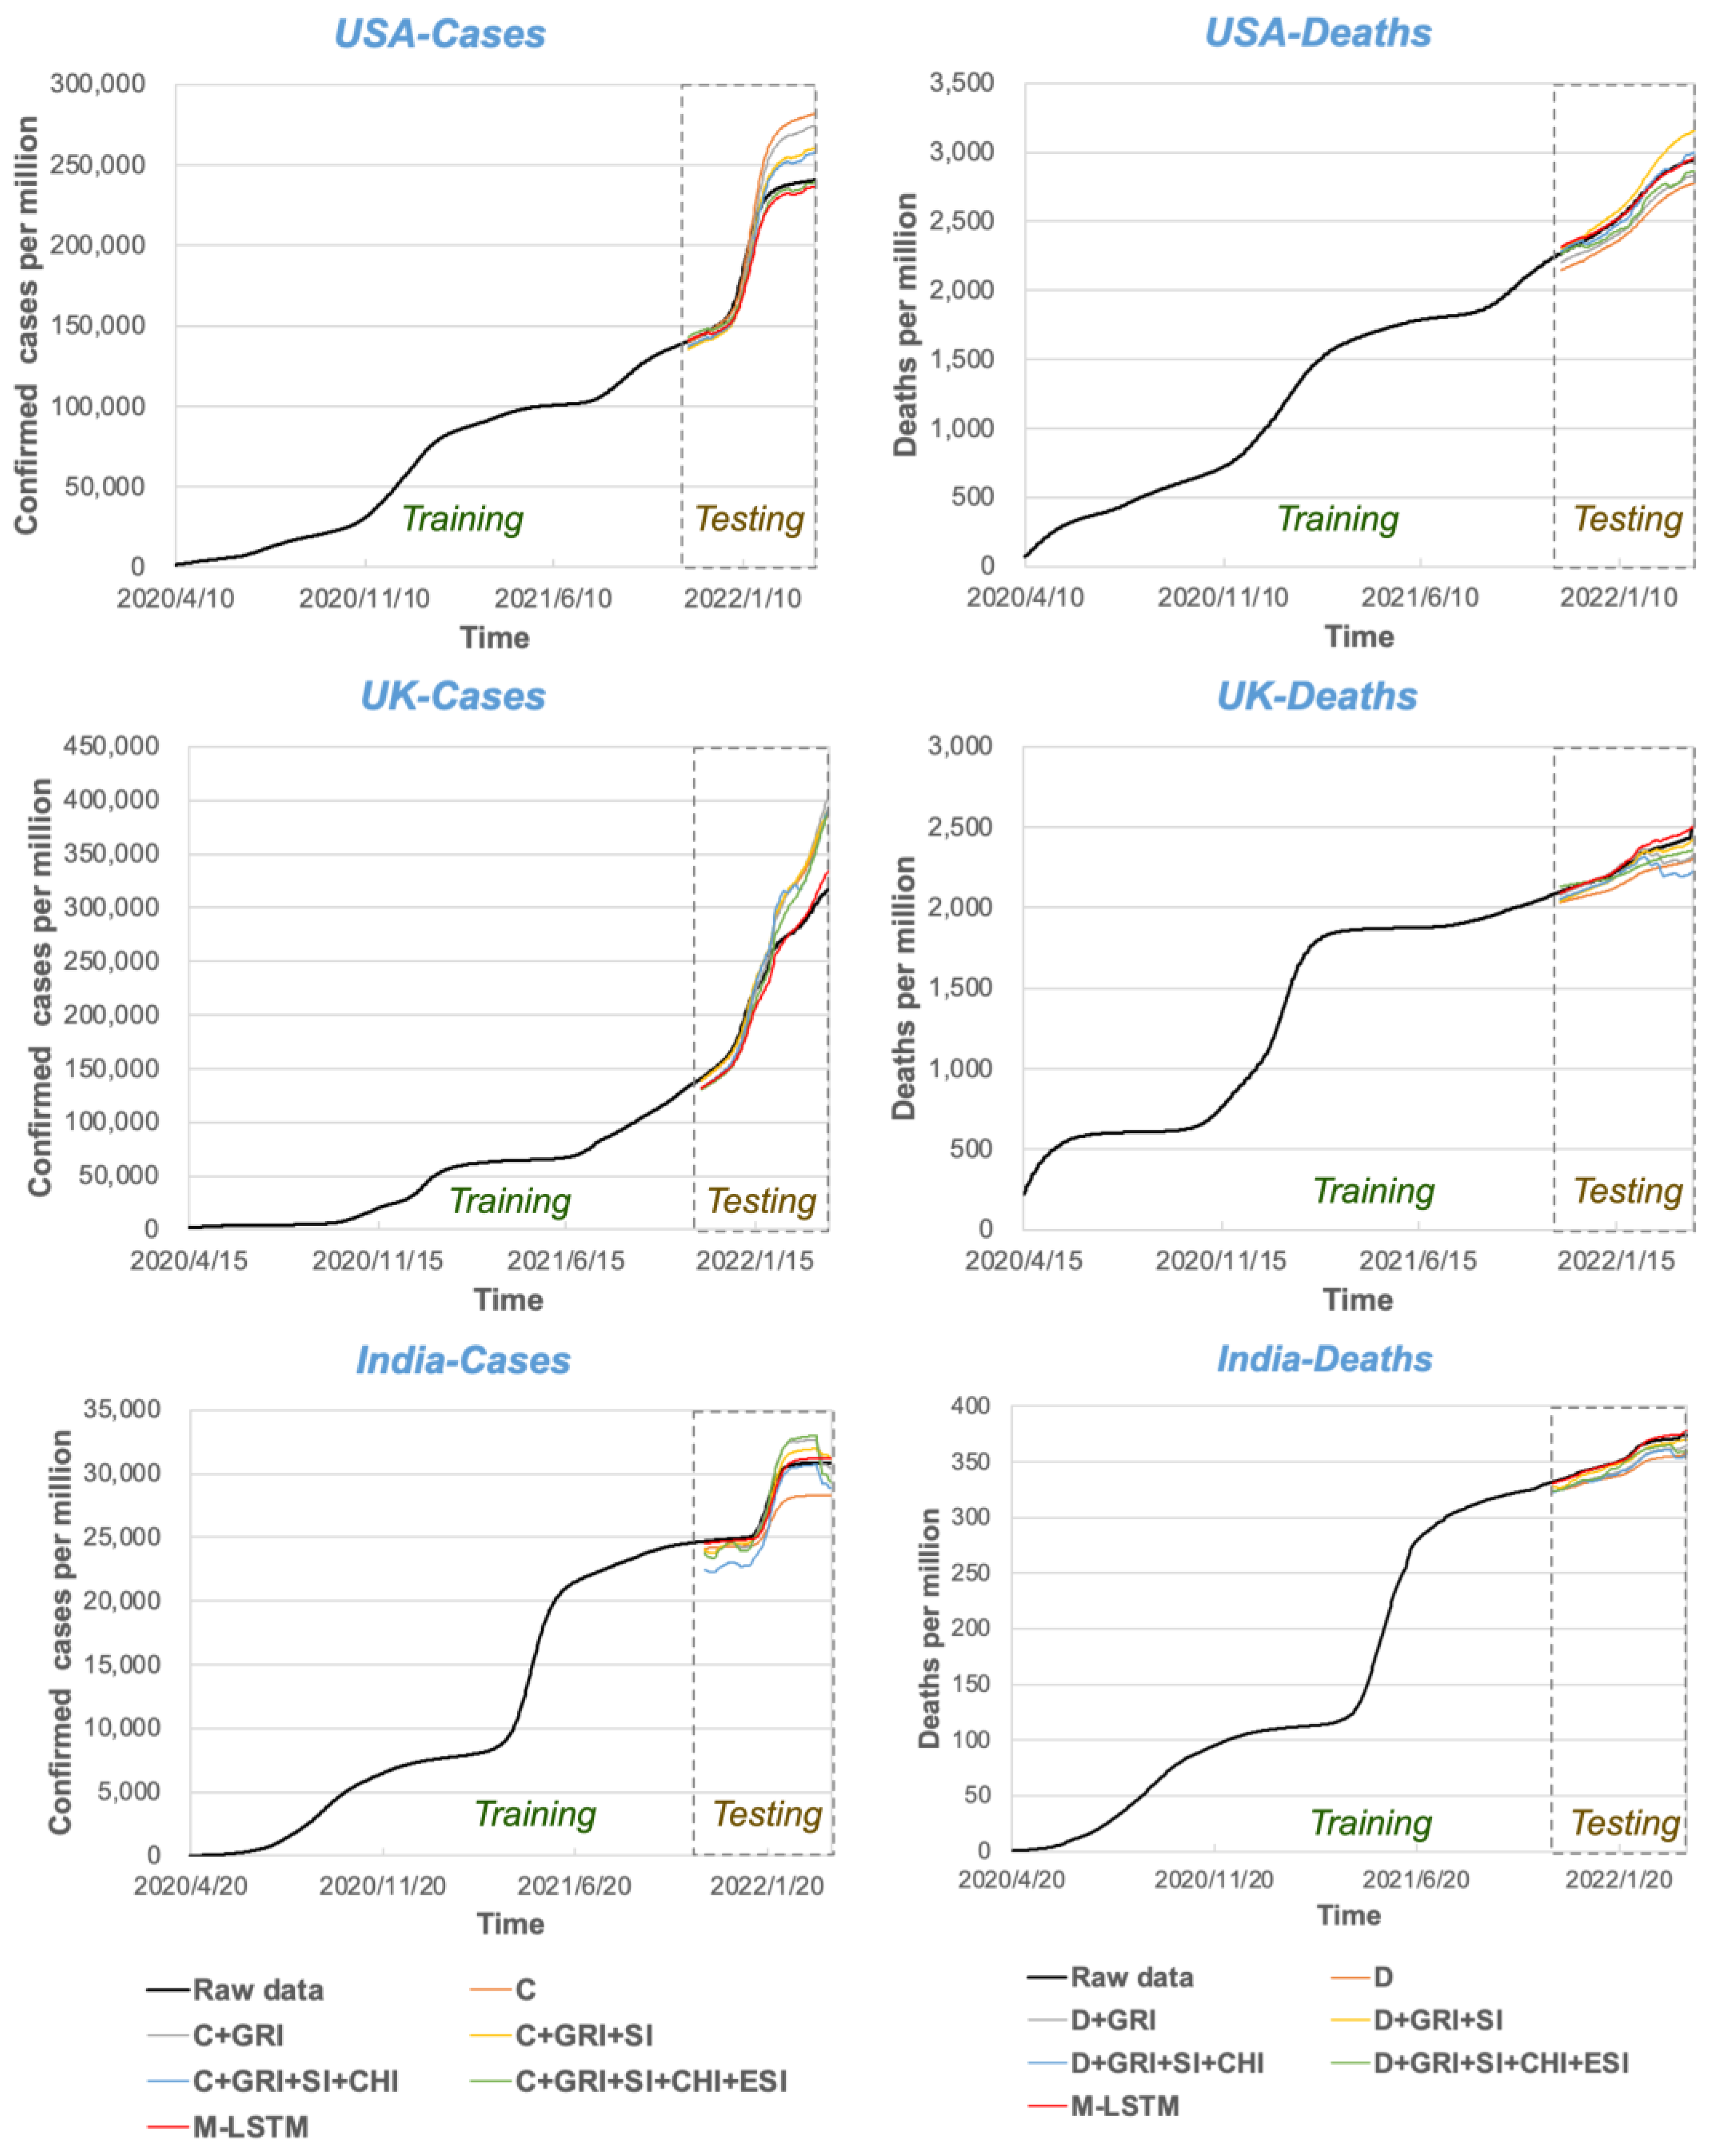
3.3. Evaluation Results of the Prediction Effectiveness of Multivariate LSTM Models Coupled with Human Influences

For the purpose of forecasting the trend of the COVID-19 epidemic, a multivariate data-driven epidemic prediction model was developed based on a correlation and lag relationship analysis. An input layer featured a selection scheme relying on correlations with human-influenced factors between confirmed cases, deaths, and delays. In the experiment, the data were first divided into two parts: 80% was the training set and the remaining 20% was the test set. The historical time interval T of the input data was 7, the epoch of the model training was 50, and the batch size was 8.
First, three sets of comparative models were developed, including univariate prediction, multivariate prediction, and multivariate prediction considering a correlation threshold filter for human influences. For the univariate case, we used the number of confirmed cases and deaths time series (inputs) to predict the number of confirmed cases and deaths time series (expected outputs), respectively. C (confirmed cases) and D (death cases) were used to represent the univariate inputs to the number of confirmed cases and deaths. Data from the past 7 days were used to forecast the value 1 day in the future using a rolling forecast. For the multivariate case, more variables were gradually added to the input set to form different coupling schemes. The change in the predictive power of the model was then observed experimentally.
The four input coupling schemes for predicting confirmed cases were: confirmed cases and government response index (C + GRI); confirmed cases, government response index, and stringency index (C + GRI + SI); confirmed cases, government response index, stringency index, and containment and health index (C + GRI + SI + CHI); and confirmed cases, government response index, stringency index, containment and health index, and economic support index (C + GRI + SI + CHI + ESI). The four input coupling schemes for death cases were: deaths and government response index (D + GRI); deaths, government response index, and stringency index (D + GRI + SI); deaths, government response index, stringency index, and containment and health index (D + GRI + SI + CHI); and deaths, government response index, stringency index, containment and health index, and economic support index (D + GRI + SI + CHI + ESI). Then, considering the correlations and lags between variables, multivariate forecasts based on correlation thresholds were constructed. For example, the M-LSTM (R_thred > 0.7) indicated that variables with correlation thresholds greater than 0.7 were screened as inputs. Since the situation varied from country to country, the most appropriate threshold was selected based on the results of multiple experiments. Table 3, Table 4 and Table 5 compare the errors of prediction models constructed with different input variables for each of the three countries. Figure 6 shows the curves of the training data and the test data (prediction data) of all the comparative models for the three countries. The specific analysis was conducted as follows.
A comparative analysis of univariate and multivariate forecasting effects indicated that multivariate forecasting methods showed significantly better forecasting performances than univariate methods in most cases in the three countries. The goodness-of-fit R2 of the five multivariate forecasting methods was significantly higher than that of the univariate forecasting methods. For instance, compared with univariate forecasting for the number of confirmed cases (C) in the United States, the R2 of the multivariate forecasting methods C + GRI, C + GRI + SI, C + GRI + SI + CHI, C + GRI + SI + CHI + ESI, and M-LSTM improved by 19.80%, 41.76%, 45.23%, 51.02%, and 48.93%, respectively. When comparing multivariate forecasting methods for deaths (D) in the USA, C + GRI, C + GRI + SI, C + GRI + SI + CHI, C + GRI + SI + CHI + ESI, and M-LSTM improved R2 by 59.03%, 59.99%, 104.63%, 80.74%, and 107.19%, respectively. Based on the above results, it appears that incorporating human influencing factors into the LSTM model will be able to significantly improve its ability to predict epidemics in the future.
The predictive effects of the coupled models with different input variables ere compared and analyzed. The synthesis in Table 3, Table 4 and Table 5 shows that the average predictive performance of the multivariate model improved as more input variables were added, but the situation varied slightly for different countries. In the United States, for example, the MAE and RMSE continued to decrease and the R2 continued to increase with the addition of input variables when predicting confirmed cases and deaths. However, for the UK and India, an increase in input variables did not necessarily result in an improvement in prediction performance; for example, D + GRI + SI achieved the best prediction performance and D + GRI + SI + CHI achieved the worst for the prediction of deaths in the UK; in India, C + GRI + SI achieved the best and C + GRI + SI + CHI achieves the worst outcomes for the prediction of confirmed diagnoses. As a result, coupling more input variables improved prediction performance, but coupling some individual input variables also resulted in less accurate predictions.
A comparison of the prediction effects of multivariate methods screened using correlation was conducted. Correlation-based M-LSTM methods consistently outperformed other prediction methods in predicting confirmed cases and deaths. For example, the mean R2 for the M-LSTM improved by 31.75%, 18.82%, 32.44%, and 16.56% in comparison to C + GRI, C + GRI + SI, C + GRI + SI + CHI, and C + GRI + SI + CHI + ESI, respectively, in forecasting the number of confirmed cases in the three countries. Comparing the M-LSTM to D + GRI, D + GRI + SI, D + GRI + SI + CHI, and D + GRI + SI + CHI + ESI, the mean R2 of the M-LSTM increased by 50.45%, 14.45%, 901.76%, and 28.19%, respectively, in predicting the number of death cases in the three countries. Further observations from Figure 6 show similar conclusions. For instance, Figure 6 shows that M-LSTM was closer to the actual values than the other models. Specifically, in predicting the number of confirmed and death cases in the UK, M-LSTM yielded the best-fitting results with the actual values, indicating its superior forecasting capability relative to the other models. It can be concluded that the M-LSTM proposed in this paper can achieve a superior prediction performance compared with the other models.

4. Conclusion and Discussion

In recent years, research on the application of AI technology to infectious disease prediction has become increasingly popular. Especially since the outbreak of COVID-19, many researchers have developed various AI models to simulate the spread and development of the epidemic in order to assist government agencies in preparing and formulating countermeasures in advance. However, most of the existing studies have ignored the impact of human influences on epidemic prediction and failed to effectively integrate human influences into epidemic prediction; on the other hand, most of these studies used univariate prediction models, which are more common in epidemiology. Thus, this study developed a multivariate machine learning epidemic prediction model that incorporated human intervention factors and investigated the logical relationship between human factors and epidemic cases. An empirical study was conducted to analyze the correlation and lag between human factors and epidemic changes using the COVID-19 epidemic as an example. In addition, several multivariate machine learning epidemic prediction models were developed and compared in terms of their predictive performance.
Based on the above research work, the major findings of the paper are as follows.
(1) There is a correlation between epidemic change and human influences. It was found that the government response index, stringency index, containment and health index, and economic support index were all negatively correlated with confirmed cases and deaths. Furthermore, the correlation between the four types of human intervention factors and the number of confirmations and deaths varied between the countries, reflecting the different effects of the various epidemic prevention policies implemented in different regions.
(2) There was a significant lag between the four types of human intervention factors and the number of diagnoses and deaths. The negative correlations between the four human factors and the number of confirmed cases and deaths increased with the increase in lag days. This indicates that epidemic control measures would not be effective immediately after the implementation of human interventions, but would require a period to be effective. Correlation coefficients generally increase faster with a lag time of between 0 and 15 days, indicating that human interventions are more effective about 15 days after they are implemented.
(3) The M-LSTMs proposed in this study are superior to univariate predictions. The addition of human factor variables can improve prediction performance, but the addition of individual factors can also lead to poor prediction results. The proposed multivariate prediction method with correlation screening in this paper obtained the highest prediction performance among all test cases.

Author Contributions

Conceptualization, methodology, original draft preparation Z.Q.; investigation, data curation B.Z.; writing—review and editing, supervision H.W.; All authors have read and agreed to the published version of the manuscript.

Funding

This work was supported by the National Natural Science Foundation project of China (72004086) and Fundamental Research Funds for the Central Universities (lzujbky-2022-kb09) and (22lzujbkydx011).

Data Availability Statement

The data were collected from the open datasets of Our World in Data (https://ourworldindata.org/covid-cases (accessed on 15 February 2023)) and the Oxford COVID-19 Government Response Tracker (https://github.com/OxCGRT (accessed on 15 February 2023)).

Conflicts of Interest

The authors declare no conflict of interest.

References

  1. Baker, R.E.; Mahmud, A.S.; Miller, I.F.; Rajeev, M.; Rasambainarivo, F.; Rice, B.L.; Takahashi, S.; Tatem, A.J.; Wagner, C.E.; Wang, L.F.; et al. Infectious Disease in an Era of Global Change. Nat. Rev. Microbiol. 2022, 20, 193–205. [Google Scholar] [CrossRef] [PubMed]
  2. Yi, J.; Zhang, H.; Mao, J.; Chen, Y.; Zhong, H.; Wang, Y. Review on the COVID-19 Pandemic Prevention and Control System Based on AI. Eng. Appl. Artif. Intell. 2022, 114, 105184. [Google Scholar] [CrossRef] [PubMed]
  3. Kassania, S.H.; Kassanib, P.H.; Wesolowskic, M.J.; Schneidera, K.A.; Detersa, R. Automatic Detection of Coronavirus Disease (COVID-19) in X-Ray and CT Images: A Machine Learning Based Approach. Biocybern. Biomed. Eng. 2021, 41, 867–879. [Google Scholar] [CrossRef] [PubMed]
  4. Zgheib, R.; Kamalov, F.; Chahbandarian, G.; Labban, O.E. Diagnosing COVID-19 on Limited Data: A Comparative Study of Machine Learning Methods. In Proceedings of the Lecture Notes in Computer Science (Including Subseries Lecture Notes in Artificial Intelligence and Lecture Notes in Bioinformatics), Shenzhen, China, 12–15 August 2021; Volume 12837 LNCS. [Google Scholar]
  5. Akinnuwesi, B.A.; Fashoto, S.G.; Mbunge, E.; Odumabo, A.; Metfula, A.S.; Mashwama, P.; Uzoka, F.M.; Owolabi, O.; Okpeku, M.; Amusa, O.O. Application of Intelligence-Based Computational Techniques for Classification and Early Differential Diagnosis of COVID-19 Disease. Data Sci. Manag. 2021, 4, 10–18. [Google Scholar] [CrossRef]
  6. Qu, Z.; Li, Y.; Jiang, X.; Niu, C. An Innovative Ensemble Model Based on Multiple Neural Networks and a Novel Heuristic Optimization Algorithm for COVID-19 Forecasting. Expert Syst. Appl. 2023, 212, 118746. [Google Scholar] [CrossRef] [PubMed]
  7. Friedman, J.; Liu, P.; Troeger, C.E.; Carter, A.; Reiner, R.C.; Barber, R.M.; Collins, J.; Lim, S.S.; Pigott, D.M.; Vos, T.; et al. Predictive Performance of International COVID-19 Mortality Forecasting Models. Nat. Commun. 2021, 12, 2609. [Google Scholar] [CrossRef]
  8. Guo, S.; Fang, F.; Zhou, T.; Zhang, W.; Guo, Q.; Zeng, R.; Chen, X.; Liu, J.; Lu, X. Improving Google Flu Trends for COVID-19 Estimates Using Weibo Posts. Data Sci. Manag. 2021, 3, 13–21. [Google Scholar] [CrossRef]
  9. Ng, P.C.; Spachos, P.; Plataniotis, K.N. COVID-19 and Your Smartphone: BLE-Based Smart Contact Tracing. IEEE Syst. J. 2021, 15, 5367–5378. [Google Scholar] [CrossRef] [PubMed]
  10. Esmail, S.; Danter, W. Viral Pandemic Preparedness: A Pluripotent Stem Cell-Based Machine-Learning Platform for Simulating SARS-CoV-2 Infection to Enable Drug Discovery and Repurposing. Stem. Cells Transl. Med. 2021, 10, 239–250. [Google Scholar] [CrossRef]
  11. Ly, K.T. A COVID-19 Forecasting System Using Adaptive Neuro-Fuzzy Inference. Financ. Res. Lett. 2020, 41, 101844. [Google Scholar] [CrossRef]
  12. Parbat, D.; Chakraborty, M. A Python Based Support Vector Regression Model for Prediction of COVID19 Cases in India. Chaos Solitons Fractals 2020, 138, 109942. [Google Scholar] [CrossRef] [PubMed]
  13. Chimmula, V.K.R.; Zhang, L. Time Series Forecasting of COVID-19 Transmission in Canada Using LSTM Networks. Chaos Solitons Fractals 2020, 135, 109864. [Google Scholar] [CrossRef]
  14. Shastri, S.; Singh, K.; Kumar, S.; Kour, P.; Mansotra, V. Time Series Forecasting of Covid-19 Using Deep Learning Models: India-USA Comparative Case Study. Chaos Solitons Fractals 2020, 140, 110227. [Google Scholar] [CrossRef]
  15. Kırbaş, İ.; Sözen, A.; Tuncer, A.D.; Kazancıoğlu, F.Ş. Comparative Analysis and Forecasting of COVID-19 Cases in Various European Countries with ARIMA, NARNN and LSTM Approaches. Chaos Solitons Fractals 2020, 138, 110015. [Google Scholar] [CrossRef] [PubMed]
  16. Marzouk, M.; Elshaboury, N.; Abdel-Latif, A.; Azab, S. Deep Learning Model for Forecasting COVID-19 Outbreak in Egypt. Process Saf. Environ. Prot. 2021, 153, 363–375. [Google Scholar] [CrossRef]
  17. Devaraj, J.; Madurai Elavarasan, R.; Pugazhendhi, R.; Shafiullah, G.M.; Ganesan, S.; Jeysree, A.K.; Khan, I.A.; Hossain, E. Forecasting of COVID-19 Cases Using Deep Learning Models: Is It Reliable and Practically Significant? Results Phys. 2021, 21, 103817. [Google Scholar] [CrossRef]
  18. Dehning, J.; Zierenberg, J.; Spitzner, F.P.; Wibral, M.; Neto, J.P.; Wilczek, M.; Priesemann, V. Inferring Change Points in the Spread of COVID-19 Reveals the Effectiveness of Interventions. Science 2020, 369, eabb9789. [Google Scholar] [CrossRef] [PubMed]
  19. Haug, N.; Geyrhofer, L.; Londei, A.; Dervic, E.; Desvars-Larrive, A.; Loreto, V.; Pinior, B.; Thurner, S.; Klimek, P. Ranking the Effectiveness of Worldwide COVID-19 Government Interventions. Nat. Hum. Behav. 2020, 4, 1303–1312. [Google Scholar] [CrossRef] [PubMed]
  20. Hale, T.; Angrist, N.; Goldszmidt, R.; Kira, B.; Petherick, A.; Phillips, T.; Webster, S.; Cameron-Blake, E.; Hallas, L.; Majumdar, S.; et al. A Global Panel Database of Pandemic Policies (Oxford COVID-19 Government Response Tracker). Nat. Hum. Behav. 2021, 5, 529–538. [Google Scholar] [CrossRef] [PubMed]
  21. Gers, F.A.; Schmidhuber, J.; Cummins, F. Learning to Forget: Continual Prediction with LSTM. Neural Comput. 2000, 12, 2451–2471. [Google Scholar] [CrossRef] [PubMed]
  22. Coronavirus (COVID-19) Cases—Our World in Data. Available online: https://ourworldindata.org/covid-cases (accessed on 13 February 2022).
Figure 1. LSTM schematic.
Systems 11 00201 g001
Figure 2. M-LSTM model structure.
Systems 11 00201 g002
Figure 3. Lagged relationship between human interventions and US epidemic data.
Systems 11 00201 g003
Figure 4. Lagged relationship between human interventions and UK epidemic data.
Systems 11 00201 g004
Figure 5. Lagged relationship between human interventions and Indian epidemic data.
Systems 11 00201 g005
Figure 6. Comparison of predicted and actual values of different models in three countries.
Systems 11 00201 g006
Table 1. OxCGRT index composition.
Index NameGovernment
Response Index
Containment and Health IndexStringency
Index
Economic
Support Index
C1xxx
C2xxx
C3xxx
C4xxx
C5xxx
C6xxx
C7xxx
C8xxx
E1x x
E2x x
E3
E4
H1xxx
H2xx
H3xx
H4
H5
H6xx
H7xx
H8xx
(x indicates that an indicator contributes to that index).
Table 2. Pearson correlation coefficients of human indicators and epidemic data.
CountryData TypeGovernment Response IndexStringency
Index
Containment Health IndexEconomic
Support Index
USAConfirmed cases−0.318 **−0.430 **0.011−0.739 **
Deaths−0.284 **−0.460 **0.022−0.683 **
UKConfirmed cases−0.642 **−0.720 **−0.531 **−0.766**
Deaths−0.324 **−0.526 **−0.226 **−0.495 **
IndiaConfirmed cases−0.402 **−0.434 **−0.190 **−0.795 **
Deaths−0.434 **−0.470 **−0.228 **−0.788 **
(Note: ** p < 0.01).
Table 3. Comparison of multivariate model prediction results in the USA.
DatasetInput VariablesMAERMSER2
Confirmed casesC24,017.0916,754.500.642
C + GRI19,280.4915,318.060.769
C + GRI + SI12,011.6410,755.520.911
C + GRI + SI + CHI10,408.699229.330.933
C + GRI + SI + CHI + ESI6960.935311.930.970
M-LSTM (R_thred > 0.4)8370.556751.520.957
DeathsD161.50160.100.478
D + GRI109.36107.050.761
D + GRI + SI108.3091.730.765
D + GRI + SI + CHI32.3628.480.979
D + GRI + SI + CHI + ESI82.2473.490.865
M-LSTM (R_thred > 0.4)20.8715.080.991
Table 4. Comparison of multivariate model prediction results in the UK.
DatasetInput VariablesMAERMSER2
Confirmed casesC31,945.9323,168.870.696
C + GRI35,955.6927,135.310.615
C + GRI + SI34,315.5724,584.630.650
C + GRI + SI + CHI31,845.9125,464.800.698
C + GRI + SI + CHI + ESI28,594.8023,038.300.757
M-LSTM (R_thred > 0.7)12,572.5710,922.310.953
DeathsD108.79105.490.065
D + GRI61.0840.120.705
D + GRI + SI36.4632.900.895
D + GRI + SI + CHI110.4782.540.036
D + GRI + SI + CHI + ESI55.3346.360.758
M-LSTM (R_thred > 0.5)28.6222.130.935
Table 5. Comparison of multivariate model prediction results in India.
DatasetInput VariablesMAERMSER2
Confirmed casesC1896.811658.970.514
C + GRI1087.70901.780.840
C + GRI + SI712.68654.500.931
C + GRI + SI + CHI1686.221468.510.616
C + GRI + SI + CHI + ESI1277.731104.020.780
M-LSTM (R_thred > 0.4)426.37343.090.975
DeathsD13.6513.380.005
D + GRI9.469.410.522
D + GRI + SI4.354.090.899
D + GRI + SI + CHI11.5111.180.293
D + GRI + SI + CHI + ESI7.857.310.671
M-LSTM (R_thred > 0.4)1.771.390.983
Disclaimer/Publisher’s Note: The statements, opinions and data contained in all publications are solely those of the individual author(s) and contributor(s) and not of MDPI and/or the editor(s). MDPI and/or the editor(s) disclaim responsibility for any injury to people or property resulting from any ideas, methods, instructions or products referred to in the content.

