
Spatiotemporal Evolution and Antecedents of Rice Production Efficiency: From a Geospatial Approach


1
School of Business, Hunan Agricultural University, Changsha 410128, China
2
School of Economics, Hunan Agricultural University, Changsha 410128, China
3
Department of Economics, Management, and Institutions (DEMI), University of Naples Federico II, Complesso Universitario di Monte Sant’Angelo, 80126 Napoli, NA, Italy
4
College of Business, Honghe University, Mengzi 661100, China
*
Author to whom correspondence should be addressed.
Systems 2023, 11(3), 131; https://doi.org/10.3390/systems11030131
Submission received: 10 January 2023
/
Revised: 18 February 2023
/
Accepted: 20 February 2023
/
Published: 1 March 2023
Abstract
:In a response to the appeal for securing the rice production efficiency to achieve the United Nations Sustainable Development Goals, we adopted a geographic detector model to investigate the spatiotemporal evolution trajectory and driving forces of the rice production in the world’s largest rice-producing country, China. We have analyzed the spatiotemporal evolution features and aggregation patterns of county rice production efficiency based on panel data of 122 counties in Hunan Province, one of the main grain production provinces in China, from 2006 to 2018. Our findings indicate: (1) Hunan Province’s rice production in three counties (i.e., Taoyuan, Liling, and Anren) showed the highest efficiency; there were pronounced regional variances in rice productivity which results in a sharp and rapid shrink of the range of rice productivity, (2) financial investments in agriculture, forestry, and water resources, as well as per capita disposable income of farmers, were the main determinants of the spatiotemporal variation in rice production efficiency, (3) the spatiotemporal divergence of rice production efficiency at the province level was U-shapedly, influenced by the share of secondary industry in GDP; the southern Hunan region received the biggest contribution from farmers in terms of disposable income per person at the regional level. Overall, theoretically, this study offers fresh evidence for regional optimization of rice and other grain production from a novel integrative approach of the geospatial and the land resource preservation. Practically, it provides feasible guidance for the high-quality development of grain production in China, which may also help eradicate hunger and attain sustainable grain production all over the world.
1. Introduction
Grain security is crucial for maintaining national stability and has always been a crucial foundation for human survival and societal growth. The international production of rice, maize, and other grain crops fluctuates in the new era of global climate change and COVID-19, and China’s grain security is experiencing unprecedented challenges, chiefly due to fluctuations in the international agricultural product market, tighter constraints on natural resources and the ecological environment, and low efficiency and efficiency of grain production [1,2,3]; grain production’s temporal and spatial patterns are ever-evolving, notably incorporating the production agglomeration features of wheat, soybean, and other grain crops [4,5,6]. The second of the 17 Sustainable Development Goals (SDGs) included in the United Nations’ Transforming Our World: The 2030 Agenda for Sustainable Development is to end hunger, achieve grain security, and support sustainable agriculture [7]. Nearly half of the world’s population is fed by rice, one of the most extensively grown crops worldwide. China has consistently sown more than 30 million hectares of rice, and the country produces more than 200 million tons of rice annually, ranking among the top in the world. However, there are significant regional differences in the endowment of natural resources, farmland infrastructure, production technology, human capital, and grain production system policies, which are clearly reflected in the production factor conditions of rice in different periods and regions of China [8,9]. As a result, the production efficiency of rice is unstable. Studying the spatiotemporal evolution of rice production efficiency and its influencing elements in the context of stabilizing grain security is one of the major research areas.
Gradually, establishing regional high-quality grain production and ensuring grain security have come to dominate global scholarly research. Studies that have already been conducted mainly focused on the spatiotemporal variations in grain production efficiency, including that of wheat, soybean, maize, and rice [10,11,12,13], the spatiotemporal evolution of planting structure patterns [14], the spatiotemporal variations in land resource use efficiency, and its influencing factors [15]. Multiple linear regression, spatial autocorrelation, stochastic frontier analysis, and data envelopment analysis (DEA) were utilized to assess efficiency and examine the characteristics of its spatiotemporal evolution [16,17]. We discovered that elements such as climate, fertilization level, and farmers’ education level have a substantial impact on rice production based on studies on the efficiency of rice production and its spatiotemporal variation. The duplication of seedling costs, the high cost of pesticides, and the high cost of transportation services were the main causes of low rice production efficiency [18]. Rice production efficiency may be improved with the addition of labor force, mechanical power, and irrigation in paddy fields [19,20]. The spatiotemporal variance in rice production efficiency is influenced by the availability of natural resources, farmland transfers, household income levels, and agricultural subsidy systems and policies [21]. In order to increase rice production, we should upgrade the infrastructure of paddy fields, intensify the use of contemporary rice growing technologies, and alter farmers’ perceptions about rice farming [22].
Despite the fact that scholars have engaged in substantial research and discussion in this area, it is apparent that: in terms of research objectives, the majority of the production efficiency of grain crops, such as wheat, soybean, and maize, is evaluated and classed, while the research on the temporal dynamic change, spatial differentiation, and the identification of influencing variables of rice production efficiency has not received much attention. Studies on rice production efficiency rarely focus on long-term time series panel data at the micro level of counties; instead, they tend to concentrate on the macro level, such as the major grain producing areas, or on cross-sectional data from a single year. Multiple linear regression, gray correlation coefficient, and other techniques are frequently utilized in research, as well as qualitative study of the efficiency-influencing components [23,24]. In this study, a novel method for quantitatively identifying the variables that affect the efficiency of rice is utilized, and this method is known as the geographic detector model. This method increases the accuracy of the results of the influencing factor detection.
Hunan province is one of the main grain-producing provinces in China, and is also a significant producer of traditional rice. Therefore, determining the characteristics of the spatiotemporal evolution of efficiency and the influencing elements of the spatiotemporal variation of efficiency, we quantitatively quantified the efficiency of rice production in 122 counties of Hunan Province from 2006 to 2018. In the beginning, the rice yield was chosen as the output variable, six input variables such as rice sown area and irrigated area of paddy field were selected, and five environmental variables such as the proportion of primary industry in the GDP and the level of urbanization. The three-stage DEA model was used to quantify and evaluate the Hunan Province’s rice production efficiency. Second, in the third stage of DEA, the spatiotemporal evolution characteristics and aggregation patterns of rice production efficiency were analyzed using the spatial autocorrelation approach. Thirdly, the geographic detector model was used to examine the influence degree of each component on the spatiotemporal differentiation of rice production efficiency. Detection factors such as the proportion of the secondary industry in GDP and the per capita disposable income of farmers were chosen. Finally, based on the empirical findings, pertinent countermeasures and recommendations are made to improve the planning of advantageous agricultural space, clarify the primary space configuration for rice production in the future, and support the dual improvement of rice production efficiency and benefits.
2. Materials and Methods
2.1. Research Area and Datasets
Hunan province is one of the major agricultural provinces in China, located in the middle of the Yangtze River in the north, agricultural production conditions have unique geographical advantages, as the province belongs to the continental subtropical monsoon humid climate, annual average temperature 16–18 °C, annual average precipitation 1200–1700 mm, annual sunshine number 1300–1800 h. In 2020, the total output value of agriculture, forestry, animal husbandry, and fishery reached 751.197 billion yuan, ranking sixth in the country, accounting for 5.45% of the total output value of agriculture, forestry, animal husbandry, and fishery, which is an important guarantee for national food security. The overall rice yield in Hunan Province has been steady from the start of the twenty-first century. For many years, more than 4 million hectares of rice have been planted, and more than 25 million tons of rice have been produced. At roughly 6300 kg/ha, the unit output has been consistent. Rice sown area and yield are stable among the top in China. The Dongting Lake region, southern Hunan region, Xiang-Xi region, and Chang-Zhu-Tan region, which are split into 14 districts and prefectures with a total of 122 counties, fall within the purview of Hunan Province. Figure 1 depicts the overall situation of the research area, and each county is marked by name. The analysis unit division of rice production efficiency in Hunan Province is shown in Table 1.
The study’s time period covered 2006 to 2018, taking into account Hunan Province’s administrative divisions, town demolition in 2005, and the COVID-19 epidemic’s effects on grain production in 2019. The primary sources of data were the Hunan Rural Statistical Yearbook, Hunan Statistical Yearbook, Hunan Financial Yearbook, Winds database, and research from the years 2007 to 2019 [25,26,27,28]. In the statistical book, the pricing data is handled using the Consumer Price Index (CPI), and the input-output variable data is modified in accordance with the ratio of the relevant agricultural data and the local cultivated land.
2.2. Methods
2.2.1. Three-Stage DEA Model
The three-stage DEA model’s measurement efficiency may evaluate the production level more accurately and objectively by excluding the impact of external factors and statistical noise (random error term) [29,30,31]. In order to assess the overall efficiency of rice production in the province of Hunan, the three-stage DEA model is utilized (efficiency), and the construction of the conventional DEA model is the initial step. Depending on the BCC input orientation model, each county’s basic input-output statistics are obtained to determine each input relaxation amount and perform a second stage SFA regression on the initial inputs, excluding the effects of random and environmental factors. In adapting to the initial raw data, after modifying each input variable, it is confirmed that the DMU can remain on the same level of the external environment; the third stage then utilizes the modified input to replace the original input from the first stage. The true output remains unaltered from the original, for the efficiency measurement is gathered with the BCC input orientation model once again to efficiently get accurate findings that more precisely reflect the genuine management level of each DMU. The pertinent expressions will not be covered in this article because the model is further developed [32,33].
2.2.2. Spatial Autocorrelation Analysis Model
In order to determine whether units in a region have spatial dependency and heterogeneity, it is vital to determine whether there is a strong spatial correlation between the attribute value of a unit in a region and nearby units. This is accomplished through the use of spatial autocorrelation analysis [34,35]. In this study, the spatial differentiation of rice production efficiency in Hunan Province was analyzed using Moran’s I index to actualize the recognition of the spatial aggregation pattern. The expression can be expressed as follows:
In Formula (1), n is the number of spatial units included in the study area (122 counties in Hunan Province), and Xi, Xj represents the rice productivity values in the spatial cells i and j, respectively. Wij is the spatial weight coefficient. If there is a spatial proximity relationship between spatial unit i and j, then Wij = 1; otherwise, Wij = 0. The significance level of Moran’s I index can be measured by Z-statistic, which is expressed as follows:
In Equation (2), E(Ii) and Var(Ii) are the mathematical expectation and variance of Moran’s I index, respectively. According to the symbol of Ii and the size of Z(Ii), spatial units can be divided into two types of spatial aggregation modes: if Ii is positive and Z(Ii) > 1.96 (significance level set to 0.05), the spatial unit i is “High-High” cluster, indicating that the spatial unit and the adjacent spatial unit have relatively high rice production efficiency, a hot spot cluster. If Ii is positive and Z(Ii) < −1.96, the spatial unit i is a “Low-Low” aggregation type. Both the spatial unit and the adjacent unit of rice production efficiency are relatively low, and it is a cold point type aggregation area.
2.2.3. Geographic Detector Model
A statistical technique known as the “geographic detector” can identify the spatial differentiation of geographic elements and identify the influencing variables (causes) that contribute to that spatial differentiation [36,37,38]. The geodetector model was employed in this work to examine the impact of various detecting parameters on the spatiotemporal variance of rice production efficiency in the province of Hunan. The study is thought to be divided into a number of sub-regions. There is spatial differentiation if the overall variance of the region is greater than the sum of the variances of the sub-regions. A statistical correlation exists between two variables if their spatial distributions have a tendency to be consistent. The spatial differentiation, the detection factor, and the analysis of the interdependence between variables can all be done using the Q statistic calculated by the geographic detector. The dependent variable E’s spatial differentiation can be detected by the factor detector, together with how much E’s spatial differentiation is explained by a particular detecting factor. The expression is as follows:
In Equation (3), i = 1,2,... L. In the equation, q is the explanatory force of probe factor to variable E. L represents the stratification (class/zone) of factor or variable. σi2, σ2 indicate the variance of layer i and full region E values, respectively. Ni and N indicate the number of samples in layer i and the whole region, respectively. If the variable E is what causes the stratification, then a bigger q value means that the spatial differentiation caused by the variable E is more visible. The greater the q value, which can be calculated as 100*q%, indicates that the detection factor interprets the variable E more when the stratification is caused by the detection factor D. The range of values for q is 0 to 1, with a q-factor of 0, indicating that the probe factor D is independent of the variable E and a q-value of 1 indicating that the probe factor D can completely explain the spatial differentiation of the variable E. In addition, according to the definition of non-central distribution of F p values of the q statistical significance test, if the p value is lower than the default significance level (0.05), it suggests that under the condition of stratified E rendering space distribution, or in other words, that under the condition of stratified E, the q value was not significant, and the variables were distributed randomly.
2.3. Variable Selection and Descriptive Statistics
Taking into account the consistency of data availability and statistical quality of the regional natural resource endowment, paddy field infrastructure, rice farming technology, human capital, and grain policy, as well as references, pertinent research, and practical research [39,40]. Rice yield was selected as the output variable. The overall production of early, middle, and late rice is referred to as rice yield. Statistical evaluation using tons. Six factors were chosen as input variables: planting area, irrigation area, fertilizer, pesticides, mechanical power, practitioners. Planting area is chosen as the input for the cultivated land resource and is statistically calculated in hectares. Farmland facilities and equipment are used to irrigate rice fields. The amount of paddy field that is effectively the irrigation area is a crucial indicator of how well the land is hydrated and how well it can withstand droughts. Calculation of statistical data in hectares. With the use of fertilizer, pesticide, and mechanical power in the production of rice, it serves as the cornerstone for ensuring and expanding rice production. Statistical calculations are done in tons and kilowatts, respectively. The key to increasing rice production efficiency is labor force input from practitioners. Statistical calculation is made in human units. At the same time, according to the existing research [41], the proportion of the primary industry in GDP, urbanization level, rice minimum purchase price, financial agriculture, forestry and water expenditure, and the rice cropping index were comprehensively considered to examine their impact on rice production efficiency. In addition, four detection factors were chosen to analyze the degree of influence on the spatiotemporal differentiation of DEA rice production efficiency in the third stage. These factors included the proportion of the secondary industry in GDP, per capita disposable income of farmers, government expenditure on agriculture, forestry and water resources, and the rice multiple cropping index [42,43,44].
The research subjects in this paper are 122 counties in Hunan Province, the study period was 2006–2018, and the sample size was 1586. Data descriptive statistics of the output variables, input variables, and environmental variables for rice production efficiency are shown in Table 2.
The average annual rice production input-output variables in Hunan Province were tested using the Pearson correlation coefficient method to see if the selection of variables was reasonable. The test results are displayed in Table 3. The results demonstrate that the selection of the input-output variables was reasonable because all of the correlation coefficients between the input-output variables were positive, and they all passed the two-sided tests under the 1% significant level.
3. Results
3.1. Analysis of Spatiotemporal Evolution Characteristics and Aggregation Pattern of Rice Production Efficiency
3.1.1. Space and Temporal Evolution Characteristics Analysis of Rice Production Efficiency
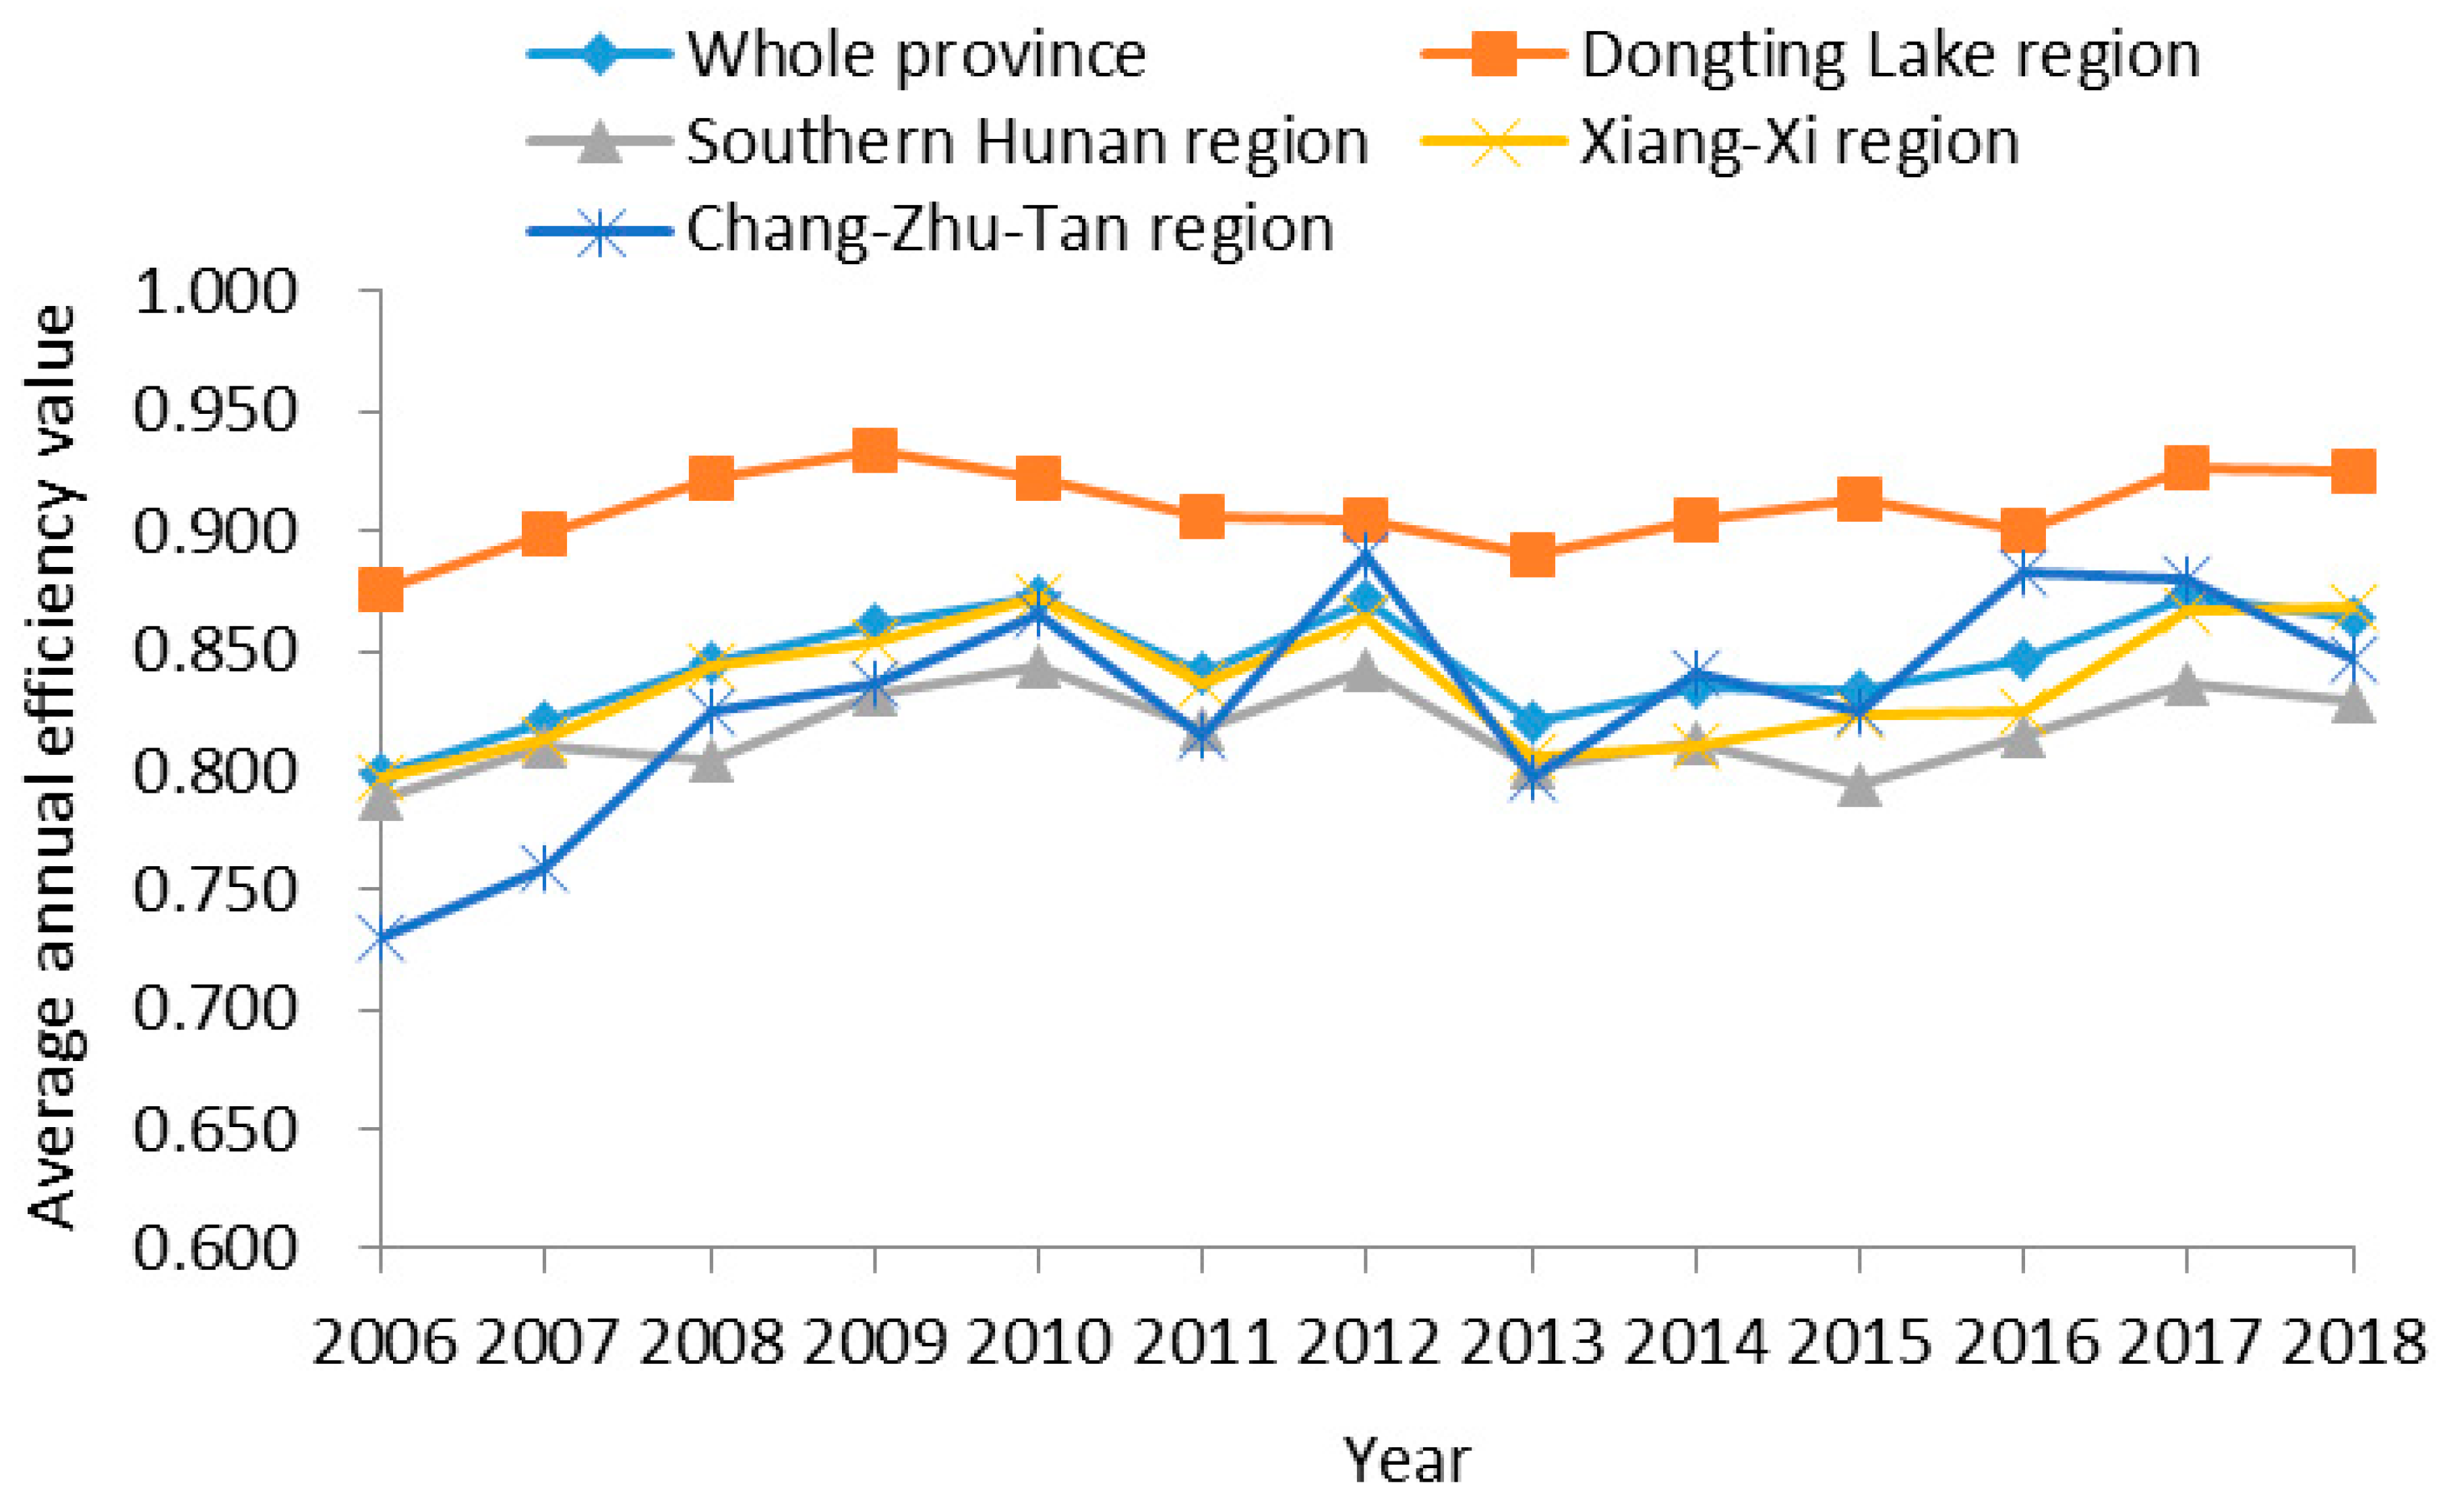
The findings of the three-stage DEA measurement of Hunan Province’s rice production efficiency revealed that each county’s efficiency value fluctuated around 0.825, with a maximum efficiency of 1.000 and a minimum efficiency of 0.109. This efficiency was compared to the first stage after removing the influence of random and environmental factors. The mean DEA efficiency of the three stages of rice production in Hunan Province from 2006 to 2018 was 0.854, and it showed a constant increasing trend between 2006 and 2018, which was in keeping with the reality of the change in rice sown area and the development of rice technology in Hunan Province. From 2006 to 2018, Taoyuan, Liling, Anren, Xinhua, and You in Hunan Province had an efficiency value of 1.000, which was on the cutting edge of efficiency. The average efficiency of 45 counties ranged from 0.900 to 1.000, among which 28 counties were above 0.950: Yueyang, Shuangfeng, Longhui, Xiangtan, Linli, Ningxiang, Xiangyin, Huarong, Chaling, Wangcheng, Xiangxiang, Wugang, Zhuzhou, Liuyang, Nan, Dingcheng, Hanshou, Xupu, Lengshuitan, Shaoyang, Changsha, Li, XinShao, Suining, Dao, Lianyuan, Zhijiang, Huitong. Furthermore, 33 counties’ average efficiency ranged from 0.800 to 0.900. Thirteen hilly counties, including Sangzhi, Xinhuang, and Guzhang, had efficiency levels below 0.700 on average, and thirty-nine counties had average efficiency levels below 0.800. When the results of the DEA measure are compared to those from the first stage, after environmental factors have been taken into account, the efficiency is more than average 0.950 changes in the county but size, the Shaoshan, Linxiang, Jinshi, Longhui, 17 suburb counties switched with Hanshou, Nan, Huarong, Xiangyin, Ningxiang, Liuyang, and other 18 major grain production counties. The area of important counties around Dongting Lake region, including Hanshou, Nan, and Huarong, have low rice production efficiency because of external environmental conditions. There were 24 counties with an average efficiency below 0.800, the majority of which produced small counties of rice, including Guidong, Lengshuijiang, Chengbu, Luxi, Huayuan, and Baojing. Further investigation revealed that the scale efficiency of most mountainous counties had significantly decreased, which indicated that the plain geographic advantage of Dongting Lake region was conducive to the modern production of rice, while the mountainous area of Xiang-Xi region was not. The main reason for the change in rice production efficiency value was the overall reduction of its scale efficiency, the results of which indicated that the mountainous area of Xiang-Xi region was not conducive to the modern production of rice. Dongting Lake region, Xiang-Xi region, Chang-Zhu-Tan region, and southern Hunan regions had overall efficiency levels in Hunan Province that ranged from high to low, as illustrated in Figure 2. From 2006 to 2018, the average rice productivity was 0.909, 0.837, 0.830, and 0.817, respectively. With a maximum annual efficiency of 0.934 in 2009 and a minimum annual efficiency of 0.875 in 2006, Dongting Lake region has consistently been a high efficiency area for the production of rice. Xiang-Xi region’s average annual efficiency saw a dramatic shift, reaching a maximum of 0.872 in 2010 and a minimum of 0.797 in 2006. Chang-Zhu-Tan region’s annual average efficiency varied widely from year to year and sharply improved from 2006 to 2010. In 2012, the annual average efficiency was at its highest point, 0.890, and at its lowest point, 0.730, in 2006. In southern Hunan region, the average annual efficiency remained comparatively constant, reaching a maximum of 0.843 in 2010 and a minimum of 0.787 in 2006.
The entire study was classified into five categories according to 1.000-0.950-0.850-0.750-0.500-0.500-0 (with the minimum efficiency value as the limit value), and the spatial layout of efficiency was visualized. These categories were based on the rice production efficiency values of the four node years (2006, 2010, 2014, and 2018) in Hunan Province. Figure 3 depicts the spatial distribution of node years. The findings demonstrated that rice production efficiency in Hunan Province varied significantly by region. The number of counties with high yield efficiency continuously rose over time, demonstrating that rice production efficiency in Hunan Province increased overall with the continual development of agricultural research investment, production infrastructure, and human resources. Only 28 counties had an efficiency rating above 0.950 in 2006, when viewed from the perspective of the node year, and 37 had an efficiency score below 0.750. In 2018, there were only 23 counties with an efficiency score under 0.750, compared to 44 counties with a value above 0.950. Present in southern Zhuzhou, northern Hengyang, northern Shaoyang, and southern Huaihua, which, for the boundary of the two big block, northern blocks, are the most high-efficiency areas, while the southern blocks are mostly low-efficiency areas. The visible rice production efficiency of Dongting Lake region and southern Hunan regions is significantly impacted by the regional natural resource endowment, production technology and human capital; high-efficiency areas mainly appeared in Dongting Lake region, Chang-Zhu-Tan region, and Loudi county, and low-efficiency areas mainly appeared in Xiang-Xi region’s Zhangjiajie and Xiangxi, particularly the Guzhang, Sangzhi, and other counties. This indicated that the rice production efficiency frontier was spreading quickly surrounding Dongting Lake region, but the grain production circumstances in low value areas need to be consistently improved.
3.1.2. Spatiotemporal Clustering Pattern Analysis of Rice Production Efficiency
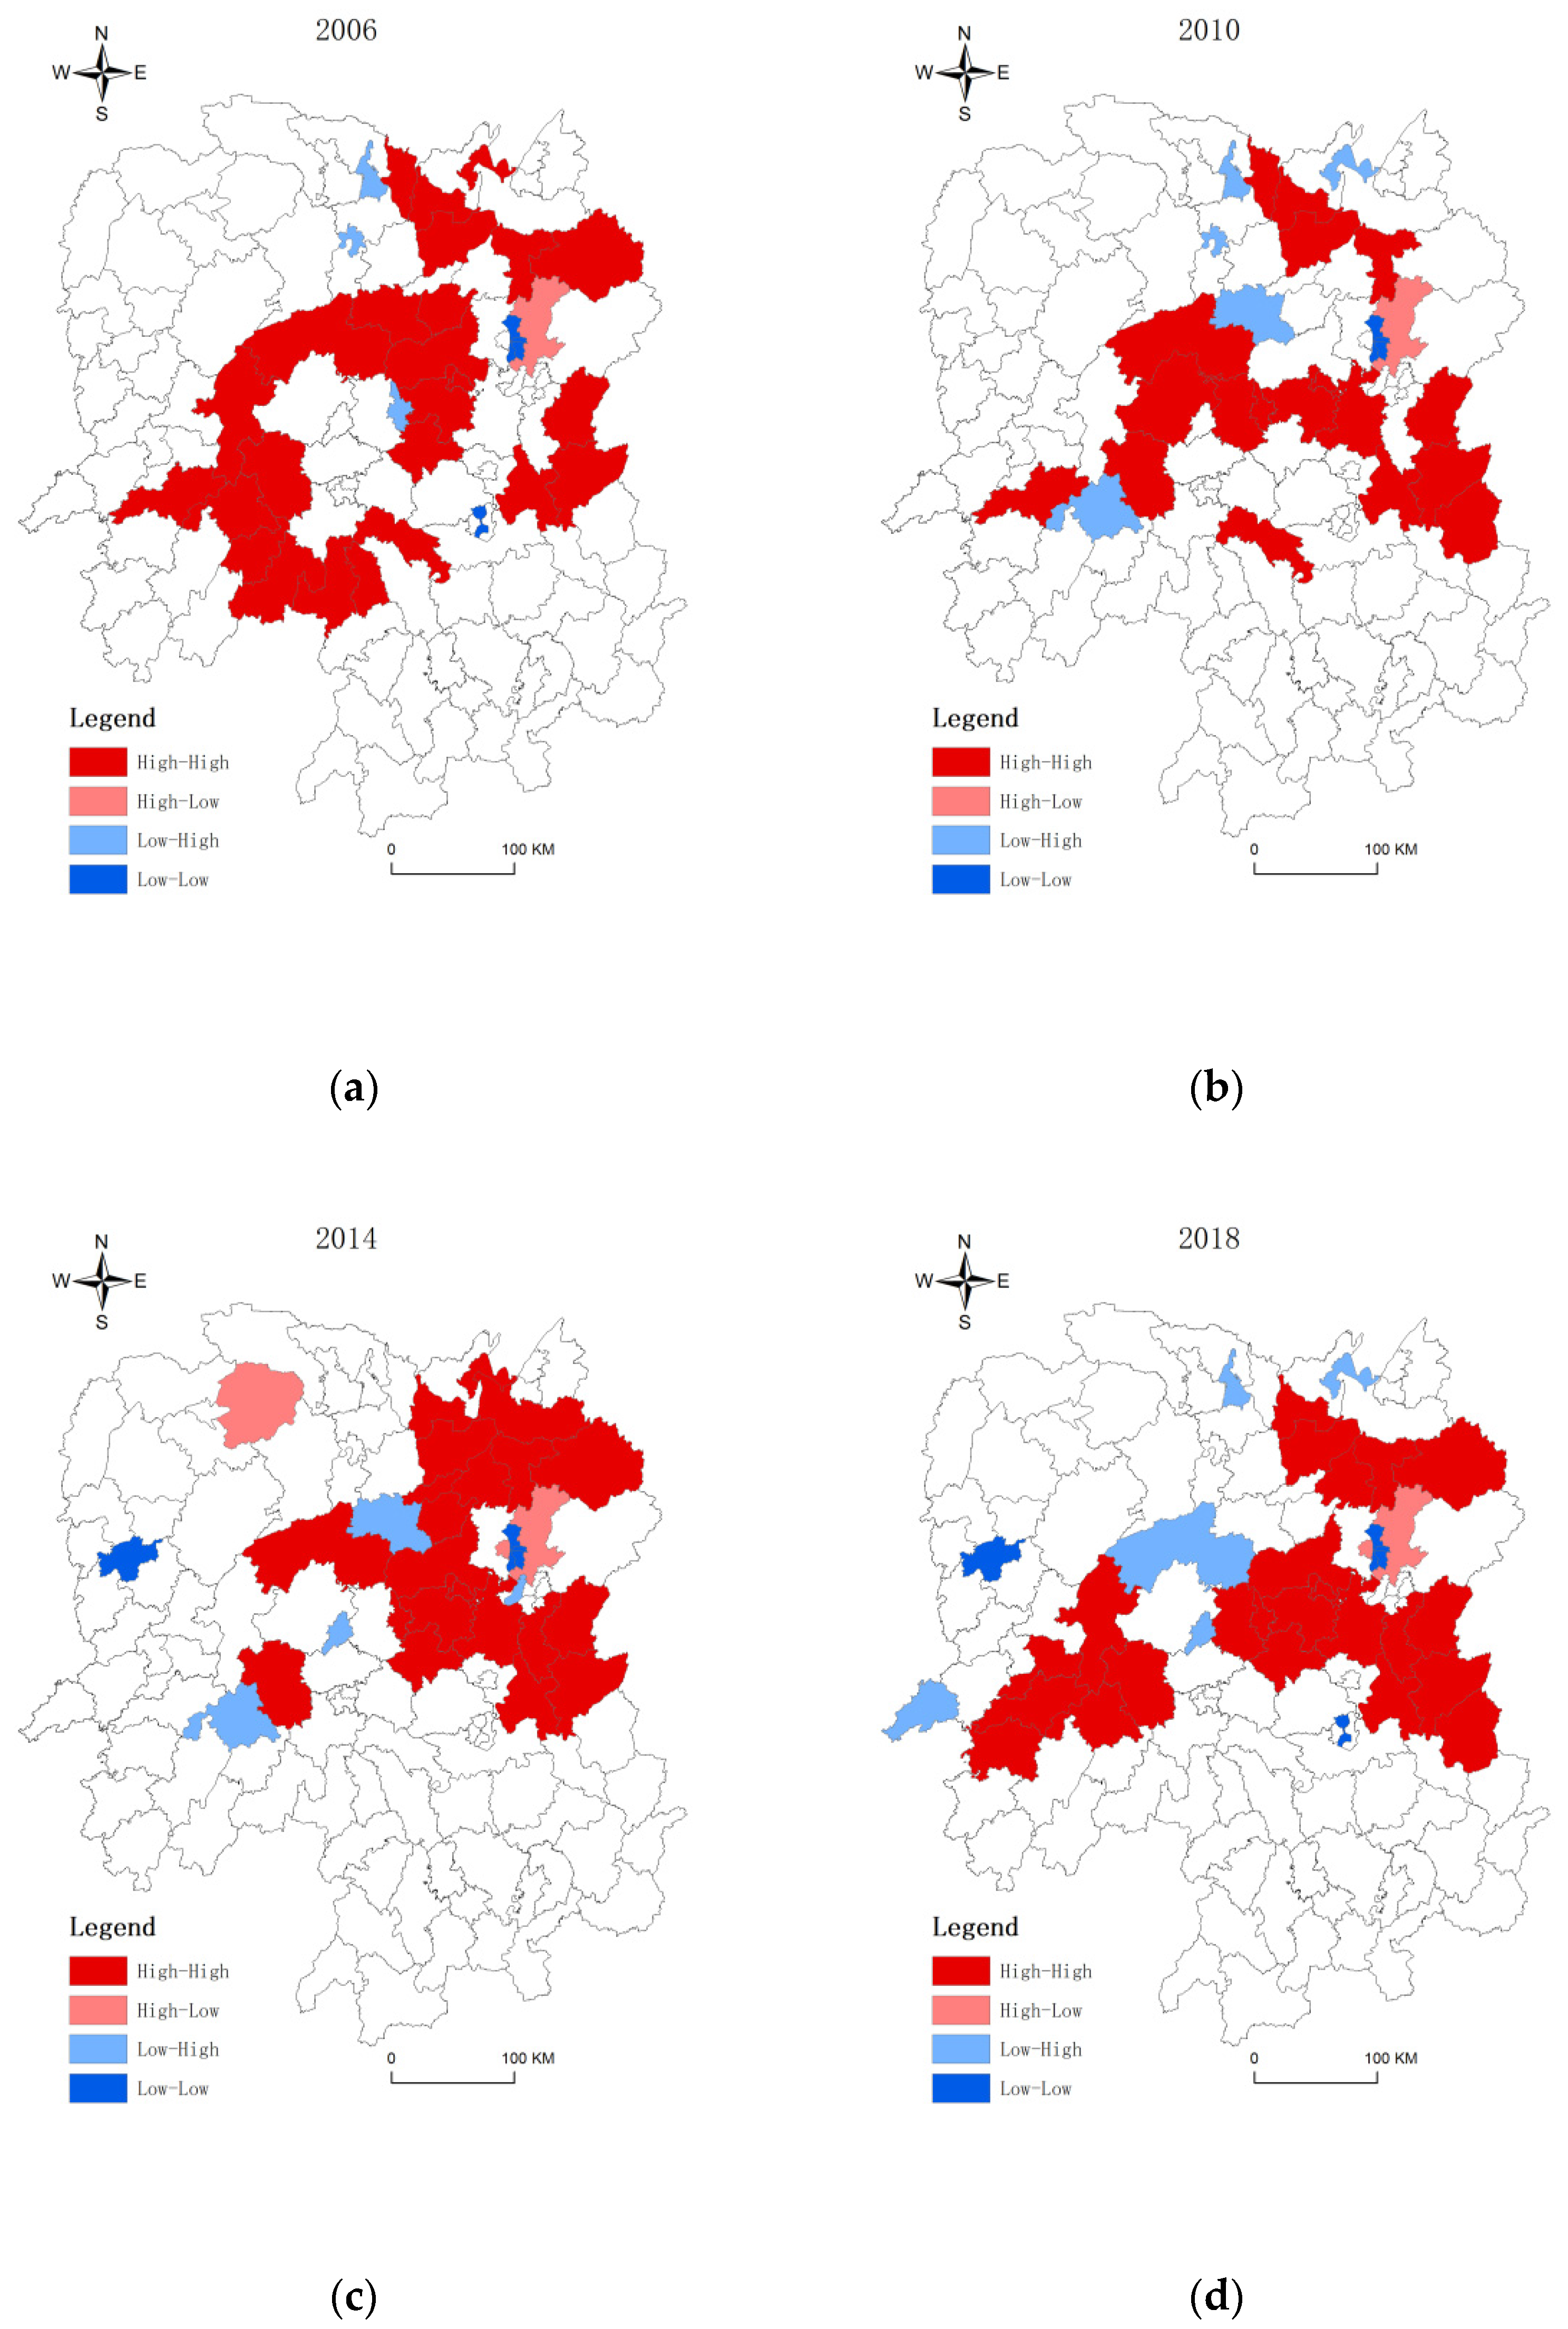
In order to investigate the spatial correlation of rice production efficiency agglomeration in Hunan Province, the geographical distance weight matrix was utilized as the spatial weight matrix. The findings are depicted in Figure 4. Each node year’s Moran’s I index was close to 0.25 and met the 1% threshold for significance. There was a regional relative clustering phenomena and positive spatial autocorrelation in the Hunan Province’s county-level rice production efficiency. The high efficiency clustering of counties around Dongting Lake region, such Yiyang and Yueyang, and counties in Xiang-Xi region and southern Hunan region, including Xiangxi, Huaihua, and Chenzhou districts, was shown to be one of the clustering features of rice production efficiency that were steadily becoming more prominent in Hunan Province. Particularly, there were 25, 18, 21, and 23, respectively, high-high clustering types in node years. The central Hunan region experienced a significant inter-annual adjustment, and the high-value clustering area was gradually moved from Anhua, Taojiang, Ningxiang, and Xiangtan to the southwest jurisdiction county of Zhuzhou district, Xiangtan district, and Shaoyang district. There are 6, 4, 5, and 7 different low-low agglomeration kinds, correspondingly, in node years. In the southeast of Chenzhou district’s Rucheng, and Jishou district, Xinhuang of Huaihua, are the primary locations of the low-value agglomeration zones, and the breadth of the agglomeration increasingly shrinks. Dongting Lake region, which serves as a major hub for the production of rice, has benefited to some extent from favorable policy and market developments, and the spread of rice production to neighboring counties, high-value clusters can be spread out. In addition, several counties in Xiang-Xi region’s Zhangjiajie district and Xiangxi State as well as some counties in southern Hunan region are influenced by the terrain, and the use of mechanical power and labor has resulted in some redundancy, which lowers the efficiency of rice production. It is also clear that poor value clustering occurs in these counties, despite some control over the use of chemical fertilizers and pesticides.
3.2. Analysis on Influencing Factors of Spatiotemporal Variation of Rice Production Efficiency
3.2.1. Analysis on Influencing Factors of Spatiotemporal Differentiation of Rice Production Efficiency at Provincial Scale
The socioeconomic cross section data of rice production at the county level for the years 2006, 2010, 2014, and 2018 were used as the analysis object. The detection factors were divided into five categories using the equal frequency discretization method, and the geographic detector, which was used to determine the degree to which each factor influenced the spatial differentiation of the annual average efficiency of rice production in Hunan province at the provincial scale. Table 4 displays the q-statistic and the accompanying p-value.
Findings from the detection process indicate that the second industry’s share of the national income in the years 2006, 2010, 2014, and 2018 were correspondingly 12.75%, 7.83%, 6.57%, and 8.44%. Differential space and time effects have a “U”-shaped effect on the efficiency of rice production. Despite the fact that the secondary industry’s share of Hunan Province’s GDP has been rising steadily over the years, this data shows that the rice production is unstably impacted by roads, power grids, and other infrastructure, thus demonstrating that the spillover effect of industry on agriculture needs to be strengthened. In node years, 28.80%, 19.90%, 8.21%, and 3.05%, respectively, contributed to the per capita disposable income of farmers. The impact of this detecting element on the spatiotemporal differentiation of rice production efficiency diminished year after year, indicating that while farmers’ disposable money increased with the high-quality development of the economy and society, their conception of rice planting altered. Fiscal spending on forestry, agriculture, and water resources contributed 13.63%, 26.97%, 30.04%, and 34.62%, respectively, in the node years. The effect of rice production efficiency on spatiotemporal variations was gradually growing. It is evident that the Central Committee’s efforts to support and strengthen agriculture have resulted in a number of substantial deployments and implementations that have significantly expanded the impact of fiscal support for agriculture and encouraged the development of farming facilities. It helped development, such as reducing poverty, and helped rice production to some amount. The contributions made by the rice multiple cropping index were 18.15%, 18.04%, 29.05%, and 14.90%, respectively, and had a substantial impact on the spatiotemporal differentiation of rice production efficiency in node years. It was somewhat confirmed that the establishment of various cropping regions with a good endowment of natural resources and institutional policy support had a clear favorable impact on rice production.
3.2.2. Analysis on Influencing Factors of Spatiotemporal Variation of Rice Production Efficiency at Regional Scale
In order to further reveal the spatial differentiation characteristics of rice production efficiency in Hunan Province, this paper probes and analyzes the influencing factors of the mean value of rice production efficiency in Dongting Lake region, southern Hunan region, Xiang-Xi region, Chang-Zhu-Tan region, and Hunan Province from 2006 to 2018, respectively, so as to put forward targeted countermeasures and suggestions for the zoning control of rice production in Hunan Province. The detection results are shown in Table 5.
Following Dongting Lake region (10.32%) and Chang-Zhu-Tan region (3.36%), it was determined from the analysis of the exploration data that the secondary industry proportion of GDP in southern Hunan region (28.79%) contributed most to the spatiotemporal differentiation of rice production efficiency. In southern Hunan region, cities are assisting in the rapid development of rural areas, which is attempting to create a new pattern of integrating urban and rural development. Farmland facilities, equipment, and industry are promoting agriculture. With a Q value of 65.47%, the per capita disposable income of farmers makes the highest contribution to southern Hunan region. This shows that an increase in farmers’ disposable income in southern Hunan region increases their ability to afford technical training, agricultural insurance and services, and rice production. For southern Hunan region, Chang-Zhu-Tan region, Dongting Lake region, and Xiang-Xi region, the corresponding Q values of the fiscal impacts of agriculture, forestry, and water spending were 30.67%, 27.58%, 16.91%, and 14.31%. Under the direction of financial resources and institutional policies to support and benefit agriculture, the efficiency of rice production in southern Hunan region progressively increased. Input from financial agriculture, forestry, and water resources help to direct rice production in a favorable way. Both Chang-Zhu-Tan region’s and southern Hunan region’s Q values for the influence of the rice multiple cropping index were identical, at 36.14% and 35.64%, respectively. The Q values of the influence on Xiang-Xi region and Dongting Lake region were 23.71% and 12.84%, respectively, indicating that despite the basic fertility of paddy fields dropped with numerous rice crops, and rice production was somewhat aided by the area’s abundant natural resources and supportive institutional policies.
4. Conclusions and Discussion
Taking 122 counties in Hunan Province as the research unit, the rice production efficiency of counties in Hunan Province was measured and analyzed by means of three-stage DEA, spatial autocorrelation and geodetector, and the spatiotemporal evolution characteristics and influencing factors of efficiency were revealed. The research mainly found that Hunan Province’s rice production in Taoyuan, Liling, and Anren was at the cutting edge of efficiency, and the rice production efficiency of most of the key grain production counties in Dongting Lake region was greatly affected by external environmental factors. For example, the advantages of the primary industry in GDP and the high rice cropping index promote rice production in Dongting Lake region. There were pronounced regional variances in rice productivity. Dongting Lake region had a majority of the high-efficiency areas, while the low-efficiency areas were primarily found in Xiang-Xi region’s northwest and southern Hunan region’s southeast. The range of rice productivity rapidly shrunk as a result. Financial investments in agriculture, forestry, and water resources, as well as per capita disposable income of farmers, were the main determinants of the spatiotemporal variation in rice production efficiency. The spatiotemporal divergence of rice production efficiency at the province level was U-shapedly influenced by the share of the secondary industry in GDP, and the impact of rice multiple cropping index on the spatiotemporal differentiation of rice production efficiency is significant. southern Hunan region received the biggest contribution from farmers in terms of disposable income per person at the regional level, and the contribution to Xiang-Xi region is the smallest.
The Dongting Lake region with a high multiple cropping index has basically realized the integration of input and output of natural endowment. Changde and Yiyang mainly improve PTE, while Huaihua and Shaoyang further improve TE by upgrading SE. For Changsha, Zhuzhou, and Hengyang, PTE is greater than 0.900, for which Changsha and Zhuzhou is more than 0.950, but SE below 0.900. Hengyang rice production efficiency focuses on improvement direction for a moderate scale. The focus of change is to expand the scale of rice production, to achieve the centralized allocation of resources. In Chenzhou, Yongzhou and southern Hunan, PTE should be improved in the later development, the technical management level should be improved in rice production, the popularization and application of rice farming technology should be strengthened, and the construction of high-standard farmland and rice production functional area should be accelerated. For Xiang-xi region and Zhangjiajie, PTE SE value has larger room for improvement; the improvement of rice production efficiency has great difficulties. In theory, the future rice production, on the one hand, should pay attention to the improvement of the management level, and on the other hand, shouldexpand the scale of rice production, but due to the natural environment of mountain landscape, paddy field upgrade is difficult. The region should mainly speed up the introduction of rice technology, and scientific management and application.
To secure absolute world grain security in the new era and “exactly” improve rice production efficiency and benefits, we should develop rice production on a moderate scale based on natural resource endowment, strengthen paddy field infrastructure construction and supervision, strengthen research, development, and promotion of rice farming technology, promote the cultivation of new professional rice farmers, and increase the minimum purchase price of rice and rice products. Additionally, we should establish a comprehensive farmland transfer management service platform, realize the whole process of farmland contract management rights, realize the management of paddy transfer information, and develop appropriate scale rice production based on regional natural resource endowment. In order to carry out the modest scale of production, organization, and management of the villagers’ water, farmers under the premise of volunteering, follow to where the natural resource is rich in rice production “functional areas” production principle and are compensated in line with the law. They must organize and manage the flow of paddy fields between villagers to agricultural intermediary service organizations and new-scale business entities for circulation, and prevent the threat that abandoned, “non-staple” structures provide to the paddy field’s protection. For instance, Hunan Province’s Dongting Lake region can develop major grain growers as a production and management entity, whereas southern Hunan region and Xiang-Xi region can develop family farms as a production and management entity. It is also necessary to strengthen the construction and supervision of paddy field infrastructure, gradually promoting the construction of high-standard farmland fertile soil projects and improved seed and breeding projects such as water conservancy and irrigation, mechanical tillage road hardening, water and electricity supply, and communication, and strengthen the construction of rice production infrastructure through means such as agricultural machinery operation roads, UAV operating space, and rice storage facilities. This should be done to provide thorough infrastructure support services for the entire prenatal, middle, and postnatal series for rice production and management; at the same time, a stable paddy field ecosystem is a process for the wholesome development of the regional ecosystem. A threat to regional agricultural production and ecological security should be avoided, paddy fields and infrastructure should be better supervised, private water conservation and irrigation channel reforms should be avoided by rice farmers, and the sustainable growth of the contemporary rice sector should be ensured. Research, development, and promotion of rice cultivation technology, is full of local advantages, similar toa cluster of agricultural research institutes, the creation of a technical highland like Silicon Valley, smart intelligence in the seed industry, the selection and breeding of varieties with high yield, super high yield, great stress resistance, and the development of the premium Xiangrice brand. These are all essential to improving the efficiency of rice production. We should study green and low-carbon production methods, such as paddy field green fertilization, straw returning, and conservation tillage, and promote the reduction of chemical fertilizers and pesticides in agricultural production to prevent agricultural non-point source pollution. We should also replace traditional production components with contemporary material elements including scientific and technical advances to improve production efficiency. We should do this to link with the major news media in order to promote rice farming technology and to provide timely and accurate information and consulting services related to rice production for rice farmers through platforms such as the agricultural scientific network, expert consultation hotline, and agricultural information publicity bulletin board. For instance, the Hunan Province region of Dongting Lake should fully exploit the benefits of rice cultivation technology, establish a basis for demonstration rice planting, actively encourage and support the participation of relevant businesses and cooperatives, and realize the full application of rice cultivation technology to all different types of rice production bodies. This can be done by encouraging the development of new professional rice farmers by enhancing training topics, utilizing the benefits of education groups focused on agriculture to their fullest extent, expanding rice farmers’ access to extension services and training, carrying out overall cultivation from the perspectives of identity, business structure, and new technology, and actively innovating training techniques for new professional rice farmers. We will train many new, skilled rice farmers who love the sector, have a solid grasp of technology, and are excellent managers. To achieve the modernization of rice production, for instance, southern Hunan region and Xiang-Xi region should continue to support their production socialization services, encourage the development of new professional rice farmers, encourage the improvement of the quality of the labor force engaged in rice production, and establish a community of interests through the signing of service agreements between leading rice enterprises and traditional rice farmers. The creation of rice production systems and policies should take into account the new state of grain security, and priority should be given to institutional and policy guarantees, such as financial support for agriculture, subsidies for the acquisition of cultivated land and agricultural gear and tools, adequate support for rice planting, and protection of the minimum price of rice, to help farmers allocate and use resources wisely. To support the value-added of the entire rice industry chain, relevant supporting policies were published for various links and themes under the direction of system and policy. In order to form a good rice planting ecology of paddy fields that is jointly preserved by the entire community, it is also necessary to strengthen the management and protection of paddy fields as well as public awareness campaigns. For instance, it should promote the paddy field’s comprehensive ecological cultivation mode in accordance with local conditions, develop the symbiotic co-cultivation of rice and fish, organically combine rice planting and aquaculture, and increase the ecological market competitiveness of Xiang rice.
5. Paper Limitations and Prospective Future Research
The spatiotemporal evolution and influencing variables of rice production efficiency at the county level in Hunan Province were reviewed in this study from the perspective of geospace, which effectively compensated for the absence of research, gave a new perspective for regional optimization of rice production from the perspective of geography, and scientific usage of land resources from the perspective of resource science, and provided guidance for promoting sustainable development of grain production. However, the following areas of this study still require improvement: first, the future research must be a breakthrough in the whole world and contribute to the overall efficiency of rice production level ascent for the reason, on the scale, this paper only chooses Chinese county as study area, ignoring more external variations of wide area. Second, in terms of influencing factors, this work does not conduct a thorough investigation on the mechanisms underlying rice production efficiency, and the selected influence factors did not involve natural conditions, planting history and culture, etc. To create a more thorough influencing system, future research must include a number of aspects that affect rice production efficiency. We can attempt to choose specific significant rice-producing regions, such as the Dongting Lake region as a classic case for in-depth production, in order to explain its driving mechanism from a microscopic perspective. Thirdly, in terms of the development of the research’s subject matter, this work did not exclude the municipal districts with low rice yield, and future discussions of the dynamic correlation and spatial spillover effects of rice production efficiency at various spatial scales are required. Last but not least, the follow-up research will extensively examine the impact evaluation of the COVID-19 outbreak on rice production efficiency in China in light of the fact that the time period chosen for this work was from 2006 to 2018, and that the analysis of rice production efficiency was not conducted based on the international environment background of COVID-19. To emphasize the current and practical significance, the variations in rice production efficiency before and after the COVID-19 epidemic were compared and studied.
Author Contributions
Conceptualization, F.Z. and X.Z.; methodology, X.Z. and Z.L.; software, F.C. and T.C.; validation, Z.L., F.Z. and T.C.; formal analysis, F.C.; investigation, F.C.; resources, F.Z.; data curation, Z.L.; writing—original draft preparation, X.Z. and F.Z.; writing—review and editing, X.Z. and Z.L.; visualization, Z.L. and T.C.; supervision, F.C.; project administration, F.Z. and X.Z.; funding acquisition, X.Z. All authors have read and agreed to the published version of the manuscript.
Funding
This research was funded by [National Natural Science Foundation of China], grant number 71573081.
Data Availability Statement
Not applicable.
Acknowledgments
We express our sincere appreciation to the anonymous reviewer for constructive comments.
Conflicts of Interest
The authors declare no conflict of interest. The funders had no role in the design of the study; in the collection, analyses, or interpretation of data; in the writing of the manuscript, or in the decision to publish the results.
References
- Hou, M.; Deng, Y.; Yao, S. Spatial Agglomeration Pattern and Driving Factors of Grain Production in China since the Reform and Opening Up. Land 2021, 10, 10. [Google Scholar] [CrossRef]
- Li, H.; Wu, Y.; Huang, X.; Sloan, M.; Skitmore, M. Spatial-temporal evolution and classification of marginalization of cultivated land in the process of urbanization. Habitat Int. 2017, 61, 1–8. [Google Scholar] [CrossRef] [Green Version]
- Gao, H.; Zhang, Y.; Xu, C.; Yang, Y. Towards a Sustainable Grain Production Network: An Empirical Study from Northeast China. Sustainability 2022, 14, 8849. [Google Scholar] [CrossRef]
- Zhang, Y.; Li, B. Detection of the Spatio-Temporal Differentiation Patterns and Influencing Factors of Wheat Production in Huang-Huai-Hai Region. Foods 2022, 11, 1617. [Google Scholar] [CrossRef] [PubMed]
- Chen, W.; Zhang, B.; Kong, X.; Wen, L.; Liao, Y.; Kong, L. Soybean Production and Spatial Agglomeration in China from 1949 to 2019. Land 2022, 11, 734. [Google Scholar] [CrossRef]
- Li, S.; Zhang, D.; Xie, Y.; Yang, C. Analysis on the spatio-temporal evolution and influencing factors of China’s grain production. Environ. Sci. Pollut. Res. 2022, 29, 23834–23846. [Google Scholar] [CrossRef]
- Kusnandar, K.; Brazier, F.M.; van Kooten, O. Empowering change for sustainable agriculture: The need for participation. Int. J. Agric. Sustain. 2019, 17, 271–286. [Google Scholar] [CrossRef] [Green Version]
- Long, H.; Tu, S.; Ge, D.; Li, T.; Liu, Y. The allocation and management of critical resources in rural China under restructuring: Problems and prospects. J. Rural Stud. 2016, 47, 392–412. [Google Scholar] [CrossRef] [Green Version]
- Wang, Y.; Gao, F.; Gao, G.; Zhao, J.; Wang, X. Production and Cultivated Area Variation in Cereal, Rice, Wheat and Maize in China (1998–2016). Agronomy 2019, 9, 222. [Google Scholar] [CrossRef] [Green Version]
- Bao, B.; Jiang, A.; Jin, S.; Zhang, R. The Evolution and Influencing Factors of Total Factor Productivity of Grain Production Environment: Evidence from Poyang Lake Basin, China. Land 2021, 10, 606. [Google Scholar] [CrossRef]
- Duan, P.; Qin, L.; Wang, Y.; He, H. Spatiotemporal Correlations between Water Footprint and Agricultural Inputs: A Case Study of Maize Production in Northeast China. Water 2015, 7, 4026–4040. [Google Scholar] [CrossRef] [Green Version]
- Islam, A.; Shen, S.; Yang, S.; Hu, Z.; Rahman, M. Spatiotemporal rice yield variations and potential agro-adaptation strategies in Bangladesh: A biophysical modeling approach. Sustain. Prod. Consump. 2020, 24, 121–138. [Google Scholar] [CrossRef]
- Jin, T.; Zhong, T. Changing rice cropping patterns and their impact on food security in southern China. Food Secur. 2022, 14, 907–917. [Google Scholar] [CrossRef]
- Shi, W.; Lu, C.; Shi, X.; Cui, J. Patterns and trends in grain self-sufficiency on the Tibetan Plateau during 1985–2016. J. Geogr. Sci. 2020, 30, 1590–1602. [Google Scholar] [CrossRef]
- Luo, X.; Ao, X.; Zhang, Z.; Wan, Q.; Liu, X. Spatiotemporal variations of cultivated land use efficiency in the Yangtze River Economic Belt based on carbon emission constraints. J. Geogr. Sci. 2020, 30, 535–552. [Google Scholar] [CrossRef]
- Hossain, M.; Kamil, A.; Baten, M.; Mustafa, A. Stochastic Frontier Approach and Data Envelopment Analysis to Total Factor Productivity and Efficiency Measurement of Bangladeshi Rice. PLoS ONE 2012, 7, e46081. [Google Scholar] [CrossRef] [Green Version]
- Jalilov, S.; Mainuddin, M.; Maniruzzaman, M.; Mahbubul, A.; Towfiqul, I. Efficiency in the Rice Farming: Evidence from Northwest Bangladesh. Agriculture 2019, 9, 245. [Google Scholar] [CrossRef] [Green Version]
- Sun, Z.; Li, X. Technical Efficiency of Chemical Fertilizer Use and Its Influencing Factors in China’s Rice Production. Sustainability 2021, 13, 1155. [Google Scholar] [CrossRef]
- Yu, X.; Yin, X.; Liu, Y.; Li, D. Do Agricultural Machinery Services Facilitate Land Transfer? Evidence from Rice Farmers in Sichuan Province, China. Land 2021, 10, 466. [Google Scholar] [CrossRef]
- Wang, Y.; Huang, J.; Wang, J.; Christopher, F. Mitigating rice production risks from drought through improving irrigation infrastructure and management in China. Aust. J. Agric. Resour. Econ. 2018, 62, 161–176. [Google Scholar] [CrossRef]
- Ge, X.; Zhu, F.; Yang, Y.; Liu, G.; Chen, F. Probing Influence Factors of Implementation Patterns for Sustainable Land Consolidation: Insights from Seventeen Years of Practice in Jiangsu Province, China. Sustainability 2020, 12, 3576. [Google Scholar] [CrossRef]
- Wagan, S.; Memon, Q.; Li, Q.; Luan, J. Measuring the efficiency of Pakistani rice production via stochastic frontier and data envelopment analyses. Custos Agronegocio 2019, 15, 63–86. [Google Scholar]
- Griffith, D.; Chun, Y. Spatial Autocorrelation and Uncertainty Associated with Remotely-Sensed Data. Remote Sens. 2016, 8, 535. [Google Scholar] [CrossRef] [Green Version]
- Guo, B.; He, D.; Zhao, X.; Zhang, Z.; Dong, Y. Analysis on the spatiotemporal patterns and driving mechanisms of China’s agricultural production efficiency from 2000 to 2015. Phys. Chem. Earth 2020, 120, 102909. [Google Scholar] [CrossRef]
- National Bureau of Statistics. China Statistical Yearbook 2007–2019. Available online: http://www.stats.gov.cn/tjsj/ndsj/ (accessed on 6 May 2022).
- Hunan Provincial Bureau of Statistics. Hunan Rural Statistical Yearbook 2007–2019. Available online: http://tjj.hunan.gov.cn/hntj/tjsj/index.html (accessed on 6 May 2022).
- Hunan Provincial Bureau of Statistics. Hunan Statistical Yearbook 2007–2019. Available online: http://tjj.hunan.gov.cn/hntj/tjsj/tjnj/index.html (accessed on 6 May 2022).
- Hunan Provincial Bureau of Statistics. Hunan Finance Statistical Yearbook 2007–2019. Available online: http://tjj.hunan.gov.cn/hntj/tjsj/tjnj/index.html (accessed on 6 May 2022).
- Charnes, A.; Cooper, W.; Rhodes, E. Measuring the efficiency of decision making units. Eur. J. Oper. Res. 1978, 2, 429–444. [Google Scholar] [CrossRef]
- Fried, H.; Lovell, C.; Schmidt, S.; Yaisawarng, S. Accounting for environmental effects and statistical noise in data envelopment analysis. J. Prod. Anal. 2002, 17, 157–174. [Google Scholar] [CrossRef]
- Azizi, H. DEA efficiency analysis: A DEA approach with double frontiers. Int. J. Syst. Sci. 2014, 45, 2289–2300. [Google Scholar] [CrossRef]
- Pan, Z.; Tang, D.; Kong, H.; He, J. An Analysis of Agricultural Production Efficiency of Yangtze River Economic Belt Based on a Three-Stage DEA Malmquist Model. Int. J. Environ. Res. Public Health 2022, 19, 958. [Google Scholar] [CrossRef]
- Jiang, M.; Qi, C. Measurement and Analysis of Agricultural Production Efficiency in Taiwan of China Based on Three-stage DEA Model. Asian Agric. Res. 2018, 10, 7. [Google Scholar]
- Chen, Y. An analytical process of spatial autocorrelation functions based on Moran’s index. PLoS ONE 2021, 16, e0249589. [Google Scholar] [CrossRef]
- Ji, J.; Tang, Z.; Wang, L.; Liu, W.; Shifaw, E.; Zhang, W.; Guo, B. Spatiotemporal Analysis of the Coupling Coordination Degree between Haze Disaster and Urbanization Systems in China from 2000 to 2020. Systems 2022, 10, 150. [Google Scholar] [CrossRef]
- Wang, Q.; Jiang, D.; Gao, Y.; Zhang, Z.; Chang, Q. Examining the Driving Factors of SOM Using a Multi-Scale GWR Model Augmented by Geo-Detector and GWPCA Analysis. Agronomy 2022, 12, 1697. [Google Scholar] [CrossRef]
- Zhang, Q.; Shi, F.; Abdullahi, N.; Shao, L.; Huo, X. An empirical study on spatial-temporal dynamics and influencing factors of apple production in China. PLoS ONE 2020, 15, e0240140. [Google Scholar] [CrossRef] [PubMed]
- Yin, G.; Lin, Z.; Jiang, X.; Yan, H.; Wang, X. Spatiotemporal differentiations of arable land use intensity—A comparative study of two typical grain producing regions in northern and southern China. J. Clean. Prod. 2019, 208, 1159–1170. [Google Scholar] [CrossRef]
- Zhang, D.; Wang, H.; Lou, S. Research on grain production efficiency in China’s main grain-producing areas from the perspective of grain subsidy. Environ. Technol. Innov. 2021, 22, 101530. [Google Scholar] [CrossRef]
- Lu, L.; Chiu, S.; Chiu, Y.; Chang, T. Three-stage circular efficiency evaluation of agricultural food production, food consumption, and food waste recycling in EU countries. J. Clean. Prod. 2022, 343, 130870. [Google Scholar] [CrossRef]
- Ma, L.; Long, H.; Tang, L.; Tu, S.; Zhang, Y. Analysis of the spatial variations of determinants of agricultural production efficiency in China. Comput. Electron. Agric. 2021, 180, 105890. [Google Scholar] [CrossRef]
- Yu, D.; Hu, S.; Tong, L.; Xia, C. Spatiotemporal Dynamics of Cultivated Land and Its Influences on Grain Production Potential in Hunan Province, China. Land 2020, 9, 510. [Google Scholar] [CrossRef]
- Sun, Y.; Chang, Y.; Liu, J.; Ge, X.; Liu, G. Spatial Differentiation of Non-Grain Production on Cultivated Land and Its Driving Factors in Coastal China. Sustainability 2021, 13, 13064. [Google Scholar] [CrossRef]
- Cai, J.; Ma, E.; Lin, J.; Liao, L.; Han, Y. Exploring global food security pattern from the perspective of spatio-temporal evolution. J. Geogr. Sci. 2020, 30, 179–196. [Google Scholar] [CrossRef]
Figure 1.
Overview of the study area.
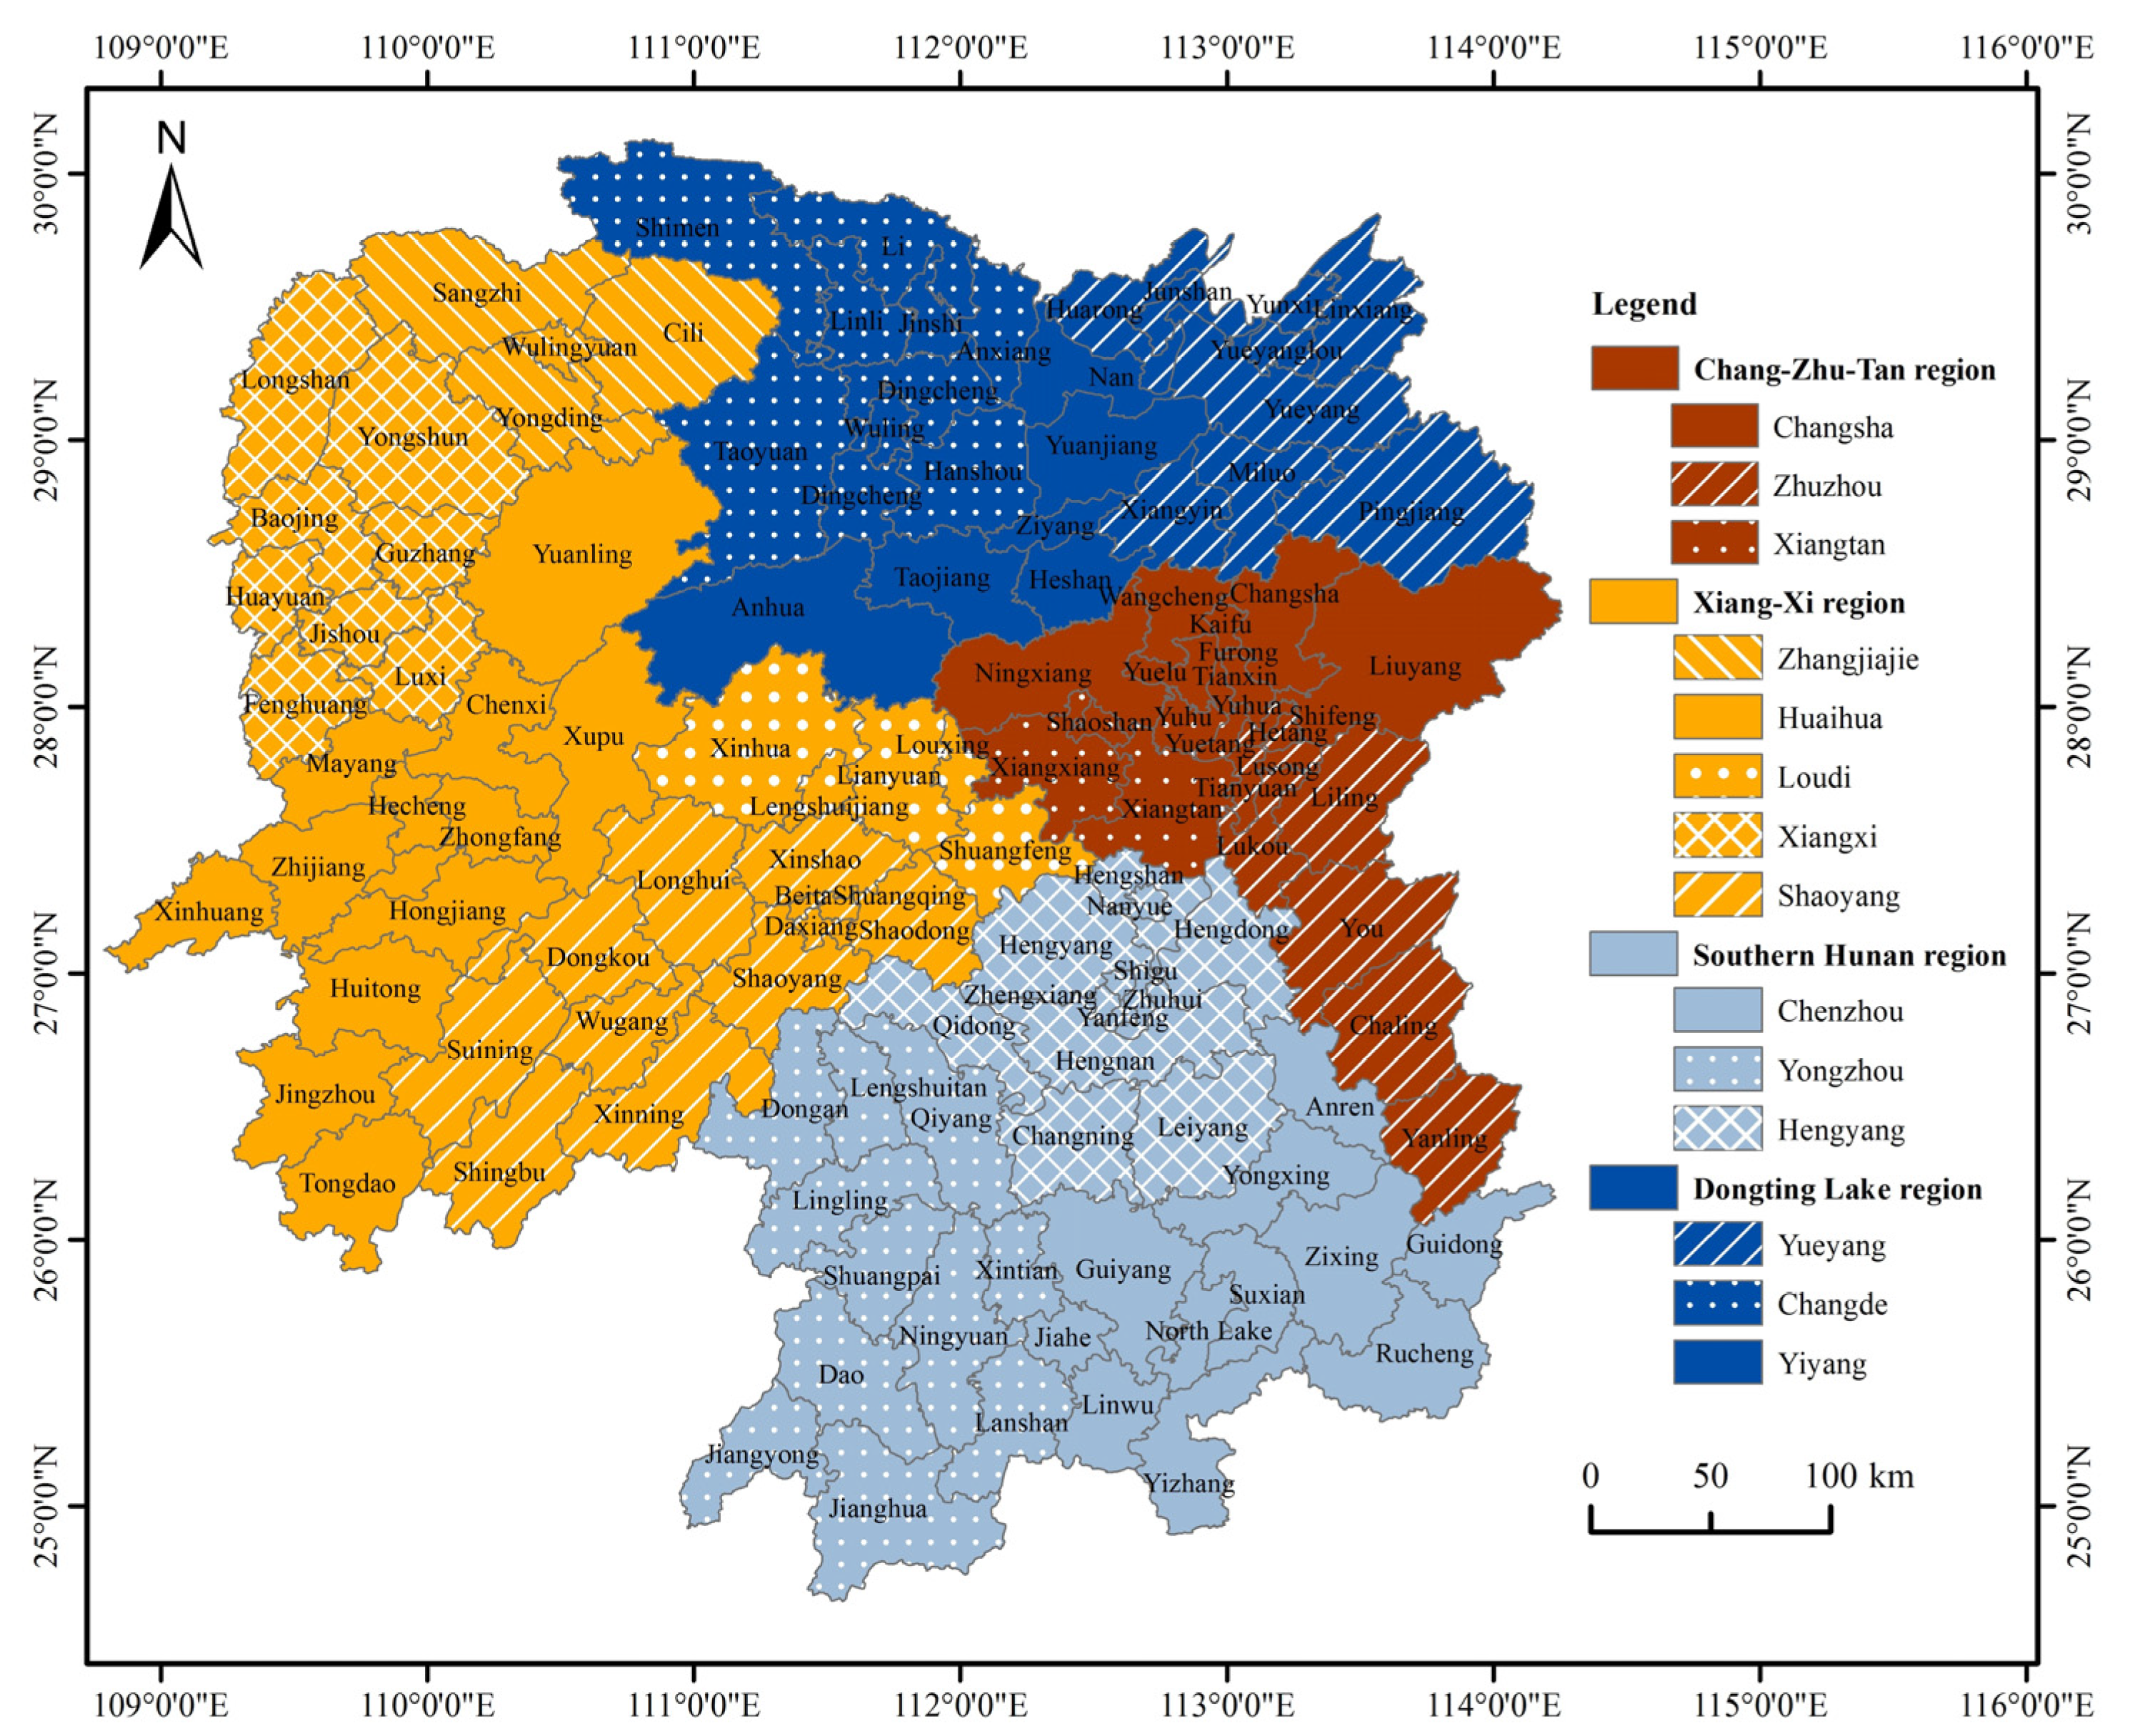
Figure 2.
Time-series curve of annual average efficiency of rice production in four regions of the Hunan Province.
Figure 2.
Time-series curve of annual average efficiency of rice production in four regions of the Hunan Province.

Figure 3.
Spatial distribution of rice production efficiency in Hunan Province in 2006 (a), 2010 (b), 2014 (c), and 2018 (d).
Figure 3.
Spatial distribution of rice production efficiency in Hunan Province in 2006 (a), 2010 (b), 2014 (c), and 2018 (d).
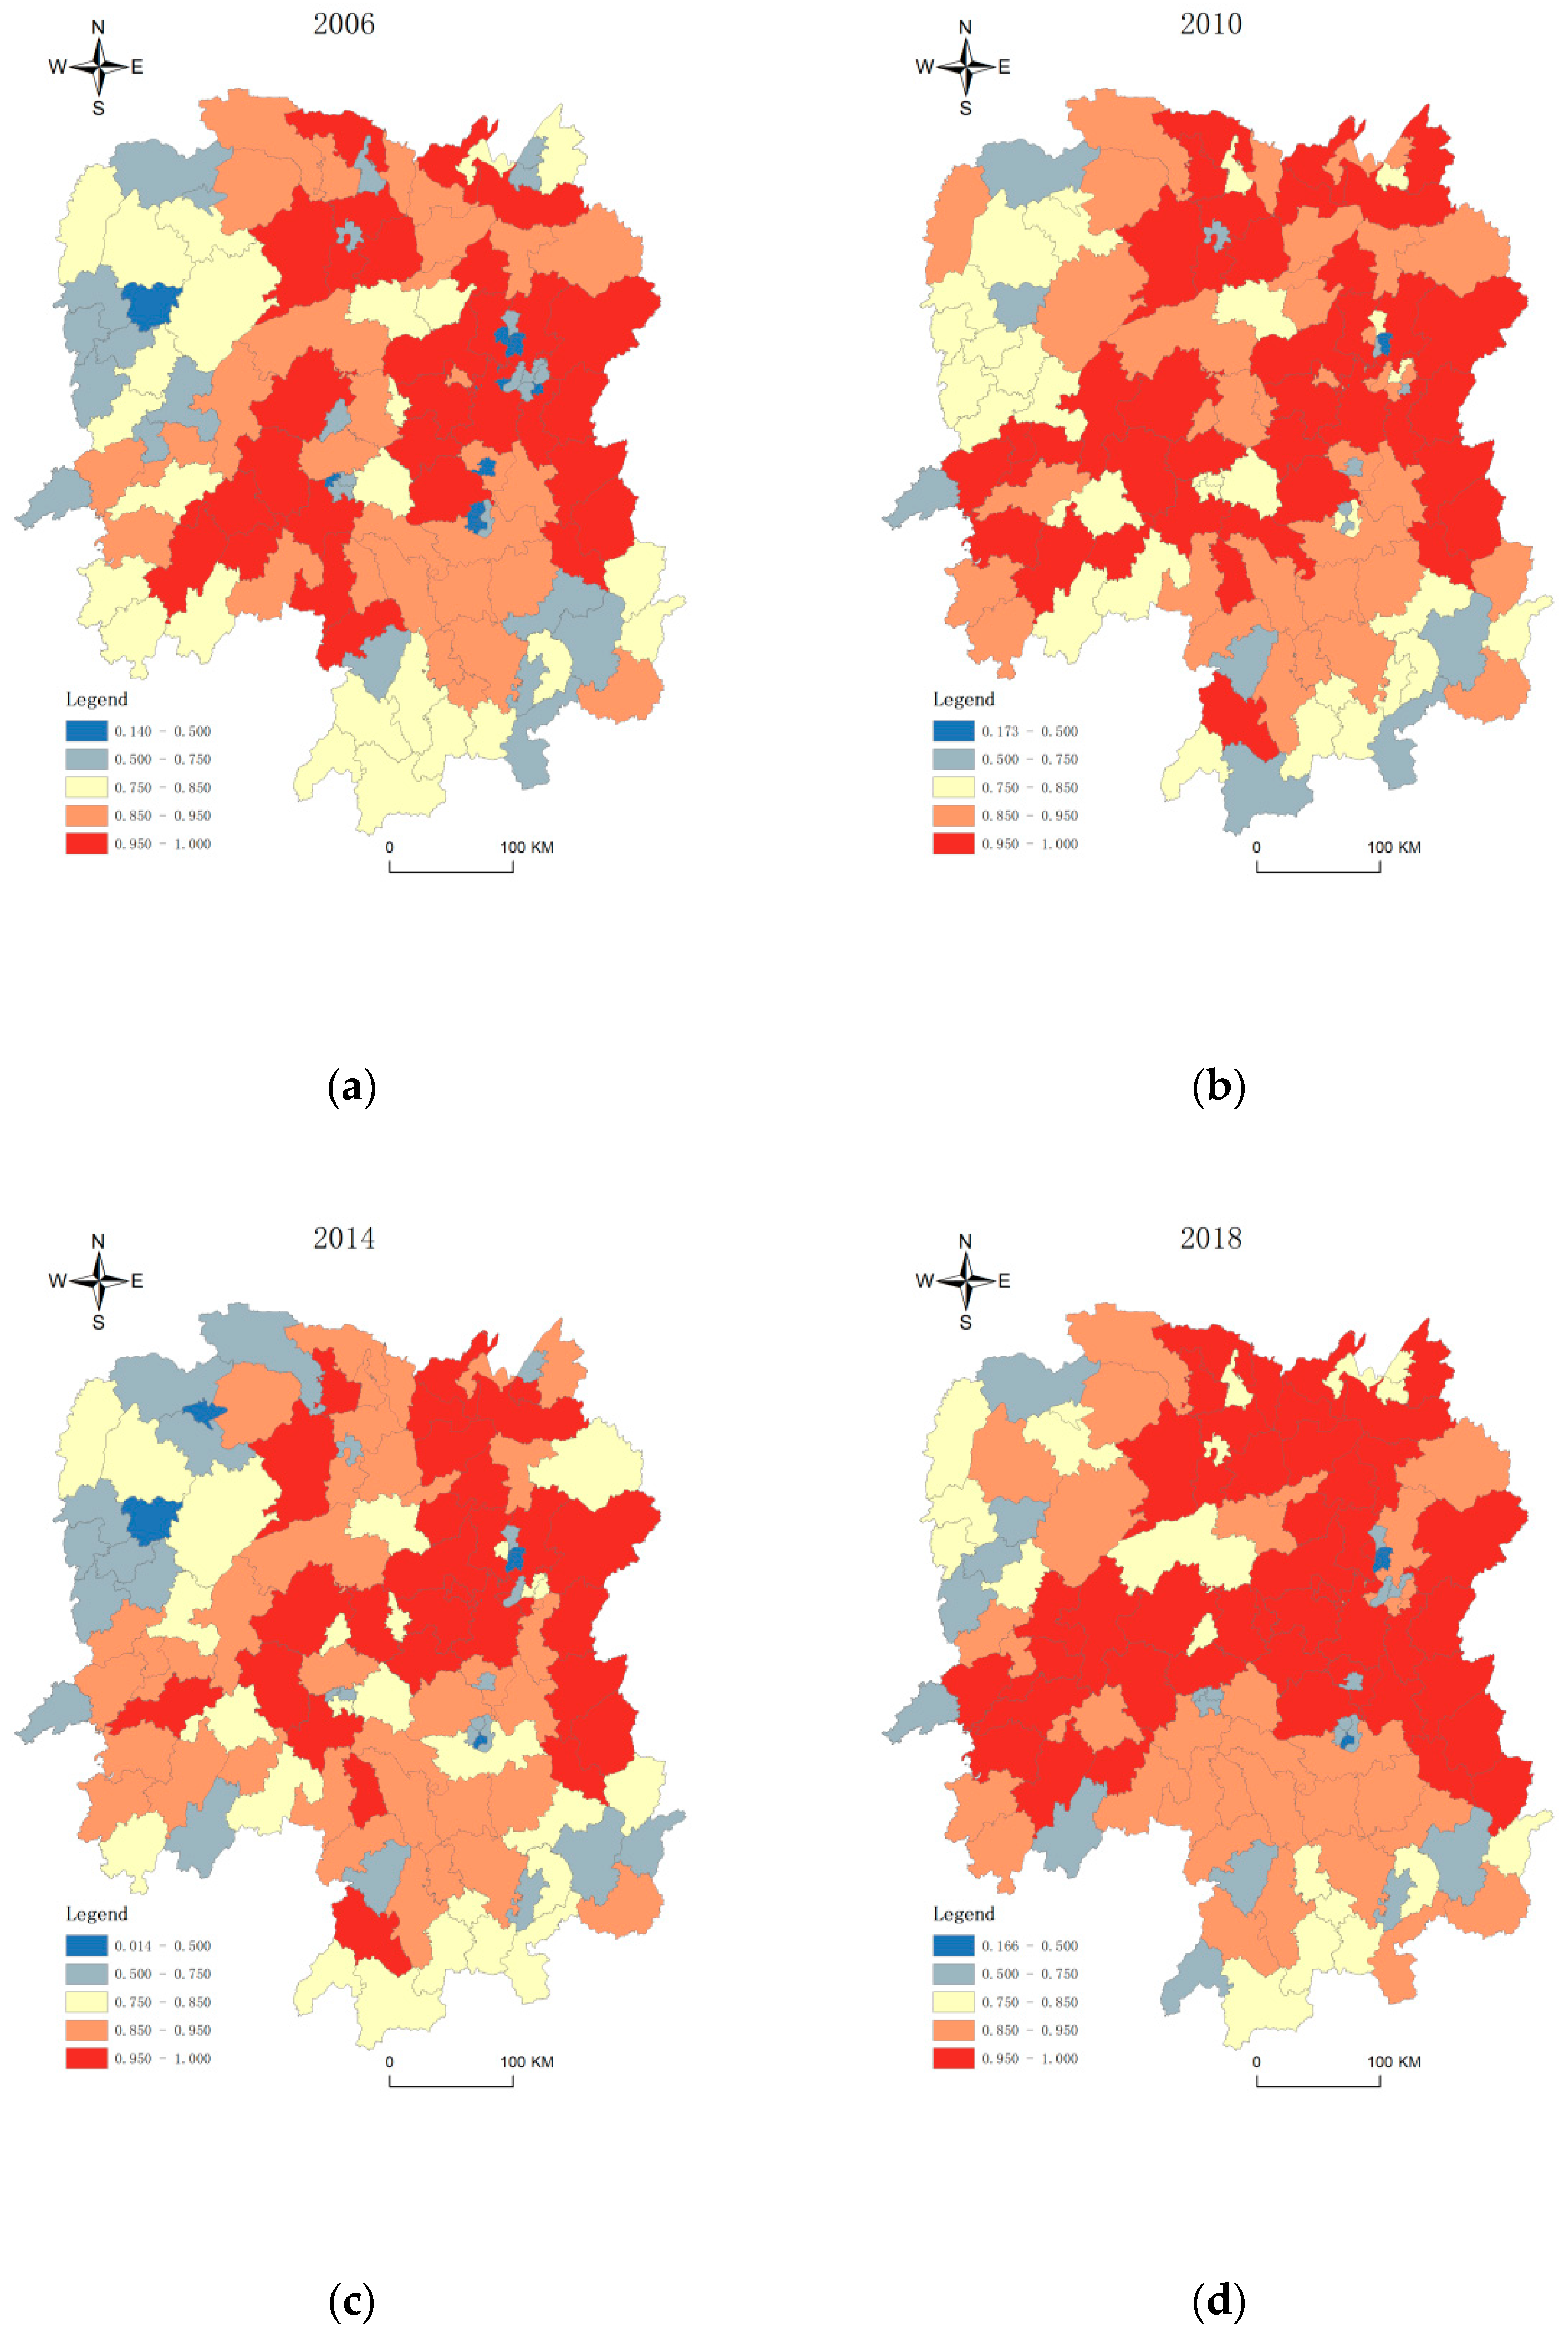
Figure 4.
LISA clustering maps of rice production efficiency in Hunan Province in 2006 (a), 2010 (b), 2014 (c), and 2018 (d).
Figure 4.
LISA clustering maps of rice production efficiency in Hunan Province in 2006 (a), 2010 (b), 2014 (c), and 2018 (d).

Table 1.
Analysis unit division of rice production efficiency in Hunan Province.
| Regions | Districts | Counties |
|---|---|---|
| Dongting Lake | Yueyang | Miluo, Linxiang, Yueyang, Pingjiang, Xiangyin, Huarong, Yueyang lou, Yunxi, Junshan |
| Changde | Jinshi, Anxiang, Hanshou, Li, Linli, Taoyuan, Shimen, Wuling, Dingcheng | |
| Yiyang | Yuanjiang, Nan, Taojiang, Anhua, Ziyang, Heshan | |
| Southern Hunan | Hengyang | Leiyang, Changning, Hengyang, Hengnan, Hengshan, Hengdong, Qidong, Zhuhui, Yanfeng, Shigu, Zhengxiang, Nanyue |
| Chenzhou | Zixing, Guiyang, Yongxing, Yizhang, Jiahe, Linwu, Rucheng, Guidong, Anren, Beihu, Suxian | |
| Yongzhou | Dongan, Dao, Ningyuan, Jiangyong, Jianghua, Lanshan, Xintian, Shuangpai, Qiyang, Lingling, Lengshuitan | |
| Xiang-Xi | Loudi | Lengshuijiang, Lianyuan, Shuangfeng, Xinhua, Louxing |
| Shaoyang | Wugang, Shaodong, Xinshao, Shaoyang, Longhui, Dongkou, Xinning, Suining, Chengbu, Shuangqing, Daxiang, Beita | |
| Huaihua | Hongjiang, Zhongfang, Yuanling, Chenxi, Xupu, Mayang, Huitong, Xinhuang, Zhijiang, Jingzhou, Tongdao, Hecheng | |
| Zhangjiajie | Cili, Sangzhi, Yongding, Wulingyuan | |
| Xiangxi | Jishou, Luxi, Fenghuang, Huayuan, Baojing, Guzhang, Yongshun, Longshan | |
| Chang-Zhu-Tan | Changsha | Liuyang, Ningxiang, Changsha, Furong, Tianxin, Yuelu, Kaifu, Yuhua, Wangcheng |
| Zhuzhou | Liling, You, Chaling, Yanling, Hetang, Shifeng, Lusong, Tianyuan, Lukou | |
| Xiangtan | Xiangxiang, Shaoshan, Xiangtan, Yuhu, Yuetang |
Note. The data is sorted out according to the administrative divisions of Hunan Province.
Table 2.
Descriptive statistics of variables (N = 1586).
| Variables | Minimum | Maximum | Mean | SD |
|---|---|---|---|---|
| Rice yield | 191.00 | 886,698.00 | 218,892.39 | 187,497.09 |
| Planting area | 30.00 | 132,290.00 | 34,327.20 | 29,051.71 |
| Irrigation area | 30.00 | 86,320.00 | 23,586.05 | 18,612.76 |
| Fertilizer | 270.40 | 225,600.76 | 47,884.77 | 44,796.91 |
| Pesticide | 3.10 | 5324.17 | 717.62 | 797.04 |
| Mechanical power | 3895.33 | 1,544,854.06 | 274,402.51 | 253,978.65 |
| Practitioners | 1984.39 | 437,210.87 | 117,964.33 | 85,620.93 |
| The proportion of primary industry in GDP | 0.11 | 50.64 | 17.52 | 10.68 |
| Urbanization level | 12.41 | 99.83 | 48.94 | 22.22 |
| Rice minimum purchase price | 61.94 | 97.03 | 82.72 | 12.24 |
| Financial agriculture, forestry and water expenditure | 1.86 | 813.84 | 144.72 | 130.82 |
| Rice cropping index | 0.27 | 2.00 | 1.35 | 0.39 |
Table 3.
The Pearson correlation coefficient of the mean value of rice production input and output variables.
Table 3.
The Pearson correlation coefficient of the mean value of rice production input and output variables.
| Input | Planting Area | Irrigation Area | Fertilizer | Pesticide | Mechanical Power | Practitioners | |
|---|---|---|---|---|---|---|---|
| Output | |||||||
| Rice yield | 0.994 *** | 0.946 *** | 0.919 *** | 0.749 *** | 0.886 *** | 0.837 *** | |
Note: *** indicates a significant correlation at the 0.01 level (bilateral).
Table 4.
Global detection results of influencing factors of spatiotemporal variation of rice production efficiency.
Table 4.
Global detection results of influencing factors of spatiotemporal variation of rice production efficiency.
| Detection Factors | 2006 | 2010 | 2014 | 2018 | ||||
|---|---|---|---|---|---|---|---|---|
| q | p | q | p | q | p | q | p | |
| The proportion of secondary industry in GDP | 0.1275 | 0.0170 | 0.0783 | 0.1170 | 0.0657 | 0.2635 | 0.0844 | 0.3651 |
| Per capita disposable income of farmers | 0.2880 | 0.0000 | 0.1990 | 0.1483 | 0.0821 | 0.0746 | 0.0305 | 0.7841 |
| Government expenditure on agriculture, forestry and water resources | 0.1363 | 0.9326 | 0.2697 | 0.8478 | 0.3004 | 0.0000 | 0.3462 | 0.0000 |
| Rice multiple cropping index | 0.1815 | 0.0026 | 0.1804 | 0.0000 | 0.2965 | 0.0000 | 0.1490 | 0.0318 |
Table 5.
Local detection results of influencing factors on spatiotemporal differentiation of rice productivity.
Table 5.
Local detection results of influencing factors on spatiotemporal differentiation of rice productivity.
| Detection Factors | Dongting Lake | Southern Hunan | Xiang-Xi | Chang-Zhu-Tan | ||||
|---|---|---|---|---|---|---|---|---|
| q | p | q | p | q | p | q | p | |
| The proportion of secondary industry in GDP | 0.1032 | 0.0176 | 0.2879 | 0.0000 | 0.0534 | 0.0064 | 0.0336 | 0.5096 |
| Per capita disposable income of farmers | 0.2212 | 0.0000 | 0.6547 | 0.0000 | 0.4587 | 0.0000 | 0.4545 | 0.0000 |
| Government expenditure on agriculture, forestry and water resources | 0.1691 | 0.0000 | 0.3067 | 0.0000 | 0.1431 | 0.0000 | 0.2758 | 0.0000 |
| Rice multiple cropping index | 0.2371 | 0.0256 | 0.3564 | 0.0000 | 0.1284 | 0.0072 | 0.3614 | 0.0000 |
Disclaimer/Publisher’s Note: The statements, opinions and data contained in all publications are solely those of the individual author(s) and contributor(s) and not of MDPI and/or the editor(s). MDPI and/or the editor(s) disclaim responsibility for any injury to people or property resulting from any ideas, methods, instructions or products referred to in the content. |
© 2023 by the authors. Licensee MDPI, Basel, Switzerland. This article is an open access article distributed under the terms and conditions of the Creative Commons Attribution (CC BY) license (https://creativecommons.org/licenses/by/4.0/).
Share and Cite
MDPI and ACS Style
Zeng, X.; Li, Z.; Zeng, F.; Caputo, F.; Chin, T. Spatiotemporal Evolution and Antecedents of Rice Production Efficiency: From a Geospatial Approach. Systems 2023, 11, 131. https://doi.org/10.3390/systems11030131
AMA Style
Zeng X, Li Z, Zeng F, Caputo F, Chin T. Spatiotemporal Evolution and Antecedents of Rice Production Efficiency: From a Geospatial Approach. Systems. 2023; 11(3):131. https://doi.org/10.3390/systems11030131
Chicago/Turabian StyleZeng, Xiongwang, Zhisheng Li, Fusheng Zeng, Francesco Caputo, and Tachia Chin. 2023. "Spatiotemporal Evolution and Antecedents of Rice Production Efficiency: From a Geospatial Approach" Systems 11, no. 3: 131. https://doi.org/10.3390/systems11030131
Note that from the first issue of 2016, this journal uses article numbers instead of page numbers. See further details here.