
Simulated Global Empty Containers Repositioning Using Agent-Based Modelling
1
Arab Academy for Science, Technology and Maritime Transport, College of International Transport and Logistics, Alexandria 1029, Egypt
2
Faculty of Logistics, University of Maribor, 3000 Celje, Slovenia
*
Author to whom correspondence should be addressed.
Systems 2023, 11(3), 130; https://doi.org/10.3390/systems11030130
Submission received: 14 December 2022
/
Revised: 10 February 2023
/
Accepted: 13 February 2023
/
Published: 1 March 2023
(This article belongs to the Section Systems Design)
Abstract
:Due to an ever-increasing movement of containers across the globe in line with the economic boom, the trade imbalance and issues related to empty containers have become inevitable. Empty containers accumulated at specific ports cannot only generate profit but also increase the environmental footprint. This research proposes a Maritime Empty Container Reposition Modelling Framework by integrating the agent-based modelling (ABM) paradigm to model the global movements of empty containers. An agent-based maritime logistic empty container redistribution model was developed to help minimize the total relevant costs for empty container movement in the planning horizon. In the system, ports, shipping companies, customers, and empty containers were identified as critical agents. Using simulated annealing (SA), shipping line agents were able to optimise empty container repositioning to determine the best sequence for moving containers. The model was applied to the Asia–Middle East region to simulate global empty containers repositioning in the region. The results comparison shows that the proposed optimised empty container repositioning framework can significantly reduce the shipping line’s costs and make full use of empty containers.
1. Introduction
The maritime industry faces increasingly turbulent, rapidly changing, and uncertain situations due to the instability of global trade. One of the main driving forces for change has been the adoption of the container since the late 1960s [1]. Over the years, maritime supply chains have become more complex due to globalization and expansion into new markets [2]. The evolutions in transport chains and the high competitiveness among stakeholders create pressures on cost management, which push ports and shipping lines to rethink their objectives in logistics processes. They have a high importance for the overall success of the maritime transport chain, aiming to reduce the total cost and achieve more profit [3,4,5,6,7]. In recent years, the shipping sector has suffered from considerable inefficiencies in container distribution, which is majorly influenced by trade imbalances, long relocation times, and unreliable commercial forecasts [8,9]. The continuous trade imbalance in the shipping sector and the negative consequences put additional pressure on all maritime stakeholders to make tough decisions regarding repositioning empty containers [10]. Meanwhile, the numerous operations that encounter significant changes over time as a result of the interdependency of global logistics activities makes it more distressing than ever before.
The effective movement of empty containers is a critical component of all container logistics chains. Hence, shipping lines face many more challenges in managing the empty container task, leading to delays, additional handling, and rising costs of thousands of dollars. Money is lost primarily through inefficiencies in moving and storing containers and losing the opportunities to serve more customers in various markets. In 1998, CMA-CGM spent USD 145 million on the container logistic management of 250,000 TEUs, including empty container repositioning [11]. The main reason for the loss was a lack of coordination between the intra-regional and inter-regional levels. Another complicated issue concerns the repositioning coordinators of the shipping line, who spent several days finding a solution by hand. Repositioning plans are created through a trial-and-error process that relies on the team’s expertise and experience. Significant savings can be expected if container usage is optimised, as the repositioning process can be considered a problem and a strategy simultaneously [12]. Therefore, it is imperative to develop an empty container repositioning plan to avoid increased costs and suboptimal usage [13].
Currently, managing empty containers has become crucial to maximizing profits, utilization, and customer satisfaction [14]. Through the application of various models, researchers investigated whether optimisation or simulation heuristics could improve allocation performance [15]. The movement of containers and the optimisation of shipping routes between seaports has been extensively studied in the literature [5,16,17,18,19,20,21]. Both approaches have received a lot of interest in economics and operations research literature. Nevertheless, the combination of optimisation and simulation has received little attention, although it may provide a good method of assessing the suitability of different repositioning policies for empty containers. As pointed out in the Preferred Reporting Items for Systematic reviews and Meta-Analyses (PRISMA) [22], a remarkable research gap exists due to a limited number of authors discussing this approach, especially with integrating the ABM dynamic simulation approach and advanced optimisation algorithms. Meanwhile, there have been many scholarly papers published on the problem of repositioning empty containers [13,22,23], but the literature lacks realistic data in great detail for shipping lines.
Targeted to fill the literature gap, this study proposes a Maritime Empty Container Reposition Modelling Framework by integrating the ABM paradigm to model the global movements of empty containers. An agent-based maritime logistic empty container redistribution model was developed. The study then implements the proposed framework for maritime shipping routes between ports in the Middle East and Asia for the CMA-CGM shipping line. This company has been selected as it is one of the top shipping lines worldwide, which can be a potential player in model preparation and evaluation. The proposed model aims to minimize the total cost, increase profit, and achieve high container utilization. The numerical results will be used to validate the robustness and effectiveness of the developed framework and simulation model. Due to this, the usability of the model depends on the analysis of real liner cases together with different scenarios, especially in light of the responses from maritime professionals. The next section illustrates the concepts, existing studies, and hypothesis of this study.
2. Literature Review
Global maritime container repositioning is a complex system. It includes a high number of actors, each with their own behaviours. The global empty container repositioning process starts from the container arrival, handling operations, transport, and allocation of empties until the release of the empty containers to customers. The actors interact with each other, which leads to an increase in the repositioning’s complexity [24]. The interactions among the actors shape the general behaviours of the shipping companies. Due to a high number of repetitive operations, a single change to a parameter value, which causes a small change on an individual basis, might result in a massive shift in the shipping line’s decision [25].
ABM is one of the most popular modelling and simulation tools for analysing systems with emergent system properties that cannot be deduced by a large number of interactive agents and aggregation methods [26,27,28,29]. Additionally, it has been used to test the acting and interacting of collective or individual autonomous agents [30,31]. In line with a systems approach, ABM is responsible for studying the individual actions of agents and their influence on the entire system. Furthermore, the researchers place the rules and parameters for each agents to interact; they can modify specific rules to test for agents’ behaviour differences [32]. Recently, many industries used ABM for testing a myriad of situations regarding their businesses. It is a highly effective approach to studying contingent behaviours and the interaction of macro- and micro-level effects. In particular, ABM can be used to examine how dynamics and social norms that are evident at a large scale result from multiple processes occurring at the micro-level [32].
In the field of supply chain and transportation, ABM has been identified as one of the most efficient approaches to developing certain decision-making processes [33]. This technique can provide added value to the digitalization of the container supply chain as it can assist the stakeholders in minimizing costs and increasing their profits [34]. To the best of our knowledge, there are a limited number of methodologies that have applied the ABM tool to solve the problem of empty container movements [35,36]. Therefore, this research proposed ABM to overcome the lack of using this methodology in the previous literature. The effectiveness of the model is tested through a case study in the maritime sector. In particular, a shipping line had been chosen as it is becoming a crucial entity in the maritime economy due to the continuous growth in the volume of goods exchanged around world.
For developing an optimisation-simulation model, ABM can be considered as a suitable approach for global maritime logistics issues [33,37,38]. Since the shipping system is a complex logistics network, it is appropriate to address the problem of empty container repositioning using ABM. With the capabilities of representing a system naturally and flexibly, ABM is one of the promising alternatives for global maritime logistics issues [37]. It has a dynamic character and includes a significant number of entities, where each entity is trying to maximize its profit. Additionally, it enables the design of actors to resemble the real system without imposing unnecessary limitations on the actors’ interactions [38].
By using this approach for the empty container problem, various combinations of designs can be experimented with in a relatively short period, at a lower cost, and with less risk. It has the ability to modify the design plan to produce desired outputs, rather than making new design plans on the actual system without verifying its outputs [39,40]. Hence, this research makes a reasonable attempt to find the optimal solution by using the ABM approach to simulate the dynamics of a global empty container repositioning system. Then, an optimisation method, simulated annealing, will be used to optimise the repositioning strategy as the instances of the problem are too large [25]. To achieve the objectives, the study formulated the following hypotheses:
H1:
The extra costs and environmental footprints of empty containers can be reduced by an optimised repositioning strategy.
H2:
Empty container turnover rates can be affected by selecting an appropriate repositioning strategy.
H3:
Container utilization rates can be potentially improved through applying an appropriate repositioning strategy.
This paper will contribute to our understanding of current repositioning strategies for managing empty containers by proving/rejecting the above-mentioned hypotheses. It would also help to clarify all the difficulties associated with implementing repositioning activities by demonstrating how shipping lines can improve their performance. The following section illustrates the proposed empty container repositioning framework by integrating the ABM paradigm.
3. Methodology
3.1. Model Framework
As illustrated in Figure 1, the empty container repositioning process begins when full containers are delivered to surplus ports. The customer unloads the cargo and returns it to be stored in empty depots in anticipation of future demand. When empty containers are returned, usually a quick visual inspection takes place. Depending on the state of the container, it is then sent for repair or maintenance, or might simply require a cleaning operation at the depot before releasing it to another customer. When a new customer in a deficit area requests empty containers from the shipping line, the shipping line checks its empty stock with surplus depots and orders the requested number of empty containers. Customers can order any number of containers, and the shipping line will provide them by availability. The total number of requested containers can be moved from the surplus terminal to a deficit area on one vessel or more than one according to vessel capacity, as the priority is for laden containers. After the arrival of empties, the shipping line releases the containers to the customers based on their bookings, moving them to their premises by trucks or any inland transportation method. At the same time, the customer pays the agreed freight to the shipping line. Despite the length of this cycle, including its risks and costs, shipping lines can gain more revenue from this process instead of paying storage costs for empties while waiting for an order in the surplus area. Indeed, shipping lines often consider empty container movements as a necessary evil.
3.2. Agent Attributes and Actions
In order to define the entities or agents involved and influence the system objectives, it is necessary to understand the general description of the processing system. Determining the attributes that exist in each agent should be considered as each agent has a variety of attributes. As shown in Figure 2, this research deals with the shipping industry simulation of container transportation management where shipping lines, ports, customers and empty terminals are the four leading players in the shipping repositioning cycle who interact to utilize empty containers’ movement [13]. In addition to the containers, which are considered the main asset in the model for moving/loading/discharging cargo, the vessels represent the transportation method responsible for moving and distributing the container from point to point. The key to understanding the whole problem is to realise the interaction between the stakeholders of the system [26].
- Shipping line: It harnesses its resources to meet customer demands for empty containers during the demand-planning phase. The main aim of its repositioning process is to reduce the presence of empty containers by sending them from the surplus port to a deficit port according to the customer needs, distance, and cost to make better profits.
- Ports: The connected chain between other players for loading, discharging, and handling the cargo. Ports are the starting and ending points of the container movements. The container returns to this point after completing its current mission to take on a new task. The port’s performance is effected by the number of port berths, the number of labourers, and the number of arrival/departure containers and vessels.
- Customers: Normally, the request for empty containers is sent to the shipping line by customers weeks prior. Customer demands are received, including the start date, origin, and destination, to carry out the request correctly according to availability.
- Empty terminals: They are owned by a shipping line or working based on a contract to store the empties. It can be located within a container terminal with the overall port facility or in the hinterland as an inland container depot. These terminals are secure facilities that provide basic essential services for container shipping companies and solve the problem of bottlenecks and storage issues. The attributes of all agents are listed in Table 1:
Consider a shipping service system composed of a shipping line . It plays an essential role in exchanging the throughput data between stakeholders and taking the repositioning decision. The shipping line network has a fleet of vessels, a fleet of containers , and a set of ports, whether these ports are deficit ports or surplus ports . Shipping companies receive a demand for empty containers from a considerable number of customers . They are trying to intake most of these demands . Hence, the logistics team of the shipping line checked the available number of empty containers at the port and the total supply of empty containers which arrived . The shipping line’s profit can be generated from the received freight per empty container that the customer will pay instead of paying storage costs in the port . The objective function of this model is to minimise the total repositioning cost, which includes three types of costs: handling , storage , and transportation . Consequently, the objective function can be described as follow:
Objective Function:
Constraints
where is the number of shipping lines (i = 1 indicates shipping line company 1); is the number of ports (k = 1 indicates port 1); is the number of customers (j = 1 indicates customer 1), and is the number of containers (l = 1 indicates container 1).
3.3. Optimisation: Simulated Annealing (SA)
The study uses the simulated annealing (SA) method for shipping line agents to optimise the empty container scheduling and maximize the total profit. SA is a stochastic global search optimisation algorithm [41,42] as it uses randomness as part of the search process. Most local search algorithms do not operate well for nonlinear objective functions while SA is an appropriate algorithm for such functions. Like the stochastic hill climbing local search algorithm, it has the ability to modify a single solution and find the relatively local area in the search space until the local optima are located. Unlike the hill climbing algorithm, it accepts the worse solutions as the current solution, then the likelihood of accepting the worse solutions starts at a high level at the beginning of the search, decreasing while the search progress. It allows the algorithm to first locate the region for the global optima, escape the local optima, and then hill climb to the optima itself [41].
Figure 3 illustrates the process of SA optimisation. The cycle starts when the customer requests empty containers from the shipping line to load cargo and move from the port to . Based on customers’ demand , the shipping line orders empty containers from a surplus terminal to a deficit area . Customers can order any number of containers , and the shipping line will provide them by availability . The tentative number of containers to each port is determined by the possible profit generated. The model starts with a random number of , which has a high shipping cost and low profit. Then the SA reallocates the containers among all the clients to gradually reduce the total cost and increase the total profit. After multiple runs, the best solutions are found, and the is confirmed. After this, the shipping line will send the confirmed empty containers to each port. Once the containers arrive, the clients will pay the rental fee .
4. Model Implementation and Data Inputs
4.1. Model Implementation
The management of such a complex problem subsequently requires new modelling methods; an efficient simulation tool should be used to clarify the concept in a clear visual way. The proposed Maritime Empty Container Reposition Modelling Framework was implemented using the ‘Netlogo 6.2.2’ simulation platform. Netlogo is the most well-known agent-based programming platform developed by Wilensky in 1999 for simulating natural and social phenomena [43]. It is particularly well suited for modelling complex systems and analysing the connection between the behaviour of basic entities and the macro-level patterns that emerge from their interactions [44]. The Geographic Information System (GIS) extension in Netlogo facilitates geospatial data processing, which allows simulating the global maritime routes and container vessel movements dynamically. The model uses GIS shapefile and CSV as the input to generate the port, shipping line, client, and container agents.
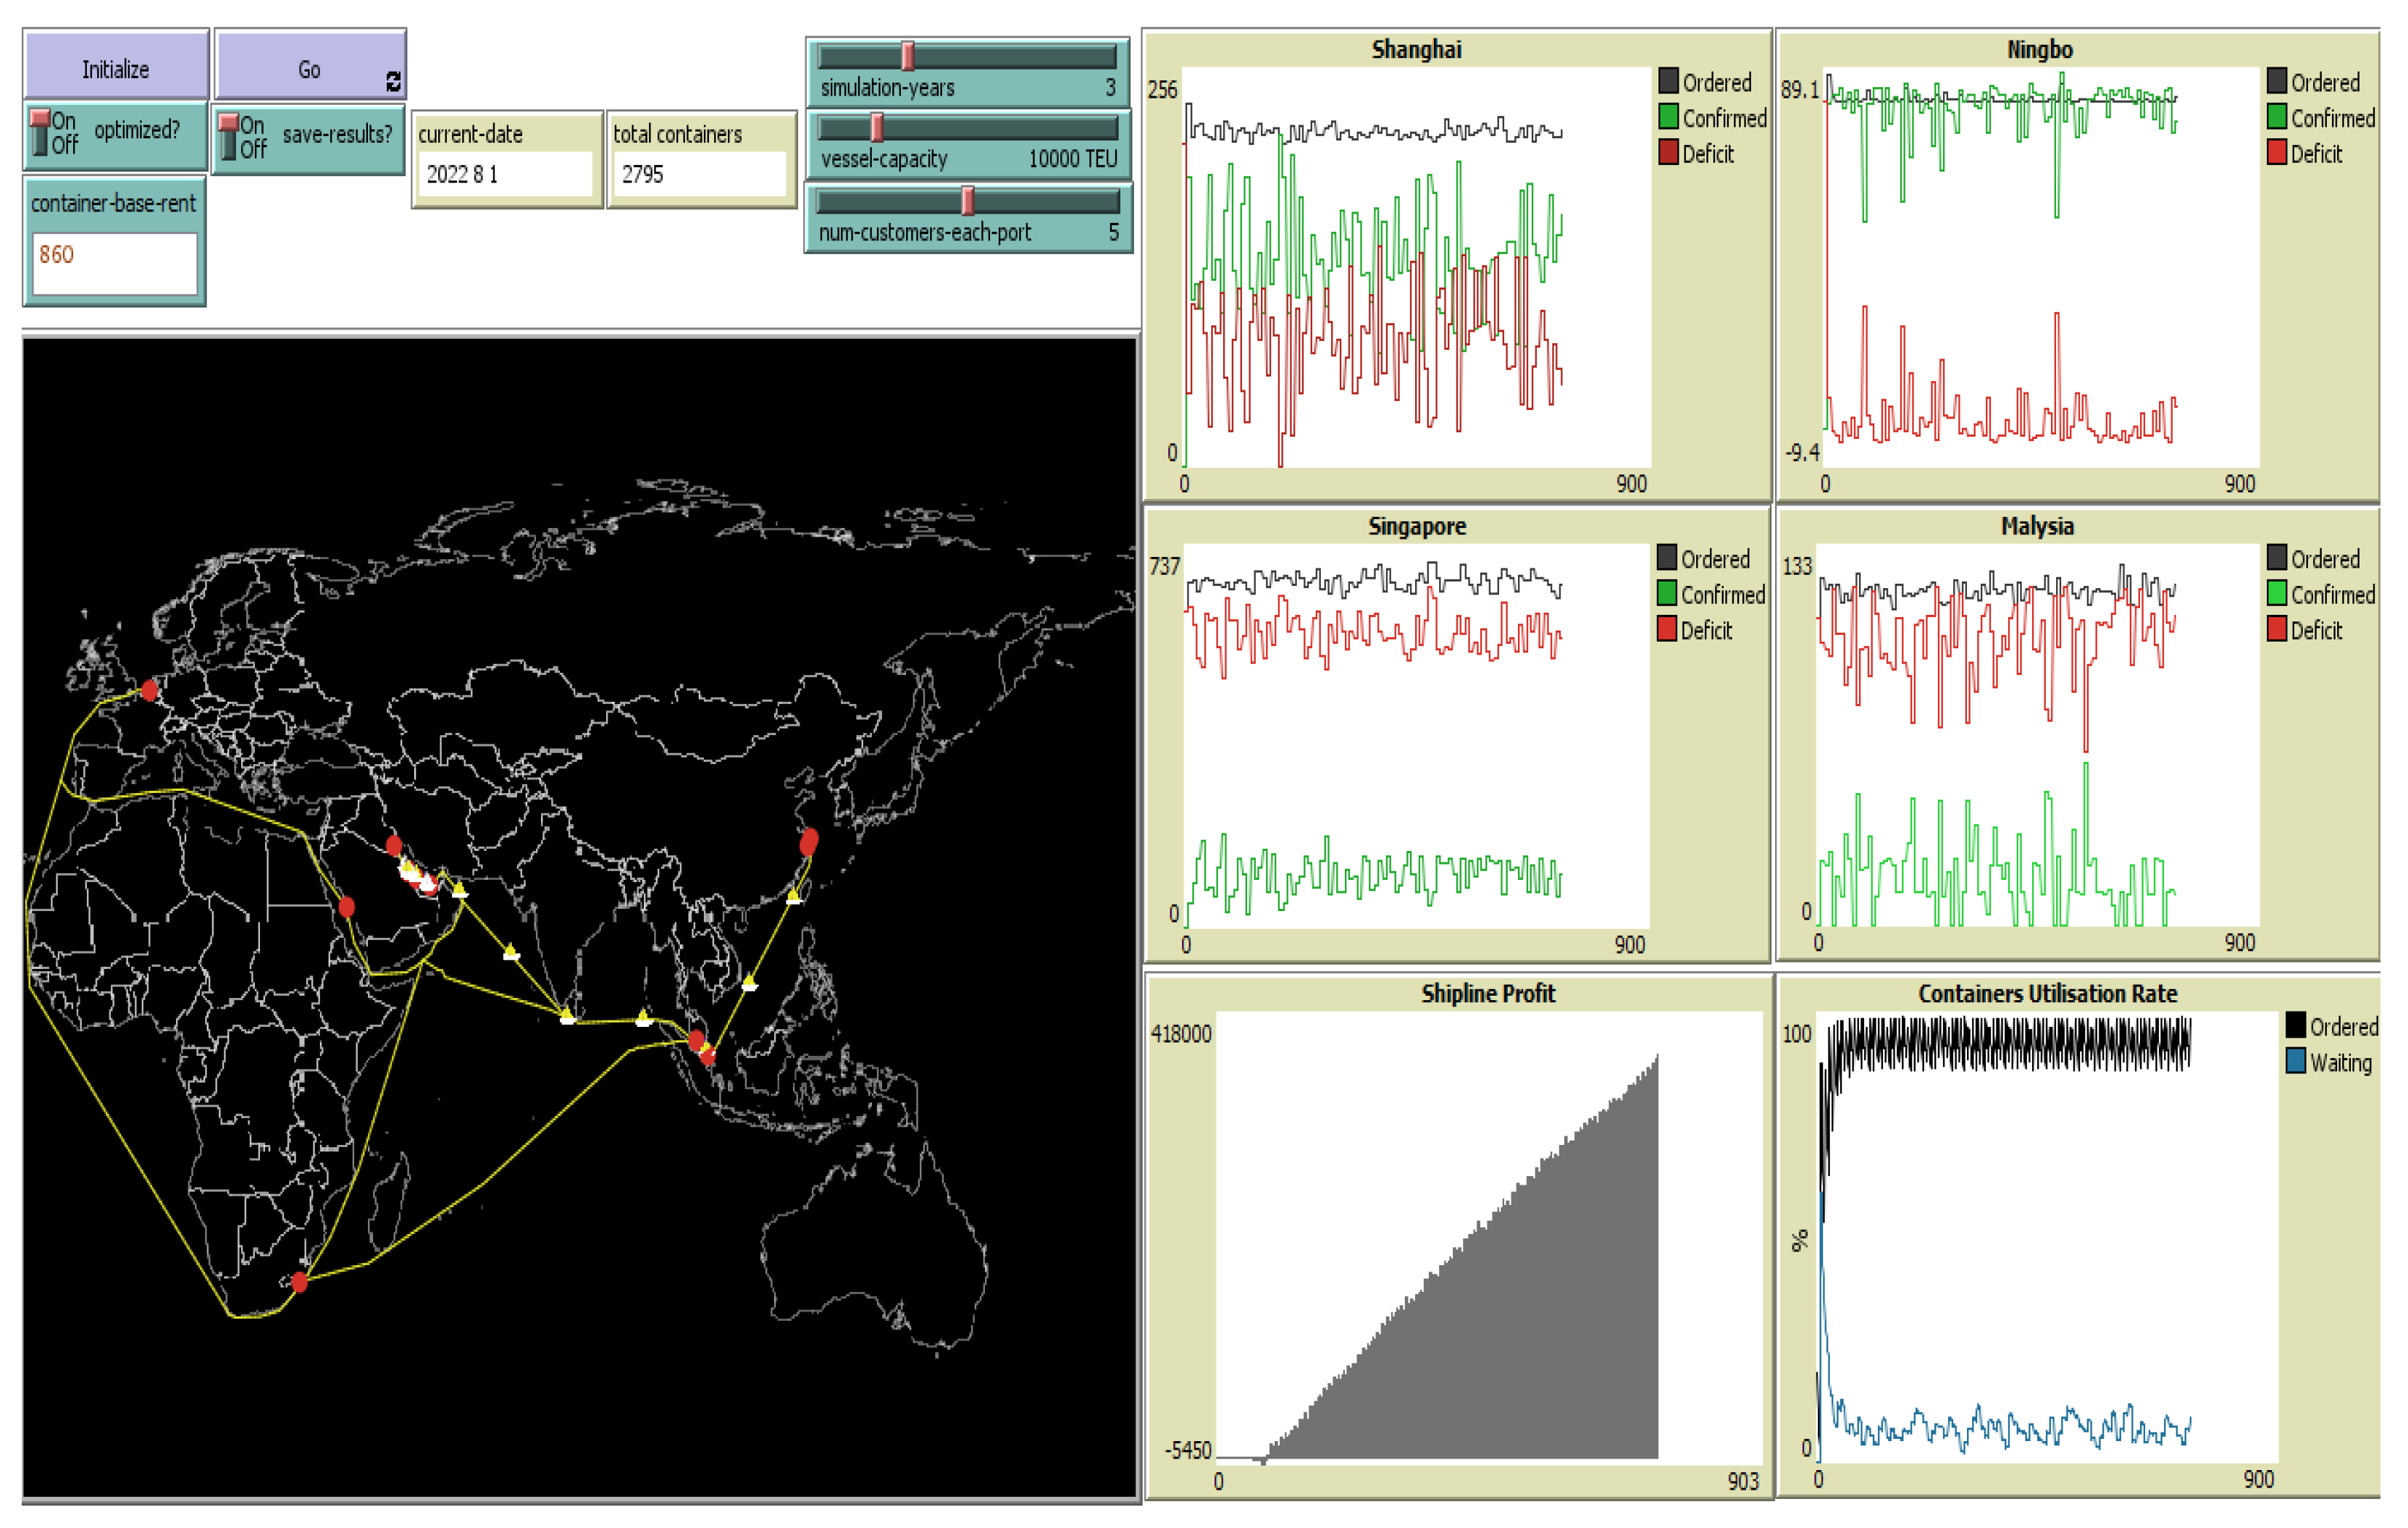
Figure 4 shows the interface of the build model; the yellow lines represent the maritime routes. Red dots represent the ports. The white ship represents vessels. When the model begins, loaded containers continue moving to destination ports, then they disappear after arriving at their destination and are excluded from the simulation. At the same time, the empty containers begin to move from the surplus ports to deficit ports through shipping routes in an attempt to balance the container movement and reduce the duration of the container remaining empty. The model uses four plots monitoring the port empty container order, order confirmation, and container deficit. The “shipping line profit” plot monitors the profits generated, and the “containers utility ratio” plot monitors the empty container utility rate. Additionally, several sliders/switches are added to adjust the actions taken by the agents, whether at the start-up process or during run-time.
4.2. Scope of Model Implementation
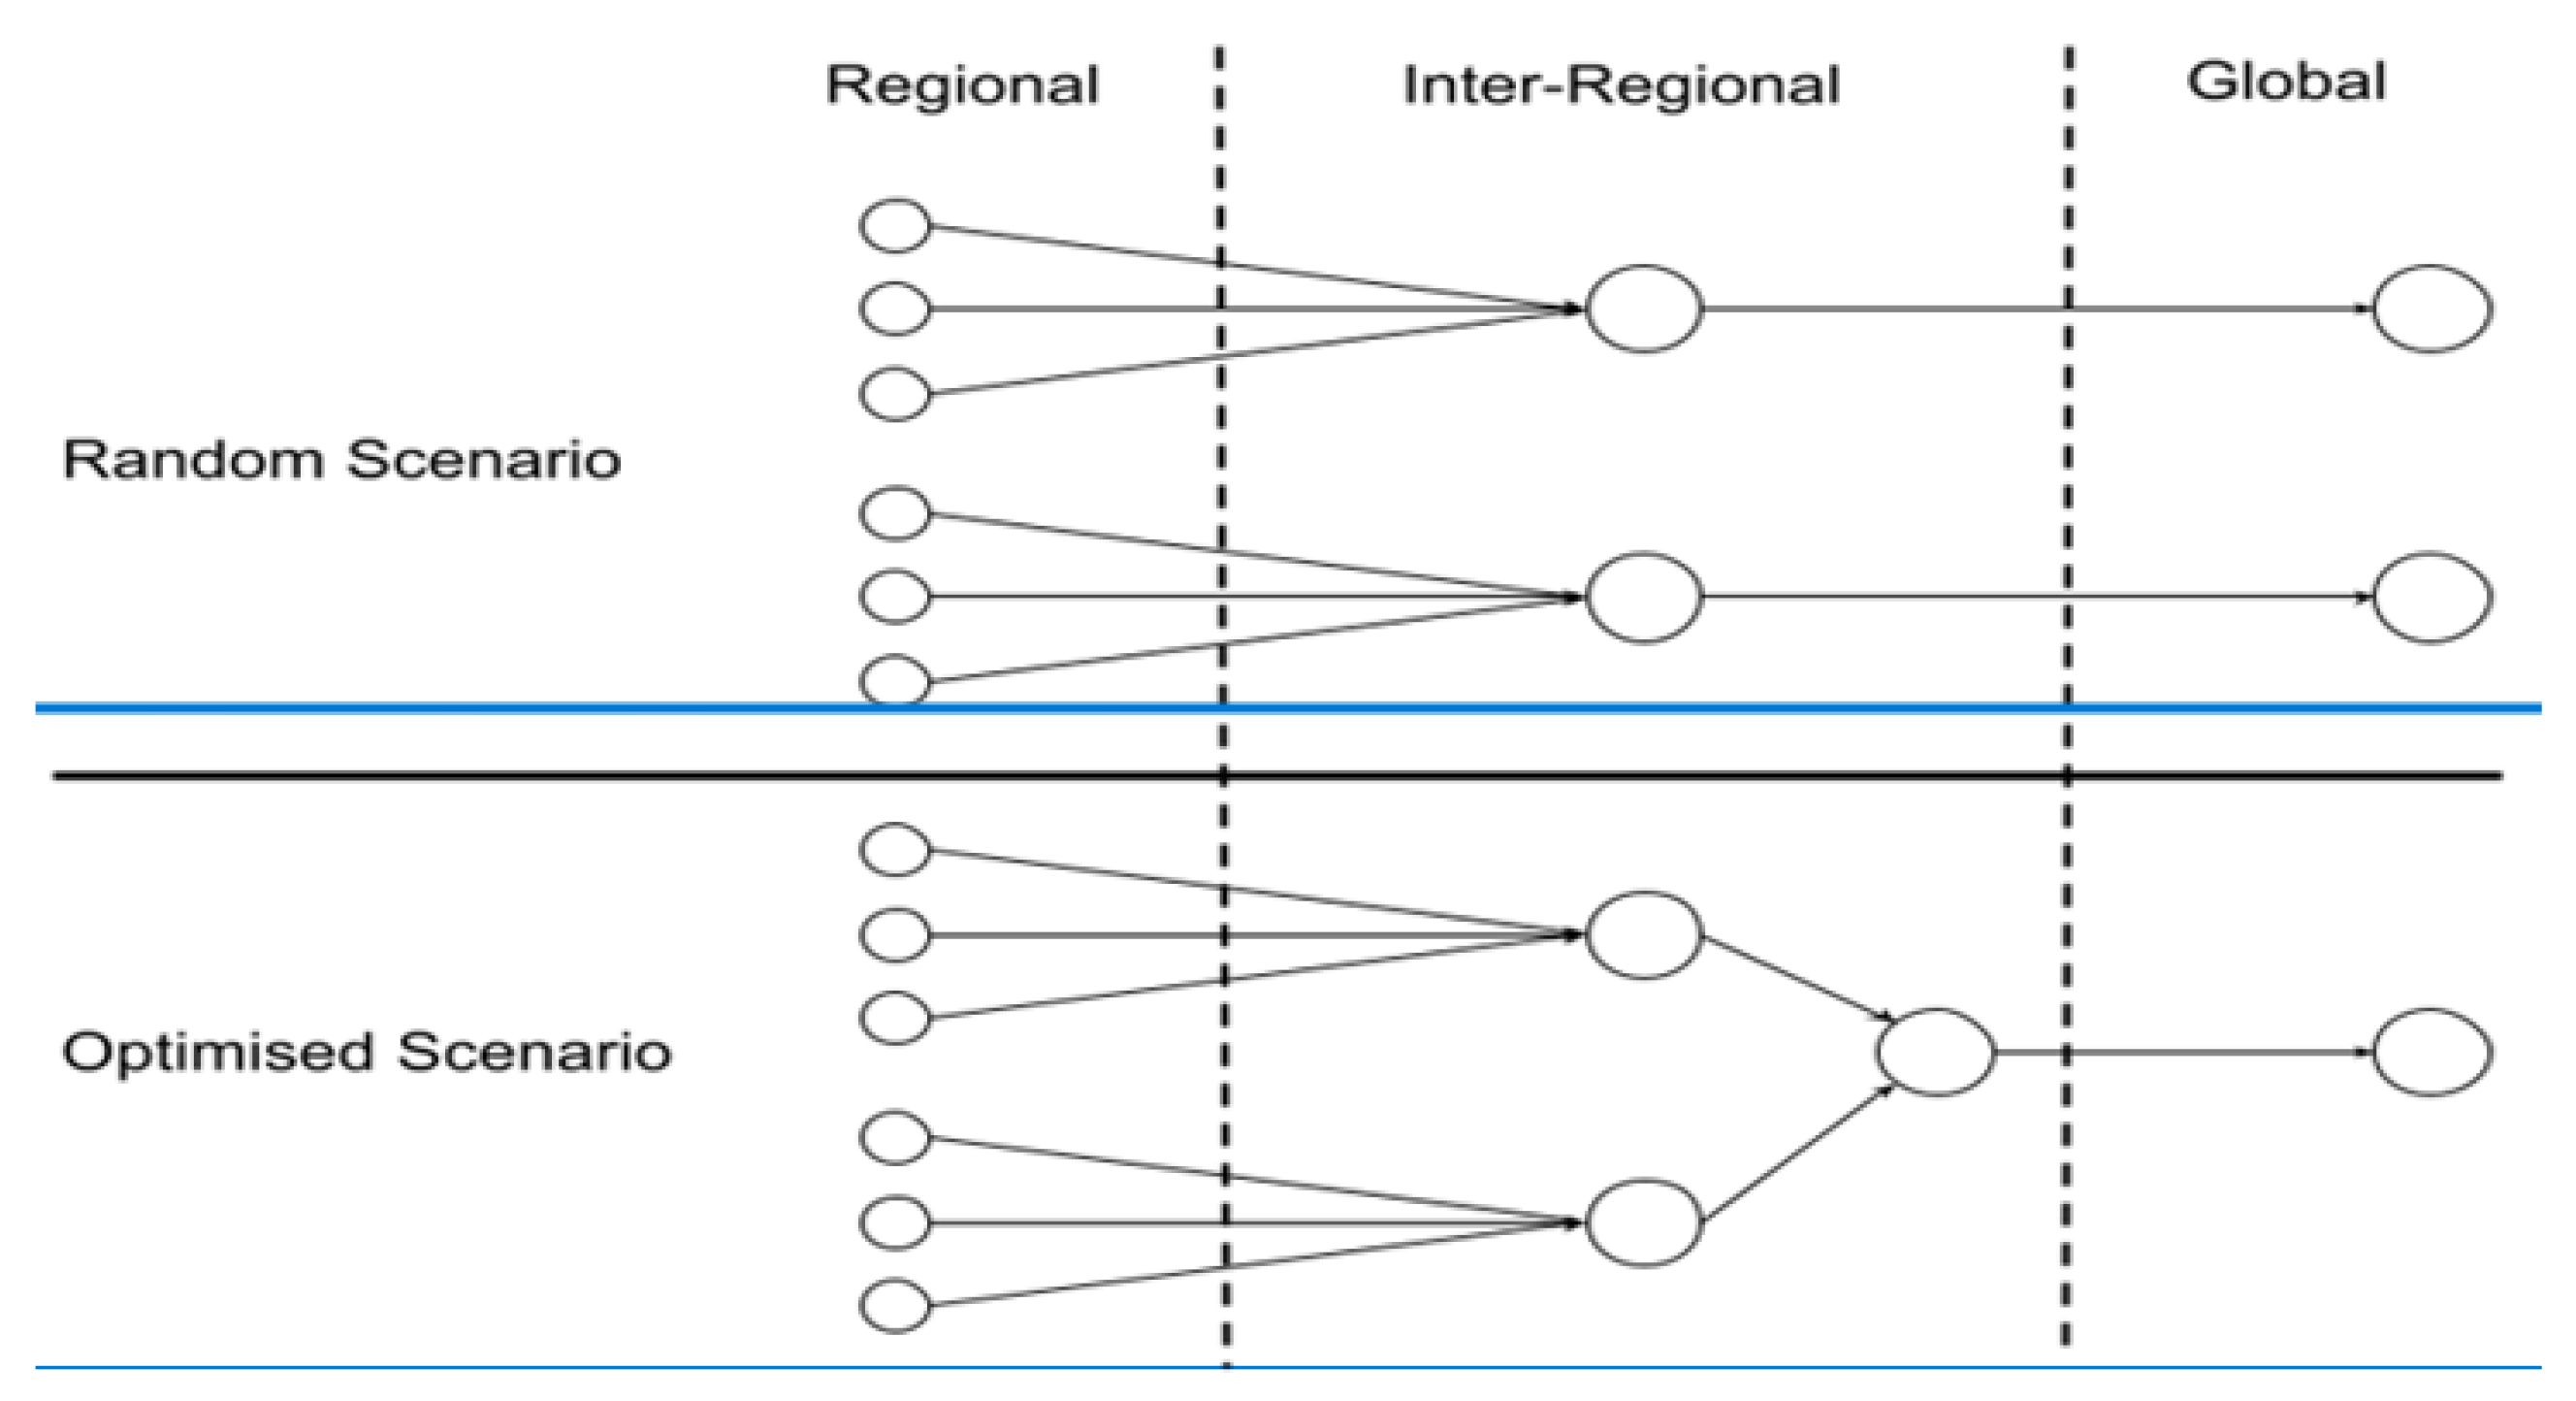
- The process of global repositioning involves the mitigation of trans-oceanic trade imbalances by shifting them from surplus to deficit regions by using ports as gateways.
- Interregional repositioning involves the movement of containers across expansive areas by means of intermodal rail or short-sea shipping. They concern connections between inland terminals and ports.
- The concept of regional repositioning is primarily concerned with drayage operations between intermodal terminals, empty container depots, and major freight distribution clusters, often within the same metropolitan area.
Because of the complex nature (possible multi-mode shipments) of regional repositioning processes, this study focuses on inter-regional to global empty container repositioning. At the inter-regional level, ports consolidate inland empty containers. The ports can send the empty containers to deficit ports based on a random order or further consolidate them and send them to deficit ports in an optimised manner to maximise profits. This study is going to investigate the competitiveness of an optimised strategy by comparing it with a random one.
4.3. Data Inputs
To simplify the simulation, the study uses ten different ports in various countries showing their shipping routes that bound each of these ports: Shanghai, Singapore, Port Klang, and Ningbo as the deficit ports; Jeddah, Umm Qasr, BHKBS, QAHMD, and Jebel Ali as the surplus ports (Table 2). The Dammam port is treated as the hub where the shipping line company locates. The Dammam port gets empty containers from the nearby surplus ports and then distributes them to the deficit ports by scheduling. Un-ordered containers will be stored at the Dammam port, and a storage fee will be charged. In the simulation, the capacity of each container vessel was set as 20,000 TEUs and the number of customers at each port (num-customer-each-port) was set as 5. That means each port has five cargo shipping companies ordering empty containers from the shipping company located in SADAM. The simulation period was set as 365 days starting from 1 August 2020. The ordered containers leave the Dammam port heading to the deficit ports following the defined routes (Samarakoon, M., Personal Interview, 11 October 2021).
Table 3 lists the demand, supply, and associated costs in dollars between different ports. During the simulation, the customers from deficit ports will put empty container requests at a defined frequency. The surplus ports will send their surplus empty containers to Dammam at the defined frequency. The model saves the proportion of allocated empty containers to a CSV.
5. Simulation Results
In this study, a sensitivity analysis has been conducted to assess the potential significance of the results. Since the shipping industry is a large-scale industry, the significance of decreasing empty container movements is of importance. Explicitly, it was estimated for the whole container shipping industry through computing the resulting difference in both strategies. In order to test the effectiveness of the proposed model, the study creates an “optimize?” button to help in comparing the results between the optimised and random repositioning strategies. The optimised strategy uses the SA method to allocate empty containers to customers for each region considering the possible profit, demand, and distance. While the random repositioning strategy allocates empty containers to customers randomly, using the first-come-first-serve approach will distribute empty containers to clients unorderly.
Figure 6 shows the ordered containers (CO), confirmed orders (CC), and deficit (CS) for each port using the random repositioning strategy. The results show that each port was confirmed with around 30% to 50% of its ordered empty containers on average. All four ports maintain high levels of empty container deficits.
Figure 7 shows the results of applying the optimised strategy. The Shanghai and Ningbo ports have higher empty order confirmations than Singapore and Malaysia. Nearly all the orders from the Ningbo port were fulfilled, while the order confirmation of the Shanghai port was above the deficit level. Conversely, the Singapore and Malaysia ports had significantly low empty container ordering confirmation rates.
The simulation results shows that the Singapore port had the highest empty container orders and the Shanghai port followed. However, Singapore’s confirmed empty container order rates were significantly lower in the optimised scenario than in the random scenario and other ports. Meanwhile, the travel distance from SADAM to Singapore is way shorter than Shanghai and Ningbo. The loading costs of all ports are the same, and the sea freight cost to SGSIN and MYPKG is USD 20 cheaper than to CNNGB and CNSHA (Table 3). However, the discharge costs, LOLO costs, inland costs, scanning costs, and customs costs in CNSHA and CNNGB are way lower than SGSIN and MYPKG. When customers pay the same rental fee for container usage, sending empty containers to CNSHA and CNNGB will achieve much higher profits than SGSIN and MYPKG.
In reality, SGSIN and MYPKG have fewer chances of empty container shortage than other ports taking advantage of the central location in the global maritime logistic network. These ports could get empty containers easily from other ports. CNSHA and CNNGB could face a higher chance of empty container shortage, considering the geographical location and high cargo volume. Therefore, repositioning empty containers using optimisation methods can reduce the empty container shortage for these two ports and other similar ports.
The importance of the hypotheses in this research is obvious as they are related to the future scenarios of container movements. Hence the three postulated hypotheses which were outlined in the first phase of the study have been tested to see if they should be accepted or rejected.
5.1. Shipping Line Profit
This hypothesis can trace the effect of applying an optimised strategy on the repositioning cost. It is related to the main objective of the paper, enabling the shipping lines to gain more revenue and achieve significant improvement in terms of costs, which is the key success factor for any company. By comparing the random and optimised repositioning scenarios in Figure 8, the results show that the random scenario’s profit level briefly climbed to positive before turning to negative in the rest period. Additionally, the overall profits of the optimised scenario increased continuously during the simulated period. These results provide a clear implication that the optimised repositioning strategy positively impacted the associated costs and, consequently, the company’s profit. It indicates the necessity of having a model to support the decision to move empty containers. Furthermore, H1 is supported by the above-outlined cognitions, and the findings are elaborated throughout the thesis.
5.2. Empty Container Turnover
This hypothesis is designed to measure the number of days that have passed since the empty container was ordered until it reached the final destination. Contrary to the basic principle of the container turnover rate that was referred to by [14], the increase in the turnover rate of empty containers is not considered a positive result as they are idle in the depots. By comparing the empty container turnover days under the optimised and random repositioning scenarios, the results showed that the average turnover days under a random scenario was around 20 days, while it turned to 25 days under the optimised scenario. Figure 9 shows that the number of turnover days in the optimised strategy is five days greater than that of the random strategy due to the careful selection of ports in terms of distance, demand, and profit in the optimised strategy. The model findings confirm that the random strategy sends the empty containers to the nearest/the first demanding port without considering the revenue consequences. The shipping line in this strategy seeks to operate the container as frequently as possible, even if the freight value is low. In comparison, the empty containers are distributed in an optimised strategy according to effective planning in advance, guaranteeing the certainty of immediate use and obtaining a high freight rate. Therefore, the long distance to the selected shortage port or the lack of frequent ships to these ports can be the primary reasons for increasing the turnover days in the optimised strategy. The average turnover days for empty containers in both strategies are not significantly different, but the intrinsic value is the freight rate. These cognitions and the findings are elaborated throughout the research, supporting the second hypothesis.
5.3. Empty Container Usage Rate
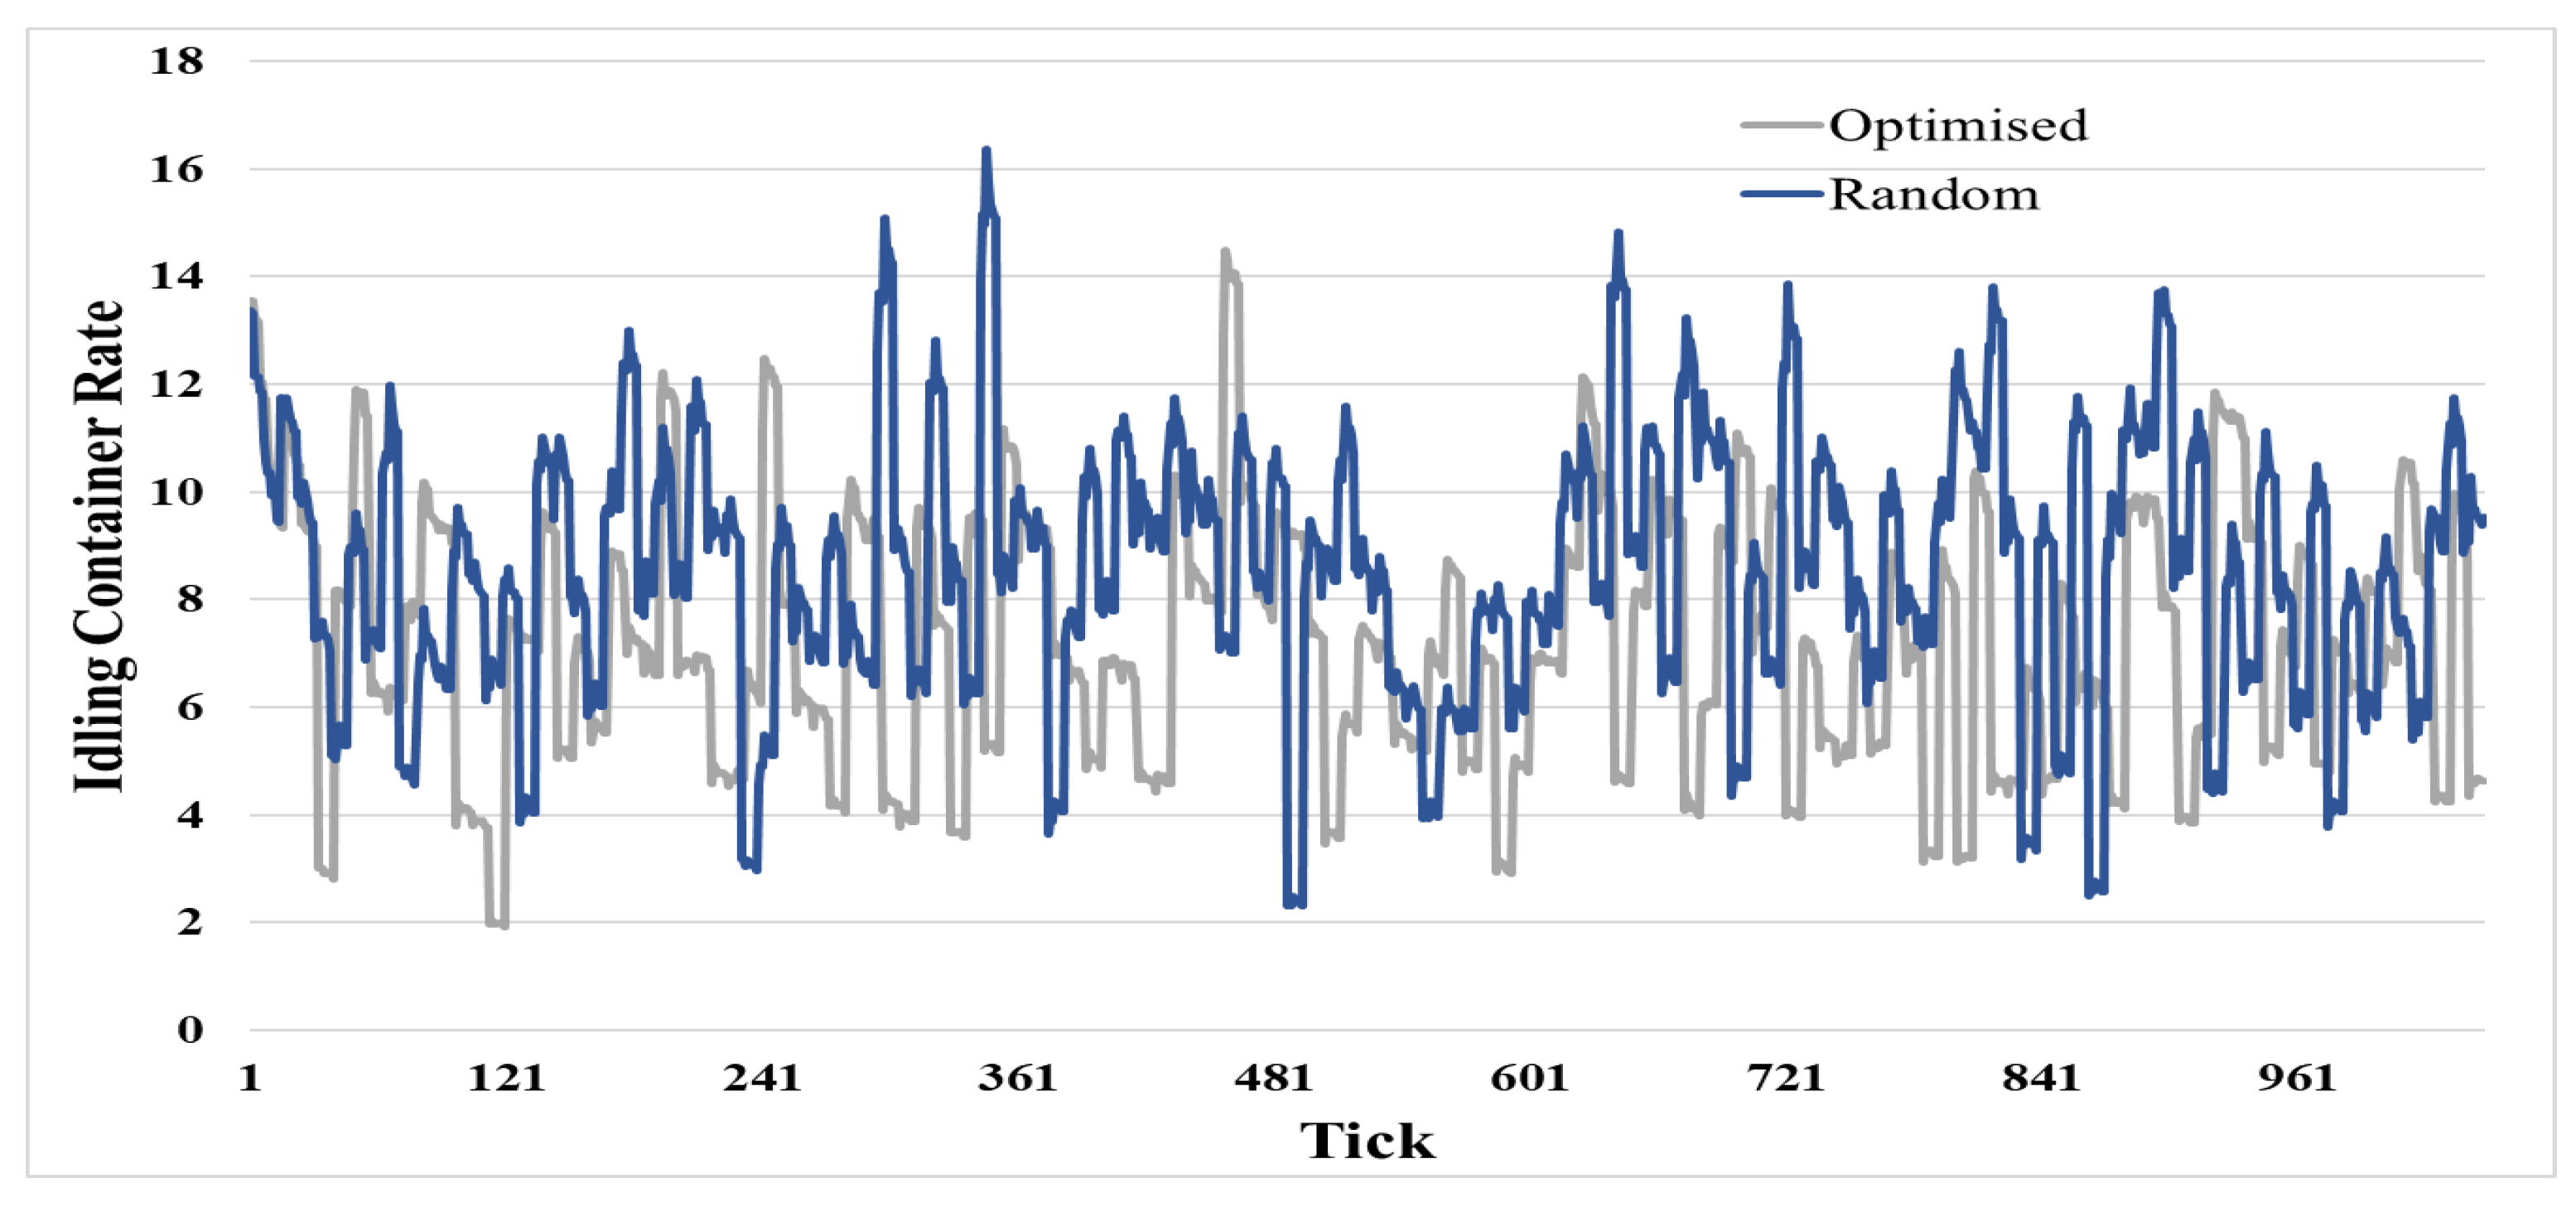
It is not hard to see why improving the utilisation rate should be a primary concern for any shipping line where growing trade imbalances can have a notable impact as more containers will spend additional time being idle. As shown in Figure 10, the model results illustrate the number of times the container has been used during its lifespan. The empty containers in the random scenarios need to wait for a longer period of time in the depot until a vessel arrives. This represents a non-revenue generating part involving additional costs such as storage costs. In comparison, the average idling rates of empties in optimised scenarios are less than the random ones where containers are shipped quickly to profitable customers. Although the results of empty containers’ idle rate in the simulation model are not sharply different in both scenarios, the slightest difference causes a significant change due to the storage cost continuing to rise. Hence, improving container utilisation could achieve potential cost savings and save the container’s lifespan. The analysis of the above results during the research supports H3.
6. Discussion
The research direction initially started with the idea of this model, aiming to validate the concept and confirm its benefits. Based on the results, it is proven that the proposed model creates several general benefits to the global economy and especially to the maritime sector. The model is strong enough to validate the three hypotheses and subsequently improve the repositioning of empty containers. According to [46], the movements of empties are costly and estimated to be around 20–25% of the total expenses in shipping lines. They require extra handling and transportation, taking up slots on vessels which could generate revenue through laden containers. Hence, it is understood that shipping lines will prioritize strategies that can reduce financial burdens. Nonetheless, it is evident from the findings that implementing the optimised repositioning strategy can eliminate the cost as much as possible and achieve more revenues for the shipping line. The proposed model presents all the ports in each country with the empty stocks, their needs, cost, and space so that the decision-makers can select the best profitable option. Additionally, when the optimised repositioning strategy is viewed as a solution, it enables not only cost savings but also a lower environmental impact.
According to [47], empty containers are exposed to being salted and corrosion during storage in depots, affecting their lifespan. The well-cited study [12] considers the scale of the container transportation network and the decision time frame seems to have a better effect on container utilization throughout its lifespan. Subsequently, the proposed model attempted to address this problem by reducing the idle time of empty containers in depots. One of the positive outcomes extracted from the model’s implementation is explained by shorter empty container waiting times and increased container usage rates. Nonetheless, container utilization is increased while using the optimised strategy and vice versa. Thus, proving the hypotheses led to a consensus about the model’s value, which can be considered an essential point for the validity of the research.
One of the most important attributes of excellent customer satisfaction is fast responsiveness [48]. Hence, keeping good relationships with customers to ensure future orders is more important than rejecting requests to enable some cost reductions. In the maritime sector, matching demand and supply together in a timely fashion is substantially challenging since it has to match on each level; location, specific time, destination, equipment, and customer-specific requests [49]. Therefore, supplying empty containers to the customer in a short time could not only ensure that demand is fulfilled, but it can also improve the whole company’s performance. The model tries to address this issue by enhancing the flexibility of the supply chain. Consequently, it helps in eliminating the long delivery lead time needed to select the empty containers and provide a very wide range of surplus/deficit areas, since the model will contain all the information of the shipping line and ports. The results showed that the random strategy’s response time to supply empty containers is less than the optimised strategy. Still, this difference is insignificant compared to the profits achieved from targeting the most optimised shortage location. The shipping lines would therefore choose to reposition their empty containers to the optimised area since it is a better approach to stay competitive instead of randomly sending them.
Although the problem of empty container movements cannot be entirely avoided as long as there are trade imbalances, efficient empty container distributions free shipping lines from the administrative hassle of figuring out slots on the vessel, trucking, negotiations, and endless emails. Additionally, the positive outcomes from implementing the proposed model enable shipping lines and the maritime industry to reduce their vessel speed resulting in less fuel consumption; therefore, there is a lack of adverse effects on the environment emanating from empty container movements [16].
In summary, the proposed model of managing empty container movements can help the shipping industry to achieve significant improvement within international trade on a number of levels: First, the capital expenditures which is the money used to maintain fixed assets. The lower the capital expenditures, the better it is for the shipping lines. Secondly, resource consumption which is represented in this study on containers and vessels. The model will be helpful since all the transport chains worldwide can reduce the inventory level and safety stock, and reducing their consumption leads to increased sustainability. Third, the depot storage costs and terminal space; reducing such elements means that shipping lines obtain more storage space for lower charges.
7. Conclusions and Future Work
Maritime activities are interdependent and affect each other either directly or indirectly. Container management will improve the entire logistics and transport chain, including empty container distribution. By avoiding a lack of containers or accumulating too many, container management will optimise the performance of the entire shipping system.
Based on the comparative analysis of the optimisation-simulation model, the following conclusions can be drawn:
- The impact of repositioning is large, as fewer empty containers increase the accumulated net profit. An optimised repositioning strategy can increase profitability by increasing the turnover of empty containers.
- With the proposed optimised strategy, container utilisation is maximized over its lifetime. Reduced container movements also reduce environmental impacts such as CO2 emissions, congestion, and fuel consumption from a sustainable perspective.
- The random strategy relies on shipping empty containers once ordered without considering the cost, profit, or utilisation rate if no repositioning strategy is implemented.
The study found that simulation optimisation is becoming a useful tool for all maritime stakeholders, especially shipping lines, and a value-added approach to all ports within the transport chain. Even though the positive results mentioned do not represent a significant difference for just one container, they seem overwhelming when you consider the yearly volume of containers and the size of the industry. A promising result of this study indicates interest in using the optimisation-simulation model to address the problem of empty container movements. The study hypotheses were verified by the results, but future studies could benefit from improving the model performance. To simplify the problem, a semi-closed system was proposed for one shipping company and a limited number of ports and customers.
The global maritime logistic network comprises thousands of shipping companies, ports, users, and other entities. If this study is to be used in future research, the researcher should conduct more comparative studies among shipping lines and multiple ports. This will provide more robust results. The proposed model considered handling and shipping costs, but other factors should be considered in the future, such as the time cost, empty depot location, storage planning, and shipping schedule. In order to get closer to real predictability, the authors propose extending this contribution and considering additional parameters.
Author Contributions
Conceptualization, A.A. and T.K.; methodology, A.A. and B.R.; software, B.R. and T.K.; validation; B.R.; writing—original draft preparation, A.A.; writing—review and editing, A.A. and T.K.; supervision, T.K. All authors have read and agreed to the published version of the manuscript.
Funding
This research received no external funding.
Institutional Review Board Statement
Not applicable.
Informed Consent Statement
Not applicable.
Data Availability Statement
Data is contained within the article.
Conflicts of Interest
The authors declare no conflict of interest.
References
- Rodrigue, J.-P.; Notteboom, T.E. Containerization, box logistics and global supply chains: The integration of ports and liner shipping networks. In Port Management; Springer: Berlin/Heidelberg, Germany, 2013; pp. 5–28. [Google Scholar]
- Liu, Q. Efficiency Analysis of Container Ports and Terminals; UCL (University College London): London, UK, 2010. [Google Scholar]
- Li, J.-A.; Leung, S.C.H.; Wu, Y.; Liu, K. Allocation of empty containers between multi-ports. Eur. J. Oper. Res. 2007, 182, 400–412. [Google Scholar] [CrossRef]
- Belayachi, N.; Gelareh, S.; Yachba, K.; Bouamrane, K. The Logistic of Empty Containers′ Return in the Liner-Shipping Network. Transp. Telecommun. J. 2017, 18, 207–219. [Google Scholar] [CrossRef] [Green Version]
- Choong, S.T.; Cole, M.H.; Kutanoglu, E. Empty container management for intermodal transportation networks. Transp. Res. Part E Logist. Transp. Rev. 2002, 38, 423–438. [Google Scholar] [CrossRef]
- Hosseini, A.; Sahlin, T. An optimization model for management of empty containers in distribution network of a logistics company under uncertainty. J. Ind. Eng. Int. 2018, 15, 585–602. [Google Scholar] [CrossRef]
- Notteboom, T.E. Container shipping and ports: An overview. Rev. Netw. Econ. 2004, 3, 86–106. [Google Scholar] [CrossRef] [Green Version]
- Braekers, K. Optimization of Empty Container Movements in Intermodal Transport; Springer: Berlin/Heidelberg, Germany, 2013. [Google Scholar]
- Rodrigue, J.-P. The Geography of Transport Systems, 5th ed.; Routledge: London, UK, 2020. [Google Scholar]
- Endresen, Ø.; Dalsøren, S.; Eide, M.; Isaksen, I.S.; Sørgård, E. The environmental impacts of increased international maritime shipping, past trends and future perspectives. In Proceedings of the Global Forum on Transport and Environment in a Globalising World, Guadalajara, Mexico, 10–12 November 2008; pp. 10–12. [Google Scholar]
- Lopez, E. How do ocean carriers organize the empty containers reposition activity in the USA? Marit. Policy Manag. 2003, 30, 339–355. [Google Scholar] [CrossRef]
- Borg, E. Environmental Benefits from Reducing Empty Container Movements: A Life Cycle Assessment and Analysis of Strategies to Reduce Empty Container Repositioning. School of Architecture and the Built Environment, KTH Royal Institute of Technology, Dissertation. 2021. Available online: http://urn.kb.se/resolve?urn=urn:nbn:se:kth:diva-298597 (accessed on 13 December 2022).
- Kuzmicz, K.A.; Pesch, E. Approaches to empty container repositioning problems in the context of Eurasian intermodal transportation. Omega 2019, 85, 194–213. [Google Scholar] [CrossRef]
- Epstein, R.; Neely, A.; Weintraub, A.; Valenzuela, F.; Hurtado, S.; Gonzalez, G.; Beiza, A.; Naveas, M.; Infante, F.; Alarcon, F.; et al. A Strategic Empty Container Logistics Optimization in a Major Shipping Company. Interfaces 2012, 42, 5–16. [Google Scholar] [CrossRef] [Green Version]
- Ivanov, D.; Sokolov, B. Adaptive Supply Chain Management; Springer Science & Business Media: Berlin/Heidelberg, Germany, 2009. [Google Scholar]
- Shintani, K.; Imai, A.; Nishimura, E.; Papadimitriou, S. The container shipping network design problem with empty container repositioning. Transp. Res. Part E Logist. Transp. Rev. 2007, 43, 39–59. [Google Scholar] [CrossRef] [Green Version]
- Feng, C.-M.; Chang, C.-H. Empty container reposition planning for intra-Asia liner shipping. Marit. Policy Manag. 2008, 35, 469–489. [Google Scholar] [CrossRef]
- Song, D.-P.; Dong, J.-X. Cargo routing and empty container repositioning in multiple shipping service routes. Transp. Res. Part B Methodol. 2012, 46, 1556–1575. [Google Scholar] [CrossRef]
- Zhang, Y.; Facanha, C. Strategic planning of empty container repositioning in the transpacific market: A case study. Int. J. Logist. Res. Appl. 2014, 17, 420–439. [Google Scholar] [CrossRef]
- Huang, Y.-F.; Hu, J.-K.; Yang, B. Liner services network design and fleet deployment with empty container repositioning. Comput. Ind. Eng. 2015, 89, 116–124. [Google Scholar] [CrossRef]
- Akyüz, M.H.; Lee, C.-Y. Service type assignment and container routing with transit time constraints and empty container repositioning for liner shipping service networks. Transp. Res. Part B Methodol. 2016, 88, 46–71. [Google Scholar] [CrossRef]
- Abdelshafie, A.; Salah, M.; Kramberger, T.; Dragan, D. Repositioning and Optimal Re-Allocation of Empty Containers: A Review of Methods, Models, and Applications. Sustainability 2022, 14, 6655. [Google Scholar] [CrossRef]
- Song, D.-P.; Dong, J.-X. Empty container repositioning. In Handbook of Ocean Container Transport Logistics; Springer: New York, NY, USA, 2015; pp. 163–208. [Google Scholar]
- Monios, J.; Wang, Y. Regional stakeholder solutions to empty container repositioning costs in peripheral regions. In Proceedings of the Transport Research Institute, STAR (Scottish Transport Applications and Research) Conference, Edinburgh Napier University, Glasgow, UK, 21 May 2014. [Google Scholar]
- Müller, D.; Tierney, K. Decision support and data visualization for liner shipping fleet repositioning. Inf. Technol. Manag. 2017, 18, 203–221. [Google Scholar] [CrossRef]
- Macal, C.M.; North, M.J. Tutorial on agent-based modelling and simulation. J. Simul. 2010, 4, 151–162. [Google Scholar] [CrossRef]
- Axelrod, R.; Tesfatsion, L. Appendix AA guide for newcomers to agent-based modeling in the social sciences. Handb. Comput. Econ. 2006, 2, 1647–1659. [Google Scholar]
- Wilensky, U.; Rand, W. An Introduction to Agent-Based Modeling: Modeling Natural, Social, and Engineered Complex Systems with NetLogo; MIT Press: Cambridge, MA, USA, 2015. [Google Scholar]
- Brown, D.G. Agent-based models. In Our Earth’s Changing Land: An Encyclopedia of Land-Use and Land-Cover Change; Geist, H., Ed.; Greenwood Publishing Group: Westport, CT, USA, 2006; pp. 7–13. [Google Scholar]
- Railsback, S.F.; Grimm, V. Agent-Based and Individual-Based Modeling: A Practical Introduction; Princeton University Press: Princeton, NJ, USA, 2019. [Google Scholar]
- Gimblett, R.; Daniel, T.; Meitner, M.J. An individual-based modeling approach to simulating recreation use in wilderness settings. In Proceedings of the USDA Forest Service Proceedings RMRS-P-15-VOL-4, Missoula, MT, USA, 23–27 May 2000; U.S. Department of Agriculture, Forest Service, Rocky Mountain Research Station: Ogden, UT, USA; pp. 99–106. [Google Scholar]
- Bruch, E.; Atwell, J. Agent-based models in empirical social research. Sociol. Methods Res. 2015, 44, 186–221. [Google Scholar] [CrossRef] [Green Version]
- Christos, K.; Dimitrios, B.; Dimitrios, A. Agent-based simulation for modeling supply chains: A comparative case study. Int. J. New Technol. Res. 2016, 2, 263416. [Google Scholar]
- Bichou, K.; Gray, R. A logistics and supply chain management approach to port performance measurement. Marit. Policy Manag. 2004, 31, 47–67. [Google Scholar] [CrossRef]
- Gusah, L.; Cameron-Rogers, R.; Thompson, R.G. A systems analysis of empty container logistics—A case study of Melbourne, Australia. Transp. Res. Procedia 2019, 39, 92–103. [Google Scholar] [CrossRef]
- Dong, J.-X.; Song, D.-P. Container fleet sizing and empty repositioning in liner shipping systems. Transp. Res. Part E Logist. Transp. Rev. 2009, 45, 860–877. [Google Scholar] [CrossRef]
- Anand, N.; Van Duin, J.R.; Tavasszy, L. Framework for modelling multi-stakeholder city logistics domain using the agent based modelling approach. Transp. Res. Procedia 2016, 16, 4–15. [Google Scholar] [CrossRef] [Green Version]
- Wibowo, R.A.; Hidayatno, A.; Moeis, A.O. Simulating port expansion plans using agent based modelling. Int. J. Technol. 2015, 6, 864–871. [Google Scholar] [CrossRef]
- Shephard, M.S.; Beall, M.W.; O’bara, R.M.; Webster, B.E. Toward simulation-based design. Finite Elem. Anal. Des. 2004, 40, 1575–1598. [Google Scholar] [CrossRef]
- Zouhaier, H.; Kebair, F.; Serin, F.; Said, L.B. Multi-agent modeling and simulation of a hub port logistics. In Proceedings of the 2013 International Conference on Control, Decision and Information Technologies (CoDIT), Hammamet, Tunisia, 6–8 May 2013; pp. 671–676. [Google Scholar]
- Rutenbar, R.A. Simulated annealing algorithms: An overview. IEEE Circuits Devices Mag. 1989, 5, 19–26. [Google Scholar] [CrossRef]
- Aarts, E.; Korst, J.; Michiels, W. Simulated annealing. In Search Methodologies; Springer: Berlin/Heidelberg, Germany, 2005; pp. 187–210. [Google Scholar]
- Tisue, S.; Wilensky, U. Netlogo: A simple environment for modeling complexity. In Proceedings of the International Conference on Complex Systems, Boston, MA, USA, 16–21 May 2004; pp. 16–21. [Google Scholar]
- Vidal, J.M.; Buhler, P.; Goradia, H. The past and future of multiagent systems. In Proceedings of the AAMAS Workshop on Teaching Multi-Agent Systems, NewYork, NY, USA, 19–23 July 2004. [Google Scholar]
- Boile, M.; Theofanis, S.; Baveja, A.; Mittal, N. Regional repositioning of empty containers: Case for inland depots. Transp. Res. Rec. 2008, 2066, 31–40. [Google Scholar] [CrossRef]
- De Brito, M.; Konings, R. Container management strategies to deal with the East-West flows imbalance. Logist. Freight Clust. Delft Neth. 2008. [Google Scholar]
- Obrecht, M.; Knez, M. Carbon and resource savings of different cargo container designs. J. Clean. Prod. 2017, 155, 151–156. [Google Scholar] [CrossRef]
- Caro, F.; Martínez-de-Albéniz, V. The impact of quick response in inventory-based competition. Manuf. Serv. Oper. Manag. 2010, 12, 409–429. [Google Scholar] [CrossRef] [Green Version]
- Kuźmicz, K.A.; Pesch, E. Prerequisites for the modelling of empty container supply chains. Eng. Manag. Prod. Serv. 2017, 9, 28–36. [Google Scholar] [CrossRef] [Green Version]
Figure 1.
Framework of empty container repositioning cycle.
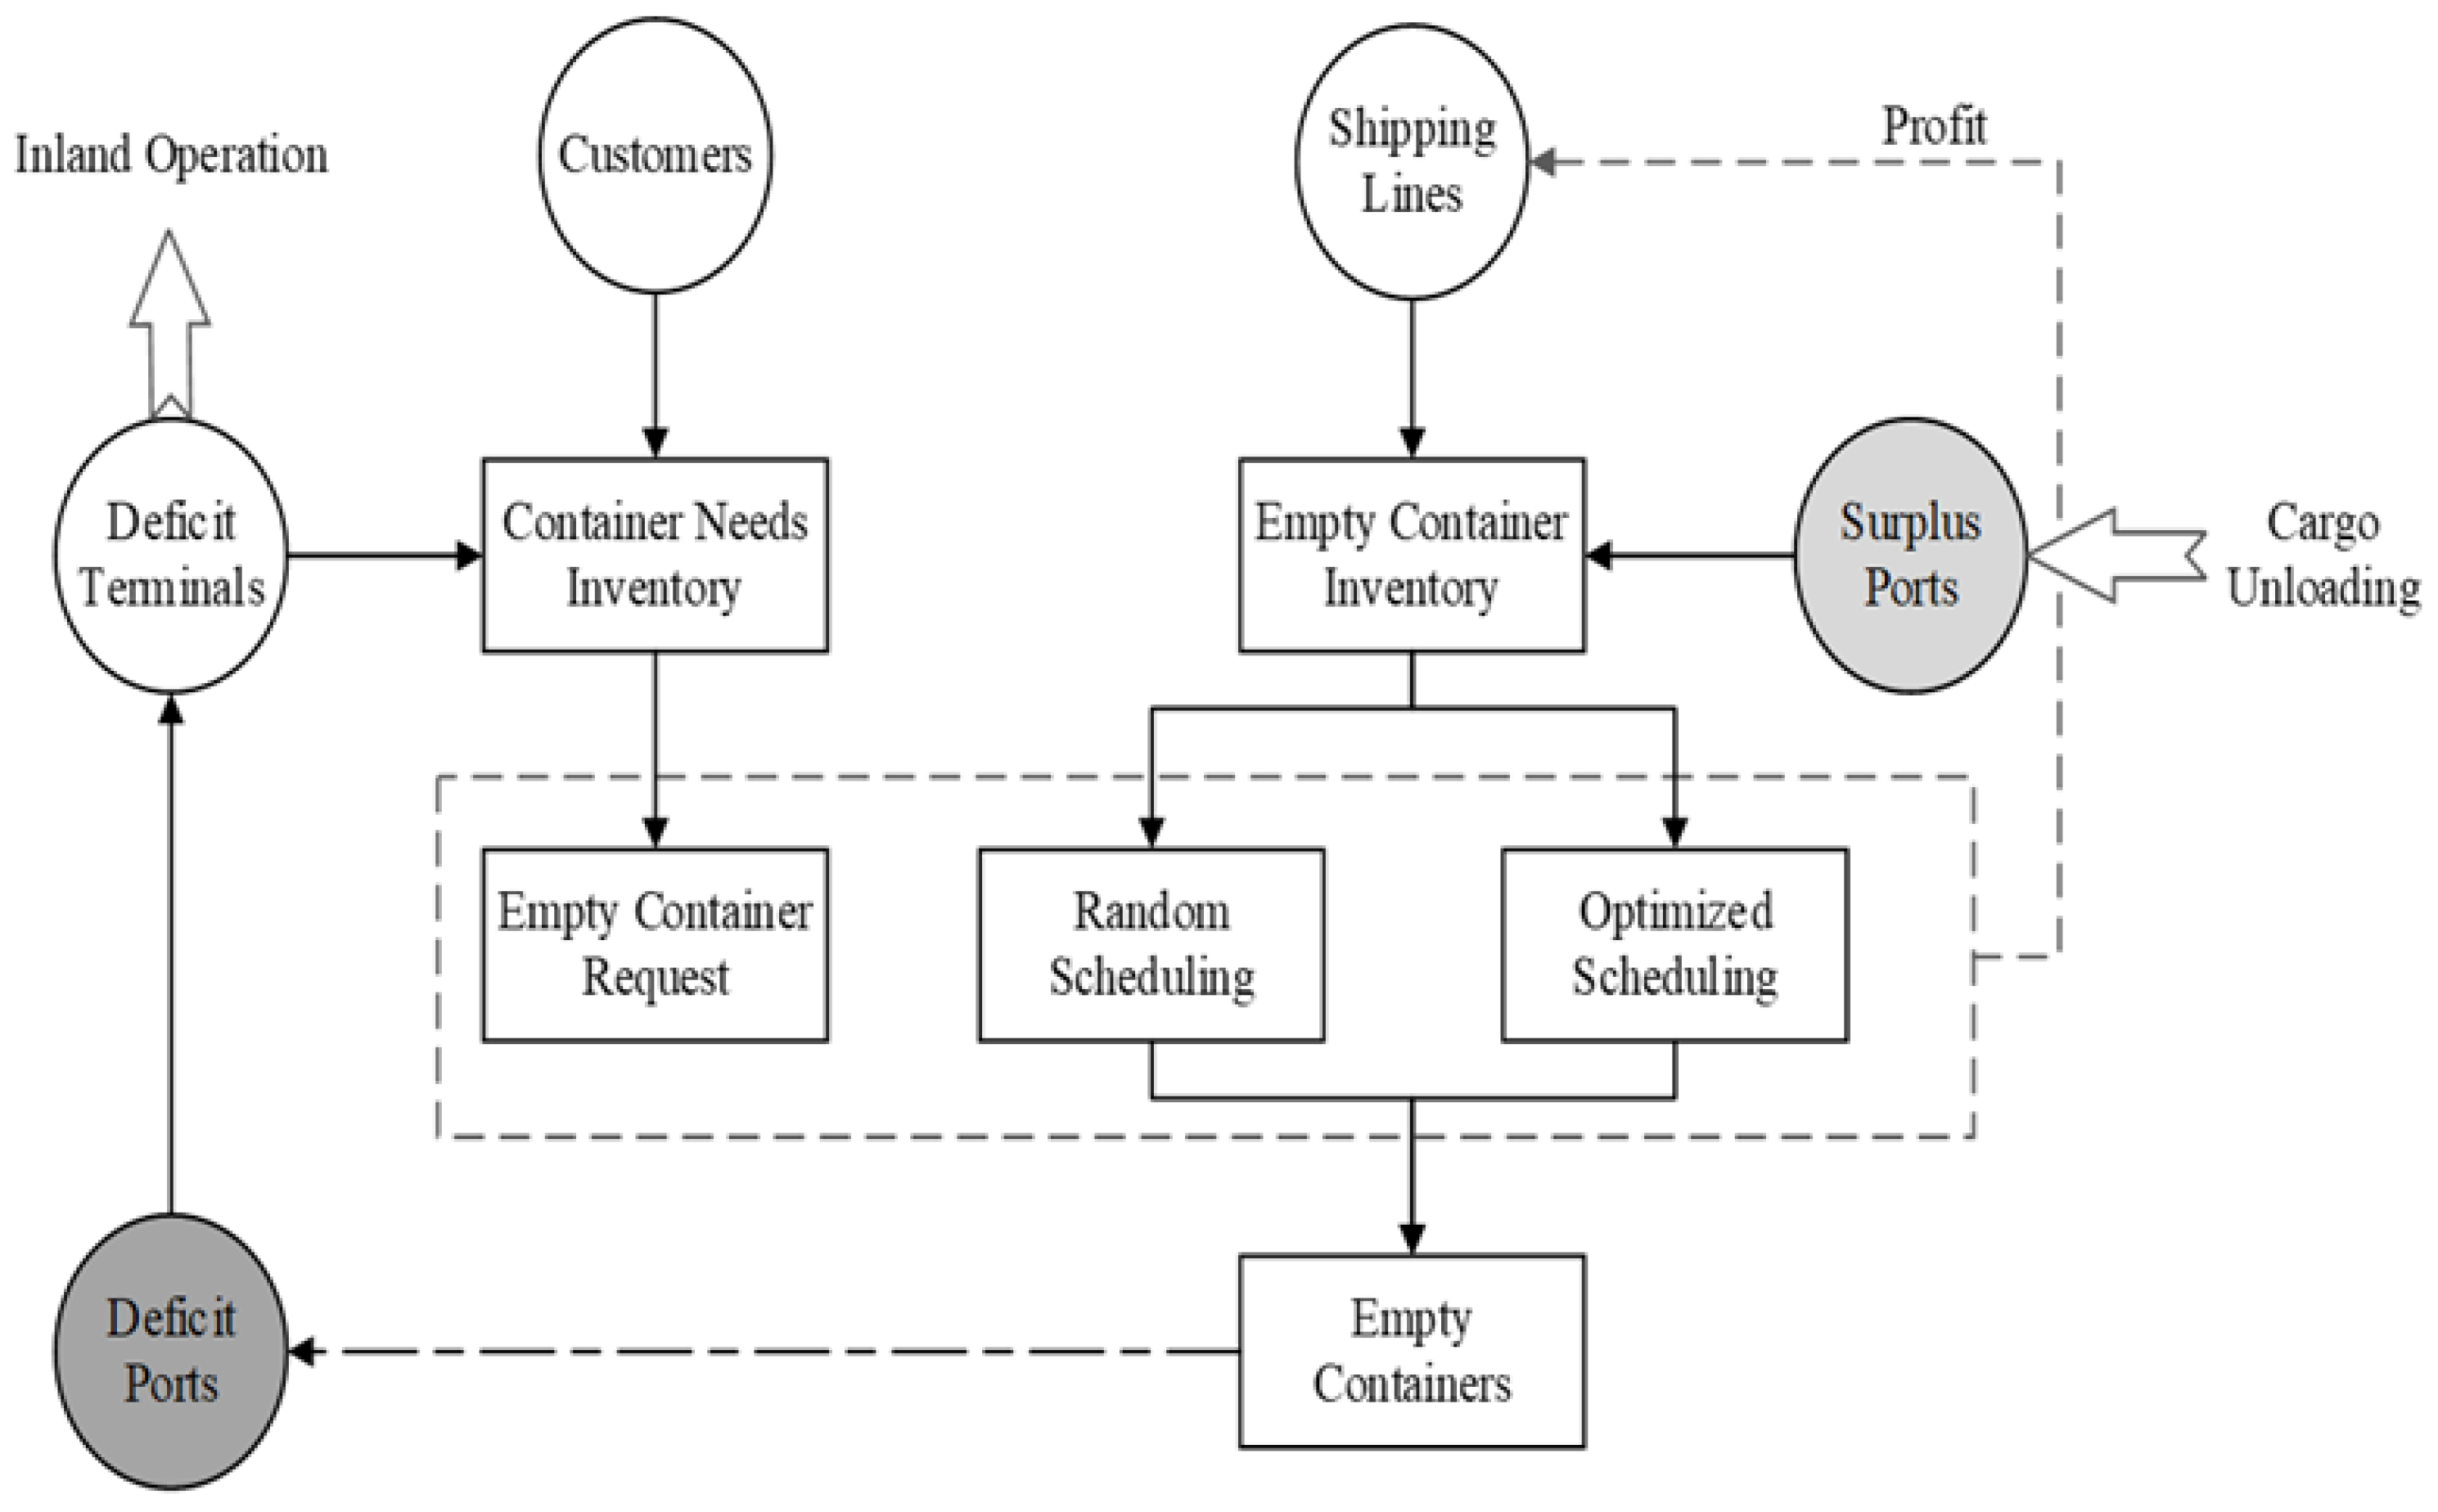
Figure 2.
The leading players in the maritime container repositioning cycle.

Figure 3.
Simulated Annealing Method for Empty Container Optimisation.
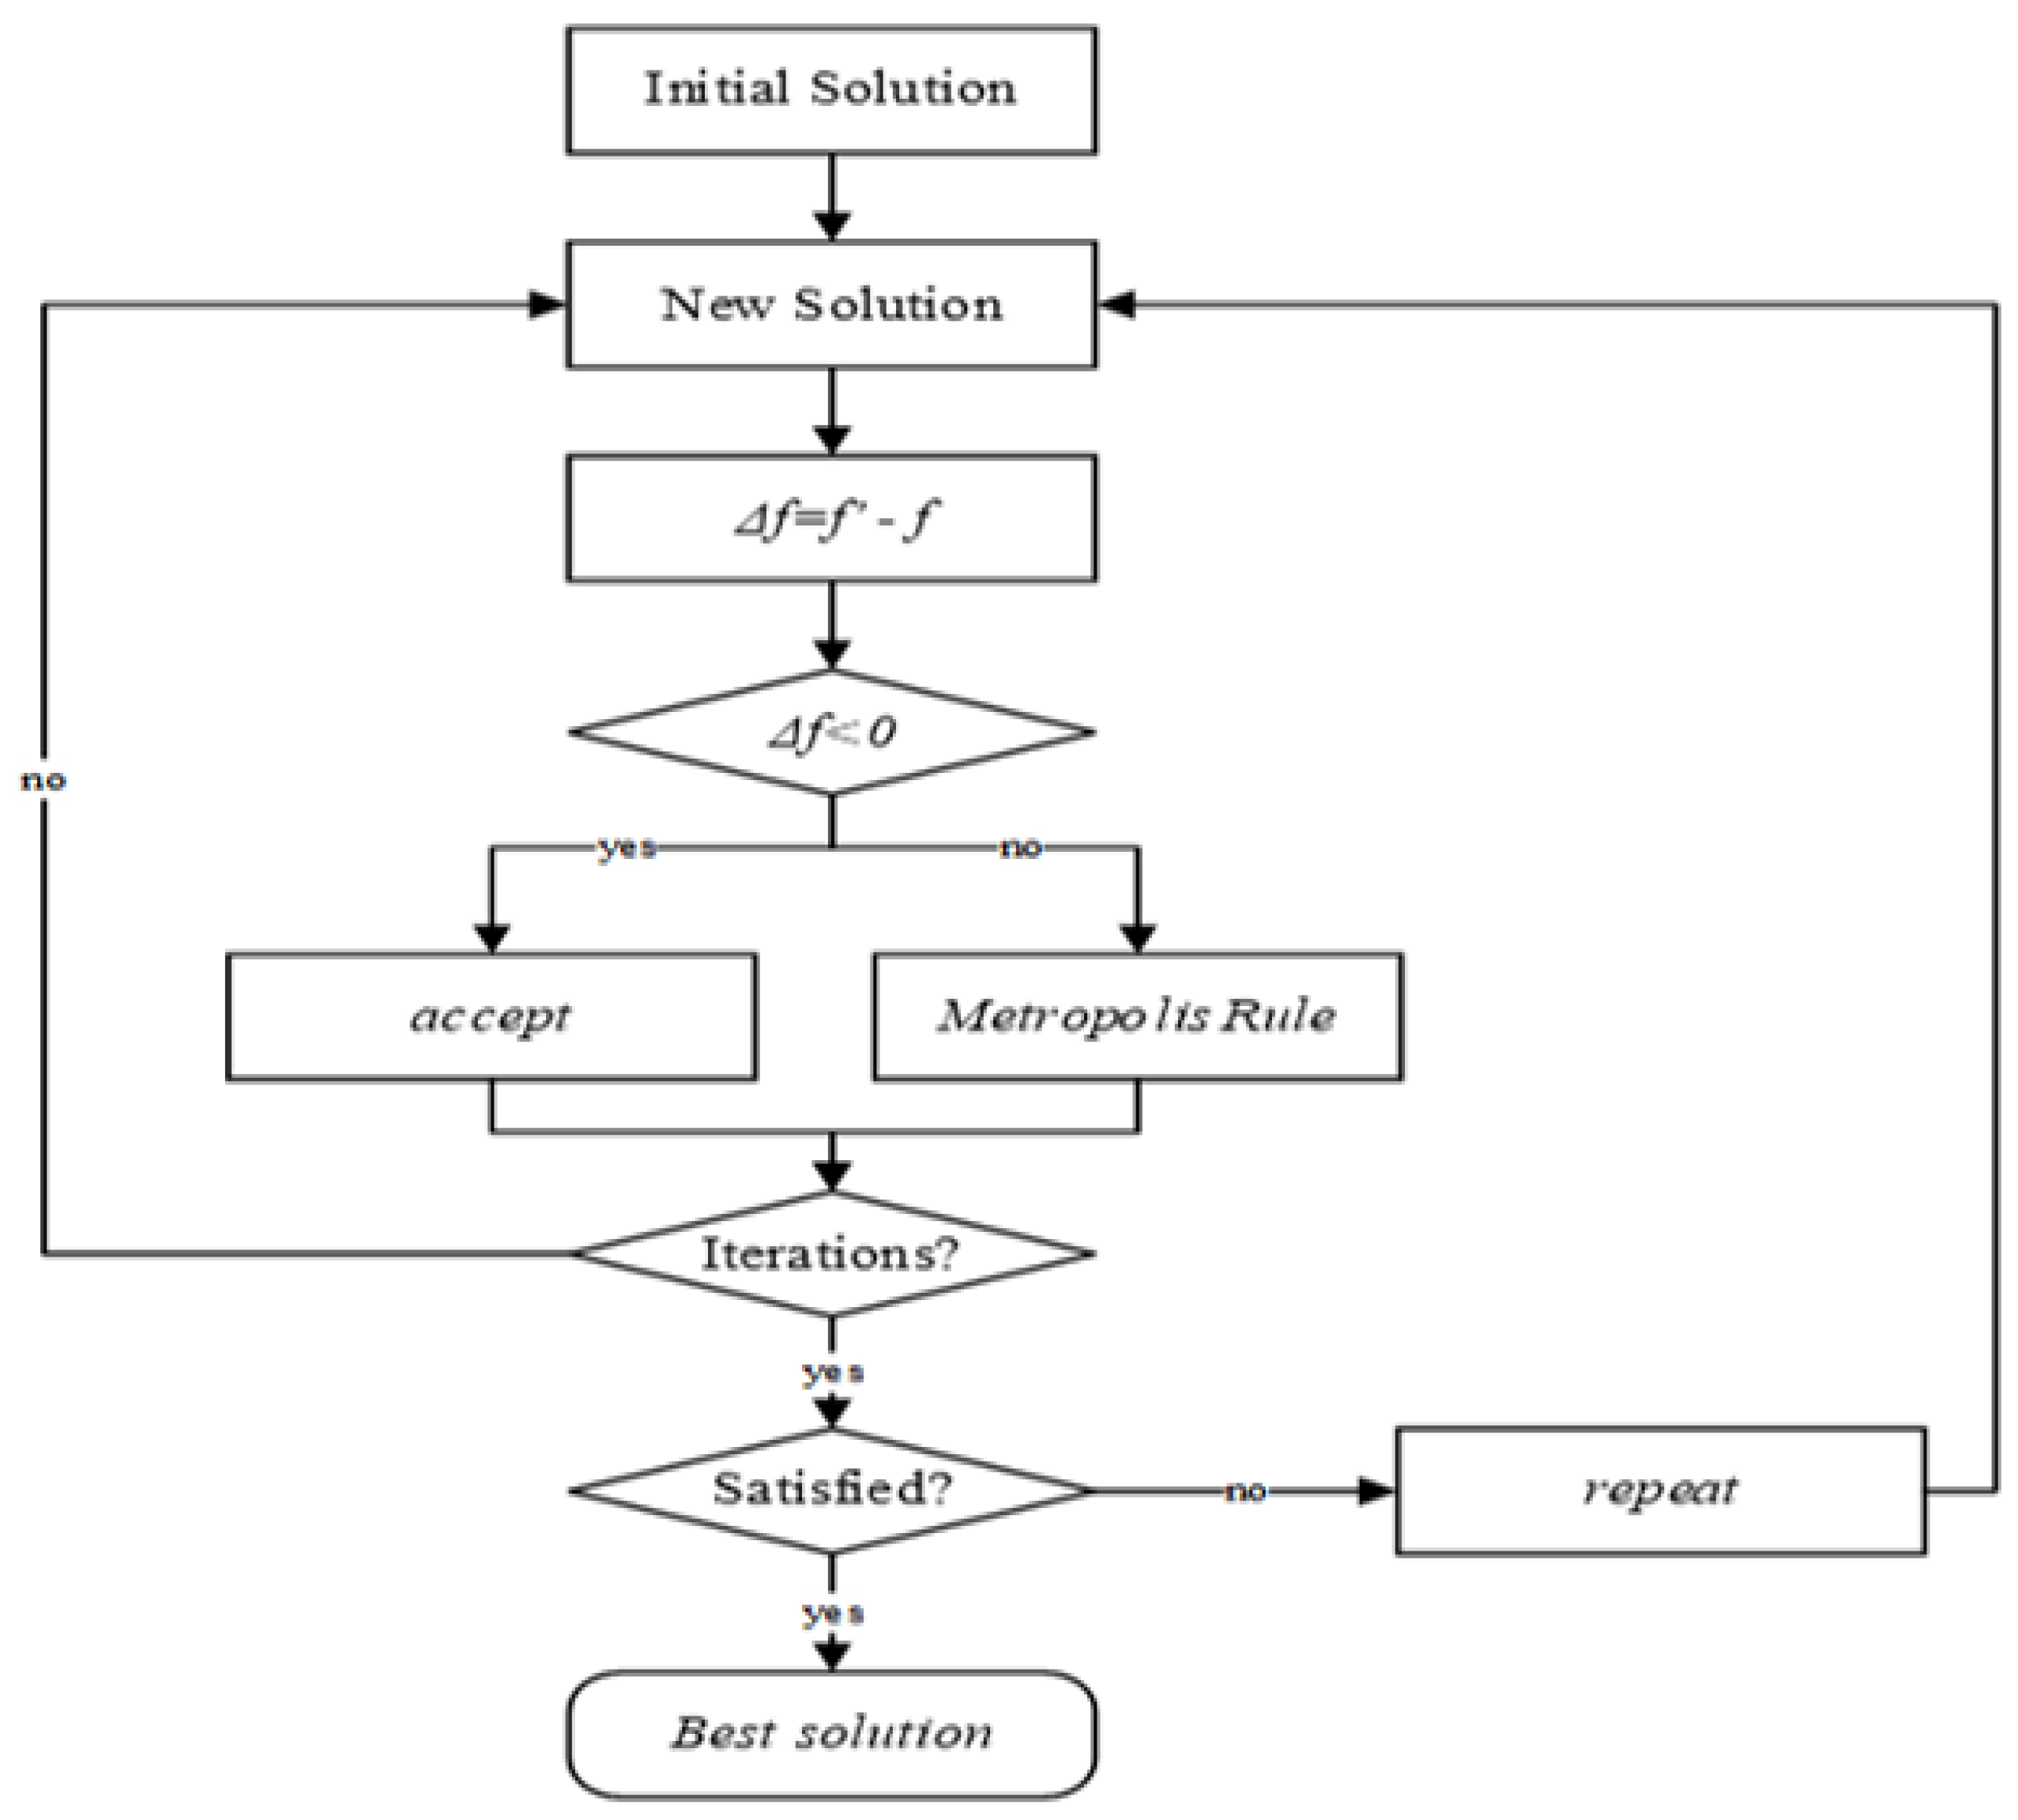
Figure 4.
Netlogo Interface for Maritime Empty Container Repositioning Simulation.

Figure 5.
Scenarios of Repositioning Strategy.

Figure 6.
Random Scenario for Allocating Empty Containers.

Figure 7.
Optimised Scenario for Empty Container Repositioning.
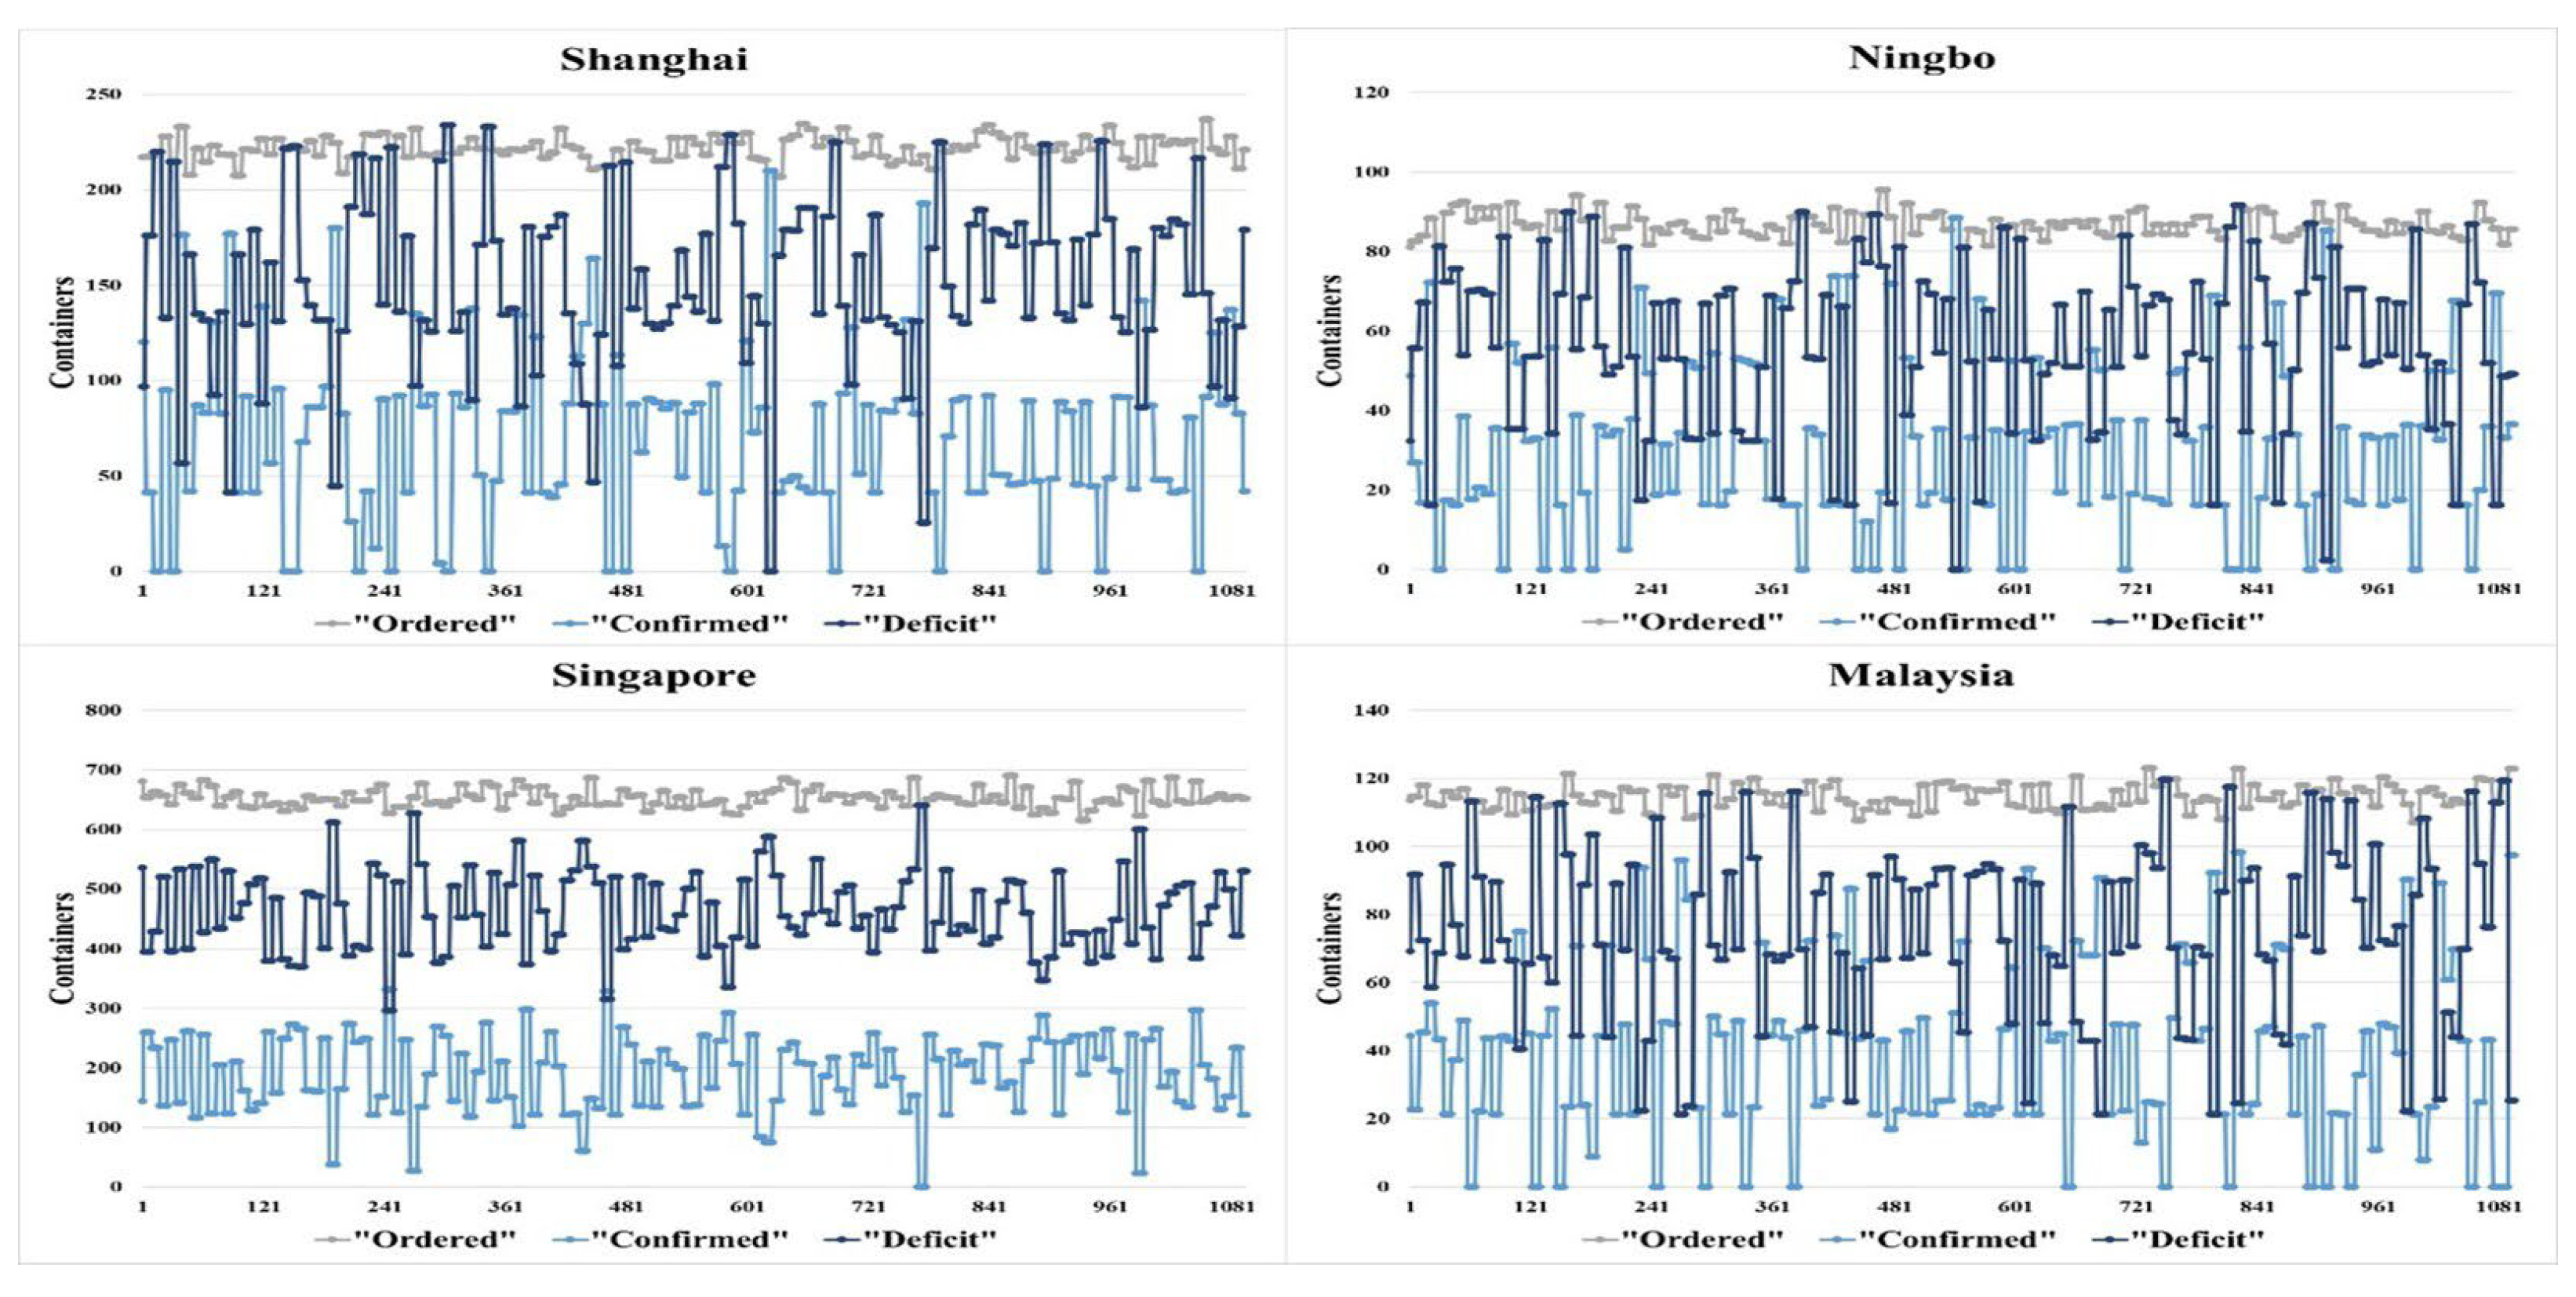
Figure 8.
Shipping Line Profit for Random and Optimised scenarios.
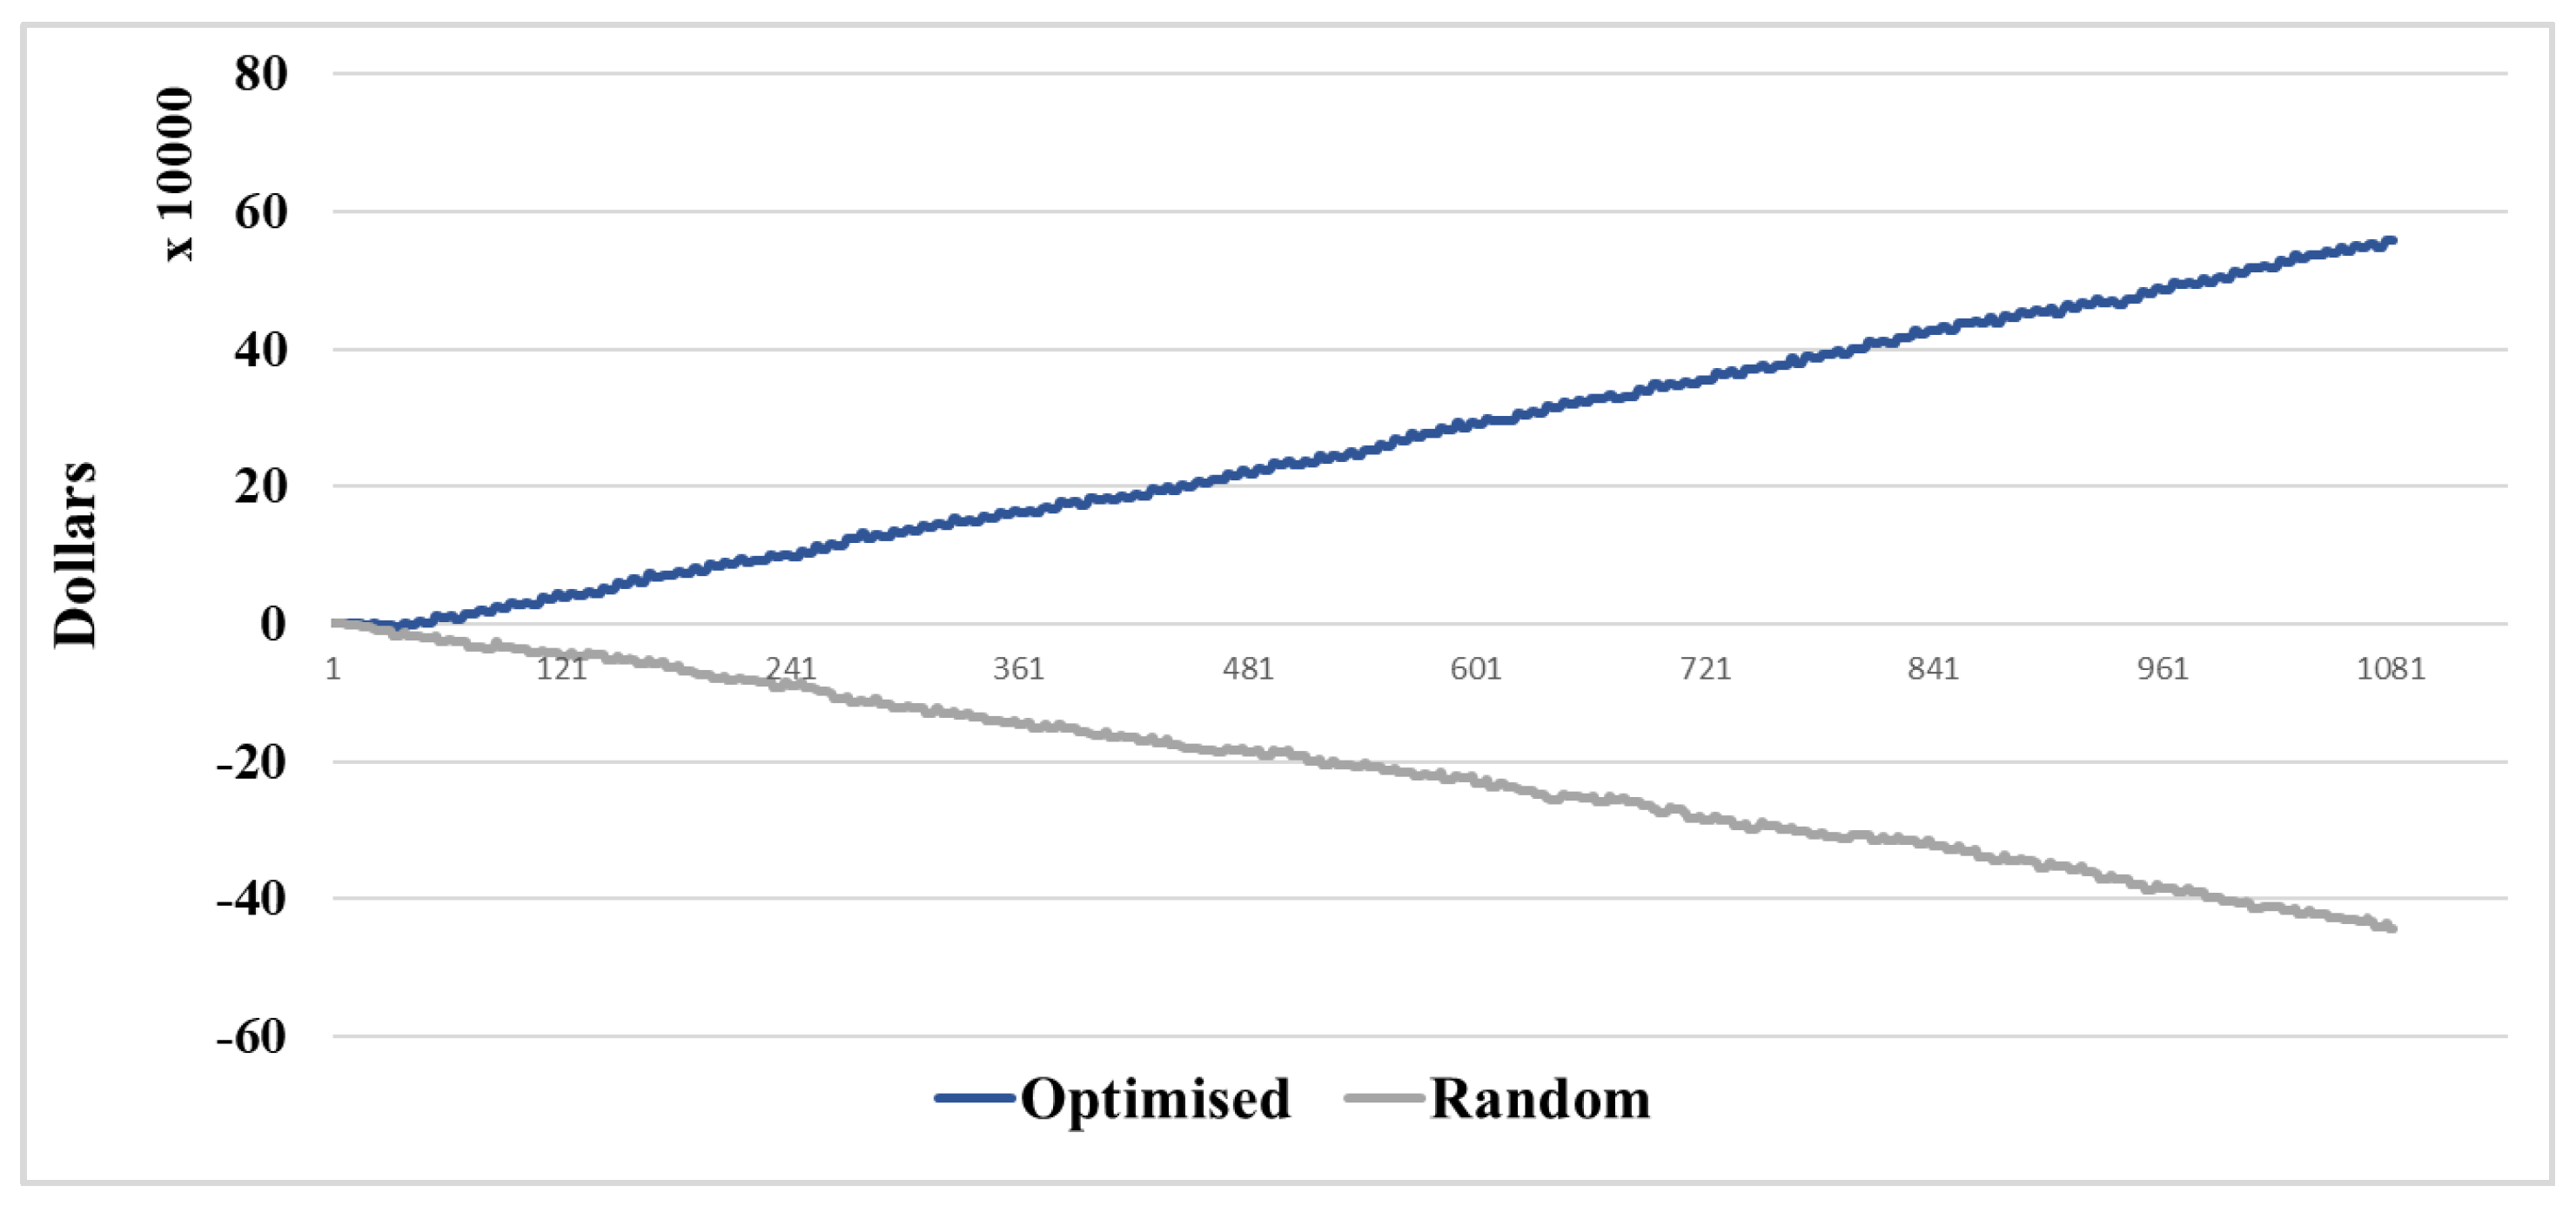
Figure 9.
Empty Container Average Turnover Days.
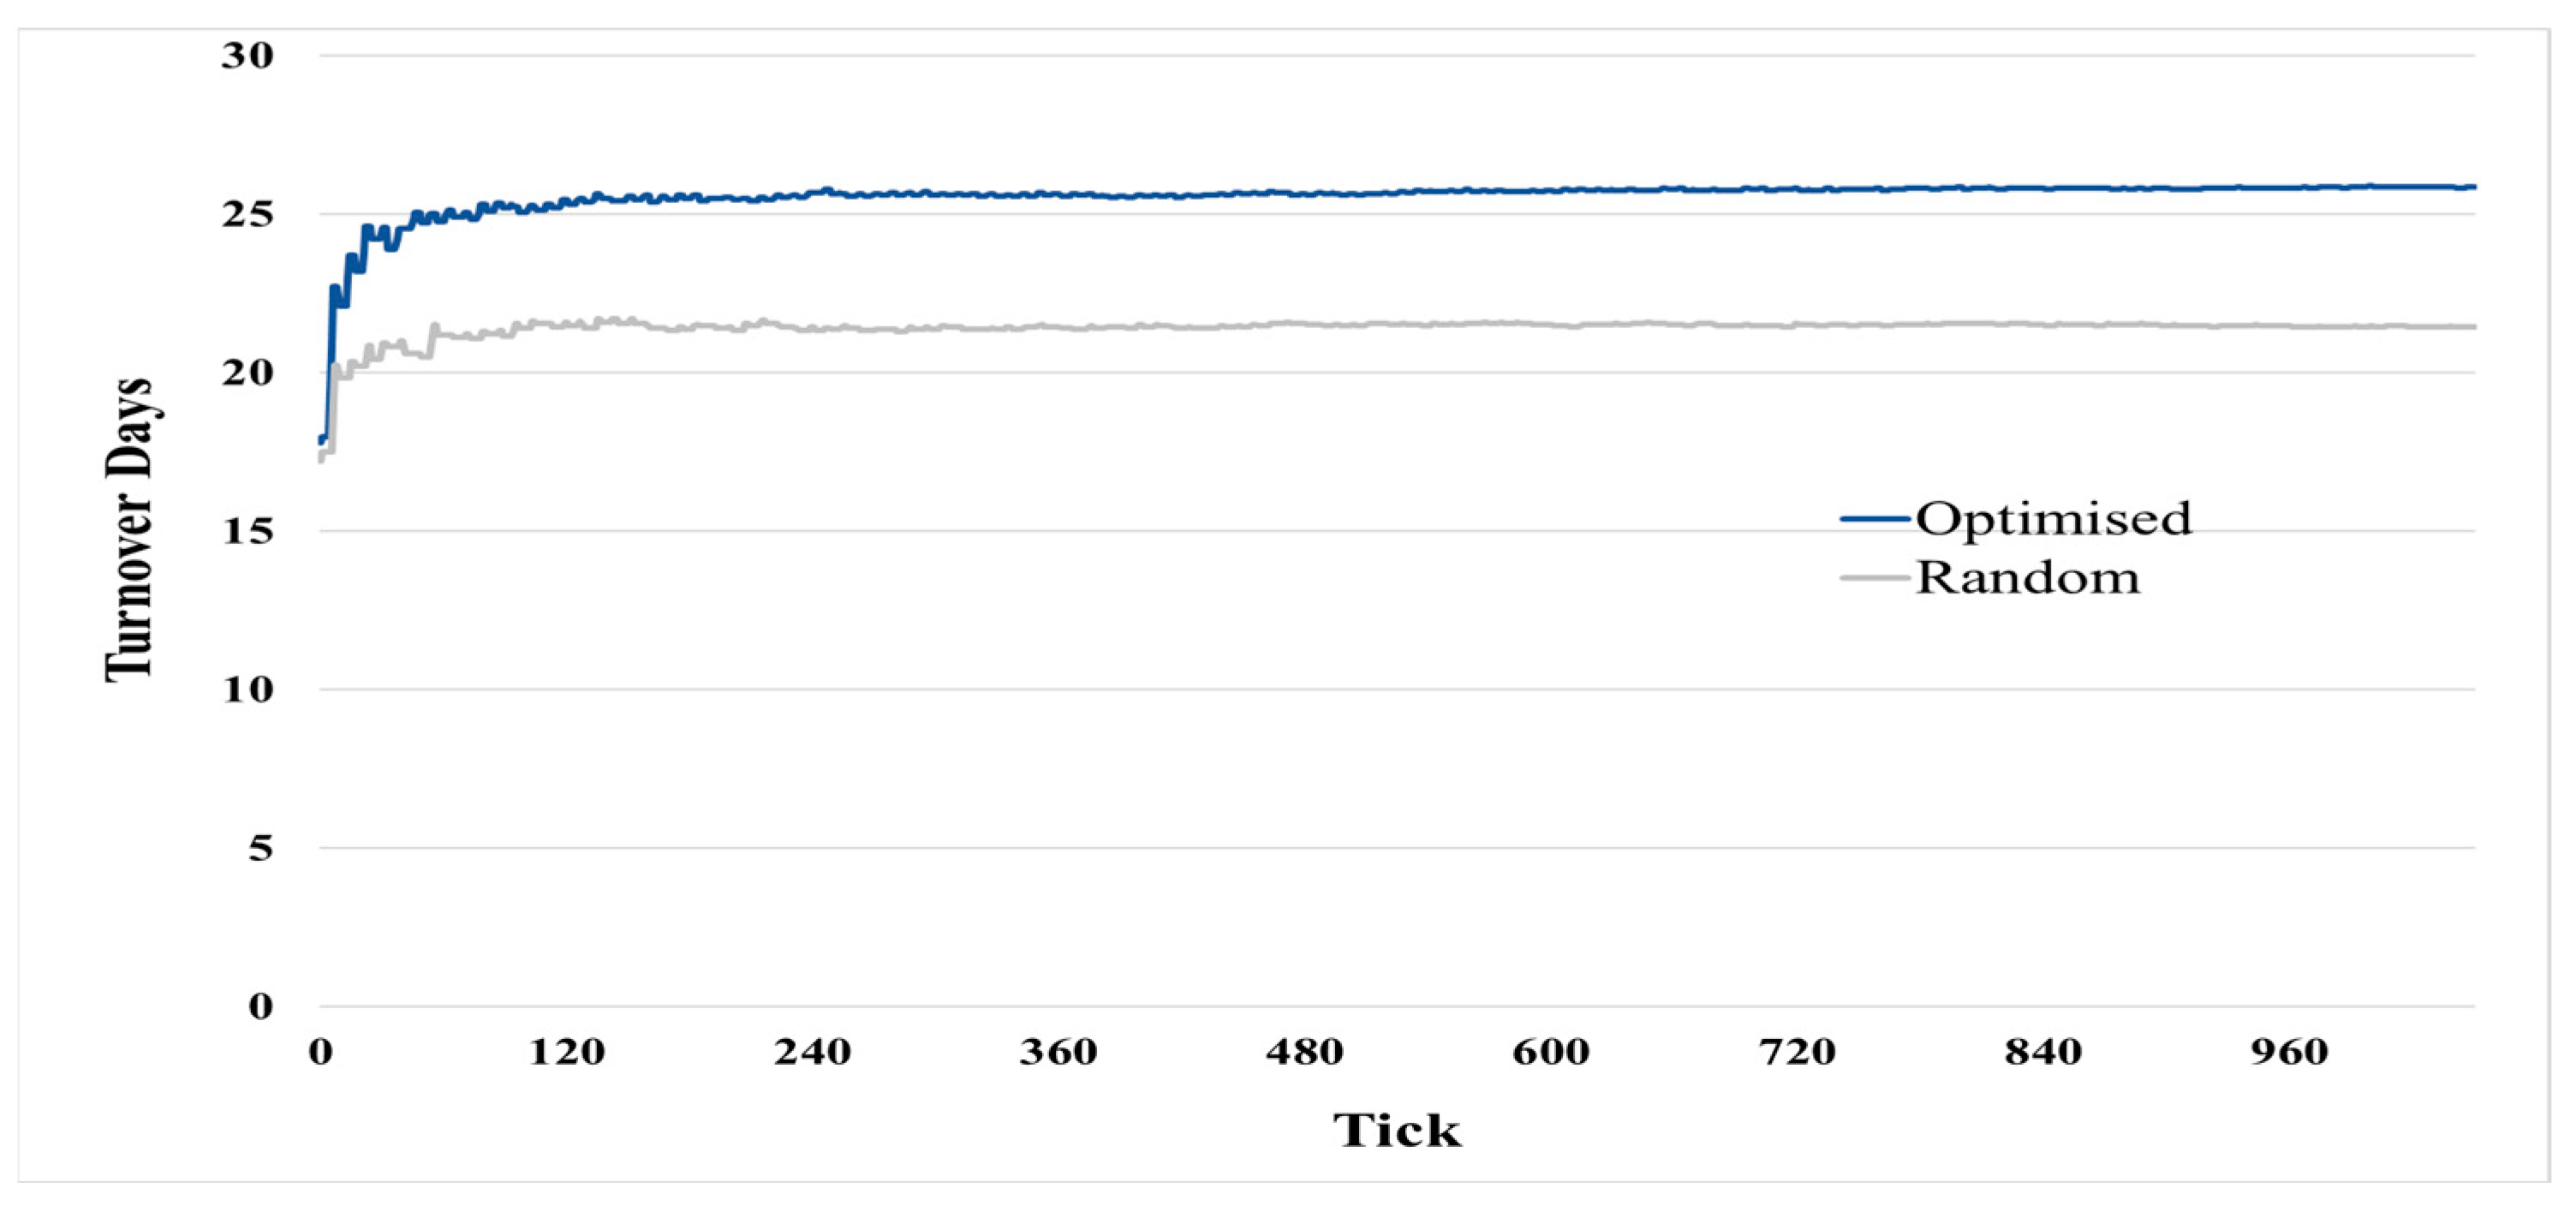
Figure 10.
Empty Container Utilization Rates.


Table 1.
Agents and Attributes.
| Agent | Attribute | Type | Description |
| Shipping Line | List | Empty container surplus ports list. | |
| List | Empty container deficit ports list. | ||
| Ratio | Total demand for empty containers. | ||
| Ratio | Total supply of empty containers. | ||
| Ratio | Total number of empty containers in the processed intaking orders. | ||
| Ratio | Total costs for repositioning the empty containers include handling cost, transportation cost, and storage cost. | ||
| Ratio | Total profit the shipping line can generate from repositioning the intaking orders. | ||
| Customer | Ordinal | Port ID. | |
| Ratio | The number of empty containers the customer ordered. | ||
| Ratio | The number of ordered empty containers confirmed by the shipping line. | ||
| Ratio | The empty containers shortage. | ||
| Ratio | The per empty container customer will pay to the shipping line (this can be determined by the actual cost and supply–demand balance of empty containers around the world; currently, the number is pre-set as fixed and varies among the ports). | ||
| Port | Dichotomous | The total empty container status of the port, deficit, or surplus (1 surplus port; 0 deficit port). | |
| Ratio | The handling of empty containers per unit at the port. | ||
| Ratio | The per unit cost of an empty container in a port. | ||
| Ratio | The total number of empty containers at the port. | ||
| Container | dichotomous | An empty container has two statuses, ordered or not ordered (1 ordered; 0 not ordered). | |
| Ordinal | The origin area of an empty container. | ||
| Ordinal | The destination area repositioning by the shipping line. | ||
| Ratio | Distance between and . | ||
| Ratio | The total time that a container is idle in the origin port. | ||
| Ratio | The handling cost per empty container. | ||
| Ratio | The storage cost of the container. | ||
| Ratio | The transportation cost from to . |
Table 2.
Selected Ports for Simulating in Netlogo.
| Deficit Ports | Abbreviation | Country | Surplus Ports | Abbreviation | Country |
|---|---|---|---|---|---|
| Dammam | SADMM | Saudi Arabia | Jeddah port | SAJED | Saudi Arabia |
| Shanghai | CNSHA | China | Umm Qasr port | IQUQR | Iraq |
| Singapore | SGSIN | Malaysia | BHKBS | BHKBS | Bahrain |
| Port Klang | MYPKG | Malaysia | QAHMD | QAHMD | Qatar |
| Ningbo | CNNGB | China | Jebel Ali port | AEJEA | United Arab Emirates |
Table 3.
Data inputs for the simulated ports *.
| POL | SADMM | SADMM | SADMM | SADMM | AEJEA | IQUQR | BHKBS | QAHMD |
| POD | CNNGB | SGSIN | MYPKG | CNSHA | SADMM | SADMM | SADMM | SADMM |
| Average Supply | 73 | 613 | 99 | 213 | 304 | 800 | 212 | 62 |
| Average Demand | 81 | 608 | 107 | 207 | 284 | 798 | 198 | 51 |
| Frequency/Cycle | 8 | 8 | 8 | 8 | 4 | 2 | 3 | 1 |
| SeaFreight/TEU | 60 | 40 | 40 | 60 | 24 | 20 | 20 | 20 |
| LoadingCost | 115 | 115 | 115 | 115 | 65 | 40 | 60 | 85 |
| DischargingCost | 20 | 50 | 50 | 20 | 115 | 115 | 115 | 115 |
| LOLOCost | 58 | 72 | 72 | 58 | 60 | 60 | 60 | 60 |
| StorageCost | 5 | 5 | 5 | 5 | 5 | 5 | 5 | 5 |
| InlandCost | 58 | 72 | 72 | 58 | 60 | 60 | 60 | 60 |
| ScanningCost | 58 | 72 | 72 | 58 | 60 | 60 | 60 | 60 |
| Customs | 58 | 72 | 72 | 58 | 60 | 60 | 60 | 60 |
* POL: port of loading; POD: port of destination; TEU: twenty-foot equivalent unit; LOLO: lift-on/lift-off.
Disclaimer/Publisher’s Note: The statements, opinions and data contained in all publications are solely those of the individual author(s) and contributor(s) and not of MDPI and/or the editor(s). MDPI and/or the editor(s) disclaim responsibility for any injury to people or property resulting from any ideas, methods, instructions or products referred to in the content. |
© 2023 by the authors. Licensee MDPI, Basel, Switzerland. This article is an open access article distributed under the terms and conditions of the Creative Commons Attribution (CC BY) license (https://creativecommons.org/licenses/by/4.0/).
Share and Cite
MDPI and ACS Style
Abdelshafie, A.; Rupnik, B.; Kramberger, T. Simulated Global Empty Containers Repositioning Using Agent-Based Modelling. Systems 2023, 11, 130. https://doi.org/10.3390/systems11030130
AMA Style
Abdelshafie A, Rupnik B, Kramberger T. Simulated Global Empty Containers Repositioning Using Agent-Based Modelling. Systems. 2023; 11(3):130. https://doi.org/10.3390/systems11030130
Chicago/Turabian StyleAbdelshafie, Alaa, Bojan Rupnik, and Tomaž Kramberger. 2023. "Simulated Global Empty Containers Repositioning Using Agent-Based Modelling" Systems 11, no. 3: 130. https://doi.org/10.3390/systems11030130
Note that from the first issue of 2016, this journal uses article numbers instead of page numbers. See further details here.