Article

Carbon Reduction Subsidy, Remanufacturing Subsidy or Consumer Recycling Subsidy? A Low-Carbon Closed-Loop Supply Chain Network Operation Decision

1
College of Engineering, Northeast Agricultural University, Harbin 150030, China
2
Postdoctoral Station for Agricultural and Forestry Economic Management, Northeast Agricultural University, Harbin 150030, China
3
School of Economics and Management, Harbin University of Science and Technology, Harbin 150080, China
4
College of Economics and Management, Northeast Agricultural University, Harbin 150030, China
*
Author to whom correspondence should be addressed.
Systems 2023, 11(3), 126; https://doi.org/10.3390/systems11030126
Submission received: 24 January 2023 / Revised: 21 February 2023 / Accepted: 24 February 2023 / Published: 27 February 2023
(This article belongs to the Section Supply Chain Management)

Abstract

:
To promote carbon emission reduction and resource reuse, this study is devoted to studying the impact of government subsidy policies on the operation decision of a low-carbon closed-loop supply chain system. In the production stage, governments can use carbon reduction subsidies and remanufacturing subsidies to reduce the green behavior costs of manufacturers; in the recycling stage, governments can use consumer recycling subsidies to increase the recycling willingness of consumers. In this study, we introduce these three subsidy policies into the target function of the subsidized members. Using the Nash non-cooperative game and variational inequality, we developed a low-carbon supply chain network equilibrium model to examine the impact of subsidy policies on the system operation decision. The results show that, under the three subsidy policies, raising the subsidy level can help to improve the recycling rate, promote the reduction in carbon emissions and improve the profits of retailers; however, manufacturers’ incomes increase only when the carbon reduction subsidy level is below a certain threshold. Notably, under the coexistence of three subsidy policies, the carbon reduction subsidy policy has a more significant impact on the system. Finally, the numerical results show that, when the subsidy level is higher than six, although the increase in carbon reduction subsidy level leads to a decrease in the profits of manufacturers, this policy has the best contribution to the environmental benefits of the system. Our results can serve as guidelines for governments when designing the optimal subsidy programs to achieve the ultimate goal of establishing an environmentally friendly supply chain network system.

1. Introduction

Low-carbon products and remanufactured products play an increasingly important role in the world’s economy [1,2]. They can reduce the over-exploitation of resources, prevent the pollution caused by waste disposal, and also cut down carbon dioxide emissions (CO2e) [3]. Under the concept of sustainable development, enterprises have begun to implement low-carbon and remanufacturing production activities [4]. For example, LG New Energy, a power battery manufacturer, has established a localized battery resource lifecycle closed-loop system and continuously developed sustainable development projects (e.g., energy conservation and emission reduction, battery recycling and remanufacturing) to achieve a zero-carbon factory. In this context, the supply chain network has gradually developed towards low-carbon and remanufacturing processes and formed the management mode of a low-carbon closed-loop supply chain network (LC-CLSCN) structure [3]. The LC-CLSCN system can not only reduce CO2e but also realize closed-loop management of products from “production → recycling → remanufacturing” [5]. Therefore, in the face of this multi-level network-structural system [6], there is certain theoretical and practical significance in studying the LC-CLSCN operation decision.
In the LC-CLSCN system, manufacturing enterprises need to expend a large number of funds to carry out low-carbon investment and remanufacturing production construction [5], such as the construction of enterprises’ low-carbon factories and the procurement of remanufacturing equipment [4]. This will reduce the enthusiasm of manufacturing enterprises for remanufacturing and low-carbon investment. To realize the global strategy of remanufacturing and low-carbon production, governments are willing to formulate CO2e reduction subsidy and remanufacturing subsidy policies to encourage enterprises’ CO2e reduction and remanufacturing behaviors [7,8]. For example, the “Fit for 55 Policy” issued by the European Union, the “Special Fund Management Measures for Energy Conservation, Emission Reduction and Carbon Reduction” formulated by Shanghai, and the “Made in China 2025” proposed by China. These policies have been proposed to support the CO2e reduction and remanufacturing behavior of production enterprises through the method of government fund compensation [9,10]. Additionally, the academic field has also obtained some conclusions about the impact of CO2e reduction subsidy and remanufacturing subsidy on the production and operation of the supply chain. For example, Cao et al. [9] and Wang et al. [11] proved that CO2e reduction subsidies and remanufacturing subsidies can reduce the enterprises’ CO2e and reduce resource waste under certain conditions. However, they only focused on the simple-structure supply chain system. It is difficult for this simple-structure supply chain system to describe the characteristics of the network-structure LC-CLSCN system [5,6]. This is because network-structure LC-CLSCN contains many similar subjects [12]. The competition and cooperation relationship between subjects is complex, and the simple-structure system cannot describe the competition and cooperation relationship between subjects [6,13]. Therefore, we can easily associate this with the key issues: if the government implements a CO2e reduction subsidy and/or remanufacturing subsidy for manufacturing enterprises in the face of the LC-CLSCN with network-structure, how do these two subsidies affect the production, recycling, CO2e and profit distribution of the system? Which subsidy policy is more conducive to promoting CO2e reduction and waste product recycling?
However, the CO2e reduction subsidy policy and remanufacturing subsidy policy are both direct compensation methods for production enterprises. Although the benefits of these two direct subsidies are reducing the CO2e reduction investment and remanufacturing equipment procurement costs of enterprises by directly giving funds to target enterprises, these direct subsidies ignore the key members of reverse logistics (i.e., consumers). As the starting point of reverse logistics [3,14] and from the perspective of the “waste products → remanufactured products” logic of reverse logistics [5], improving consumers’ enthusiasm for recycling can increase the raw materials of reverse logistics (i.e., waste products). In reality, governments have also noticed this point and formulated consumer recycling subsidy policies. For example, the United States has formulated a subsidy policy of about USD 4000 for waste automobile recycling. China has promulgated the “Law on Promotion of Circular Economy”, which stipulates that the government provide a 10% subsidy to consumers who carry out the trade-in program behavior of products. In particular, scholars have also paid attention to the impact of consumer recycling subsidy policy on supply chain recycling and remanufacturing effects. Jena et al. [15] proved that the consumer recycling subsidy policy can reduce the negative utility of consumer recycling and improve the recycling rate of waste products to a certain extent in a simple-structure supply chain. However, Nagurney et al. [6] believed that the simple-structure supply chain is an ideal supply chain system, while the multi-level network-structure supply chain system is more realistic. Inspired by Nagurney et al. [6] and Jena et al. [15], we naturally think of another interesting scientific question: under the multi-level network-structure LC-CLSCN system, if the government subsidizes consumers, how does the change in subsidy level affect the LC-CLSCN system operation?
Therefore, based on the above analysis, although these three policies (i.e., CO2e reduction subsidy policy, remanufacturing subsidy policy and consumer recycling subsidy policy) are the government’s green behavior guidance policies for LC-CLSCN system members under the incentive mechanism, these three policies have certain differences in terms of internal logic. On one hand, the subsidy subjects are different. The CO2e reduction subsidy policy and remanufacturing subsidy policy belong to the direct subsidy for production enterprises [9], while the consumer recycling subsidy belongs to the indirect subsidy for consumers [15]. This heterogeneity of subsidy subjects will lead to a change in the subsidy effect. On the other hand, the relationship between subsidy policies and system operation decisions is different. Fu et al. [16] proved that for the multi-level network-structure supply chain, any small change in the system will change the behavior decisions and profit distribution of members. However, through sorting and analyzing the existing research, we find that the supply chain research considering subsidy policy includes two types. The first type is the research on the operation and subsidy policy of a supply chain system under a “one-to-one” simple structure, such as in Cao et al. [10] and Wan [17]. Obviously, this kind of research can only solve the operation problem of an idealized supply chain system [16]. However, due to the differences in the construction logic between the simple-structure supply chain decision model and the network-structure supply chain decision model, these conclusions are not applicable to the network-structure supply chain system. The other is the research on the operation and subsidy policy of the supply chain system under a “many-to-many” network-structure, such as in Diabat and Jebali [18]. However, there is a gap in this kind of research, that is, the operation of the LC-CLSCN under the simultaneous and separate existence of these three policies. Therefore, inspired by the above-mentioned factors, our research goal is to solve the impact of the CO2e reduction subsidy policy, remanufacturing subsidy policy and consumer recycling subsidy policy on the LC-CLSCN operation decision, and analyze the optimal subsidy policy selection strategies. Specifically, this paper addresses the following questions:
  • How do the CO2e reduction subsidy, remanufacturing subsidy and consumer recycling subsidy policies affect the production, recycling, CO2e reduction and profit distribution of the LC-CLSCN system?
  • When the three policies exist separately, which policy is more conducive to promoting the system’s forward and reverse product circulation, reducing CO2e and promoting the benefits of members and the system?
  • Under the coexistence of these three subsidy policies, which policy has a more significant impact on the LC-CLSCN system?
To address these questions, first, we choose the classic Nash non-cooperative game, variational inequality and spatial price equilibrium methods to construct the LC-CLSCN equilibrium model considering these three government policies. These methods have been widely recognized in the literature for solving the problem of competitive supply chain network equilibrium [6]. Second, in the process of developing the model, after setting the model assumptions and quantifying the subsidy policies’ parameters, we introduce these three subsidy policies into the profit maximization model of subsidized members (i.e., manufacturers and consumers). On this basis, applying variational inequality and Nash non-cooperative game [6,16], the LC-CLSCN equilibrium model under three subsidy policies is transformed into a solvable mathematical model. Finally, the modified projection algorithm is used to solve the model and obtain the LC-CLSCN equilibrium results. Through the comparative analysis of the equilibrium results, the impact of the changes in different subsidy parameters on production, CO2e, recycling and the profits of members and the system is given.
The research advantages and contributions are as follows: (1) This paper proposes a new perspective—CO2e reduction subsidy policy, remanufacturing subsidy policy and consumer recycling subsidy policy—to clarify the impact of government subsidy policies on the multi-dimensional equilibrium decisions of the LC-CLSCN system. This perspective is meaningful and has certain academic advantages. In terms of practical significance, the LC-CLSCN system under network-structure is more practical [6] and helps to provide guidance for the selection of government subsidy policies and the decision-making of members. In terms of theoretical significance, this research can supplement the research on the CLSCN operation decision under the coexistence of direct and indirect subsidy policies. This is because, on one hand, in the existing research on supply chain operation under direct/indirect subsidy policies, more scholars pay attention to the “one-to-one” simple-structure system (such as Cao et al. [9], Wang et al. [11] and Li et al. [19]), but this simplified supply chain structure cannot show the same level of the competition environment in the actual CLSCN system [6,13]. On the other hand, there are differences in modeling methods and logic between simple-structure and network-structure supply chain systems, that is, the simple-structure supply chain uses the Steinberg game and reverse recurrence method [20], and the supply chain network uses Nash non-cooperative game and variational inequality [5,12], which leads to the simple-structure supply chain operation results being not applicable to the network-structure situation. Therefore, this study can supplement the existing research and belongs to the theoretical exploration work of new problems and new models in the field of CLSCN research. (2) This paper constructs a new LC-CLSCN mathematical model considering three different government policies. This model can transform the multi-objective nonlinear programming problem with constraints into a variational inequality [5,12]. This model can clearly explain the multi-dimensional equilibrium decision of the network under the competition of members at the same level and can also describe the impact of the government subsidy policies on the network equilibrium results. In addition, the results obtained by the model also have the characteristics of uniqueness and optimality. Therefore, the model built in this paper has a certain popularization and practicability and also helps to provide model construction ideas for the CLSCN equilibrium model under other subsidy policies. (3) This paper gives the impact of subsidy policies on the production, recycling, remanufacturing, profit distribution and CO2e reduction in the LC-CLSCN system. Through the research results, we found the differences in the impact of different subsidy policies on the system and also gave the government’s optimal subsidy policy selection strategies. The research conclusion can also provide support and help for the selection of government subsidy policy.
Our paper is structured as follows. The second part is a literature review, while the third part provides the problem description and model assumptions. The fourth step involves the construction of the LC-CLSCN equilibrium model, and the fifth gives numerical examples. The sixth part includes discussion, implication and management enlightenment, and finally, the last section proposes conclusions and future research directions.

2. Literature Review

There are three research streams related to this research: the decision of CLSCN, low-carbon/sustainable CLSC under government intervention and LC-CLSCN equilibrium under government intervention.

2.1. The Decision of CLSCN

This stream mainly focuses on the supply chain system under the “many-to-many” network-structure and studies the system operation in different situations. Through the collation and analysis of the literature, this stream is mainly divided into two categories. The first is multi-objective optimization without considering the game situation. These studies usually aim to maximize the overall profit and minimize the overall cost of the system, build a multi-objective decision optimization model and achieve Pareto optimization by solving the model, such as in Diabat and Jebali [18] and Salehi-Amiri et al. [21]. However, this kind of research can only solve the problem of optimal operation of the whole system and cannot achieve the optimal decision of each member [22,23].
The second category of research makes up for this shortcoming. These studies achieve the equilibrium optimization of the CLSCN systems by building and solving CLSCN equilibrium models, which is also consistent with our model construction logic. Therefore, we will focus on reviewing this category of research. The earliest research on the CLSCN equilibrium problem originated from Hammond and Beullens [22], who extended the forward supply chain network equilibrium model to the CLSCN equilibrium model considering reverse logistics based on the research of Nagurney et al. [6]. Their research lays the foundation for the research of CLSCN operation. Later, many scholars took the CLSCNs as the research object and studied the production, remanufacturing and profit distribution problems of CLSCNs from the perspective of technology investment [24], service level [25] and damage level of returned products [26]. These studies aim at maximizing the profits of members and use variational inequality to construct network equilibrium models in different situations. However, it is noteworthy that the above research studies the CLSCN operation from the perspective of the internal behavior of the system. From the perspective of government intervention, Diabat and Jebali [18] discovered that regulatory policy can upgrade the reverse network system’s service level. In contrast, considering the government subsidy policy, existing research includes subsidy and reward-penalty policies. Considering the recycling subsidies for enterprises and consumers, a network equilibrium problem was discussed by Jena et al. [15], who found that implementing recycling subsidies for manufacturers was more conducive to the profitability of the system. From the perspective of reward-penalty policy, Chen and Ulya [27] studied the recycling decisions of a CLSC network. Finally, they proved that a reward-penalty policy can more effectively promote the green efforts of manufacturers. It is worth noting that in addition to recycling and remanufacturing, low-carbon behavior is also a key factor to measure the sustainable operation of the system [5]. However, the CLSCN system involved in the above-mentioned research only includes the recycling and remanufacturing environmental protection process. On the contrary, we focus not only on the recycling and remanufacturing process, but also on the CO2e reduction process, and discuss the production, recycling, remanufacturing and CO2e of the LC-CLSCN system.

2.2. LC-CLSC and Sustainable CLSC Operations Considering Government Policy

This stream is the operation of the LC-CLSC and sustainable supply chain under government intervention. Although the simple-structure supply chain system is an ideal supply chain [23], this stream is one of the important branches in the literature on supply chain operation. This is because supply chain research includes many directions, such as healthcare supply chain [28], agricultural product supply chain [29] and industrial manufacturing supply chain [30]. Therefore, based on our research objectives, here we mainly discuss the operation of the industrial manufacturing low-carbon/sustainable supply chain under government intervention. Scholars of this type of research believed that enterprises’ investment in CO2e reduction technologies and the adoption of green technologies can help reduce the negative environmental effects of large-scale CO2e [31]. Dey et al. [32] found that manufacturing enterprises’ green technology investment can reduce CO2e by 2.81%. Through sorting out the existing research, scholars found that government CO2e intervention can achieve CO2e reduction, and they studied the operation of the low-carbon CLSC from the perspective of government regulation [4], government subsidy [33] and taxation [34]. Specifically, this type of research can be divided into two categories. The first category considers a single policy. For example, considering subsidy policy, a recycling decision model of an LC-CLSC system was established by Wang et al. [11], who proved that government subsidy policy can improve the operating efficiency of the system. Under government regulation policy, Xia et al. [35] developed a low-carbon CLSC operation decision model under CO2e limit policy and found that CO2e restriction can effectively promote CO2e reduction behavior of enterprises. Considering CO2e tax policy, Luo et al. [34] and Shu et al. [36] explored the influence of CO2e tax on the CLSC decisions. They found that an appropriate CO2e tax level can inhibit CO2e and increase enterprises’ profits. Taking an automobile CLSC as their research case, under the assumption of manufacturer’s CO2e reduction, Fander and Yaghoubi [37] established an automobile CLSC decision model and found that government technology intervention can effectively promote the fuel-saving technology investment of automobile manufacturers. Similarly, taking a new CLSC energy vehicle as an example, Zhao et al. [38] designed a CLSC energy vehicle profit distribution model that considers financial subsidies for different members. The other category is considering double/multiple subsidy policies. Zhang and Yu [39] introduced CO2e reduction subsidy and recycling subsidy policies into an LC-CLSC and studied the coordination mechanism of the system. From the perspective of CO2e tax and recycling subsidy policies, the operation and performance allocation of an LC-CLSC was discussed by Xu et al. [20], who found that these two policies have opposite effects on a manufacturer’s CO2e. To explore the impact of CO2e reduction subsidies and tax policies on the CLSC, Wan [17] established an LC-CLSC decision model and found that the CO2e reduction subsidy policy is more favorable for promoting market demand, increasing environmental benefits and members’ profits.
With the continuous deepening of sustainable concepts, the supply chain system has begun to consider how to seek social welfare while considering economic interests; that is, the sustainable operation of the system needs to consider the social, economic and environmental dimensions at the same time [40]. Awan et al. [41] proved that sustainable business models are crucial to the green development of the global economy after sorting out and analyzing 912 documents. In recent years, the study of three-dimensional (i.e., economic, environmental and social) sustainable supply chain management has become a hot topic in the academic field. Song et al. [42] studied a sustainable CLSC decision under corporate social responsibility (CSR) investment and government subsidy policy. They found that, regardless of the level of government subsidy, the manufacturer’s CSR is more effective in promoting social welfare. Considering retailers’ CSR investment, Mondal et al. [43] established a sustainable CLSC system and studied the impact of government subsidy and CSR investment levels on social welfare and profits. To compare the effects of a reward-penalty policy and tax subsidy policy, Mondal and Giri [44] introduced government tax and reward-penalty policies into a sustainable CLSC and proved that the consumer subsidy policy can improve the sustainable triple bottom line. Taking aluminate batteries as an example, Johari and Hosseini-Motlagh [45] studied the recycling rate, social welfare, consumer surplus, profit and coordination mechanism of a sustainable CLSC that considers a government’s mandatory battery recycling policy. From the perspective of the government’s CO2e constraint policy, a sustainable CSR CLSC with CO2e constraint was discussed by Shu et al. [46], who found that when the government adopts a reasonable CO2e policy, CSR behavior is not only conducive to improving social welfare but also conducive to reducing CO2e. However, the above studies all focused on the production, recycling and CO2e reduction of CLSCs under a simple structure. Therefore, in the next stream, scholars supplement the idealization/simplification defects in the “one-to-one” simple-structure supply chain system, that is, they study the “many-to-many” network-structure system. Therefore, we will focus on LC-CLSCN operation under government intervention.

2.3. The Operation of LC-CLSCN Considering Government Policy

The third stream is the LC-CLSCN operation research considering government intervention. This stream complements the idealization/simplification decision problem of the simple-structured supply chain and can solve the operation decision problems of a competitive supply chain under a multi-level network structure. Existing research falls into two categories. The first category considers the operation of LC-CLSCN under a single policy and analyzes the impact of changes in policy level on the CO2e, recycling rate and profit distribution of the system. Research perspectives mainly include carbon tax [47], carbon trading [13] and government subsidy [15]. Specifically, Cheng et al. [5] developed a CLSCN operation under the CO2e tax policy. They discovered that CO2e tax can reduce the CO2e of manufacturers. From the perspective of CO2e trading policy, Zhang et al. [48] focused on a CLSC network comprising suppliers, high-CO2e manufacturers, low-CO2e manufacturers, markets and carbon trading centers. They designed an LC-CLSCN equilibrium model and proved that the government’s CO2e reduction target is consistent with the profit goals of enterprises. Considering the government’s green technology investment subsidy policy, using variational inequality, the LC-CLSCN equilibrium model was established by Wu et al. [24], who found that subsidy policy can boost enterprises’ green behaviors. For the sustainable CLSC network structure, Cheng et al. [49] studied a network equilibrium problem under the government’s CO2e license policy. They found that CO2e limit policy can effectively control manufacturers’ CO2e.
The second category considers government dual/multiple policies. Considering CO2e limitation and trade control policies, an LC-CLSCN operation under different recycling structures was developed by Wang and Shao [50], who found that the manufacturer recycling structure is better and the government low carbon policy can effectively reduce the CO2e of production enterprises. Considering CO2e tax and pollution tax policies, Allevi et al. [51] studied the equilibrium problem of an LC-CLSCN system composed of suppliers, manufacturers, consumers and recyclers. They found that compared with the CO2e tax imposed on other members, the CO2e tax imposed on transport members is more conducive to reducing the costs of producers. Considering recycling subsidy and CO2e constraint policies, Tao et al. [52] constructed a network equilibrium model using variational inequality and found that for any given CO2e constraint, the recycling subsidy level has a positive effect on increasing recycling efficiency. Using the same model construction method as Tao et al. [52], an LC-CLSCN equilibrium model considering tariff/quota and subsidy policies was developed by Feng et al. [23], who also obtained the impact of policy changes on LC-CLSCN equilibrium results through numerical examples. Through the analysis of the above documents, we can find that no matter what policies the government implements, these policies can reduce the CO2e of the LC-CLSCN system to a certain extent. In particular, to compare subsidy and regulatory policies, Bian and Xuan [53] compared CO2e reduction subsidy and CO2e tax policies and found that CO2e reduction policy can better motivate the green behaviors of manufacturers. The above scholars introduced government policies as exogenous parameters into the network equilibrium models according to their different government policies; that is, they applied the Nash game theory and variational inequality to build LC-CLSCN equilibrium models considering government policies. By solving these network equilibrium models, the influence of different policies on system operation decisions is obtained. From the perspective of research methods, the model construction methods in this paper are similar to the above methods. However, the difference is that we find a research gap from the above documents, that is, combining the three green processes of LC-CLSCN (i.e., low-carbon production, recycling and remanufacturing), introducing policy subsidy policies from the perspective of these three processes, and exploring the best subsidy policy selection strategy of the system.

2.4. Research Gaps

In summary, the following are the research gaps. (1) In the existing research on the CLSC network equilibrium, scholars focused mainly on the CLSC network system that considers product recycling and remanufacturing processes. And more, they measured the green and sustainable development of the CLSC network by recycling and remanufacturing efficiency. However, CO2e reduction is the key sector for the CLSC network’s green operation. This kind of research did not study the production and CO2e reduction of CLSC networks. (2) In the research into the low-carbon CLSC under simple-structure, most scholars assumed that the government implements a remanufacturing subsidy policy, consumer recycling subsidy policy and CO2e reduction subsidy policy. They assume that these subsidy policies in the system exist alone or in pairs. However, the research on the supply chain system with simple-structure can only solve the idealized supply chain operation problem, which cannot solve the problem of supply chain network operation in which members at the same level compete with each other. (3) In existing research on CLSC network equilibrium, scholars have discussed the multi-dimensional equilibrium decision problem from the perspective of CO2e tax, pollution and recycling subsidy policies. This kind of research provides research ideas for our work. However, their research conclusions do not apply to our model results. This is because different subsidy policies are different in the process of model description and solution. In addition, as the key processes of CLSCN (i.e., recycling, CO2e reduction and remanufacturing), from the perspective of these process subsidy policies—remanufacturing subsidy, consumer recycling subsidy and CO2e subsidy—studies studying the production, recycling, CO2e subsidy and profit distribution problems of the LC-CLSCN have been scarce.
Specifically, a detailed comparison between this paper and the main related literature is shown in Table 1. Therefore, according to the research gaps, this paper studies the LC-CLSCN operation decision problem from the remanufacturing subsidy policy, consumer recycling subsidy policy and CO2e subsidy policy perspectives, which supplements the literature on LC-CLSCN operation under subsidy policy.

3. Problem Description and Assumptions

This study considers the LC-CLSCN system composed of M manufacturers (m denotes a typical manufacturer, m = 1 , 2 , , M ), S retailers (s denotes a typical retailer, s = 1 , 2 , , S ) and D markets (d denotes a typical market, d = 1 , 2 , , D ). Referring to the assumptions of Nagurney et al. [12] and Allevi et al. [51] on the risk appetite and information relationship of members, we assume that all members of the LC-CLSCN are risk-neutral and the information among members is completely symmetrical. In this LC-CLSCN, manufacturers use raw materials to produce new products; simultaneously, manufacturers use recycled waste products for remanufacturing, and these waste products are recycled from markets. The production of new and remanufactured products generates a certain amount of CO2e. According to Ding et al. [56], this paper assumes that remanufacturing a unit waste product generates less CO2e than producing a new product.
Furthermore, to better promote a green economy, in addition to considering manufacturers’ recycling and remanufacturing behaviors, this paper also considers the CO2e reduction behavior of manufacturers and introduces the CO2e reduction decision into the decision objectives of each manufacturer. In particular, to prove the regulatory and intermediary roles of government subsidy policies on the sustainable operation of the LC-CLSCN system, this study considers three subsidy policies (i.e., CO2e reduction subsidy policy, consumer recycling subsidy policy and remanufacturing subsidy policy) and analyzes the impact of these three policies on production, recycling, CO2e reduction and profit distribution of the LC-CLSCN system. Figure 1 shows the LC-CLSCN structure of this study.
The model assumptions underlying this study are as follows:
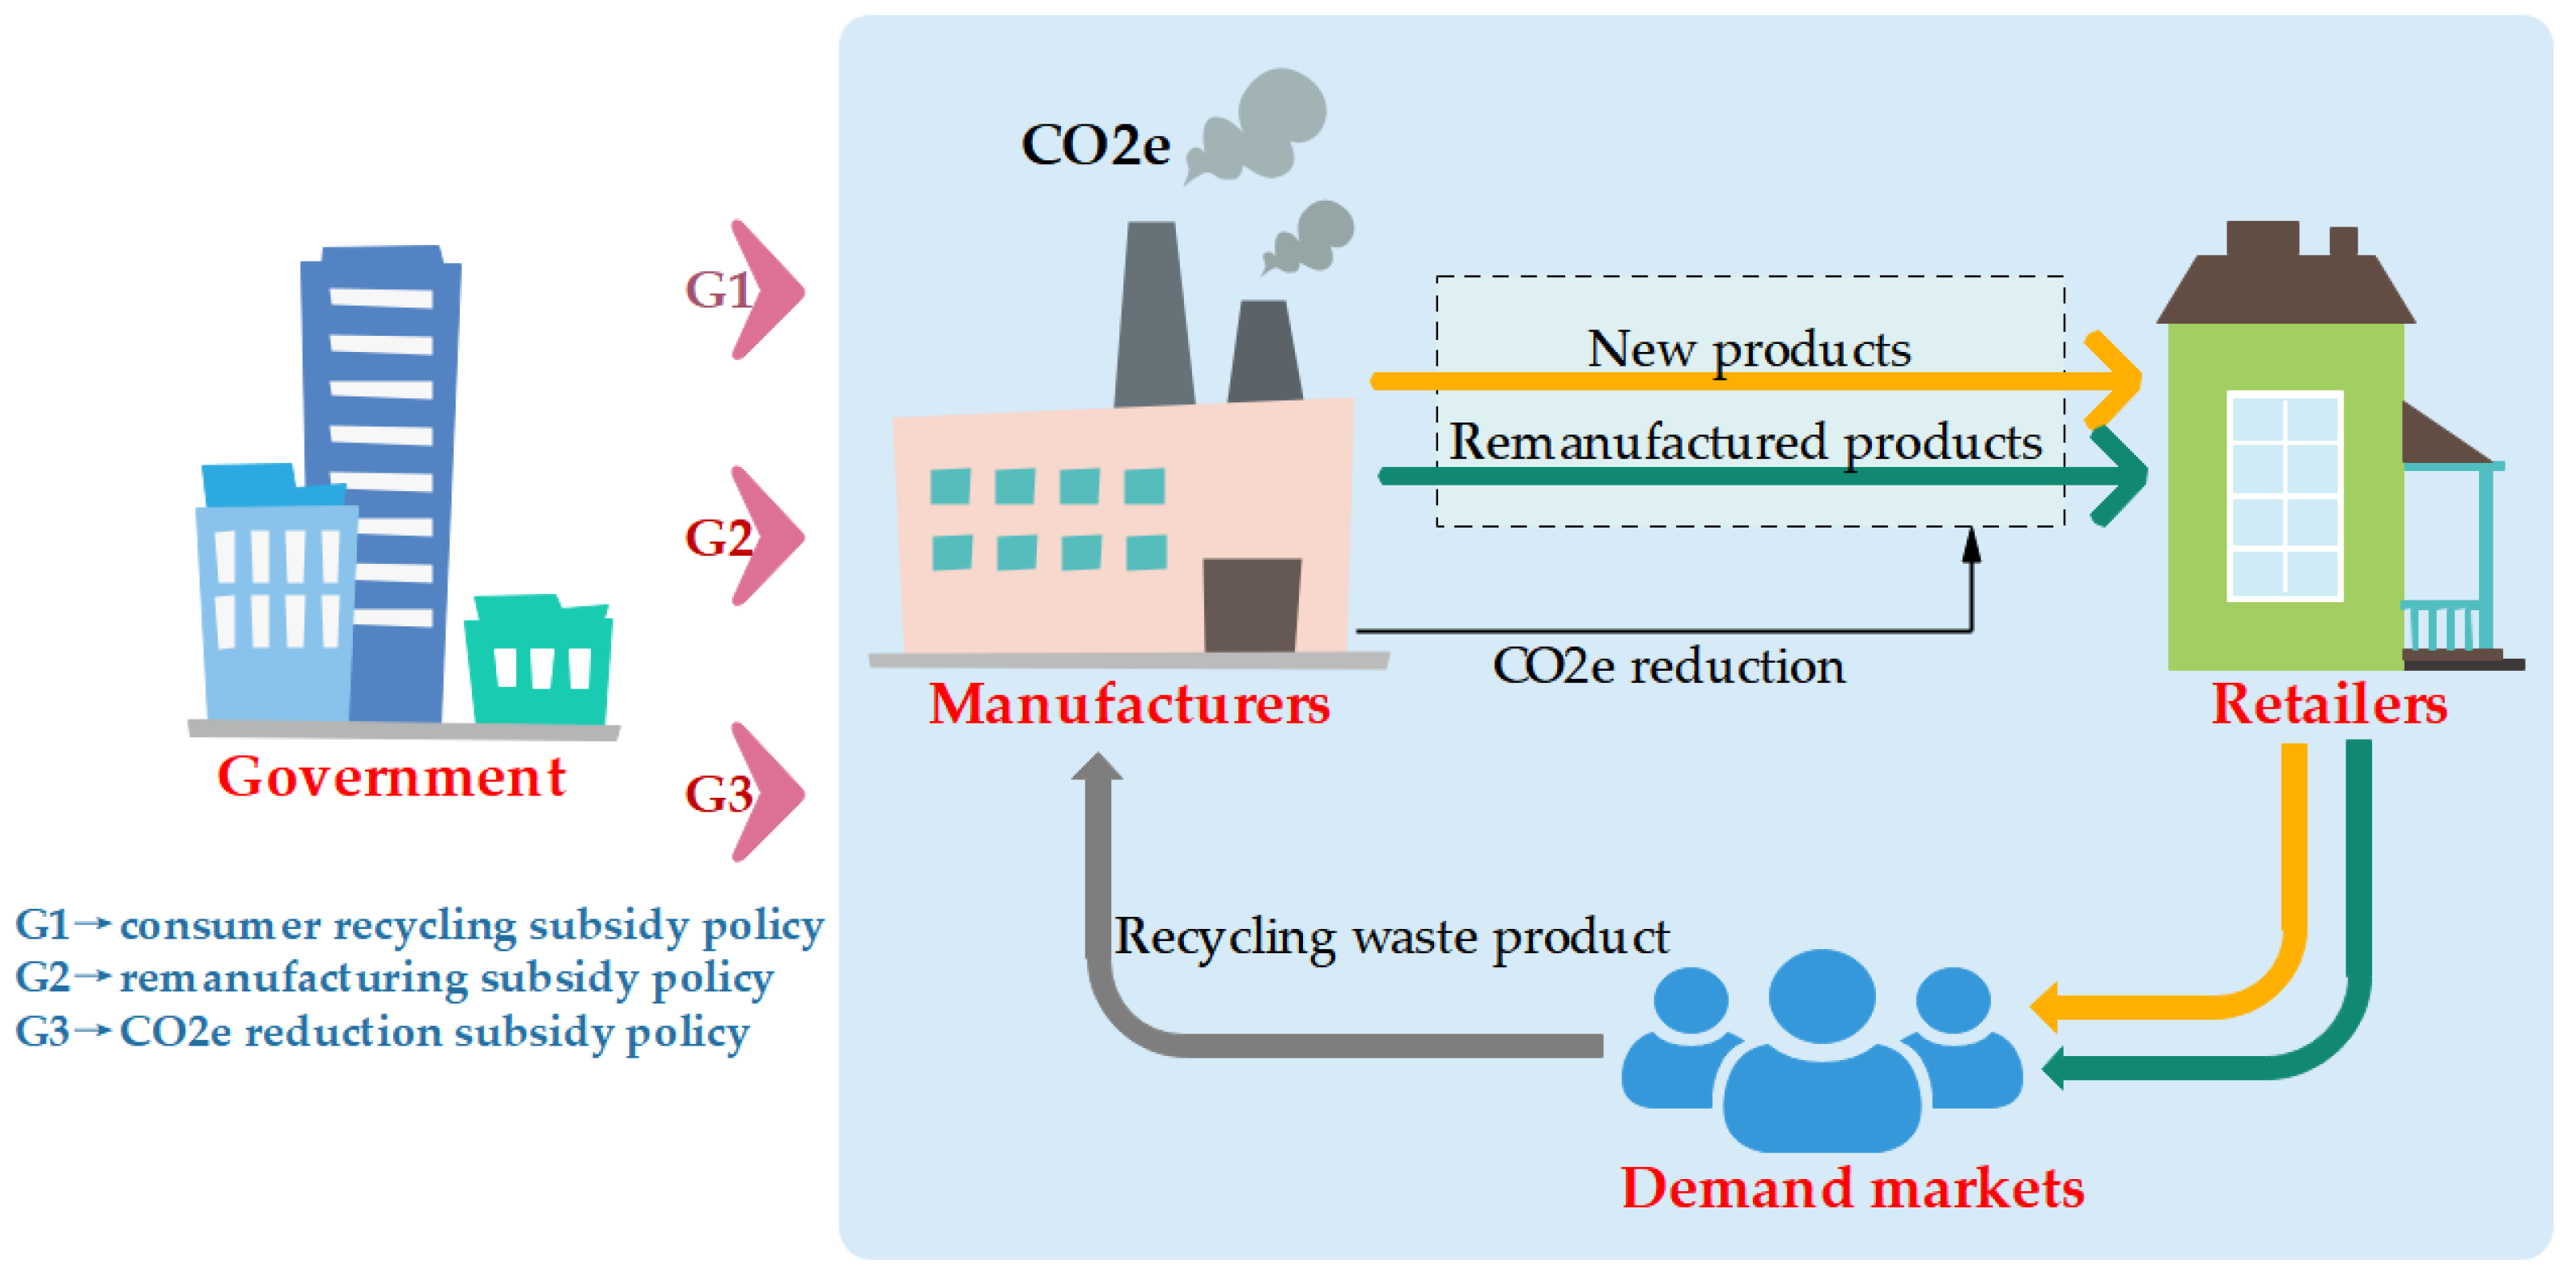
  • According to the research objective, to ensure the rationality of the model, we assume that the baseline CO2e per unit of a new product is e m and the baseline CO2e per unit of a remanufactured product is r e m , where r   ( 0 < r < 1 ) is the CO2e reduction coefficient of remanufactured products. To reduce CO2e, we assume that manufacturers implement CO2e reduction. According to Wang and Wu [4], we assume that α e 2 / 2 is the CO2e reduction cost of a manufacturer, where α   ( α > 0 ) is the CO2e reduction cost coefficient and e   ( e > 0 ) is the CO2e reduction per unit product (CO2e reduction level). After the manufacturer reduces CO2e, the CO2e per unit of new product is e m e , and the CO2e per unit of remanufactured product is r   ( e m e ) .
  • Under the remanufacturing subsidy policy, consumer recycling subsidy policy and CO2e reduction subsidy policies, this paper provides a new assumption that there are different subsidy environments in the supply chain system, that is, the government can implement these three policies separately or simultaneously. In the remanufacturing subsidy policy, the government offers a unit of remanufactured product subsidy β m to manufacturers. Regarding the consumer recycling subsidy policy, the government provides a unit recycling subsidy β d to consumers. Under the CO2e reduction subsidy policy, the government provides a unit CO2e reduction subsidy θ to manufacturers.
  • This study adopts a single-period model; that is, members are in a stable and mature period. During this period, prices, market demand and recycling rate are relatively stable. Therefore, it is assumed that all recycled waste products are used for remanufacturing, and consumers can distinguish between new products and remanufactured products. Many studies have made similar assumptions, such as Hammond and Beullens [22] and Chang et al. [57].
  • To better analyze the impact of three subsidy policies on manufacturers’ CO2e reduction. This study only considers CO2e in the process of product production and remanufacturing and does not consider CO2e in the process of recycling and marketing. Many studies also made a similar model assumption, such as Zhang et al. [14], Luo et al. [34] and Tao et al. [52].
  • In the LC-CLSC network, all members are rational persons whose decision goal is to maximize their economic interests [22]. According to Hammond and Beullens [22] and Chang et al. [57], we assume that all members’ functions are continuously differentiable convex functions.
Other symbols and their descriptions in the text are shown in Table 2.

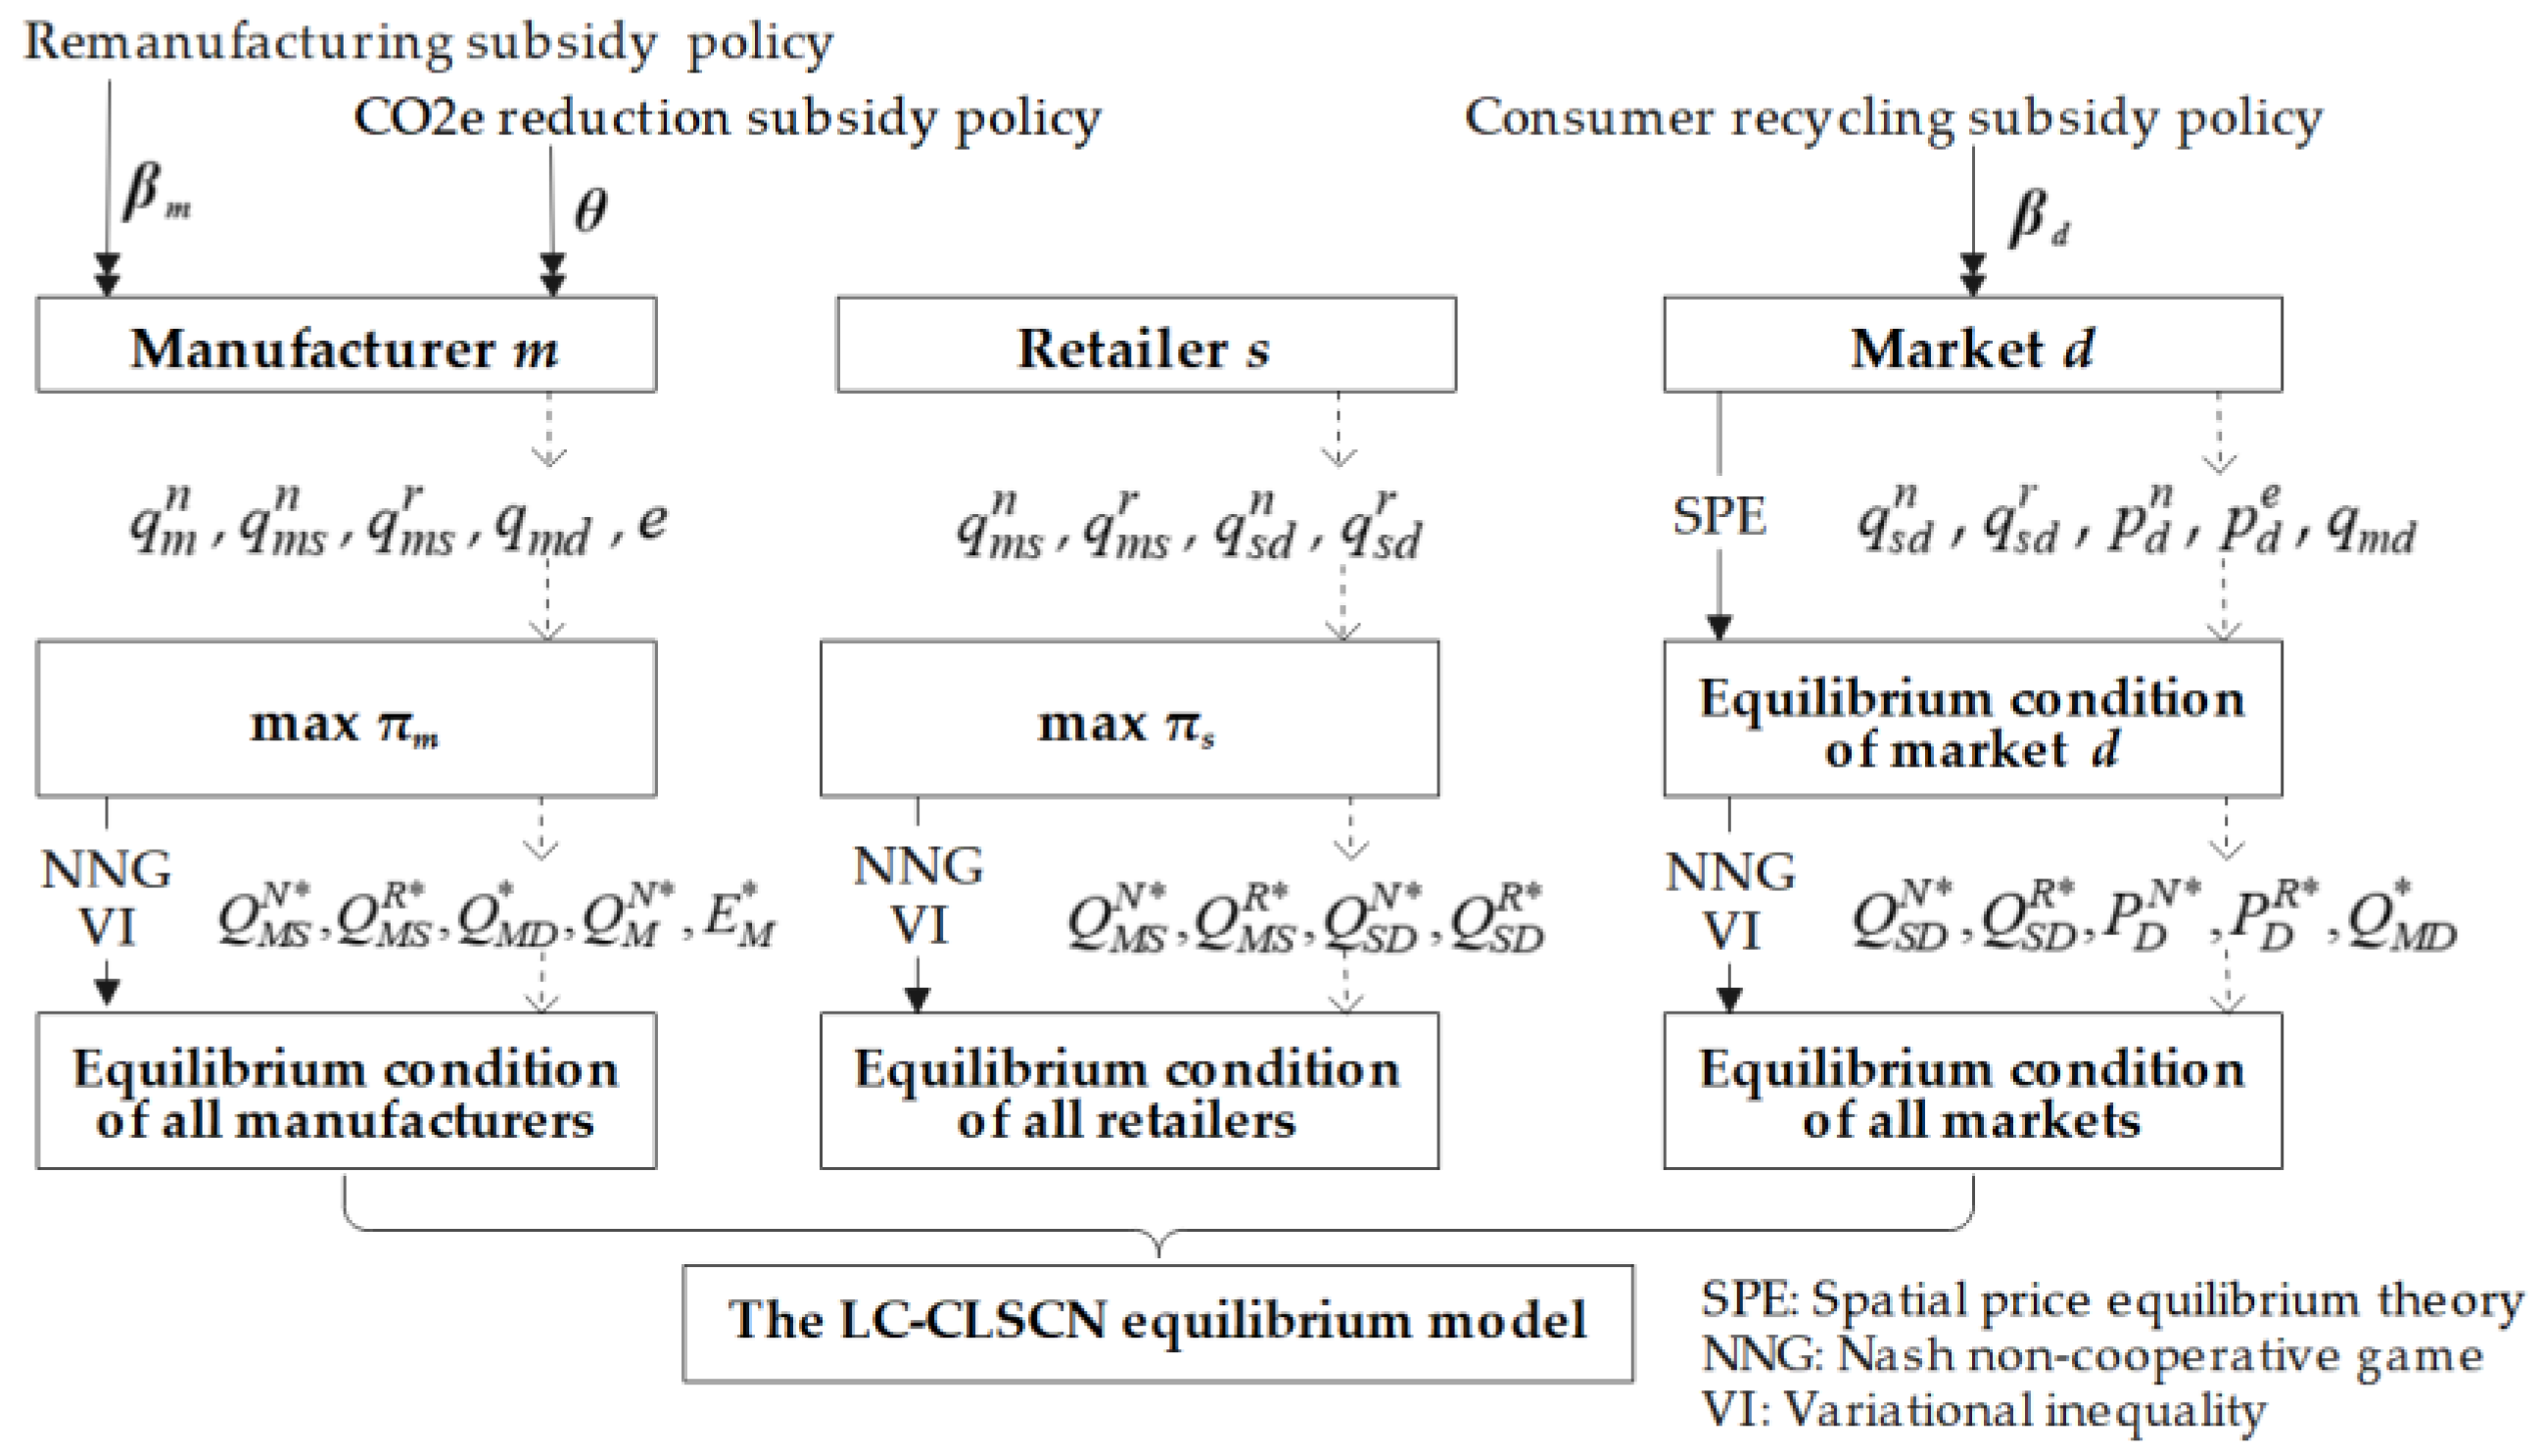
4. Research Method and Mathematical Model Formulation

4.1. Research Method

In this part, we introduce the model construction methods and ideas to prove the rationality of the LC-CLSCN model in this paper. For the research methods to solve the network equilibrium problem, referring to the research of Nagurney et al. [6], Hammond and Beullens [22] and Zhang et al. [48], this paper uses Nash non-cooperative game theory, spatial price equilibrium theory and the variational inequality method to build a mathematical model. The rationality of adopting these research methods lies in that there are complex interactions among members in the competitive supply chain network system (i.e., members at the same level compete with each other, and members at the upper and lower levels trade/cooperate with each other) [51], while the game theory and reverse recurrence method used in the simple-structure supply chain modeling are not applicable to the competitive supply chain network structure system [12,52]. The advantage of the research methods used in this paper is that the Nash non-cooperative game can quantify and describe the competition among members in the LC-CLSCN system. When members reach the Nash equilibrium, the system can maintain a relatively stable optimal state [6]. In addition, variational inequality can be used to describe the multi-member interactive decision-making problem; that is, the multi-member interactive decision-making problem is transformed into a solvable variational inequality equation. Through the solution of the variational inequality equation, the multidimensional equilibrium decision of the network system can be obtained. In particular, using variational inequality and the Nash non-cooperative game to solve supply chain network equilibrium problems has been widely used in academia, such as the research of Feng et al. [23], Allevi et al. [51], Tao et al. [52] and Candogan et al. [58].
In the mathematical model of this paper, according to the model assumptions in the previous section, using the Nash non-cooperative game, variational inequality and spatial price equilibrium, this paper develops an LC-CLSCN model considering three subsidy policies (i.e., CO2e reduction subsidy policy, remanufacturing subsidy policy and consumer recycling subsidy policy). The building logic and methods of the mathematical model are shown in Figure 2. Specifically, first, we establish the decision objectives, behaviors, costs, benefits and constraints of the production-level members (i.e., manufacturers). According to the benefit-cost logic [52], the profit maximization function model of manufacturer m is established. In this function model, we also introduce CO2e reduction cost, remanufacturing cost, government’s CO2e reduction and remanufacturing subsidies. Using variational inequality and the Nash non-cooperative game, we transform the profit maximization problem of all competing manufacturers into a variational inequality equation. The model construction idea of retailers is similar to that of manufacturers. Second, we analyze the behaviors, decisions and costs of the demand-level members. According to the theory of spatial price equilibrium [6], the conditions that the equilibrium state of the market level needs to meet are designed. In market-level equilibrium conditions, we also introduce a consumer recycling subsidy and the transaction cost of consumers. Additionally, considering the characteristics of the LC-CLSCN system, the constraint conditions that the market level needs to satisfy (i.e., recycling volume constraint and recycling price constraint) are defined. On the basis of the above conditions, using variational inequality, the Nash non-cooperative game and complementarity theory, we transform the optimal behavior of demands under consumer recycling subsidy into a variational inequality problem. Finally, according to the network equilibrium theory [6], the LC-CLSCN equilibrium model considering three subsidy policies is given. In particular, through the research of Zhang et al. [48] and Candogan et al. [58], the equilibrium results obtained by solving the LC-CLSCN equilibrium model have the characteristics of existence, uniqueness and optimality. Therefore, in the next part of this section, we will construct the optimal behavior and equilibrium state of members, and then give the LC-CLSCN equilibrium model considering three subsidy policies.

4.2. Mathematical Model Formulation

4.2.1. Manufacturers

The decisions of the manufacturer m consist of the number of new products produced, the number of new and remanufactured products wholesaled to retailer s, the number of waste products recycled from market d and the CO2e reduction level; that is, the manufacturer m decides q m n , q m s n , q m s r , q m d and e . According to assumption three, the number of remanufactured products made by manufacturer m is σ h d = 1 D q m d . According to assumption one, the CO2e generated by the manufacturer is σ h r ( e m e ) d = 1 D q m d + q m n ( e m e ) . Additionally, according to assumption two, the remanufacturing subsidy that manufacturer m can obtain is β m σ h d = 1 D q m d , and the CO2e reduction subsidy that manufacturer m can obtain is θ [ e q m n + r e σ h d = 1 D q m d ] . The decision goal of manufacturer m is to maximize profits. The total revenue of manufacturer m is the sum of wholesale revenue of products, government CO2e reduction subsidies and remanufacturing subsidies (i.e., s = 1 S ( q m s n p m s n + q m s r p m s r ) + θ [ e q m n + r e σ h d = 1 D q m d ] + β m σ h d = 1 D q m d ). The total cost of manufacturer m consists of transaction cost s = 1 S c m s m ( q m s n , q m s r ) , CO2e reduction cost α e 2 / 2 , recycling cost d = 1 D q m d p m d and production cost  f m n ( Q m n ) + f m r ( σ r , q m d ) . Therefore, according to the benefit-cost logic, the decision objective function of manufacturer m is the following.
max π m = s = 1 S q m s n p m s n * + s = 1 S q m s r p m s r * d = 1 D q m d p m d * + θ [ e q m n + r e σ h d = 1 D q m d ] + β m σ h d = 1 D q m d s = 1 S c m s m ( q m s n , q m s r ) f m n ( Q m n ) f m r ( σ r , q m d ) α e 2 / 2
s . t .   s = 1 S q m s n q m n
s = 1 S q m s r σ h d = 1 D q m d
Equations (2) and (3) indicate that the number of new/remanufactured products traded is not higher than that of new/remanufactured products made from raw/waste materials. According to Feng et al. [23], in this study, λ 1 and λ 2 are set as Lagrange multipliers in Equations (2) and (3), Λ M 1 = ( ( λ 1 ) M × 1 ) R + M , Λ M 2 = ( ( λ 2 ) M × 1 ) R + M . According to the Nash non-cooperative game [49], the profit maximization equilibrium condition of all manufacturers is equivalent to the following variational inequality [23,51], determining ( Q M S N * , Q M S R * , Q M D * , Q M N * , E M * , Λ M 1 * , Λ M 2 * ) Ω M such that the following is true.
m = 1 M s = 1 S [ p m s n * + c m s m ( q m s n , q m s r ) q m s n + λ 1 ] × [ q m s n q m s n * ] + m = 1 M [ θ e + f m n ( Q m n ) q m n λ 1 ] × [ q m n q m n * ] + m = 1 M s = 1 S [ p m s r * + c m s m ( q m s n , q m s r ) q m s r + λ 2 ] × [ q m s r q m s r * ] + m = 1 M [ θ q m n r σ h d = 1 D q m d + α e * ] × [ e e * ] + m = 1 M d = 1 D [ p m d * θ r e σ h β m σ h + f m r ( σ r , q m d ) q m d λ 2 σ h ] × [ q m d q m d * ] + m = 1 M [ q m n s = 1 S q m s n ] × [ λ 1 λ 1 * ] + m = 1 M [ σ h d = 1 D q m d s = 1 S q m s r ] × [ λ 2 λ 2 * ] 0 ( Q M S N , Q M S R , Q M D , Q M N , E M , Λ M 1 , Λ M 2 ) Ω M , Ω M = R + M ( 4 + 2 S + D )
Using the complementarity theory and the equivalence of variational inequality [14,16], through the first and second terms of Equation (4), we gain p m s n * = c m s m ( q m s n , q m s r ) / q m s n + λ 1 and  p m s r * = c m s m ( q m s n , q m s r ) / q m s r + λ 2 . Through the fifth and sixth terms in Equation (4), we can find λ 2 = [ p m d * θ r e σ h β m σ h + f m r ( σ r , q m d ) / q m d ] / σ h and λ 1 = f m n ( Q m n ) / q m n θ e . Subsequently, by combining these, it is easy to obtain p m s n * = c m s m ( q m s n , q m s r ) / q m s n + f m n ( Q m n ) / q m n θ e and p m s r * = c m s m ( q m s n , q m s r ) / q m s r + [ p m d * θ r e σ h β m σ h + f m r ( σ r , q m d ) / q m d ] / σ h . Therefore, it can be seen that the price of new and remanufactured products is affected by the CO2e reduction subsidy level θ . An increase in β m can reduce remanufactured products’ price.
In addition, through the fifth term of Equation (4), p m d * = θ r e σ h + λ 2 σ h f m r ( σ r , q m d ) / q m d + β m σ h can be obtained. Therefore, if the number of waste products recycled by manufacturer m is positive (i.e., q m d * > 0 ), the recycling price p m d * is determined by θ r e σ h + β m σ h + λ 2 σ h f m r ( σ r , q m d ) / q m d ; that is, the recycling price is positively correlated with θ and β m , which indicates that the CO2e reduction subsidy and remanufacturing subsidy policies can help increase the transaction price of waste products.

4.2.2. Retailers

The decisions of retailer s are the wholesale and sales volume of new products and remanufactured products; that is, the retailer s decides q m s n , q m s r , q s d n and q s d r . The retailer’s revenue is the sales revenue of products; that is, the total revenue of retailer s is d = 1 D ( q s d n p s d n + q s d r p s d r ) . At the same time, the retailer also needs to consider the transaction cost with other members [ m = 1 M c m s s ( q m s n , q m s r ) + d = 1 D c s d s ( q s d n , q s d r ) ] and the wholesale cost of products m = 1 M ( q m s n p m s n + q m s r p m s r ) . Therefore, according to the benefit-cost logic, the decision objective function of retailer s is the following.
max π s = d = 1 D q s d n p s d n * + d = 1 D q s d r p s d r * m = 1 M c m s s ( q m s n , q m s r ) m = 1 M q m s n p m s n * m = 1 M q m s r p m s r * d = 1 D c s d s ( q s d n , q s d r )
s . t .   d = 1 D q s d n m = 1 M q m s n
d = 1 D q s d r m = 1 M q m s r
Equations (6) and (7) represent that the number of new/remanufactured products sold is not higher than that of new/remanufactured products wholesaled from manufacturers. We set λ 3 and λ 4 as the Lagrange multipliers in Equations (6) and (7), Λ S 3 = ( ( λ 3 ) S × 1 ) R + S , Λ S 4 = ( ( λ 4 ) S × 1 ) R + S . Therefore, the profit maximization equilibrium state of retailers can be transformed by the following variational inequality [12,23], determining ( Q M S N * , Q M S R * , Q S D N * , Q S D R * , Λ S 3 * , Λ S 4 * ) Ω S such that the following is true.
m = 1 M s = 1 S [ c m s s ( q m s n , q m s r ) q m s n + p m s n * λ 3 * ] × [ q m s n q m s n * ] + m = 1 M s = 1 S [ c m s s ( q m s n , q m s r ) q m s r + p m s r * λ 4 * ] × [ q m s r q m s r * ] + d = 1 D s = 1 S [ c s d s ( q s d n , q s d r ) q s d n p s d n * + λ 3 * ] × [ q s d n q s d n * ] + d = 1 D s = 1 S [ c s d s ( q s d n , q s d r ) q s d r p s d r * + λ 4 * ] × [ q s d r q s d r * ] + s = 1 S [ m = 1 M q m s n d = 1 D q s d n ] × [ λ 3 λ 3 * ] + s = 1 S [ m = 1 M q m s r d = 1 D q s d r ] × [ λ 4 λ 4 * ] 0 ( Q M S N * , Q M S R * , Q S D N * , Q S D R * , Λ S 3 * , Λ S 4 * ) Ω S , Ω S = R + 2 S ( M + D + 2 )
Under the equilibrium state, through the first and second terms of Equation (8), we obtain p s d n * = c s d s ( q s d n , q s d r ) / q s d n + λ 3 * and p s d r * = c s d s ( q s d n , q s d r ) / q s d r + λ 4 * . Through the third and fourth terms of Equation (8), λ 3 * = c m s s ( q m s n , q m s r ) / q m s n + p m s n * and λ 4 * = p m s r * + c m s s ( q m s n , q m s r ) / q m s r can be obtained. Then, through merging and sorting, p s d n * = c s d s ( q s d n , q s d r ) / q s d n + c m s s ( q m s n , q m s r ) / q m s n + p m s n * and p s d r * = c s d s ( q s d n , q s d r ) / q s d r + c m s s ( q m s n , q m s r ) / q m s r can be achieved. This proves that if the number of two types of products sold by retailer s to market d is greater than zero (i.e., q s d n * > 0 , q s d r * > 0 ), new product retail price  p s d n * is determined by c s d s ( q s d n , q s d r ) / q s d n + p m s n * + c m s s ( q m s n , q m s r ) / q m s n and remanufactured product retail price p s d r * is determined by c s d s ( q s d n , q s d r ) / q s d r + c m s s ( q m s n , q m s r ) / q m s r + p m s r * . The above conclusions indicate that two types of products’ retail prices are positively correlated with their wholesale prices. From Equation (8), we have discovered that the CO2e reduction subsidy and remanufacturing subsidy policies help reduce two types of products’ wholesale prices. Therefore, according to price conductivity theory [14,59], the CO2e reduction subsidy and remanufacturing subsidy policies help to reduce products’ retail prices.

4.2.3. Markets

In market d, consumers can buy new or remanufactured products from retailers; however, when they purchase products, they also need to pay transaction costs, such as transportation, time and physical costs [14]. Therefore, for new products, using spatial price equilibrium theory, the equilibrium conditions of market d are shown in Equations (9) and (10) [16].
c d s n ( q s d n * ) + p s d n * = p d n * , q s d n * > 0 p d n * , q s d n * = 0
q d n ( p d n * ) = s = 1 S q s d n * , p d n * > 0 s = 1 S q s d n * , p d n * = 0
For remanufactured products, the equilibrium conditions of market d are given by Equations (11) and (12) [14].
c d s r ( q s d r * ) + p s d r * = p d r * , q s d r * > 0 p d r * , q s d r * = 0
q d r ( p d r * ) = s = 1 S q s d r * , p d r * > 0 s = 1 S q s d r * , p d r * = 0
In the recycling stage of waste products, according to assumption two, for each recycled waste product, the government subsidy available to consumers is β d . In addition, manufacturers have certain negative effects on consumers in the process of recycling waste products [48]. Therefore, reverse recycling needs to satisfy the following.
V ( Q M D ) = p m d * + β d , q m d * > 0 p m d * + β d , q m d * = 0
s . t .   m = 1 M q m d s = 1 S ( q s d n + q s d r )
Equation (14) shows that the recycling volume of waste products is not higher than the sales volume of two products. Let λ 5 be the Lagrange multiplier in Equation (14), Λ D 5 = ( ( λ 5 ) D × 1 ) R + D . When Equations (9)–(14) are satisfied simultaneously, all markets can reach an equilibrium state. Therefore, the markets’ equilibrium state of markets can be expressed as the following variational inequality [51], determining ( Q S D N * , Q S D R * , P D N * , P D R * , Q M D * , Λ D 5 * ) Ω D such that the following is true.
d = 1 D s = 1 S [ c d s n ( q s d n * ) + p s d n * p d n * λ 5 ] × [ q s d n q s d n * ] + d = 1 D s = 1 S [ c d s r ( q s d r * ) + p s d r * p d r * λ 5 ] × [ q s d r q s d r * ] + d = 1 D [ s = 1 S q s d n * q d n ( p d n * ) ] × [ p d n p d n * ] + d = 1 D [ s = 1 S q s d r * q d r ( p d r * ) ] × [ p d r p d r * ] + m = 1 M d = 1 D [ V ( Q M D * ) p m d * β d + λ 5 ] × [ q m d q m d * ] + d = 1 d [ s = 1 S ( q s d n + q s d r ) m = 1 M q m d ( t ) ] × [ λ 5 λ 5 * ] 0 ( Q S D N , Q S D R , P D N , P D R , Q M D , Λ D 5 ) Ω D , Ω D = R + 2 D ( S + M + 1 )
In the equilibrium state, from the first, second and fifth terms of Equation (15), p d n * = p s d n * + c d s n ( q s d n * ) λ 5 , p d r * = c d s r ( q s d r * ) + p s d r * λ 5 , and p m d * = V ( Q M D * ) β d + λ 5 can be obtained. This shows that if consumers can purchase two products, the products’ prices should not be higher than the consumers’ transaction costs. And more, the recycling price is determined by V ( Q M D * ) β d + λ 5 , which means that the recycling price is affected by the recycling negative effect and the recycling subsidy level; that is, an increase in β d helps reduce recycling prices. Through merging and sorting, p m d * = V ( Q M D * ) β d + p d r * c d s r ( q s d r * ) p s d r * V ( Q M D * ) β d + p d n * c d s n ( q s d n * ) p s d n * can be achieved; hence, reducing recycling prices can help reduce consumer product purchase prices. According to the demand functions, reducing the purchase prices of the two products helps to increase sale quantity. Therefore, this paper can propose that an increase in the consumer recycling subsidy level β d can promote the circulation of new and remanufactured products.

4.2.4. The LC-CLSCN Equilibrium Model under Different Subsidy Policies

When the LC-CLSCN system achieves an equilibrium state, the circulation number and price of products (i.e., new products, remanufactured products and waste products) in the system need to meet the equilibrium states of members at the same time [6,14]. More specifically, under the LC-CLSCN system achieving the Nash equilibrium, the number of new/remanufactured/waste products sold by upper-level members must be equal to the number of new/remanufactured/waste products accepted by lower-level members; that is, in the LC-CLSCN equilibrium state, Equations (4), (8) and (15) must be satisfied simultaneously. Therefore, this paper provides the following definition and theorem.
Definition 1.
The LC-CLSCN equilibrium problem considering remanufacturing subsidy, consumer recycling subsidy and CO2e reduction subsidy policies means that the number of new/remanufactured/waste products transferred by all members is consistent. In any given subsidy policy environment, the production, trading, recycling, remanufacturing and CO2e reduction decisions of members must meet the equilibrium of all members in the LC-CLSCN system.
Theorem 1.
The LC-CLSCN equilibrium that considers the government remanufactured subsidy policy, CO2e reduction subsidy policy and consumer recycling subsidy policy can be transformed by the following variational inequality [51]: find ( Q M S N * , Q M S R * , Q M D * , Q M N * , E M * , Q S D N * , Q S D R * , P D N * , P D R * , Λ M 1 * , Λ M 2 * , Λ M 3 * , Λ M 4 * , Λ D 5 * ) Ω , such that the following is true.
m = 1 M s = 1 S [ c m s s ( q m s n , q m s r ) q m s n + c m s m ( q m s n , q m s r ) q m s n + λ 1 * λ 3 * ] × [ q m s n q m s n * ] + d = 1 D [ s = 1 S q s d n * q d n ( p d n * ) ] × [ p d n p d n * ] + m = 1 M d = 1 D [ V * β d θ r e σ h β m σ h + f m r ( σ r , q m d ) q m d λ 2 σ h + λ 5 ] × [ q m d q m d * ] + d = 1 D [ s = 1 S q s d r * q d r ( p d r * ) ] × [ p d r p d r * ] + m = 1 M [ θ e + f m n ( Q m n ) q m n λ 1 ] × [ q m n q m n * ] + m = 1 M [ θ q m n r σ h d = 1 D q m d + α e * ] × [ e e * ] + m = 1 M s = 1 S [ c m s s ( q m s n , q m s r ) q m s r + c m s m ( q m s n , q m s r ) q m s r + λ 2 * λ 4 * ] × [ q m s r q m s r * ] + m = 1 M [ q m n s = 1 S q m s n ] × [ λ 1 λ 1 * ] + d = 1 D s = 1 S [ c d s n ( q s d n * ) + c s d s ( q s d n , q s d r ) q s d n p d n * + λ 3 * λ 5 * ] × [ q s d n q s d n * ] + s = 1 S [ m = 1 M q m s n d = 1 D q s d n ] × [ λ 3 λ 3 * ] + d = 1 D s = 1 S [ c d s r ( q s d r * ) + c s d s ( q s d n , q s d r ) q s d r p d r * + λ 4 * λ 5 * ] × [ q s d r q s d r * ] + m = 1 M [ σ h d = 1 D q m d s = 1 S q m s r ] × [ λ 2 λ 2 * ] + s = 1 S [ m = 1 M q m s r d = 1 D q s d r ] × [ λ 4 λ 4 * ] + d = 1 d [ s = 1 S ( q s d n + q s d r ) m = 1 M q m d ( t ) ] × [ λ 5 λ 5 * ] 0 ( Q M S N , Q M S R , Q M D , Q M N , E M , Q S D N , Q S D R , P D N , P D R , Λ M 1 , Λ M 2 , Λ M 3 , Λ M 4 , Λ D 5 ) Ω , Ω = Ω M × Ω S × Ω D
Proof. 
(1) Necessity: By adding Equations (4), (8) and (15), endogenous variables p m s n * , p m s r * , p s d n * , p s d r * and p m d * are eliminated, and then Equation (16) is obtained. (2) Sufficiency: Add ( p m s n * + p m s n * ) to the first bracket of the first item in Equation (16), while ( p m d * + p m d * ) is added to the first bracket of the third item. Then, ( p m s r * + p m s r * ) and ( p s d n * + p s d n * ) are added in the first brackets of the seventh and ninth items of Equation (16), respectively. Last, ( p s d r * + p s d r * ) is added to the first bracket of the eleventh item of Equation (16). According to the above steps, the value of inequality does not change. At this point, the obtained variational inequality is precisely the sum of the equilibrium conditions (4), (8) and (15). □
From the above definition and theorem, it can be seen that transaction prices p m s n * , p m s r * , p s d n * , p s d r * and p m d * are endogenous variables. In addition, according to Equations (4), (8) and (15), equilibrium state conclusions have been obtained; that is, the recycling subsidy and CO2e reduction subsidy policies can help reduce the prices of new/manufactured products, and the consumer recycling subsidy policy can help increase the waste product recycling price. Under the equilibrium state of the system, both manufacturers and retailers make decisions to maximize their own economic interests, while consumers in the markets make decisions through comparison; that is, all members at all levels in the LC-CLSCN system can reach the Nash equilibrium state. Therefore, we can understand the influence of the three subsidy policies on the equilibrium results of the LC-CLSCN system and make a set of scientific multi-dimensional decisions, which has a positive effect on the LC-CLSCN operation.

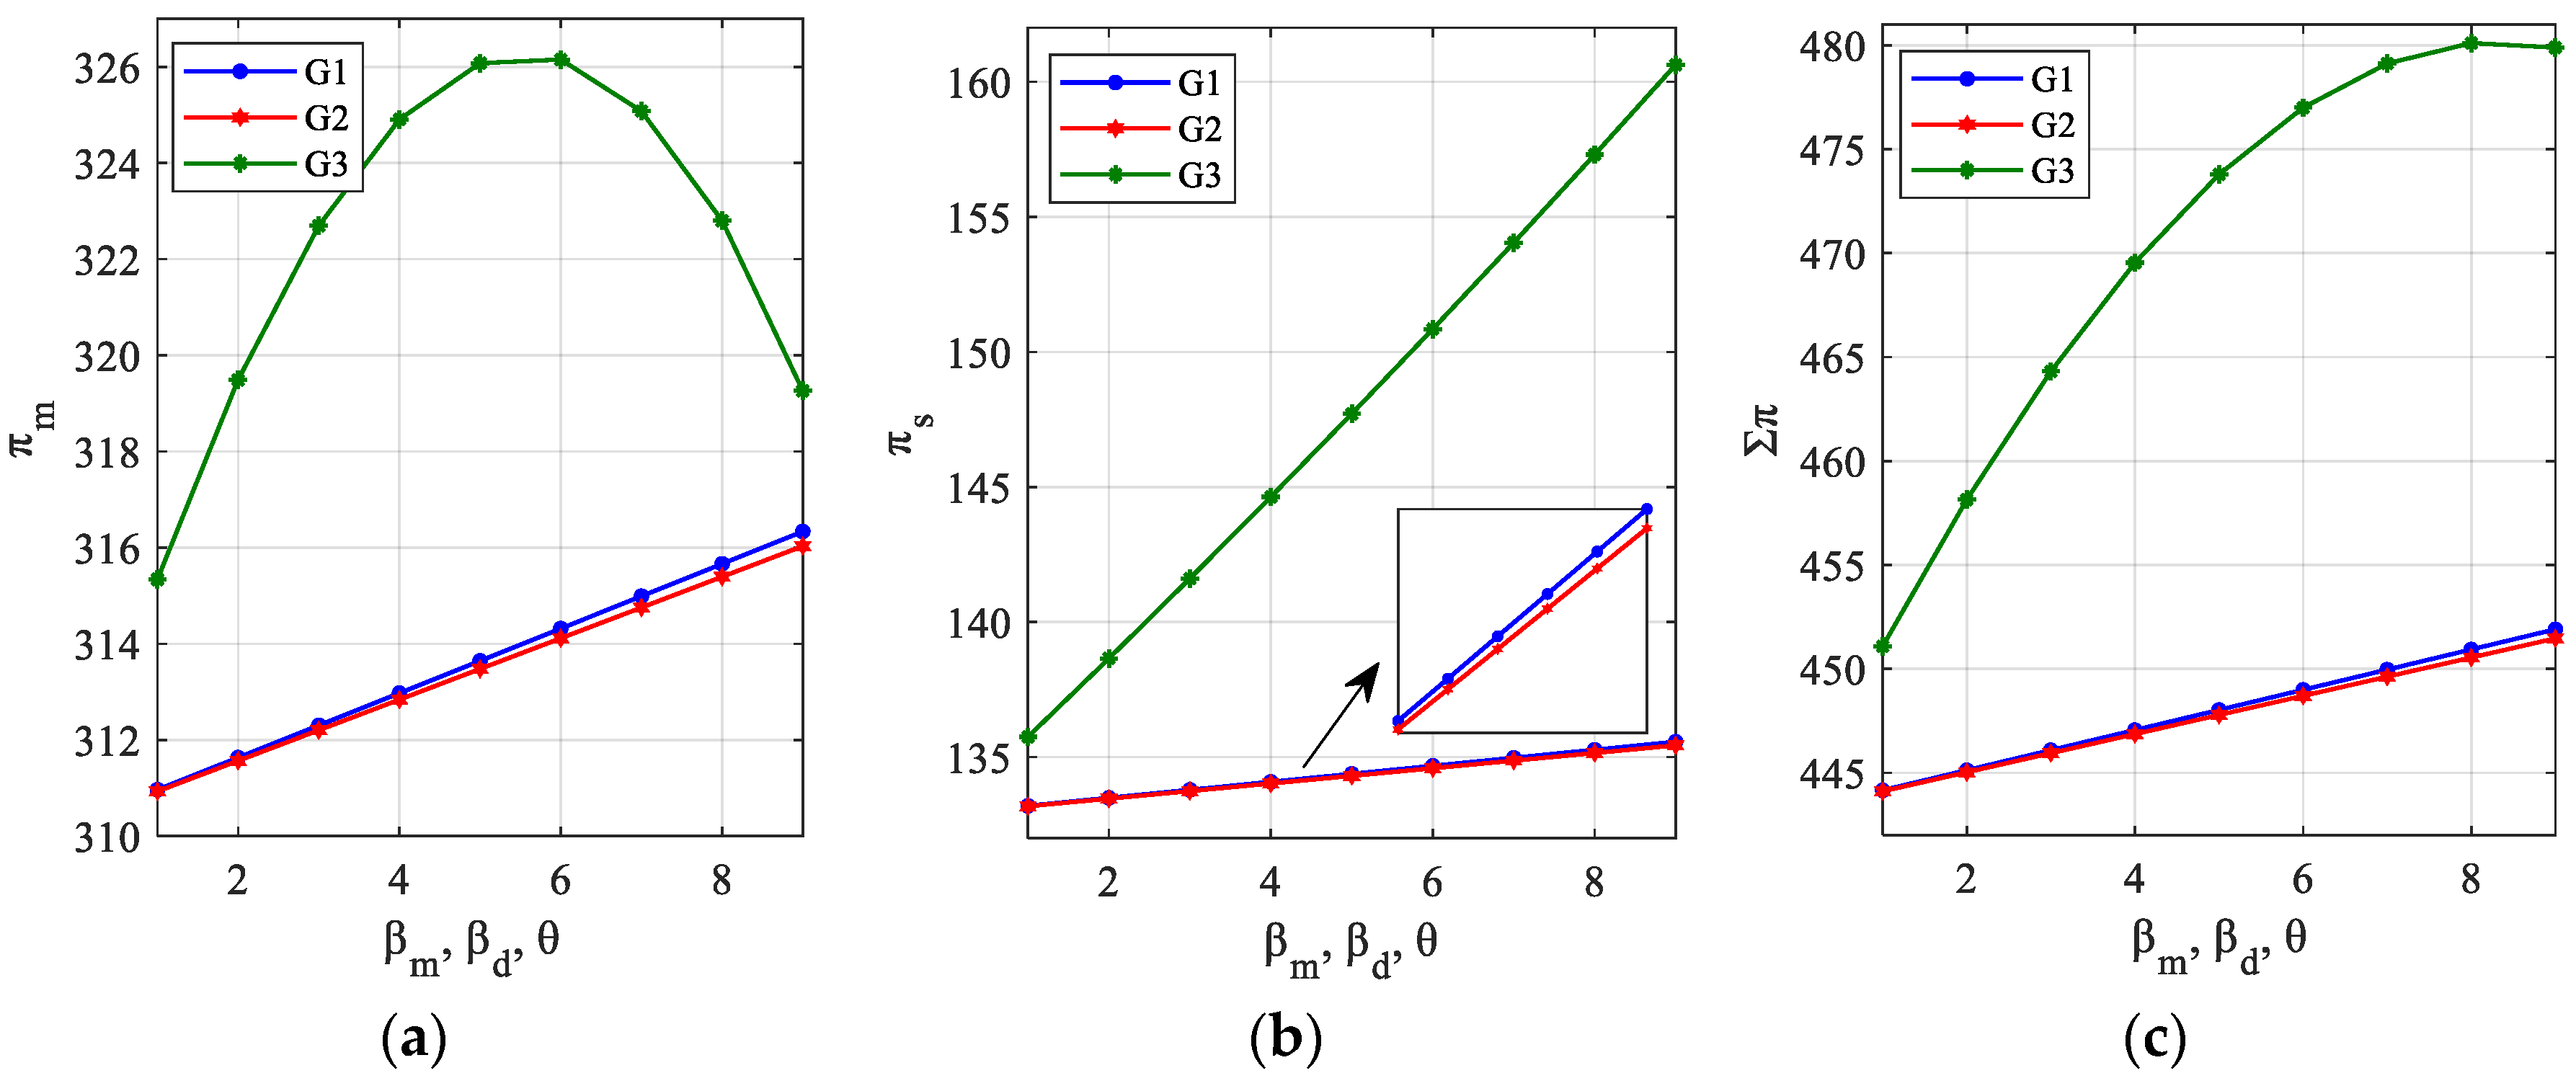
5. Numerical Examples

This section uses numerical examples to verify and solve the LC-CLSCN equilibrium model and obtain multi-dimensional equilibrium decisions for different subsidy policy scenarios. In the process of solving the model, this paper first assumes the number of members at each level in the LC-CLSCN system. Then, according to the assumption of a continuous differentiable convex function, we establish the relevant cost functions involved in the variational inequality model. On this basis, the modified projection algorithm is used to solve the constructed model [6,14], and the setting of relevant parameters of the algorithm is given. Finally, the algorithm program is written in MATLAB to solve the model and obtain simulation data results in different situations (i.e., network equilibrium results). Through comparative analysis and visual processing of simulation data, the impact of different subsidy policies on the operation decision of LC-CLSCN is given. The specific research process and results are as follows.
According to Zhang et al. [14], assume that the LC-CLSCN comprises two manufacturers, two retailers and two markets. Referring to the studies of Zhang et al. [14] and Hammond and Beullens [22], the functions in the model are as follows:
c m s m ( q m s n , q m s r ) = 0.25 ( q m s n + q m s r ) 2 + 0.5 ( q m s n + q m s r ) , f m r ( σ r , q m d ) = 0.25 ( σ r q m d ) 2 + σ r q m d + 2.5 ,   f m n ( Q m n ) = ( q m n ) 2 + 0.2 q m n , c m s s ( q m s n , q m s r ) = 0.25 ( q m s n + q m s r ) 2 + 0.5 ( q m s n + q m s r ) ,   q d r ( p d n , p d r ) = 0.3 p 3 d r p d r + 0.15 d p d n + 45 ,   c d s n ( q s d n ) = 0.15 ( q s d n ) 2 + 1 ,   c d s r ( q d s r ) = 0.15 ( q d s r ) 2 + 1 , q d n ( p d n , p d r ) = 0.5 p 3 d n 1.2 p d n + 0.15 d p d r + 60 ,   V = 0.5 ( m d q m d ) + 3 , c s d s ( q s d n , q s d r ) = 0.25 ( q s d n + q s d r ) 2 + 0.5 ( q s d n + q s d r ) .
The variational Inequality (16) is solved by a modified projection algorithm [6,14]. We use MATLAB to write a program to obtain the results, where the iteration step size is 0.01, and the termination condition is 10−6. The settings of other parameters are r = 0.2 , e m = 1 , δ h = 0.95 , δ r = 0.85 and a = 0.5 .
Following are the research aspects of this section. (1) In the environment where the three subsidy policies exist separately, the influence of the change of different subsidy levels on the LC-CLSCN multi-dimensional equilibrium decisions is discussed. Additionally, by comparing and analyzing the LC-CLSCN equilibrium results under different subsidy policies, we determine the applicable conditions of the optimal subsidy policy selection strategies. (2) Under the coexistence of the three subsidy policies, the impact of changes in combination parameters (i.e., the subsidy levels of the three subsidy policies) on the production, recycling, CO2e reduction and profit distribution of LC-CLSCN is analyzed. Then, we summarize which subsidy policy has a greater impact on the LC-CLSCN system, and which policy can help reduce CO2e and resource waste.

5.1. Numerical Example 1

In this part, when a government implements remanufacturing subsidy policy, CO2e reduction policy and consumer recycling subsidy policy, respectively, analyze the impact of changes in β m , β d , and θ on system operation decisions. We assume that the values of β m , β d , and θ are set from 1 to 9. The results are presented in Table 3 and Figure 3. To clarify the table and figure, in Table 3 and Figure 3, e t o t a l represent the system’s CO2e, G1-G3 represent the consumer recycling subsidy policy, remanufacturing subsidy policy and CO2e reduction subsidy policy, respectively.
According to Table 3, no matter which subsidy policy is adopted by a government, an increase in subsidy level can improve the new/remanufactured product sales volume and the waste product recycling rate. This result is similar to Jena et al. [15], who also proved that consumer recycling subsidy policy and remanufacturing subsidy policy can improve the recycling rate of waste products and increase the demand for products. However, since we also considered the CO2e reduction subsidy policy and the manufacturers’ CO2e reduction investment, we expanded their research conclusions; that is, this study finds that the CO2e reduction subsidy policy can also promote the recycling rate of waste products. The reason for this result is that in the assumptions in this paper, we have assumed that the CO2e of remanufactured products is smaller, which leads to the CO2e reduction subsidy policy increasing the circulation of remanufactured products and thus improving the recycling rate. Additionally, there are some new discoveries that we have obtained. In terms of CO2e reduction, for any subsidy policy, three policies can improve CO2e reduction by manufacturers and reduce the total CO2e of the system. In addition, comparing Table 3 longitudinally, when the subsidy level is constant, we find that q m s n G 3 * > q m s n G 1 * > q m s n G 2 * , q m s r G 3 * > q m s r G 1 * > q m s r G 2 * , q m d G 3 * > q m d G 1 * > q m d G 2 * , e t o t a l G 3 * < e t o t a l G 1 * < e t o t a l G 2 * , h G 3 * > h G 1 * h G 2 * and e G 3 * > e G 1 * > e G 2 * , which shows that the CO2e reduction subsidy policy can better promote new/remanufactured product transactions, improve recycling efficiency, promote manufacturers’ CO2e and reduce the total CO2e of the LC-CLSCN system.
As shown in Figure 3, under the consumer recycling subsidy policy or remanufacturing subsidy policy, an increase in the level of subsidies can increase the profits of members and the LC-CLSCN system. Under the CO2e subsidy reduction policy, when θ increases, retailers’ profits always increase gradually; however, manufacturers’ profits increase when the CO2e reduction subsidy level is θ [ 0 ,   6 ] . Conversely, when the CO2e reduction subsidy level is θ > 6 , as the CO2e reduction subsidy level increases, the manufacturers’ profits reduce. This interesting result is also supported in the literature. For example, the research of Zhu and Liao [60] and Zhang et al. [61] proved that the subsidy policy does not always promote the profits of enterprises. For the whole LC-CLSCN profits, as the CO2e reduction subsidy level increases, the total profits can increase under θ [ 0 ,   8 ] . In particular, comparing the three policies, the CO2e reduction subsidy policy is always more conducive to retailers’ profits. However, the remanufacturing subsidy policy has the worst effect on improving retailers’ profits. For the profits of manufacturers and the LC-CLSCN system, the CO2e reduction subsidy policy does not always promote the profitability of manufacturers and the system. Only when θ is less than a certain threshold, CO2e reduction subsidy policy superior to the consumer recycling subsidy and remanufacturing subsidy policy. Therefore, if the government adopts a medium or low subsidy level, the effect of the CO2e reduction subsidy policy is the best, whereas if the government adopts a high subsidy level, the consumer recycling subsidy policy is the best.

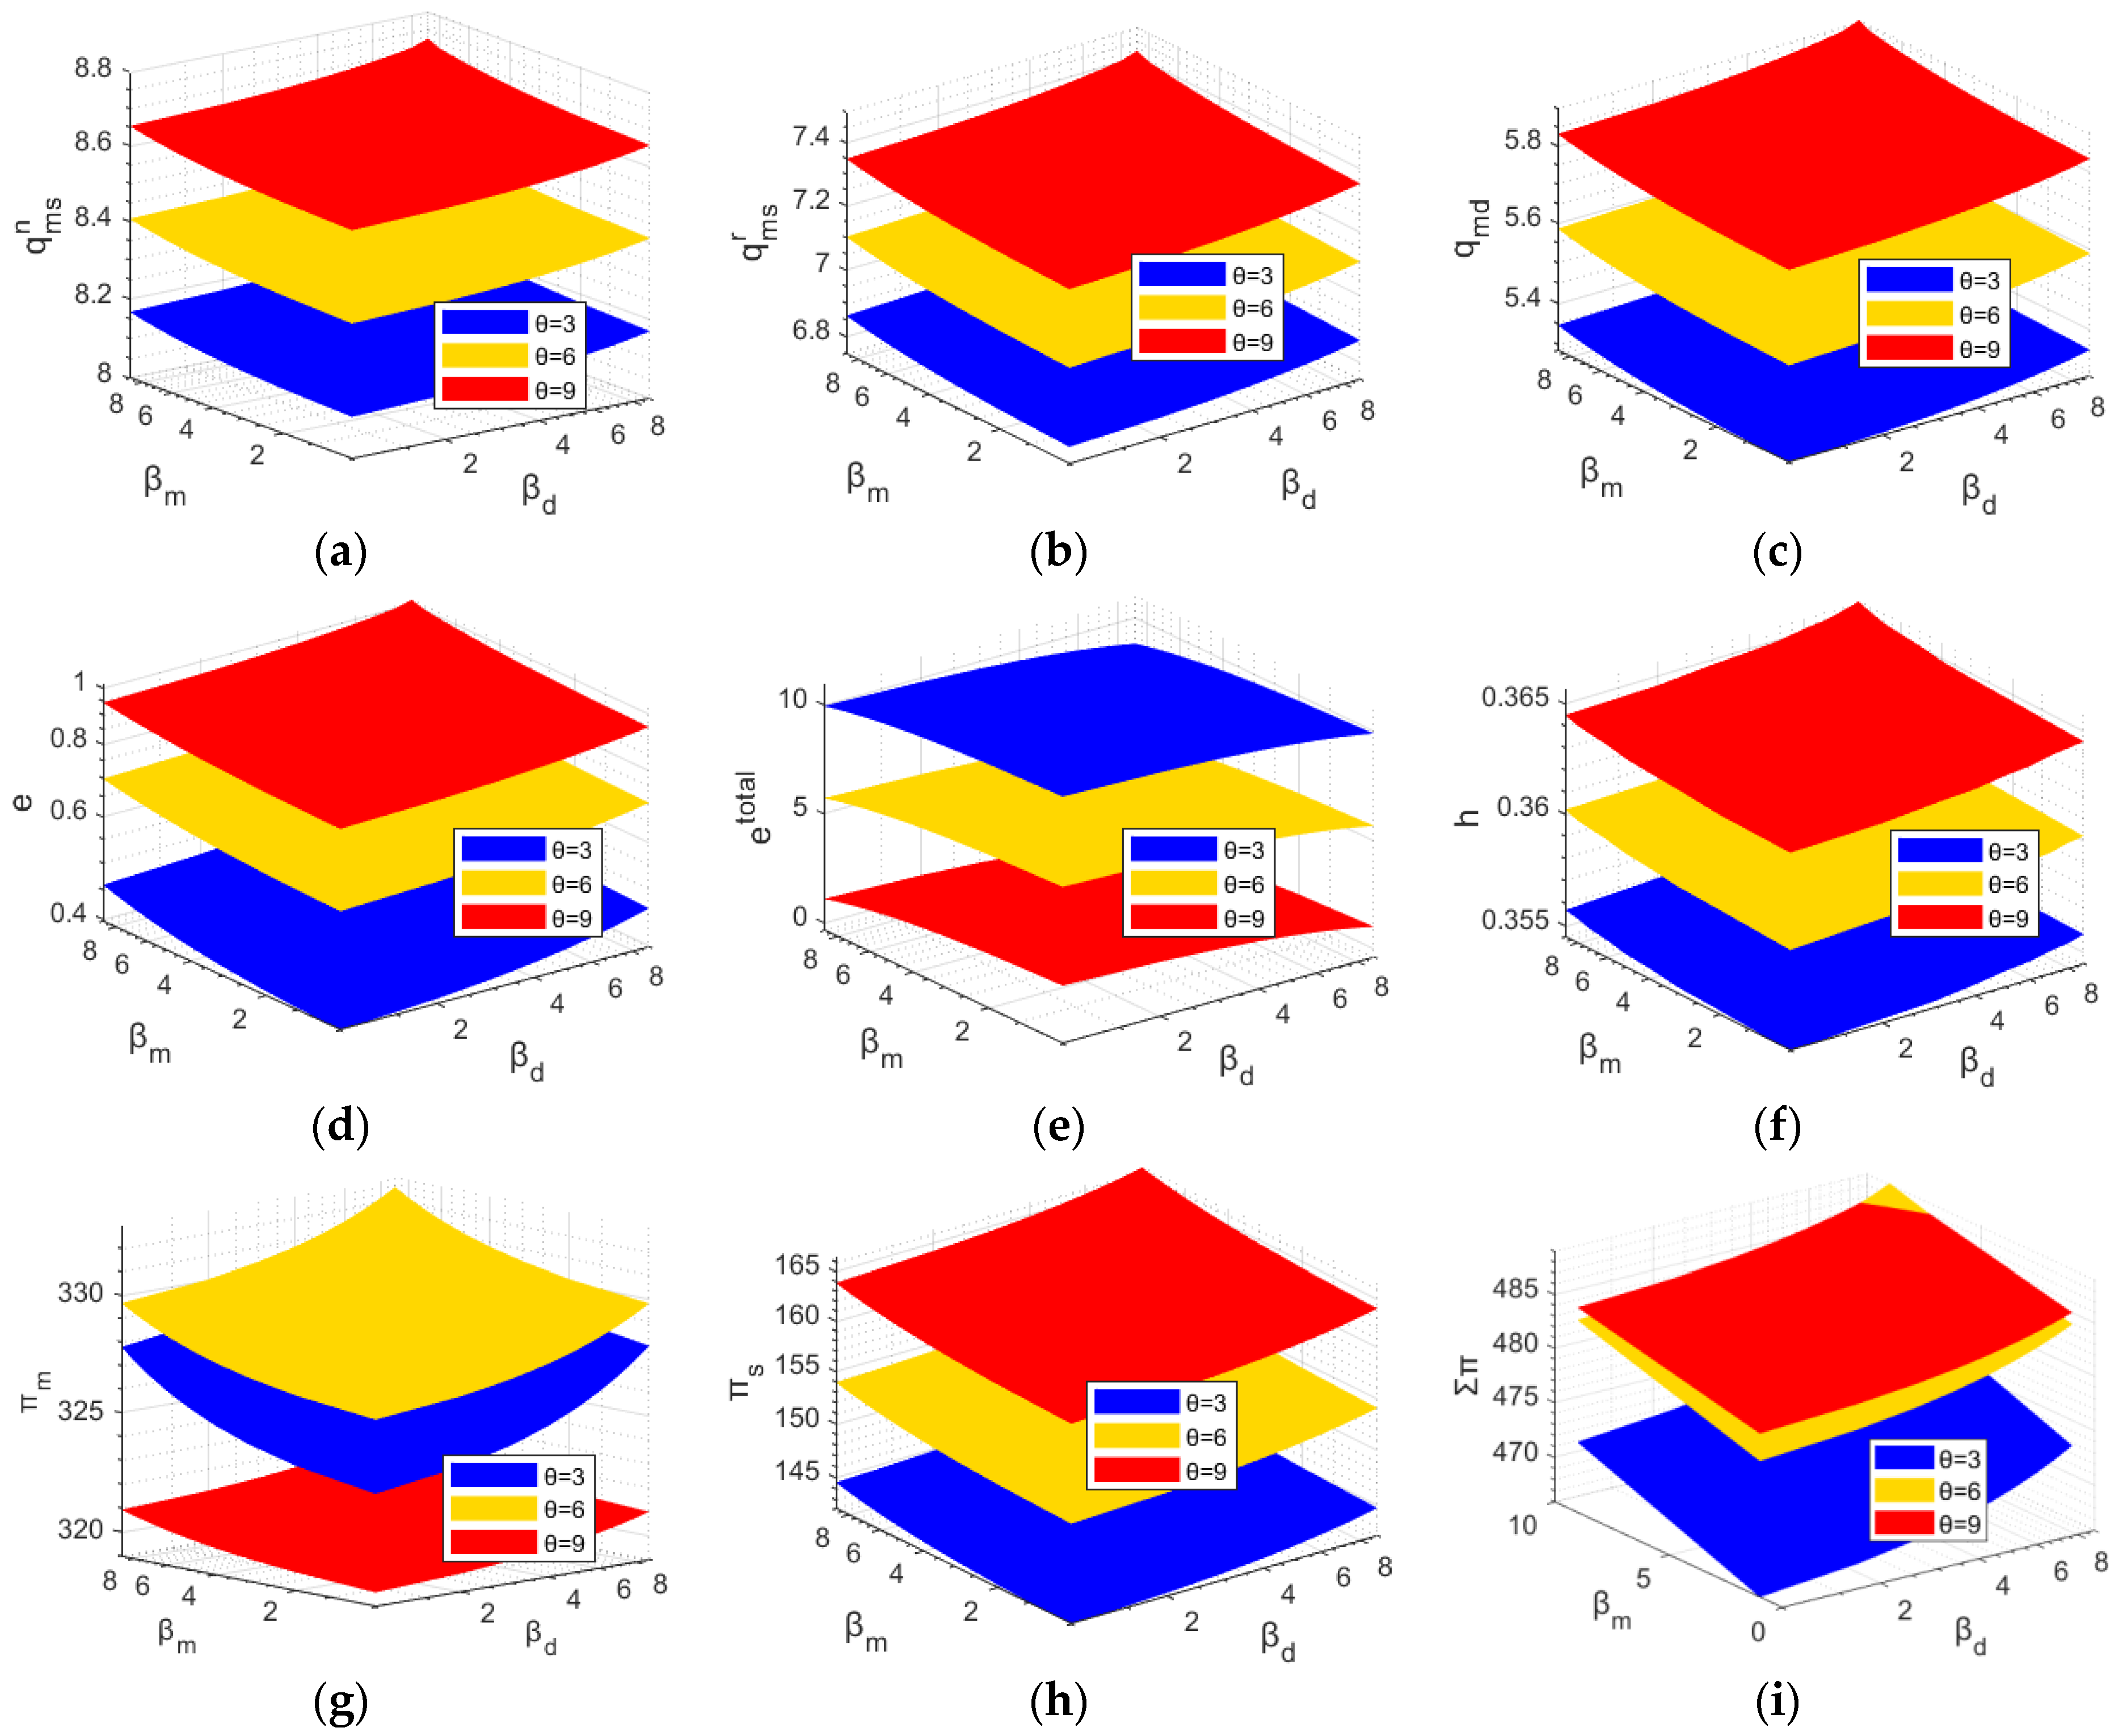
5.2. Numerical Example 2

This part analyzes the impact of changes in subsidy levels β m , β d , and θ on the LC-CLSCN equilibrium under the coexistence of three subsidy policies. Let θ = 3 6 9 , and the values of β m and β d are set from 1 to 10. The results are shown in Figure 4. Additionally, to clarify the figure, in Figure 4, the policies represented by G1–G3 are consistent with numerical example 1.
From Figure 4a–f, it can be seen that when the three policies exist simultaneously, the level of β m , β d , and θ is higher, the more conducive they are to the system’s forward and reverse product circulation, the manufacturers’ CO2e reduction level is more able to increase, and the more able the policies are to help reduce the total CO2e of the system. Furthermore, from the scope of increase/decrease, when any two subsidy levels are constant, we find that Δ q m s i G 3 * > Δ q m s i G 1 * > Δ q m s i G 2 * , i = m , r , Δ q m d G 3 * > Δ q m d G 1 * > Δ q m d G 2 * , Δ h G 3 * > Δ h G 1 * > Δ h G 2 * , Δ e G 3 * > Δ e G 1 * > Δ e G 2 * and Δ e t o t a l G 3 * > Δ e t o t a l G 1 * > Δ e t o t a l G 2 * , which indicates that under the coexistence of three subsidy policies, the change in CO2e reduction subsidy level dominates the impact of product circulation, waste product recycling and CO2e reduction in the system.
Figure 4g–i shows that, in the environment where the level of CO2e reduction subsidy level θ is constant, the increase in the level of remanufacturing subsidy and consumer recycling subsidy can always help members to gain profits. Conversely, in an environment where the level of remanufacturing subsidy and consumer recycling subsidy levels are constant, an increase in the CO2e reduction subsidy level always increases the retailers’ profit. However, when the CO2e reduction subsidy level increases from 3 to 6, the manufacturers’ profits gradually increase. When the CO2e reduction subsidy level increases from 6 to 9, the manufacturers’ profits decrease significantly. These phenomena show that CO2e reduction subsidy is not always promoting manufacturers to gain profits. In addition, for the profits of the LC-CLSCN system, for any given θ , comparing the profit situation under the remanufacturing subsidy policy and the consumer recycling subsidy policy, we find that the consumer recycling subsidy policy can better promote the system to obtain profits. This research conclusion is different from Jena et al. [15], who found that a remanufacturing subsidy policy can better promote the profit of the system than a consumer subsidy policy. There are three reasons why our conclusion is different from that of Jena et al. [15]. The first reason is that the research methods are different. Jena et al. [15] developed a supply chain model by using the Stackelberg game theory, while our research uses the Nash non-cooperative game theory to build the LC-CLSCN model. The second reason is that the decision goals are different. The decision goal of Jena et al. [15] is to maximize the total performance (i.e., the total profit when the social welfare is maximized), while our decision goal is to maximize the economic profits of members. The third reason is that the model assumptions are different. Jena et al. [15] only assumed that the manufacturer has remanufacturing behavior. In this paper, we not only assume the remanufacturing and CO2e reduction behavior of manufacturers but also introduce the CO2e reduction subsidy policy. Therefore, differences in model construction methods, decision objectives and model assumptions will lead to differences in mathematical models, and then different equilibrium results will be obtained. In addition, we have also made new discoveries. When both β m and β d are less than 7, the whole LC-CLSCN system’s profits raise with an increase in θ . In terms of the profit change range in the system, when the CO2e reduction subsidy level is at a medium or low level (i.e., θ < 6 ), the whole system’s profit increase degree/proportion is larger; conversely, when the θ is at a high level (i.e., θ > 6 ), the whole system’s profit increase is small. This phenomenon occurs because excessively increasing the CO2e reduction subsidy level reduces manufacturers’ profits, which in turn reduces the LC-CLSCN system’s profits. Therefore, this paper can prove that CO2e reduction subsidy is not always promoting manufacturers and the whole LC-CLSCN system to gain profits.

6. Discussion, Implications and Recommendations

6.1. Results and Discussion

This study focuses on the impact of three government subsidy policies (i.e., CO2e reduction subsidy policy, consumer recycling subsidy policy and remanufacturing subsidy policy) on the LC-CLSCN operation. We have found that no matter which subsidy policy is implemented by the government, the government’s top-level subsidy policy plays a regulatory and intermediary role in the operation of the LC-CLSCN system. The following will discuss the research results in detail according to the research objectives of this paper.
The impact of these three subsidy policies on production, recycling, CO2e reduction and profit distribution. In terms of production, recycling and CO2e reduction, we have found that no matter which subsidy policy the government implements, an increase in subsidy level can improve the recycling rate, prevent CO2e and boost the market circulation of products. The research of Jena et al. [15], Cao et al. [10] and Zhang and Yu [39] has also reached this conclusion. In terms of profit, a consumer recycling subsidy policy and remanufacturing subsidy policy can always promote the profits of members and the LC-CLSCN system. This finding is also consistent with the conclusion of Jena et al. [15]. However, since this paper expands the research perspective of Jena et al. [15] (i.e., introducing CO2e reduction subsidy and CO2e reduction behavior), we have also obtained a new discovery. This new discovery is interesting and different from our intuition; that is, the increase in CO2e reduction subsidy level can always promote retailers’ profits, but not always promote manufacturers’ profits. Only when the CO2e reduction subsidy level is less than a certain threshold, the increase in subsidy level can promote manufacturers to gain profits. Through analysis, the reason for this result is that, on one hand, we have considered the CO2e reduction cost of each manufacturer, which is quantified by the amount of CO2e reduction. Since the government implements a CO2e reduction subsidy according to the amount of the CO2e reduction, in the equilibrium state, if the government’s CO2e reduction subsidy level is too high, it will indirectly increase the CO2e reduction costs of manufacturers. On the other hand, according to the conclusion of the theoretical analysis in Section 4.1, in the equilibrium state, the increase in CO2e reduction subsidy level can reduce the wholesale price of products. Therefore, at a higher CO2e reduction subsidy level, the profits of manufacturers affected by both high CO2e reduction costs and low wholesale prices will decrease. This interesting result is also supported in the literature. For example, the research of Zhu and Liao [60] and Zhang [61] proved that the subsidy policy does not always promote the profits of enterprises.
When the three policies exist separately, we compare and analyze the impact of the three policies on the system. In terms of the environmental dimension, three policies are helpful to promote CO2e reduction and product recycling, but their effects are different. The research results show that under the same subsidy level, h G 3 * > h G 1 * h G 2 * and e G 3 * > e G 1 * > e G 2 * have been found, which shows that the CO2e reduction subsidy can better promote the reduction in CO2e and the recycling of waste products than the other two subsidies. In terms of the economic dimension, we have found if the CO2e subsidy level is at a reasonable range (i.e., θ is below a certain threshold), although the increase in CO2e reduction subsidy level leads to the decrease in marginal profit of manufacturers, the contribution of CO2e reduction subsidy to the development of the system economy is also better than the other two policies. Therefore, when the three policies exist separately, if the government’s subsidy level is in a reasonable range, the CO2e reduction subsidy policy is more beneficial to the LC-CLSCN system.
Under the coexistence of three subsidy policies, this paper has found which subsidy policy has the greatest impact on the system. According to numerical example 2, it has been obtained that the impact of changes in the subsidy levels on the system is the same as the impact on the system when the policies exist separately. However, when the change of these three subsidy levels is the same, Δ q m d G 3 * > Δ q m d G 1 * > Δ q m d G 2 * , Δ h G 3 * > Δ h G 1 * > Δ h G 2 * and Δ e G 3 * > Δ e G 1 * > Δ e G 2 * have been obtained, which shows that under the coexistence of three subsidy policies, the change in the CO2e reduction subsidy level has a greater impact on the LC-CLSCN system operation.

6.2. Implications

This paper also has some research implications. The following sets out some theoretical implications and practical implications.
In terms of theoretical implications, first, this paper aims to provide a framework for current and future researchers who are interested in promoting the research of LC-CLSCN sustainable operation. The classification of existing relevant literature in this paper could help academics understand the evolution of previous research and the supply chain system toward a competitive LC-CLSCN structure. Second, this paper can act as a reference on the relationship between the government subsidy policies (i.e., CO2e reduction subsidy policy, remanufacturing subsidy policy and consumer recovery subsidy policy) and LC-CLSCN operation. Specifically, the guidance and intermediary roles of government policy for supply chain systems have been recognized in the literature [15,39,53]. In view of the research boundary, from the perspective of three government subsidy policies, using the Nash non-cooperative game, variational inequality, spatial price equilibrium and modified projection algorithm, we have obtained interesting research results through the logic of “decision objectives → optimal behavior and equilibrium conditions → LC-CLSCN equilibrium model → equilibrium results”. These research results can excavate the internal logic and correlation between the government subsidy policies and the system operation decision. Third, the model construction logic and method in this paper can provide a reference for subsequent scholars to study CLSCN operation and policy intervention. There is no doubt that the LC-CLSCN network model under the government subsidy policies constructed in this paper can not only express the competition and cooperation relationship among members, but also reflect the internal logical relationship between the government policies parameters and product prices, recycling rate, and CO2e reduction. In particular, the LC-CLSCN equilibrium model developed in this paper also has the characteristics of uniqueness and optimality, and the results obtained by solving the model have the Nash equilibrium characteristic.
In terms of practical implications, our research results can clearly explain the impact of government subsidies on the behavior and decisions of members and give the best subsidy policy selection strategies through the comparative analysis of the three policies on the system operation results. In addition, research results are helpful for government departments to find the deficiencies of the existing subsidy policies. We guide the government to formulate scientific and reasonable subsidy policies according to its own financial situation.

6.3. Management Recommendations

6.3.1. Government

The guidance and intermediary roles of government policy for supply chain systems have been recognized in the literature [15,39,53], and our research has also proved this point. Therefore, based on the above discussion, this paper suggests that the government should formulate a scientific subsidy policy system based on its financial situation.
First, if the government’s financial plan is insufficient, it can adopt a single subsidy policy for the LC-CSCN system. It is suggested that the government should implement the CO2e reduction subsidy policy for manufacturing enterprises, and the subsidy level can be medium. Although this proposal is not the most effective way to reduce CO2e and improve recycling efficiency, it is relatively effective. This is because, on the premise of not reducing the profits of the members and the whole LC-CLSCN system, this policy can not only encourage members to implement CO2e reduction and waste product recycling activities to a certain extent, but also reduce government capital investment. Therefore, this is a relatively effective proposal in the situation of government financial shortage.
Second, when the government’s financial capital plan is sufficient. This paper suggests that the government can formulate subsidy policies according to the manufacturing enterprises’ economic strength and the supply chain system’s industry scale and maturity. If manufacturers have strong economic strength and the supply chain system is in a developed industry, the government can implement these three policies at the same time and adopt a higher level of subsidies. The reason for this suggestion is that, under the high level of these three subsidies, when the manufacturing enterprises have a large economic scale or the supply chain system is in a developed industry, it is more important to pay attention to environmental protection than to obtain greater economic benefits. Although this suggestion may reduce the profits of manufacturers, it can promote CO2e reduction and waste utilization of the system.
Third, according to the conclusion of this paper, we have found that although the high-level subsidies of these three policies can promote the overall environmental benefits of the system, this will lead to lower profits for manufacturers, and thus lower the profits of the system, which in turn reduces the LC-CLSCN system’s economic performance. Therefore, we suggest that the government can take additional measures to subsidize manufacturers (e.g., tax reduction and production subsidies), which can effectively improve their economic benefits and promote the sustainable development of the LC-CLSCN system. In addition, the government can formulate additional relevant support systems. The difficulty in measuring subsidy policies may lead to the poor effect of the three subsidy policies on the system [62]. Therefore, this study recommends that the government implement support systems, for example, public information platforms, consumer supervision systems, random inspection systems, license systems and other supervision methods.

6.3.2. Enterprise Members

LC-CLSCN’s members should actively fulfill their low-carbon/remanufacturing responsibilities on the premise of implementing government policies. For example, members can undertake corporate social responsibility (CSR) through low-carbon/recycling/recycling behavior, low-carbon and remanufacturing technology investment and environmental protection [63]. This is also a way for LC-CLSCN members to show their enterprises/products to consumers, which helps to improve their social reputation. Second, because the LC-CLSCN is the carrier for the survival of members, each enterprise should do its best to promote the stable operation of the system [13]. For example, retailers can increase consumers’ willingness to buy low-carbon/remanufactured products by investing in advertising for low-carbon/remanufactured products [64]. Enterprise members (e.g., manufacturers and retailers) should also adopt some publicity strategies to improve consumers’ willingness to recycle waste products. Finally, members should adopt cooperative strategies [65]. These cooperative strategies include low-carbon product investment cooperation, CO2e reduction cost sharing and multi-channel recycling cooperation strategy. Additionally, manufacturers can also implement subsidy-sharing or information-sharing contracts with retailers [66].

7. Conclusions, Limitations and Future Direction

7.1. Conclusions

This study has emphasized the operation decision of LC-CLSCN composed of manufacturers, retailers and demands. Under the assumption of the government’s three subsidy policies (i.e., CO2e reduction subsidy policy, consumer recycling subsidy policy and remanufacturing subsidy policy), using the Nash non-cooperative game theory, variational inequality and spatial price equilibrium, we have developed an LC-CLSCN network equilibrium model that considers manufacturers’ CO2e reduction. Under different subsidy policy environments, the effects of changes in subsidy levels on new/remanufactured product transactions, waste product recycling rate, CO2e reduction and profits have been analyzed. The following research conclusions have been obtained in this paper. (1) No matter which subsidy policy the government implements, an increase in subsidy level for these three subsidy policies is always conducive to an increase in new/remanufactured product market demand and waste product recycling rate, as well as an increase in CO2e reduction of manufacturers. (2) No matter which subsidy policy the government implements, raising the subsidy level can help to improve the profits of retailers; however, manufacturers’ incomes increase only when the CO2e subsidy level is below a certain threshold. (3) When the three policies exist separately, although those three policies are helpful to promote CO2e reduction and waste product recycling, but their effects are different. Under the same subsidy level, the CO2e reduction subsidy can better promote the reduction in CO2e and the recycling of waste products than the other two subsidy policies. (4) Under the coexistence of three subsidy policies, the impact of changes in the subsidy levels on the system is the same as the impact on the system when the policies exist separately. However, when the change of these three subsidy levels is the same, the change in the CO2e reduction subsidy level has a greater impact on the LC-CLSCN system operation.

7.2. Limitations and Future Direction

Following are the limitations of this study and directions for future research. First, the subsidized members of this paper only consider consumers and manufacturers. In the future, a retailer subsidy policy can be introduced into the LC-CLSCN system to study the system’s operation and subsidy policy selection strategies. Second, this study has assumed that all members posses information symmetry. Future research can relax the information assumption and study the LC-CLSCN operation under information asymmetry. Third, we only consider CO2e in the production process. In the future, the CO2e in the recycling and marketing process can be taken into account in the system, and the impact of the subsidy policies on the system operation can be studied. Fourth, we only regard the recycling rate of waste products as the environmental sustainability of the system. Future research can study the impact of natural resource excessive exploitation on LC-CLSCN operation decision. Finally, this paper only considers the environmental protection and economic benefits of the system. Future works can also consider the CSR behavior of enterprises and study the sustainable supply chain network operation from the three dimensions of environment, society and economy.

Author Contributions

Conceptualization, C.D. and Q.Z.; methodology, F.Y.; software, C.D. and F.Y.; validation, Y.W.; formal analysis, C.D. and Q.Z.; investigation, J.W.; resources, C.D.; data curation, Q.Z.; writing—original draft preparation, Q.Z.; writing—review and editing, C.D.; visualization, F.Y.; supervision, Q.Z.; project administration, Y.W.; funding acquisition, J.W. All authors have read and agreed to the published version of the manuscript.

Funding

This research is supported by the National Social Science Fund of China, Grant Number: 19BJY169.

Data Availability Statement

Not applicable.

Acknowledgments

The authors thank the editors and reviewers for their hard work.

Conflicts of Interest

The authors declare no conflict of interest.

References

  1. Sun, Y. A Robust Possibilistic Programming Approach for a Road-Rail Intermodal Routing Problem with Multiple Time Windows and Truck Operations Optimization under Carbon Cap-and-Trade Policy and Uncertainty. Systems 2022, 10, 156. [Google Scholar] [CrossRef]
  2. Cao, K.; Xu, Y.; Wang, J. Should Firms Provide Online Return Service for Remanufactured Products? J. Clean. Prod. 2020, 272, 122641. [Google Scholar] [CrossRef]
  3. Soon, A.; Heidari, A.; Khalilzadeh, M.; Antucheviciene, J.; Zavadskas, E.K.; Zahedi, F. Multi-Objective Sustainable Closed-Loop Supply Chain Network Design Considering Multiple Products with Different Quality Levels. Systems 2022, 10, 94. [Google Scholar] [CrossRef]
  4. Wang, Z.; Wu, Q. Carbon Emission Reduction and Product Collection Decisions in the Closed-Loop Supply Chain with Cap-and-Trade Regulation. Int. J. Prod. Res. 2021, 59, 4359–4383. [Google Scholar] [CrossRef]
  5. Cheng, P.; Ji, G.; Zhang, G.; Shi, Y. A Closed-Loop Supply Chain Network Considering Consumer’s Low Carbon Preference and Carbon Tax under the Cap-and-Trade Regulation. Sustain. Prod. Consum. 2022, 29, 614–635. [Google Scholar] [CrossRef]
  6. Nagurney, A.; Dong, J.; Zhang, D. A Supply Chain Network Equilibrium Model. Transp. Res. Part E Logist. Transp. Rev. 2002, 38, 281–303. [Google Scholar] [CrossRef]
  7. Xu, L.; Wang, C.; Miao, Z.; Chen, J. Governmental Subsidy Policies and Supply Chain Decisions with Carbon Emission Limit and Consumer’s Environmental Awareness. RAIRO-Oper. Res. 2019, 53, 1675–1689. [Google Scholar] [CrossRef] [Green Version]
  8. Zhou, X.; Wei, X.; Lin, J.; Tian, X.; Lev, B.; Wang, S. Supply Chain Management under Carbon Taxes: A Review and Bibliometric Analysis. Omega 2021, 98, 102295. [Google Scholar] [CrossRef]
  9. Cao, K.; Xu, X.; Wu, Q.; Zhang, Q. Optimal Production and Carbon Emission Reduction Level under Cap-and-Trade and Low Carbon Subsidy Policies. J. Clean. Prod. 2017, 167, 505–513. [Google Scholar] [CrossRef]
  10. Cao, K.; He, P.; Liu, Z. Production and Pricing Decisions in a Dual-Channel Supply Chain under Remanufacturing Subsidy Policy and Carbon Tax Policy. J. Oper. Res. Soc. 2020, 71, 1199–1215. [Google Scholar] [CrossRef]
  11. Wang, Y.; Fan, R.; Shen, L.; Miller, W. Recycling Decisions of Low-Carbon e-Commerce Closed-Loop Supply Chain under Government Subsidy Mechanism and Altruistic Preference. J. Clean. Prod. 2020, 259, 120883. [Google Scholar] [CrossRef]
  12. Nagurney, A.; Besik, D.; Li, D. Strict Quotas or Tariffs? Implications for Product Quality and Consumer Welfare in Differentiated Product Supply Chains. Transp. Res. Part E Logist. Transp. Rev. 2019, 129, 136–161. [Google Scholar] [CrossRef]
  13. Zhou, Y.; Lin, X.-T.; Fan, Z.-P.; Wong, K.-H. Remanufacturing Strategy Choice of a Closed-Loop Supply Chain Network Considering Carbon Emission Trading, Green Innovation, and Green Consumers. Int. J. Environ. Res. Public Health 2022, 19, 6782. [Google Scholar] [CrossRef]
  14. Zhang, G.; Cheng, P.; Sun, H.; Shi, Y.; Zhang, G.; Kadiane, A. Carbon Reduction Decisions under Progressive Carbon Tax Regulations: A New Dual-Channel Supply Chain Network Equilibrium Model. Sustain. Prod. Consum. 2021, 27, 1077–1092. [Google Scholar] [CrossRef]
  15. Jena, S.K.; Ghadge, A.; Sarmah, S.P. Managing Channel Profit and Total Surplus in a Closed-Loop Supply Chain Network. J. Oper. Res. Soc. 2018, 69, 1345–1356. [Google Scholar] [CrossRef]
  16. Fu, R.; Qiang, Q.; Ke, K.; Huang, Z. Closed-Loop Supply Chain Network with Interaction of Forward and Reverse Logistics. Sustain. Prod. Consum. 2021, 27, 737–752. [Google Scholar] [CrossRef]
  17. Wan, N. The Impacts of Low Carbon Subsidy, Collection Mode, and Power Structure on a Closed-Loop Supply Chain. J. Renew. Sustain. Energy 2018, 10, 065904. [Google Scholar] [CrossRef]
  18. Diabat, A.; Jebali, A. Multi-Product and Multi-Period Closed Loop Supply Chain Network Design under Take-Back Legislation. Int. J. Prod. Econ. 2021, 231, 107879. [Google Scholar] [CrossRef]
  19. Li, B.; Geng, Y.; Xia, X.; Qiao, D. The Impact of Government Subsidies on the Low-Carbon Supply Chain Based on Carbon Emission Reduction Level. Int. J. Environ. Res. Public Health 2021, 18, 7603. [Google Scholar] [CrossRef]
  20. Xu, J.; Wang, P.; Xu, Q. Impact of Information Asymmetry on the Operation of Green Closed-Loop Supply Chain under Government Regulation. Sustainability 2022, 14, 7999. [Google Scholar] [CrossRef]
  21. Salehi-Amiri, A.; Zahedi, A.; Gholian-Jouybari, F.; Rodríguez, E.Z.; Hajiaghaei-Keshteli, M. Designing a Closed-Loop Supply Chain Network Considering Social Factors; A Case Study on Avocado Industry. Appl. Math. Model. 2022, 101, 600–631. [Google Scholar] [CrossRef]
  22. Hammond, D.; Beullens, P. Closed-Loop Supply Chain Network Equilibrium under Legislation. Eur. J. Oper. Res. 2007, 183, 895–908. [Google Scholar] [CrossRef]
  23. Feng, P.; Zhou, X.; Zhang, D.; Chen, Z.; Wang, S. The Impact of Trade Policy on Global Supply Chain Network Equilibrium: A New Perspective of Product-Market Chain Competition. Omega 2022, 109, 102612. [Google Scholar] [CrossRef]
  24. Wu, H.; Xu, B.; Zhang, D. Closed-Loop Supply Chain Network Equilibrium Model with Subsidy on Green Supply Chain Technology Investment. Sustainability 2019, 11, 4403. [Google Scholar] [CrossRef] [Green Version]
  25. Jiang, G.; Wang, Q.; Wang, K.; Zhang, Q.; Zhou, J. A Novel Closed-Loop Supply Chain Network Design Considering Enterprise Profit and Service Level. Sustainability 2020, 12, 544. [Google Scholar] [CrossRef] [Green Version]
  26. Polat, L.O.; Gungor, A. WEEE Closed-Loop Supply Chain Network Management Considering the Damage Levels of Returned Products. Environ. Sci. Pollut. Res. 2020, 28, 7786–7804. [Google Scholar] [CrossRef]
  27. Chen, C.-K.; Ulya, M.A. Analyses of the Reward-Penalty Mechanism in Green Closed-Loop Supply Chains with Product Remanufacturing. Int. J. Prod. Econ. 2019, 210, 211–223. [Google Scholar] [CrossRef]
  28. Sriyanto, S.; Lodhi, M.S.; Salamun, H.; Sardin, S.; Pasani, C.F.; Muneer, G.; Zaman, K. The Role of Healthcare Supply Chain Management in the Wake of COVID-19 Pandemic: Hot off the Press. Foresight 2022, 24, 429–444. [Google Scholar] [CrossRef]
  29. Jiang, Y.; Li, K.; Chen, S.; Fu, X.; Feng, S.; Zhuang, Z. A Sustainable Agricultural Supply Chain Considering Substituting Organic Manure for Chemical Fertilizer. Sustain. Prod. Consum. 2022, 29, 432–446. [Google Scholar] [CrossRef]
  30. Chauhan, C.; Singh, A. A Review of Industry 4.0 in Supply Chain Management Studies. J. Manuf. Technol. Manag. 2020, 31, 863–886. [Google Scholar] [CrossRef]
  31. Sun, L.; Cao, X.; Alharthi, M.; Zhang, J.; Taghizadeh-Hesary, F.; Mohsin, M. Carbon Emission Transfer Strategies in Supply Chain with Lag Time of Emission Reduction Technologies and Low-Carbon Preference of Consumers. J. Clean. Prod. 2020, 264, 121664. [Google Scholar] [CrossRef]
  32. Dey, B.K.; Park, J.; Seok, H. Carbon-Emission and Waste Reduction of a Manufacturing-Remanufacturing System Using Green Technology and Autonomated Inspection. RAIRO Oper. Res. 2022, 56, 2801–2831. [Google Scholar] [CrossRef]
  33. Li, N.; Deng, M.; Mou, H.; Tang, D.; Fang, Z.; Zhou, Q.; Cheng, C.; Wang, Y. Government Participation in Supply Chain Low-Carbon Technology R&D and Green Marketing Strategy Optimization. Sustainability 2022, 14, 8342. [Google Scholar] [CrossRef]
  34. Luo, R.; Zhou, L.; Song, Y.; Fan, T. Evaluating the Impact of Carbon Tax Policy on Manufacturing and Remanufacturing Decisions in a Closed-Loop Supply Chain. Int. J. Prod. Econ. 2022, 245, 108408. [Google Scholar] [CrossRef]
  35. Xia, L.; Guo, T.; Qin, J.; Yue, X.; Zhu, N. Carbon Emission Reduction and Pricing Policies of a Supply Chain Considering Reciprocal Preferences in Cap-and-Trade System. Ann. Oper. Res. 2017, 268, 149–175. [Google Scholar] [CrossRef]
  36. Shu, T.; Huang, C.; Chen, S.; Wang, S.; Lai, K.K. Trade-Old-for-Remanufactured Closed-Loop Supply Chains with Carbon Tax and Government Subsidies. Sustainability 2018, 10, 3935. [Google Scholar] [CrossRef] [Green Version]
  37. Fander, A.; Yaghoubi, S. Dynamic and Stochastic Modeling for a Closed-Loop Automotive Supply Chain under Fuel Issue and Government Intervention: A Case Study. Comput. Ind. Eng. 2022, 25, 108765. [Google Scholar] [CrossRef]
  38. Zhao, J.; Zeng, D.; Che, L.; Zhou, T.; Hu, J. Research on the Profit Change of New Energy Vehicle Closed-Loop Supply Chain Members Based on Government Subsidies. Environ. Technol. Innov. 2020, 19, 100937. [Google Scholar] [CrossRef]
  39. Zhang, Z.; Yu, L. Altruistic Mode Selection and Coordination in a Low-Carbon Closed-Loop Supply Chain under the Government’s Compound Subsidy: A Differential Game Analysis. J. Clean. Prod. 2022, 366, 132863. [Google Scholar] [CrossRef]
  40. Dey, B.K.; Yilmaz, I.; Seok, H. A Sustainable Supply Chain Integrated with Autonomated Inspection, Flexible Eco-Production, and Smart Transportation. Processes 2022, 10, 1775. [Google Scholar] [CrossRef]
  41. Awan, U.; Sroufe, R.; Bozan, K. Designing Value Chains for Industry 4.0 and a Circular Economy: A Review of the Literature. Sustainability 2022, 14, 7084. [Google Scholar] [CrossRef]
  42. Song, L.; Yan, Y.; Yao, F. Closed-Loop Supply Chain Models Considering Government Subsidy and Corporate Social Responsibility Investment. Sustainability 2020, 12, 2045. [Google Scholar] [CrossRef] [Green Version]
  43. Mondal, C.; Giri, B.C.; Biswas, S. Integrating Corporate Social Responsibility in a Closed-Loop Supply Chain under Government Subsidy and Used Products Collection Strategies. Flex. Serv. Manuf. J. 2022, 34, 65–100. [Google Scholar] [CrossRef]
  44. Mondal, C.; Giri, B.C. Tax-Subsidy or Reward-Penalty? Determining Optimal Strategy in Sustainable Closed-Loop Supply Chain under Quality-Dependent Return. Int. J. Syst. Sci. Oper. Logist. 2021, 1–26. [Google Scholar] [CrossRef]
  45. Johari, M.; Hosseini-Motlagh, S.-M. Coordination of Social Welfare, Collecting, Recycling and Pricing Decisions in a Competitive Sustainable Closed-Loop Supply Chain: A Case for Lead-Acid Battery. Ann. Oper. Res. 2019, 1–36. [Google Scholar] [CrossRef]
  46. Shu, T.; Liu, Q.; Chen, S.; Wang, S.; Lai, K.K. Pricing Decisions of CSR Closed-Loop Supply Chains with Carbon Emission Constraints. Sustainability 2018, 10, 4430. [Google Scholar] [CrossRef] [Green Version]
  47. Ali, H.; Ryan, S.M. Closed-Loop Supply Chain Network Design with Multiple Transportation Modes under Stochastic Demand and Uncertain Carbon Tax. Int. J. Prod. Econ. 2018, 195, 118–131. [Google Scholar] [CrossRef] [Green Version]
  48. Zhang, G.; Zhang, X.; Sun, H.; Zhao, X. Three-Echelon Closed-Loop Supply Chain Network Equilibrium under Cap-and-Trade Regulation. Sustainability 2021, 13, 6472. [Google Scholar] [CrossRef]
  49. Cheng, P.; Zhang, G.; Sun, H. The Sustainable Supply Chain Network Competition Based on Non-Cooperative Equilibrium under Carbon Emission Permits. Mathematics 2022, 10, 1364. [Google Scholar] [CrossRef]
  50. Wang, J.; Shao, W. Optimal Decisions in the Closed-Loop Supply Chain Considering Capacity Constraints and Stochastic Demand under the Cap-and-Trade Regulation. Complexity 2022, 2022, 2600196. [Google Scholar] [CrossRef]
  51. Allevi, E.; Gnudi, A.; Konnov, I.V.; Oggioni, G. Evaluating the Effects of Environmental Regulations on a Closed-Loop Supply Chain Network: A Variational Inequality Approach. Ann. Oper. Res. 2018, 261, 1–43. [Google Scholar] [CrossRef]
  52. Tao, Z.G.; Guang, Z.Y.; Hao, S.; Song, H.J.; Xin, D.G. Multi-Period Closed-Loop Supply Chain Network Equilibrium with Carbon Emission Constraints. Resour. Conserv. Recycl. 2015, 104, 354–365. [Google Scholar] [CrossRef]
  53. Bian, J.; Xuan, Z. Tax or Subsidy? An Analysis of Environmental Policies in Supply Chains with Retail Competition. Eur. J. Oper. Res. 2020, 283, 901–914. [Google Scholar] [CrossRef]
  54. Li, B.; Chen, W.; Xu, C.; Hou, P. Impacts of Government Subsidies for Environmental-Friendly Products in a Dual-Channel Supply Chain. J. Clean. Prod. 2018, 171, 1558–1576. [Google Scholar] [CrossRef]
  55. Chan, C.K.; Zhou, Y.; Wong, K.H. A Dynamic Equilibrium Model of the Oligopolistic Closed-Loop Supply Chain Network under Uncertain and Time-Dependent Demands. Transp. Res. Part E Logist. Transp. Rev. 2018, 118, 325–354. [Google Scholar] [CrossRef]
  56. Ding, J.; Chen, W.; Wang, W. Production and Carbon Emission Reduction Decisions for Remanufacturing Firms under Carbon Tax and Take-Back Legislation. Comput. Ind. Eng. 2020, 143, 106419. [Google Scholar] [CrossRef]
  57. Chang, X.; Xia, H.; Zhu, H.; Fan, T.; Zhao, H. Production Decisions in a Hybrid Manufacturing–Remanufacturing System with Carbon Cap and Trade Mechanism. Int. J. Prod. Econ. 2015, 162, 160–173. [Google Scholar] [CrossRef]
  58. Candogan, O.; Epitropou, M.; Vohra, R.V. Competitive Equilibrium and Trading Networks: A Network Flow Approach. Oper. Res. 2021, 69, 114–147. [Google Scholar] [CrossRef]
  59. Sun, H.; Zhang, G.; Zhong, Y.; Da, L. The Equilibrium of Multi-Period Closed-Loop Supply Chain Network with Manufacturer-Collection Channel under Government Subsidies. Chin. J. Manag. Sci. 2015, 23, 56–64. [Google Scholar] [CrossRef]
  60. Zhu, Z.; Liao, H. Do Subsidies Improve the Financial Performance of Renewable Energy Companies? Evidence from China. Nat. Hazards 2019, 95, 241–256. [Google Scholar] [CrossRef]
  61. Zhang, H.; Zheng, Y.; Zhou, D.; Zhu, P. Which Subsidy Mode Improves the Financial Performance of Renewable Energy Firms? A Panel Data Analysis of Wind and Solar Energy Companies between 2009 and 2014. Sustainability 2015, 7, 16548–16560. [Google Scholar] [CrossRef] [Green Version]
  62. Wu, Q.; Xu, X.; Lin, R. Government Incentive Mechanism of Closed-Loop Supply Chain Based on Information Asymmetry. RAIRO Oper. Res. 2021, 55, 3359–3378. [Google Scholar] [CrossRef]
  63. Panda, S.; Modak, N.M.; Cárdenas-Barrón, L.E. Coordinating a Socially Responsible Closed-Loop Supply Chain with Product Recycling. Int. J. Prod. Econ. 2017, 188, 11–21. [Google Scholar] [CrossRef]
  64. Yan, K.; Liu, S.; Zuo, M.; Zheng, J.; Xu, Y. Dual-Channel Supply Chain Pricing Decisions under Discounted Advertising Value. Systems 2022, 10, 76. [Google Scholar] [CrossRef]
  65. Fontoura, P.; Coelho, A. The Influence of Supply Chain Leadership and Followership on Organizational Performance: An Empirical Study on a Portuguese Energy Supplier. Balt. J. Manag. 2020, 15, 333–353. [Google Scholar] [CrossRef]
  66. Yang, T.; Li, C.; Yue, X.; Zhang, B. Decisions for Blockchain Adoption and Information Sharing in a Low Carbon Supply Chain. Mathematics 2022, 10, 2233. [Google Scholar] [CrossRef]
Figure 1. The LC-CLSCN structure of this study.
Systems 11 00126 g001
Figure 2. The LC-CLSCN equilibrium model building logic and method in this paper.
Systems 11 00126 g002
Figure 3. (a) The impact of changes in subsidy levels on π m when the policies exist separately; (b) The impact of changes in subsidy levels on π s when the policies exist separately; (c) The impact of changes in subsidy levels on π when the policies exist separately.
Systems 11 00126 g003
Figure 4. (a) The effects of subsidy levels on q m s n under the coexistence of the three policies; (b) The effects of subsidy levels on q m s r under the coexistence of the three policies; (c) The effects of subsidy levels on q m d under the coexistence of the three policies; (d) The effects of subsidy levels on e under the coexistence of the three policies; (e) The effects of subsidy levels on CO2e under the coexistence of the three policies; (f) The effects of subsidy levels on h under the coexistence of the three policies; (g) The effects of subsidy levels on π m under the coexistence of the three policies; (h) The effects of subsidy levels on π s under the coexistence of the three policies; (i) The effects of subsidy levels on π under the coexistence of the three policies.
Systems 11 00126 g004
Table 1. Comparison between this paper and the main related literature.
LiteratureSS-SCSCNGovernment PolicyMethod
RRLCRRLCCRPCRSPRSPOtherGTVI
Wang and Wu [4]
Cheng et al. [5], Zhou et al. [13]
Wang et al. [11]
Cao et al. [9], Li et al. [19]
Zhang et al. [14]
Jena et al. [15]
Wan [17]
Xu et al. [20], Mondal and Giri [44],
Shu et al. [46]
Xia et al. [35]
Shu et al. [36]
Zhao et al. [38]
Zhang and Yu [39]
Song et al. [42],
Wu et al. [24], Zhang et al. [48],
Cheng et al. [49], Allevi et al. [51],
Tao et al. [52]
Bian and Xuan [53]
Li et al. [54]
Chan et al. [55]
This paper
Note. SS-SC: simple structure supply chain. SCN: supply chain network. RR: recycling and remanufacturer. LC: low-carbon. CRP: CO2e reduction policy. CRSP: consumer recycling subsidy policy. RSP: remanufacturing subsidy policy. VI: variational inequality. GT: game theory.
Table 2. Symbols and related descriptions.
SymbolsDescriptions
σ h , σ r The conversion rate of raw materials and waste products, σ h > 0 , σ r > 0
q m n , q m r The number of new products and remanufactured products produced by manufacturer m, Q M N = ( q m n ) M × 1 R + M , Q M R = ( q m r ) M R × 1 R + M R
q m s n , q m s r The number of new products and remanufactured products wholesaled by manufacturer m to retailer s, Q M S N = ( q m s n ) M S × 1 R + M S , Q M S N = ( q m s n ) M S × 1 R + M S
q s d n , q s d r The number of new products and remanufactured products retailed by retailer s to market d Q S D N = ( q s d n ) S D × 1 R + S D , Q S D R = ( q s d r ) S D × 1 R + S D
p m s n , p m s r The price of new products and remanufactured products wholesaled by manufacture m to retailer s
p s d n , p s d r The price of new products and remanufactured retailed by retail s to market d
p m d , q m d The number and price of waste products recycled by manufacturer m from market d, Q M D = ( q m d ) M D × 1 R + M D
p d n , p d r The price of new products and remanufactured products purchased by consumers in market d P D N = ( p d n ) D × 1 R + D , P D R = ( p d r ) D × 1 R + D
q d n , q d r The new product and remanufactured product demand functions of market d, q d n = q d n ( p d n , p d r ) , q d r = q d r ( p d r , p d n )
f m n , f m r The production costs of new products and remanufactured products of manufacturer m, f m n = f m n ( Q m n ) , f m r = f m r ( σ r , q m d )
c m s s , c m s m The transaction costs between manufacturer m and retailer s (retailer s and manufacturer m borne, respectively), c m s s = c m s s ( q m s n , q m s r ) , c m s m = c m s m ( q m s n , q m s r )
c s d s The transaction costs between retailer s and market d (retailer s borne), c s d s = c s d s ( q s d n , q s d r )
c d s n , c d s r The transaction costs borne by consumers buying new products and remanufactured products, respectively, c d s n = c d s n ( q s d n ) , c d s r = c d s r ( q s d r )
V Recycling negative utility function
h Waste product recycling rate
π x The member’s profit, x = m , s
Note. This study uses superscript “*” to express the equilibrium results.
Table 3. The impact of changes β m , β d and θ on the network equilibrium results when the policies exist separately.
β m , β d , θ 123456789
q m s n * G27.86507.87267.88027.88787.89547.90307.91057.91817.9257
G17.86547.87347.88147.88947.89747.90547.91337.92137.9293
G37.93428.01178.08988.16878.24828.32848.40948.49108.5734
q m s r * G16.56066.56826.57586.58346.59106.59866.60616.61376.6213
G26.56106.56906.57706.58506.59306.60106.60896.61696.6249
G36.62986.70736.78546.86436.94387.02407.10507.18667.2690
q m d * G25.04435.05195.05955.06715.07475.08235.08985.09745.1050
G15.04475.05275.06075.06875.07675.08475.09265.10065.1086
G35.11355.19105.26915.34805.42755.50775.58875.67035.7527
h G20.34970.34980.35000.35010.35030.35050.35060.35080.3509
G10.34970.34990.35000.35020.35030.35050.35070.35080.3510
G30.35110.35270.35420.35570.35730.35880.36020.36170.3631
e * G20.15650.16410.17170.17930.18690.19450.20200.20960.2172
G10.15690.16490.17290.18090.18890.19690.20480.21280.2208
G30.22570.30320.38130.46020.53970.61990.70090.78250.8649
e t o t a l G214.88514.76714.64714.52814.40814.28814.16814.04713.926
G114.87914.75414.62914.50314.37714.25014.12313.99613.869
G313.79112.54011.2499.91678.54287.12645.66644.16192.6121
Disclaimer/Publisher’s Note: The statements, opinions and data contained in all publications are solely those of the individual author(s) and contributor(s) and not of MDPI and/or the editor(s). MDPI and/or the editor(s) disclaim responsibility for any injury to people or property resulting from any ideas, methods, instructions or products referred to in the content.

