
Green Independent Innovation or Green Imitation Innovation? Supply Chain Decision-Making in the Operation Stage of Construction and Demolition Waste Recycling Public-Private Partnership Projects


Abstract
:1. Introduction
2. Literature Review

| Research Topics | Dimensions | Source Papers |
|---|---|---|
| Innovation diffusion theory | Basic concepts of innovation diffusion | [36,37] |
| The relationship between innovation diffusion and technology spillover | [38,39,40,41] | |
| The relationship between innovation diffusion and innovation or imitation behavior | [42,43,44] | |
| Supply chain decision-making in CDW recycling PPP project | Government subsidies and consumer environmental awareness have an impact on supply chain decision-making in PPP projects for CDW recycling | [45,46,47,48,49,50] |
| Technology spillover effect has an impact on supply chain decision-making in CDW recycling PPP projects | [51,52,53] |
2.1. Innovation Diffusion Theory
2.2. Supply Chain Decision-Making in CDW Recycling PPP Projects
2.2.1. Government Subsidies and Consumer Awareness of Environmental Protection
2.2.2. Technology Spillover Effect
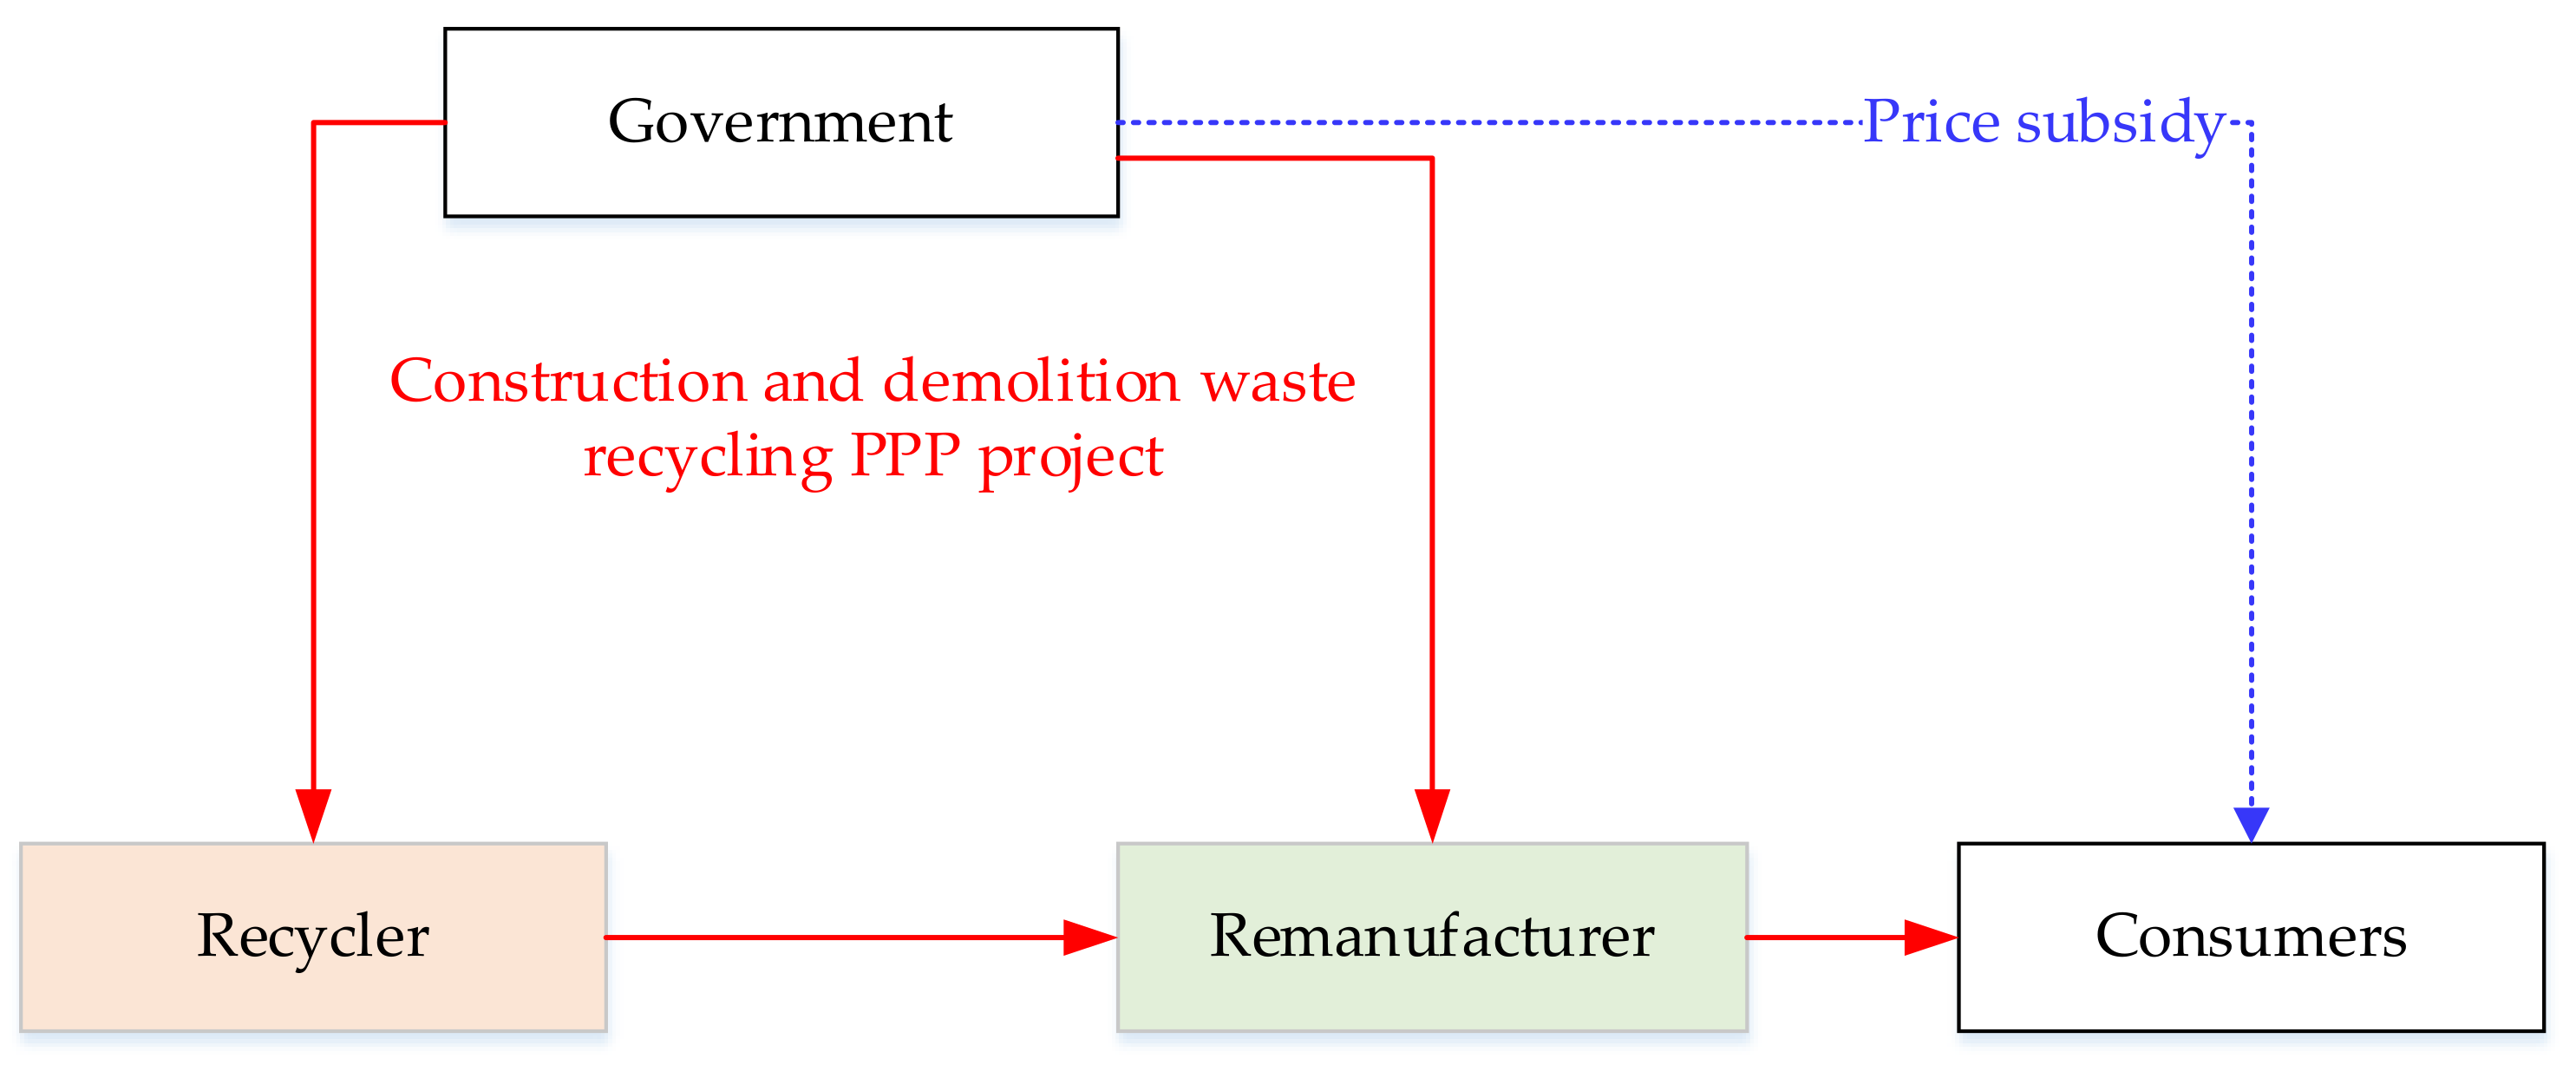
3. Problem Description and Model Assumption
3.1. Problem Description and Model Building
3.2. Model Assumptions
- (1)
- (2)
- With the increasing awareness of environmental protection among consumers, they have the characteristic of green preference for products and will be more inclined to buy green products with environmental attributes, which indicates the green sensitivity of consumers [58].
- (3)
- In the CDW recycling supply chain, the remanufacturer, as the party closer to the market, is more aware of the green preferences of consumers [59], so it will certainly carry out green independent innovation. The remanufacturers will continue to improve their technology and put forward higher requirements for raw materials, forcing recyclers to carry out green technology. As a follower, the recycler can choose between green independent innovation and green imitation innovation. Among them, green independent innovation is more helpful for the recycler to achieve technological breakthroughs but requires higher costs; green imitation innovation can only meet the technical needs of the recycler when recycling, and the R&D investment is also less [25].
- (4)
- Under the condition of bounded rationality, the performance of the R&D innovation of recyclers is better than that of green imitation innovation. The R&D investment costs of the two green innovation paths are different, and the cost of green independent innovation is greater than the cost of green imitation innovation. Let the R&D investment cost of green independent innovation be and the R&D investment cost of green imitation innovation be , where , and are the innovation cost coefficients. To simplify the model, the innovation cost coefficient is assumed to be 1 [60].
- (5)
- Due to the high product-relatedness of enterprises in the same CDW recycling supply chain, remanufacturers and recyclers have certain correlations in terms of technology. Therefore, the innovation behavior of remanufacturers and recyclers often has vertical technology spillover effects [61]. Different innovation paths correspond to different levels of technology spillover. Let , the spillover coefficient, reflect the degree of innovation diffusion among the CDW recycling supply chains; then, the spillover coefficient under green independent innovation of the recycler and remanufacturer is , and the spillover coefficient under the green imitation innovation of the recycler is .
- (5)
- According to the research of Gao Peng et al. [62], the unit cost of remanufacturing will not affect the results, so it is ignored in the model.Relevant participation and specific meanings are shown in Table 2.
3.3. Model Calculation
3.3.1. Recyclers Choose Non-Innovation (RNI)
3.3.2. Recyclers Choose Green Independent Innovation (RII)
3.3.3. Recyclers Choose Green Imitation Innovation (RIMI)
4. Model Analysis
5. Numerical Simulation
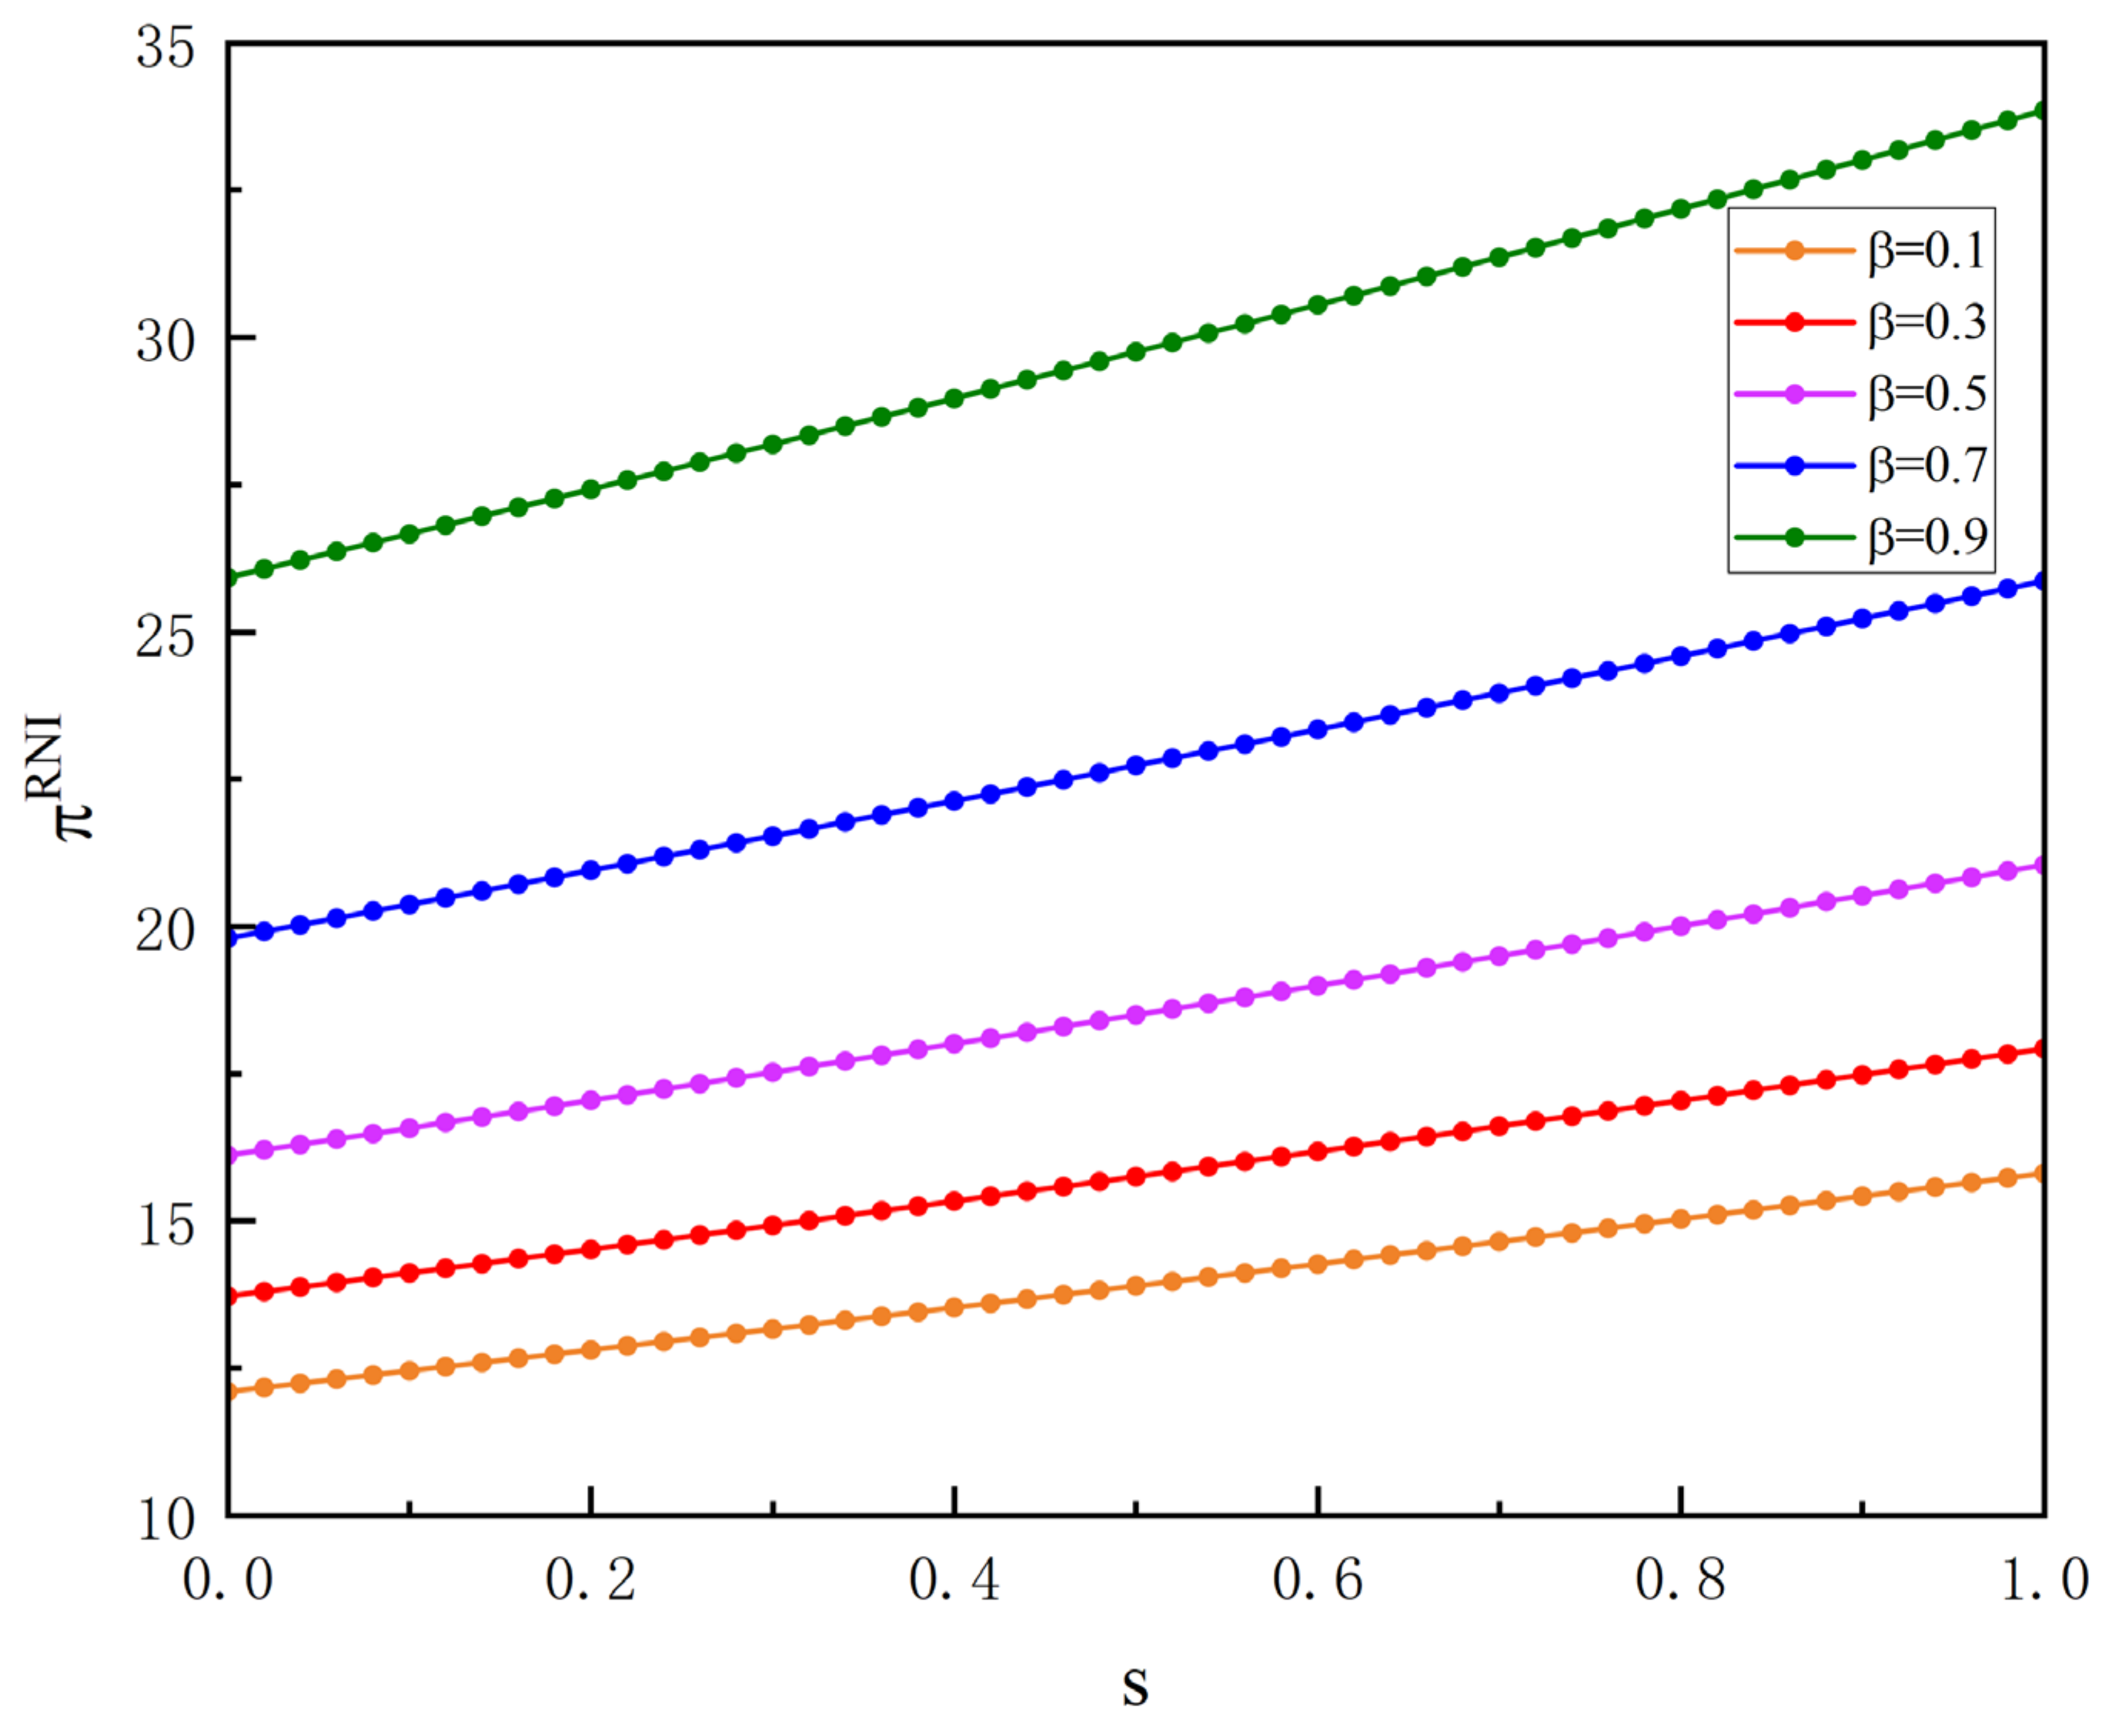
5.1. RNI
5.2. RII
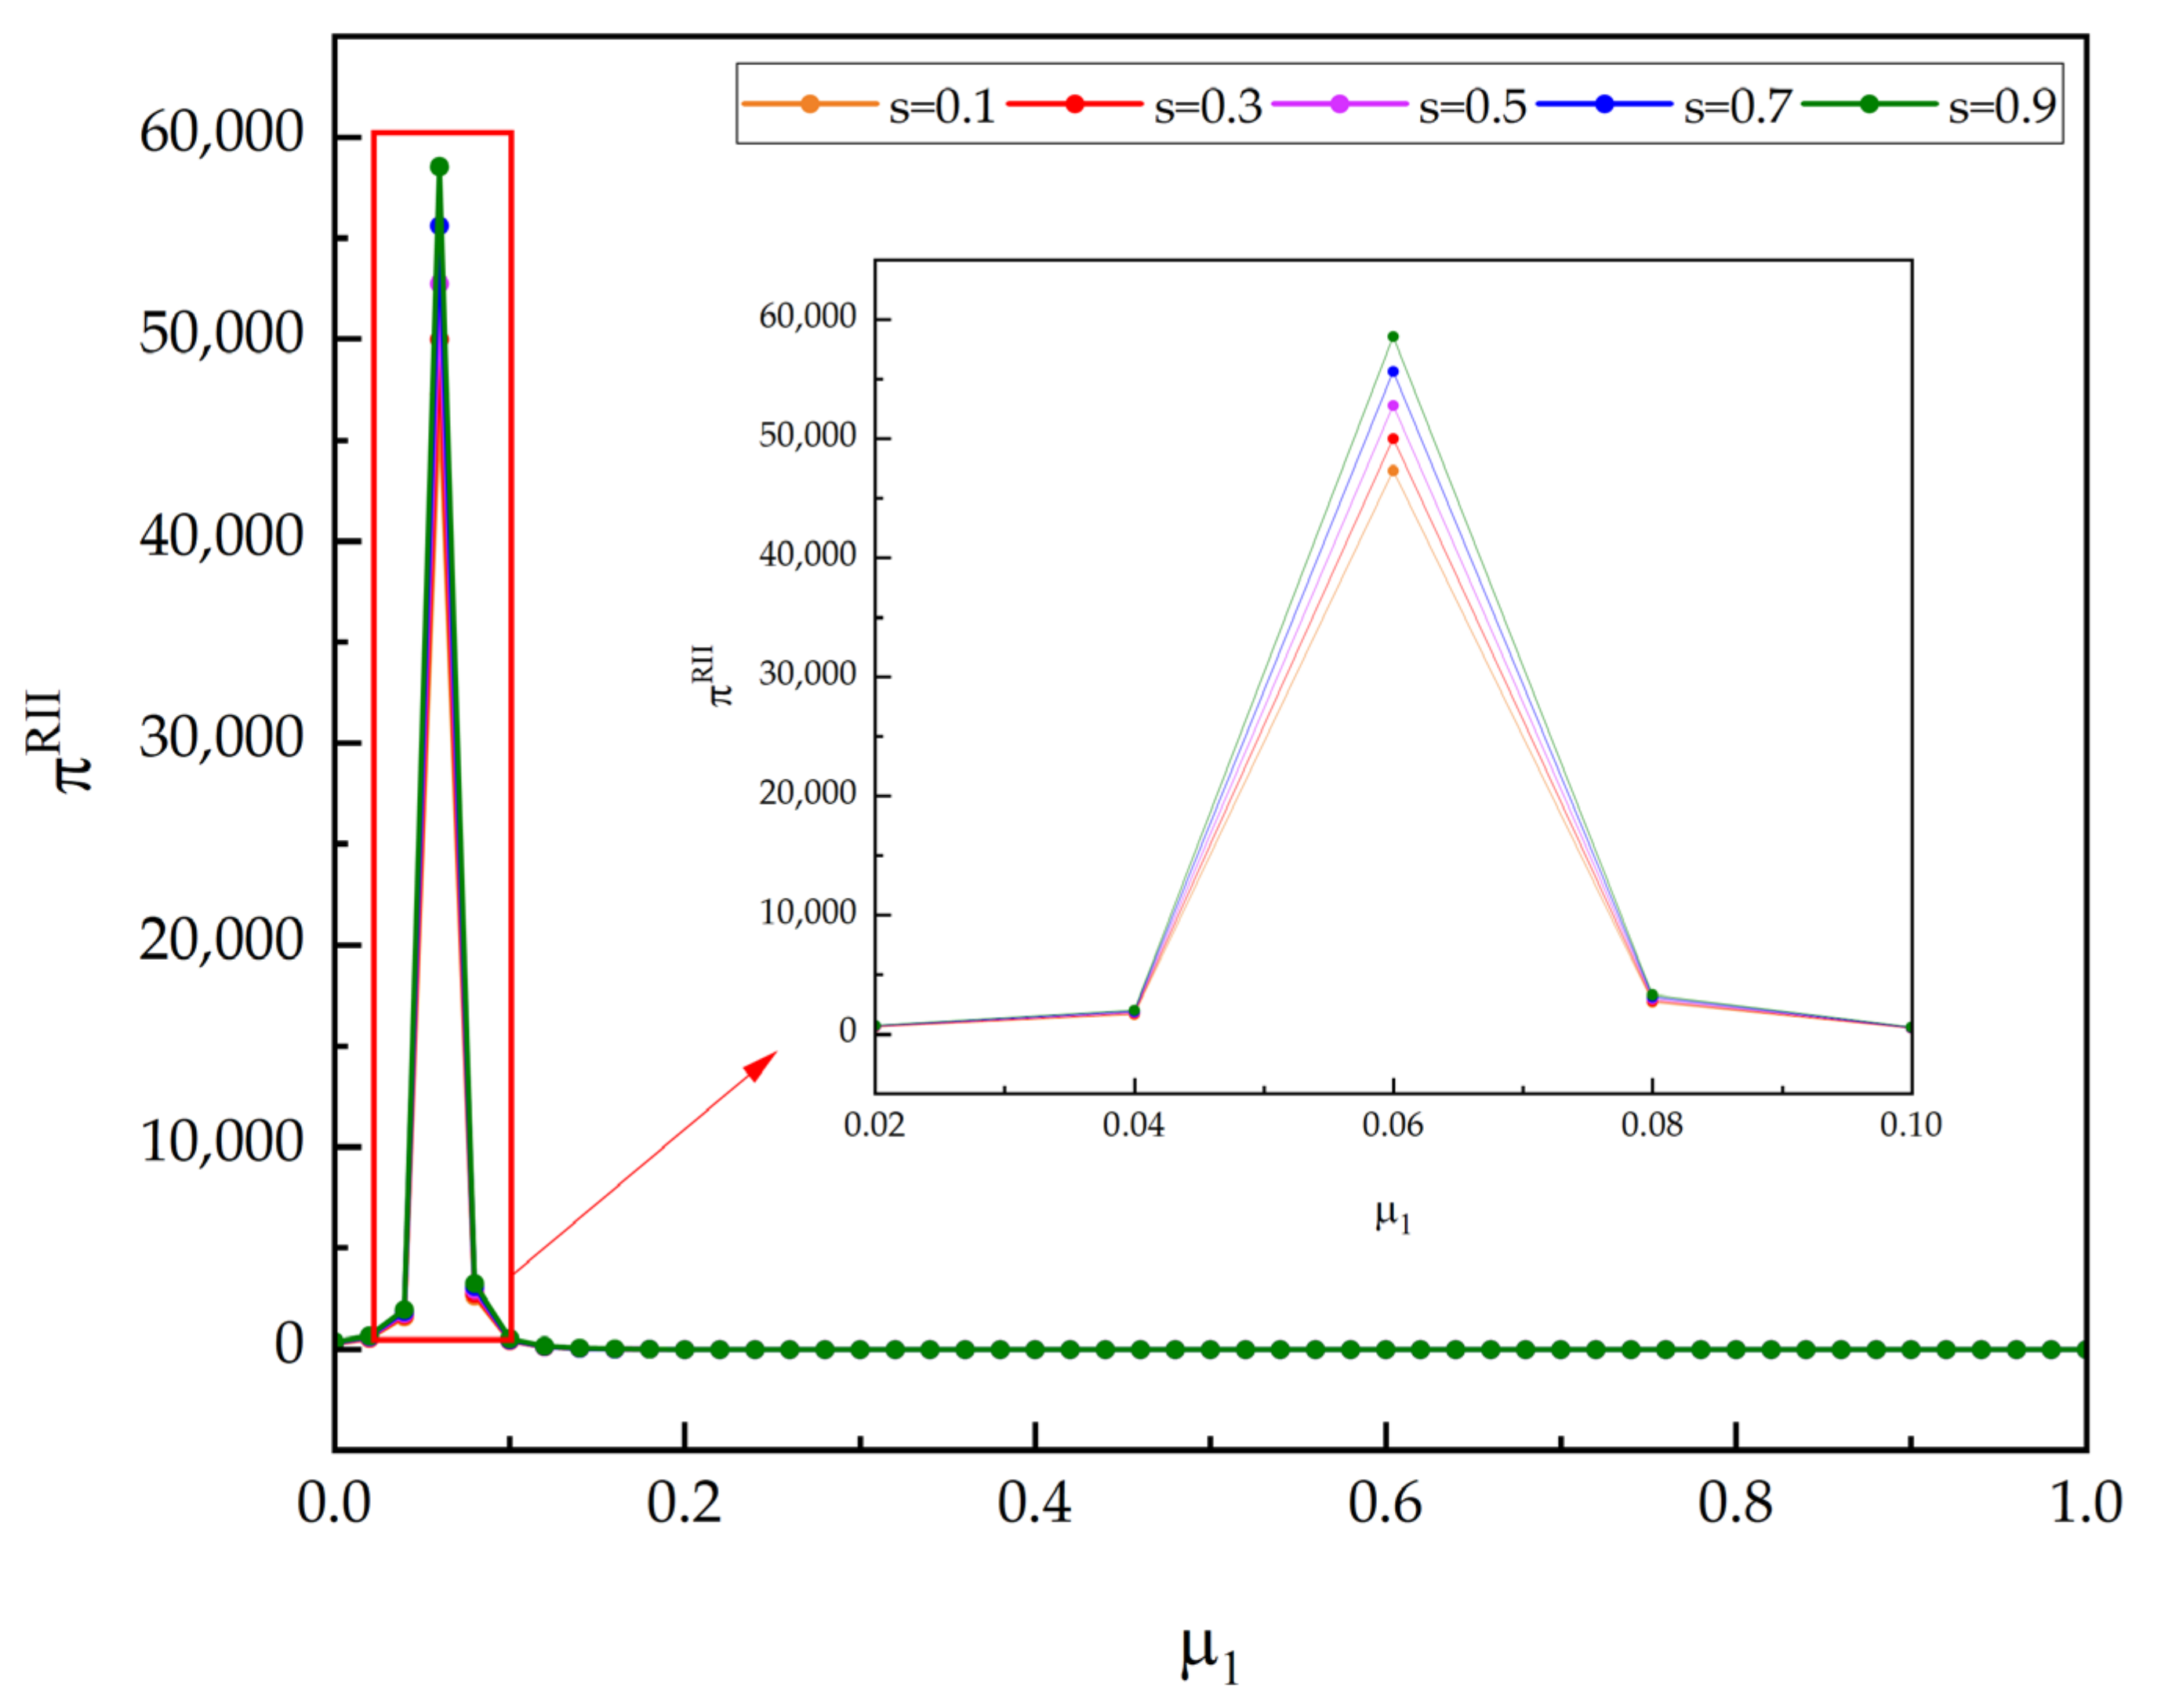
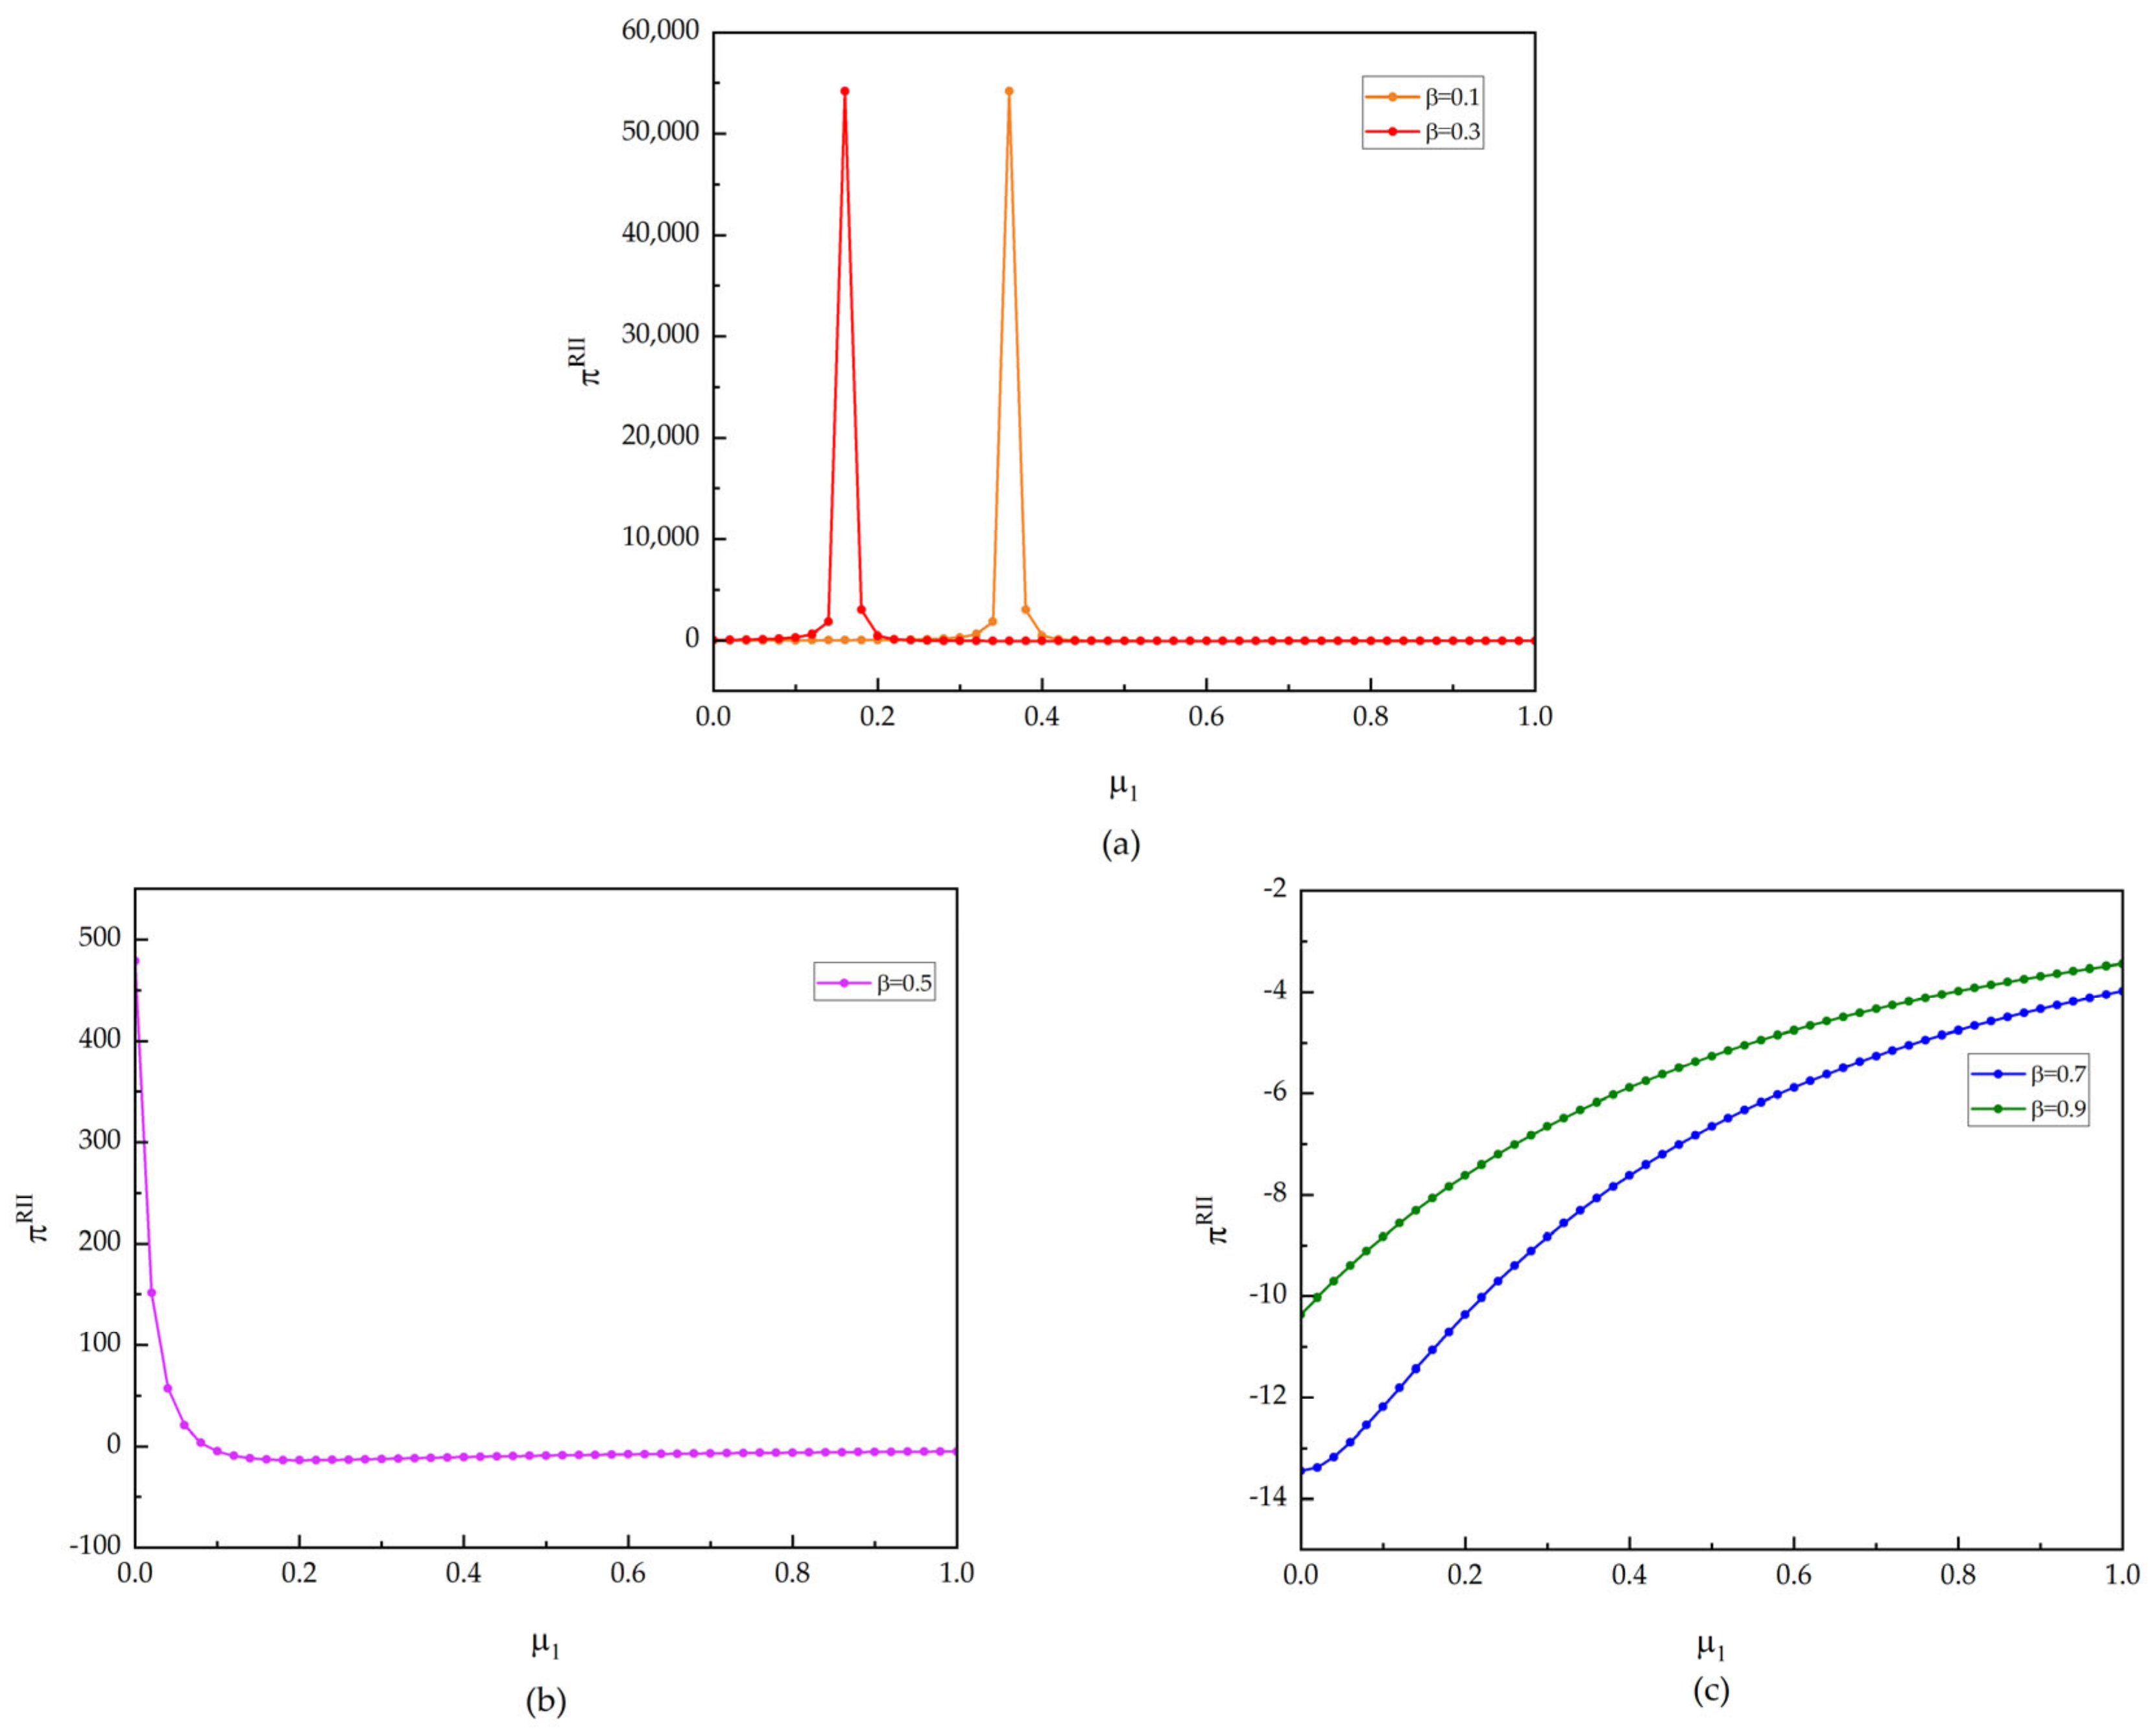
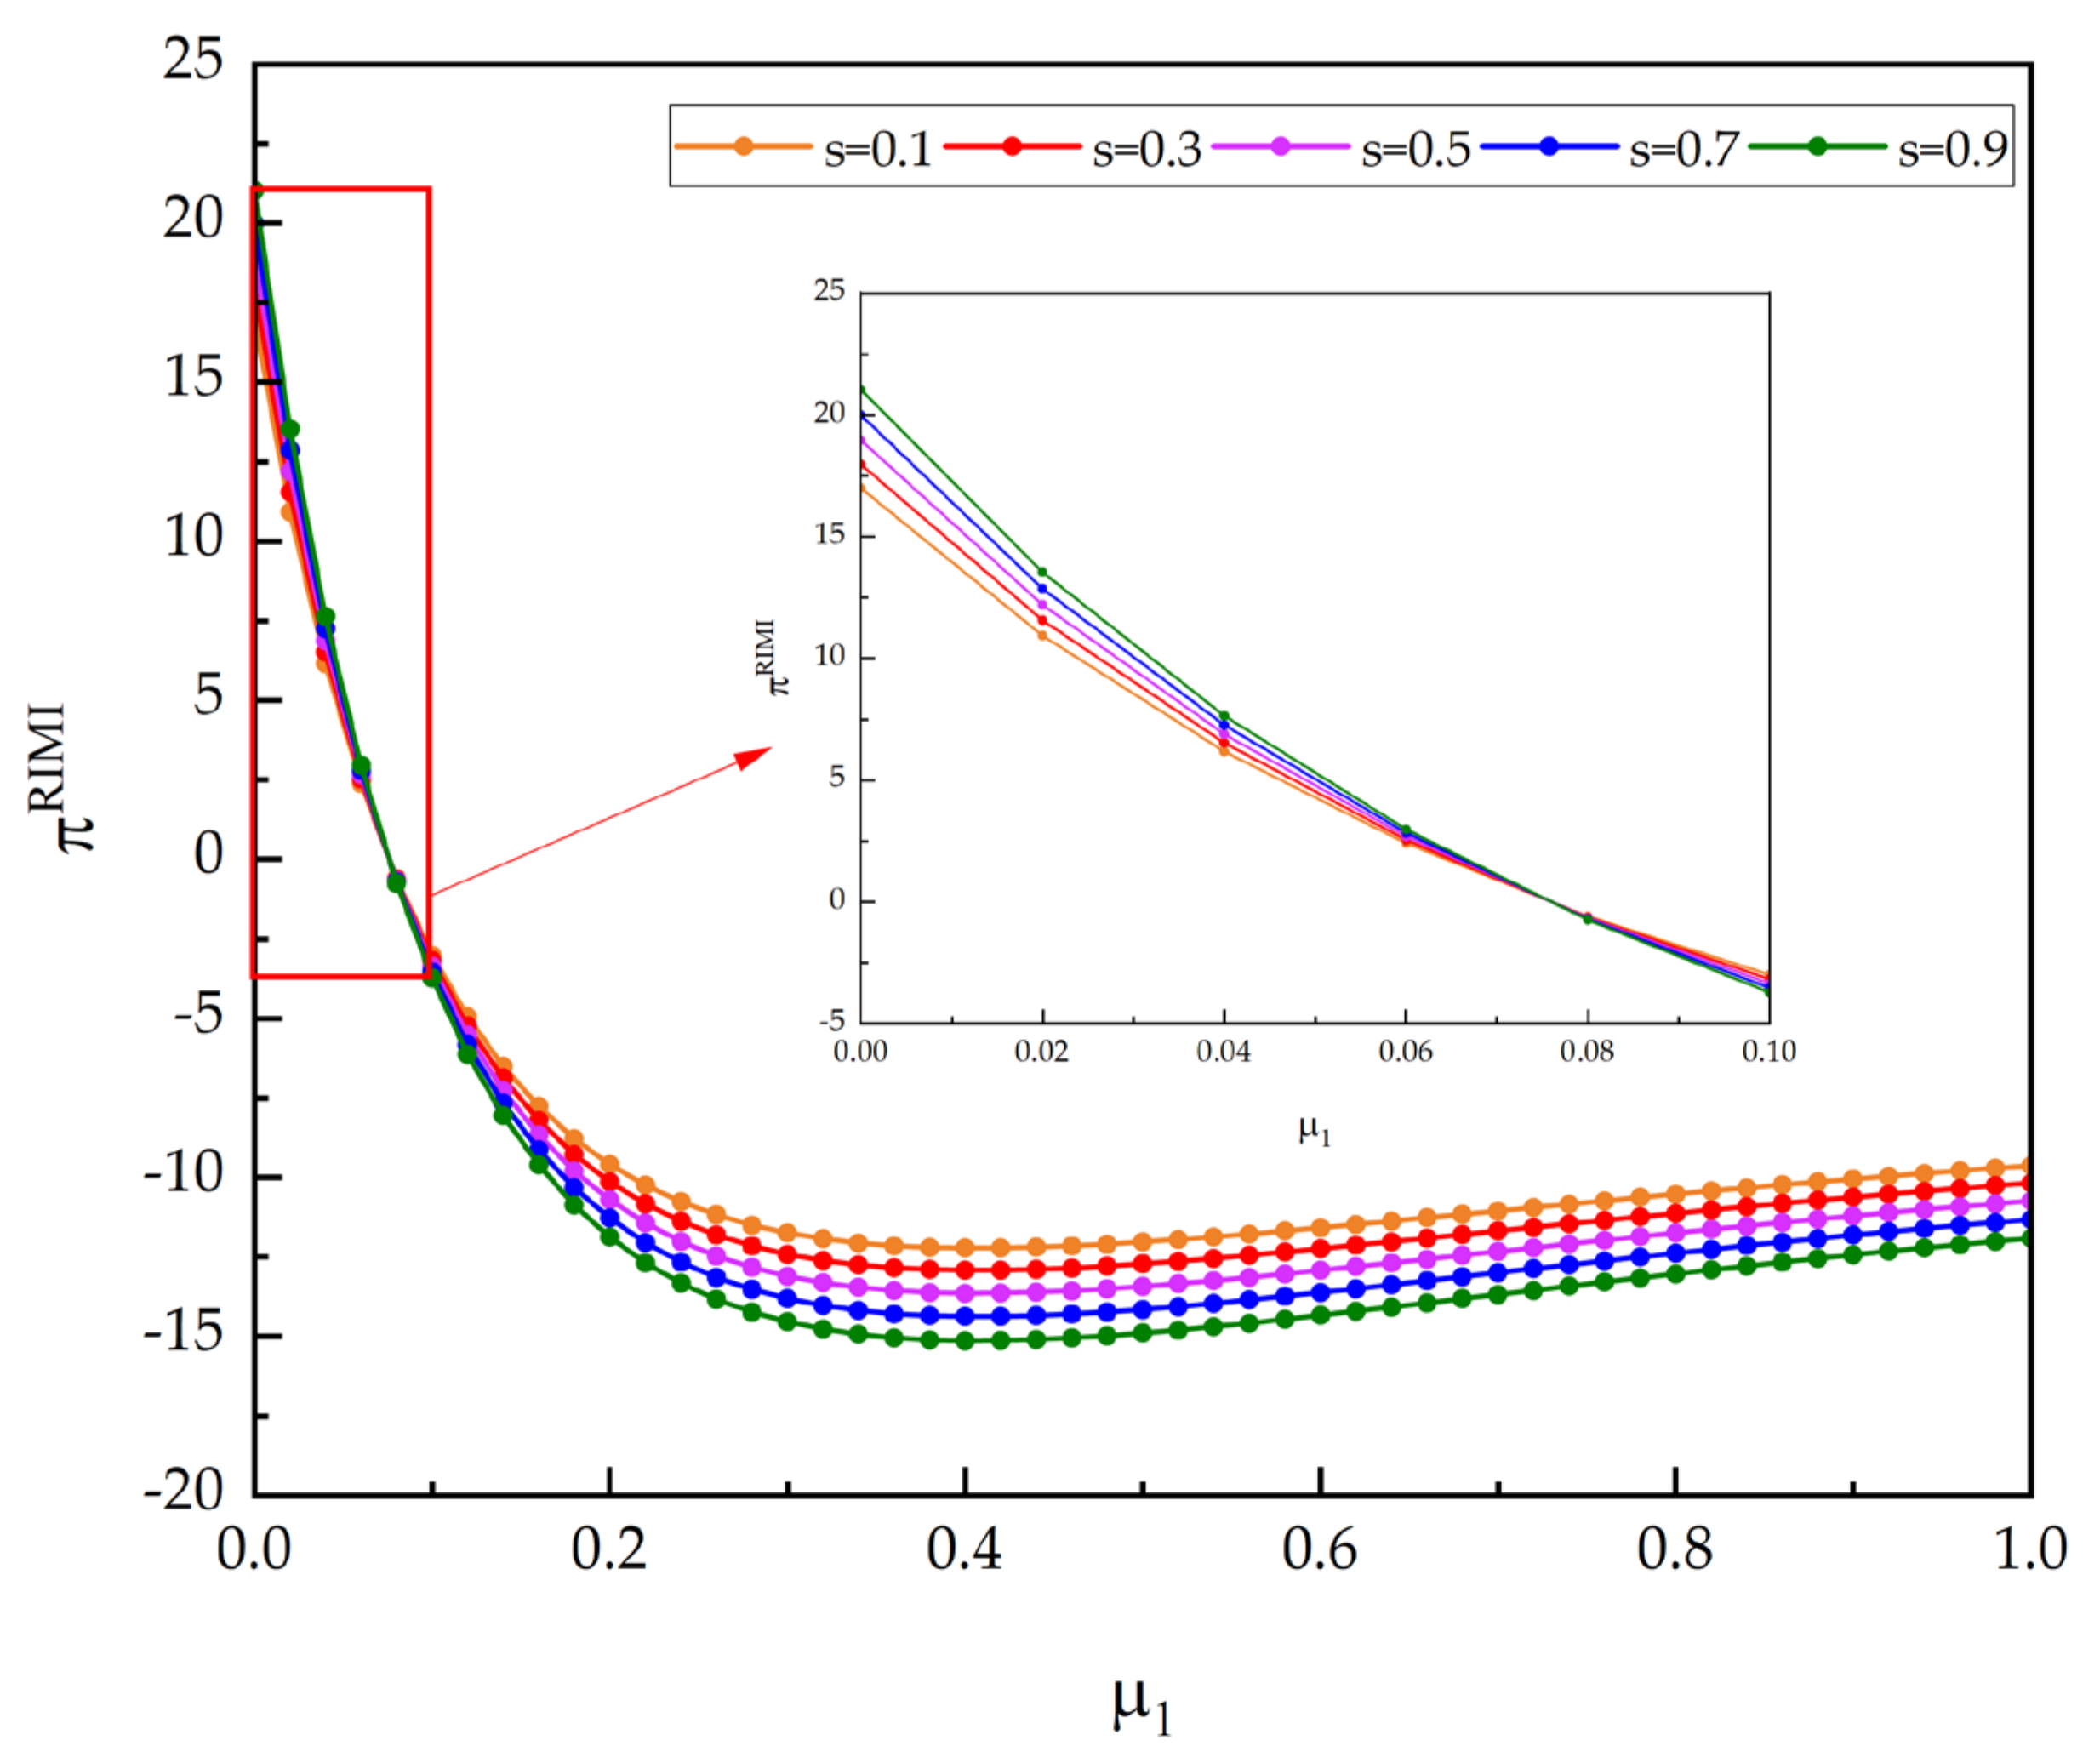
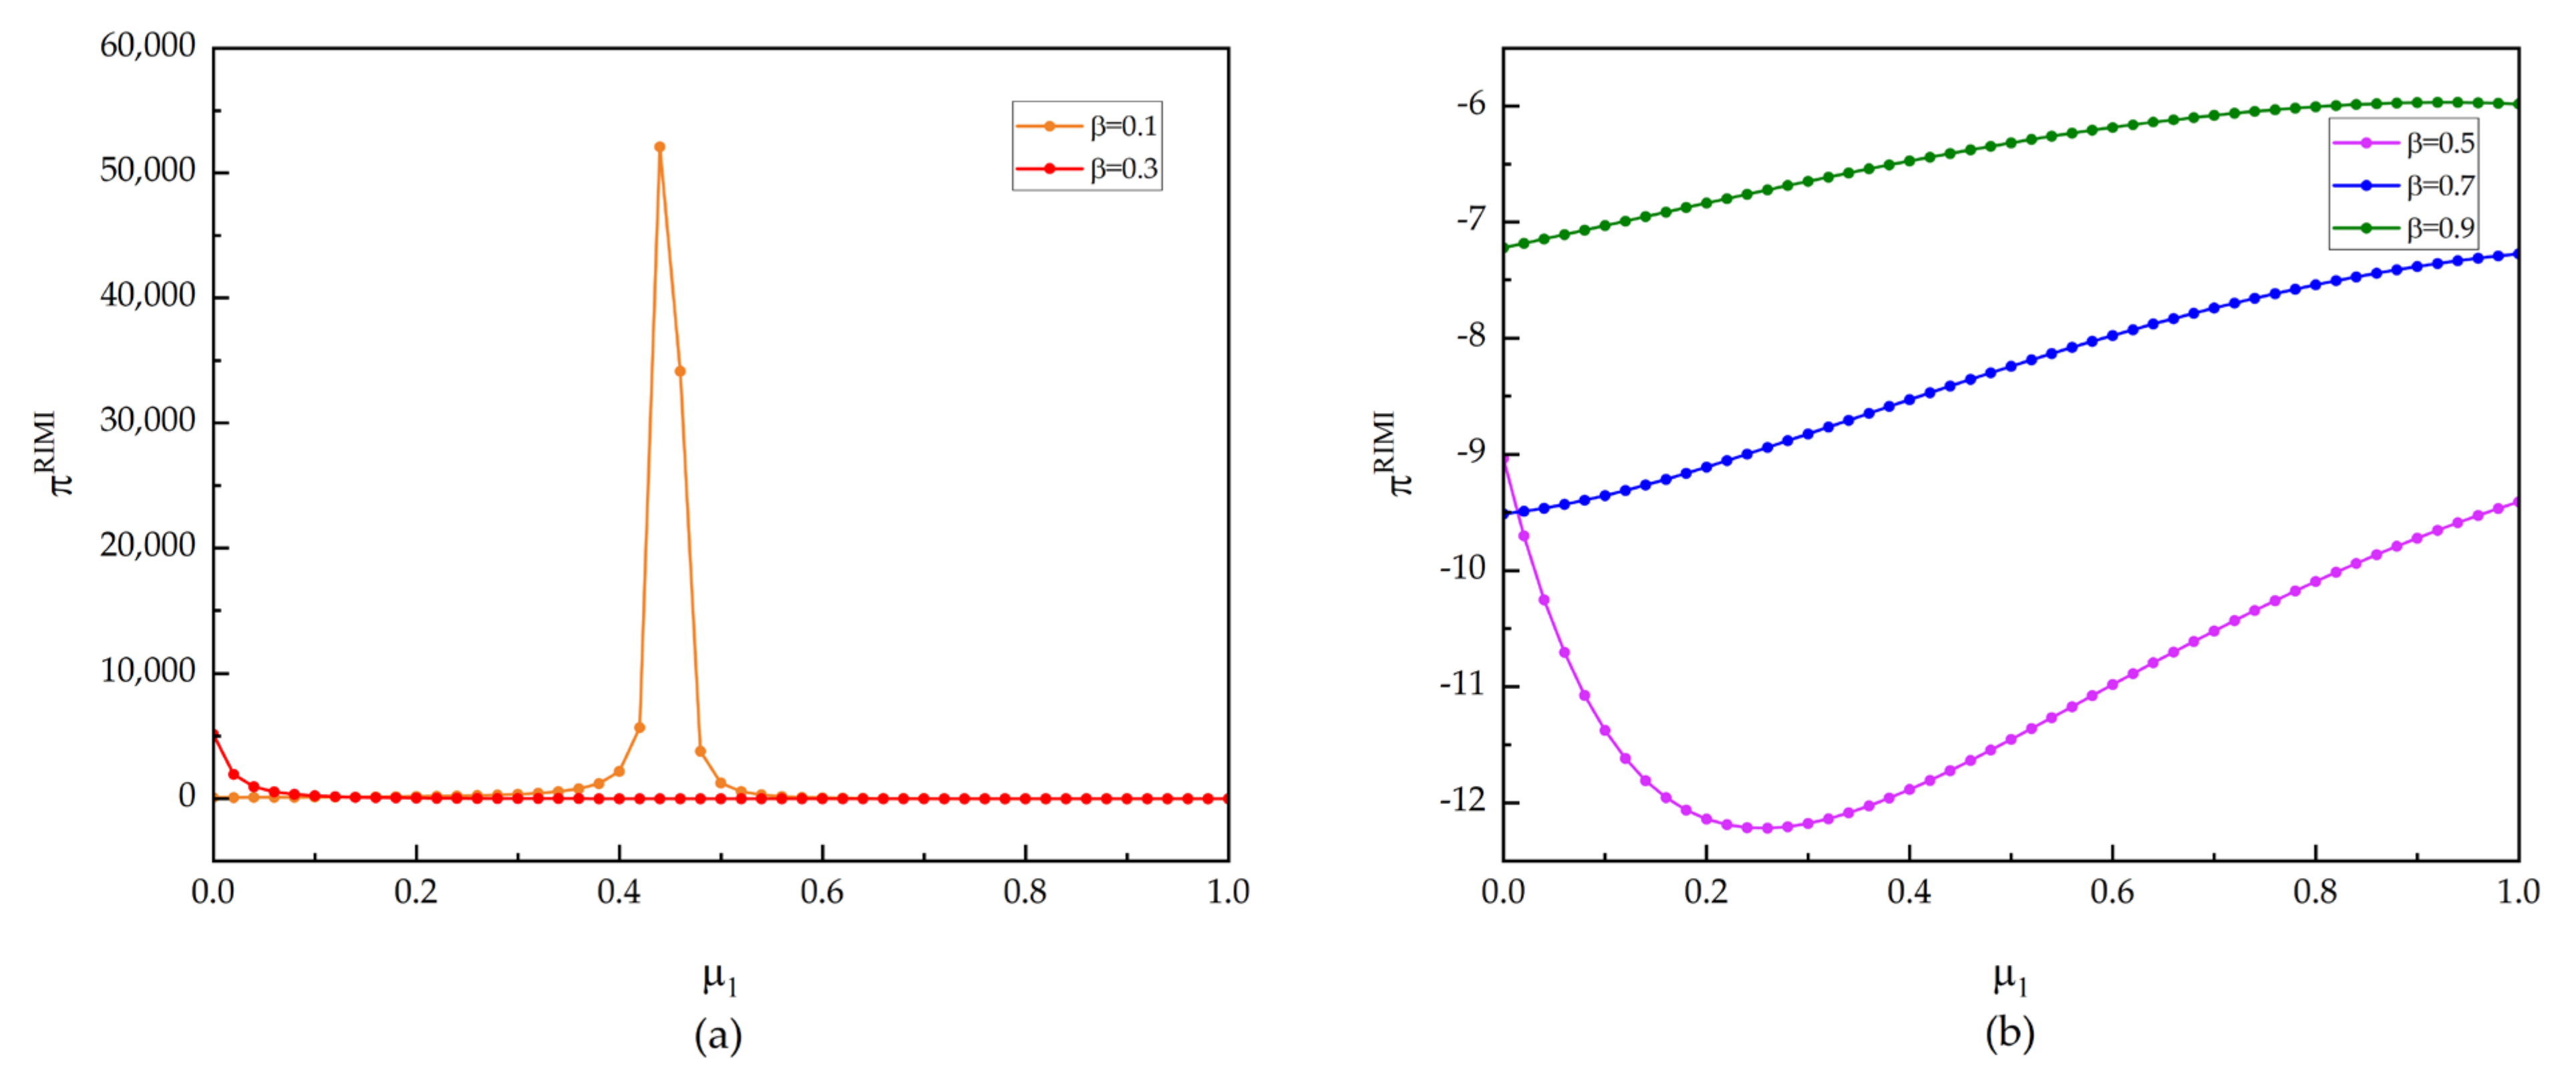
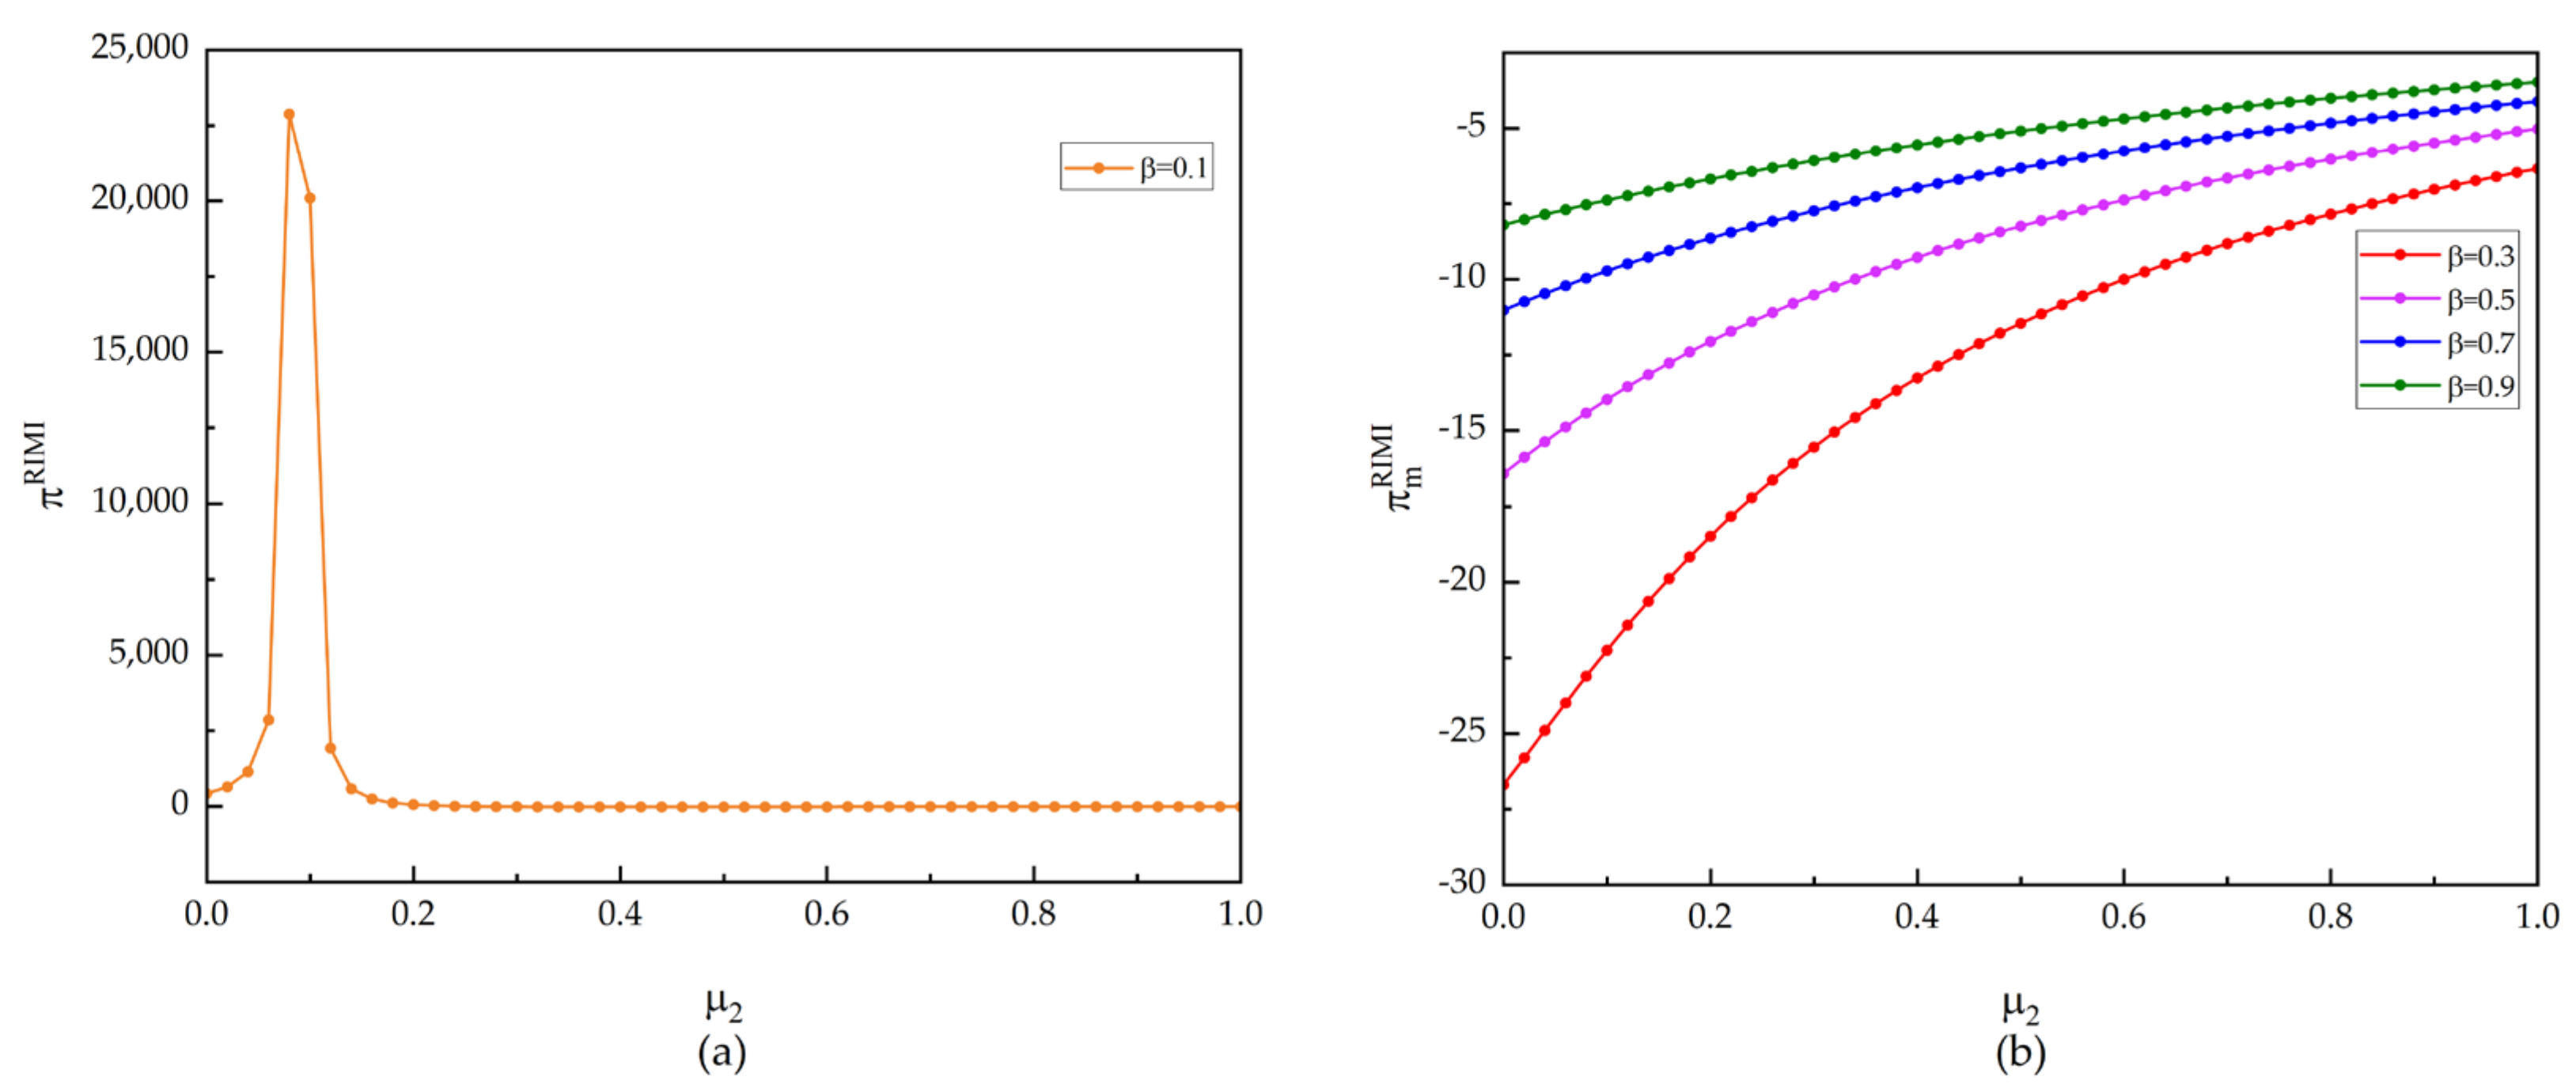
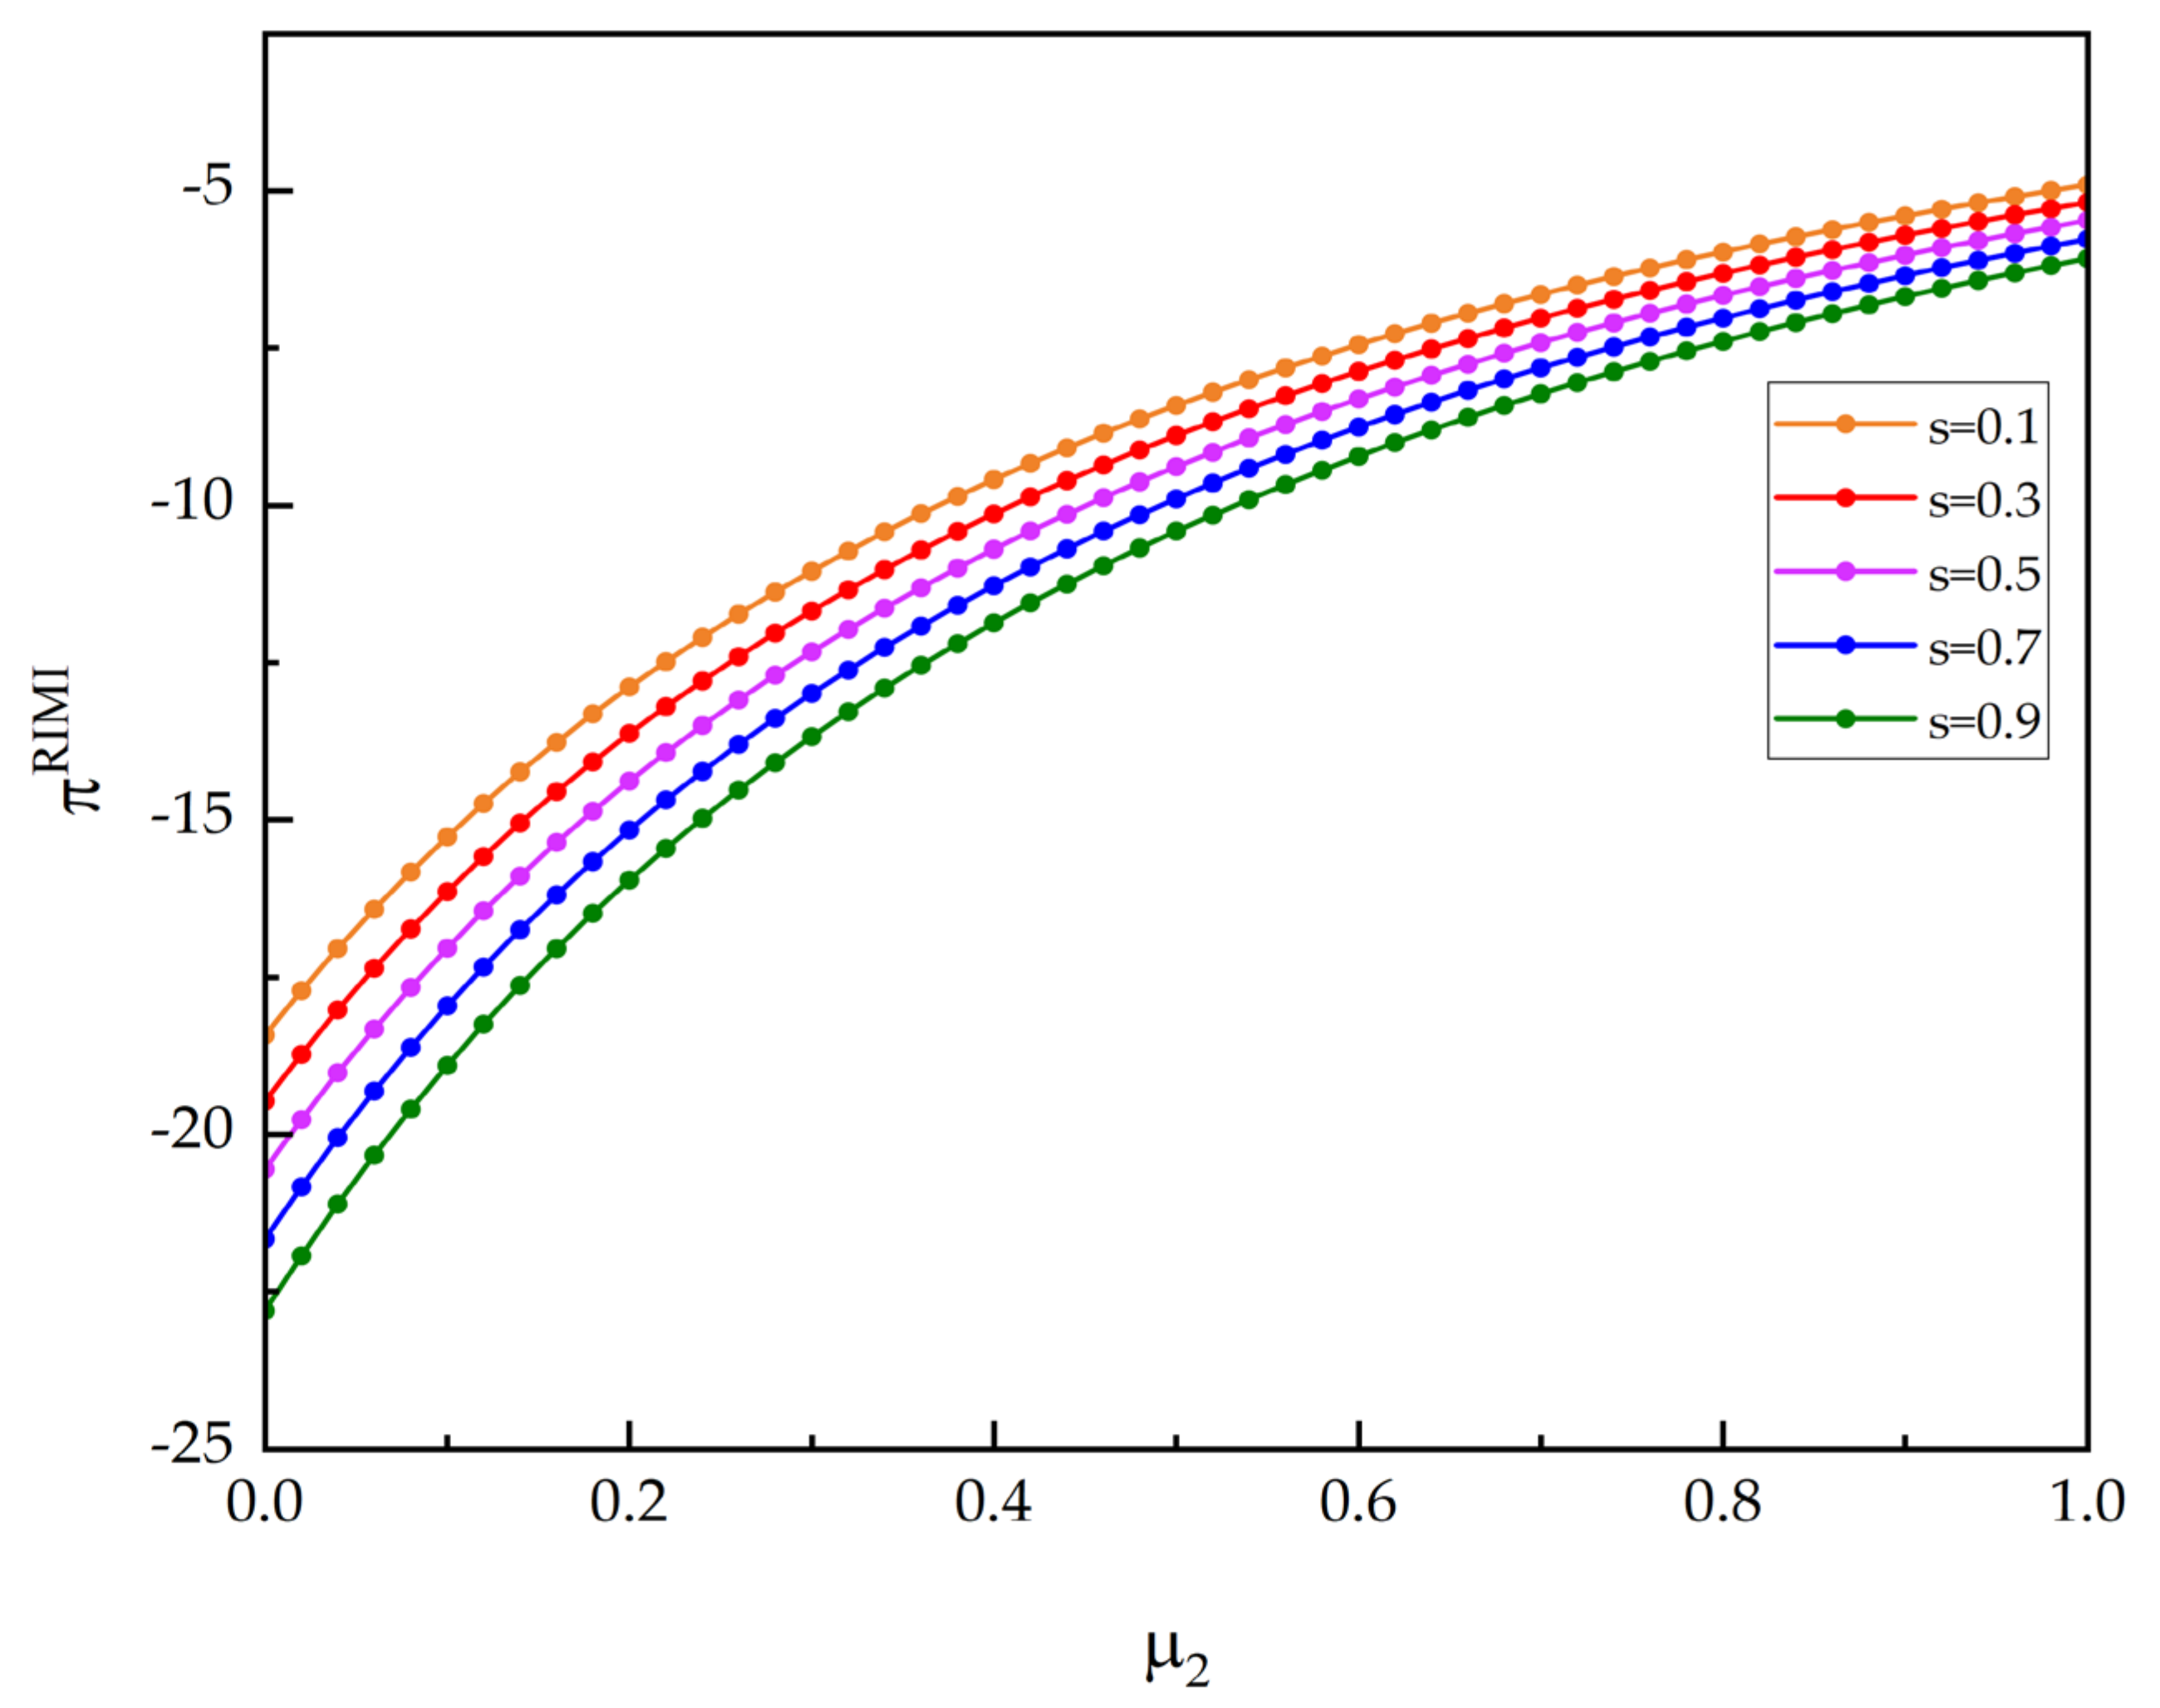
5.3. RIMI
6. Conclusions and Implications
- (1)
- In the CDW recycling PPP project, the two main operators, the remanufacturer and recycler, can achieve their own innovation level as well as profit improvement through technology spillover. When the recycler carries out green independent innovation, the innovation level of the remanufacturer and the recycler and the profit of the recycler are positively correlated with the spillover level of both parties, but the profit of the remanufacturer increases only when the spillover level is small. When the recycler carries out green imitation innovation, the innovation level of the remanufacturer and recycler and the profits of the recycler only decrease with the technology spillover of each other when the spillover level of the remanufacturer is high. The change in the profit of the remanufacturer is more complex, and only when the level of their own spillovers is very high can it help to improve the profits.
- (2)
- In the CDW recycling PPP project, when the recycler chooses different innovation paths, the total profit of the CDW recycling supply chain changes dynamically with the overflow level. When the recycler engages in green independent innovation, the total profit of the CDW recycling supply chain increases with the mutual spillover level of both the remanufacturer and the recycler, then decreases and finally increases, and the length of the decreasing interval is small; when the recycler engages in green imitation innovation, the total profit of the CDW recycling supply chain decreases and then increases with the spillover level of the recycler.
- (3)
- In the CDW recycling PPP project, the government price subsidy to consumers does not always improve the total profit of the CDW recycling supply chain. In the case of non-innovation of the recycler, green independent innovation, and an appropriate spillover level between the recycler and remanufacturer, an increase in government subsidies can improve the total profit of the CDW recycling supply chain. However, when recyclers carry out green imitation innovation, increasing government subsidies will reduce the total profit of the CDW recycling supply chain.
- (4)
- In the CDW recycling PPP project, when the recycler chooses different innovation paths and technology spillovers, the impact of consumer green sensitivity on the total profit of the CDW recycling supply chain is heterogeneous. When the recycler does not innovate, the total profit of the CDW recycling supply chain is positively correlated with the green sensitivity of consumers. The total profit of the CDW recycling supply chain increases only when the recycler carries out green independent innovation, green imitation innovation with a small amount of technology spillover, and when the consumer’s green sensitivity is low. When the green sensitivity of consumers is high, the total profit of the CDW recycling supply chain decreases with the mutual technology spillover under the green independent innovation of the recycler; however, when the recycler imitates green innovation, the increase in the recycler’s spillover level can weaken the negative impact of the remanufacturer’s technology spillover on the total profit of the supply chain.
- (1)
- In the process of recycling CDW, technology spillover has become an important driving force for recyclers and remanufacturers to improve their innovation level. Recyclers and remanufacturers should seize the opportunity of collaborative innovation, make full use of technology spillover to integrate innovation resources, and absorb more heterogeneous knowledge. For example, the China Shandong Electric Construction Company mentioned in the 2021 National Solid Waste Resource Utilization Technology Conference that CDW can be “turned into treasure” and reused by technical means, and there have been successful cases in Shanghai, Wuhan, Zhengzhou, and other cities; meanwhile, Shandong Ming Ran Recycling Resources Co. Ltd. has also had some successful experiences in the comprehensive treatment and recycling of CDW. In addition, remanufacturers and recyclers should reasonably control the degree of technology spillover in the innovation process to maximize their own profits. The government and relevant departments should strive to build a platform for green innovation technology exchange and cooperation to promote innovation cooperation between the two major operators of CDW, recyclers and remanufacturers.
- (2)
- It is suggested that the government and relevant departments should further improve the technology innovation guidance mechanism and form a good technological innovation diffusion mechanism between CDW recyclers and remanufacturers to play the driving role of technology innovation in driving the development of the overall CDW recycling industry. For example, the China Construction Waste Resourcefulness Industry Technology Innovation Strategy Alliance promotes the rapid development of the CDW recycling industry through extensive and in-depth dialogue and cooperation with politicians, entrepreneurs, international organizations, regional governments, etc. It has developed the world’s first carbon methodology to produce recycled concrete mainly from CDW and applied it to several projects in Beijing. However, at the same time, the government and relevant departments should also be aware of the adverse impact of technology spillover on the total profit of the CDW recycling supply chain and should attach great importance to optimizing the allocation of innovation resources and creating a good technological innovation environment.
- (3)
- In CDW recycling PPP projects, the government should adjust the subsidy amount according to the specific situation when subsidizing the price of consumers. When the government subsidy is low, it is more beneficial for recyclers to carry out green imitation innovation; when the government subsidy is high, it is more beneficial for recyclers to carry out green independent innovation. However, even if recyclers do not innovate, the total profit of the CDW recycling supply chain will also increase with an increase in government subsidies. For example, the Housing and Urban-Rural Development Bureau of Yiwu City, Zhejiang Province, has increased its policy support for CDW, and the city’s financial support for enterprises that invest in comprehensive utilization facilities for CDW is given a subsidy of 20% of the total investment in the acquisition of production equipment. Therefore, to promote the technological innovation of recyclers, the government should give consumers appropriate price subsidies according to the innovation path of recyclers.
- (4)
- When recyclers have innovative behaviors, higher consumer green sensitivity is not conducive to increasing the total profit of the CDW recycling supply chain. In China, CDW recycling PPP projects have started to operate in cities along the upstream and downstream of the Yangtze River, core cities in Beijing, Tianjin, and Tang, as well as in the southwest transportation stronghold. Therefore, to promote the smooth implementation of more CDW recycling PPP projects, the government should actively publicize the project at the social level to establish the correct awareness of consumers about the green innovative behaviors of recyclers and remanufacturers in the CDW recycling process. Recyclers and remanufacturers should also make full use of each other’s technology spillover and strive to improve their innovative technology level to meet market demand.
Author Contributions
Funding
Institutional Review Board Statement
Informed Consent Statement
Data Availability Statement
Conflicts of Interest
References
- Vukovic, N.; Pobedinsky, V.; Mityagin, S.; Drozhzhin, A.; Mingaleva, Z. A study on green economy indicators and modeling: Russian context. Sustainability 2019, 11, 4629. [Google Scholar] [CrossRef]
- Wu, H.Y.; Zuo, J.; Zillante, G.; Wang, J.Y.; Yuan, H.P. Status quo and future directions of construction and demolition waste research: A critical review. J. Clean. Prod. 2019, 240, 118163. [Google Scholar] [CrossRef]
- Wang, Q.F.; Yang, Y.; Luan, D.; Qin, S. Current Situation and Comprehensive Treatment of Construction Waste. Fresenius Environ. Bull. 2020, 29, 8751–8756. [Google Scholar]
- Statistics. Eurostat. Available online: https://ec.europa.eu/eurostat/databrowser/view/cei_wm040/default/table?lang=en (accessed on 15 January 2023).
- Borrachero, M.V.; Payá, J.; Brito, S.; Segura, Y.P.; Soriano, L.; Tashima, M.M.; Monzó, J.M. Reusing construction and demolition waste to prepare alkali-activated cement. Materials 2022, 15, 3437. [Google Scholar] [CrossRef]
- Huang, B.J.; Wang, X.Y.; Kua, H.W.; Geng, Y.; Bleischwitz, R.; Ren, J.Z. Construction and demolition waste management in China through the 3R principle. Resour. Conserv. Recycl. 2018, 129, 36–44. [Google Scholar] [CrossRef]
- Yazdani, M.; Kabirifar, K.; Frimpong, B.E.; Shariati, M.; Mirmozaffari, M.; Boskabadi, A. Improving construction and demolition waste collection service in an urban area using a simheuristic approach: A case study in Sydney, Australia. J. Clean. Prod. 2021, 280, 124138. [Google Scholar] [CrossRef]
- Bai, X.P.; Wang, X.W. A Novel Planning Method of Urban Building Wastes for Environment Protection and Sustainable Development. SAGE Open 2020, 10, 1–10. [Google Scholar] [CrossRef]
- Tam, V.W. Economic comparison of concrete recycling: A case study approach. Resour. Conserv. Recycl. 2008, 52, 821–828. [Google Scholar] [CrossRef]
- Lyytimäki, J.; Antikainen, R.; Hokkanen, J.; Koskela, S.; Kurppa, S.; Känkänen, R.; Seppälä, J. Developing Key Indicators of Green Growth. Sustain. Dev. 2017, 26, 51–64. [Google Scholar] [CrossRef]
- Ramos, M.; Martinho, G. Influence of construction company size on the determining factors for construction and demolition waste management. Waste Manag. 2021, 136, 295–302. [Google Scholar] [CrossRef]
- Liu, J.K.; Hua, Z.W.; Pang, Y.S.; Wang, X.T. Risk sharing for PPP project in construction waste recycling industry in China. Environ. Sci. Pollut. Res. 2022, 29, 12614–12628. [Google Scholar] [CrossRef]
- Hammond, J.; Bailey, S.; Gore, O.; Checkland, K.; Darley, S.; McDonald, R.; Blakeman, T. The problem of success and failure in public-private innovation partnerships. J. Soc. Policy 2021, 51, 771–791. [Google Scholar] [CrossRef]
- Hermans, F.; Geerling-Eiff, F.; Potters, J.; Klerkx, L. Public-private partnerships as systemic agricultural innovation policy instruments-Assessing their contribution to innovation system function dynamics. NJAS-Wagen J. Life Sci. 2018, 88, 76–95. [Google Scholar] [CrossRef]
- Willems, T.; Van Dooren, W. (De)Politicization Dynamics in Public-Private Partnerships: Lessons from a Comparison between UK and Flemish PPP Policy. Public Manag. Rev. 2016, 18, 199–220. [Google Scholar] [CrossRef]
- Wang, L.G.; Shrestha, A.; Zhang, W.; Wang, G.B. Government guarantee decisions in PPP wastewater treatment expansion projects. Water 2020, 12, 3352. [Google Scholar] [CrossRef]
- Rajan, T.A.; Gopinath, G.; Behera, M. PPPs and project overruns: Evidence from road projects in India. J. Constr. Eng. Manag. 2014, 140, 04013070. [Google Scholar] [CrossRef]
- Wang, H.M.; Xiong, W.; Wu, G.D.; Zhu, D.J. Public-private partnership in public administration discipline: A literature review. Public Manag. Rev. 2018, 20, 293–316. [Google Scholar] [CrossRef]
- Feng, S.L.; Chong, Y.; Li, G.X.; Zhang, S.B. Digital finance and innovation inequality: Evidence from green technological innovation in China. Environ. Sci. Pollut. Res. 2022, 29, 87884–87900. [Google Scholar] [CrossRef]
- Hong, M.; Li, Z.H.; Drakeford, B. Do the green credit guidelines affect corporate green technology innovation? Empirical research from China. Int. J. Environ. Res. Public Health 2021, 18, 1682. [Google Scholar] [CrossRef]
- Blaut, J.M. Diffusionism: A uniformitarian critique. Ann. Assoc. Am. Geogr. 1987, 77, 30–47. [Google Scholar] [CrossRef]
- Tan, R.W.; Qing, X.; Yang, J.S.; Zhang, J.; Li, D. Analysis on Recycling Channel Selection of Construction and Demolition Waste in China from the Perspective of Supply Chain. Int. J. Environ. Res. Public Health 2022, 19, 4975. [Google Scholar] [CrossRef] [PubMed]
- Du, Y.P.; Wang, H.H. Green Innovation Sustainability: How Green Market Orientation and Absorptive Capacity Matter? Sustainability 2022, 14, 8192. [Google Scholar] [CrossRef]
- Liu, X.F.; Yu, H.Z.; Lai, G.W.; Wang, S.X.; Xie, Y.Y. Imitation or Innovation? Research on the Path Selection of Enterprise Performance Improvement from the Perspective of Organizational Ecology. Sustainability 2022, 14, 7223. [Google Scholar] [CrossRef]
- Wang, C.B.; Huang, Z.G. Econometric analysis of the impact of financial structure on innovation based on the fixed effects panel model. Math. Probl. Eng. 2021, 2021, 3022421. [Google Scholar] [CrossRef]
- Wang, M.Y.; Li, Y.M.; Li, J.Q.; Wang, Z.T. Green process innovation, green product innovation and its economic performance improvement paths: A survey and structural model. J. Environ. Manag. 2021, 297, 113282. [Google Scholar] [CrossRef]
- Aslani, A.; Heydari, J. Transshipment contract for coordination of a green dual-channel supply chain under channel disruption. J. Clean. Prod. 2019, 223, 596–609. [Google Scholar] [CrossRef]
- Wang, L.; Xu, T.J.; Qin, L.H. A study on supply chain emission-reduction level based on carbon tax and consumers’ low-carbon preferences under stochastic demand. Math. Probl. Eng. 2019, 2019, 1621395. [Google Scholar] [CrossRef]
- Chekima, B.; Wafa, S.A.W.S.K.; Igau, O.A.; Chekima, S.; Sondoh, S.L., Jr. Examining green consumerism motivational drivers: Does premium price and demographics matter to green purchasing? J. Clean. Prod. 2016, 112, 3436–3450. [Google Scholar] [CrossRef]
- Fan, R.G.; Wang, Y.T.; Chen, F.Z.; Du, K.; Wang, Y.Y. How do government policies affect the diffusion of green innovation among peer enterprises?—An evolutionary-game model in complex networks. J. Clean. Prod. 2022, 364, 132711. [Google Scholar] [CrossRef]
- Zarnikau, J. Consumer demand for ‘green power’and energy efficiency. Energy Policy 2003, 31, 1661–1672. [Google Scholar] [CrossRef]
- Brandao, R.; Hosseini, M.R.; Macedo, A.N.; Melo, A.C.; Martek, I. Public administration strategies that stimulate reverse logistics within the construction industry: A conceptual typology. Eng. Constr. Arch. Manag. 2022, 29, 2924–2949. [Google Scholar] [CrossRef]
- Munaro, M.R.; Tavares, S.F.; Bragança, L. Towards circular and more sustainable buildings: A systematic literature review on the circular economy in the built environment. J. Clean. Prod. 2020, 260, 121134. [Google Scholar] [CrossRef]
- Liu, H.Y.; Long, H.Y.; Li, X.W. Identification of critical factors in construction and demolition waste recycling by the grey-DEMATEL approach: A Chinese perspective. Environ. Sci. Pollut. Res. 2020, 27, 8507–8525. [Google Scholar] [CrossRef]
- Lu, W.; Du, L.; Feng, Y.B. Decision making behaviours and management mechanisms for construction and demolition waste recycling based on public–private partnership. Environ. Sci. Pollut. Res. 2022, 29, 82078–82097. [Google Scholar] [CrossRef]
- Xu, J.; Cao, Y.R. Innovation, the flying geese model, IPR protection, and sustainable economic development in China. Sustainability 2019, 11, 5707. [Google Scholar] [CrossRef]
- Zhang, H.F.; Vorobeychik, Y. Empirically grounded agent-based models of innovation diffusion: A critical review. Artif. Intell. Rev. 2019, 52, 707–741. [Google Scholar] [CrossRef]
- Aldieri, L.; Carlucci, F.; Vinci, C.P.; Yigitcanlar, T. Environmental innovation, knowledge spillovers and policy implications: A systematic review of the economic effects literature. J. Clean. Prod. 2019, 239, 118051. [Google Scholar] [CrossRef]
- Huang, Y.F.; Pei, J.S. Imported intermediates, technology spillover and green development: Evidence from Chinese firms. Front. Environ. Sci. 2022, 10, 909055. [Google Scholar] [CrossRef]
- Ye, T.L.; Li, G.L. Research on the Innovation Diffusion Mechanism and the Diffusion Effect of the Beijing-Tianjin-Hebei Region. Comp. Econ. Soc. Syst. 2019, 35, 166–177. (In Chinese) [Google Scholar]
- Nie, L.B.; Gong, H.; Zhao, D.X.; Lai, X.P.; Chang, M.Y. Heterogeneous knowledge spillover channels in universities and green technology innovation in local firms: Stimulating quantity or quality? Front. Psychol. 2022, 13, 943655. [Google Scholar] [CrossRef]
- Nikolaeva, R. Interorganizational imitation heuristics arising from cognitive frames. J. Bus. Res. 2014, 67, 1758–1765. [Google Scholar] [CrossRef]
- Collins, T. Imitation: A catalyst for innovation and endogenous growth. Econ. Model 2015, 51, 299–307. [Google Scholar] [CrossRef]
- Lee, C.; Kim, J.H.; Lee, D. Intra-industry innovation, spillovers, and industry evolution: Evidence from the Korean ICT industry. Telemat. Inform. 2017, 34, 1503–1513. [Google Scholar] [CrossRef]
- Riehl, K.; Kiesel, F.; Schiereck, D. Political and socioeconomic factors that determine the financial outcome of successful green innovation. Sustainability 2022, 14, 3651. [Google Scholar] [CrossRef]
- Barman, A.; Das, R.; De, P.K.; Sana, S.S. Optimal pricing and greening strategy in a competitive green supply chain: Impact of government subsidy and tax policy. Sustainability 2021, 13, 9178. [Google Scholar] [CrossRef]
- Maniatis, P. Investigating factors influencing consumer decision-making while choosing green products. J. Clean. Prod. 2016, 132, 215–228. [Google Scholar] [CrossRef]
- Zhao, L.M.; Chen, Y.Q. Optimal subsidies for green products: A maximal policy benefit perspective. Symmetry 2019, 11, 63. [Google Scholar] [CrossRef]
- Gong, M.; Dai, A.M. Multiparty evolutionary game strategy for green technology innovation under market orientation and pandemics. Front. Public Health 2022, 9, 821172. [Google Scholar] [CrossRef]
- Lin, R.J.; Tan, K.H.; Geng, Y. Market demand, green product innovation, and firm performance: Evidence from Vietnam motorcycle industry. J. Clean. Prod. 2013, 40, 101–107. [Google Scholar] [CrossRef]
- Siedschlag, I.; Meneto, S.; Koecklin, M.T. Enabling Green Innovations for the Circular Economy: What Factors Matter? Sustainability 2022, 14, 12314. [Google Scholar] [CrossRef]
- Cappelli, R.; Czarnitzki, D.; Kraft, K. Sources of spillovers for imitation and innovation. Res. Policy 2014, 43, 115–120. [Google Scholar] [CrossRef]
- Audretsch, D.B.; Belitski, M. The knowledge spillover of innovation. Ind. Corp. Change 2022, 31, 1329–1357. [Google Scholar] [CrossRef]
- He, M.; Lee, J. Social culture and innovation diffusion: A theoretically founded agent-based model. J. Evol. Econ. 2020, 30, 1109–1149. [Google Scholar] [CrossRef]
- Tsiodra, M.; Chronopoulos, M. A bi-level model for optimal capacity investment and subsidy design under risk aversion and uncertainty. J. Oper. Res. Soc. 2022, 73, 1787–1799. [Google Scholar] [CrossRef]
- Mohsin, A.K.M.; Hossain, S.F.A.; Tushar, H.; Iqbal, M.M.; Hossain, A. Differential game model and coordination model for green supply chain based on green technology research and development. Heliyon 2021, 7, e07811. [Google Scholar] [CrossRef]
- Hong, Z.F.; Guo, X.L. Green product supply chain contracts considering environmental responsibilities. Omega 2019, 83, 155–166. [Google Scholar] [CrossRef]
- Meng, Q.F.; Li, M.W.; Liu, W.Y.; Li, Z.; Zhao, J. Pricing policies of dual-channel green supply chain: Considering government subsidies and consumers’ dual preferences. Sustainability 2021, 26, 1021–1030. [Google Scholar] [CrossRef]
- Yan, T.Z. Discussion on the reverse control mechanism and strategy of retailers in commodity supply chain. Bus. Econ. Res. 2017, 724, 21–23. (In Chinese) [Google Scholar]
- EI Ouardighi, F.; Sim, J.; Kim, B. Pollution accumulation and abatement policies in two supply chains under vertical and horizontal competition and strategy types. Omega 2021, 98, 102108. [Google Scholar] [CrossRef]
- Hu, Y.; Fisher-Vanden, K.; Su, B.Z. Technological spillover through industrial and regional linkages: Firm-level evidence from China. Econ. Model 2020, 89, 523–545. [Google Scholar] [CrossRef]
- Gao, P.; Du, J.G.; Nie, J.J.; Zhu, B.X. The Influence of Consumer’s Brand Loyalty on Brand Remanufacturing Market Strategy. China Manag. Sci. 2021, 29, 47–58. (In Chinese) [Google Scholar]
- Xu, L.; Wang, C.X.; Li, H. Decision and coordination of low-carbon supply chain considering technological spillover and environmental awareness. Sci. Rep. 2017, 7, 3107. [Google Scholar] [CrossRef] [PubMed]
- Zhang, H.Y.; Xu, H.Y.; Pu, X.J. A cross-channel return policy in a green dual-channel supply chain considering spillover effect. Sustainability 2020, 12, 2171. [Google Scholar] [CrossRef]
- Xie, J.M.; Jiang, M.T.; Qin, Q.; He, Y.; Xie, D.R. Recycling model of low-carbon and closed-loop supply chain considering government subsidies. Energy Sci. Eng. 2022, 10, 4382–4396. [Google Scholar] [CrossRef]
- Su, C.; Liu, X.J.; Du, W.Y. Green supply chain decisions considering consumers’ low-carbon awareness under different government subsidies. Sustainability 2020, 12, 2281. [Google Scholar] [CrossRef]
- Han, Y.T.; Zheng, H.X.; Huang, Y.C.; Li, X. Considering consumers’ green preferences and government subsidies in the decision making of the construction and demolition waste recycling supply chain: A stackelberg game approach. Buildings 2022, 12, 832. [Google Scholar] [CrossRef]
- Mu, Z.Y.; Li, Q.J.; Dai, G.X.; Li, K.; Zhang, G.M. Government subsidy policy and online selling strategy in a platform supply chain with green RD and DDM activities. Sustainability 2022, 14, 9658. [Google Scholar] [CrossRef]
- Li, L.; Li, W.M. The Promoting Effect of Green Technology Innovations on Sustainable Supply Chain Development: Evidence from China’s Transport Sector. Sustainability 2022, 14, 4673. [Google Scholar] [CrossRef]
- Bi, K.X.; Shen, N. Green Innovation System for Manufacturing Industry: Transmission Mechanism of Knowledge Spillover. Acad. Exch. 2016, 32, 122–128. (In Chinese) [Google Scholar]
- He, J.H.; Lei, Y.L.; Fu, X. Do consumer’s green preference and the reference price effect improve green innovation? A theoretical model using the food supply chain as a case. Int. J. Environ. Res. Public Health 2019, 16, 5007. [Google Scholar] [CrossRef]
- Wang, W.; Liu, X.J.; Zhang, W.S.; Gao, G.; Zhang, H. Coordination of a green supply chain with one manufacturer and two competing retailers under different power structures. Discret. Dyn. Nat. Soc. 2019, 2019, 3453850. [Google Scholar] [CrossRef]
- Wang, D.P.; Ge, G.; Zhou, Y.; Zhu, M.Y. Pricing-decision analysis of green supply chain with two competitive manufacturers considering horizontal and vertical fairness concerns. Environ. Sci. Pollut. Res. 2022, 29, 66235–66258. [Google Scholar] [CrossRef]
- Zhang, F.F.; Zhang, Z.X.; Xue, Y.W.; Zhang, J.; Che, Y. Dynamic green innovation decision of the supply chain with innovating and free-riding manufacturers: Cooperation and spillover. Complexity 2020, 2020, 8937847. [Google Scholar] [CrossRef]
- Farrell, J.; Saloner, G. Installed base and compatibility: Innovation, product preannouncements, and predation. Am. Econ. Rev. 1986, 76, 940–955. [Google Scholar]
- Jia, L.L.; Nam, E.; Chun, D. Impact of Chinese government subsidies on enterprise innovation: Based on a three-dimensional perspective. Sustainability 2021, 13, 1288. [Google Scholar] [CrossRef]
- Qiu, J.P.; Wan, C. Technology spillovers and corporate cash holdings. J. Financ. Econ. 2015, 115, 558–573. [Google Scholar] [CrossRef]


| Symbols | Unit | Meaning Description |
|---|---|---|
| USD/t | The performance of R&D innovation under green independent innovation of remanufacturers and recyclers, | |
| USD/t | The performance of R&D innovation under green imitation innovation of recyclers | |
| 1 | The market capacity of the product | |
| 1 | CDW recycling costs | |
| USD/t | The unit wholesale price of CDW provided by recyclers to remanufacturers | |
| USD/t | The selling price of green products | |
| USD/t | Government’s price subsidies for consumers | |
| 1 | Consumer green sensitivity | |
| 1 | Spillover coefficient under green independent innovation | |
| 1 | Spillover coefficient of recyclers under green imitation innovation |
| 10 | 3 | 0.4 | 0.7 | 0.3 | 0.6 |
Disclaimer/Publisher’s Note: The statements, opinions and data contained in all publications are solely those of the individual author(s) and contributor(s) and not of MDPI and/or the editor(s). MDPI and/or the editor(s) disclaim responsibility for any injury to people or property resulting from any ideas, methods, instructions or products referred to in the content. |
© 2023 by the authors. Licensee MDPI, Basel, Switzerland. This article is an open access article distributed under the terms and conditions of the Creative Commons Attribution (CC BY) license (https://creativecommons.org/licenses/by/4.0/).
Share and Cite
Zhou, C.; He, J.; Li, Y.; Chen, W.; Zhang, Y.; Zhang, H.; Xu, S.; Li, X. Green Independent Innovation or Green Imitation Innovation? Supply Chain Decision-Making in the Operation Stage of Construction and Demolition Waste Recycling Public-Private Partnership Projects. Systems 2023, 11, 94. https://doi.org/10.3390/systems11020094
Zhou C, He J, Li Y, Chen W, Zhang Y, Zhang H, Xu S, Li X. Green Independent Innovation or Green Imitation Innovation? Supply Chain Decision-Making in the Operation Stage of Construction and Demolition Waste Recycling Public-Private Partnership Projects. Systems. 2023; 11(2):94. https://doi.org/10.3390/systems11020094
Chicago/Turabian StyleZhou, Chuyue, Jinrong He, Yuejia Li, Weihong Chen, Yu Zhang, Hao Zhang, Shiqi Xu, and Xingwei Li. 2023. "Green Independent Innovation or Green Imitation Innovation? Supply Chain Decision-Making in the Operation Stage of Construction and Demolition Waste Recycling Public-Private Partnership Projects" Systems 11, no. 2: 94. https://doi.org/10.3390/systems11020094