
Measurement and Comparison of the Innovation Spatial Spillover Effect: A Study Based on the Yangtze River Delta and the Pearl River Delta, China
Public Administration School, Hohai University, Nanjing 211100, China
Systems 2023, 11(2), 90; https://doi.org/10.3390/systems11020090
Submission received: 19 January 2023
/
Revised: 5 February 2023
/
Accepted: 7 February 2023
/
Published: 8 February 2023
(This article belongs to the Section Systems Practice in Social Science)
Abstract
:Innovation is an important factor to improve the quality of economic growth, and amplifying the innovation spatial spillover effect is an important measure to support the development of innovation. Scholars have carried out diversified research on the innovation spatial spillover effect, but there is still practical significance for deepening the research on the spatial spillover effect. In particular, the multi-angle comparative study in different regions still has research value, especially for the field of urban agglomeration integration. The spatial econometric model is a common method to measure spatial spillover effect. In order to carry out a multi-angle comparative study of innovation spatial spillover effects in different regions, this study takes two typical integrated urban agglomerations of the Yangtze River Delta and the Pearl River Delta in China as the object, and conducts a comparative study of the evolutionary characteristics of innovation spatial spillover effects based on urban scale data and the spatial econometric model. Differently from previous studies, invention patents are adopted to characterize the innovation level. The results show that there are significant positive innovation spatial spillover effects in the Yangtze River Delta and the Pearl River Delta, and the spatial spillover effect in the Yangtze River Delta is stronger. The spatial spillover effect exhibits significant spatiotemporal heterogeneity. For example, the spatial spillover effect in the core region and the fringe region of the urban agglomeration exhibits a positive effect, but the Yangtze River Delta is stronger than the Pearl River Delta. As an important innovation, the spatial spillover effects both exhibit the evolutionary characteristics of “inverted U-shape” based on the changes in geographical distance, and the spatial spillover effect of the Yangtze River Delta is always larger. Based on the empirical research, we propose promoting high-quality development by strengthening urban agglomeration cooperation, realizing urban agglomeration expansion in an orderly way, and improving the macro-political system.
1. Introduction
Theoretical analysis and empirical research have shown that innovation is not only a key driving force for economic development, but also an inevitable factor to overcome the middle-income trap [1,2]. Therefore, relying on innovation to achieve faster and better development has become a research hotspot of regional economics, and is also an eternal topic of general concern [3,4]. As the largest developing country in the world, China’s high-investment and low-tech development model has driven sustained high-speed economic growth and shaped the “Chinese miracle” since the reform and opening up [3]. However, the extensive development model also has led to embarrassing “big but not strong” economic growth, which prominently manifests as weak industrial competitiveness and a lack of core technologies. Additionally, facing intensified global competition and the emergence of resource and environmental pressures, the long-term low-efficiency and quantity-driven economic growth model has become increasingly unsustainable [5]. So, accelerating the transformation from a factor-driven model to an innovation-driven model has become a realistic path for China’s economic development [5,6].
With the implementation of regional integration strategy and the acceleration of factor flow, the urban agglomeration innovation effect has triggered relevant discussions [6,7,8]. For example, scholars represented by Fujita have explored the micro-mechanism of knowledge spillovers and the spatial agglomeration process of innovation sectors [9]. Urban agglomerations are regions where innovation factors cluster and are active in innovation development. Significant innovation gaps not only bring possibilities for urban innovation cooperation, but also result in the inefficient allocation of innovation resources and regional development imbalances, which restrict innovation development [7]. Furthermore, knowledge spillover is an important factor affecting the regional innovation pattern [10]. In fact, with the qualitative or quantitative methods, scholars have found that innovation is affected by multiple factors, such as factor input, macroeconomic policies, openness, industrial structure, and infrastructure, and that there are differences across regions and periods [2,5,6,7,8,9,10,11]. Additionally, with the regional cooperation deepening, scholars have realized that innovation is not spatially isolated and that the regional relevance driven by industrial linkages and factor flows is also an important driving force for innovation [2,7,8]. Scholars have found that there is a strong spatial agglomeration of innovation factors and that geospatial proximity is playing an important role in innovation activities [8,12,13]. Many empirical studies based on patent transfer networks and the spatial spillover effect not only identify the innovation spatial correlation, but also validate its importance in innovation development [2,6,14]. However, the spillover effect also changes significantly with the change of distance [15]. Therefore, scientifically strengthening the innovation connection level has become a feasible measure to achieve high-quality collaborative innovation in urban agglomerations.
Scientific identification of the spatial spillover effect has become an important basis for promoting the development of innovation [6,8]. The spatial spillover effect has become a hot research topic [5,16], and scholars have found that the effect also has significant heterogeneity [5,13]. Although the relevant research is rich, compared with the development requirements, there is still practical significance for deepening. In particular, the questions remain of whether the evolutionary characteristics of spatial spillover effects in different regions are consistent, and how the characteristics of spatial spillover effects change with the distance threshold. In this study, invention patents are used to characterize the innovation level, while the Yangtze River Delta and the Pearl River Delta, regions with high innovation levels and deep integration, are used as the research objects, and the spatial econometric model is used to compare the innovation spatial spillover effect from multiple perspectives. Compared with the existing studies, the contributions of this study are as follows. (i) Considering the technical content and economic effect of different patent types, the innovation level is characterized by invention patents, which not only expands the research perspective but also more closely matches realistic innovation demand in China, for which, as the largest developing country in the world, improving the innovation quality has an important practical significance [17,18,19]. (ii) Measurement of the spatial spillover effect based on the spatial econometric model intuitively demonstrates the evolutionary characteristics of innovation interactions. Compared with the patent transfer networks, the data are easier to obtain, and the conclusions are comprehensive [2,8,20]. (iii) In terms of the research content, we not only carry out comparative assessments of different urban agglomeration integration regions, but also deeply explore the evolutionary pattern of the spatial innovation spillover effect with distance thresholds. Multi-perspective research on the innovation spillover effect is of great significance for comprehensively understanding the characteristics of innovation interaction, and can also provide a theoretical reference for better promoting innovation.
2. Literature Review
The importance of innovation in promoting sustainable economic growth has been verified by theoretical and empirical studies [3,13,21]. As the largest developing country, China’s central and local governments have formulated a series of innovation support policies that have significantly promoted innovation development. Since the 21st century, the number of patents has continued to increase substantially, indicating that China is committed to promoting innovation development. Additionally, multiangle innovation research has become a topic focus of scholars [2,5,6,7,8]. As an important indicator of innovation output, patents have become a common indicator for measuring innovation levels due to their ability to fully reflect the process of invention and creation, consistent evaluation standards, and easy access to data [6,8,21,22]. However, most patent-based studies implicitly assume an important basic assumption that although legally protected patents include inventions, utility models, and designs, all types of innovation output have the same economic benefits [5,17]. Theoretical and empirical studies have shown that this is not the case, especially for developing countries such as China [17]. On the one hand, although China has ranked first in terms of patent applications for many years, the United States relies on its own key products and core technologies in the China–US trade conflict and has issued a series of credible threats to Chinese industries, further highlighting China’s weak industrial innovation capability and the lack of key technologies [18,19]. On the other hand, empirical studies have found heterogeneities in the economic effects of different patents. For example, all patents in the initial stage can have a technological spillover effect. However, economic growth in the high-income stage mainly relies on high-tech patents, and low-tech patents exhibit a certain negative effect through occupying factors [17,18]. China’s economy is moving towards the high-quality development stage, and global industrial competition is becoming increasingly intensified, all of which are forcing China to accelerate innovation from quantitative growth to qualitative growth [19]. Therefore, scientific selection of innovation level indicators has become the key basis for relevant research, and there are also many different views [14].
In the regional development study, neoclassical economic theories have paid more attention to internal driving factors. With the emergence of an insufficient explanation of economic agglomeration and endogenous drive, scholars have realized that regional development not only relies on the supply of internal factors but also suffers from the surrounding regions [6,23]. As classical theory for this related problem, whether it is the first law of geography, the theory of regional balanced development and the new economic geography, they all emphasize the importance of spatial spillover effect in affecting regional development [12,14,24,25]. Innovation, as the core connotation of economic development, exhibits stronger spatial agglomeration, geographical proximity plays an increasingly important role in innovation development, and research on the innovation spatial spillover effect has become a hot topic [12,13]. Although there is a consensus regarding the importance of spatial dependence in innovation development, and the spatial spillover effect is an important indicator of the regional interaction level, but there are different attitudes in the measuring of spillover effect [2,5,13]. Krugman et al. believed that it is impossible to measure the spillover effect of invisible knowledge flow [12]. Some scholars propose that in regard to patents, as an important indicator of innovation output, their citation status can be used as an indicator of innovation spillover. So, the spillover effect can be measured by introducing the spatial distance as an explanatory variable of patent citation strength [13,26]. In addition, in the knowledge production function, innovation output depends on both internal factor inputs and inputs obtained through geographical proximity [13]. With the development of spatial econometrics, the introduction of spatial distance into models such as knowledge production functions provides the possibility of measuring the innovation spatial spillover effect, and this has been a common method used in current related studies [5,8,22].
Spatial spillover effect is a common economic phenomenon, especially the acceleration of factor flow has become an important mechanism. For example, Fallick et al. [27] pointed out that the high mobility of talents in Silicon Valley has brought about the rapid overflow of ideas, which is also an important factor for maintaining vitality. With the improvements in statistical data and the econometric model, scholars have conducted extensive research on the innovation spatial spillover effect. Scholars have found that innovation exhibited a significant spatial spillover effect but that under the influence of the government, administrative boundaries, traffic conditions, and factor differences, the spatial spillover effects of different regions and different periods all showed significant differences [6,7,8,28]. For example, the spatial spillover effect in China exhibits significant differences among the eastern, central and western regions, and the spatial spillover effect is the largest in the eastern region [28]. Considering the distance attenuation of factor flow and knowledge dissemination, scholars have found that the innovation spatial spillover effect exhibits nonlinear characteristics [15]. For example, the intensity of knowledge spillover of R&D enterprises in the Yangtze River Delta accelerating decays in the form of a negative exponential power, and the decrease tends to be flat at 40 km [29]. However, some scholars believe that in an increasingly open innovation pattern, geographical proximity is not a necessary condition for innovation spillover and that knowledge spillover also exists at relatively long distances [30]. Research has shown a trend of spatial refinement and object diversification, providing a good reference for accurately grasping the pattern of innovation interactions and promoting the optimization of regional innovation patterns. However, the evolutionary characteristics of innovation spillover effect still require further research.
The unification of the market system, the convenience of factor flow, and improvements in infrastructure brought by the integration are the key foundations for the spatial spillover effect [2,27]. Although the depth and breadth of research have substantially expanded, there is still practical significance for expansion research of innovation spillover effect. On the one hand, limited by data availability, existing studies mainly use the number of patents granted to measure the innovation level, ignoring the differences in different patents’ economic effects [6]. On the other hand, studies mainly focus on measuring the spatial spillover effect, insufficient attention has been given to the spatiotemporal evolutionary pattern, especially the comparative study of different regions [26,27,28,29]. Therefore, in this study, the Yangtze River Delta and the Pearl River Delta are used as the objects, invention patents are used as a measure of high-quality innovation output, and the measurement and comparison of the innovation spatial spillover effect are conducted from multiple perspectives. Based on trying to enrich the research, we hope to provide experience reference for promoting high-quality innovation and coordinated development. However, it should be emphasized that innovation is a complex process, which is also difficult to measure [21,31,32]. Innovation level measurement by invention patents in this study is only a solution based on limited data.
3. Study Area, Model and Data
3.1. Study Area
For developing countries, innovation plays an important role in promoting economic growth, but the quality of innovation is also generally low, especially for China. For China, the urban agglomeration integration region is not only a gathering area of innovative elements, but also an area with the most frequent innovation interaction. The study on these regions is of great relevance [33,34]. In this study, the Yangtze River Delta and the Pearl River Delta are selected as the study areas (Figure 1). (i) The innovation level is relatively high, and with the guidance of the central government, the innovation connection between cities is increasingly strengthened, and the surrounding cities have strong expectations to join the integration region. Unlike the Pearl River Delta, the scope of the Yangtze River Delta has shown an expanding trend. However, the field of urban agglomeration integration is expanding in substance, driven by increasingly urban industrial and innovation connections. From this perspective, urban agglomeration in this study refers to the concept of urban agglomeration integration region. For example, the Pearl River Delta is the scope of the Greater Pearl River Delta, but we refer to it as an urban agglomeration for the convenience of writing, and the selection of a relevant scope has strong practical significance. (ii) There are significant differences in the geometric form and polycentric spatial structure for the two regions. The distribution of central cities has an important impact on the spatial spillover effect [14,28], the regional comparison of polycentric differences can verify the spatial spillover effect of the spatial structure, which has certain reference significance for the spatial expansion of urban agglomerations. (iii) A multi-perspective comparison requires the study area to have more basic units and relatively complete statistical data as support. Therefore, considering development typicality and data availability, the Yangtze River Delta and the Pearl River Delta are selected as the study areas, which have strong heterogeneity in the urban agglomeration integration region expansion, the “core-fringe” development pattern, and the urban distribution geometry. In addition, considering that prefecture-level cities implement regional development strategies and national macro policies and play an important role in regional innovation, cities are used as the basic unit to conduct empirical research.
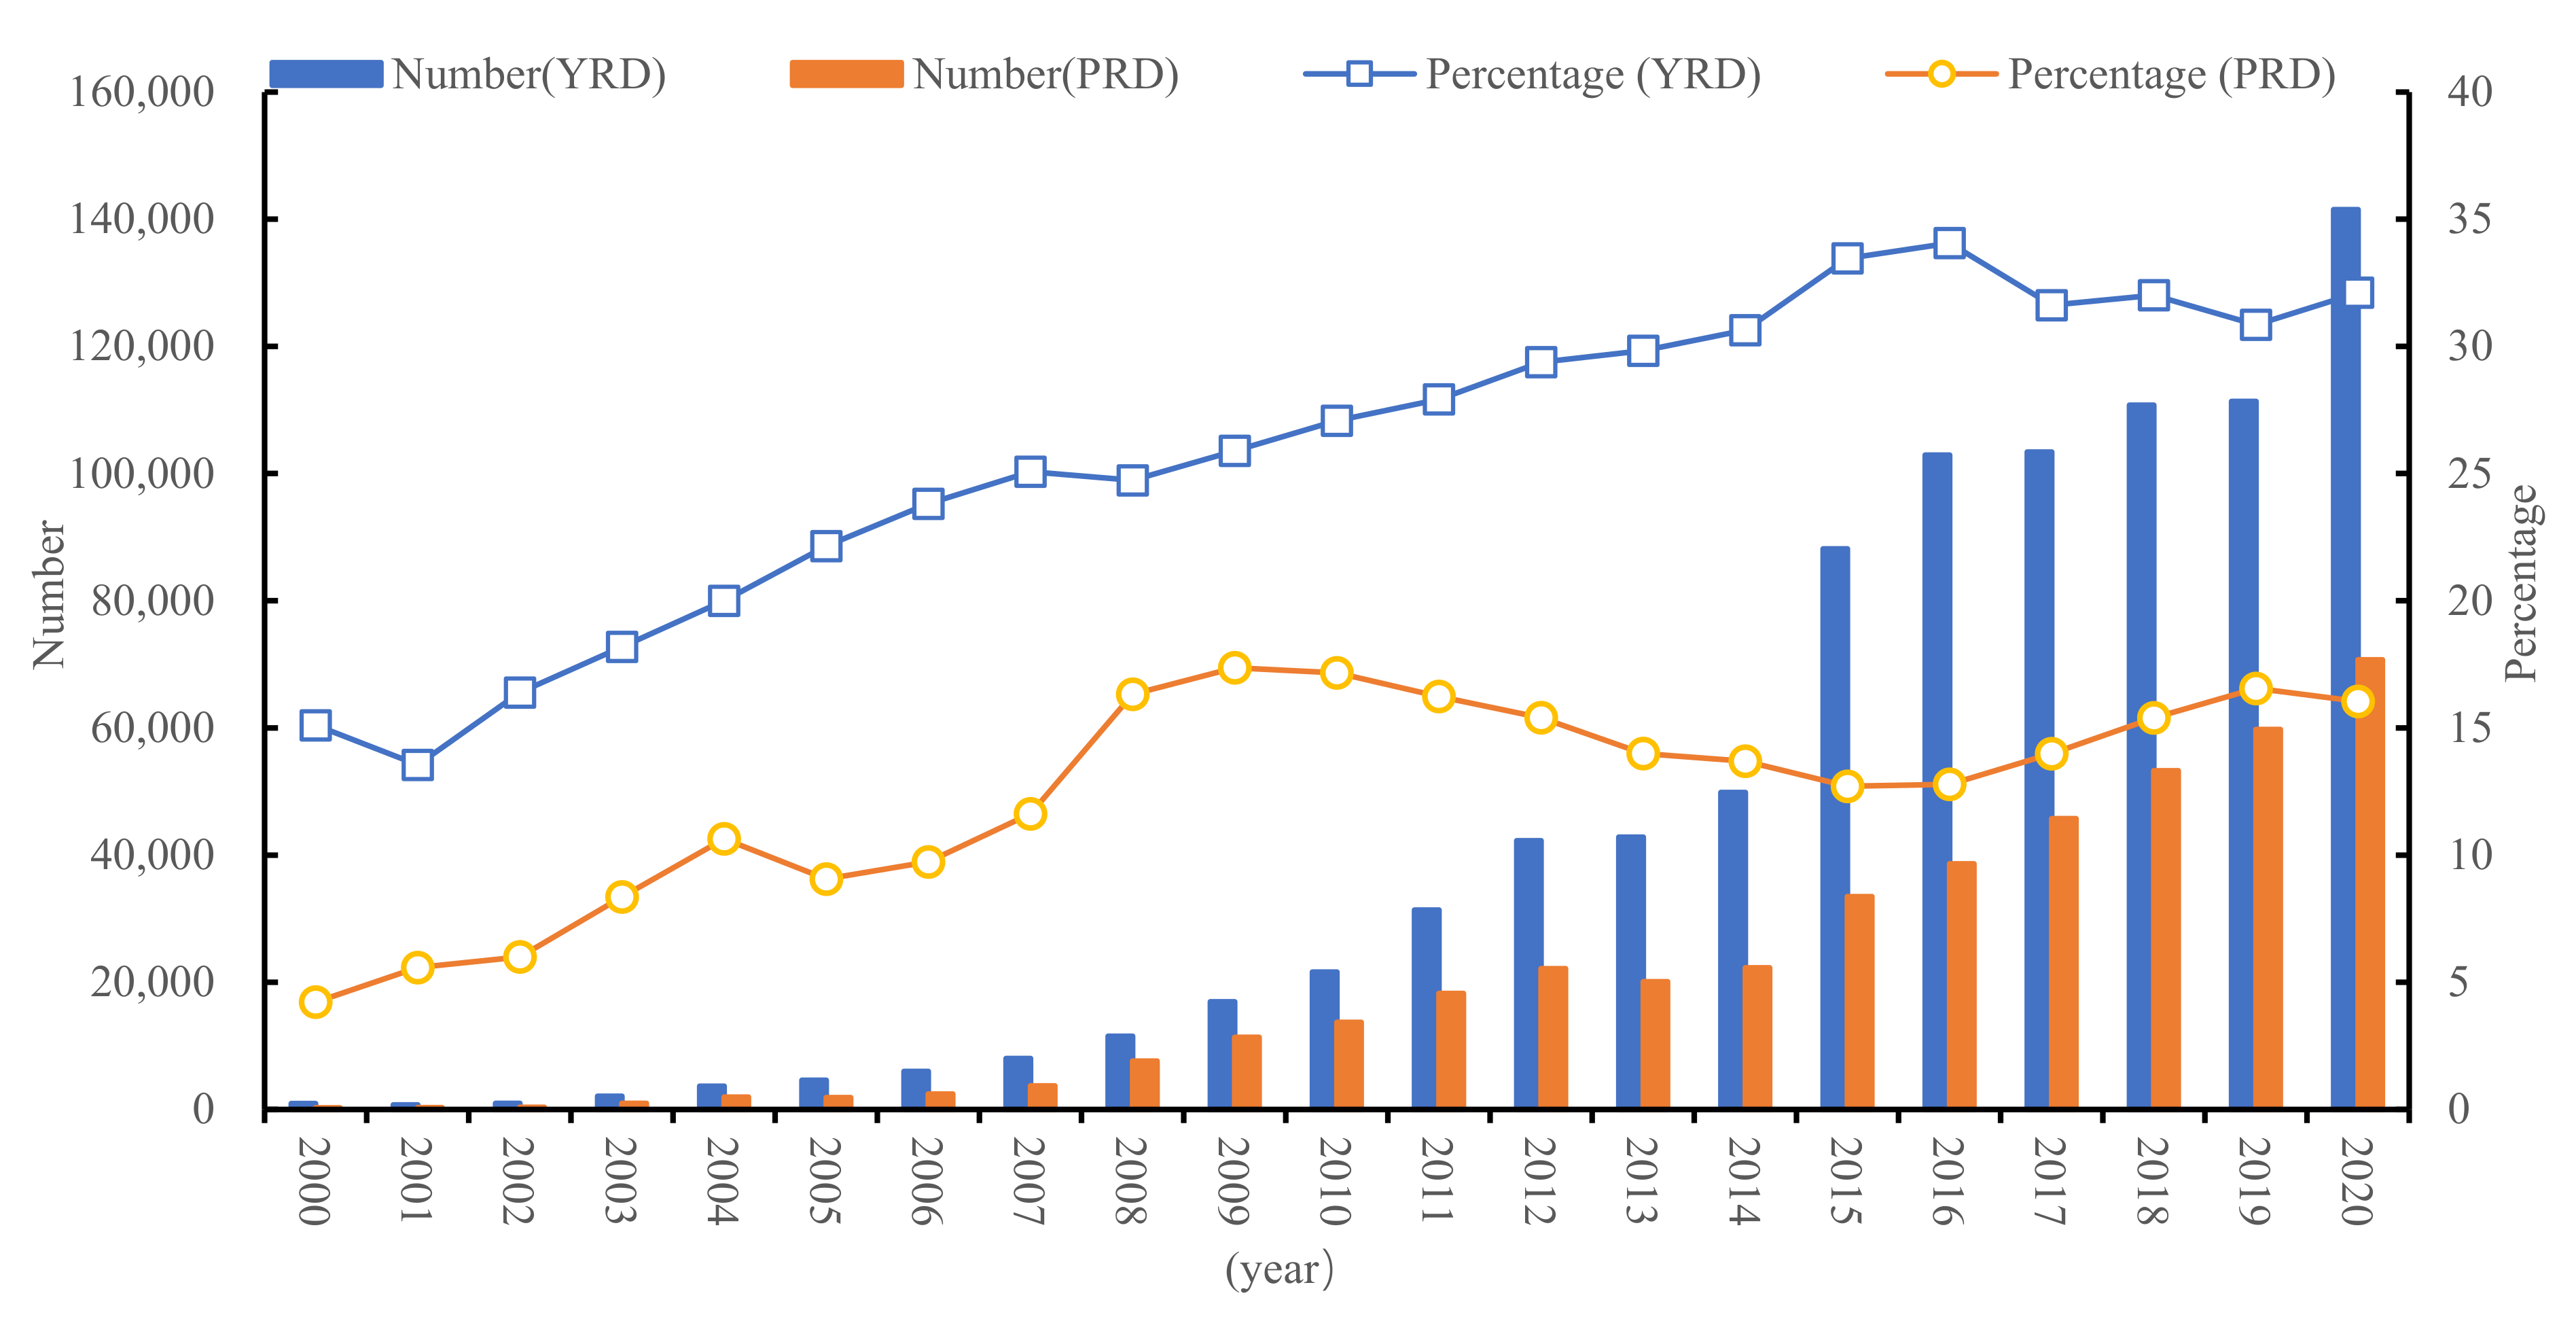
The Yangtze River Delta and the Pearl River Delta are located on the eastern coast of China. With the promotion of the cooperation mechanism by multiple subjects such as the government, academia, and enterprises, their status has been significantly improved in innovation development pattern. From 2000 to 2020, the number of invention patents granted in the Yangtze River Delta and the Pearl River Delta exhibited a fluctuating growth trend, indicating a significant increase in the innovation level. At the same time, the proportion of patents attributed among China showed a fluctuating upward trend, demonstrating their important status in innovation development (Figure 2). A comparison revealed that there are significant differences in the innovation evolution. Since 2009, the percentage of the Yangtze River Delta has increased, and the percentage of the Pearl River Delta has decreased, indicating innovation pattern changes in China. For example, the increasing attraction of foreign investments and the enhancing ability to undertake industrial transfer in some central and western regions has brought about a rapid increase in innovation, but has not significantly weakened the innovation status of the Yangtze River Delta and the Pearl River Delta, confirming the steady state of China’s innovation pattern. However, the significant decline in the innovation percentage of the Yangtze River Delta and the significant increase in the Pearl River Delta since 2016 are results of macro-strategic adjustments in the process of building an innovative country, for example, the Pearl River Delta significantly benefiting from the rapid increase in a large number of innovative enterprises, such as Huawei and ZTE.
Innovation factors are an important topic of urban competition, and developed cities have a relatively strong factor agglomeration level, generating a stronger innovation spatial agglomeration and serving as the basis of spatial spillover effects [14]. The location Gini coefficient visually measures the geospatial agglomeration level [35]. The results of location Gini coefficient are shown in Figure 3. (i) The Gini coefficients all exceed 0.60, indicating significant spatial agglomeration, and the Pearl River Delta is significantly higher than that of the Yangtze River Delta. However, the spatial agglomeration status is similar from 2000 to 2006, and the gap widened significantly after 2006, indicating the transformation of the innovation space in Yangtze River Delta into a balanced space. (ii) The Gini coefficient shows a differential evolution trend. The Yangtze River Delta decreases from 0.753 to 0.643, and the innovation pattern exhibits diffusion characteristics. However, the Pearl River Delta increases from 0.760 to 0.798, and the innovation space undergoes further agglomeration. (iii) The innovation spatial agglomeration level both exhibit an inverted U-shaped trend. At the beginning of the 21st century, innovation factors, under urban competition, rapidly agglomerated in some cities, resulting in a significant increase in the Gini coefficient. With the further deepening of the reform and opening up, the concentration and dispersion of economic development-driven factors, and adjustments in the government’s macro development strategy, the Gini coefficient decreases significantly as the innovation level increases in less developed cities driven by deepening cooperation and industrial transfer. However, in recent years, the innovation status and innovation challenges have increased, and the further agglomeration of high-end innovation factors has driven the increase in agglomeration in innovation spaces.
3.2. Econometric Model Construction
Innovation is the sum of a series activities such as brainstorming, R&D, design, and manufacturing [8]. Because of the empirical operability, the knowledge production function has become a common tool for innovation research [26,28]. Based on existing research, a basic model is constructed from the perspective of input and output, in which innovation input mainly includes human input and capital input [8,28]. The knowledge production function was constructed as follows:
In reality, innovation is also affected by the urban environment [8,26]. The development environment variable (X) is added to Equation (1), and the following econometric model was constructed:
where i and t represent city and time, respectively, and I, H, K, and X represent innovation output, human input, capital input, and development environment, respectively.
The purpose of this study is to explore the evolution characteristics of innovation spatial spillover effect. To meet this purpose, a spatial matrix was introduced into Equation (2) to construct a spatial econometric model [14,28,36]. Commonly used spatial econometric models include the spatial autoregressive model (SAR), spatial error model (SEM), and spatial Durbin model (SDM) [5,36]. The models were constructed as follows:
where ρ is the coefficient of the spatial lag term, δ is the coefficient of the spatial interaction term, and λ is the coefficient of the spatial error term. W is the spatial weight matrix, and and are error terms, respectively.
This paper constructs the spatial weight matrix by a negative exponential decay of geographic distance [28]. The specific method was as follows:
where dij is the distance between cities, and dmax is the maximum distance among cities.
3.3. Data Description
The key basis for empirical research is to measure the explained variable (I), namely the urban innovation level. In significant contrast to the existing research, we consider the technical content and economic effects of different patent types [17], and based on the actual needs of China’s innovative development, the invention patent was used to characterize the innovation level. The unit for the variable is a piece. It should be emphasized that innovation is a complex process, and there are various methods to measure innovation levels [21,26]. Among them, patent data are often used as a measure of innovation level, because the data focusing on the results of the inventive process are highly available, although these data have obvious shortcomings [31,32].
Based on the knowledge production function in Equation (2), and considering data availability, the following variables are selected in this study.
- Talent plays a key role in innovative knowledge creation, transformation, production, etc. We use the number of employees in scientific research, technical services and geological prospecting reflecting the state of talent input (H), and its unit is the person.
- Funding investment reflects the government’s emphasis on innovation, which is characterized by science and education expenditures (K), which is CNY 10,000.
- Urban development level not only affects the innovation demand, but also affects the urban innovation investment scale [28]. Urban development level (Dep) is characterized by the disposable income of urban residents in CNY.
- Under the background of globalization, urban innovation is affected by foreign investment and foreign trade, and the openness level is characterized by the total amount of urban import and export trade (Open). The unit is 100 million yuan.
- Innovation is a capital-intensive production activity. The financial level affects innovation by improving financing constraints and improving technology absorptive capacity, characterized by the balance of loans from financial institutions at the end of the year (Fin), and its unit is CNY 100 million.
The study period is 2000–2020, and the administrative division in 2000 is used as the benchmark. Relevant data are obtained from statistical yearbooks and the CNRDS. Relevant data are processed as follows. (i) The data of cities involved in administrative division adjustments are estimated using county-level data. (ii) Some missing or adjusted data are estimated with reference to the average growth rate. (iii) Economic data are based on the year 2000, combined with the relevant price index to adjust the original data.
3.4. Econometric Model Selection
The purpose of this study is to carry out a regional comparative study of innovation spatial spillover effects from multiple perspectives. Different scholars hold different attitudes towards the measurement of the spatial spillover effect, especially whether this effect can be effectively measured [12,20,26]. From the existing research, the establishment and maturity of spatial econometric model has become a common method to measure the spatial spillover effect [8,28]. This is particularly due to the availability of data and the intuitiveness of results. Therefore, this study also uses the spatial econometric model to measure and compare the innovation spatial spillover effect of urban agglomeration integration regions. This method is relatively mature and widely used. However, we must emphasize that the measurement of spatial spillover effect based on the spatial econometric model has obvious limitations. Especially, this result is a relative value; for example, it is significantly affected by the research data. In other words, the results focus on characterizing the existence and evolutionary characteristic of spatial spillover effects.
Choosing an appropriate measurement model is the key basis for conducting empirical research. For this empirical analysis, it is necessary to carry out the data test and select the appropriate econometric model based on Figure 4. The mean variance inflation factors (VIF) of the Yangtze River Delta and the Pearl River Delta are 4.36 and 5.84, respectively, indicating that the variables in this study do not have multicollinearity. On this basis, the key is to select the appropriate econometric model.
- It is necessary to confirm the existence of spatial correlation first. Based on relevant research methods [5,6], regression analysis is performed using the ordinary least squares model (OLS), and the spatial correlation of OLS regression residuals is identified. The results are provided in Table 1 and Figure 5. Table 1 indicates that increases in innovation investments, such as talent and funding, as well as improvements in the urban development environment significantly promote innovation. However, there are differences in the driving effect of different regions; for example, funding is significant in the Yangtze River Delta and nonsignificant in the Pearl River Delta, and development level is nonsignificant in the Yangtze River Delta and significant in the Pearl River Delta. Figure 5 indicate that the OLS regression residuals show a significant spatial correlation in both regions, indicating that the OLS regression estimation results ignore the innovation spatial correlation and cannot accurately reflect the objective reality, i.e., a spatial econometric model is necessary.
- 2.
- For this paper, the most important thing is to choose the appropriate measurement model. Referring to existing studies [6,36], the econometric model is selected based on the tests in Table 2. Firstly, tests based on the LM and robust LM showed that the SEM and SLM correlation statistics are significant at the 0.1 significance level, indicating that the SLM is superior to the SEM, i.e., there is significant spatial dependence. Secondly, based on the Wald and LR tests, it is judged whether SDM can be simplified to SEM and SLM. The results show that the relevant statistics all pass the 0.1 significance level; that is, the SDM cannot be simplified to the SLM and SEM. Finally, the Hausman statistic and probabilities all passed the significance test at the 0.01 level, i.e., the fixed-effects model was chosen [14,36]. Therefore, the spatial Dubin model is the best model for this empirical study.
4. Results
4.1. Measurement of the Spatial Spillover Effect
Table 3 reports the regression results based on Equation (5). Column (1) is for the Yangtze River Delta, and Column (2) is for the Pearl River Delta. The R2 values are 0.942 and 0.901, respectively, indicating that the model and variables are scientific. The spatial spillover effects in the Yangtze River Delta and the Pearl River Delta are 0.604 and 0.264, respectively, indicating that there is a significant positive innovation spatial spillover effect. A comparison indicates that the effect is different from that reported in previous studies, i.e., the greater the innovation gap, the stronger the spatial spillover effect [6,28], reflecting the complexity of the effect. For this study, it may be related to the relatively small constraints on the element flow due to the improvement of the transportation network in the Yangtze River Delta, and the difference between the polycentric spatial structure of the Yangtze River Delta and the approximately monocentric structure of the Pearl River Delta, etc.
There are also differences in the effects of other variables. For example, the coefficient of talent in the Yangtze River Delta is significantly lower than that in the Pearl River Delta, and there is a positive effect of funding in the Yangtze River Delta and a nonsignificant negative effect in the Pearl River Delta. In addition, funding, development level, financial level, and traffic conditions are the core elements of the spatial spillover effect in the Yangtze River Delta, while the core elements in the Pearl River Delta are funding, development level, openness, and traffic conditions; other variables are auxiliary factors for understanding the spatial spillover effect. For example, high-skilled R&D talent is the key topic of urban factor competition. Driven by urban competition and integrated factor flow, the spatial lag coefficients are nonsignificant in both regions. In contrast, the funding has a significant negative effect in the Yangtze River Delta and a significant positive effect in the Pearl River Delta, which may be related to the government-led integration in the Pearl River Delta having fewer barriers [14].
In general, urban innovation benefits from factor flow, technology transfer, and innovation imitation during the regional integration. Therefore, further strengthening the innovation link level is of great significance for promoting the high-quality development [20,35]. However, compared with the diffusion effect and siphon effect of the integrated elements, the innovative spatial pattern may show a differentiated evolutionary trend.
4.2. Robustness Test
In this section, robustness tests are conducted, and the results are shown in Table 4. (i) The spatial weight matrix is the basis of spatial econometrics. The spatial matrix is set based on spatial adjacency, and the benchmark model is re-estimated. Column (1) is for the Yangtze River Delta, and Column (3) is for the Pearl River Delta. For Column (1) and Column (3), compared with the benchmark model, the explained variable and the explanatory variable are the same; the only differences are in the spatial weight matrix. (ii) Design and utility model patents are materialized forms of innovative technology. The number of patents granted is used as the indicator of the innovation level to re-estimate the benchmark model. Column (2) is for the Yangtze River Delta, and Column (4) is for the Pearl River Delta. For Column (2) and Column (4), compared with the benchmark model, the explanatory variable and the spatial weight matrix are the same; the only differences are in the explained variable. That is, the explained variables are measured by the number of granted patents.
A comprehensive comparison shows that the results are strong in robustness. (i) The spatial spillover coefficients in the robustness test are all significantly positive, and the effects in the Yangtze River Delta are stronger. (ii) The estimated coefficients of most variables are different, but the impact direction and significance have not changed fundamentally. (iii) Comparisons of the spatial lag coefficients of the driving factors show that the direction and significance of most variables have not changed significantly and that they are strong in robustness.
4.3. Regional Heterogeneity of the Spatial Spillover Effect
The regional development gap is a common phenomenon in China, and the Yangtze River Delta and the Pearl River Delta show significant core-fringe development patterns. Do regions with different development levels show differential spatial spillover effects? Referring to existing studies [6,14], urban agglomeration was divided into core regions and fringe regions, and the spatial spillover effects were compared. The core region of the Yangtze River Delta includes Shanghai, Nanjing, Suzhou, Wuxi, Changzhou, Yangzhou, Zhenjiang, Taizhou, Nantong, Hangzhou, Ningbo, Shaoxing, Jiaxing, Taizhou, Huzhou, and Zhoushan. The core region of the Pearl River Delta includes Guangzhou, Shenzhen, Foshan, Dongguan, Zhongshan, Zhuhai, Jiangmen, Zhaoqing and Huizhou. The results are shown in Table 5. Column (1) and Column (2) show the results of the core region and fringe region for the Yangtze River Delta, respectively. Column (3) and Column (4) show the results of the core region and fringe region for the Pearl River Delta, respectively.
The comparison results show significant heterogeneity. (i) In the comparison of the spatial spillover effect, the core region has a significant positive effect, but the fringe region has a significant positive effect in the Yangtze River Delta and a nonsignificant positive effect in the Pearl River Delta. In general, the relatively stronger spatial spillover effect for the core region was driven by the higher innovation level and regional integration. In comparison, in the fringe region of the Pearl River Delta region, there is a nonsignificant positive spillover effect, relative to the large innovation gap between cities, long spatial distance, and fierce factor competition. (ii) The spatial spillover effects in the core and fringe regions of the Yangtze River Delta were significantly greater than that in the Pearl River Delta, indicating that the spatial spillover effect is affected not only by the innovation level but also by the city spatial distribution pattern [37]. (iii) The coefficients of the variables are also different. For example, the core region has a higher talent contribution, and the fringe region is more affected by traffic accessibility. The former is related to the talent agglomeration brought by more employment opportunities, convenient exchange conditions and a good innovation environment [38]; the latter indicates that it is of great importance to utilize innovation spillover to promote urban innovation. Relevant conclusions indicate that the formulation of policies should be adapted to local conditions.
4.4. Temporal Heterogeneity of the Spatial Spillover Effect
The spatial spillover effect is the result of the element flow, which is affected by the regional integration level [14]. In reality, government-led regional integration is also a process moving from shallow to deep. Does this bring about differences in the innovation spatial spillover effect in different periods? With the promotion of macro policies, i.e., “Guiding Opinions on Further Promoting the Reform, Opening-up and Economic and Social Development of the Yangtze River Delta” in 2008 and the “Outline of the Plan for the Reform and Development of the Pearl River Delta (2008–2020)”, and the impact of the 2008 global financial crisis, innovation patterns of urban agglomeration have evolved. For example, since 2009, the innovation contribution of the Yangtze River Delta has increased, the spatial agglomeration level has decreased, and the contribution and spatial agglomeration level of the Pearl River Delta have decreased simultaneously.
In this regard, we further compare the spatial spillover effects of 2000~2008 and 2009~2020. The results are shown in Table 6. Column (1) and Column (2) show the results of the 2000~2008 and 2009~2020 periods for the Yangtze River Delta, respectively. Column (3) and Column (4) show the results of the 2000~2008 and 2009~2020 periods for the Pearl River Delta respectively. The comparison results show the significant temporal heterogeneity of the spatial spillover effect. (i) With the support of macroeconomic policies and improvements in infrastructure, the regional integration deepening has enhanced the spatial spillover effect, such as the transition from a significant negative effect to a significant positive effect in the Yangtze River Delta, and from a nonsignificant positive effect to a significant positive effect in the Pearl River Delta. (ii) The significant negative effect of the Yangtze River Delta and the nonsignificant positive effect of the Pearl River Delta in 2000~2008 are not only related to the innovation gap, but also reflect the convenience of provincial integration. The spatial spillover effect in the Yangtze River Delta is significantly higher than that in the Pearl River Delta, which is related to the deepening of national policy guidance, the improvement of urban innovation levels, and the emergence of advantages with regard to the regional polycentric spatial structure [37,39]. (iii) The transformation of the spatial spillover effect is driven by the element of competition–cooperation. Changes in innovation-driving factors in different periods, such as the strengthening of talent and the weakening of the financial scale effect, not only reflect the difference in the driving force at different stages, but also characterize the transformation of the competition–cooperation relationship among cities.
4.5. Geographical Distance Threshold Evolution Pattern of the Spatial Spillover Effect
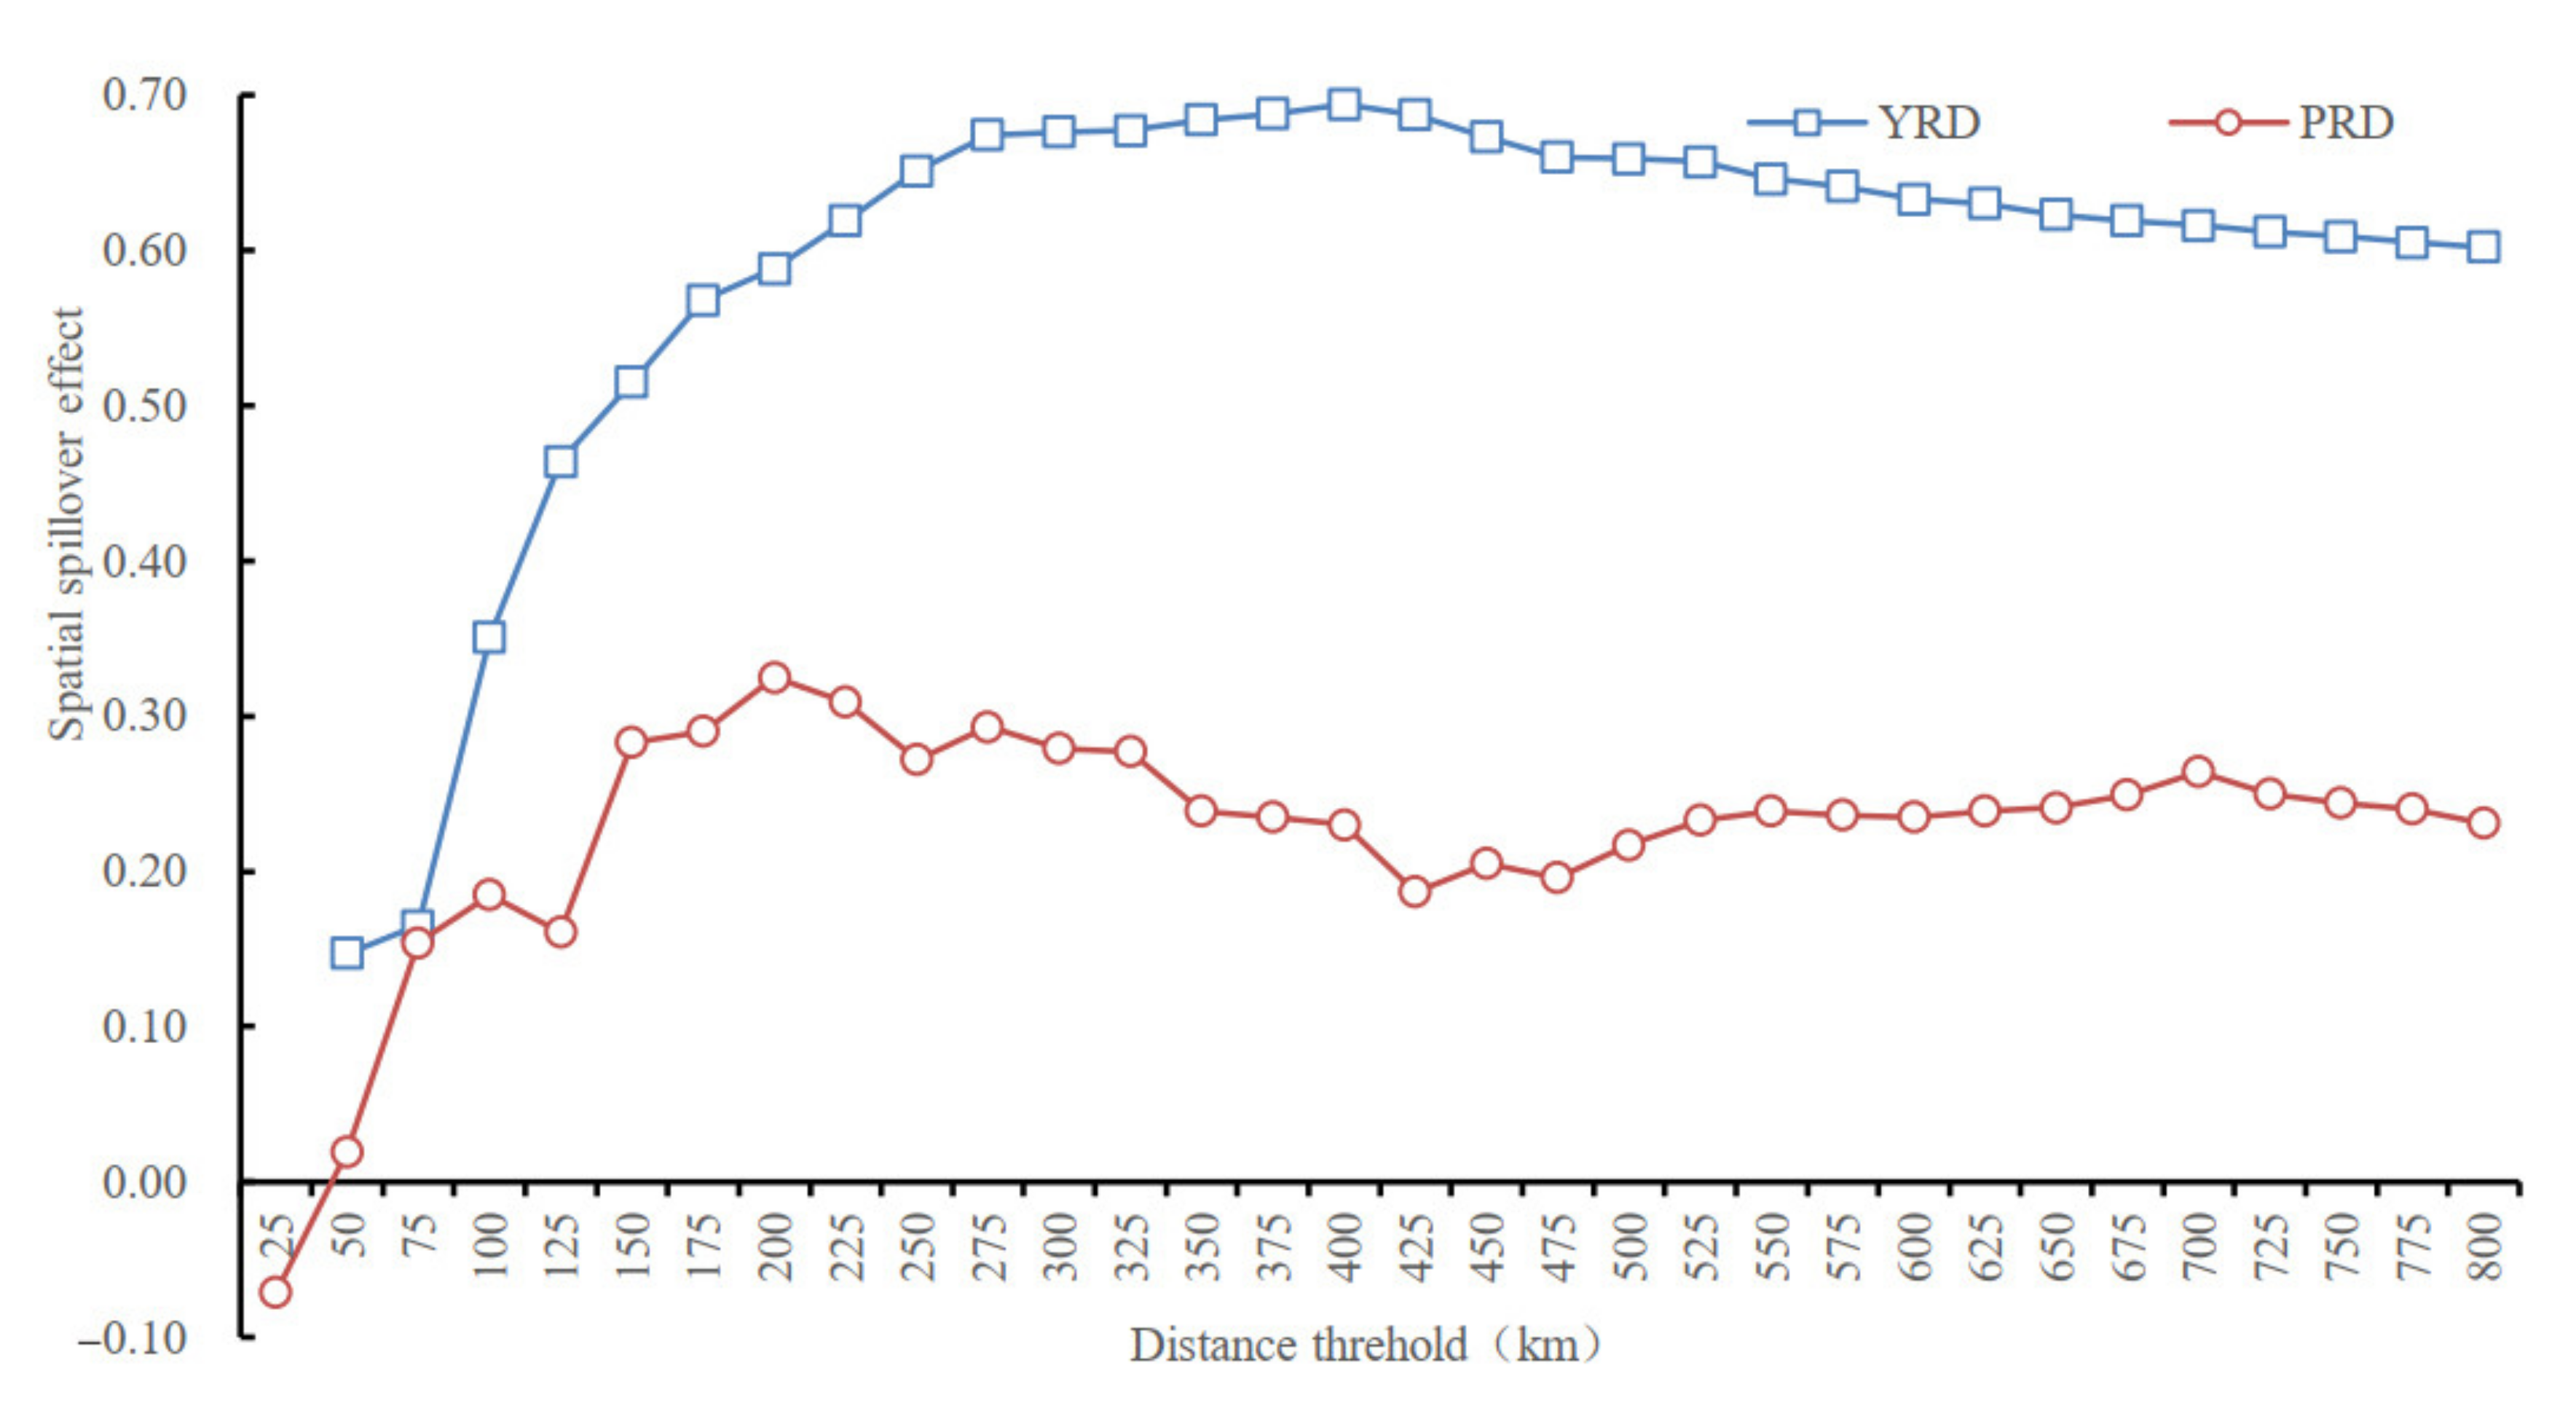
The first law of geography emphasizes the universality of spatial correlations, and the mechanism is the factor flow. Under the distance decay rule of factor flow, changes in the geographical distance bring about changes in the factor flow mechanism and affect the spatial spillover effect [14,36]. In this regard, we further examine the evolutionary pattern of the spatial spillover effect with the geographical distance threshold. The negative exponential decay of geographical distance is used to construct the spatial weight matrix, and the evolution characteristic of the spatial spillover effect under different distance thresholds is measured using an increment of 25 km. The results are shown in Figure 6.
In general, the spatial spillover effect in the Yangtze River Delta is always stronger than that in the Pearl River Delta. With the increase in the geographical distance threshold, the spatial spillover effects both exhibited an inverted U-shaped evolutionary trend, indicating that the significant localization of the spatial spillover effect and the existence of the optimal scope of the urban agglomeration integration region, which are also important factors affecting the regional development gap [36].
- Further comparison shows that the strongest spillover effect in the Yangtze River Delta is at 400 km, and that in the Pearl River Delta is 200 km. The highest spillover effect for the Yangtze River Delta is significantly larger, which is the result of comprehensive effects of urban competition–cooperation and radiation outward from central cities, especially related to the factor concentration brought by the distribution of central cities and their development conditions [37].
- When the distance thresholds of the Yangtze River Delta and the Pearl River Delta exceed 400 km and 200 km, respectively, the spatial spillover effect does not decrease significantly; that is related to the region spatial structure. For example, in the layout of central cities, those of the Yangtze River Delta are relatively evenly distributed and the Pearl River Delta is adjacent to Guangzhou and Shenzhen, while the overall spatial structure of the region is relatively regular in the Yangtze River Delta and approximate triangular in the Pearl River Delta. That is, the polycentric spatial structure brings about fluctuations in spatial spillover effect. According to existing study [39], the innovation pattern in Anhui Province exhibits a significant monocentric spatial structure, and the spatial spillover effect is at its largest at 125 km and then significantly decreases with increasing distance threshold. A comprehensive comparison verified the relatively strong spatial spillover effect of polycentric structures.
- In addition, the significant decrease in the spatial spillover effect for the Pearl River Delta in 325–350 km, may be related to the fact that most cities are within 350 km of Guangzhou and Shenzhen. That is, the irregular pattern beyond this distance threshold does not result in a concomitant increase in integrated city numbers, and it also validates the correlation between the urban spatial distribution pattern and the spatial spillover effect. The results also indicate that the elements and policies show stronger spatial agglomeration, which is also an important reason for the stronger siphon effect of high-end innovation elements in core cities [5].
Based on the evolution characteristics of innovation space spillover effect with the geographical distance threshold, three intervals warrant further discussion.
- The first interval is 50–100 km. There are relatively few cities, the gap in innovation levels is small, the competition for elements such as policy and talent are more intense, and the innovation spatial spillover effect is significantly weaker.
- For the second interval, the distance threshold for the Yangtze River Delta is 100–400 km, and for the Pearl River Delta is 100–200 km. Through competition–cooperation and cost–benefit within a certain range, cities can effectively share innovative resources, infrastructure and build a good division. The spatial spillover effect is significantly positive and gradually increases with increasing geographical distance threshold. Among the distances, 400 km is the distance that Shanghai to Hefei, and 200 km is the distance from Shenzhen to Zhaoqing, indicating that there is an optimal spatial boundary of the urban agglomeration integration region.
- The third interval is 400–800 km for the Yangtze River Delta and 200–800 km for the Pearl River Delta, respectively. As the distance increases, the opportunities for urban element exchange decrease, and the cost of innovation cooperation increases rapidly, generating an adverse impact on the division and cooperation. The spatial spillover effect is significant but continuously weakened, indicating that integrated cooperation still has an important practical significance in innovation for underdeveloped cities.
5. Discussion
China’s economy is shifting from high-speed growth to high-quality development. Strengthening innovation cooperation and amplifying the spillover effect are important measures to promote innovation. In this process, it is necessary to consider not only how to amplify the spatial spillover effect, but also the relationship between the deepening and spatial expansion of the urban agglomeration integration region.
5.1. Relying on the Urban Agglomeration Integration to Promote Innovation
The innovation pattern is the result of urban competition–cooperation relationship [28]. Innovation has a significant positive spatial spillover effect, indicating the feasibility of relying on urban agglomeration integration to promote innovation. However, it must be emphasized that by realizing innovation by integrating into an urban agglomeration, cities should strengthen themselves to gather high-quality innovation elements, synergistically optimize the development environment, strengthen urban cooperation level, especially strengthen innovative interactions with developed cities, and make full use of the spatial spillover effect to achieve high-quality development.
Based on the urban agglomeration integration led by the well-functioning government, better amplifying the spatial spillover effect to include more underdeveloped cities in the spillover scope has become a feasible path to promote coordinated development. In this regard, the government should actively break away from locally based development thinking, eliminate institutional barriers that restrict coordinated development, and coordinate the construction of coordinated development policies. Spatial spillover effect is the result of deepening urban cooperation [14], so the government should give full play to the coordination and guiding role of regional planning, and take the lead in making efforts in integrated transportation facilities, cross-regional elements flow, and coordinated development systems, etc., to create a superior integrated innovation atmosphere. Considering the diverse evolution characteristics of the spatial spillover effect, governments should fully recognize the different positions of different cities in the innovation network and formulate policies of adapting measures to local conditions and advancing with time, for example, by strengthening the synergy of industrial chains and innovation chains, and building an innovative synergy of cascade linkage to realize high-quality innovation coordinated development.
The spatial spillover effect is not homogeneous. Driven by the gradient gap and the Matthew effect of resource distribution, high-end innovation factors are rapidly agglomerating in developed cities, and the diffusion of low-tech innovation resources is accelerating, resulting in the solidification of a core-fringe structural pattern of innovation resources. The solidification unbalanced development pattern is not conducive to sustainable development, indicating that attention should be given to the possible negative effects of regional integration. For example, the improvement in high-speed rail networks may accelerate the agglomeration of innovative elements in developed cities and promote the development gap expansion. Therefore, in the process of promoting coordinated development through integration, in addition to exerting the guiding effect of an intangible hand of the market, it is also necessary to actively exert the regulatory role of the tangible hand of the government. Better weighing of the market and government forces, i.e., multiple measures to achieve precise policy implementation and promote the high-quality development of urban agglomerations, also deserves in-depth study.
5.2. Coordinating the Relationship between the Deepening and Spatial Expansion of Urban Agglomeration Integration
The urban agglomeration integration region is not only a spatial carrier of highly concentrated innovation factors, but also an important innovation system [35]. In the process of urban agglomeration integration, the frequent job-hopping and participation in start-up businesses by high-skilled labor has greatly accelerated the innovation spatial dissemination, and has become an important mechanism for the spatial spillover effect [38]. Additionally, the expansion of the market scale brought about by urban agglomeration integration, such as deepening and spatial expansion, is also an important basis for urban innovation. For example, Schumpeter’s innovation theory proposes that the expansion of market size is conducive to enterprises gaining a first-mover advantage in diversifying innovation risks and improving innovation benefits, thereby promoting improvements in innovation.
In the context of the increasing innovation status of urban agglomerations and the continuous deepening of innovation cooperation, the construction of a networked innovation pattern through the integration deepening, and the full play of the effects of external economies, has become a new paradigm for promoting the innovation development of urban agglomerations [14,40]. However, a multiangle comparison of the spatial spillover effect, especially the enhancement caused by integration deepening in the temporal comparison and the inverted U-shaped evolution characteristic of the changes of distance threshold, suggest that urban innovation should not be overly dependent on integration. In addition, there may be an optimal boundary for the urban agglomeration integration region. For example, the increasing city numbers generate the rising factor flow costs and intensify urban industry competition, which has increasingly become a constraint on the unlimited regional integration expansion [20,28]. That is, combining real-world development and theoretical research, the collaborative exploration of the optimal boundary of urban agglomeration integration regions, and promoting the coordinated development of urban agglomeration integration and spatial expansion, are also scientific issues that need to be further explored.
Currently, an increasing number of cities are expected to join the integration region, resulting in improvements in the development level by taking advantage of the spatial spillover effect, and the urban agglomeration integration region expansion has become a common phenomenon. In the future, urban agglomeration should scientifically coordinate the relationship between integration deepening and spatial expansion rather than simply promoting disorderly expansion. This study verifies the advantages of polycentric structures in enhancing the spatial spillover effect; that is, in addition to the establishment of an integrated cooperation system, urban agglomerations should transition from monocentric to polycentric to enhance the regional development gradient and spatial spillover effect. The government must adhere to greater regional coordination, formulate more preferential policies for investment, industrial development, and taxation, and accelerate and guide the agglomeration of key factors to typical fringe cities with favorable location conditions and excellent development bases to foster highlands of development in less developed regions. By undertaking the transfer of factors from developed cities and accelerating the spillover to surrounding cities, regions can achieve greater coordinated development while weakening the attenuation rate of the spatial spillover effect.
5.3. Establishing a Reasonable System to Guide Higher-Quality Innovation
In order to better promote high-quality development, increasing attention is being paid to the quality of innovation. Institutional economics and other theories propose that the system determines the regional knowledge, technology acquisition capacity, direction, etc., and has an impact on the local innovation structure and regional innovation patterns. The Chinese government plays an important role in promoting innovation. However, in the context of imperfect institutions and a low innovation level, coupled with the asymmetry of government-enterprise patent quality information and short-term policies, the number of patents is adopted by the Chinese government as the basis for government subsidies and policy support, leading to innovation subjects’ seeking support and the distortion of innovation resources allocation; many strategic innovation behaviors inhibit improvements in innovation quality [11,17]. In general, the imperfection of government-related systems is an important factor for the coexistence of the rapid increase in the number of patents and the stagnation of innovation quality in China.
In addition, to optimize the spatial spillover effect, it is necessary to optimize and adjust the government’s innovation support policies. By optimizing the performance evaluation system, the central government should shift from focusing on short-term performance to long-term performance and from focusing on growth rate to growth quality, forcing the local government to improve the innovation quality, such as increasing the proportion of invention patents in innovation performance assessments to discourage strategic innovative behavior by local governments. Additionally, local government should fully consider the development of endowments, formulate long-term development goals, and avoid short-term and inefficient local innovation behavior. Especially, macro-policymakers should actively change the way they support innovation, accelerate the establishment of a patent quality evaluation mechanism, encourage the industrialization of high-quality patents, and use industry–university–research collaboration to support improvements in the quality of economic development.
5.4. Limitations
The spatial spillover effect plays an increasingly important role in driving urban innovation development [6,14]. Taking the Yangtze River Delta and the Pearl River Delta as the objects, this study supplements and improves the measurement of the innovation spatial spillover effect, addressing the insufficiency of studies that focus on the effect measurement and ignore spatial-temporal comparisons. Considering the complexity and uncertainty of urban agglomeration systems, this study also has the following shortcomings. Considering the research theme of this study, the variables are not comprehensive. Especially, innovation is a complex process, and the core variable of innovation measured by invention patents has great limitations [21,31]. Limited by data availability, the geospatial matrix may not be able to accurately measure the connection. The spatial spillover effect is the result of urban competition–cooperation, the focus herein is on measurement and comparison, and there is a lack of discussion on the influencing factors of the spatial spillover effect. With the accumulation and improvement of relevant data, these issues are important directions to consider and study.
6. Conclusions
The multi-perspective comparative study on the innovation spatial spillover effect has an important practical significance for optimizing the urban agglomeration innovative pattern. This paper takes the Yangtze River Delta and the Pearl River Delta as the objects and uses the spatial econometric model to conduct a multi-perspective spatial spillover effect measurement and comparative study. The innovation pattern and spatial autocorrelation test both show that urban agglomeration innovation has a significant spatial correlation, and the spatial Dubin model is the best model to measure the spatial spillover effect. There are significant positive spatial spillover effects in the Yangtze River Delta and the Pearl River Delta, which show that it is important and feasible to strengthen urban linkages to promote innovative development. The spatial spillover effects show multiple heterogeneities; for example, the spatial spillover effects in different periods have changed significantly. The heterogeneity tests show that promoting innovation development through spatial spillover effect requires more targeted measures based on actual development conditions. From the perspective of the geographical distance threshold evolution pattern, the spatial spillover effects all exhibited an inverted U-shaped evolution trend for the two urban agglomeration integration regions, and the spatial spillover effect is always stronger in the Yangtze River Delta. The spillover effect is strongest in the Yangtze River Delta at 400 km and in the Pearl River Delta at 200 km. This conclusion indicates that although more cities expect to achieve innovative development by integrating into urban agglomeration, there may be an optimal boundary of urban agglomeration scope in the innovative and coordinated development. Based on the relevant empirical research, we propose promoting the high-quality innovation development by strengthening urban agglomeration cooperation, realizing urban development paths, and improving macro political systems. It also indicates that the relevant policies should be formulated after considering the local conditions of urban agglomeration. This study not only enriches the spatial spillover effect research, but also has reference significance for promoting the high-quality development and the urban agglomeration integration region expansion.
Funding
This research was funded by the National Natural Science Foundation of China, funding numbers is 42101183, the funder is Dongsheng Yan.
Data Availability Statement
the CNRDS (http://www.cnrds.com accessed on 6 October 2022); Shanghai Statistical Yearbook (https://tjj.sh.gov.cn/tjnj/index.html accessed on 6 October 2022); Jiangsu Statistical Yearbook (http://tj.jiangsu.gov.cn/col/col83749/index.html accessed on 10 October 2022); Zhejiang Statistical Yearbook (http://tjj.zj.gov.cn/col/col1525563/index.html accessed on 10 October 2022); Anhui Statistical Yearbook (http://tjj.ah.gov.cn/ssah/qwfbjd/tjnj/index.html accessed on 12 October 2022); Guangdong Statistical Yearbook (http://stats.gd.gov.cn/gdtjnj/ accessed on 12 October 2022).
Conflicts of Interest
The authors declare no conflict of interest.
References
- Capello, R.; Lenzi, C. Knowledge, innovation and productivity gains across European regions. Reg. Stud. 2015, 49, 1788–1804. [Google Scholar] [CrossRef]
- Li, Y.; Phelps, N. Knowledge polycentricity and the evolving Yangtze River Delta megalopolis. Reg. Stud. 2017, 51, 1–13. [Google Scholar] [CrossRef]
- Zhai, C.; Du, D.; Shi, W. Spatiotemporal evolution and determinants of the geography of Chinese patents abroad: A case study of strategic emerging industries. Systems 2023, 11, 33. [Google Scholar] [CrossRef]
- Jucevicius, R.; Jukneviciene, V.; Mikolaityte, J.; Saparniene, D. Assessing the regional innovation system’s absorptive capacity: The approach of a smart region in a small country. Systems 2017, 5, 27. [Google Scholar] [CrossRef]
- Shang, Q.; Poon, J.; Yue, Q. The role of regional knowledge spillovers on China’s innovation. China Econ. Rev. 2012, 23, 1164–1175. [Google Scholar] [CrossRef]
- Peng, W.; Yin, Y.; Kuang, C.; Wen, Z.; Kuang, J. Spatial spillover effect of green innovation on economic development quality in China: Evidence from a panel data of 270 prefecture-level and above cities. Sustain. Cities Soc. 2021, 69, 102863. [Google Scholar] [CrossRef]
- Méndez, R.; Moral, S. Spanish cities in the knowledge economy: Theoretical debates and empirical evidence. Eur. Urban Reg. Stud. 2011, 18, 136–155. [Google Scholar] [CrossRef]
- Fang, Z.; Razzaq, A.; Mohsin, M.; Irfan, M. Spatial spillovers and threshold effects of internet development and entrepreneurship on green innovation efficiency in China. Technol. Soc. 2022, 68, 101844. [Google Scholar] [CrossRef]
- Fujita, M. Towards the new economic geography in the brain power society. Reg. Sci. Urban Econ. 2007, 37, 482–490. [Google Scholar] [CrossRef]
- Audretsch, D.; Feldman, M. R & D spillovers and the geography of innovation and production. Am. Econ. Rev. 1996, 86, 630–640. [Google Scholar]
- Cui, W.; Li, L.; Chen, G. Market-value oriented or technology-value oriented? Location impacts of industry-university-research (IUR) cooperation bases on innovation performance. Technol. Soc. 2022, 70, 102025. [Google Scholar] [CrossRef]
- Krugman, P. Increasing returns and economic geography. J. Polit. Econ. 1991, 99, 483–499. [Google Scholar] [CrossRef]
- Autant-Bernard, C. Spatial econometrics of innovation: Recent contributions and research perspectives. Spat. Econ. Anal. 2012, 7, 403–419. [Google Scholar] [CrossRef]
- Sheng, Y.; Zhao, J.; Zhang, X.; Song, J.; Miao, Y. Innovation efficiency and spatial spillover in urban agglomerations: A case of the Beijing-Tianjin-Hebei, the Yangtze River Delta, and the Pearl River Delta. Growth Chang. 2019, 50, 1280–1310. [Google Scholar] [CrossRef]
- Rosenthal, S.; Strange, W. Geography, industrial organization, and agglomeration. Rev. Econ. Stat. 2003, 85, 377–393. [Google Scholar] [CrossRef]
- Glaeser, E. Learning in cities. J. Urban Econ. 1999, 46, 254–277. [Google Scholar] [CrossRef]
- Li, W.; Zheng, M. Is it substantive innovation or strategic innovation?: Impact of macroeconomic policies on microenterprises’ innovation. Econ. Res. J. 2016, 51, 60–73. [Google Scholar]
- Zhang, J.; Zheng, W. Has catch-up strategy of innovation inhibited the quality of China’s patents? Econ. Res. J. 2018, 53, 28–41. [Google Scholar]
- Gambardella, A.; Harhoff, D.; Verspagen, B. The economic value of patent portfolios. J. Econ. Manag. Strategy 2017, 26, 735–756. [Google Scholar] [CrossRef]
- Li, D.; Wei, Y.; Wang, T. Spatial and temporal evolution of urban innovation network in China. Habitat Int. 2015, 49, 484–496. [Google Scholar] [CrossRef]
- Romer, P. Increasing returns and long-run growth. J. Polit. Econ. 1986, 94, 1002–1037. [Google Scholar] [CrossRef]
- Griliches, Z. Patent statistics as economic indicators: A survey. J. Econ. Lit. 1990, 28, 1661–1707. [Google Scholar]
- Corinne, A.; James, P. Quantifying knowledge spillovers using spatial econometric models. J. Reg. Sci. 2011, 51, 471–496. [Google Scholar]
- Tobler, W. A computer movie simulating urban growth in the Detroit region. Econ. Geogr. 1970, 46, 234–240. [Google Scholar] [CrossRef]
- Timothy, G.; Ethan, L. Economic distance and cross-country spillovers. J. Econ. Growth 2002, 7, 157–187. [Google Scholar]
- Jaffe, A. Technological opportunity and spillovers of R&D: Evidence from firm’s patents, profits and market value. Am. Econ. Rev. 1986, 76, 984–1001. [Google Scholar]
- Fallick, B.; Fleischman, C.; Rebitzer, J. Job-hopping in Silicon Valley: Some evidence concerning the microfoundations of a high-technology cluster. Rev. Econ. Stat. 2006, 88, 472–481. [Google Scholar] [CrossRef] [Green Version]
- Cheng, K.; Zhang, Y. Measurement and decomposition of cities’ innovation spatial spillovers in China. Sci. Res. Manag. 2018, 39, 86–94. [Google Scholar]
- Wang, Q.; Hu, Z. A microlevel analysis on R&D firm agglomeration and magnitude of knowledge spillovers in continuous space. Sci. Geogr. Sinica 2018, 38, 1828–1836. [Google Scholar]
- Zhou, C.; Zeng, G.; Mi, Z.F.; Guo, X. The study of regional innovation network patterns: Evidence from the Yangtze River Delta urban agglomeration. Prog. Geogr. 2017, 36, 795–805. [Google Scholar]
- Acs, Z.; Anselin, L.; Varga, A. Patents and innovation counts as measurers of regional production of new knowledge. Res. Policy 2002, 31, 1069–1085. [Google Scholar] [CrossRef]
- Carlino, G.; Chatterjee, S.; Hunt, R. Urban density and the rate of invention. J. Urban. Econ. 2007, 61, 389–419. [Google Scholar] [CrossRef]
- Guan, J.; Yam, R. Effects of government financial incentives on firms’ innovation performance in China: Evidence from Beijing in the 1990s. Res. Policy 2015, 44, 273–282. [Google Scholar] [CrossRef]
- Ma, J.; Zeng, G.; Hu, S.; Sun, K. Innovation network structure of biomedical industry and its influencing factors in Yangtze River Delta. Res. Environ. Yangtze Basin 2022, 31, 960–971. [Google Scholar]
- Yan, D.; Sun, W. Study on the evolution, driving factors, and regional comparison of innovation patterns in the Yangtze River Delta. Land 2022, 11, 876. [Google Scholar] [CrossRef]
- Lesage, J.; Fischer, M. Estimates of the impact of static and dynamic knowledge spillovers on regional factor productivity. Int. Reg. Sci. Rev. 2012, 35, 103–127. [Google Scholar] [CrossRef]
- Burger, M.; van der Knaap, B.; Wall, R. Polycentricity and the multiplexity of urban networks. Eur. Plan. Stud. 2014, 22, 816–840. [Google Scholar] [CrossRef]
- Berliant, M.; Reed, R.; Wang, P. Knowledge exchange, matching, and agglomeration. J. Urban Econ. 2006, 60, 69–95. [Google Scholar] [CrossRef]
- Wang, Y.; Ni, P.; Wang, G. Research on the spatial structure and polycentric evolution of Chinese urban agglomeration. Jianghuai Trib. 2019, 47–53. [Google Scholar]
- Huggins, R.; Prokop, D. Network structure and regional innovation: A study of university-industry ties. Urban Stud. 2017, 54, 931–952. [Google Scholar] [CrossRef]
Figure 1.
Study areas.
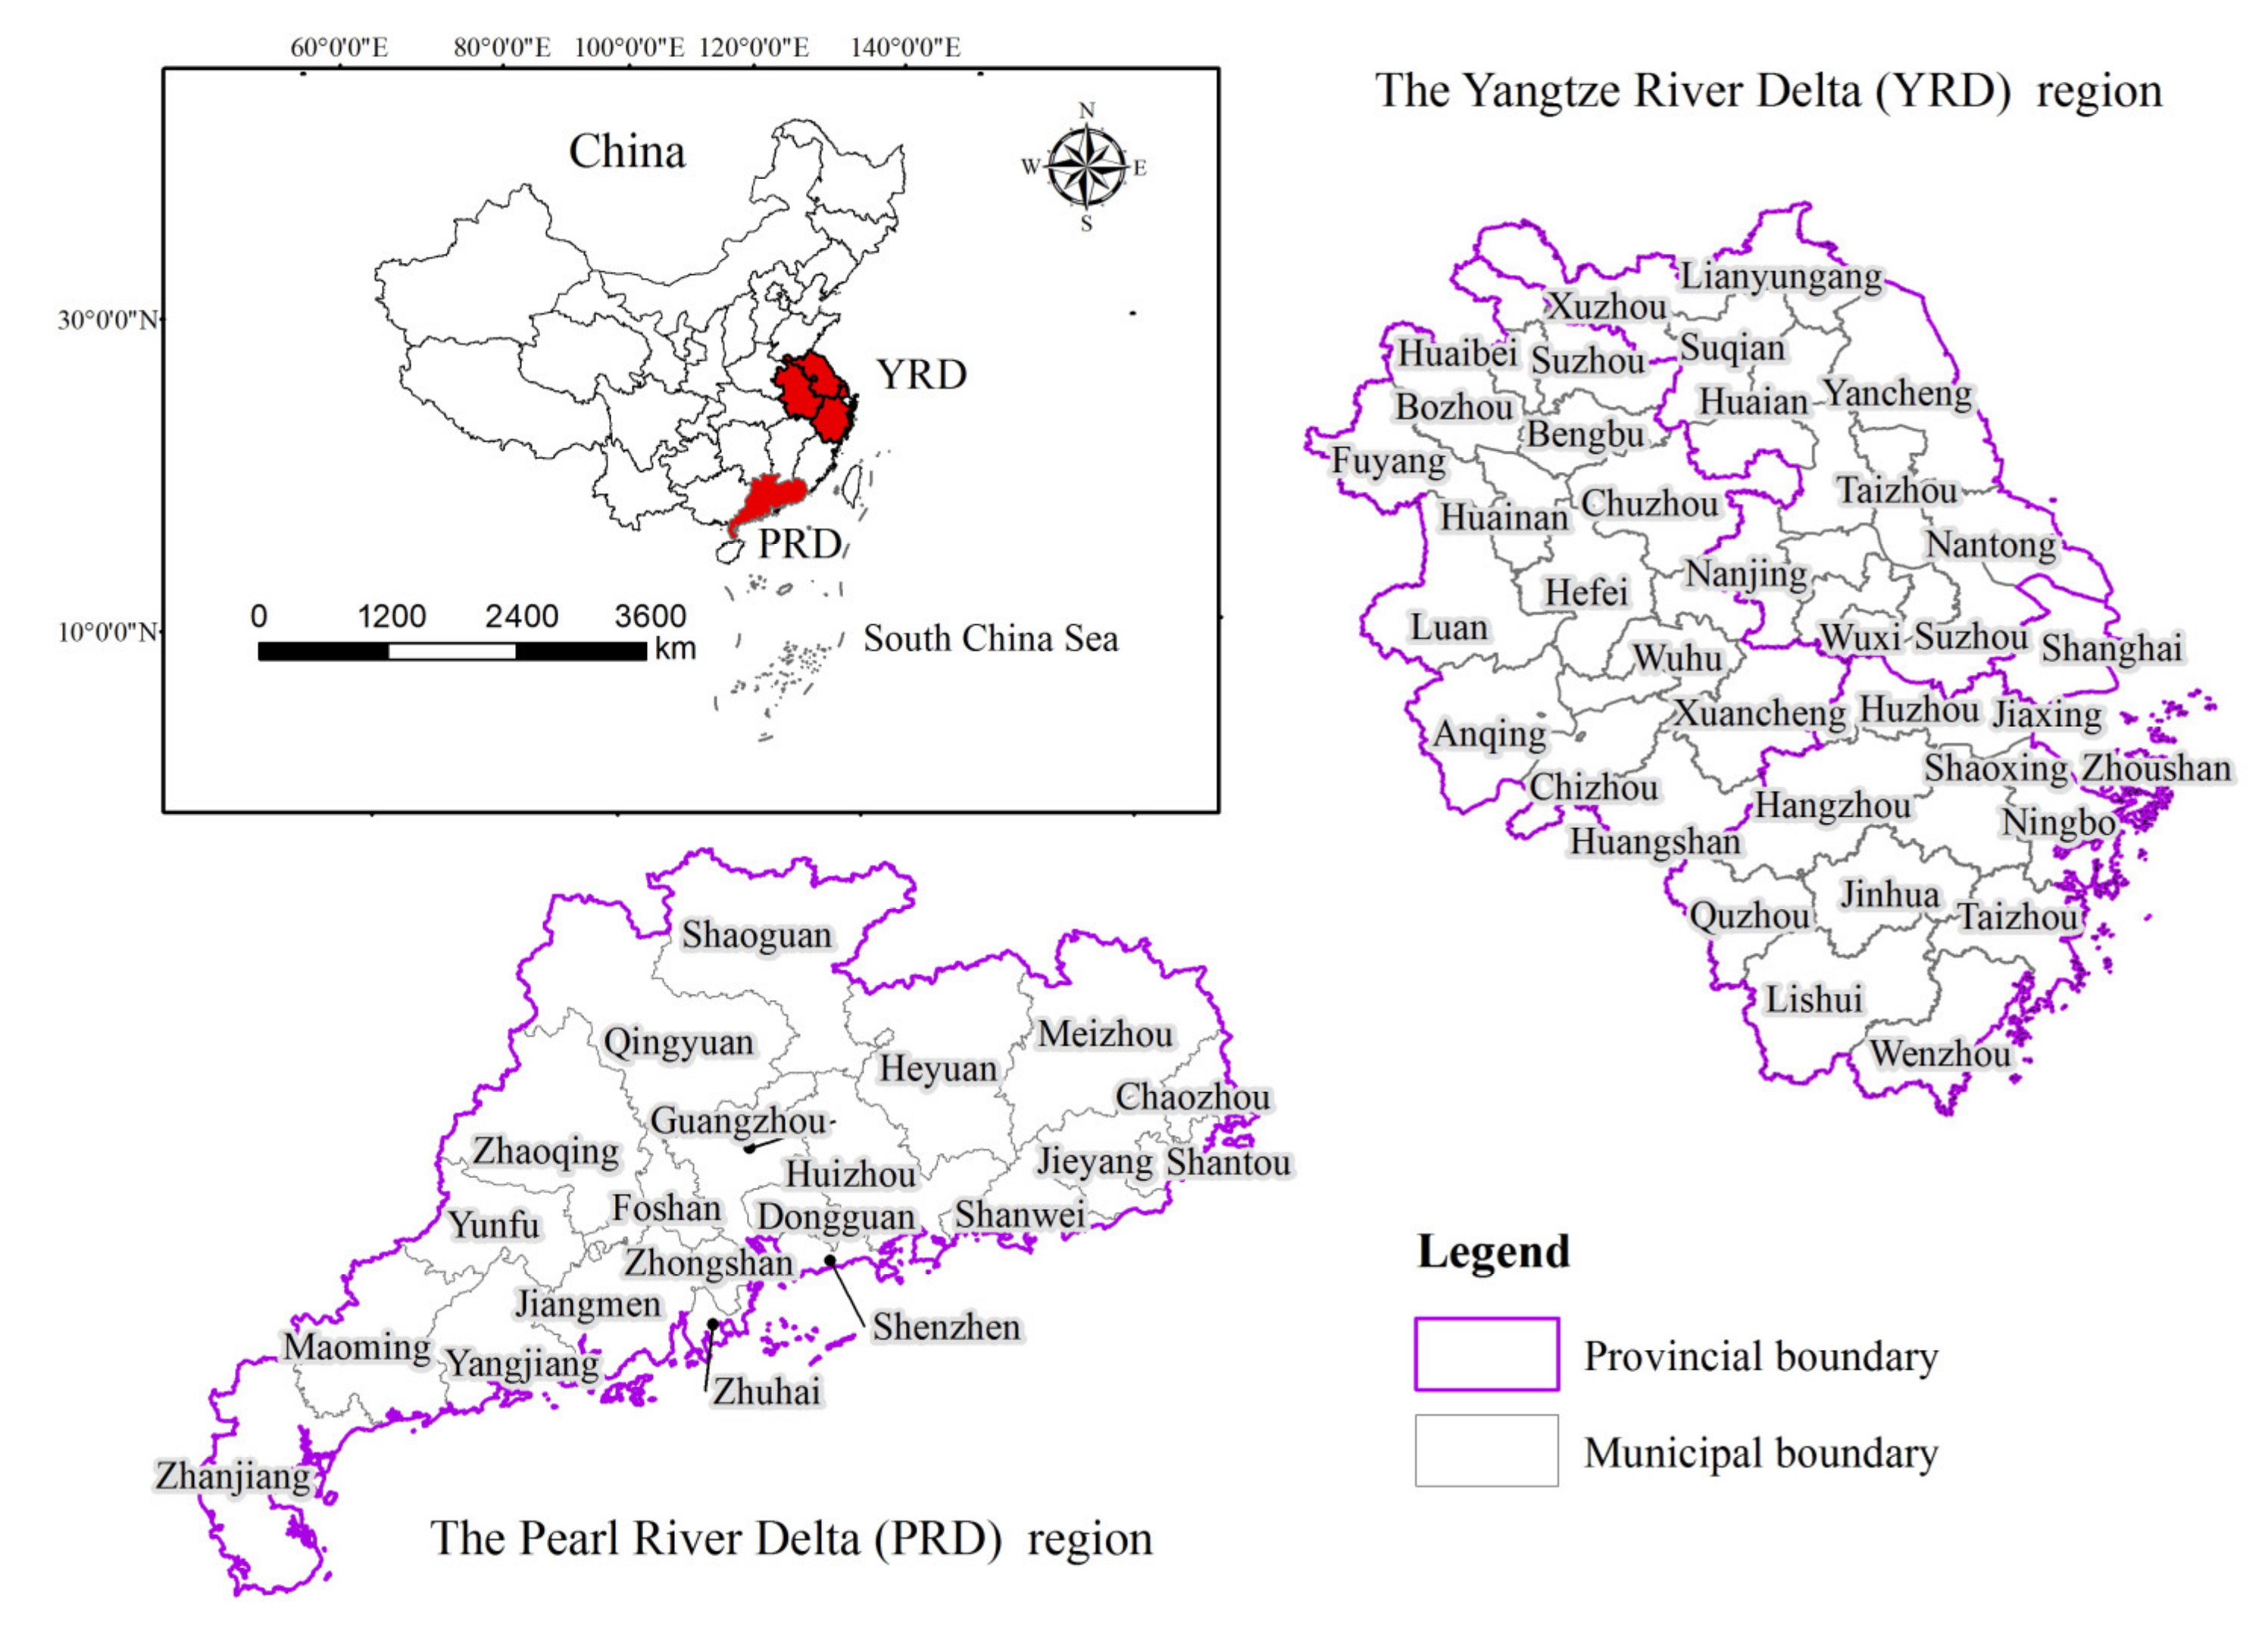
Figure 2.
Growth of invention patents in different urban agglomeration regions.

Figure 3.
Spatial agglomeration of innovation in different urban agglomeration regions.
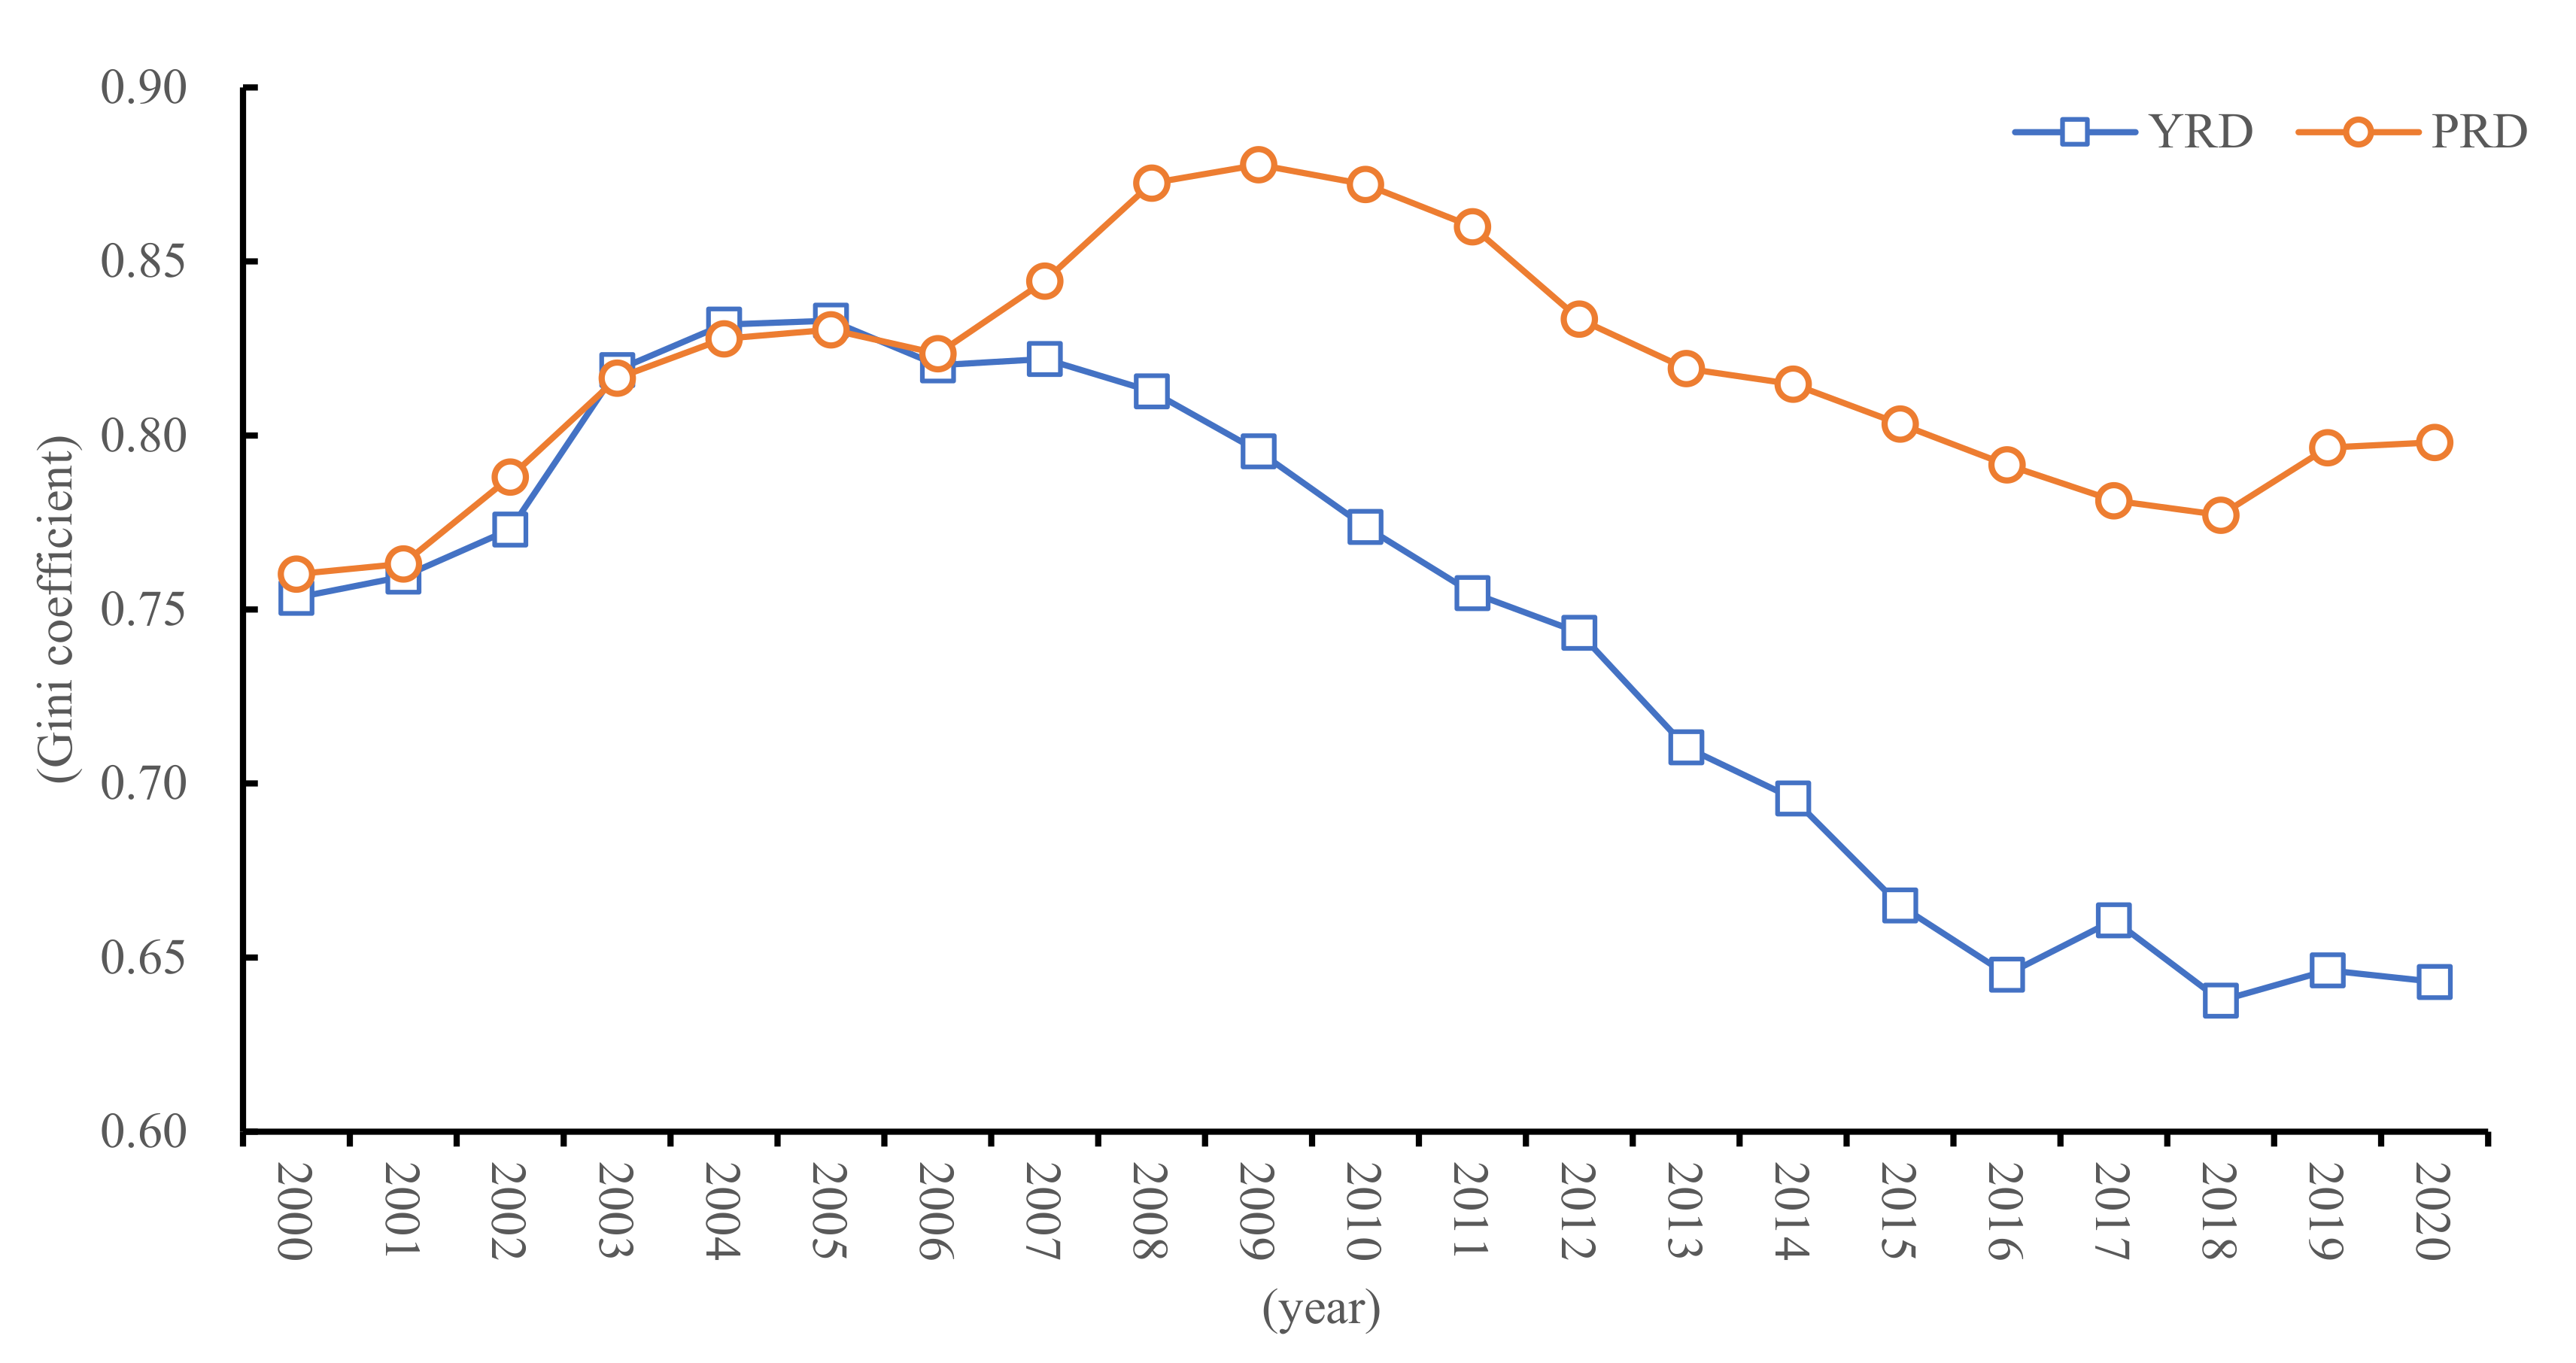
Figure 4.
Steps for the empirical research.
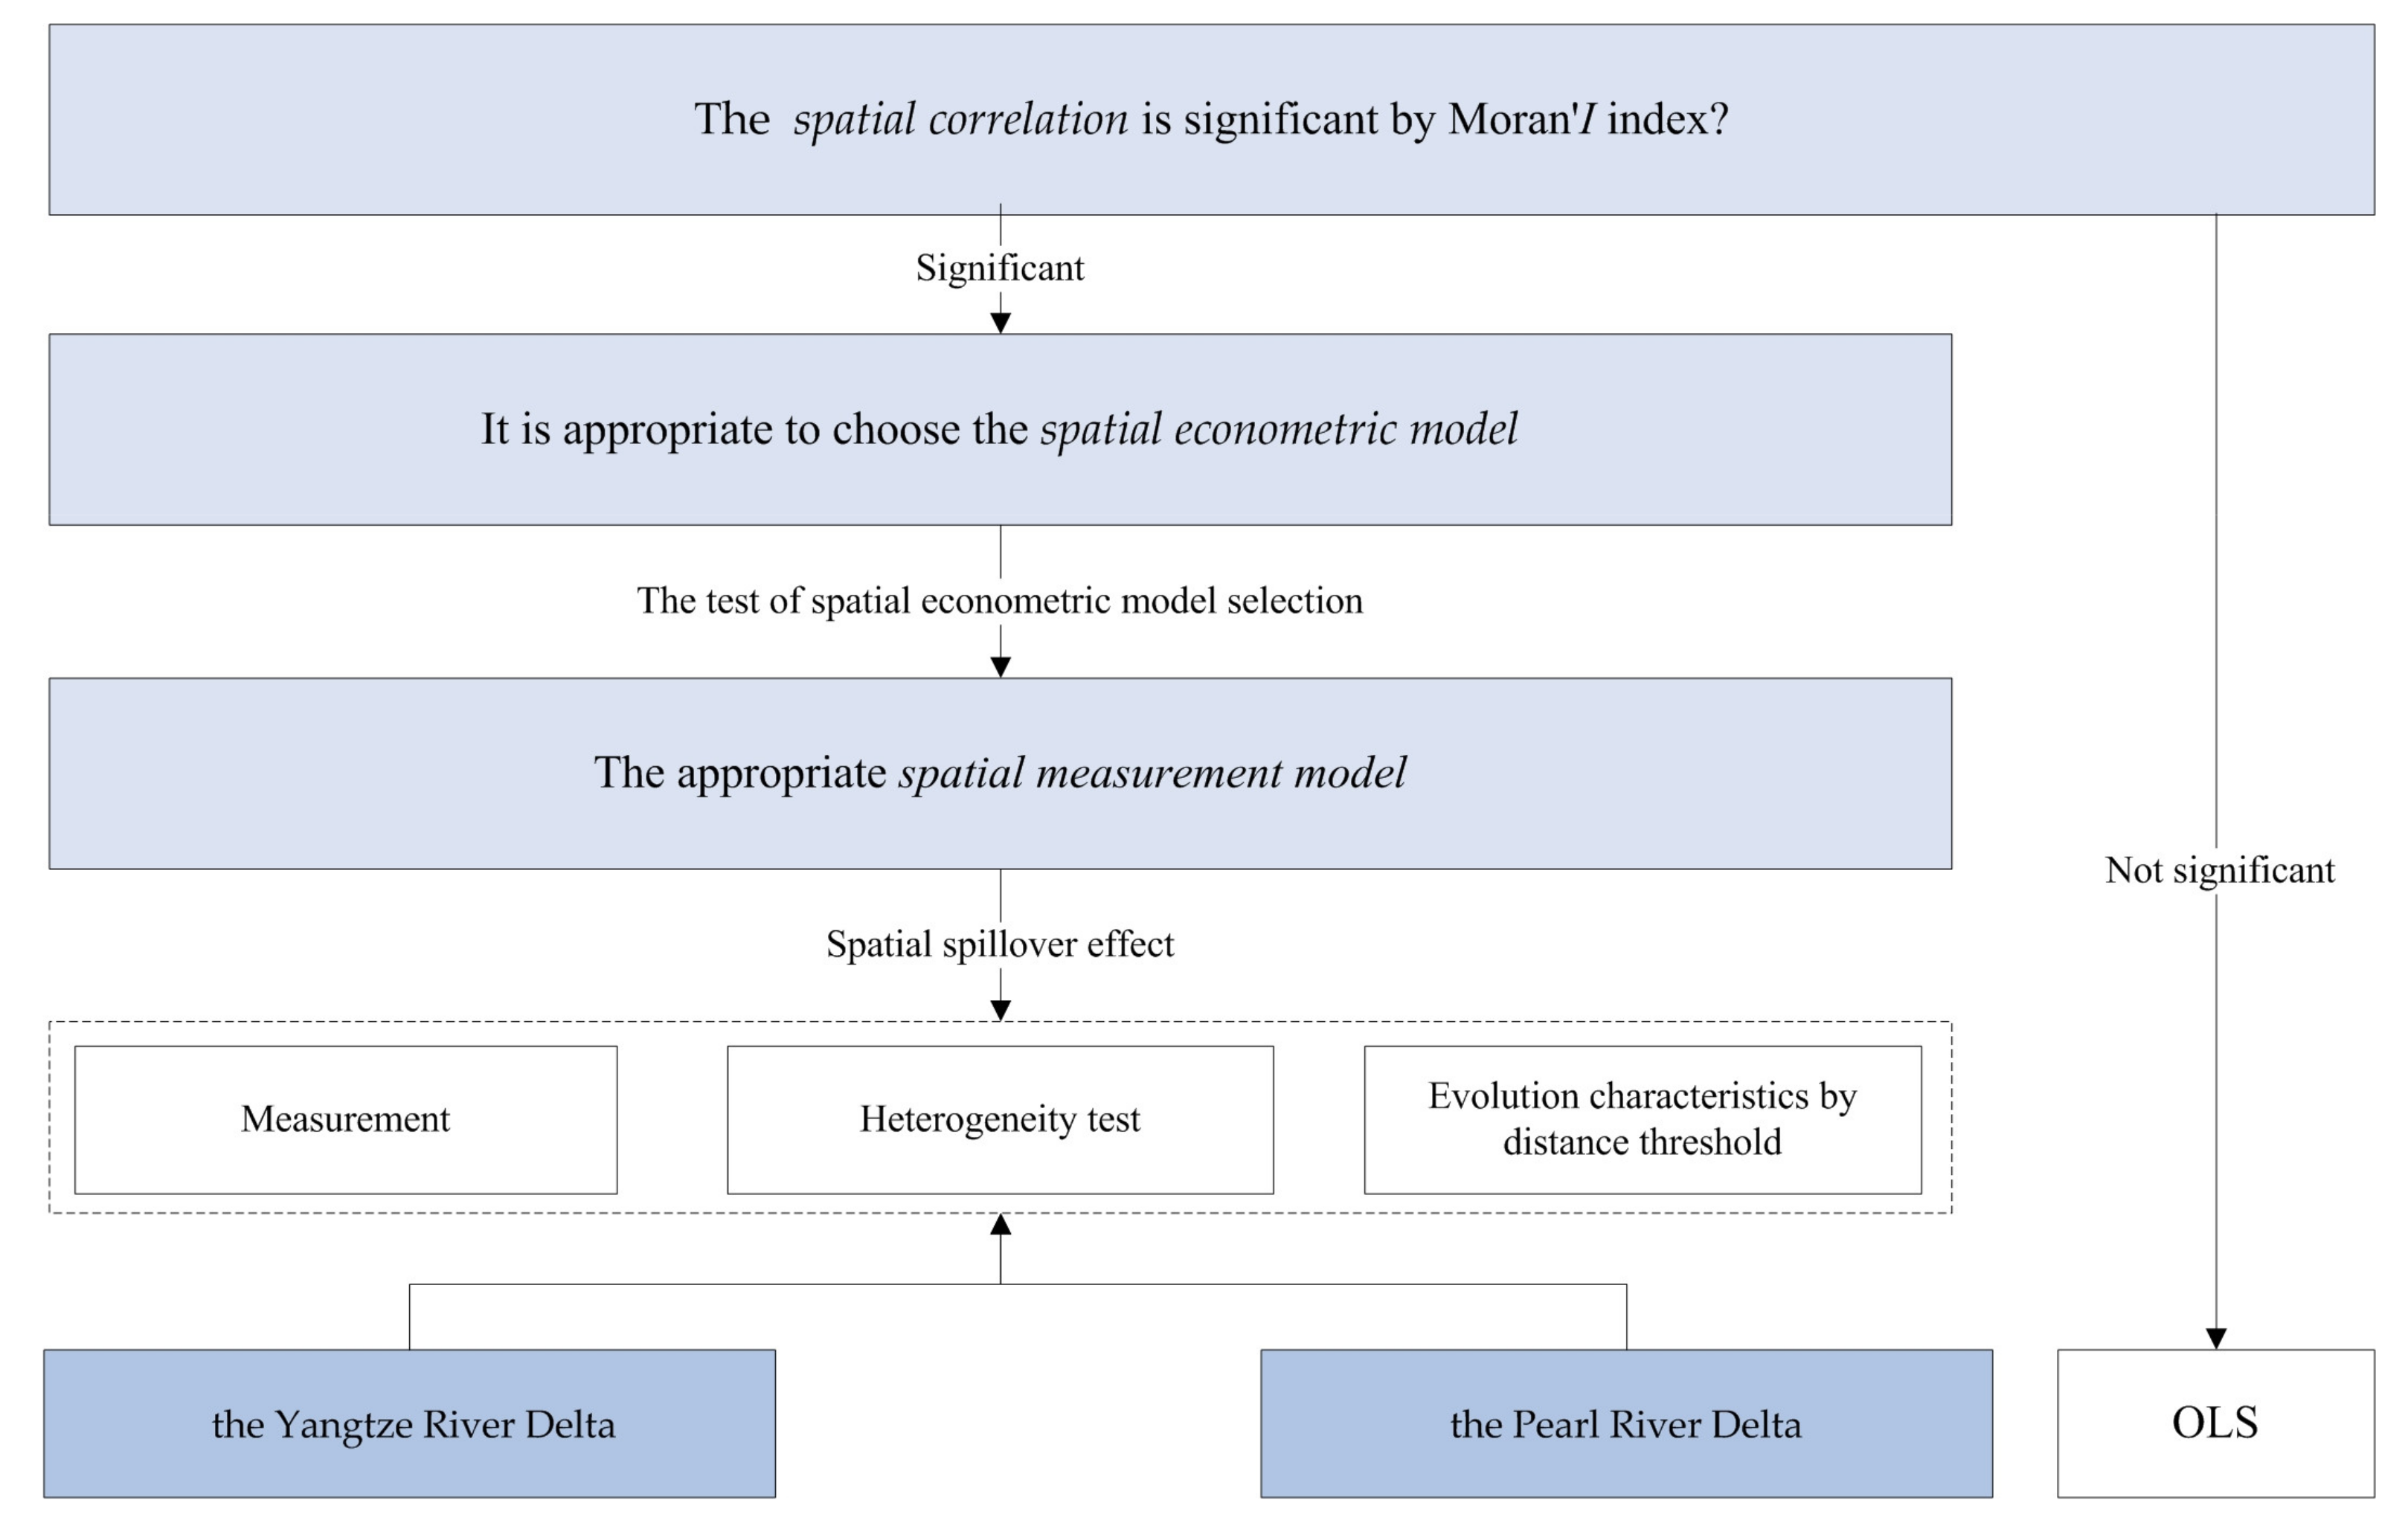
Figure 5.
Identification of the spatial correlation of OLS estimated residuals.

Figure 6.
Spatial spillover effects of innovation with geographical distance threshold.


Table 1.
OLS estimation results.
| Variable | H | K | Dep | Open | Fin | Tra | Constant | R2 |
|---|---|---|---|---|---|---|---|---|
| YRD | 0.242 *** (3.51) | 0.106 *** (3.71) | 0.0625 (0.38) | 0.0536 (0.92) | 1.507 *** (18.07) | 0.347 *** (5.06) | −13.193 *** (−11.79) | 0.920 |
| PRD | 1.005 *** (10.87) | 0.0695 (0.98) | 1.467 *** (6.21) | 0.0732 (0.68) | 0.145 (1.02) | 0.608 *** (5.48) | −25.962 ** (−12.68) | 0.872 |
Note: t-values are given in parentheses. ** p < 0.05. *** p < 0.01.
Table 2.
Test results of the spatial panel model.
| Test Indicator | YRD | PRD | ||
|---|---|---|---|---|
| Statistics | Probability | Statistics | Probability | |
| LM-lag | 22.98 | 0.0003 | 22.00 | 0.0005 |
| Robust LM-lag | 55.78 | 0.000 | 24.72 | 0.0004 |
| LM-error | 31.58 | 0.000 | 24.93 | 0.0004 |
| Robust LM-error | 40.49 | 0.000 | 52.06 | 0.000 |
| Wald-spatial lag | 24.33 | 0.0002 | 9.94 | 0.0770 |
| LR-spatial lag | 17.23 | 0.0085 | 63.76 | 0.0000 |
| Wald-spatial error | 32.38 | 0.0000 | 29.84 | 0.0000 |
| LR-spatial error | 82.14 | 0.0000 | 102.26 | 0.0000 |
| Hausman | 217.18 | 0.000 | 60.71 | 0.0000 |
Table 3.
Estimation results of the SDM.
| Variable | (1) | (2) |
|---|---|---|
| H | 0.0668 ** (2.14) | 0.472 *** (4.72) |
| K | 0.0920 *** (2.86) | −0.296 (−0.76) |
| Dep | −0.983 *** (−5.40) | 0.718 (1.08) |
| Open | 0.125 ** (2.40) | −0.315 (−0.84) |
| Fin | 0.526 *** (5.40) | 0.134 ** (1.97) |
| Tra | 0.140 ** (2.45) | 0.433 *** (4.41) |
| W × H | 0.361 (1.48) | −0.203 (−0.61) |
| W × K | −0.0942 * (−1.72) | 0.288 ** (1.91) |
| W × Dep | 0.310 *** (2.57) | 1.755 ** (2.06) |
| W × Open | 0.0272 (0.17) | 0.747 *** (3.19) |
| W × Fin | 0.0844 ** (2.03) | 0.164 (0.41) |
| W × Tra | 0.677 * (1.89) | 0.150 ** (2.55) |
| ρ | 0.604 *** (9.21) | 0.264 ** (2.27) |
| R2 | 0.942 | 0.901 |
Note: t-values are given in parentheses. * p < 0.1. ** p < 0.05. *** p < 0.01.
Table 4.
Robustness test results.
| Variable | (1) | (2) | (3) | (4) |
|---|---|---|---|---|
| H | 0.0782 ** (2.29) | 0.424 *** (3.14) | 0.413 *** (4.12) | 0.435 *** (4.39) |
| K | 0.0978 *** (3.02) | 0.720 *** (2.86) | −0.170 (−1.05) | 0.198 * (1.91) |
| Dep | −0.868 *** (−4.90) | −0.195 ** (−2.34) | 0.386 (1.20) | 0.968 (0.89) |
| Open | 0.134 ** (2.48) | 0.725 ** (2.40) | −0.310 (−0.73) | 0.347 (1.15) |
| Fin | 0.611 *** (6.29) | 0.722 *** (9.31) | 0.190 (1.23) | 0.0629 *** (3.45) |
| Tra | 0.157 *** (2.62) | 0.340 ** (2.45) | 0.325 *** (3.22) | 0.452 *** (4.63) |
| W × H | 0.458 (1.53) | 0.561 ** (2.48) | −0.306 * (−1.81) | −0.0700 (−0.21) |
| W × K | −0.0492 ** (−2.11) | −0.0475 (−1.07) | 0.241 * (1.81) | 0.102 ** (1.99) |
| W × Dep | 0.582 ** (2.14) | 0.333 ** (2.02) | 0.477 ** (2.12) | 1.872 *** (2.62) |
| W × Open | 0.206 (0.23) | 0.0311 (0.39) | 0.656 *** (3.49) | 0.657 *** (2.82) |
| W × Fin | 0.508 *** (3.17) | 0.547 *** (2.60) | 0.670 (1.57) | 0.159 (0.41) |
| W × Tra | 0.320 *** (2.72) | 0.858 *** (2.86) | 0.285 *** (2.61) | 0.177 ** (2.15) |
| ρ | 0.297 *** (6.92) | 0.574 *** (8.59) | 0.272 *** (3.95) | 0.438 *** (3.00) |
| R2 | 0.937 | 0.949 | 0.900 | 0.902 |
Note: t-values are given in parentheses. * p < 0.1. ** p < 0.05. *** p < 0.01.
Table 5.
Estimation results for different regions.
| Variable | (1) | (2) | (3) | (4) |
|---|---|---|---|---|
| H | 0.0104 ** (2.12) | 0.0651 (0.82) | 0.420 *** (2.96) | 0.321 ** (2.23) |
| K | 0.116 ** (2.25) | 0.0643 (1.61) | 0.0520 (0.38) | −0.350 *** (−3.43) |
| Dep | 0.873 (1.06) | −0.537 ** (−2.11) | 0.632 (1.26) | −0.560 (−1.28) |
| Open | 0.349 *** (3.38) | 0.0619 (0.90) | −0.0780 (−0.24) | 0.0274 (0.25) |
| Fin | 0.404 **(2.19) | 0.361 *** (2.82) | 0.0301 ** (2.13) | −0.399 (−1.26) |
| Tra | −0.195 * (−1.91) | 0.276 *** (3.67) | 0.113 (0.59) | 0.292 *** (2.77) |
| W × H | 0.437 * (1.94) | 0.739 (1.49) | −0.685 ** (−2.03) | −0.367 (−0.79) |
| W × K | −0.0380 (−0.55) | −0.0744 (−0.95) | −0.174 (−0.47) | 0.269 ** (2.13) |
| W × Dep | 1.251 ** (2.36) | 0.207 (0.26) | 2.151 (1.49) | 2.311 *** (3.74) |
| W × Open | −0.274 * (−1.69) | −0.0584 (−0.19) | 0.523 (0.85) | 0.306 (1.48) |
| W × Fin | −0.263 (−1.06) | 0.243 (0.49) | 0.0970 (0.13) | 0.430 (1.54) |
| W × Tra | 0.660 * (1.75) | 0.489 (1.21) | 0.0718 (0.13) | −0.227 (−0.88) |
| ρ | 0.646 *** (7.63) | 0.170 *** (5.48) | 0.279 ** (2.40) | 0.0995 (0.75) |
| R2 | 0.960 | 0.935 | 0.944 | 0.891 |
Note: t-values are given in parentheses. * p < 0.1. ** p < 0.05. *** p < 0.01.
Table 6.
Estimation results for different periods.
| Variable | (1) | (2) | (3) | (4) |
|---|---|---|---|---|
| H | −0.425 (−1.24) | 0.619 *** (2.99) | 0.0281 (0.13) | 0.276 ** (2.58) |
| K | −0.0207 (−0.48) | 0.440 *** (6.22) | −0.269 *** (−3.22) | 0.356 * (1.76) |
| Dep | −0.993 *** (−3.13) | −0.483 (−1.61) | −2.107 *** (−2.92) | 0.0898 (0.27) |
| Open | 0.212 (1.64) | 0.356 *** (4.68) | −0.137 (−0.87) | 0.00659 (0.04) |
| Fin | 0.707 *** (3.97) | 0.0129 (0.11) | 0.0505 (0.19) | 0.527 ** (2.31) |
| Tra | −0.0430 (−0.25) | 0.269 *** (2.93) | 0.310 * (1.95) | −0.183 (−1.29) |
| W × H | −2.139 (−0.81) | 0.712 (0.31) | −3.520 * (−1.80) | −0.0784 (−0.05) |
| W × K | −0.283 *** (−2.99) | 1.103 (1.53) | 0.333 ** (1.97) | 1.481 ** (2.42) |
| W × Dep | −0.976 ** (−2.57) | 3.553 *** (2.82) | 0.927 (0.66) | −1.468 * (−1.65) |
| W × Open | 5.274 *** (2.83) | −1.002 *** (−3.36) | 3.461 *** (2.67) | −0.253 (−0.61) |
| W × Fin | 0.376 (0.20) | 0.322 (1.27) | −1.515 (−0.99) | 0.327 (0.71) |
| W × Tra | 0.66 (1.42) | 0.871 ** (2.10) | 0.414 *** (2.65) | 0.0867 (0.00) |
| ρ | −0.861 ** (−2.13) | 0.688 *** (3.40) | 0.245 (1.48) | 0.286 *** (2.86) |
| R2 | 0.734 | 0.898 | 0.733 | 0.821 |
Note: t-values are given in parentheses. * p < 0.1. ** p < 0.05. *** p < 0.01.
Disclaimer/Publisher’s Note: The statements, opinions and data contained in all publications are solely those of the individual author(s) and contributor(s) and not of MDPI and/or the editor(s). MDPI and/or the editor(s) disclaim responsibility for any injury to people or property resulting from any ideas, methods, instructions or products referred to in the content. |
© 2023 by the author. Licensee MDPI, Basel, Switzerland. This article is an open access article distributed under the terms and conditions of the Creative Commons Attribution (CC BY) license (https://creativecommons.org/licenses/by/4.0/).
Share and Cite
MDPI and ACS Style
Yan, D. Measurement and Comparison of the Innovation Spatial Spillover Effect: A Study Based on the Yangtze River Delta and the Pearl River Delta, China. Systems 2023, 11, 90. https://doi.org/10.3390/systems11020090
AMA Style
Yan D. Measurement and Comparison of the Innovation Spatial Spillover Effect: A Study Based on the Yangtze River Delta and the Pearl River Delta, China. Systems. 2023; 11(2):90. https://doi.org/10.3390/systems11020090
Chicago/Turabian StyleYan, Dongsheng. 2023. "Measurement and Comparison of the Innovation Spatial Spillover Effect: A Study Based on the Yangtze River Delta and the Pearl River Delta, China" Systems 11, no. 2: 90. https://doi.org/10.3390/systems11020090
Note that from the first issue of 2016, this journal uses article numbers instead of page numbers. See further details here.