

The Adaptive Seismic Resilience of Infrastructure Systems: A Bayesian Networks Analysis

1
Institute for Disaster Management and Reconstruction, Sichuan University, Chengdu 610065, China
2
School of Management, Guizhou University, Guiyang 550025, China
3
Business School, Sichuan University, Chengdu 610065, China
4
School of Architecture and Built Environment, Deakin University, Geelong, VIC 3220, Australia
*
Author to whom correspondence should be addressed.
Systems 2023, 11(2), 84; https://doi.org/10.3390/systems11020084
Submission received: 4 January 2023
/
Revised: 28 January 2023
/
Accepted: 30 January 2023
/
Published: 6 February 2023
(This article belongs to the Topic Digital Technologies for Urban Resilience)
Abstract
:Earthquakes pose a significant threat to infrastructure systems. However, improving the seismic resilience of infrastructure systems in earthquake-prone regions is fraught with obstacles. First, this article reviews the current status of earthquake resilience research, points out the gaps of existing research, and then focuses on the adaptability in resilience. Secondly, five groups of influencing factors of infrastructure system adaptability are identified and clustered through literature review and expert knowledge. Thirdly, the structure and conditional probability table of the Bayesian network model are given in detail, and the evaluation model of Bayesian network adaptability is created. A Chinese earthquake-prone county was used to verify the applicability of the model. The research uses forward propagation analysis to calculate the adaptability of the case and obtains the probability of the case’s adaptability. The backward propagation to obtain the ranking of the influence degree of the critical influencing factors on the adaptability and the top three factors are respectively earthquake history, relevant information and contingency mechanisms. Finally, the research suggests measures to improve adaptability.
1. Introduction
According to the EM-DAT database, there were 1154 large earthquakes worldwide between 1970 and 2022, resulting in over 1.3 million deaths and over 23 million displacements [1,2]. In many regions of the world, earthquakes are now the primary threat to infrastructure systems. The US President’s Commission on Critical Infrastructure Protection (PCCIP) first brought this concern to public attention, proposing the notion of interdependent infrastructure systems [3]. Infrastructure system refers to a “system-of-systems” comprising water, power, communication, roads, and other systems that are closely linked to the provision of those needs on which people are reliant for survival [4]. Globalization has highlighted the interconnectedness that exists between essential infrastructure systems, which have become increasingly commonplace and intricate [5,6,7]. Infrastructure systems’ operational effectiveness is enhanced by this interconnectedness. However, this has also made infrastructure systems more susceptible to interruption. One infrastructure system through topology and proximity to laying locations causes disruption of undamaged components in other infrastructure systems and further generates a series of cascading failures [5,8,9,10,11] and/or escalating and common cause failures in an entire network of critical infrastructure systems [5].
Thus, in mitigating against the consequences of earthquake-related catastrophes, the construction of robust and resilient infrastructure systems is crucial. The challenge until now has been in how to analyze and measure the resilience of existing infrastructure systems in order to investigate mechanisms by which such systems may be strengthened. Recognition of this importance is seen in the significant body of research on resilience published to date.
1.1. Related Research in Resilience
Bruneau et al. first introduced the notion of seismic resilience [11,12]. Subsequent research on seismic resilience has been largely carried out across two dimensions, those being geospatial research emphasizing locale or research exploring specific infrastructure types. These two dimensions are, of course, interdependent; for instance, assessing the impact of key infrastructure systems on communities is a prerequisite to boosting community resilience [13]. Moreover, the overall resilience of a town or city is contingent on the resilience of its essential infrastructure systems, without which daily life can expect to be severely disrupted following any devastating event [14].
The resilience of a single infrastructure system type, including water, power, roads, or communications, is the primary focus of academic research. The most prolific literature relates to water systems [15,16,17,18,19] and power systems [20,21]. Farahmandfar et al. evaluated the quake resilience of the water system in Charleston, South Carolina, USA [19]. Chang and Shinozuka quantified the seismic capacity of the Shelby drinking water systems in Tennessee, USA [22]. Ouyang and Duenas-Osorio studied the power supply system in Harris County, Texas, USA, using the case to simulate and evaluate the time-dependent aspects of resilience and efficacy of a resilience heuristic technique [23].
Other scholars have investigated the resilience of multi-infrastructure systems and their interdependencies. In regards to interaction between infrastructure systems, the most prevalent theory holds that the interdependence of infrastructure systems networks is comprised of four relationships: functional (physical), informational (cyber), geographical, and logical [5]. Given the interdependence of infrastructure systems, evaluation of the resilience of critical infrastructure systems cannot be carried out without also evaluating that interdependence [14]. When examining the seismic resilience of infrastructure systems, functional dependency and geographical dependency are the two most critical linkages. The degree of interaction between these two types of dependencies determines the severity of consequences when the system is subjected to external pressure [4]. As the operation of the majority of infrastructure systems is dependent on a stable energy supply, energy systems are characteristically at the center of multi-infrastructure systems research. There are, in fact, numerous publications on the interactions between power and water [15,19], power and communication [21,24], energy, water, transport, information communication technology (ICT) and waste sectors [25].
There is no general index for evaluating the resilience of multiple systems under threat of an earthquake [26]. Existing quantitative techniques for resilience assessment mostly concern a single system. This practice narrows the standard indicators, restricts flexibility and adaptability to new contexts, and disregards the nature of the interdependence between systems [27].
To solve the above problems, this study first defines the resilience of “system-of-systems”, then evaluates and quantifies it, and finally gives specific improvement strategies or measures. The resilience is defined as: the comprehensive performance of the resistibility, recoverability and adaptability of “system-of-systems” in response to earthquake disasters and the ability to maintain service performance in the face of a catastrophic earthquake. It can be measured as a percentage of system performance degradation and shown as Equation (1).
Recoverability: the capacity to restore service performance of the system to the level delivered prior to an earthquake calamity. The recoverability is measured as the time of recovery and illustrated as Equation (2).
Adaptability: the capacity to learn, adjust and deal with future seismic calamities more effectively. Adaptability embodies technical, economic, organizational, and social capability to adjust to earthquakes; therefore, it cannot be represented by a single indicator as in the previous two capabilities.
The definitions and models in this paper simplify the recovery process and possible recovery states after recovery in line with the models of Miles and Chang [28] and Cimellaro et al. [29].
As depicted in Figure 1, earthquakes occur at times , , and . In our research, earthquakes are viewed as instantaneous event. The performance of the resistibility, recoverability, and adaptability of infrastructure systems between two earthquakes may be illustrated using the time period as an example. indicates the time when the infrastructure system is affected by the earthquake; indicates the time when the infrastructure system recovers to its original performance; and indicates the time when the next earthquake occurs.
Equation (1) measures the resistibility of the infrastructure system:
represents the performance of the infrastructure system corresponding to the t time. A smaller indicates that the infrastructure system loses less service performance after a seismic event, hence indicating that the infrastructure system has stronger resistibility.
Equation (2) measures the recoverability of infrastructure systems:
A small suggests that the infrastructure system recovers to pre-earthquake service performance in a short amount of time, indicating that the infrastructure system has a strong capacity for recovery.
The time interval denotes the period of time between the infrastructure system’s service performance returning to its pre-earthquake level and the next earthquake occurring. During this time interval, the assessed area should learn and adjust in response to previous earthquakes in terms of technology, economy, organization, and society, and establish sufficient coping and preparation capabilities to resist subsequent earthquakes and restore infrastructure system performance faster. These capabilities can be used to measure the adaptability of infrastructure systems. The adaptability of infrastructure systems is measured by the response and preparedness capabilities internalized and adjusted during earthquakes. The coping and preparedness learned from the earthquake at the time of is part of the adaptability of resilience in the [,] time interval.
The quantification of adaptability is the research focus of this paper, elaborated on in the third and fourth sections of this paper.
1.2. Existing Literature Related to Bayesian Networks in Seismic Resilience
The Bayesian network (BN), developed in the field of artificial intelligence, is used to handle ambiguous issues. A Bayesian network combines the benefits of graph theory and probability statistics, as well as the benefits of intuitive and adaptive probabilistic reasoning. In order to account for uncertainty and incompleteness, Bayesian networks can factorize the joint distribution of variables based on conditional dependencies [30]. A Bayesian network is an analytical tool that illustrates all the causal relationships between qualitative and quantitative considerations in order to assist decision makers in comprehending how variables are interconnected, and in understanding how the modification one variable may affect others [31].
There are few extant studies that employ Bayesian networks in resilience assessments. Johansen and Tien sought to comprehend the effect of interdependencies on overall system vulnerability and suggested a probabilistic method based on Bayesian networks to describe the interdependencies of critical infrastructure systems [32].
De Iuliis, Kammouh et al. defined downtime as the time required to restore the functionality of an infrastructure system. They used available human resources, epicentral distance, and infrastructure maintenance as variables and built a Bayesian network model to quantitatively analyze the recovery time of power systems and communication systems under varying earthquake intensities. But the model does not consider the dependence between the power system and the communication system [21].
Kammouh, Gardoni et al. considered vulnerability reduction, robustness and restoration as the three pillars of resilience. They matched indicator characteristics for their pillars of resilience and constructed a static Bayesian network composed of an index layer, a resilience pillar layer, and a resilience index. The model is simple and captures the three essential manifestations of resilience, but the confidence level of the model has yet to be determined [24].
Hossain et al. presented a method for quantifying resilience using Bayesian networks. Resilience was defined in their study by three parameters: absorptive, adaptive and restorative capacity. The research focused on absorbency, adaptability, and Bayesian network inference. However, only four indicators are used to express the adaptability, which does not fully reflect the adaptability of the studied system, leaving accuracy in need of improvement [31].
This paper quantifies resilience into resistibility, recoverability, and adaptability. Compared with the resilience quantification methods proposed in the above literature, our division method is more conducive to intuitive understanding with the coordinate axes of infrastructure system performance and time, as shown in Figure 1.
In regions with a high seismic risk, enhancing the resilience and adaptability of infrastructure systems is crucial. The period between the recovery of an infrastructure system from a previous earthquake to that of a subsequent earthquake should be properly utilized. Infrastructure managers should make the most of this time to enhance the adaptability of infrastructure systems, learn from seismic disasters, and improve and alter current resources, organizational structure, and division of work in order to be better prepared for the next earthquake. Nevertheless, few studies exist on this matter.
It has become typical for research to examine the seismic resilience of infrastructure systems in earthquake catastrophes in order to employ more resilient infrastructure systems to deal with the increasing frequency of earthquake disasters. Quantitative research on the resilience of infrastructure systems in the existing literature emphasizes two priorities. One emphasis investigates resilient infrastructure systems with a view to reducing the damage rate in order to maintain a certain minimum service level when earthquakes occur. The other is to study the recovery ability rate or ways in which infrastructure systems could quickly recover from a disaster. Undoubtedly, research on these two aspects has played a significant role in improving the resilience of infrastructure systems. However, few studies are concerned with how to increase the adaptability of infrastructure systems, how to learn from seismic disasters, or how to enhance and alter resource allocation, organizational structure, and labor distribution to be better prepared for the next earthquake. In earthquake-prone regions, it is crucial to increase the resilience of infrastructure systems. Two significant weaknesses in existing research need to be addressed, and addressed urgently:
- Lack of research on infrastructure adaptability as a critical feature of resilience.
- Lack of understanding on how to quantify adaptability and account for interdependencies between different infrastructure systems and factors, as may be provided by a Bayesian network BN analysis.
In order to solve the above two problems, the aim of this study is to construct a Bayesian network-based infrastructure system adaptability model to solve the complex relationship between different types of influencing factors and interdependent infrastructure systems.
This paper makes the following contributions:
- Classifying the underlying factors of interdependent networks with respect to the concept of adaptability.
- Developing a new conceptual BN framework for interdependent networks.
- Using different types of inferences to provide a better insight regarding the result of the BN model.
2. Background
2.1. Background of Bayes Theorem
Bayes’ theorem, proposed by Thomas Bayes, provides the foundation for the Bayesian Network. The Bayesian method has been widely improved on in terms of robustness since its first appearance [33]. According to Bayes’ theorem, the following formula can be used to compute the conditional probability:
where, = probability of given that already occurred; = probability of and both would occur; = initial probability of .
According to Equation (3), we can state the multiplication theorem of probability:
By extending the multiplication theorem (4) of probability to the occasion of events, if , then we have
Equation (5) decomposes the joint probability of n events into the product of many conditional probabilities, which is the basis for solving the Bayesian network. Formula (6) is also referred to as the chain rule of the joint probability distribution.
2.2. Background of Bayesian Network
The Bayesian network is also called the credibility network or belief network. If three events can achieve , then and are independent, with conditionally. Furthermore, there is
Conditional independence is the basis of the Bayesian network, and its strength is that it can effectively solve the ‘N-hard problem’ brought on by an increase in variables. Bayesian networks are mainly composed of network structures and network parameters. The network structure is a directed acyclic graph. The nodes in the network represent random variables, while the directed edges between nodes reflect the dependencies between variables.
The arrow points to the child node, and the tail of the arrow is the parent node. The structure of a Bayesian network contains the following categories of nodes:
Parent nodes: parent nodes are without root nodes.
Intermediate nodes: intermediate nodes are nodes with parent and child nodes.
Child nodes: child nodes are without leaf nodes.
Network parameters are conditional probabilities between nodes, which are the quantification of causal relationships between nodes and expressions of local dependencies. Each state of a node has a probability function, and conditional probabilities are used to show associations between variables.
Given its parent node, each node in the Bayesian network is conditionally independent of its nondescendant nodes. Thus, the joint probability distribution of the Bayesian network can be expressed as follows:
In formula (7), represents the set of all parent nodes of node .
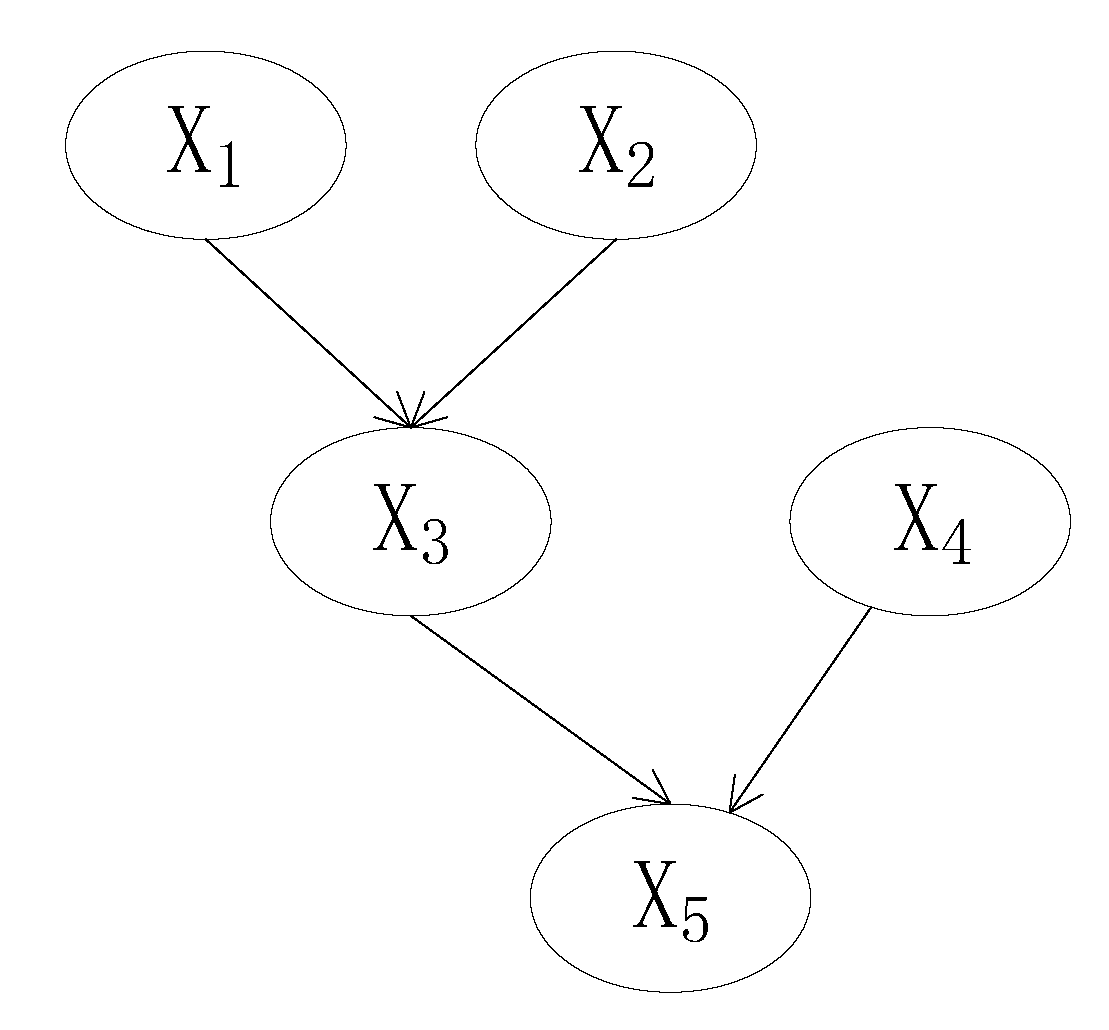
The following is a simplified example demonstrating the Bayesian network:
The example Bayesian network, shown in Figure 2, is composed of five nodes: and are the parent nodes, is an intermediate node, and is the child node. Meanwhile, are the parent node of , while are the parent node of .
Applying Equation (7), we can express the above as follows:
The joint probability can be split into the product of prior probability and conditional probability using Bayesian networks to reduce the difficulty in finding a solution. The prior probability and conditional probability of each node come from expert knowledge in combination with existing literature. The specific details will be discussed in the Section 4 of this paper.
2.3. The Methodology
The method undertaken can be divided into the following steps:
- Undergo adaptability modeling: the adaptability key variables and link of the BN are acquired from expert knowledge and published studies.
- Determine the parameters of Bayesian networks: the unconditional probability of the root node, the conditional probability of intermediate nodes and leaf nodes all derive from historical data, published literature and expert judgment.
- Conduct an inference: calculate the adaptability of the infrastructure system in the target area by way of forward reasoning of the Bayesian network model in order to identify important influencing factors of the adaptability through the unique backward reasoning of the Bayesian network. This is done so as to propose targeted adaptability improvement measures.
3. Adaptability Modeling Using Bayesian Networks
3.1. Variables Selection
Based on a review and collation of existing literature, 19 key factors were identified that affect the adaptability of infrastructure systems. In the process of identifying factors, factors were discarded that were not relevant to this study or which had a high degree of similarity with other factors. The factor of ‘ground motion’ (vibration of soil near the surface caused by seismic waves released by a seismic source), for example, is referred to in some papers [34,35,36], but the term is synonymous with ‘seismic intensity,’ which is the technical term recognized by the academic community.
In accordance with the identification, grouping, and linking of factors, the following actions were taken to complete this portion of the study:
- Step 1: Identify the factor. Identify a list of key factors affecting the adaptability of infrastructure systems from the existing literature.
- Step 2: Cluster the factor. The identified 19 key factors affecting the adaptability of infrastructure systems were divided into five categories.
- Step 3: Construct a Bayesian network structure. Apply the parent-child structure and causal relationship to construct the Bayesian network structure.
When constructing the Bayesian network structure, consideration should be made in regard to dividing the state of each factor and corresponding performance measure in order to prepare for the construction of a complete Bayesian network adaptability evaluation model. Each factor is then divided into two to four states according to expert knowledge and extant literature. The state low represents negative outcome on adaptive capacity, and the state high represents positive outcome. The factor’s state and corresponding indicator performances are listed in Table 1, Table 2, Table 3, Table 4 and Table 5.
3.2. Variables Connectivity
In order to build a Bayesian network for adaptability, it is necessary to establish a conceptual link between factors. This must be done while considering the interaction between factors and their impact on adaptability.
Factors are clustered into five categories according to the following principles:
- Factors associated with seismic events are clustered to determine response capabilities matched to magnitude of earthquake damage.
- The basic elements and operational specifications required to maintain the normal service of the infrastructure system are clustered, which support daily supply services and provide technical support in the event of an earthquake.
- Policy and mechanism factors are clustered and conduct coordinated drills between systems to ensure effective integration of resources from all parties for rapid recovery when the next earthquake occurs.
- Factors related to economic reserves are clustered for possible economic support.
- The potential support factors of stakeholders in the assessed area are clustered to determine the degree of cooperation of stakeholders when the next earthquake occurs.
The graphical representation of the proposed adaptability assessment model is shown in Figure 3. The target node (adaptive capacity) is marked in red and has five parent nodes, which are marked in green. These are namely earthquake intensity, technology, organization, economic and social. Apart from earthquake intensity, the remaining four parent nodes, technology, organization, economic and social, come from the previous factor clustering. Putting these factors into the model comprehensively classifies the influencing factors on the adaptability of the infrastructure system. It also reduces the computational complexity of the BN. The corresponding state and conditional probability table of these four nodes is given in Section 4.
3.2.1. Earthquake Intensity
Earthquake intensity is the most intuitive and widely employed gauge for determining the severity of earthquake damage. Its effect is dependent on both epicentral distance and magnitude. In general, the intensity of an earthquake and the amount of damage are proportional to the magnitude and distance from the epicenter. In the model, earthquake intensity has two parent nodes, epicentral distance and earthquake magnitude.
The epicentral distance has three states: close, far and very far. The earthquake magnitude has four states: strong, major, severe and violent. The earthquake intensity has three states: dangerous, severe and violent. Each state and the corresponding performance measure are shown in Table 1. The unconditional probability of epicentral distance and earthquake magnitude as the root node and the conditional probability of earthquake intensity as the intermediate node are presented together in Section 4.
3.2.2. Technology
Technology plays a vital role in the disaster preparedness stage. Effective technology can help infrastructure systems reduce cascading failures during earthquake disasters, reduce loss rates, and quickly restore service capabilities in the post-earthquake period, while ensuring people’s normal activities can be conducted.
Technology has five parent nodes, namely: normative operation, professional, maintenance routine, advanced technology and earthquake history. See Table 2 for the specific status and the corresponding performance measure.
Normative operation refers to the proportion of operations according to the manual [5]. This indicator is measured by the operation accuracy rate . There are three states. If the operation accuracy rate is less than or equal to 80%, is low; if the operation accuracy rate is greater than 80% and less than or equal to 90%, is medium, if the operation accuracy rate is greater than 90%, is high.
Professional refers to whether the number and ability of existing professional staff match the workload of daily repairs and maintenance [15,16,38,39]. If it matches, the status of the node is yes, otherwise it is no.
Maintenance routine refers to the regular maintenance of equipment and instruments in accordance with operating specifications [40,41]. If these are regularly maintained, the status of the node is yes, otherwise it is no.
Advanced technology means that the technological level of the infrastructure system in the evaluated area must not be lower than the level of the country as a whole; it also must match the appropriate equipment and must not exhibit any technical lag [31]. If it matches, the status of the node is yes, otherwise it is no.
3.2.3. Organization
An organized structure provides the foundation for effectively integrating resources, breaking down communication barriers between stakeholders, and coordinating between infrastructure systems. Organization contains four parent nodes, namely: earthquake history, training drills and rehearsals, contingency mechanisms and leadership. The status of each node and the corresponding performance measure are shown in Table 3. Note that earthquake history is also the parent node of technology and organization. To avoid duplication, it is not reflected in the table.
Earthquake history. Learning and optimizing daily operation and organization and deployment in the history of earthquakes and accumulating experience and countermeasures in the process is a positive and appropriate choice that people can make in the face of earthquake disasters.
Training drills and rehearsals. The practice of routine emergency drills between various infrastructure systems provides assurance for the orderly carrying out of post-earthquake rescue and relief work [17,24,45]. If there is at least one emergency drill in a year, the status of this node is yes, otherwise it is no.
Contingency mechanisms are the key channels for emergency rescue and disaster relief. A smooth contingency mechanism can quickly and efficiently transmit disaster information to relevant departments and corresponding decision-making agencies and provide a strong guarantee for allocating appropriate resources to effectively reduce infrastructure system losses and quickly restore corresponding services [17,24,45]. If there is a matching emergency mechanism or the original emergency mechanism is updated after the last earthquake, the state of the node is yes, otherwise it is no.
Leadership is a key factor for effectively integrating various stakeholders, deploying the work of all parties, and making good use of existing resources to seek social assistance [17,45,46,47]. If there is no obvious error in the daily drills and deployments, the status of the node is yes, otherwise it is no.
3.2.4. Economic Variables
Sufficient economic reserves and multichannel funding sources are important provisions for the orderly operation of relevant mechanisms and the enrichment of required resources. Economic variables have four parent nodes, namely: operation and maintenance funds, government investment decisions, financial reserves and local economic development. The status of each node and the corresponding performance measure are listed in Table 4.
Operation and maintenance funds refer to the funds required to ensure the normal operation of the infrastructure system in ordinary times [23,41,49,50]. Sufficient operation and maintenance funds enable the infrastructure system to provide stable services. Sufficient and stable financial guarantees will demonstrate stronger resistance to earthquake disasters and stronger recovery capabilities in the post-earthquake period. If the operation and maintenance funds can meet the daily operation and maintenance needs, the status of the node is yes, otherwise it is no.
Government investment decisions refers to whether higher-level government has set up special allocations to improve the resilience of the infrastructure system in the assessed area [5,24,51]. If there are government investment decisions, the status of the node is yes, otherwise it is no. Special appropriation from higher-level government is one of the sources of funding for updating the existing infrastructure system and improving its overall robustness.
Financial reserves refer to the financial situation of the local government [23,24,41,49,52,53]. A local government with a fiscal surplus can better organize emergency drills and provide funds for emergency rescue, disaster relief and post-earthquake recovery. The node status corresponding to fiscal surplus, balance and deficit is good, medium and bad, respectively.
Local economic development situation refers to the level of local economic development [52,54]. Regions with rapid economic development can provide abundant funds to support the normal operation of infrastructure systems and are better positioned to obtain more relief supplies and effect faster recovery speeds. It may be lower than, equal to, or higher than the average value of national income in the province, and the corresponding node states are low, medium, and high.
3.2.5. Social
Support and assistance from the social groups is a prerequisite for the normal operation of an infrastructure system. It is also a reliable source of a large number of resources needed for post-earthquake recovery. The social node has two parent nodes, relevant information and public awareness. Public awareness has two parent nodes, social information sharing and the level of residents’ culture. We list these nodes in the Table 5.
There are various means of social information sharing, such as producing short videos and brochures to publicize earthquake-related information, along with forming community study groups and seminars, etc., explaining relevant self-rescue methods and promoting the necessity of actively participating in post-disaster construction and rapid recovery. If similar work has been done, the status of the node is yes, otherwise it is no.
The level of residents’ culture. Generally speaking, the higher the level of education and awareness of residents, the more willing they are to devote themselves to public issues. If the education level of the residents is lower than, equal to or higher than the average level of the province, the status of the node is low, medium, high, respectively.
Public awareness [24,52]. We have assigned three states to public awareness, which, respectively, represent residents’ willingness to participate in emergency rescue and relief work. High is used to express strong willingness; medium is used to express average; and low is used to express unwillingness.
Relevant information indicates the degree of information sharing among stakeholders, which is a powerful manifestation of effective communication between stakeholders and a strong guarantee for optimizing the arrangement of emergency rescue and relief work and shortening the recovery time [24,56]. If the stakeholder communicates sufficiently, the node status is high; if communication is average but not sufficient, the node status is medium; if the stakeholder hardly communicates, the node status is low.
3.3. Interdependent Infrastructure
Rinaldi et al. define the interdependence of two infrastructure systems as a bidirectional relationship between them (a bidirectional relationship), where the state of one infrastructure system is related to the state of another infrastructure system. It divides the interdependence between infrastructure system networks into four types: functional (physical), informational (cyber), geographical, and logical [5]. This understanding has been recognized by many scholars. For example, when analyzing critical infrastructure systems, functional dependence and geographical dependence should be considered together. This joint effect determines the severity of consequences for critical infrastructure systems when they are under external pressure [4]. Since infrastructure systems are highly interrelated, it is crucial to consider their interdependencies in order to analyze the resilience of critical infrastructure systems [14]. The complexity and dynamic interaction of connections between various subsystems and components poses challenges to the optimal service or performance of infrastructure systems and may cause substantial economic losses [31].
On analyzing the current literature, it is clear that the research on the interaction between infrastructure systems falls approximately into two categories. First, there is a high likelihood of interdependence related disruption occurring propagated via either functional and/or geographical interdependencies, while the poor resistance of the infrastructure system leads to a large-scale outage of services. The second is to analyze the functional and geographical relationship between infrastructure systems in the post-earthquake recovery stage in order to explore recovery priorities, formulate recovery strategies, shorten the recovery time, and return services to normal as soon as possible. In our research, the relationship between infrastructure systems is introduced into the resistance and recovery capabilities, and on this basis, system simulation is applied and the simulation results are corrected in combination with historical data. However, in the context of the topic of adaptability discussed in this paper, infrastructure systems can be considered to cooperate well when there are no outages of service in daily operations. For this reason, in this study, when evaluating the adaptability of infrastructure systems, orderly emergency drills, planned exchanges, and effective operation between infrastructure systems are taken as the foundation of good infrastructure systems.
4. Conditional Probabilities
Another component of the Bayesian network is the structural parameter, which is the conditional probability between nodes, the quantification of the causal relationship between nodes, and the expression of local dependence [30].
4.1. Unconditional Probabilities
In the Bayesian network structure, there are 17 root nodes, 6 intermediate nodes and 1 leaf node. For the 17 root nodes, we uniformly use the Unconditional Probability Table and assume that the probability of each state of the root node is the same. That is, if the node has states, the probability of each state is . One of the advantages of the Bayesian network is that as the evidence is updated, the probability is updated, with the result that more accurate prediction results are obtained due to the new evidence. Economic variables are offered as an example to demonstrate the unconditional probability, as shown in Table 6.
4.2. Conditional Probabilities
A conditional probability table is used to represent six intermediate nodes and one leaf node. In addition to the earthquake intensity and public awareness described above, the rest of the intermediate nodes, technology, organization, economic and social, and leaf node adaptive capacity are each assigned three states, namely low, medium, and high.
By assigning values to each state of the parent node, it is possible to calculate the global relative value of the child node under each conditional state combination and combine the membership function to obtain the conditional probability table of the child node [24].
In the equation, is the global relative value of child nodes, is the number of parent nodes, is the value of the parent node, is the maximum value that parent node can take.
We also take economic variables as an example to generate the conditional probability table. Using the method given above, we calculate a total of 108 (2 × 2 × 3 × 3 × 3) conditional probabilities related to economic variables, shown listed in Table 7.
5. Case Study and Inference
Gongxian County is located to the south of Yibin City, Sichuan Province, China, between 104°38′–105°02′ E, 27°53′–28°31′ N, with an area of 1149.5 . Gongxian County is an earthquake-prone area. According to statistics, from 16 April 2012 to 20 September 2022, there were 124 earthquakes in Gongxian County, including 12 earthquakes above magnitude 4, of which 4 earthquakes were above magnitude 5. The latest earthquake above magnitude 5 occurred on 4 July 2019, with a magnitude of 5.6. It is important to understand the seismic resilience of this region. Good adaptability can help such earthquake-prone regions reduce the level of service loss rate of infrastructure systems as a result of earthquakes while quickly restoring production activities. The adaptability assessment of Gongxian County in a post-earthquake period is hereby taken as a case study to verify the applicability of the Bayesian network constructed in this paper.
The relevant parameters and data of the adaptability assessment model come from field surveys, expert interviews, and historical data review. This study provides suggestions for improving the adaptability of infrastructure systems by assessing the adaptability of resilience and by identifying sensitive factors for improving that capacity.
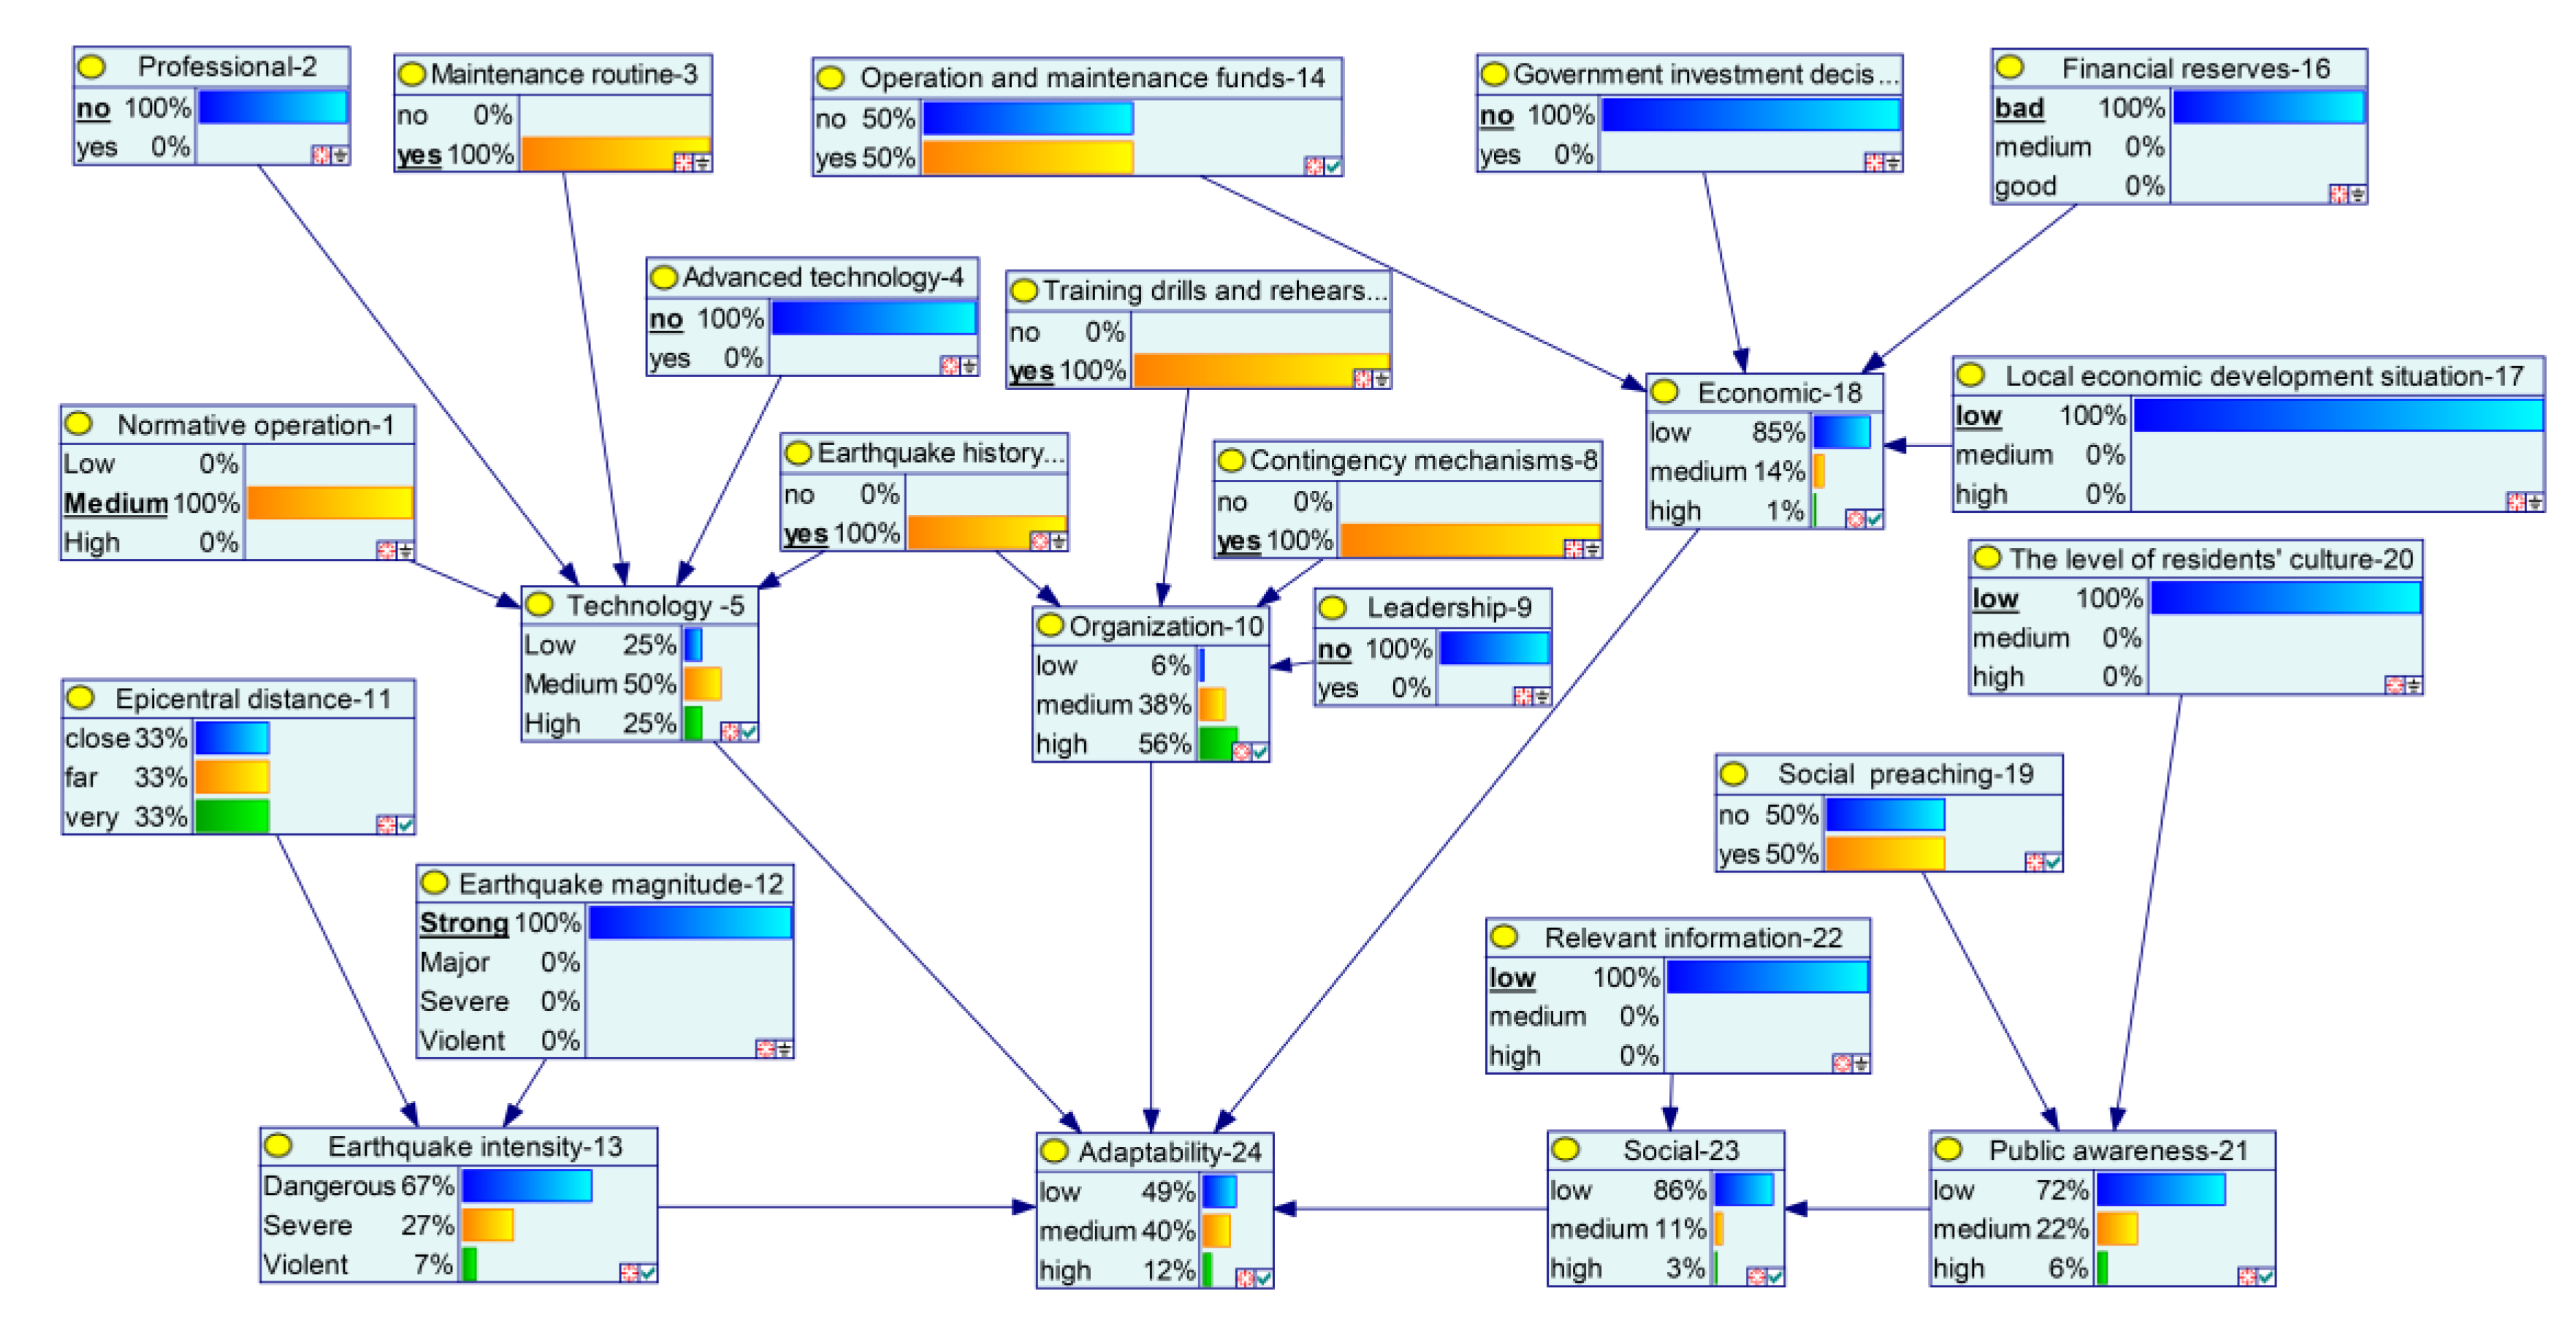
GeNIe software [57] is used to input and visualize the Bayesian network structure and the 1146 conditional probability values, etc. The calculation results are shown in Figure 4.
The final output of adaptability presents a range of uncertainty (12% high, 40% medium and 49% low. Note also that sum is 101 instead of 100, as the values have been rounded to the nearest whole number). The calculation results show that Gongxian County has the highest probability of low adaptability at 49%. The Bayesian network can apply forward propagation analysis, as discussed above, and make probabilistic inferences about possible results under given survey results and scenarios. It can also apply backward propagation under a certain fixed result to identify the pathway to that result. The backward propagation approach is more helpful in improving the adaptability of the infrastructure system.
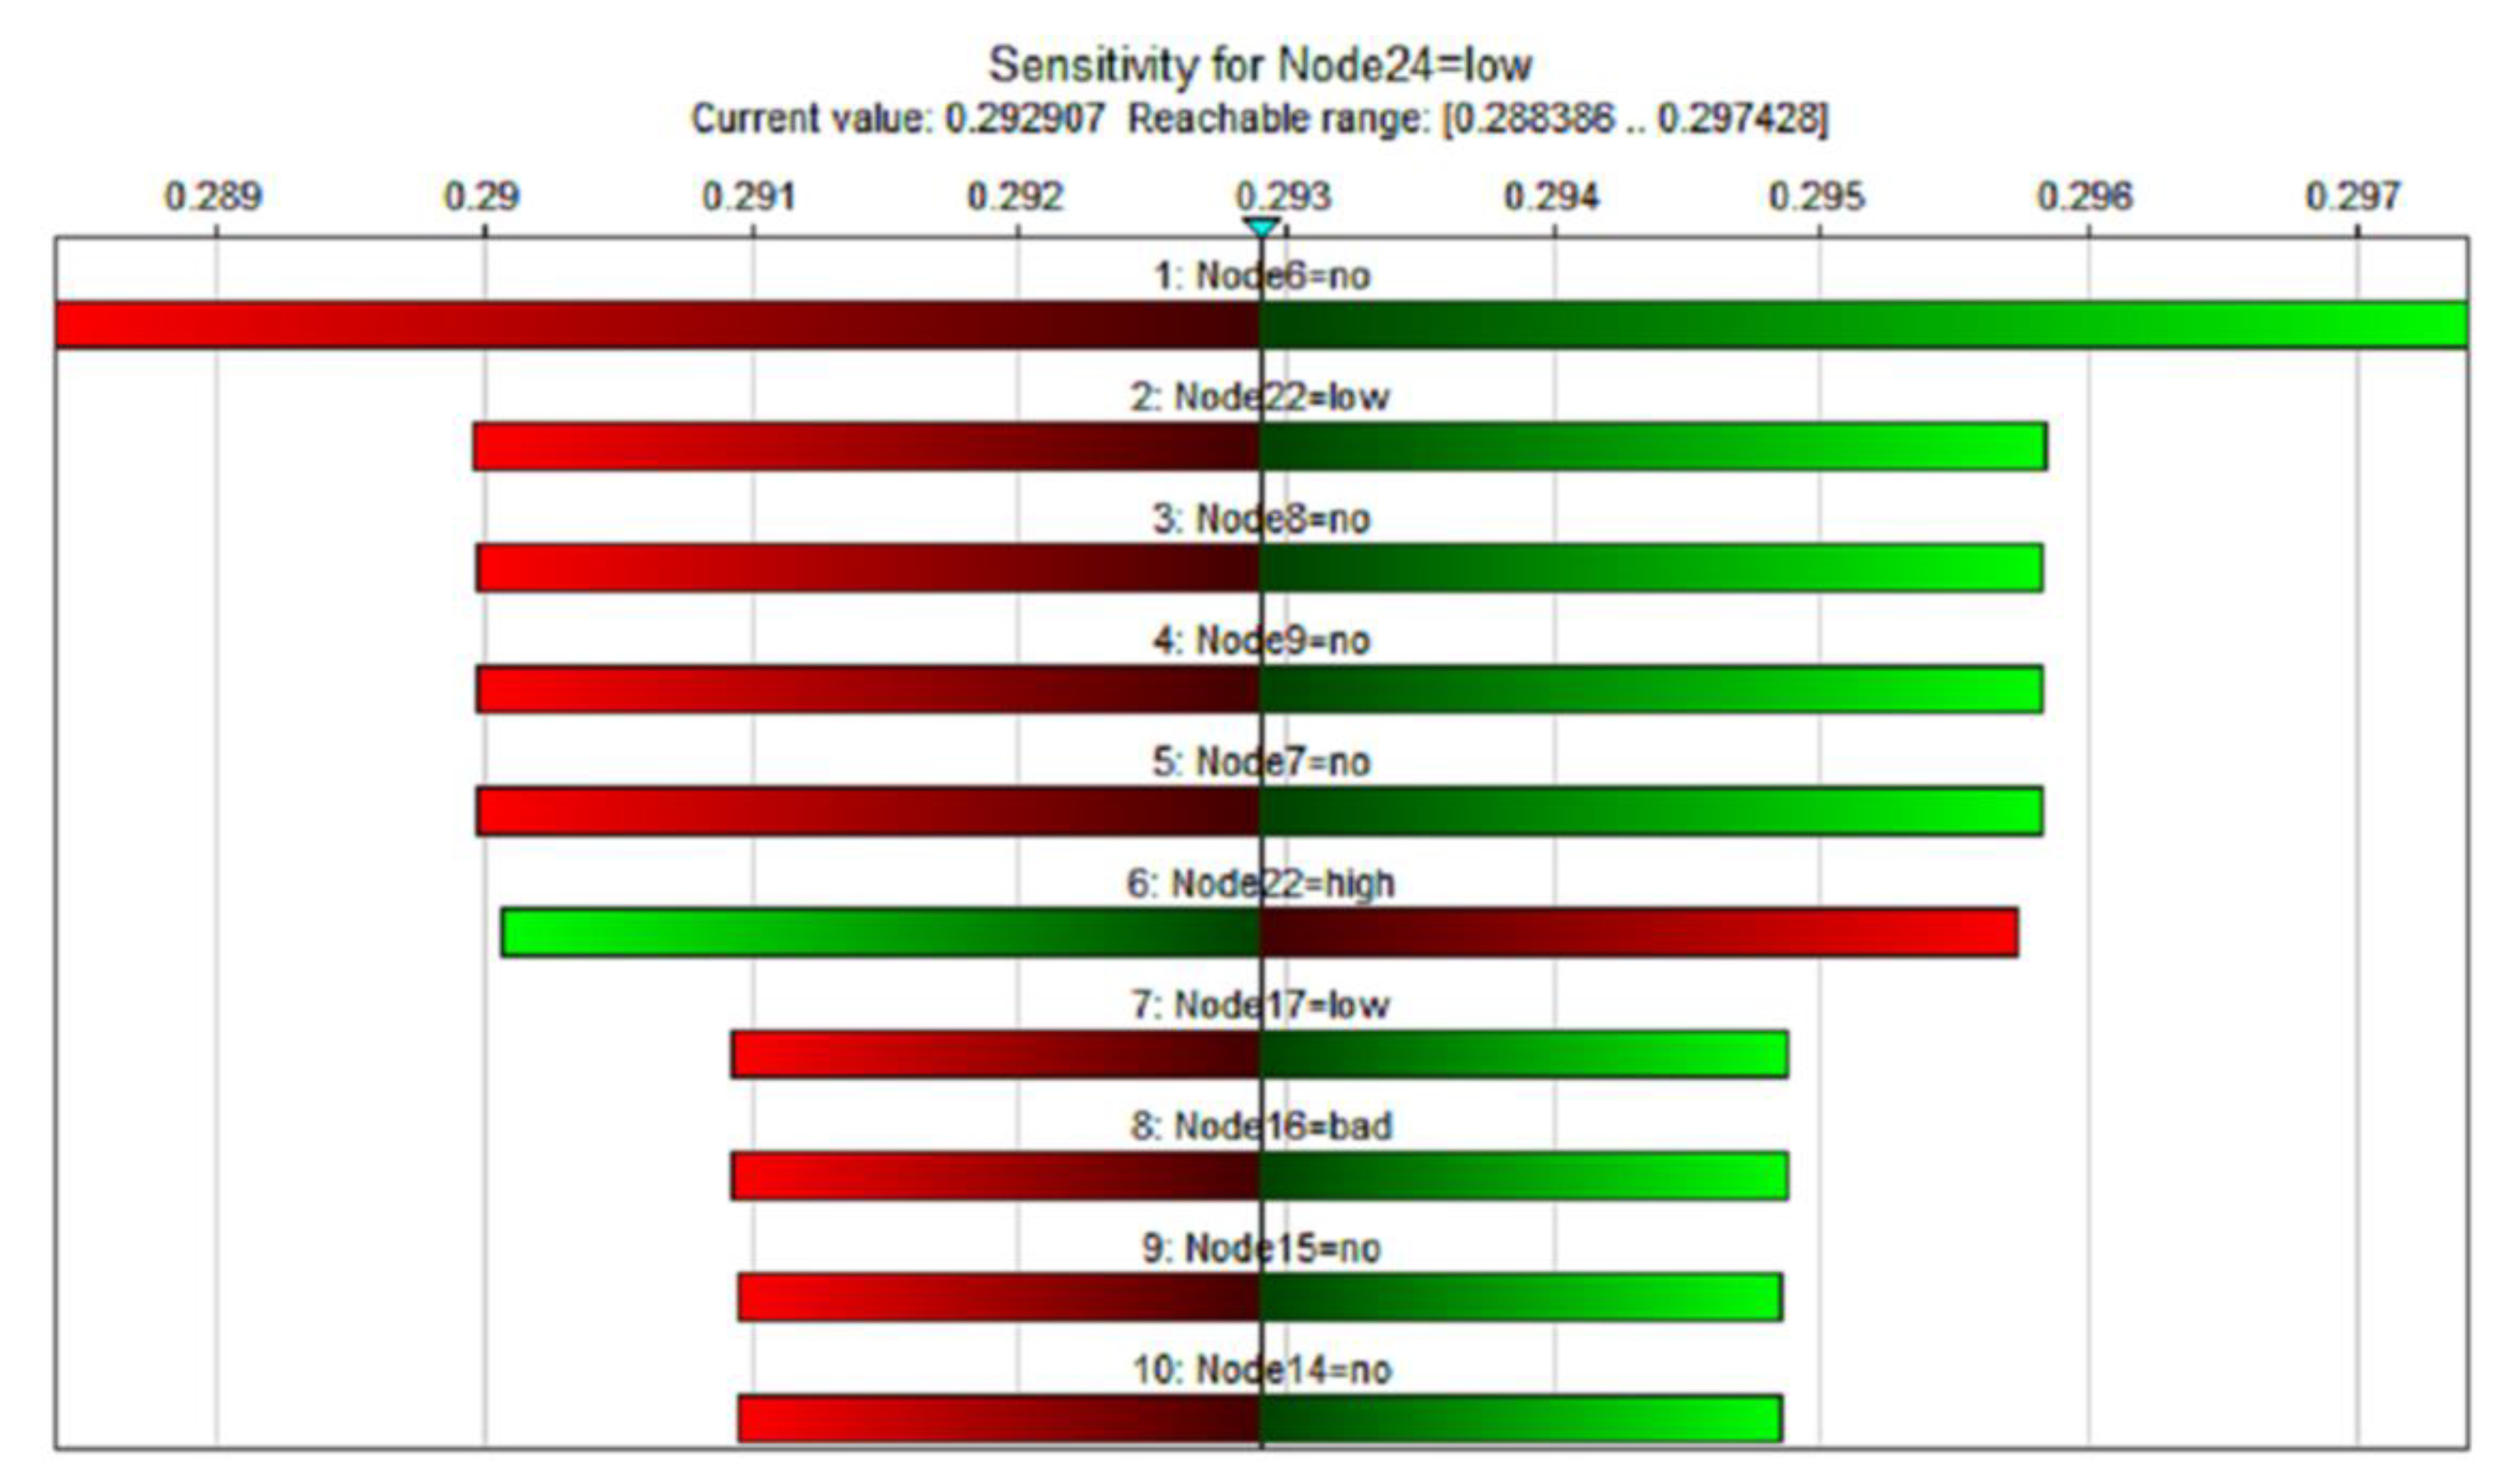
Of the three states of adaptive capacity, we are most concerned about the sensitivity of infrastructure systems in the low state, so we only perform backward propagation analysis for the low state. The color of the bar, as shown in the analysis in Figure 5, indicates the change in direction of the target state; red indicates negative change, and green indicates positive change. The top ten factors and states, critical influencing factors and their impact on adaptability, are clearly displayed. By analyzing the critical influencing factors of the adaptability target node in the target state, in the low state, the top three critical influencing factors are earthquake history (no), relevant information (low), and contingency mechanisms (no).
In order to further explore the quantitative impact of critical influencing factors on adaptability, we designed five different scenarios based on the current level and compared the changes in adaptability under the five scenarios, as shown in Table 8. In the first four scenarios, only one critical influencing factor is adjusted at a time, and in the fifth scenario, three critical influencing factors are changed simultaneously in order to reduce adaptability.
Scenario 1 adjusts the status of earthquake history from yes to no, and the status of low for adaptability increases from 49% to 63%. That is, the possibility of adaptability being low increases by 14%. Scenario 2 adjusts the status of relevant information from low to medium, and the status of low for adaptability is reduced from 49% to 42%. That is, the possibility of adaptability being low is reduced by 7%. Scenario 3 adjusts the state of relevant information from low to high, and the state of low for adaptability is reduced from 49% to 35%. That is, the possibility of adaptability being low is reduced by 14%. Scenario 4 adjusts the state of contingency mechanisms from yes to no, and the state of low for adaptability increases from 49% to 59%. That is, the possibility of adaptability being low increases by 10%. Scenario 5 adjusts the three most sensitive factors to a state that is most unfavorable to adaptability, with earthquake history at no, the relevant information at low, and contingency mechanisms at no. In this state, the low state of adaptability has increased from 49% to 75%. That is, the possibility of adaptability being low has increased by 26%.
Finally, we compare Scenario 3 and Scenario 5, which are the changes in adaptability of the three most sensitive factors between the most favorable and the most unfavorable states. The low state of adaptability is 35% and 75%, with a difference of 40%. The high state of adaptability is 20% and 4%, with a difference of 16%. The acceptable state of adaptability is high and medium. The sum of the probabilities is 65% and 25%, respectively, with a difference of 40%.
The above analysis numerically gives the degree of influence of earthquake history, relevant information and contingency mechanisms on adaptability in different states. However, applying the model to find out the key influencing factors is only the preliminary work of improving the adaptability. Our goal is to refine the improvement measures through the key influencing factors found so as to effectively improve the adaptability of the infrastructure system.
Among the three key influencing factors found, earthquake history depends on the objective fact of whether there have been earthquakes in the area. It is not a specific object of adaptability improvement measures, but it essentially represents whether the infrastructure system has experience in responding to earthquake disasters and, to a certain extent, determines the ability to respond to earthquake disasters.
Relevant information is the second most important factor affecting the adaptability of infrastructure systems. We give the following ideas to improve the degree of information sharing among stakeholders. When the infrastructure system is newly built or expanded, it is necessary to fully investigate the needs of stakeholders, coordinate the opinions of the personnel of each subsystem, integrate the existing antiseismic experience, effectively use the advantages of the terrain, coordinate the planning issues between individual infrastructure systems, and improve the infrastructure system. For the existing infrastructure system, it is recommended to set up an infrastructure system management committee or a special department of the local government. The committee or functional department organizes the necessary information sharing on important nodes and forms documents to increase the information exchange between individual infrastructure systems. At the same time, it also provides support for the management of possible earthquake disasters.
Contingency mechanisms are the third factor affecting the adaptability of infrastructure systems. Different countries and regions have different contingency mechanisms for different earthquake levels. It is recommended that when formulating contingency mechanisms, not only should corresponding coordinating departments be set up for different levels of earthquakes, but also for specific individuals in the emergency plan of the last administrative region. It is necessary to have a clear feedback path and emergency plan to effectively implement the emergency mechanism.
Regarding the specific improvement measures for relevant information and contingency mechanisms, due to the large differences in the ownership and management methods of infrastructure in different countries, this article only gives ideas, and the specific implementation should be appropriate in combination with different countries and earthquake levels.
6. Conclusions
Infrastructure system resilience is quantified by the comprehensive performance of the three factors of resistibility, recoverability, and adaptability. Responding to the weak status of extant resilience research on adaptability in infrastructure systems, this study explores adaptability of resilience in response to seismic disasters. The main factors affecting infrastructure systems are identified and parsed into five groups. A Bayesian network structure is constructed by applying expert knowledge, after which Bayesian network parameters are created by applying a method of global relative value and membership function. Finally, the feasibility of the constructed Bayesian network is verified by examining the specific performance of infrastructure in an earthquake-prone area in China. Sensitivity analysis is carried out to extract features for improving the adaptability of the infrastructure system in the post-earthquake recovery period in order to improve infrastructure resilience under conditions of subsequent earthquake disasters.
On the basis of the collation of existing literature, this paper clusters and refines the influence mechanism of each influencing factor on adaptability and further sorts the influence degree of factors on adaptability through the Bayesian network. The research has deepened the application of Bayesian networks in resilience research, identified key factors affecting adaptability, given specific ideas and suggestions for improving adaptability for the top three influencing factors, and contributed to improving the resilience of infrastructure systems.
Future research is anticipated to explore the relationship between earthquake resistibility, recoverability, and adaptability of infrastructure systems. Since there is a complex relationship between the three capacities, the simple method of adding the three together insufficiently describes the capability for resilience. This next step will pursue two aspects: one is to build a resilient Bayesian network based on the three major capabilities, fully discuss the relationship between the three major capabilities, and further improve the earthquake resilience of infrastructure systems; the other is to refine the interdependence between infrastructure systems, emphasizing the impact of functional and geographical dependencies between infrastructure systems on earthquake resilience.
Finally, the Bayesian network can be used to find out the key influencing factors and provide resilience improvement measures according to the characteristics of specific countries and infrastructure systems. Combined with heat maps or Bayesian neural networks [58], the changes in resilience before and after the implementation of corresponding measures can be visualized to intuitively reflect the effectiveness of the measures.
Author Contributions
Conceptualization, H.T. and C.C.; methodology, H.T.; software, H.T.; validation, H.T. and Q.Z.; formal analysis, H.T. and Q.Z.; investigation, H.T.; resources, H.T. and C.C.; data curation, H.T. and Q.Z.; writing—original draft preparation, H.T. and Q.Z.; writing—review and editing, H.T. and I.M.; visualization, H.T. and Q.Z; supervision, C.C.; project administration, C.C.; funding acquisition, C.C. All authors have read and agreed to the published version of the manuscript.
Funding
This research was funded by [National Natural Science Foundation of China] grant number [71971147].
Data Availability Statement
There is no additional data to share except the information in the article.
Conflicts of Interest
The authors declare no conflict of interest.
References
- EM-DAT. Available online: https://public.emdat.be/data (accessed on 10 April 2022).
- Lin, S.Y.; El-Tawil, S. Time-dependent resilience assessment of seismic damage and restoration of interdependent lifeline systems. J. Infrastruct. Syst. 2020, 26, 04019040. [Google Scholar] [CrossRef]
- Ellis, J.; Fisher, D.; Longstaff, T.; Pesante, L.; Pethia, R. Report to the President’s Commission on Critical Infrastructure Protection; Carnegie-Mellon Univ Pittsburgh PA Software Engineering Inst.: Pittsburgh, PA, USA, 1997. [Google Scholar]
- Hokstad, P.; Utne, I.; Vatn, J. Vulnerability Analyses of Interdependent Technical Infrastructures. In Risk and Interdependencies in Critical Infrastructures; Springer Series in Reliability Engineering; Springer: Berlin/Heidelberg, Germany, 2012; Chapter 6; pp. 67–94. [Google Scholar] [CrossRef]
- Rinaldi, S.M.; Peerenboom, J.P.; Kelly, T.K. Identifying, understanding, and analyzing critical infrastructure interdependencies. IEEE Control. Syst. Mag. 2001, 21, 11–25. [Google Scholar] [CrossRef]
- Graham, S. Constructing premium network spaces: Reflections on infrastructure networks and contemporary urban development. Int. J. Urban Reg. Res. 2000, 24, 183–200. [Google Scholar] [CrossRef]
- Saidi, S.; Kattan, L.; Jayasinghe, P.; Hettiaratchi, P.; Taron, J. Integrated infrastructure systems—A review. Sustain. Cities Soc. 2018, 36, 1–11. [Google Scholar] [CrossRef]
- Buldyrev, S.V.; Parshani, R.; Paul, G.; Stanley, H.E.; Havlin, S. Catastrophic cascade of failures in interdependent networks. Nature 2010, 464, 1025–1028. [Google Scholar] [CrossRef] [PubMed]
- Eusgeld, I.; Nan, C.; Dietz, S. “System-of-systems” approach for interdependent critical infrastructures. Reliab. Eng. Syst. Saf. 2011, 96, 679–686. [Google Scholar] [CrossRef]
- Little, R.G. Controlling Cascading Failure: Understanding the Vulnerabilities of Interconnected Infrastructures. J. Urban Technol. 2002, 9, 109–123. [Google Scholar] [CrossRef]
- Franchin, P.; Cavalieri, F. Probabilistic Assessment of Civil Infrastructure Resilience to Earthquakes. Comput. Civ. Infrastruct. Eng. 2014, 30, 583–600. [Google Scholar] [CrossRef]
- Bruneau, M.; Chang, S.E.; Eguchi, R.T.; Lee, G.C.; O’Rourke, T.D.; Reinhorn, A.M.; Shinozuka, M.; Tierney, K.; Wallace, W.A.; Von Winterfeldt, D. A Framework to Quantitatively Assess and Enhance the Seismic Resilience of Communities. Earthq. Spectra 2003, 19, 733–752. [Google Scholar] [CrossRef] [Green Version]
- Johansen, C.; Horney, J.; Tien, I. Metrics for Evaluating and Improving Community Resilience. J. Infrastruct. Syst. 2017, 23, 04016032. [Google Scholar] [CrossRef]
- Ouyang, M.; Wang, Z. Resilience assessment of interdependent infrastructure systems: With a focus on joint restoration modeling and analysis. Reliab. Eng. Syst. Saf. 2015, 141, 74–82. [Google Scholar] [CrossRef]
- Zhou, W.; Kalonji, G.; Chen, C.; Zheng, H.; Martek, I. A three-staged framework for measuring water supply resilience in rural China based on PLS-SEM. Sci. Rep. 2022, 12, 1–15. [Google Scholar] [CrossRef]
- Webster, J.; Smith, J.; Smith, T.; Okello, F. Water Safety Plans in Disaster Management: Appropriate Risk Management of Water, Sanitation and Hygiene in the Context of Rural and Peri-Urban Communities in Low-Income Countries. In Risk Management of Water Supply and Sanitation Systems; Springer: Berlin/Heidelberg, Germany, 2009; pp. 145–152. [Google Scholar] [CrossRef]
- Sweya, L.N.; Wilkinson, S.; Kassenga, G.; Mayunga, J. Developing a tool to measure the organizational resilience of Tanzania’s water supply systems. Glob. Bus. Organ. Excell. 2020, 39, 6–19. [Google Scholar] [CrossRef]
- Ryu, J.; Park, H. Resilience assessment for interdependent water supply systems based on a system dynamics model. WIT Trans. Ecol. Environ. 2018, 215, 241–245. [Google Scholar] [CrossRef]
- Farahmandfar, Z.; Piratla, K.R.; Andrus, R.D. Resilience Evaluation of Water Supply Networks against Seismic Hazards. J. Pipeline Syst. Eng. Pract. 2017, 8, 04016014. [Google Scholar] [CrossRef]
- Ouyang, M.; Duenas-Osorio, L. Multi-dimensional hurricane resilience assessment of electric power systems. Struct. Saf. 2014, 48, 15–24. [Google Scholar] [CrossRef]
- De Iuliis, M.; Kammouh, O.; Cimellaro, G.P.; Tesfamariam, S. Quantifying restoration time of power and telecommunication lifelines after earthquakes using Bayesian belief network model. Reliab. Eng. Syst. Saf. 2021, 208, 107320. [Google Scholar] [CrossRef]
- Chang, S.E.; Shinozuka, M. Measuring Improvements in the Disaster Resilience of Communities. Earthq. Spectra 2004, 20, 739–755. [Google Scholar] [CrossRef]
- Ouyang, M.; Duenas-Osorio, L. Time-dependent resilience assessment and improvement of urban infrastructure systems. Chaos Interdiscip. J. Nonlinear Sci. 2012, 22, 033122. [Google Scholar] [CrossRef]
- Kammouh, O.; Gardoni, P.; Cimellaro, G.P. Probabilistic framework to evaluate the resilience of engineering systems using Bayesian and dynamic Bayesian networks. Reliab. Eng. Syst. Saf. 2020, 198, 106813. [Google Scholar] [CrossRef]
- Beckford, J. An Overview of Systemic Interdependencies of the UK National Infrastructure; Beckford Consulting: Berkshire, UK, Draft (Unpublished); Available online: http://beckfordconsulting.com/wp-content/uploads/2008/10/Modernising-National-Infrastructure-Draft-2009.pdf (accessed on 23 January 2023).
- Cheng, Y.; Elsayed, E.A.; Huang, Z. Systems resilience assessments: A review, framework and metrics. Int. J. Prod. Res. 2021, 60, 595–622. [Google Scholar] [CrossRef]
- Nastov, B.; Kamisoko, D.; Chapurlat, V. An Improved Decision Support Method for Resilience Assessment Based on Multi-Viewpoint Modeling and Functional Analysis of Interconnected Systems. Int. J. Decis. Support Syst. Technol. 2021, 13, 54–70. [Google Scholar] [CrossRef]
- Miles, S.B.; Chang, S.E. Modeling Community Recovery from Earthquakes. Earthq. Spectra 2006, 22, 439–458. [Google Scholar] [CrossRef]
- Cimellaro, G.P.; Reinhorn, A.M.; Bruneau, M. Framework for analytical quantification of disaster resilience. Eng. Struct. 2010, 32, 3639–3649. [Google Scholar] [CrossRef]
- Pirbhulal, S.; Gkioulos, V.; Katsikas, S. Towards Integration of Security and Safety Measures for Critical Infrastructures Based on Bayesian Networks and Graph Theory: A Systematic Literature Review. Signals 2021, 2, 771–802. [Google Scholar] [CrossRef]
- Hossain, N.U.I.; Jaradat, R.; Hosseini, S.; Marufuzzaman, M.; Buchanan, R.K. A framework for modeling and assessing system resilience using a Bayesian network: A case study of an interdependent electrical infrastructure system. Int. J. Crit. Infrastruct. Prot. 2019, 25, 62–83. [Google Scholar] [CrossRef]
- Johansen, C.; Tien, I. Probabilistic multi-scale modeling of interdependencies between critical infrastructure systems for resilience. Sustain. Resilient Infrastruct. 2017, 3, 1–15. [Google Scholar] [CrossRef]
- Koop, G.; Leongonzalez, R.; Strachan, R. Bayesian inference in a cointegrating panel data model. In Bayesian Econometrics; Emerald Group Publishing Limited: Bingley, UK, 2008; pp. 433–469. [Google Scholar] [CrossRef] [Green Version]
- Bensi, M.T.; Der Kiureghian, A.; Straub, D. A Bayesian Network Framework for Post-Earthquake Infrastructure System Performance Assessment. In Proceedings of the TCLEE 2009: Lifeline Earthquake Engineering in a Multihazard Environment, Oakland, CA, USA, 28 June–1 July 2009; pp. 1–12. [Google Scholar] [CrossRef]
- Kameshwar, S.; Cox, D.T.; Barbosa, A.R.; Farokhnia, K.; Park, H.; Alam, M.S.; van de Lindt, J.W. Probabilistic decision-support framework for community resilience: Incorporating multi-hazards, infrastructure interdependencies, and resilience goals in a Bayesian network. Reliab. Eng. Syst. Saf. 2019, 191, 106568. [Google Scholar] [CrossRef]
- Cimellaro, G.P.; Noori, A.Z.; Kammouh, O.; Terzic, V.; Mahin, S.A. Resilience of critical structures, infrastructures and communities. arXiv Prepr. 2022, arXiv:2202.09567. [Google Scholar]
- CEA. 2020-07-The Chinese Seismic Intensity Scale. Edited by China Earthquake Administration. Available online: http://c.gb688.cn/bzgk/gb/showGb?type=online&hcno=6FD8F9071FAC980D5B2A636A9EA79DE9 (accessed on 18 April 2022).
- Zhu, J.; Manandhar, B.; Truong, J.; Ganapati, N.E.; Pradhananga, N.; Davidson, R.A.; Mostafavi, A. Assessment of infrastructure resilience in the 2015 Gorkha, Nepal, earthquake. Earthq. Spectra 2017, 33 (Suppl. 1), 147–165. [Google Scholar] [CrossRef]
- Dickson, S.E.; Schuster-Wallace, C.J.; Newton, J.J. Water Security Assessment Indicators: The Rural Context. Water Resour. Manag. 2016, 30, 1567–1604. [Google Scholar] [CrossRef]
- Croope, S.V. Managing Critical Civil Infrastructure Systems: Improving Resilience to Disasters. Ph.D. Thesis, University of Delaware, Newark, DE, USA, 2010. [Google Scholar]
- Karakoc, D.B.; Almoghathawi, Y.; Barker, K.; González, A.D.; Mohebbi, S. Community resilience-driven restoration model for interdependent infrastructure networks. Int. J. Disaster Risk Reduct. 2019, 38, 101228. [Google Scholar] [CrossRef]
- Mostafavi, A.; Ganapati, N.E.; Nazarnia, H.; Pradhananga, N.; Khanal, R. Adaptive Capacity under Chronic Stressors: Assessment of Water Infrastructure Resilience in 2015 Nepalese Earthquake Using a System Approach. Nat. Hazards Rev. 2018, 19, 05017006. [Google Scholar] [CrossRef]
- Zhao, X.; Cai, H.; Chen, Z.; Gong, H.; Feng, Q. Assessing urban lifeline systems immediately after seismic disaster based on emergency resilience. Struct. Infrastruct. Eng. 2016, 12, 1634–1649. [Google Scholar] [CrossRef]
- Zhang, X.; Tang, W.; Huang, Y.; Zhang, Q.; Duffield, C.F.; Li, J.; Wang, E. Understanding the causes of vulnerabilities for enhancing social-physical resilience: Lessons from the Wenchuan earthquake. Environ. Hazards 2018, 17, 292–309. [Google Scholar] [CrossRef]
- Lee, A.V.; Vargo, J.; Seville, E. Developing a tool to measure and compare organizations’ resilience. Nat. Hazards Rev. 2013, 14, 29–41. [Google Scholar] [CrossRef]
- Dezhi, L.; Jie, W.; Peng, C. Evaluation index system of disaster resilience of urban community composite ecosystem. Const. Econ. 2018, 39, 92–96. [Google Scholar]
- Cutter, S.L.; Burton, C.G.; Emrich, C.T. Disaster Resilience Indicators for Benchmarking Baseline Conditions. J. Homel. Secur. Emerg. Manag. 2010, 7. [Google Scholar] [CrossRef]
- Balaei, B.; Wilkinson, S.; Potangaroa, R.; Hassani, N.; Alavi-Shoshtari, M. Developing a Framework for Measuring Water Supply Resilience. Nat. Hazards Rev. 2018, 19, 04018013. [Google Scholar] [CrossRef]
- Liu, X.; Fang, Y.-P.; Zio, E. A Hierarchical Resilience Enhancement Framework for Interdependent Critical Infrastructures. Reliab. Eng. Syst. Saf. 2021, 215, 107868. [Google Scholar] [CrossRef]
- Almoghathawi, Y.; Barker, K.; Albert, L.A. Resilience-driven restoration model for interdependent infrastructure networks. Reliab. Eng. Syst. Saf. 2019, 185, 12–23. [Google Scholar] [CrossRef]
- Agustin, A.D.; Adi, T.J.W. Prediction Models of Infrastructure Resilience as a Decision Support System Based on Bayesian Network. IOP Conf. Ser. Earth Environ. Sci. 2021, 832, 012014. [Google Scholar] [CrossRef]
- Opdyke, A.; Javernick-Will, A.; Koschmann, M. Infrastructure hazard resilience trends: An analysis of 25 years of research. Nat. Hazards 2017, 87, 773–789. [Google Scholar] [CrossRef]
- Kammouh, O.; Nogal, M.; Binnekamp, R.; Wolfert, A.R. Multi-system intervention optimization for interdependent infrastructure. Autom. Constr. 2021, 127, 103698. [Google Scholar] [CrossRef]
- Nahar, N.; Hossain, F.; Hossain, M.D. Health and socioeconomic effects of groundwater arsenic contamination in rural Bangladesh: New evidence from field surveys. J. Environ. Health 2008, 70, 42–47. [Google Scholar] [PubMed]
- Balaei, B.; Wilkinson, S.; Potangaroa, R.; Adamson, C.; Alavi-Shoshtari, M. Social factors affecting water supply resilience to disasters. Int. J. Disaster Risk Reduct. 2019, 37, 101187. [Google Scholar]
- Osei-Kyei, R.; Almeida, L.M.; Ampratwum, G.; Tam, V. Systematic review of critical infrastructure resilience indicators. Constr. Innov. 2022; ahead-of-print. [Google Scholar]
- BayesFusion, LLC. “GeNIe Modeler”. User Manual. 2017. Available online: https://support.bayesfusion.com/docs/ (accessed on 21 October 2019).
- Olivier, A.; Shields, M.D.; Graham-Brady, L. Bayesian neural networks for uncertainty quantification in data-driven materials modeling. Comput. Methods Appl. Mech. Eng. 2021, 386, 114079. [Google Scholar] [CrossRef]
Figure 1.
The relationship between infrastructure system performance and capability of resilience.
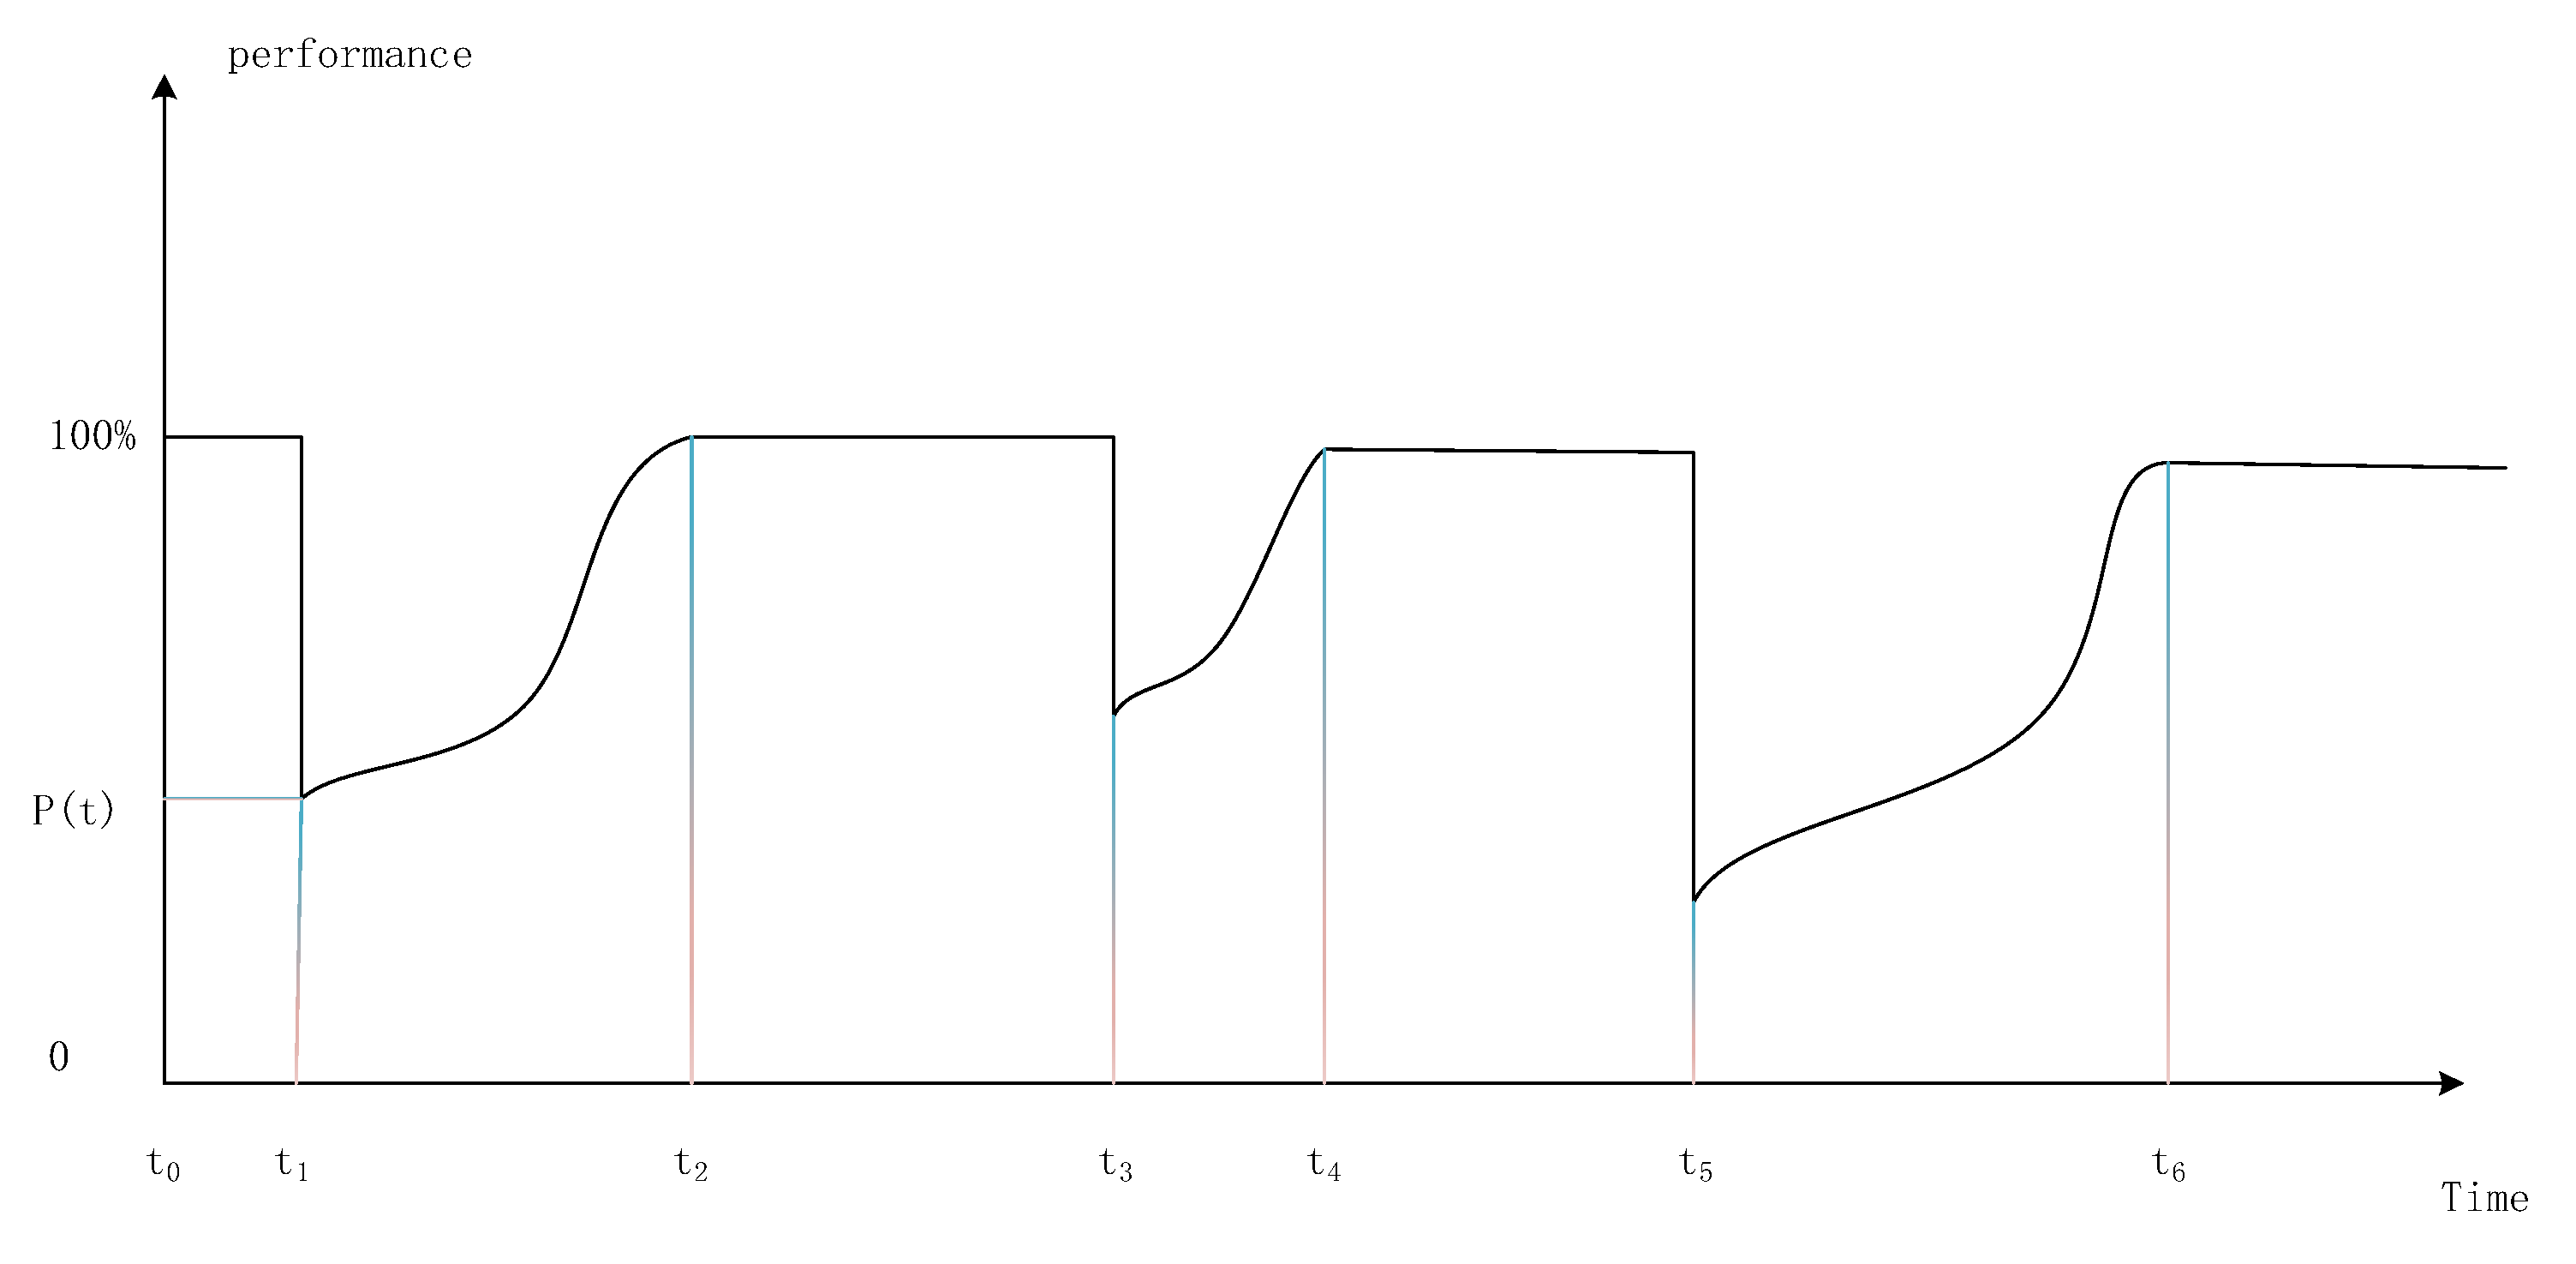
Figure 2.
An example of a Bayesian network with five nodes.

Figure 3.
Adaptability assessment model for critical infrastructures.
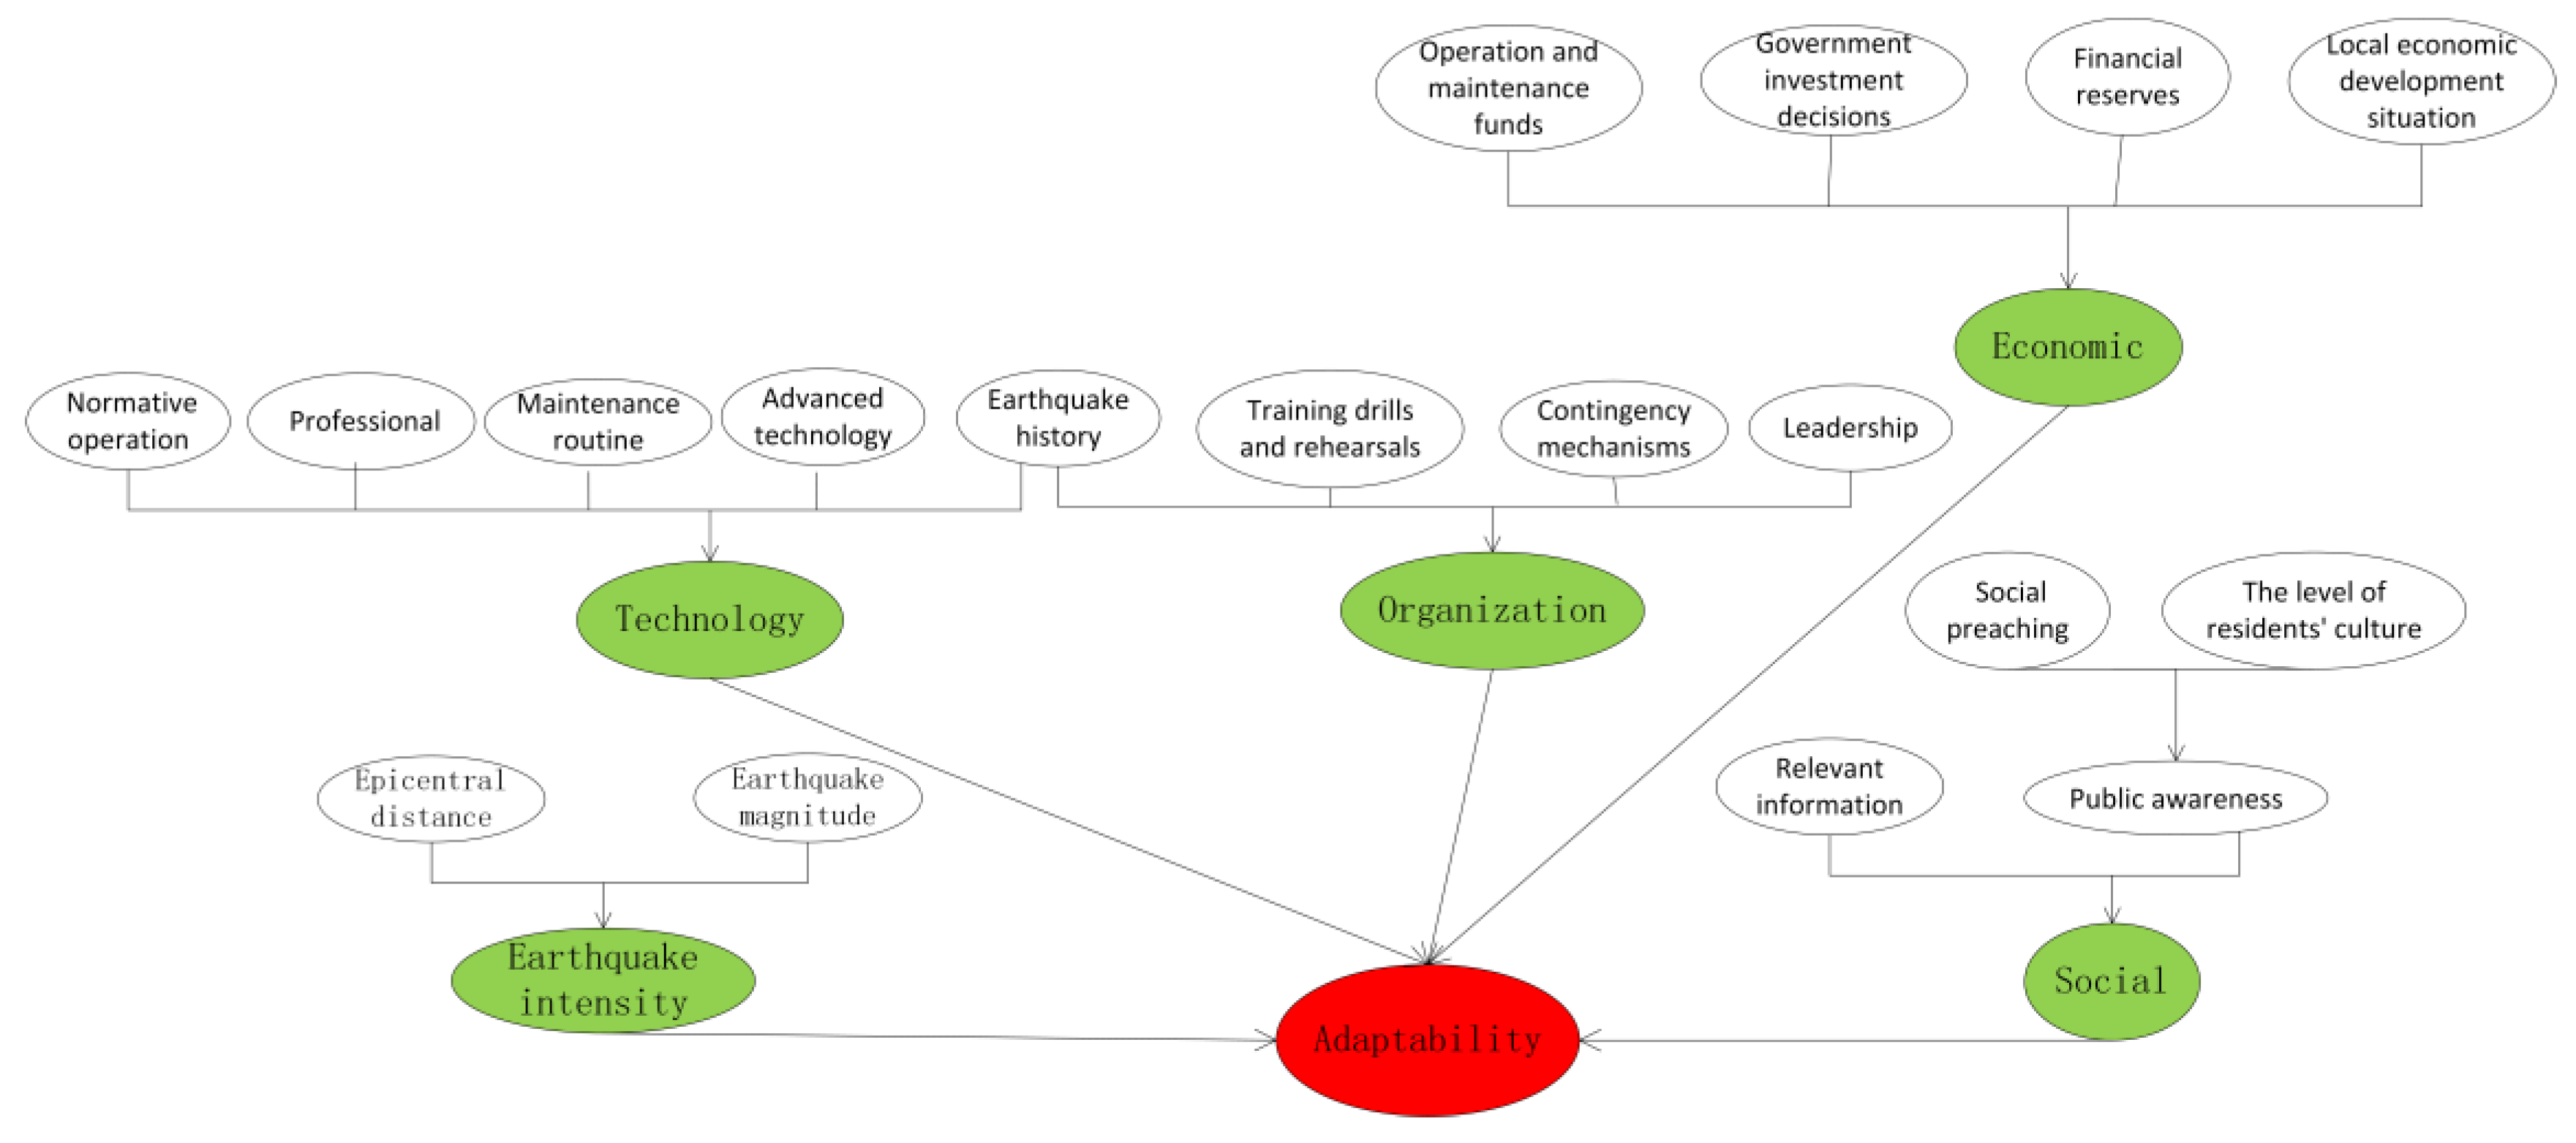
Figure 4.
BN analysis and adaptability results of the Gongxian County.

Figure 5.
Backward propagation analysis for adaptability with the state low.


Table 1.
Description of the earthquake intensity variables.
| Factor | State | Performance Measure | Reference |
|---|---|---|---|
| Epicentral distance | Close | Visual inspection/Expert opinion | [21] |
| Far | |||
| Very far | |||
| Earthquake magnitude | Strong | M5–5.9 | |
| Major | M6–6.9 | ||
| Severe | M7–7.9 | ||
| Violent | M8-Above | ||
| Earthquake intensity | Dangerous | Ⅴ–Ⅶ | [37] |
| Severe | Ⅷ–Ⅸ | ||
| Violent | Ⅹ–Ⅻ |
Table 2.
Description of the technology variables.
| Factor | State | Performance Measure | References |
|---|---|---|---|
| Normative operation | Low | ≤ 80% | [5] |
| Medium | 80% < ≤ 90% | ||
| High | > 90% | ||
| Professional | No | Inadequate | [15,16,38,39] |
| Yes | Adequate | ||
| Maintenance routine | No | Irregular maintenance | [40,41] |
| Yes | Regular maintenance | ||
| Advanced technology | No | Inadequate | [31] |
| Yes | Adequate | ||
| Earthquake history | No | Did not happen | [42,43,44] |
| Yes | Happened |
Table 3.
Description of the organization variables.
| Factor | State | Performance Measure | References |
|---|---|---|---|
| Training drills and rehearsals | No | None | [17,24,45] |
| Yes | Not less than once | ||
| Leadership | No | Unsatisfied | [17,45,46,47] |
| Yes | Satisfied | ||
| Contingency mechanisms | No | Inadequate/No update | [24,46,48] |
Table 4.
Description of the Economic variables.
| Factor | State | Performance Measure | References |
|---|---|---|---|
| Operation and maintenance funds | No | Inadequate | [23,41,49,50] |
| Yes | Adequate | ||
| Government investment decisions | No | No special investment | [5,24,51] |
| Yes | Special investment | ||
| Financial reserves | Bad | Deficit | [23,24,41,49,52,53] |
| Medium | Balance | ||
| Good | Surplus | ||
| Local economic development situation | Low | Below average | [52,54] |
| Medium | Equal to average | ||
| High | More than average |
Table 5.
Description of the Social variables.
| Factor | State | Performance Measure | References |
|---|---|---|---|
| Social information sharing | No | None | [12,48] |
| Yes | Done | ||
| The level of residents’ culture | Low | Below average | [38,46,47,55] |
| Medium | Equal to average | ||
| High | More than average | ||
| Public awareness | Low | Unwillingness | [24,52] |
| Medium | Average | ||
| High | Willingness | ||
| Relevant information | Low | Inadequate/no communication | [24,56] |
| Medium | Average but not sufficient | ||
| High | Adequate/communicate sufficiently |
Table 6.
A four-node with Unconditional probability table.
| Node State | Probability |
|---|---|
| Operation and maintenance funds | |
| No | 1/2 |
| Yes | 1/2 |
| Government investment decisions | |
| No | 1/2 |
| Yes | 1/2 |
| Financial reserves | |
| Bad | 1/3 |
| Medium | 1/3 |
| Good | 1/3 |
| Local economic development situation | |
| Low | 1/3 |
| Medium | 1/3 |
| High | 1/3 |
Table 7.
Conditional probability Table for the economic variable.
| Father Nodes | Son Node: Economic | ||||||
|---|---|---|---|---|---|---|---|
| Operation and Maintenance Funds | Government Investment Decisions | Financial Reserves | Local Economic Development Situation | High | Medium | Low | |
| 1 | 1 | 2 | 2 | 1.0000 | 1.0000 | 0.0000 | 0.0000 |
| 1 | 1 | 2 | 1 | 0.8333 | 0.6944 | 0.2778 | 0.0278 |
| 1 | 1 | 2 | 0 | 0.6667 | 0.4444 | 0.4444 | 0.1111 |
| 0 | 0 | 1 | 1 | 0.3333 | 0.1111 | 0.4444 | 0.4444 |
| 0 | 0 | 1 | 0 | 0.1667 | 0.0278 | 0.2778 | 0.6944 |
| 0 | 1 | 2 | 0 | 0.5000 | 0.2500 | 0.5000 | 0.2500 |
| … | … | … | … | … | … | … | … |
Table 8.
Comparative scenarios among different adaptability.
| Scenario | Earthquake History | Relevant Information | Contingency Mechanisms | Adaptability (%) | ||
|---|---|---|---|---|---|---|
| Low | Medium | High | ||||
| Base Case | yes | low | yes | 49 | 40 | 12 |
| 1 | no | low | yes | 63 | 30 | 7 |
| 2 | yes | medium | yes | 42 | 42 | 16 |
| 3 | yes | high | yes | 35 | 45 | 20 |
| 4 | yes | low | no | 59 | 32 | 9 |
| 5 | no | low | no | 75 | 21 | 4 |
Disclaimer/Publisher’s Note: The statements, opinions and data contained in all publications are solely those of the individual author(s) and contributor(s) and not of MDPI and/or the editor(s). MDPI and/or the editor(s) disclaim responsibility for any injury to people or property resulting from any ideas, methods, instructions or products referred to in the content. |
© 2023 by the authors. Licensee MDPI, Basel, Switzerland. This article is an open access article distributed under the terms and conditions of the Creative Commons Attribution (CC BY) license (https://creativecommons.org/licenses/by/4.0/).
Share and Cite
MDPI and ACS Style
Tang, H.; Zhong, Q.; Chen, C.; Martek, I. The Adaptive Seismic Resilience of Infrastructure Systems: A Bayesian Networks Analysis. Systems 2023, 11, 84. https://doi.org/10.3390/systems11020084
AMA Style
Tang H, Zhong Q, Chen C, Martek I. The Adaptive Seismic Resilience of Infrastructure Systems: A Bayesian Networks Analysis. Systems. 2023; 11(2):84. https://doi.org/10.3390/systems11020084
Chicago/Turabian StyleTang, Hui, Qingping Zhong, Chuan Chen, and Igor Martek. 2023. "The Adaptive Seismic Resilience of Infrastructure Systems: A Bayesian Networks Analysis" Systems 11, no. 2: 84. https://doi.org/10.3390/systems11020084
Note that from the first issue of 2016, this journal uses article numbers instead of page numbers. See further details here.