
Intelligent Hybrid Modeling of Complex Leaching System Based on LSTM Neural Network

1
School of Information and Control Engineering, China University of Mining and Technology, Xuzhou 221116, China
2
Key Laboratory of Intelligent Textile and Flexible Interconnection of Zhejiang Province, Hangzhou 310018, China
*
Author to whom correspondence should be addressed.
Systems 2023, 11(2), 78; https://doi.org/10.3390/systems11020078
Submission received: 2 December 2022
/
Revised: 19 January 2023
/
Accepted: 30 January 2023
/
Published: 2 February 2023
(This article belongs to the Section Systems Engineering)
Abstract
:In order to improve the leaching efficiency of gold ore and reduce the environmental treatment cost of residual sodium cyanide, continuous stirred tank reactors are often connected in a cascade manner. A gold leaching system is a multiphase chemical reaction system, and its kinetic reaction mechanism is complex and affected by random factors. Using intelligent modeling technology to establish a hybrid prediction model of the leaching system, the dynamic performance of the process can be easily analyzed. According to the reaction principle and the theory of substance conservation, a mechanism model is established to reflect the main dynamic performance of the leaching system. In order to improve the global convergence of the optimization target, a particle swarm optimization (PSO) algorithm based on simulated annealing is used to optimize the adjustment parameters in the kinetic reaction velocity model. The multilayer long short-term memory (LSTM) neural network approach is used to compensate for the prediction errors caused by the unmodeled dynamics, and a hybrid model is established. The hybrid prediction model can accurately predict the leaching rate, which provides a reliable basis for guiding production, and also provides a model basis for process optimization, controller design, and operation monitoring. Finally, the superiority and practicability of the hybrid model are verified by a practical leaching industrial system test. The prediction model of key variables in the leaching process is established for the first time using the latest time series prediction technology and intelligent optimization technology. The research results of this paper can provide a good reference and guidance for other research on complex system hybrid modeling.
1. Introduction
A hydrometallurgical leaching system is a typical complex system involving physical and chemical reactions, variables, and uncertainties [1]. Establishing the model of this complex system is helpful to analyze the relationship between the internal structure characteristics and the external variables [2]. With the decline in ore gold grade and increasingly strict environmental protection standards, hydrometallurgy plays an increasingly important role in the production of non-ferrous metals [3]. Hydrometallurgy technology can directly deal with low-grade and complex materials, improve the comprehensive utilization rate of resources, and realize cleaner production easily [4]. Hydrometallurgy is mainly based on the disciplines of metallurgical physics chemistry and reaction engineering [5]. Leaching is an important process in hydrometallurgy. Leaching is a complex process of chemical dissolution reaction between a leaching agent and specific components in solid materials [6]. The solution containing the extracted substance can be formed by leaching and can be preliminarily separated from other insoluble components. Leaching systems are mainly based on filtration leaching and agitation leaching. The leaching rate is the key index of any leaching system, and it is usually detected by offline assay [7]. The quality of the leaching solution directly determines the quality and benefit of subsequent production processes. Based on experimental tests, computer simulations, and mathematical derivation, the dynamic model of the leaching system can be established [8]. The process model can provide the necessary scientific basis for the engineering development and application of new hydrometallurgical processes.
The main factors affecting gold cyanidation leaching are cyanide concentration, oxygen concentration, pH value of leaching solution, ore pulp temperature, ore particle size and shape, pulp concentration, leaching time, impurities, and associated minerals [9]. In order to ensure that the leaching system operates in the optimal state, it is necessary to accurately establish the prediction model of the key variables related to the leaching rate [10]. The mechanism model of the leaching system can be established by analyzing the structure and internal chemical changes of the leaching system. Combined with prior knowledge and reasonable assumptions, the mechanism model is simplified to reveal the external characteristics of the leaching system, which has important practical significance for the leaching system [11]. The influence of related variables on the leaching rate and key auxiliary variables can be determined by analyzing the mechanism model. The gold cyanidation leaching system is a complex multiphase chemical reaction process. The complicated kinetic reaction mechanism and process random factors increase the difficulty in modeling the leaching system [12]. Due to the different production technologies, equipment parameters, and operation modes, the structure and parameters of the kinetic model of the gold cyanidation leaching system are different and need to be determined by appropriate methods [13]. The achievements of researchers in determining the gold leaching reaction mechanism provide a good guide for the establishment of the leaching system model in this paper.
The mechanism model can be established by analyzing the internal laws of the system and ignoring unimportant factors. Based on strict mathematical derivation or computer simulation, the mechanism model has a strong explanatory ability and can be extended to other similar processes [14]. Conversely, the data-driven model fully mines the relationship between process data and can reflect complex information that cannot be explained by the mechanism method. The data compensation model compensates for the output errors caused by the unmodeled dynamics of the system [15]. The data model has high precision but also has the disadvantage of poor generalization ability. The hybrid model uses a mechanism model to reflect the main dynamic characteristics of the system, which reduces the requirement of sample data and improves the generalization ability of the model [16]. The hybrid model has good local approximation performance and global dynamic performance. The hybrid model has the dual advantages of high precision of the data model and the strong generalization ability of the mechanism model [17]. The hybrid models commonly used in practical applications can be divided into two types, parallel and series. The relationships between the variables and structures of cascade leaching systems are complex [18]. Abundant mechanism knowledge and prior knowledge go into creating leaching systems, so it is more suitable to establish a parallel hybrid model of such systems [19]. The LSTM neural network has unique superiorities in process data mining and time-series prediction. The LSTM is an improvement of the recurrent neural network and has a time-recurrent structure [20]. Therefore, this paper will use the LSTM network to research the hybrid modeling of the cascade leaching industrial process.
The mechanism analysis and data-driven modeling of industrial systems are hot topics for researchers. Based on Merkel’s theory and mechanistic analytical techniques, a parallel hybrid model has been constructed for a mechanical draft counter flow wet-cooling tower by using least squares support vector machine, which can guide system energy-saving optimization [21]. By analyzing experiment data and mechanism knowledge, the choke finger system is modeled by a block-oriented model with a nonlinear dynamic input [22]. Based on process knowledge and real industrial data, an intelligent operational adjustment framework based on a hybrid Bayesian network (BN) has been established for the copper cleaner flotation process [23]. A new hybrid wind-speed forecasting method based on a back propagation (BP) neural network has been proposed to forecast daily average wind speed [24]. By combing ensemble just-in-time learning and moving window techniques, a data-driven semi-supervised weighted probability partial least squares regression (SWPPLSR) is developed to obtain the unmodeled dynamics in the mechanism model, and its validity has been verified by modeling a roller hearth kiln of ternary cathode material manufacturing [25]. By combining data assignment and the parameter estimation technique, a hybrid system consisting of a Piecewise Auto-Regressive eXogeneous (PWARX) structure has been developed for a rainfall-runoff system [26]. Hybrid modeling with a data-driven scheme has been proposed in multiscale material and process design, in which mechanistic models are used to describe the process-related principle [27]. For the polyethylene production process, a hybrid model with feedforward artificial neural networks (FANNs) has been developed by adding an empirical layer to the mechanistic model. The mechanistic model utilizes fundamental material and energy balances to predict important process conditions [28]. Based on empirical mode decomposition and back-propagation neural network, a hybrid water temperature prediction model has been proposed to reduce aquaculture risks and optimize the operation of water quality management [29]. A quantitative assessment hybrid model demonstrates a superior capability to predict the time evolution of different process variables using only the initial and process conditions [30]. According to the existing knowledge of the reaction mechanism and chemical principles, a simplified mechanism model of a leaching system can be established [31]. The unknown parameters involved in the non-convex mechanism model can be optimized and solved by intelligent methods [32]. The unmodeled dynamics and prediction errors in the mechanism model can be compensated by an error data model established by neural networks [33]. These hybrid modeling strategies provide a good reference and guidance for the hybrid modeling of cascade leaching systems.
In this paper, the theory of mechanism analysis modeling and the scheme of intelligent hybrid modeling are studied for hydrometallurgical gold cyanidation leaching systems. A typical gold cyanidation leaching system is introduced and designed. The chemical principle of the cyanidation leaching system is introduced in detail. The structure and model order of the process are determined by the mechanism analysis technique. The influence of related variables on the leaching system is also discussed. Based on reasonable assumptions and simplification, the dynamic mechanism model of single and cascade gold leaching systems is established. The adjusting parameters of the gold dissolution rate and cyanide ion consumption rate are estimated by using the particle swarm optimization algorithm based on a simulated annealing strategy. The LSTM network with sliding windows is designed to compensate for the prediction error of the mechanism model, and the intelligent hybrid model is established. Based on the experimental test, the effectiveness and merit of the proposed hybrid modeling algorithm are cross-verified by comparison with the existing methods. The accurate leaching process model can not only predict the leaching rate well but also provide the basis for the model-based predictive control technology and the development of a process operation monitoring system. Based on the latest data-driven modeling strategy using an LSTM neural network or a gated recurrent unit (GRU) neural network, the proposed hybrid modeling technique can accurately predict the leaching rate in the leaching process. The research ideas proposed in this paper can provide inspiration for the modeling of other complex systems. The rest of this paper is organized as below. The hydrometallurgical gold leaching system will be introduced and designed in Section 2. Section 3 includes the chemical principle behind the gold cyanidation leaching system. The mechanism modeling of a cascade leaching system will be given in Section 4. Parameter identification of the mechanism model will be given in Section 5. Hybrid modeling techniques based on LSTM networks will be presented in Section 6. The experiment test is presented in Section 7. Finally, some conclusions are drawn in Section 8.
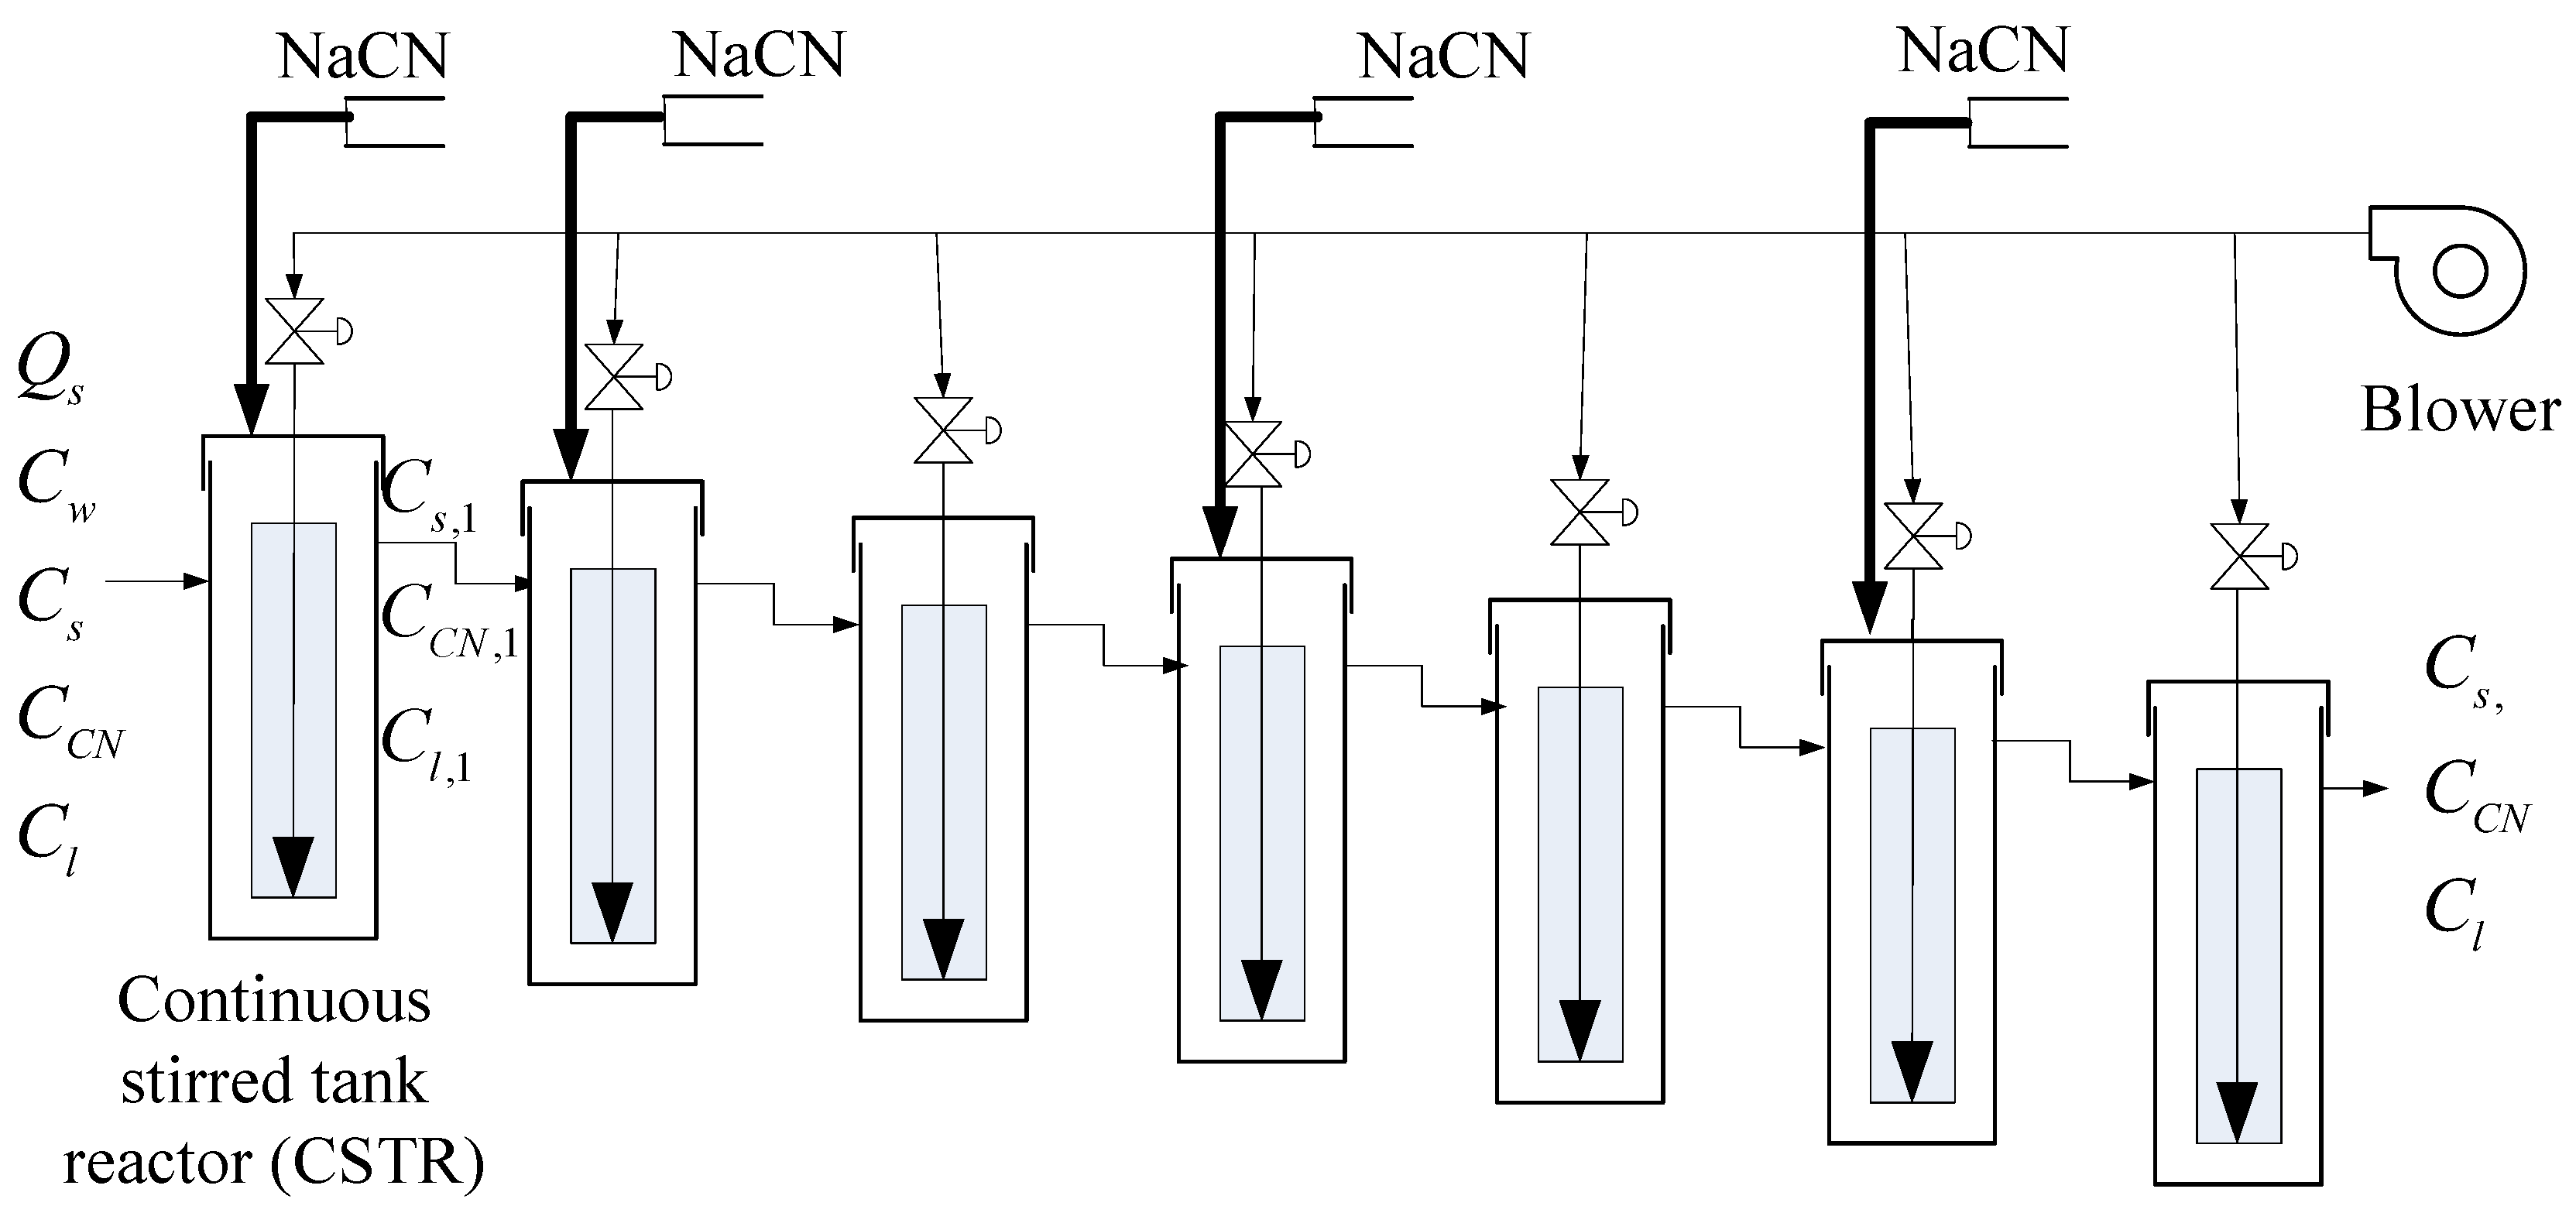
2. Hydrometallurgical Gold Leaching System
In this section, the basic components of the hydrometallurgical leaching process will be described and analyzed in detail to facilitate the establishment of system mechanism models. Seven tank reactors in series are adopted to carry out cyanide reactions for the hydrometallurgical gold leaching system, as shown in Figure 1. A blower is used to fill each leaching tank with air. Sodium cyanide is added to the first, second, fourth, and sixth reaction tanks. The ore pulp containing gold is concentrated and stored in buffer tanks. The insoluble gold in the solid phase reacts with sodium cyanide and oxygen to form water-soluble gold cyanide complex ions. Compressed air is passed through the bottom of the leaching tank to provide dissolved oxygen for the reaction. Pneumatic agitation is used to prevent ore pulp accumulation. The reacted ore pulp flows into the subsequent leaching tank through the overflow. The cascade leaching system involves complex physical and chemical reactions, and different leaching tanks have different kinetic reaction rates. Ore pulp flow rate, ore pulp concentration, pH value, and dissolved oxygen concentration can be measured online. However, gold grade and cyanide ion concentration can only be measured offline. Low-frequency and high-frequency disturbances exist in the measurement process, which increases the difficulty of process modeling.
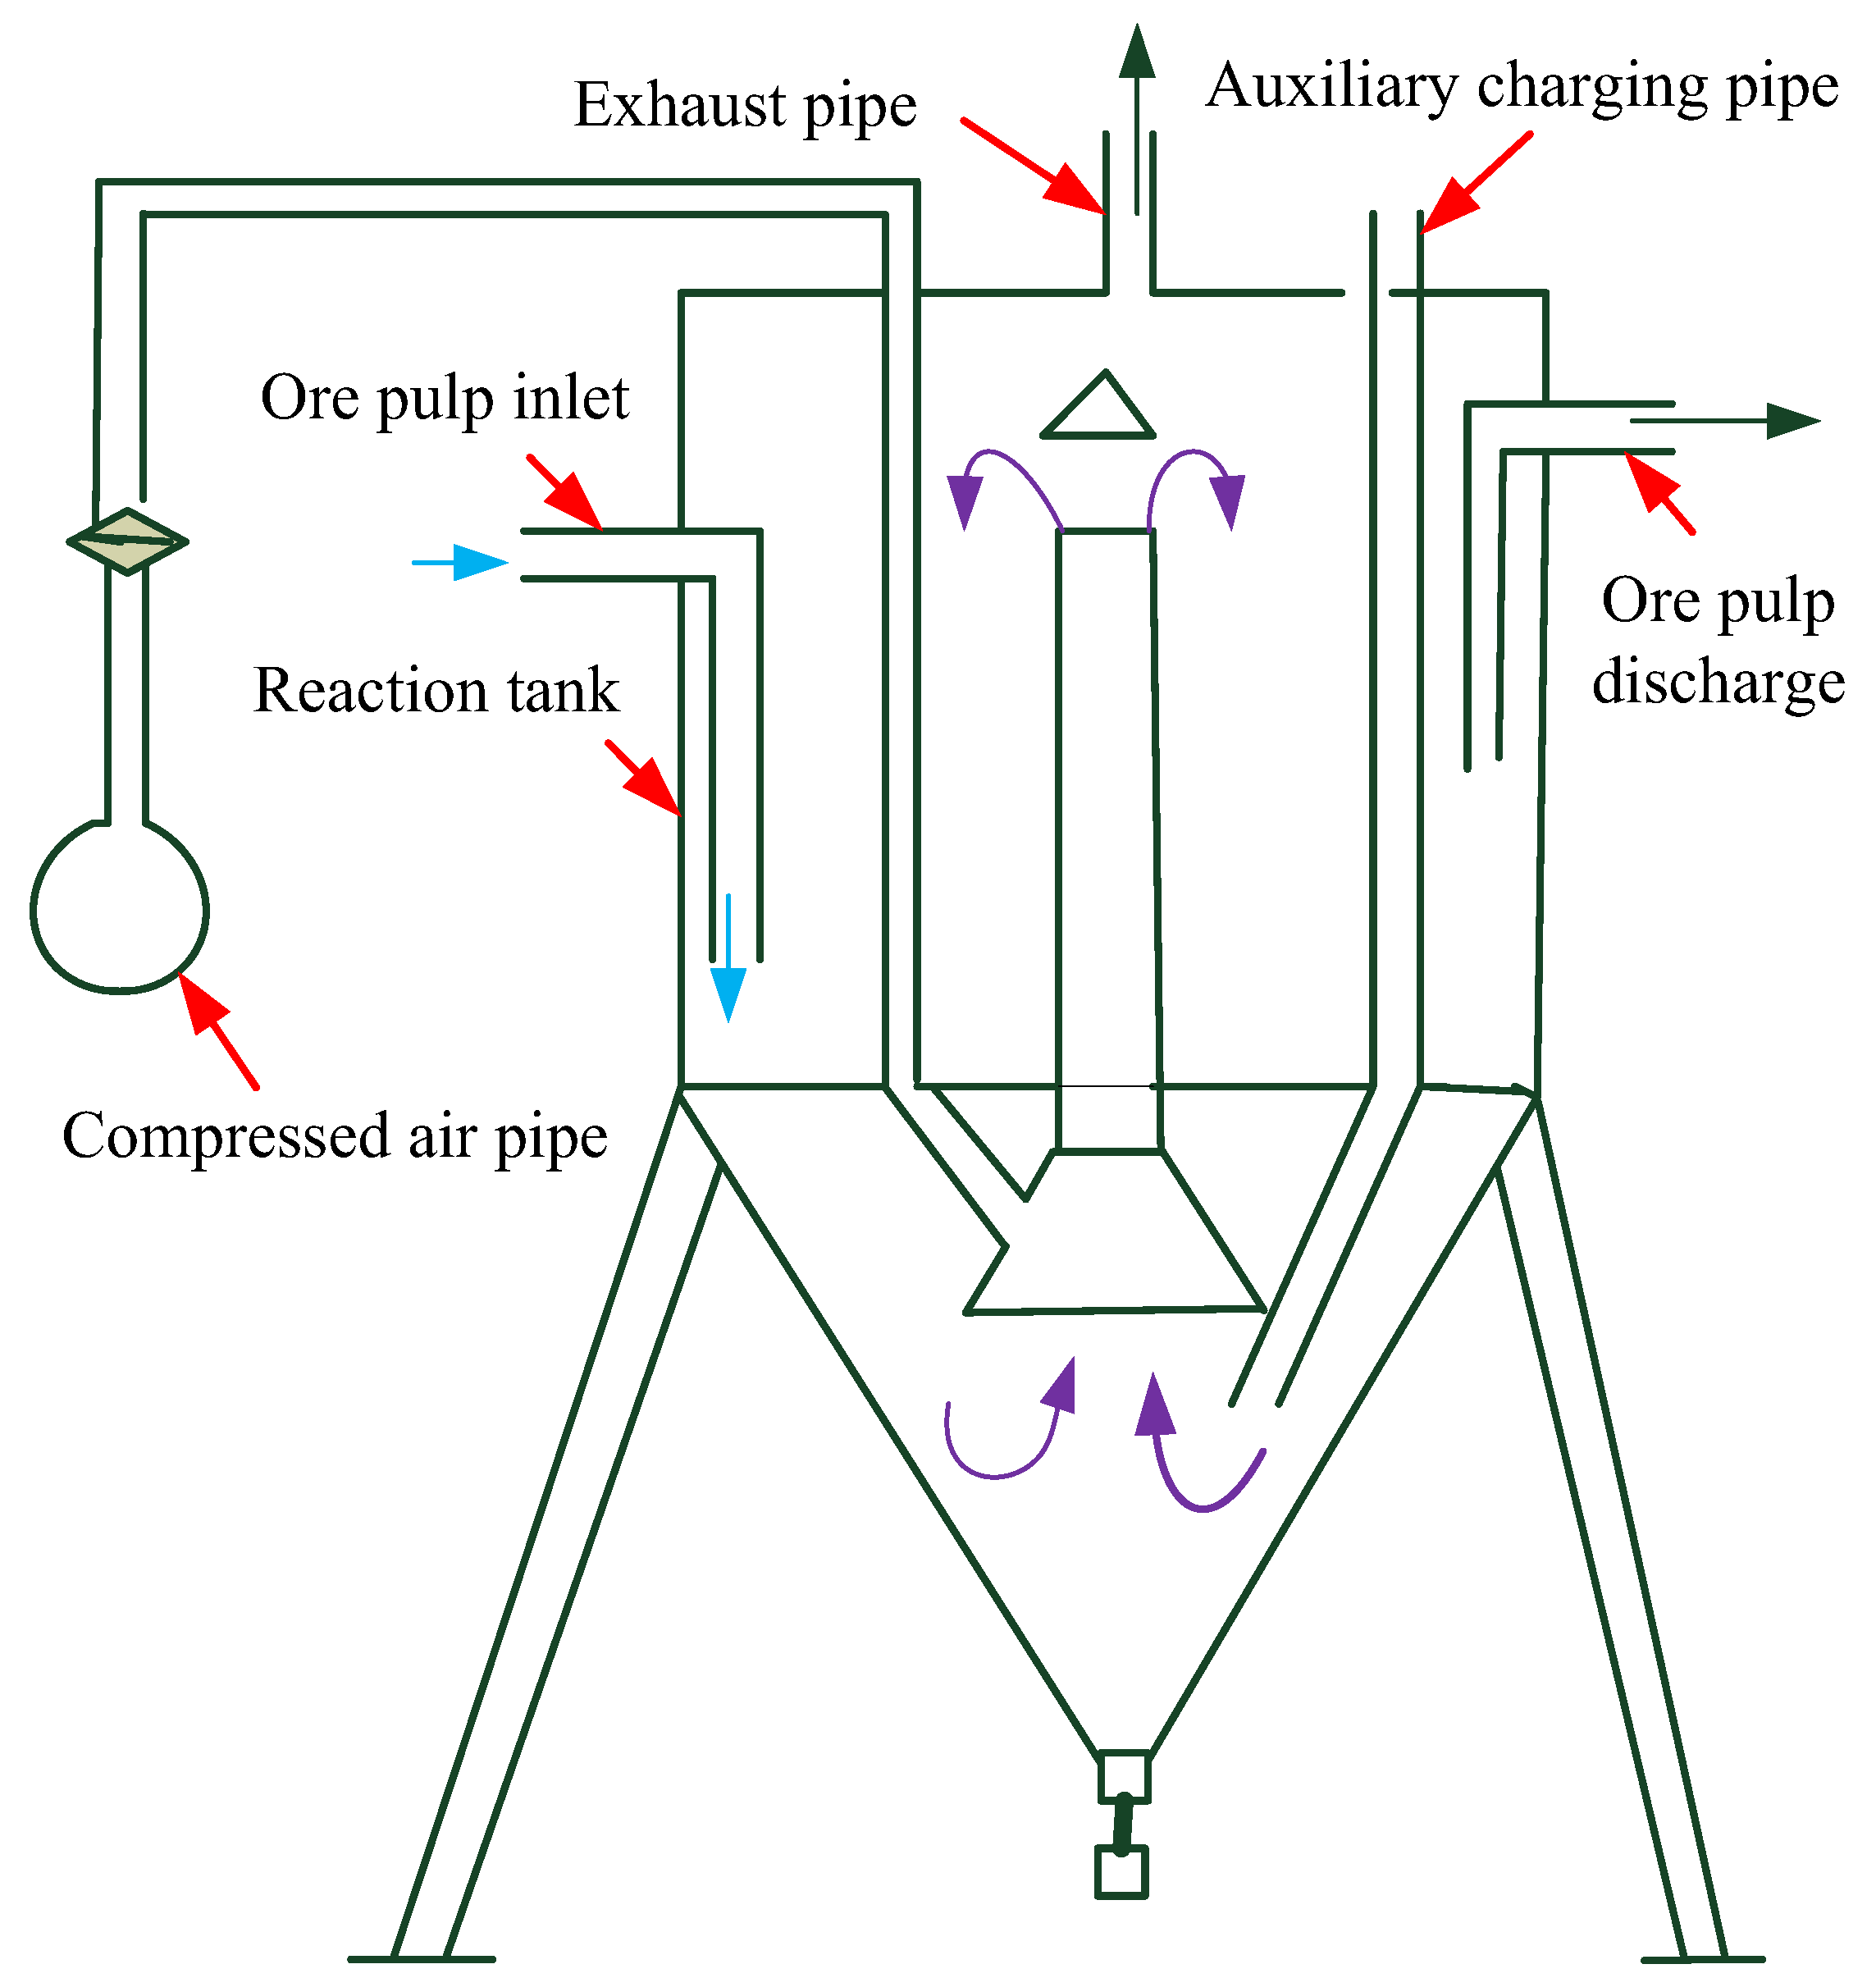
The continuous stirred leaching tank reactor (CSTR) is also called a Pachuca extractor and has been adopted in the leaching system [7], as shown in Figure 2. The CSTR is the key reaction equipment in the leaching process. It is not only the reaction vessel but also the power source of the leaching process. The bottom of the leaching tank is filled with compressed air into the central pipe, forming a large number of bubbles rising along the central pipe. The bubble in the central pipe makes the volume of ore pulp expand and the density decrease, which results in the pulp pressure in the central pipe being less than the pressure outside the central pipe. Under the action of the pressure difference between the inside and outside of the pipe, the ore pulp in the pipe moves upward and flows out from the upper end of the central pipe. The ore pulp outside the central pipe slowly flows down to the bottom, which forms a closed circulation of pulp flow. The bubbles that overflow from the ore pulp are discharged through the exhaust pipe at the top of the tank.
3. Chemical Principle of Gold Cyanidation Leaching System
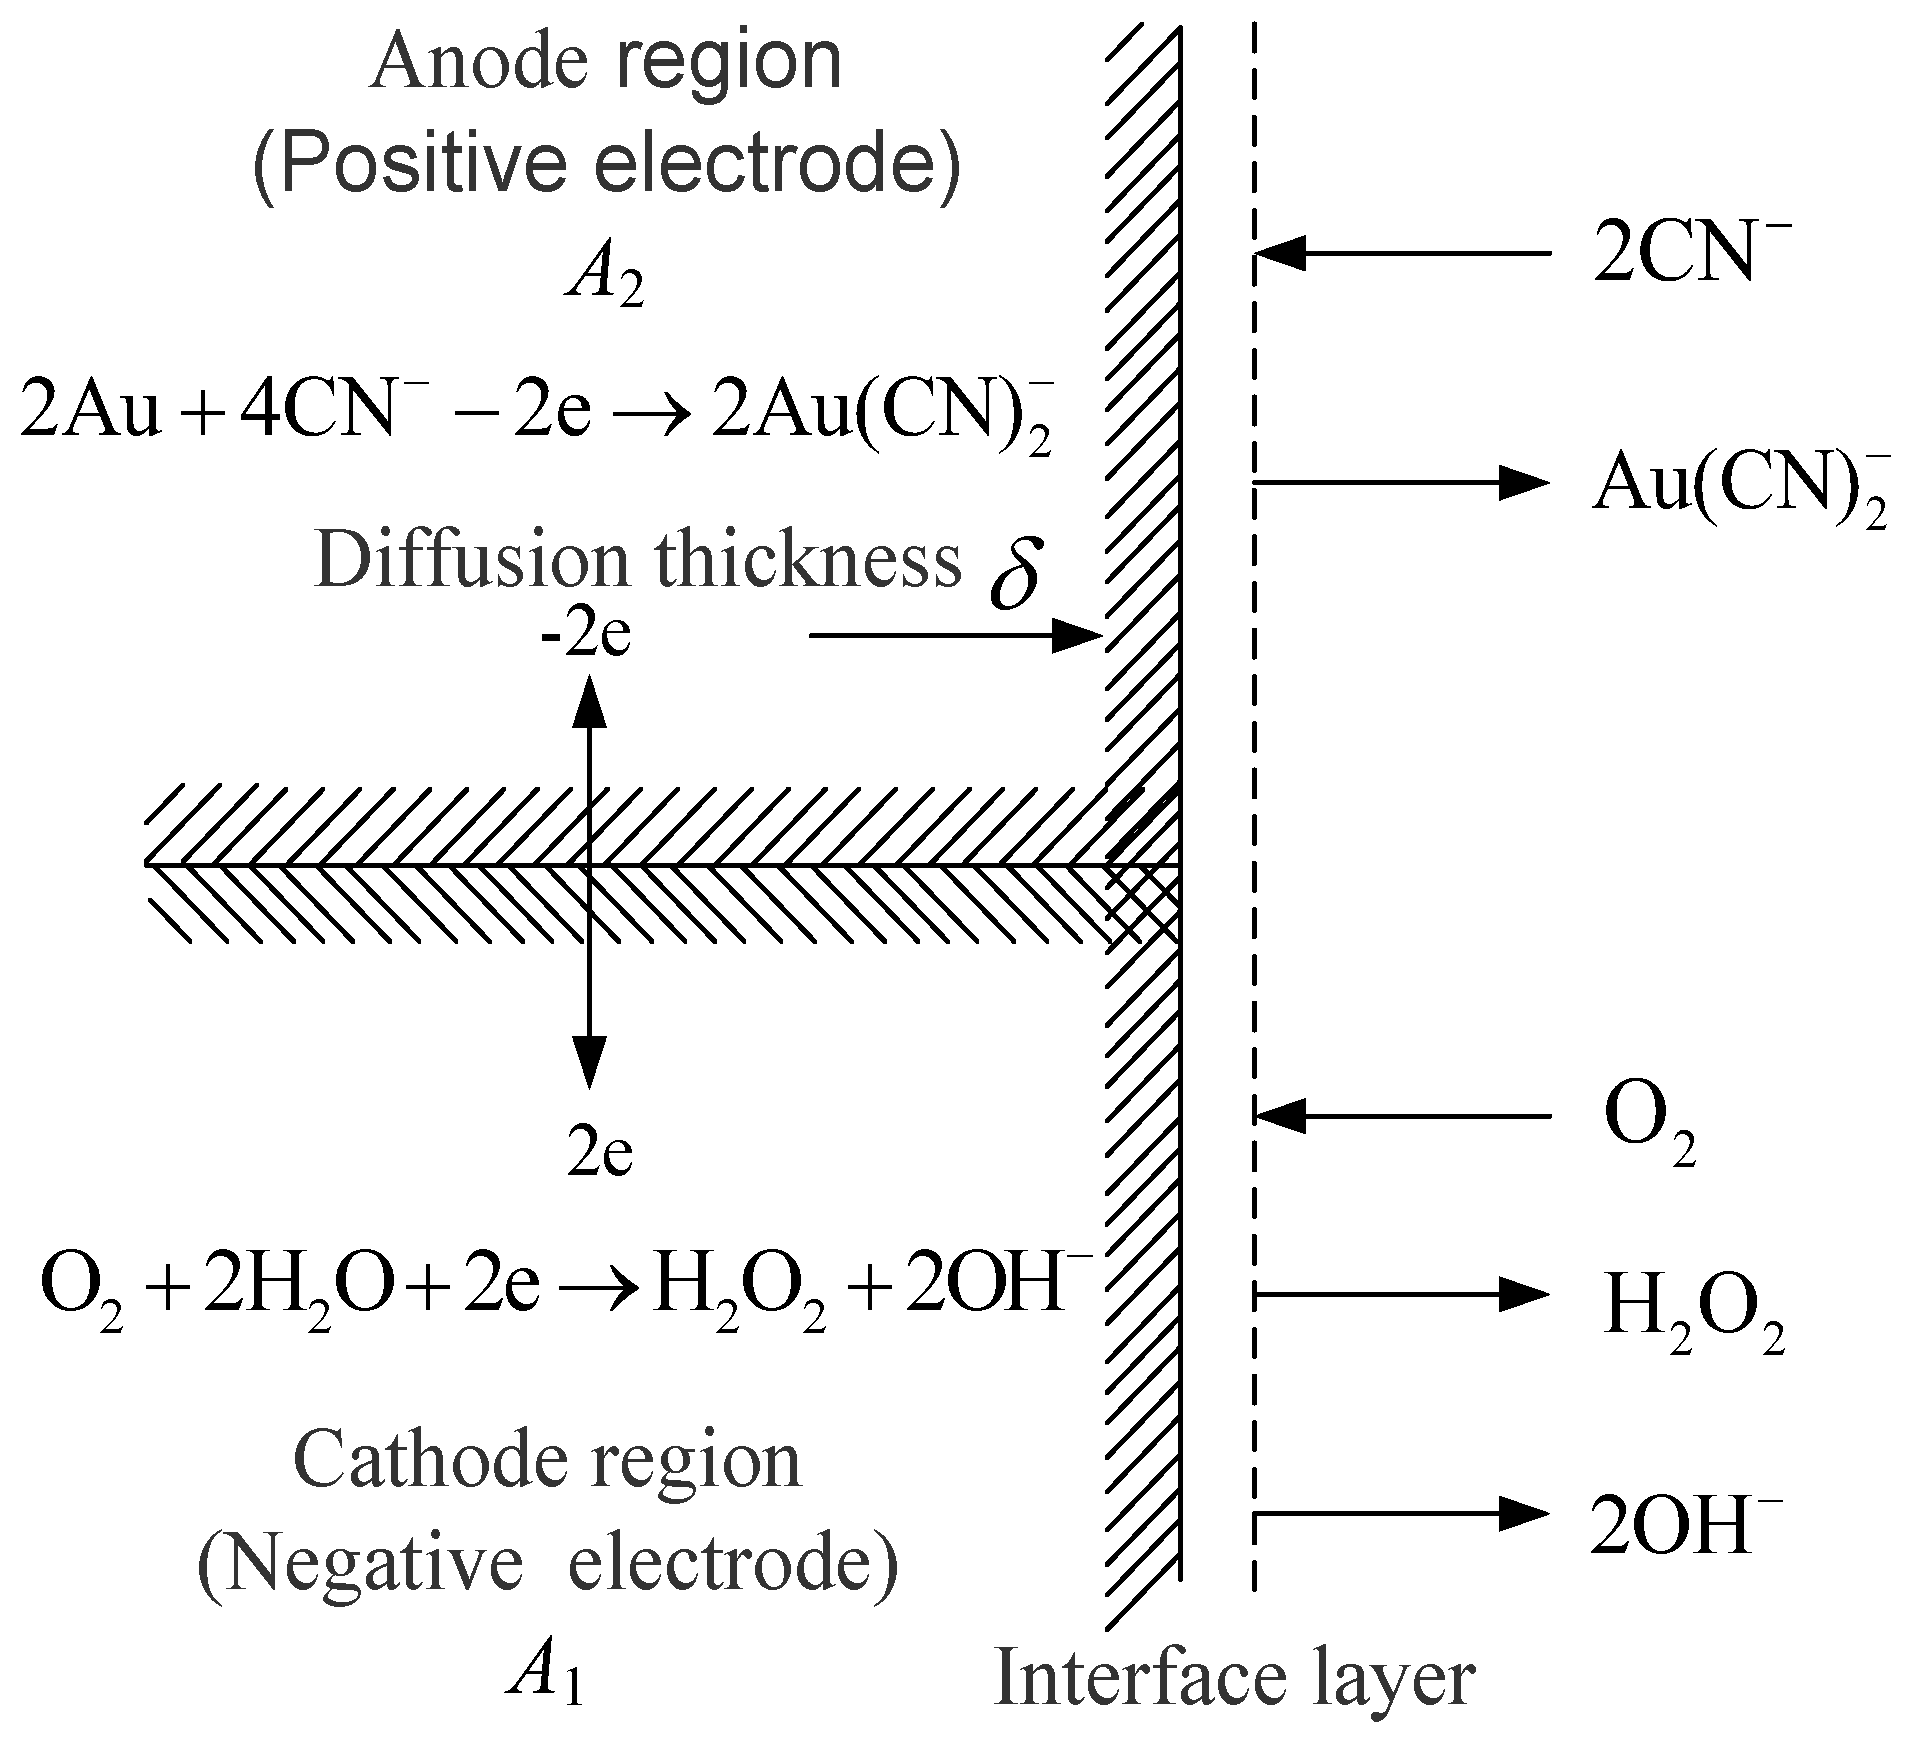
In this section, the reaction principle of the hydrometallurgical leaching process will be introduced in order to understand the difficulties in, and key points of, modeling. The reaction of gold with sodium cyanide is electrochemical dissolution. The oxidation and dissolution of gold occur at the anode, while the depolarization of oxygen occurs at the cathode, as shown in Figure 3.
The major chemical reactions can be expressed as
Equation (1) can be expressed as two battery reactions. The anode region reaction can be expressed as
The cathode region reaction can be expressed as
Concentration polarization is the most important factor affecting the polarization of the cathode and anode. The concentration polarization of oxygen and cyanide ions can be determined by Fick’s law
where and are the diffusion rates of and , respectively; and are the diffusion coefficients of dissolved oxygen and cyanide ion, respectively; and are the concentrations of and in the solution, respectively; and are the concentrations of and at the interface, respectively.
The chemical reaction rate of and at the metal interface is much higher than the diffusion rate, i.e., , . Thus, Equations (4) and (5) can be simplified as
The dissolution rate of gold is twice that of oxygen consumption and half that of cyanide consumption. Therefore, the dissolution rate of gold can be expressed as
or
When the above equation reaches equilibrium, it becomes
The total surface area of metal in contact with water can be expressed as . The dissolution rate of gold can be expressed as
In the case of very low cyanide concentration and high dissolved oxygen concentration, Equation (11) can be simplified as
The dissolution rate of gold is mainly determined by the cyanide ion concentration.
In the case of high cyanide concentration and low dissolved oxygen concentration, Equation (11) can be simplified as
The dissolution rate of gold mainly depends on the concentration of dissolved oxygen.
4. Mechanism Modeling of Cascade Leaching System
On the basis of understanding the structure, kinetic principle, and chemical reaction principle of hydrometallurgy, the mechanism model of the leaching process can be established by using the mechanism knowledge and partial differential equations. The mechanism model of the leaching system mainly consists of the mass conservation equations of gold in the ore, gold in the liquid, and cyanide ion in the liquid, as well as the corresponding kinetic reaction rate models of gold and cyanide ion. The conservation equation of gold and cyanide in single-tank leaching systems can be expressed as
where is the solid flow rate of ore pulp; is the liquid flow rate of ore pulp; and are the initial gold concentration of the solid and liquid, respectively; is the mass of solid ore pulp in the leaching tank; is the mass of liquid ore pulp in the leaching tank; is the initial cyanide ion concentration of the liquid; and are the concentration of solid and liquid gold in the leaching tank, respectively; is the liquid cyanide ion concentration; is the addition flow rate of sodium cyanide; is the gold dissolution rate; is the consumption rate of cyanide ion.
The gold dissolution rate is a nonlinear function of the average diameter of ore particles , dissolved oxygen concentration , liquid hydrogen ion concentration , and solid gold concentration , and can be expressed as
The consumption rate of cyanide ions is a nonlinear function of the and , and can be expressed by
The solid and liquid mass of ore pulp satisfies the conservation relation. The relationship between the solid flow rate and liquid flow rate of ore pulp can be expressed as
where is the ore pulp concentration.
The average residence time of the chemical reaction can be computed by
where and are the solid density and liquid density of ore pulp, respectively; and is the volume of the leaching tank.
The residence mass of solid and liquid in the leaching tank can be expressed as
The leaching rate of gold can be computed by
The mechanism model of the leaching system is a nonlinear function and can be expressed as
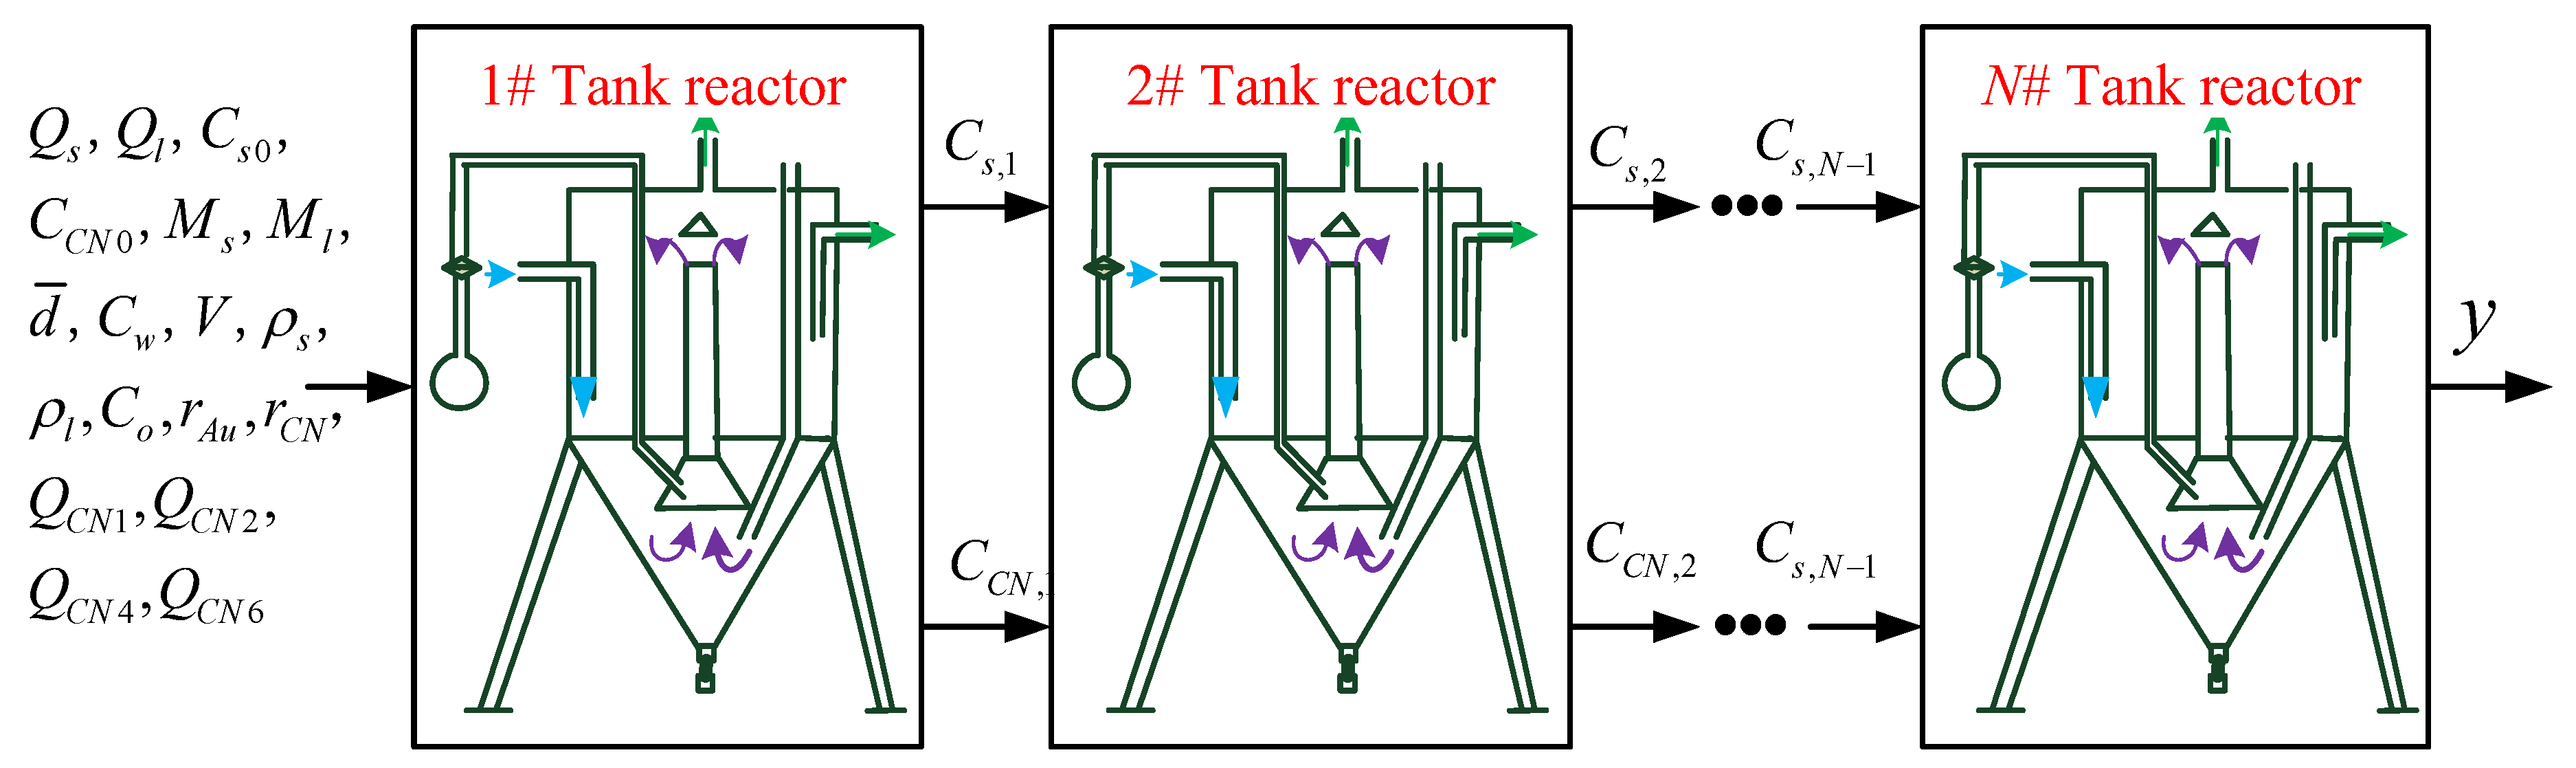
The leaching tank is serially connected by ore pulp overflow. The effective volume of each leaching tank is the same. It is assumed that the reactants in the leaching tank can be mixed adequately. Material isolation is neglected. The resistance of ore pulp is constant. The input and output schematic diagram of the cascade leaching system is shown in Figure 4. For the stable operation of the leaching industrial process, the mass conservation principle satisfies and . The total leaching rate of the cascaded gold cyanidation leaching system can be expressed as
where is the solid gold concentration of the leaching tank.
The addition of sodium cyanide to each leaching tank is an operational variable. The model structure of each leaching tank in the cascade leaching system is the same, but the kinetic reaction velocity model parameters of different leaching tanks need to be estimated. If every leaching tank model adopts the same parameter, it will cause model mismatch and reduce the prediction accuracy of the leaching rate. Therefore, the unknown parameters in the model should be identified by the actual process data. There are many unknown parameters in the leaching process mechanism model. It is difficult for conventional optimization algorithms to obtain a satisfactory global optimal solution. It is more likely to obtain the optimal operating variable by intelligent optimization technology.
5. Parameter Estimation Based on PSO Algorithm
The gold dissolution rate and the consumption rate of cyanide ions cannot be measured using the detection equipment for online measurement. The kinetic reaction models estimated by the existing literature based on the least square method are
where the residual gold concentration in the solid is a function of and expressed as
The differential equations of gold concentration and cyanide ion concentration can be expressed by
Due to different production environments and equipment parameters, the empirical model obtained from existing literature cannot be directly applied to the leaching system in this paper. However, it provides a good reference for constructing a leaching system model. The key adjusting parameters and in the gold dissolution rate and cyanide ion consumption rate models can be estimated based on the existing model structure. The parameter identification objective function is composed of the error norm between the actual leaching rate obtained by assay and the leaching rate predicted by the model, i.e.,
The reaction velocity model is a nonlinear function of adjustment parameters and the sampling data may contain measurement noise. The conventional least square optimization or Newton optimization methods cannot easily obtain satisfactory optimization results [34]. Therefore, intelligent methods should be used to optimize the solution. Among many intelligent optimization methods, the particle swarm optimization (PSO) algorithm has the advantages of small computation and strong global convergence, which is suitable for optimizing large complex process models. The intelligent PSO algorithm will be used to solve the objective function. The PSO algorithm based on a simulated annealing strategy has the ability of probability mutation and can avoid falling into the local extremum. The velocity update and position update formulas of a particle can be expressed as
where is the dimension of the particle; and are random numbers between (0, 1); and are positive learning factors (or acceleration coefficients); is the velocity compression factor, and .
The particle fitness function constructed by the standard PSO algorithm has some limitations. Therefore, the simulated annealing algorithm is used to construct the fitness function of particles to improve the global convergence and convergence speed of the optimization algorithm. The initial temperature of the simulated annealing algorithm is taken as . The annealing mode is designed as , where is the annealing constant. The fitness of a particle can be computed by
where is the group optimal solution and is the fitness function. The improved particle swarm optimization algorithm is more suitable for optimizing the leaching process and more likely to obtain the optimal operational variables. In the actual industrial system application, the undetermined parameters involved in the optimization algorithm can be taken according to the following criteria [35]. The number of particles is usually set to between 50 and 100. The learning factor and are usually set in the interval between 1.3 and 2.8. The value of the annealing constant is usually chosen between 0.4 and 0.6. The number of iterations can be determined according to the requirements of the industrial process and is usually set to between 500 and 1500.
6. Compensation Modeling Based on LSTM Neural Network
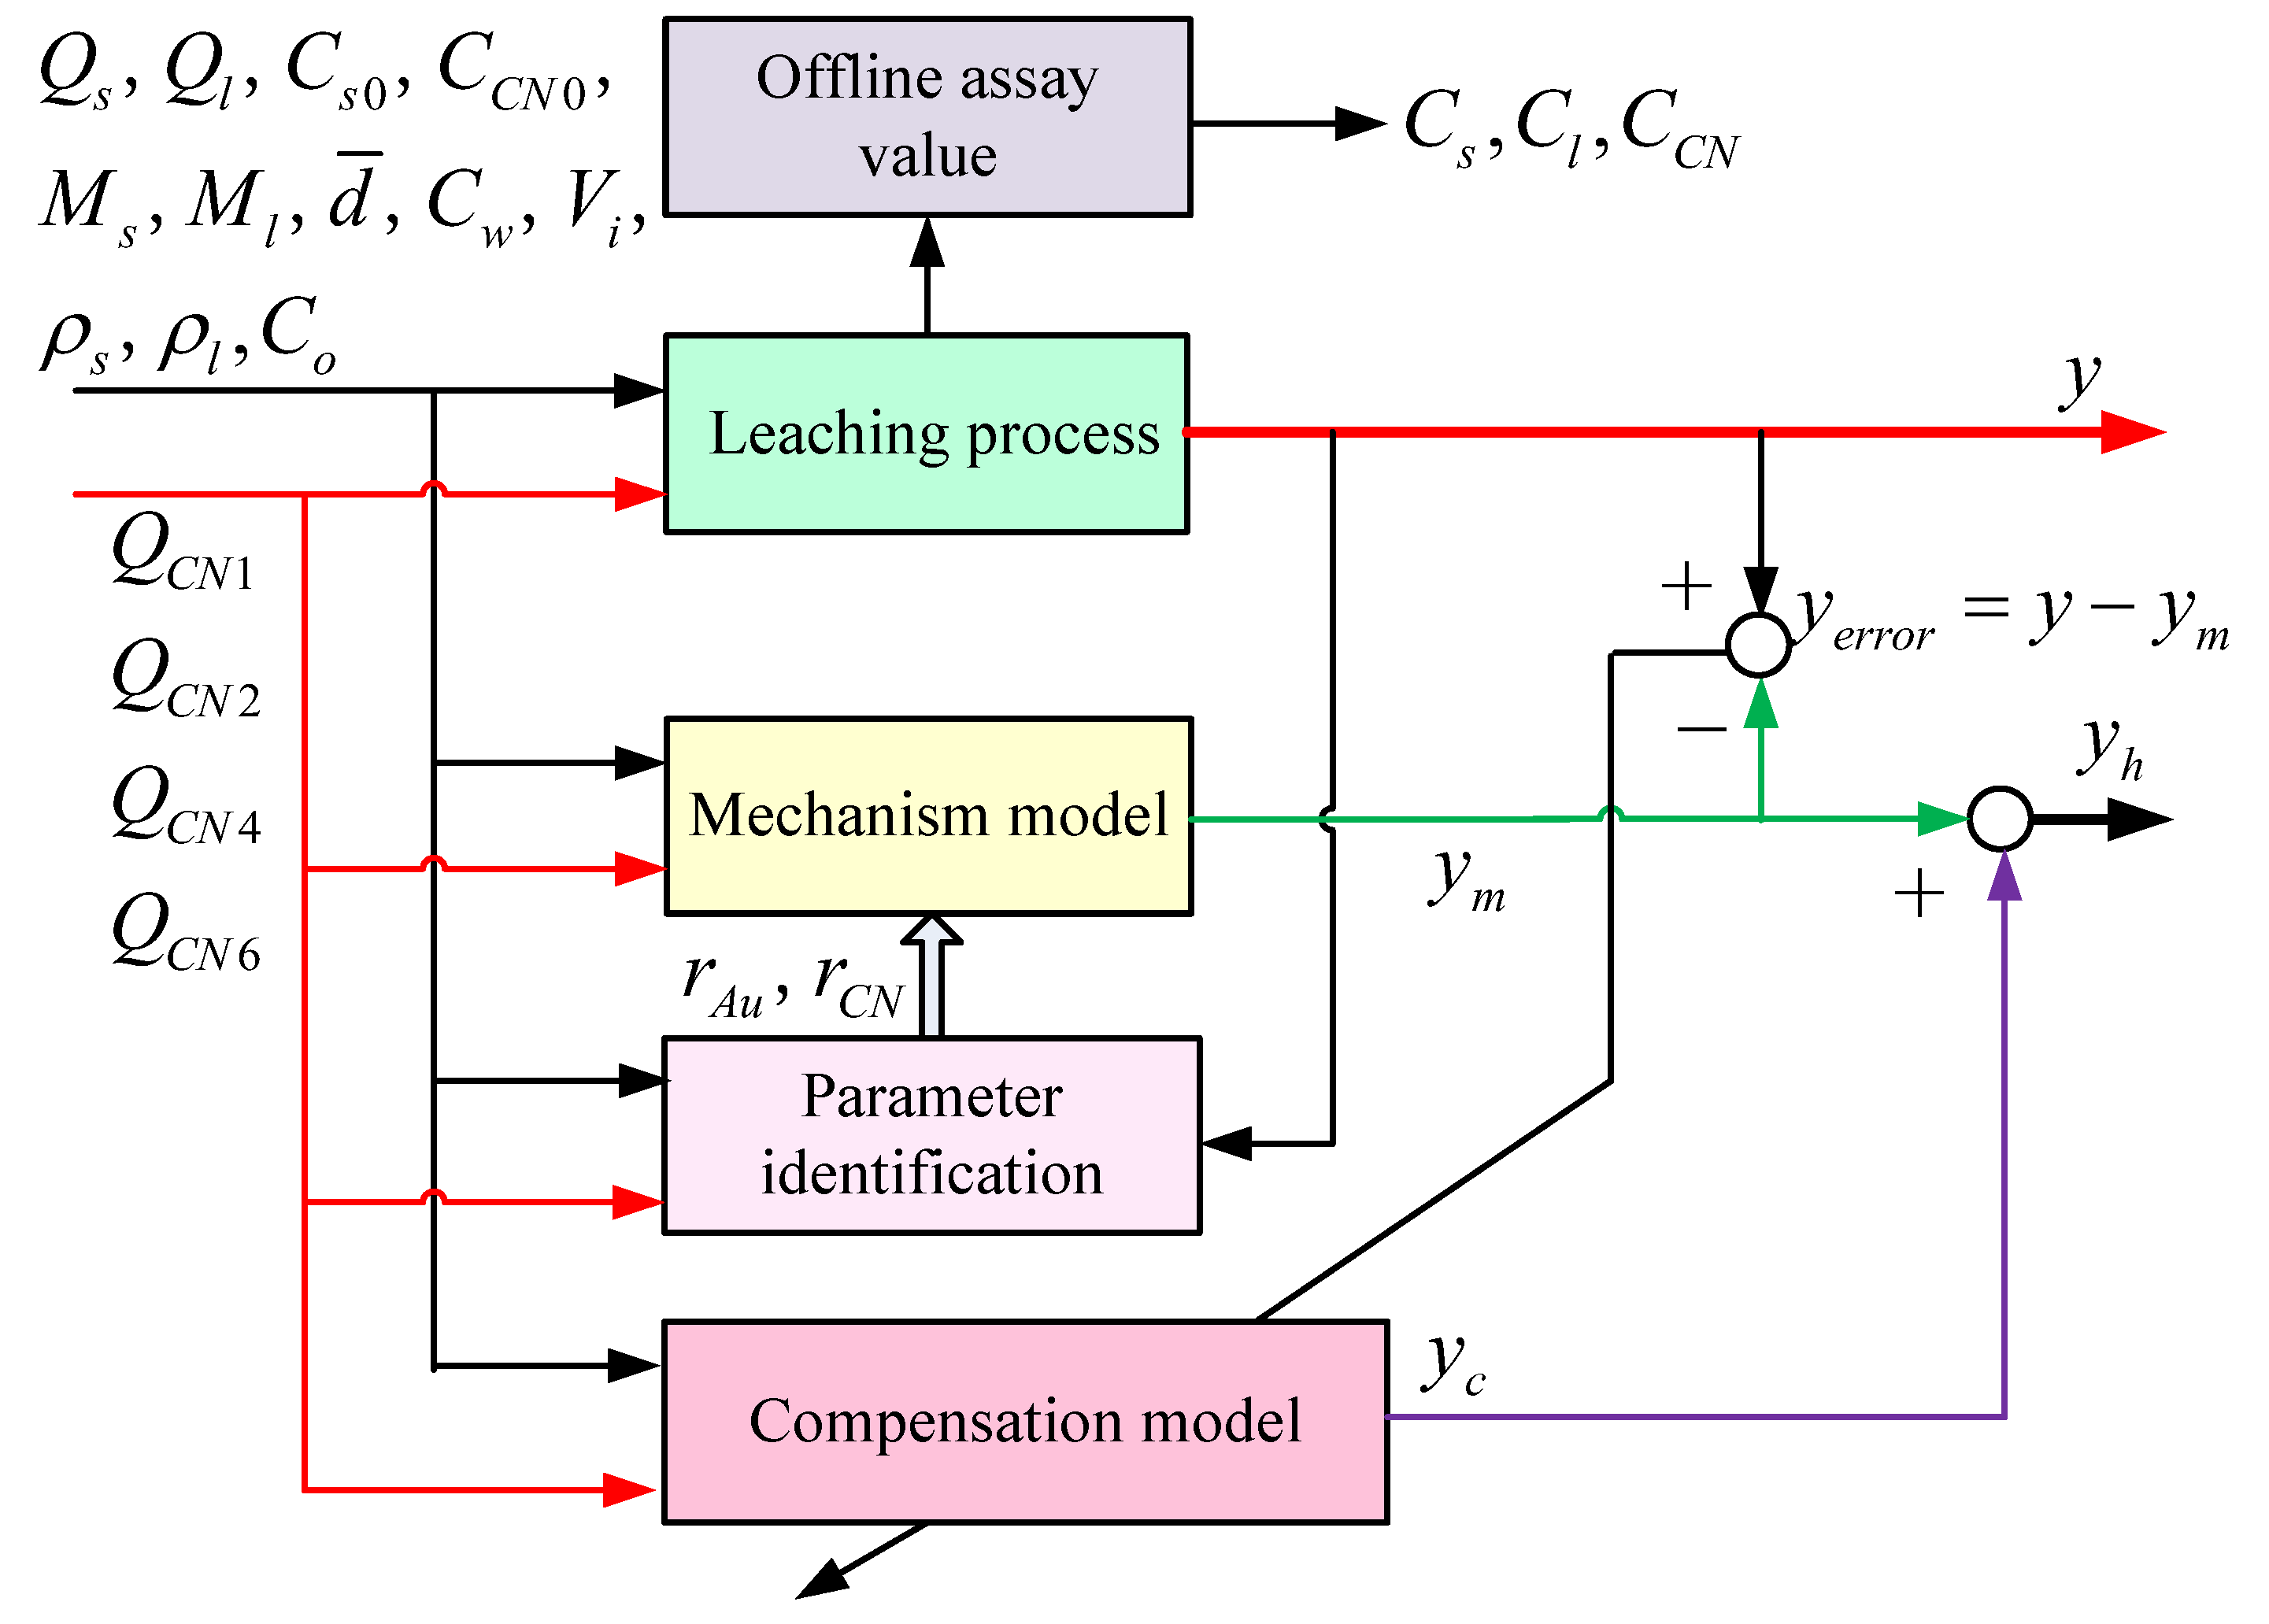
The mechanism model parameters of the system can be obtained by the optimization technique. However, due to the simplification in the modeling process, the prediction of the mechanism model will have a large error. Intelligent methods can be used to train the prediction errors to obtain a compensation model. The mechanism model of the leaching system is derived by rigorous mathematical operation. It can well describe the main dynamic trend in the leaching rate. However, the mechanism model cannot accurately describe all the characteristics and complex variable relationships of the actual process. When identifying the unknown parameters of the dynamic model of the leaching system, the errors caused by model structure approximation and ideal assumptions are not considered. The variation in production working conditions and random disturbances will lead to the mismatching of mechanism model parameters, which will cause a large prediction error. By mining the relationship between process data, data-driven technology can compensate for the undescribed information of the mechanism modeling method. A data-driven model is used to compensate for the output error caused by the unmodeled dynamic of the leaching system, and the hybrid model can be established. Due to the bad operating environment of the leaching process, there may be no abundant good data for network training. Therefore, the general neural network methods cannot easily obtain good error compensation results. Considering that the LSTM neural network can assign different weights to memory information by using the forget gate, this operation can weaken the adverse effects of data dispersion and dead zone cutoff on network learning. Considering the characteristics of the gold cyanidation leaching system, the parallel hybrid model is constructed by utilizing the LSTM neural network and the mechanism model, as shown in Figure 5. The data model based on an LSTM neural network compensates for the mechanism model output error. The LSTM neural network uses the prediction error between the mechanism model output and the system output to train the network and obtain the error compensation output . The hybrid model output can be expressed as .
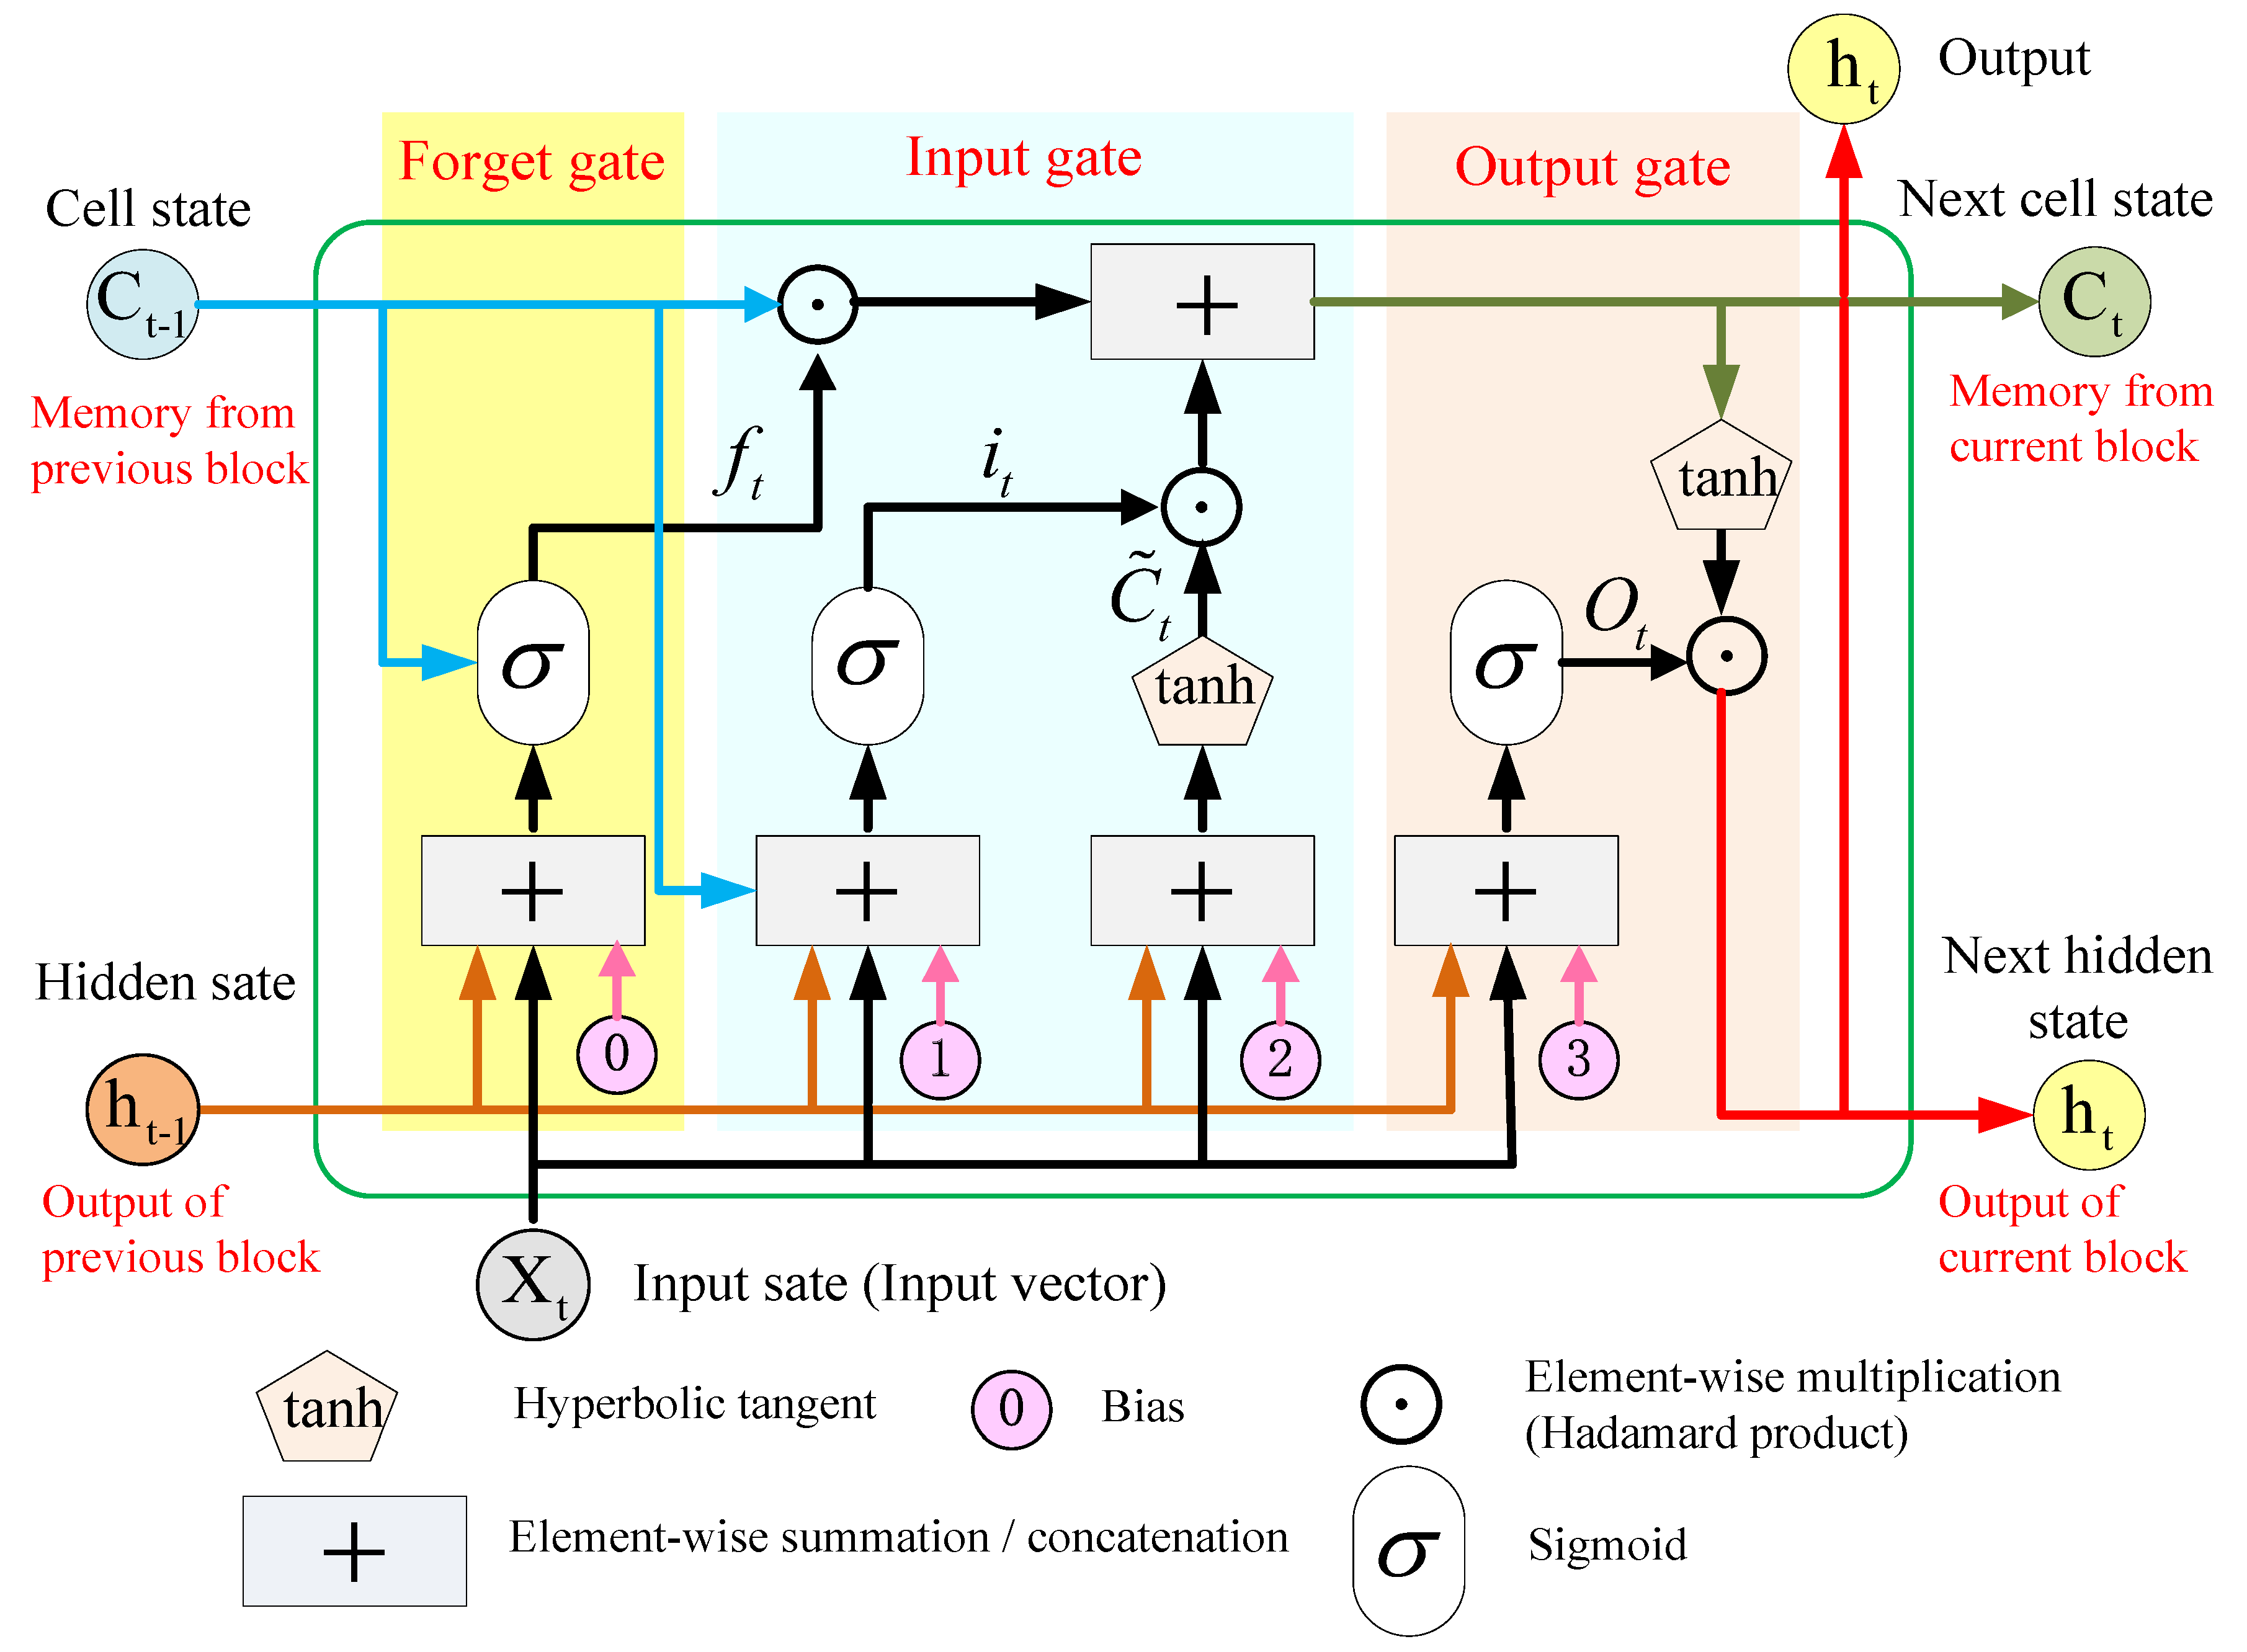
The gating state of the LSTM neural network consists of a sigmoid layer and a pointwise multiplication operation. The Sigmoid layer normalizes the input signal to determine the retained information. The pointwise multiplication operation is to multiply the input data dimension-by-dimension. This operation can protect the original dimension of the data from being destroyed and ensure the composability of the output results of each gate. The LSTM neural network uses input, forgetting, and output gates to protect and control the cell state and transmission state. The input gate normalizes the information of the previous hidden state and the current input information. The forgetting gate solves the gradient attenuation problem by assigning different weights to the control information and transferring the past information to the present moment. The output gate outputs the current hidden state and passes it to the next layer. The LSTM neural network gate structure is shown in Figure 6, where is the batch data with samples and dimensions at time ; is the hidden state at the previous moment; is the learning weight parameter; represents the operation of multiplying by the corresponding element, i.e., the Hadamard product; is the sigmoid function with a range of [0, 1]; and is a hyperbolic tangent function with a range [−1, 1].
The hidden layers of the LSTM network not only transmit feedforward information but also transmit internal feedback information. The LSTM network can take into account not only current information but also historical useful information. The LSTM network controls the transmission state through the gating state so that the network can remember the information which needs to be remembered for a long time and forget the unimportant information. The LSTM uses constant error flow to solve the problem of gradient disappearance and gradient explosion in time-series data training. The information propagation of the LSTM neural network mainly consists of forward propagation and error backward propagation. Through forward propagation and error backward propagation, each gating unit obtains the optimal weight matrix, bias matrix, and error information proportion according to the cost function. The output layer outputs the training results, which mainly consist of matrix linear transformation and normalization function. The schematic diagram of the single-layer LSTM neural network is shown in Figure 7.
The number of hidden layer nodes has a great influence on the training and compensation of an LSTM neural network. If the number of hidden nodes is too few, the learning and information processing capability of the network will be reduced. If the number of hidden layer nodes is too many, it will more easily fall into the local extremum, increasing the complexity of the network structure and reducing the speed of network learning. The optimal number of hidden layer nodes can be determined by
where is the number of modes; is the number of nodes at the input layer; and is the number of nodes at the output layer. The network node parameters used in this study are given in Table 1.
In general, the number of hidden layer nodes can be specified as one hundred, which can satisfy the accuracy requirements. To prevent gradient explosions, the gradient threshold can be taken as one. Network convergence can be promoted by reducing the learning rate when network training reaches half times. The cost function of the network is constructed by the mean square error (MES) approach. The optimization method ‘Adam’ is used to solve the problem [36]. Adam can ensure that each network weight maintains the same learning rate and can be adjusted separately. The adaptive learning rate of different parameters is calculated by the first and second moments of the gradient. Adam is the combination of the root mean square propagation and adaptive momentum algorithms, and its weight update formula is
where is the number of iterations; is the learning rate and can be taken as ; is a small constant to increase data stability and can be taken as ; is the exponential moving mean of the gradient, obtained from the first moment of the gradient; and is the square gradient, obtained by the second moment of the gradient. The update formula and are
where is the gradient of the objective function; is a modification of ; is a modification of .
where and are the constants that control exponential decay. In this paper, the optimization method parameters of Adam are those given in Table 2.
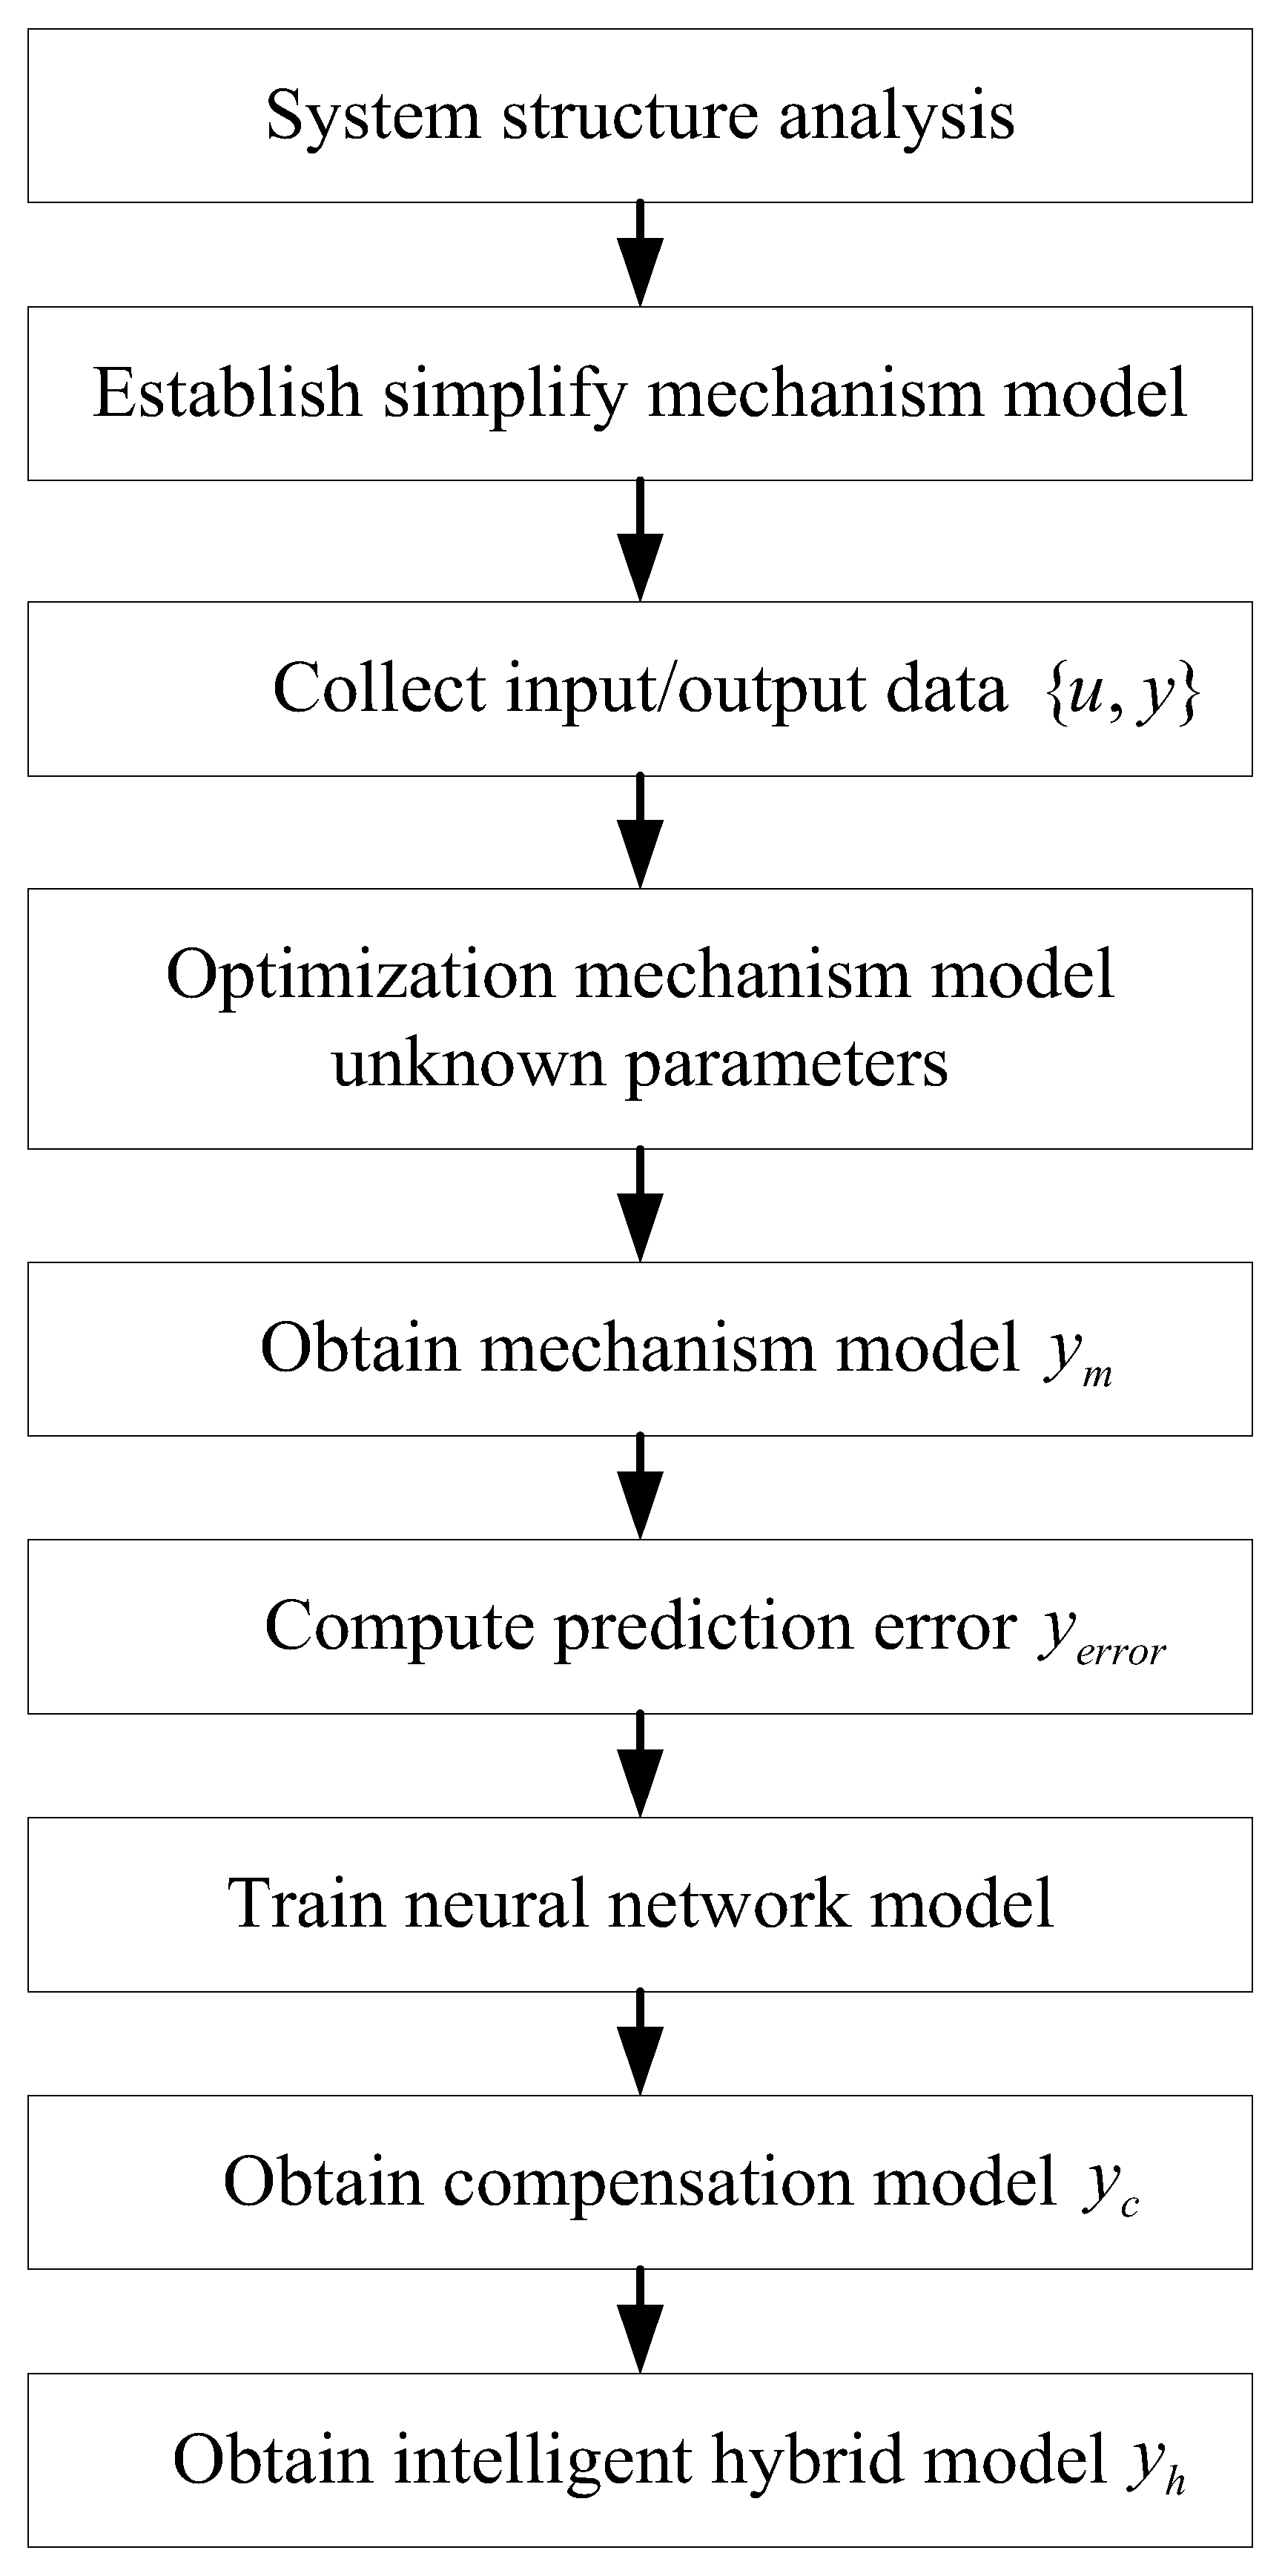
The prediction performance of the time series can be improved by improving data training correspondence. The corresponding step size of historical data at each point is increased and an autoregressive form is used to improve the prediction performance. A sliding window prediction algorithm is proposed based on the LSTM neural network. The prediction of a single point data corresponding to is modified to use adjacent historical data corresponding to for prediction output. It should be noted that the sampled data of the actual system may contain noise and disturbance, which need to be cleaned and processed. It may be necessary to design specific test experiments to obtain the data that can fully reflect the system performance to improve the performance of the training network and the model prediction precision. The flowchart of the proposed hybrid intelligent modeling strategy is shown in Figure 8.
7. Experimental Verification
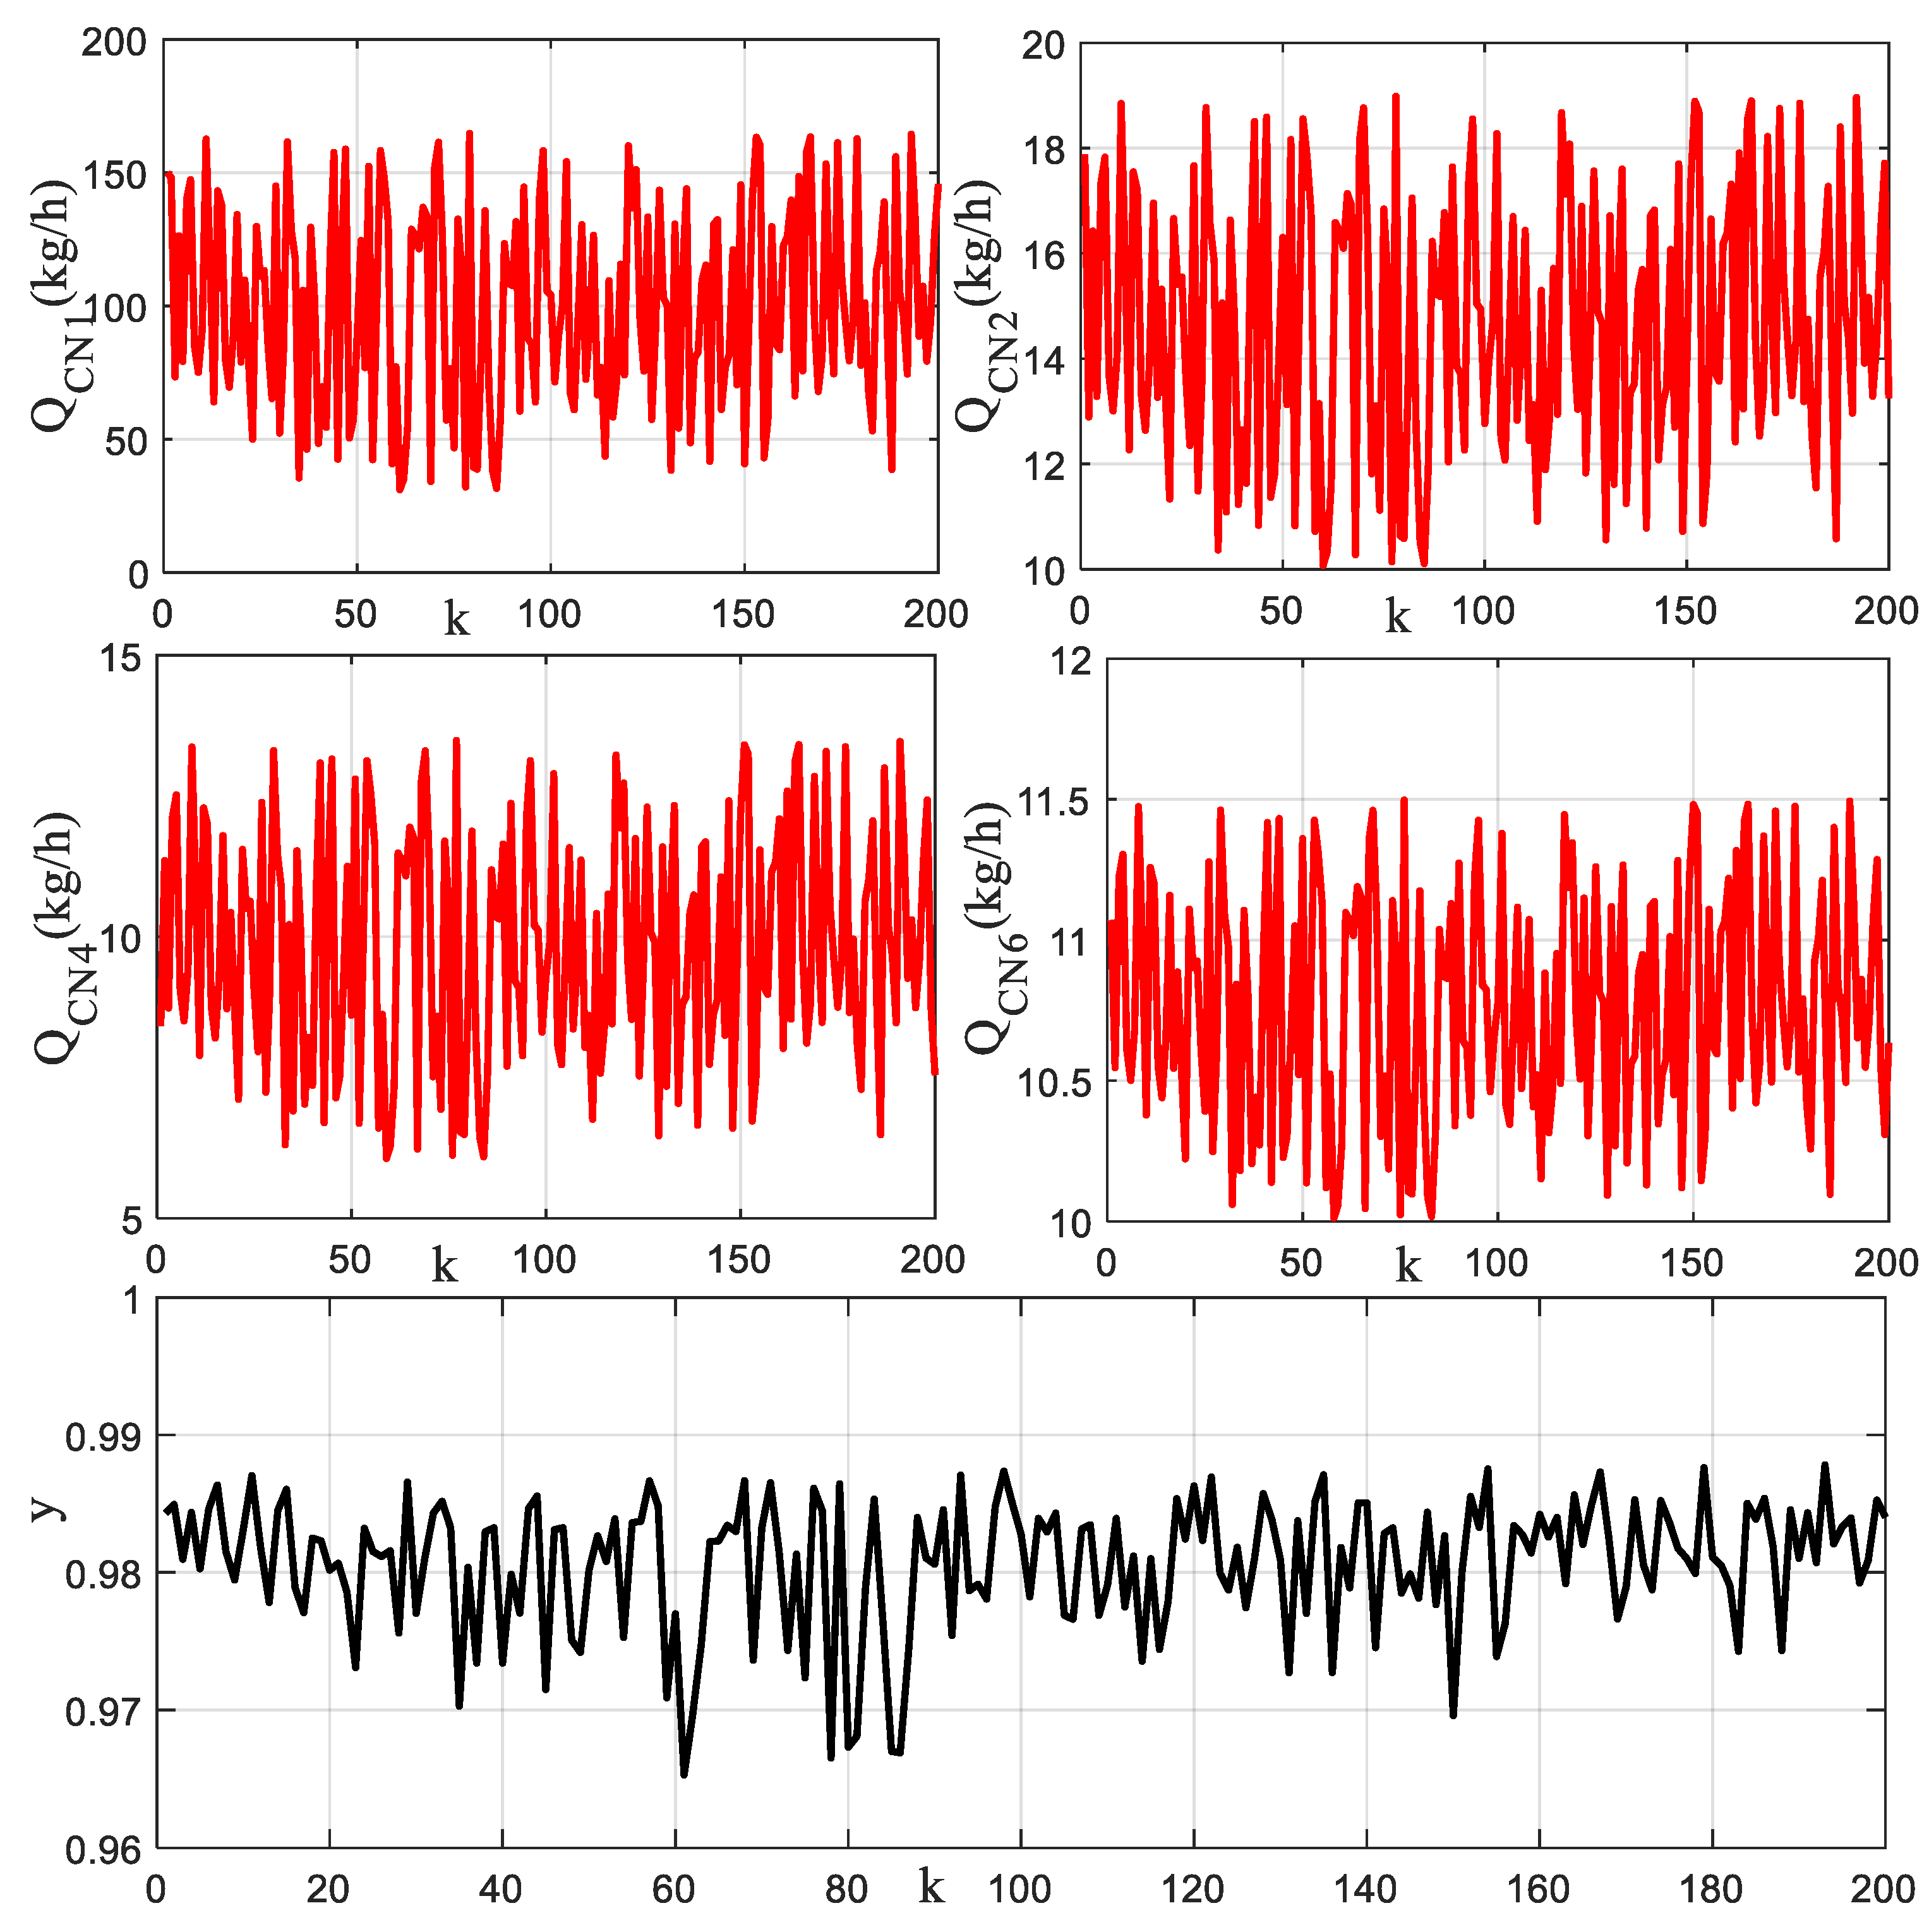
In order to verify the prediction performance of the proposed mechanism model, parameter optimization method, and hybrid model, a cascade leaching system is used for practical application tests. The variables and parameter values involved in the mechanism model are shown in Table 3. By sampling the data between the input sodium cyanide and the output leaching rate, as shown in Figure 9, the unknown parameters in the mechanism model can be effectively optimized and determined.
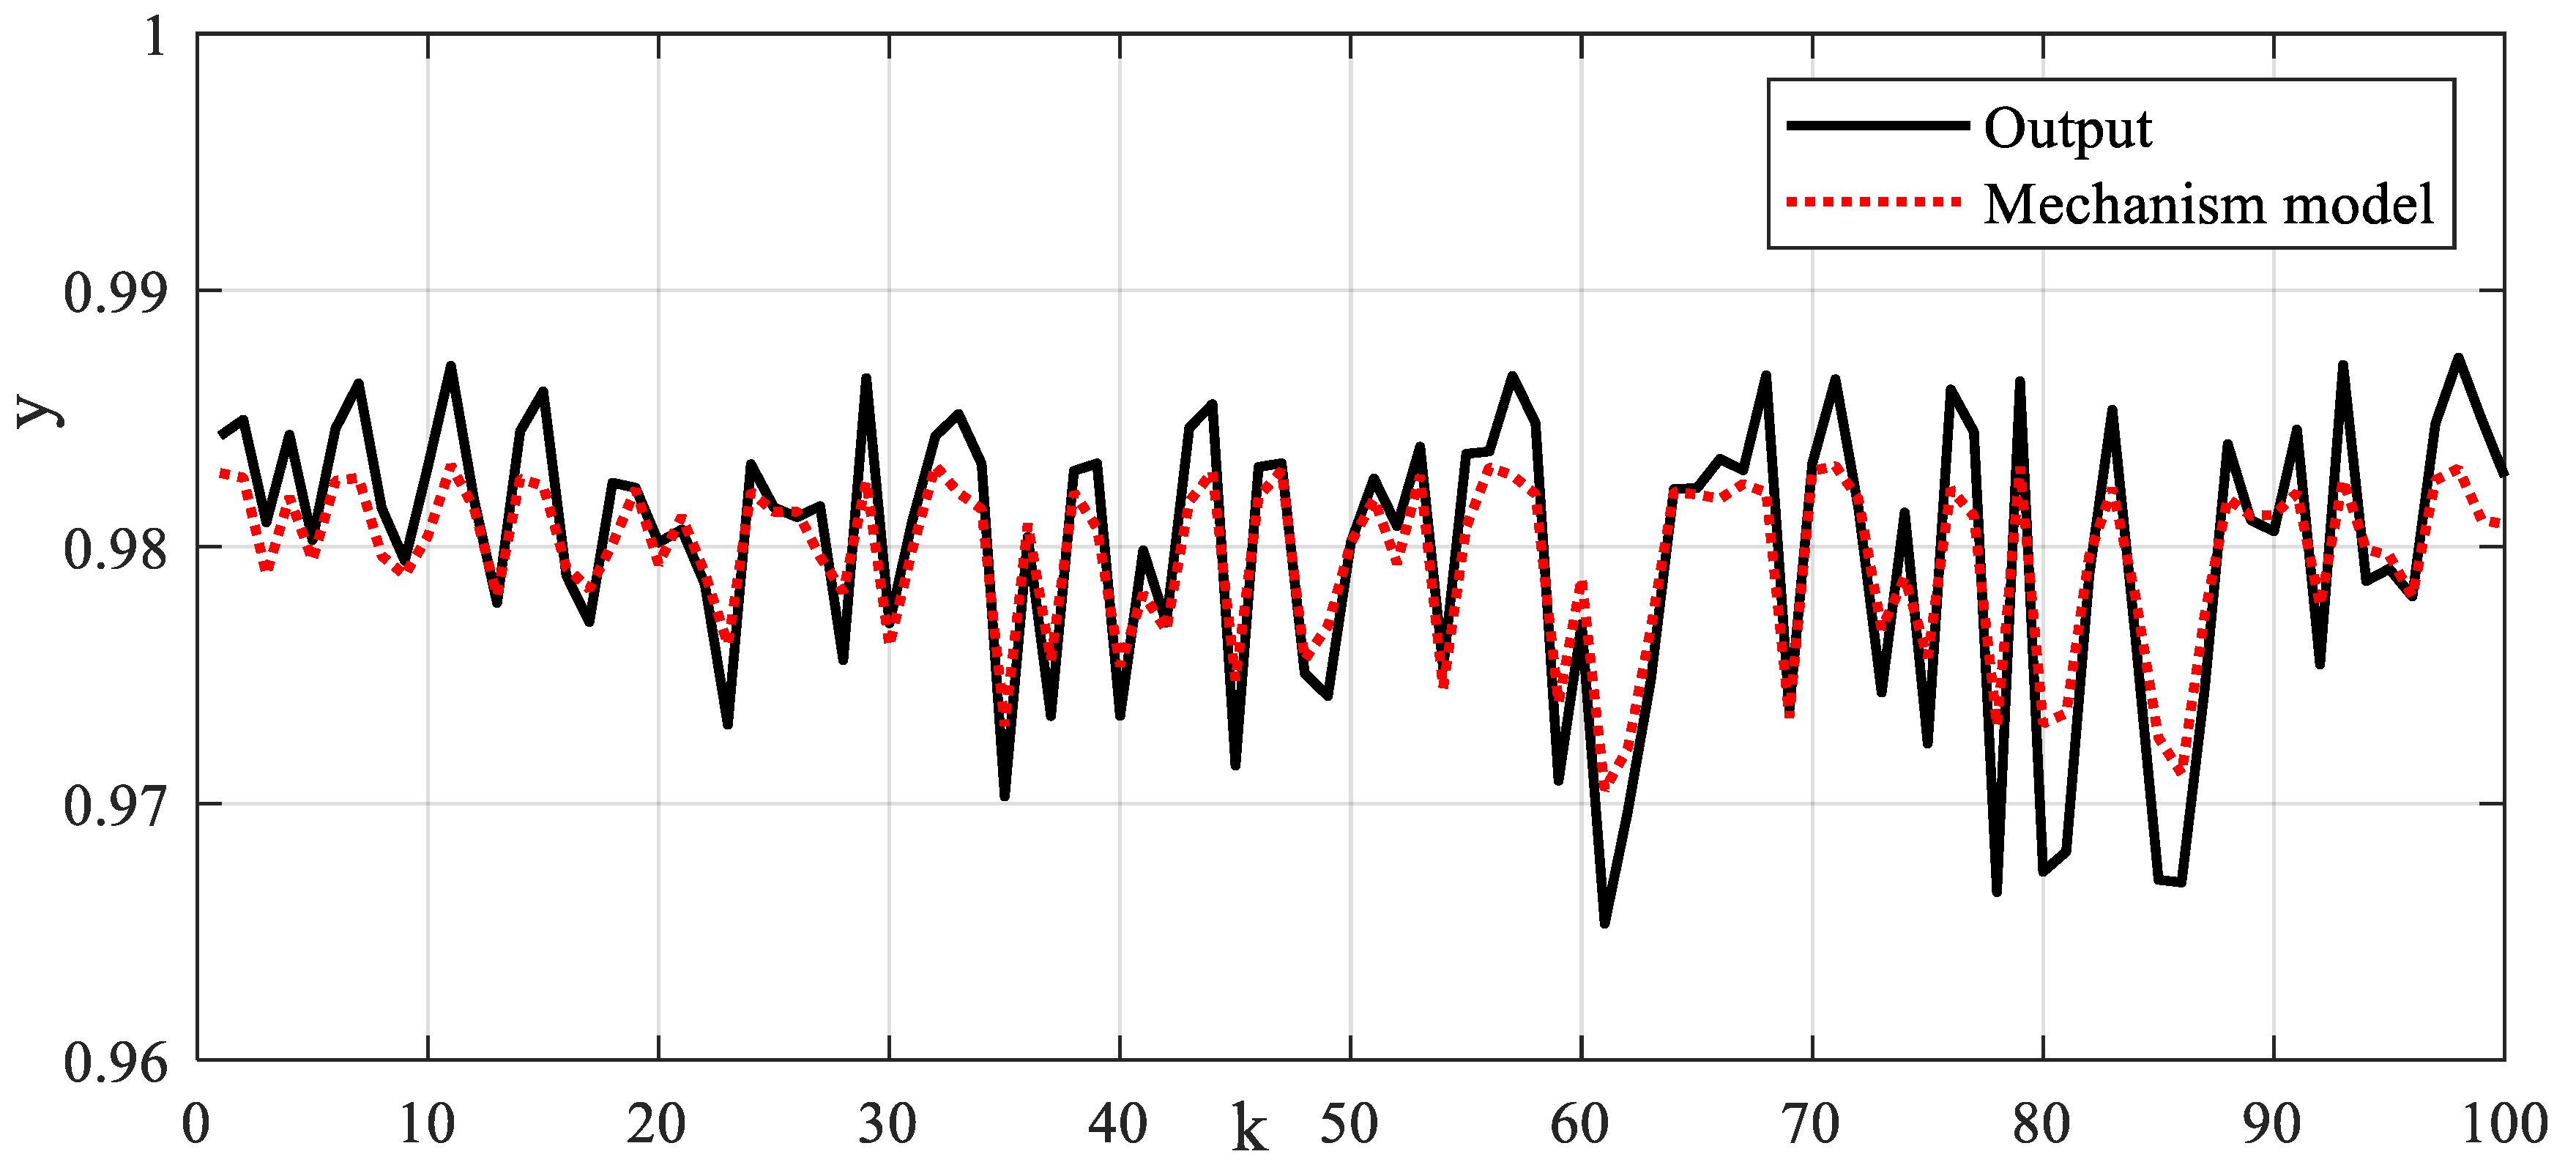
In order to identify the mechanism model’s unknown parameters, the PSO algorithm is used to solve the objective function. The dimension of the particle is taken as . The number of particles is taken as . The number of iterations is taken as . The positive learning factors are taken as and . The annealing constant is taken as . The key adjustment parameters obtained by the identification algorithm are shown in Table 4. The mechanism model can describe the main dynamic characteristics of the cascade leaching system output, as shown in Figure 10. Due to some simplifications in the process of establishing the mechanism model and the noise in the sampled data, there is a large error between the prediction output of the mechanism model and the sampling output. To improve the prediction accuracy of the model, the LSTM neural network will be used to compensate for the output error.
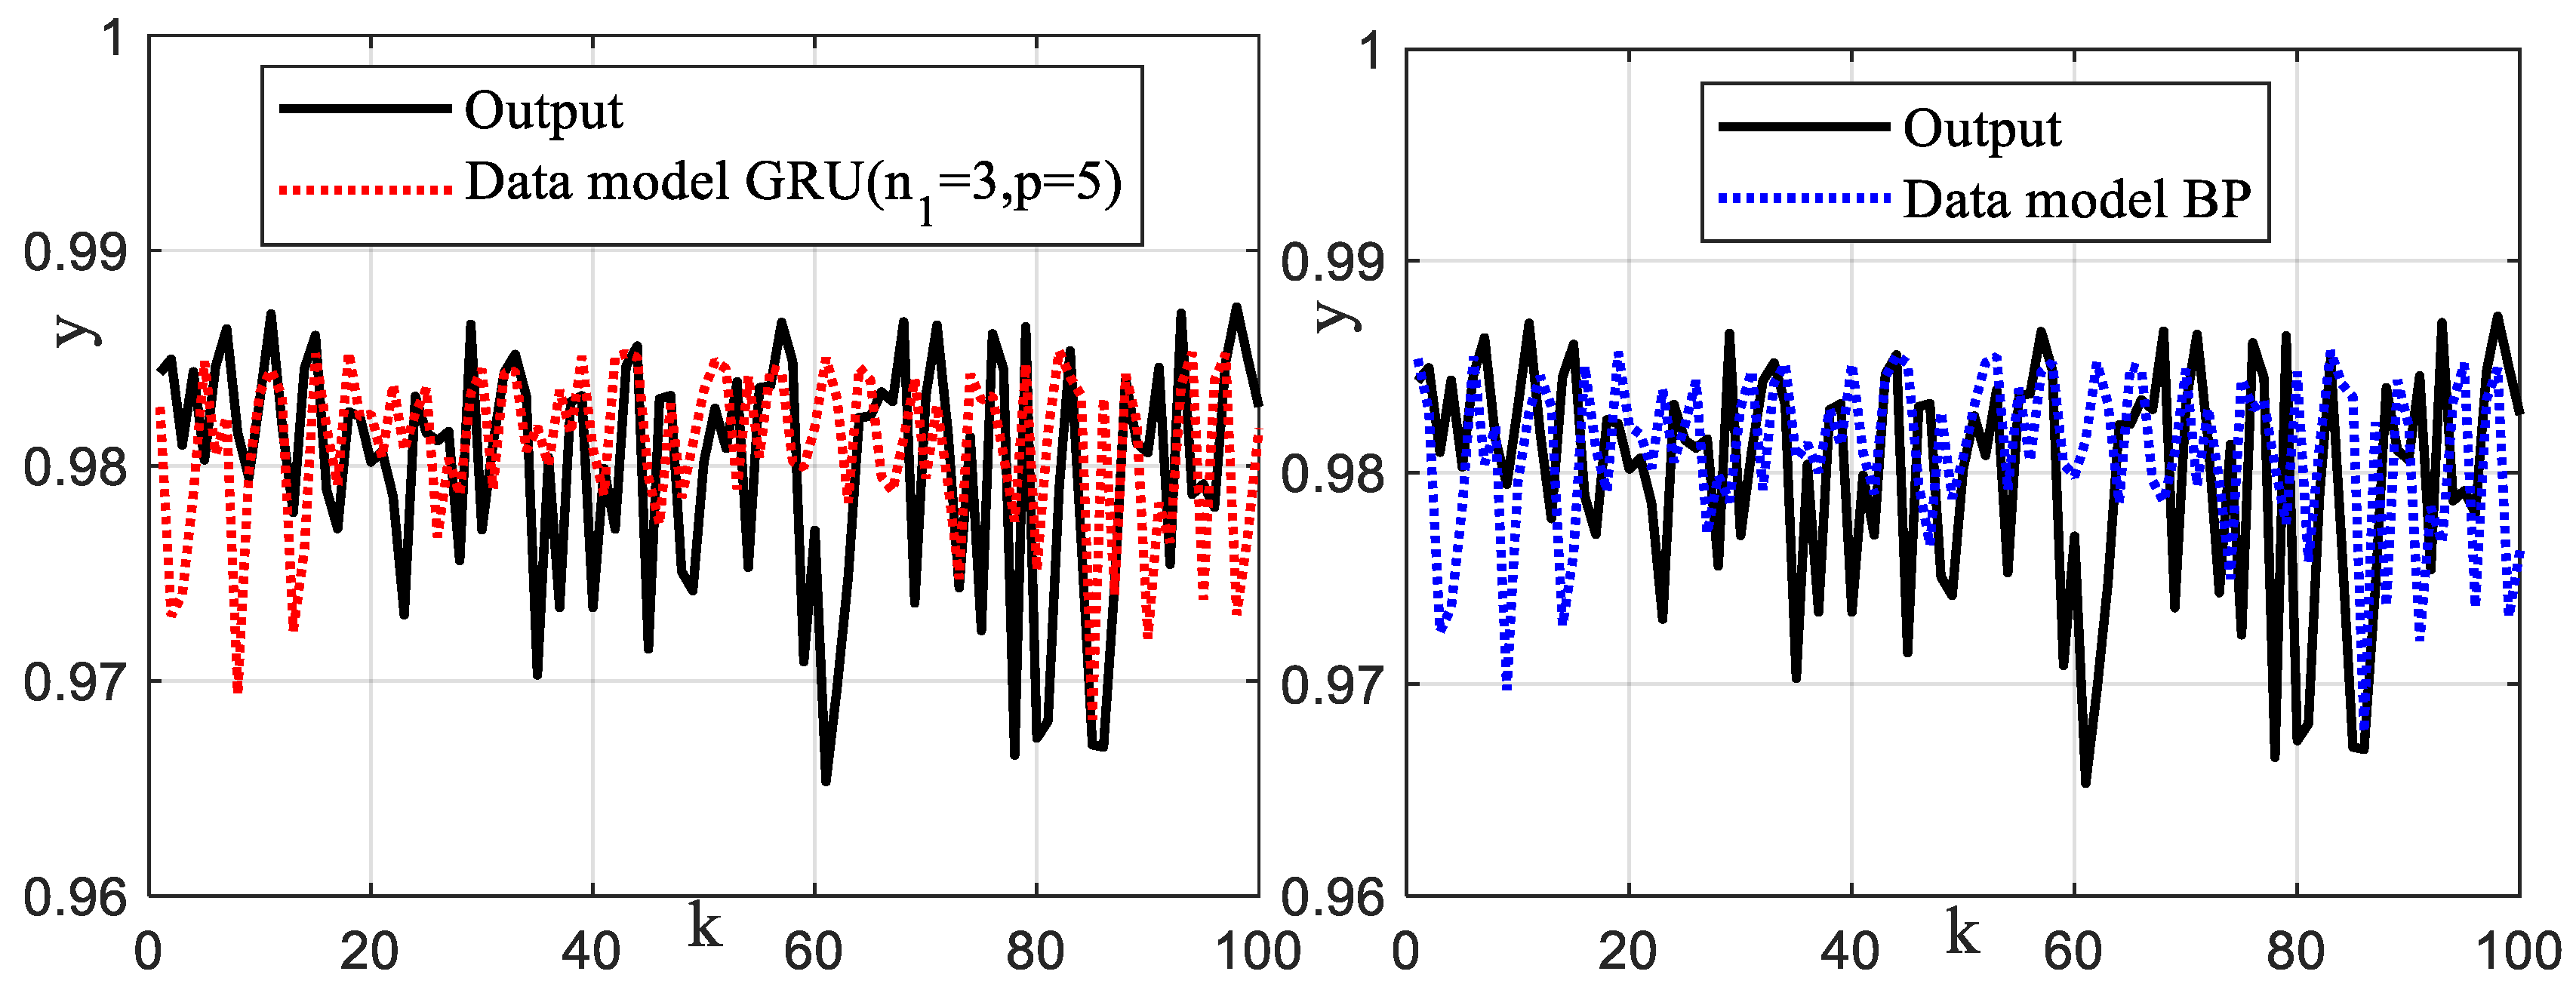
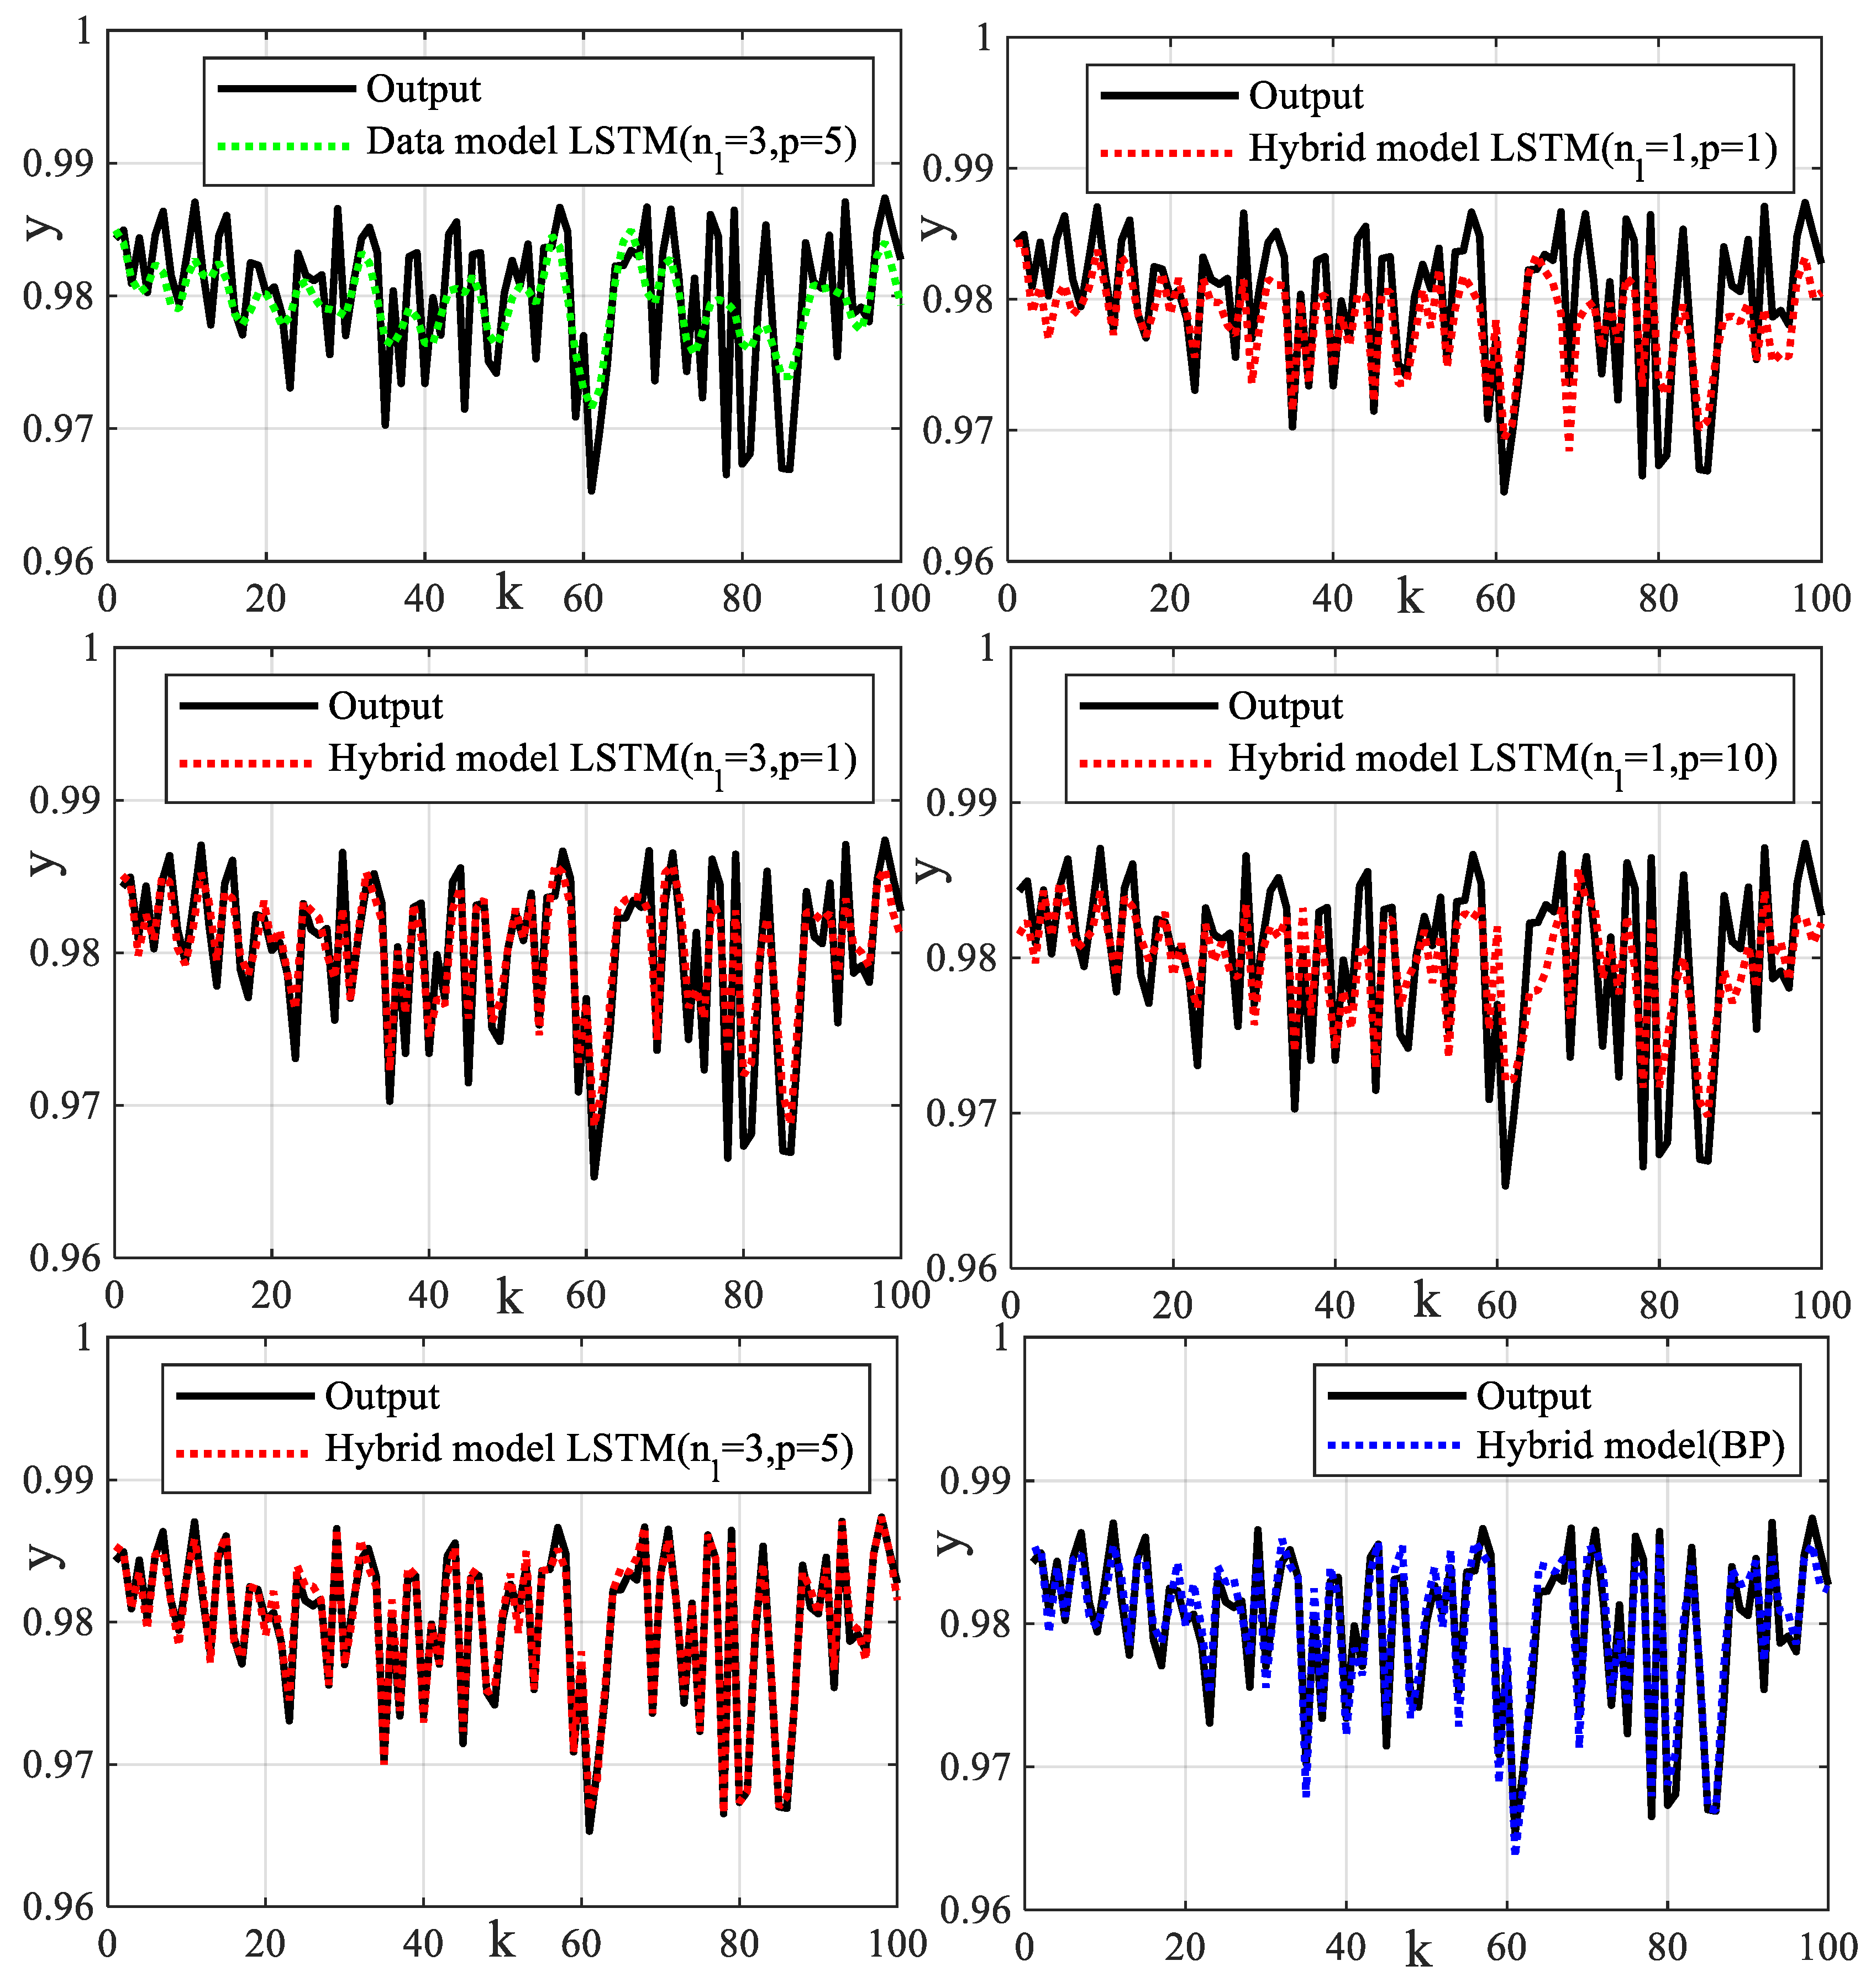
The 3000 data samples are divided into two parts. The first part contains 2000 data points and is applied to train the network. The second part contains the remaining 1000 data points and is used to test the network. Different adjacent point data are selected to form a sequential recursive relationship for estimating the output error. Different sliding window lengths () and numbers of hidden layers () are taken to construct different neural networks. For comparing the prediction performance of the proposed method, the hybrid model based on the BP neural network in the reference [37] is also tested to validate experimental data. In addition, based on the BP neural network and GRU neural network, the data-driven models without using system mechanism model information are also tested to validate experimental data respectively [38]. In order to quantitatively evaluate the prediction accuracy of different algorithms, the prediction error can be computed by . The mean of the prediction error is computed by . The variance of the prediction error is computed by . The output prediction results by different methods are shown in Figure 11 and Figure 12. The means and variances of the prediction errors by using different data-driven modeling methods are shown in Table 5. The means and variances of the prediction errors by using different hybrid modeling methods are shown in Table 6. Note that to more clearly display the input and output data and the estimates of the different leaching process models, only a portion of the data is shown in these figures. The X-axis represents the number of samples taken by a discrete computer sampling system. If the is multiplied by the sampling interval, it will represent the system sampling time. But when computing the prediction error, all the sampled data is used. The cross-validation results show that the hybrid models have better prediction results than the mechanism model and data models. The compensation error based on the LSTM neural network is smaller than that of the BP neural network and the GRU neural network. For signals with fast amplitude changes, the multilayer LSTM neural network has better prediction results. Since the BP neural network has no time-series operation, the BP network only trains the input data at the current moment, without considering the useful information of the input data at the previous moment. The BP network uses the gradient descent method to train the network. The weights of the BP neural network easily obtain local minima, which causes the termination of the training without obtaining the global optimal solution. Since the discrete distribution of the output data is large, it is difficult to train the BP neural network effectively. The data-driven models established based on the BP network and the LSTM network have poor extrapolation adaptability and large output prediction error. Since the forget gate of the LSTM neural network can assign different weights to memory information, the adverse effects of data dispersion and dead zone cutoff on network learning are weakened, so the hybrid model with a sliding window based on the LSTM neural network has a smaller estimation variance and higher estimation stability. It can be seen that, as the number of hidden layers of the LSTM increases, the error compensation effect is better. As the sliding window length increases, the compensation effect also becomes better. However, when the sliding window length increases to a certain amount, the compensation effect will be reduced due to the transitional memory of the previous data. The hybrid model based on a three-layer LSTM neural network with sliding window length () has achieved a good compensation effect for the cascade leaching system. We can see that the cascade leaching process is a complex system of gold hydrometallurgy, involving many links, equipment, and operating variables. The hybrid modeling technique combines the mechanism analysis technique, intelligent optimization technique, and neural network data-driven modeling technique. Many of the latest algorithms are used in the experimental comparison test.
8. Conclusions
A hydrometallurgical leaching system with the serial connection of several leaching tanks is characterized by strong coupling, nonlinearity, and different reaction rates. According to the principles of physics and chemical reactions and the principles of mass conservation, a mechanism model has been established to reflect the dynamic characteristics of the cascade leaching system. The mechanism model mainly consists of the gold conservation equation, cyanide ion conservation equation, and the related kinetic reaction velocity equation. The reaction rate model parameters are not the same due to the different working environments of leaching tanks. The particle swarm optimization algorithm based on a simulated annealing strategy has been used to estimate the key adjusting parameters in the gold dissolution rate model and the cyanide ion consumption rate model. There are some ideal assumptions and simplifications in the process of mechanism modeling. The variation in production conditions and random disturbances can cause parameter mismatch in the mechanism model and large prediction errors. The LSTM neural network is used to mine complex relationships between process data. The output errors caused by the unmodeled dynamics of the mechanism model are trained and compensated using the LSTM approach. An intelligent hybrid model of the cascade leaching system has been established. The hybrid model of the leaching system is convenient to analyze the dynamic characteristics and understand the influence of input variables on the leaching rate. The hybrid model facilitates designing controllers and monitoring process operation, and also provides a scientific basis for new process development. Finally, the effectiveness and superiority of the proposed hybrid modeling algorithm are verified by comparison with existing methods based on the data sampled from the cascade leaching industrial process. The proposed modeling techniques and frameworks can also be optimized using other intelligent optimization algorithms with better performance and the latest data-driven modeling techniques. Note that when the proposed modeling technique is extended to other industrial systems, it will be necessary to establish a mechanism model reflecting the main dynamics of the system, and sufficient data training prediction errors are also required in data compensation modeling. Otherwise, the establishment model will contain prediction errors.
Author Contributions
Conceptualization, S.D., Y.Z. and X.Z.; methodology, X.Z.; software, S.D.; validation, S.D. and X.Z.; formal analysis, X.Z.; investigation, Y.Z.; resources, X.Z.; data curation, S.D.; writing—original draft preparation, Y.Z. and X.Z; writing—review and editing, X.Z.; visualization, S.D.; supervision, Y.Z.; project administration, Y.Z. and X.Z.; funding acquisition, S.D. All authors have read and agreed to the published version of the manuscript.
Funding
The work was supported by the Jiangsu Provincial Natural Science Foundation of China under Grant No. BK20210493 and the Key Laboratory of Intelligent Textile and Flexible Interconnection of Zhejiang Province under Grant No. ZD03.
Data Availability Statement
The data that support the findings of this study are available from the corresponding author, Shijian Dong ([email protected]), upon reasonable request.
Conflicts of Interest
The author declares no conflict of interest.
Nomenclature
| Variable | Terminology |
| A1 | cathode region (negative electrode) |
| A2 | anode region (positive electrode) |
| Nengst interface layer thickness | |
| total surface area of metal in contact with water | |
| dissolution rate of gold | |
| initial cyanide-ion concentration in the liquid (mg/kg) | |
| cyanide-ion concentration in the liquid (mg/kg) | |
| initial gold concentration in the liquid (mg/kg) | |
| gold concentration in the liquid (mg/kg) | |
| oxygen concentration in the liquid (mg/kg) | |
| initial gold grade in the ore (mg/kg) | |
| gold grade in the ore (mg/kg) | |
| residual gold grade in the ore (mg/kg) | |
| solid concentration in the pulp (kg/kg) | |
| average size of the ore particles () | |
| liquid holdup in the tank (kg) | |
| ore holdup in the tank (kg) | |
| cyanide flow rate added into the tank (mg/h) | |
| liquid flow rate into the tank (kg/h) | |
| ore flow rate into the tank (kg/h) | |
| dissolution rate of gold in the tank [mg/(kg h)] | |
| consumption rate of cyanide in the tank [mg/(kg h)] | |
| time (h) | |
| net volume of the tank reactor () | |
| average residence time of chemical reaction | |
| solid density of ore pulp | |
| liquid density of ore pulp | |
| leaching rate of gold | |
| total leaching rate of the cascade leaching system | |
| solid gold concentration of the leaching tank. | |
| velocity update formulas of particle | |
| position update formulas of particle | |
| dimension of the particle | |
| & | positive learning factors (or acceleration coefficients) |
| velocity compression factor | |
| fitness of particle | |
| group optimal solution | |
| prediction error | |
| .. | mechanism model output |
| system output | |
| error compensation output | |
| hybrid model output | |
| batch data with samples | |
| dimensions at time | |
| hidden state at the previous moment | |
| learning weight parameter | |
| operation of multiplying by the corresponding element | |
| sigmoid function with a range of [0, 1] | |
| hyperbolic tangent function with a range [−1, 1]. | |
| number of modes | |
| number of nodes at the input layer | |
| number of nodes at the output layer | |
| weight of neural network | |
| learning rate | |
| a small constant to increase data stability | |
| exponential moving mean of the gradient | |
| square gradient | |
| gradient of the objective function | |
| & | constants that controls exponential decay |
References
- Le, M.N.; Lee, M.S. A review on hydrometallurgical processes for the recovery of valuable metals from spent catalysts and life cycle analysis perspective. Miner. Process. Extr. Metall. Rev. 2021, 42, 335–354. [Google Scholar] [CrossRef]
- Feketa, P.; Schaum, A.; Meurer, T. Distributed Parameter State Estimation for the Gray–Scott Reaction-Diffusion Model. Systems 2021, 9, 71. [Google Scholar] [CrossRef]
- Jia, R.; You, F. Multi-stage economic model predictive control for a gold cyanidation leaching process under uncertainty. AIChE J. 2021, 67, e17043. [Google Scholar] [CrossRef]
- Marzoughi, O.; Li, L.; Pickles, C.; Ghahreman, A. Regeneration and sulfur recovery of Lanxess Lewatit AF 5 catalyst from the acidic Albion leaching process using toluene and tetrachloroethylene as organic solvents. J. Ind. Eng. Chem. 2022, 107, 291–301. [Google Scholar] [CrossRef]
- Panda, R.; Dinkar, O.S.; Kumari, A.; Gupta, R.; Jha, M.K.; Pathak, D.D. Hydrometallurgical processing of waste integrated circuits (ICs) to recover Ag and generate mix concentrate of Au, Pd and Pt. J. Ind. Eng. Chem. 2021, 93, 315–321. [Google Scholar] [CrossRef]
- Zhang, J.; Tan, Y.; Li, S.; Wang, Y.; Jia, R. Comparison of alternative strategies estimating the kinetic reaction rate of the gold cyanidation leaching process. ACS Omega 2019, 4, 19880–19894. [Google Scholar] [CrossRef]
- Niu, D.; Liu, X.; Liu, Y.; Jia, M. Optimization control of hydrometallurgical leaching process based on IDE-MPC. Miner. Eng. 2022, 176, 107341. [Google Scholar] [CrossRef]
- Abdelbari, H.; Shafi, K. A System Dynamics Modeling Support System Based on Computational Intelligence. Systems 2019, 7, 47. [Google Scholar] [CrossRef]
- Wang, J.; Faraji, F.; Ghahreman, A. Evaluation of ozone as an efficient and sustainable reagent for chalcopyrite leaching: Process optimization and oxidative mechanism. J. Ind. Eng. Chem. 2021, 104, 333–344. [Google Scholar] [CrossRef]
- Bi, K.; Qiu, T. An intelligent SVM modeling process for crude oil properties prediction based on a hybrid GA-PSO method. Chin. J. Chem. Eng. 2019, 27, 1888–1894. [Google Scholar] [CrossRef]
- Sansana, J.; Joswiak, M.N.; Castillo, I.; Wang, Z.; Rendall, R.; Chiang, L.H.; Reis, M.S. Recent trends on hybrid modeling for Industry 4.0. Comput. Chem. Eng. 2021, 151, 107365. [Google Scholar] [CrossRef]
- Ordoukhanian, E.; Madni, A.M. Model-based approach to engineering resilience in multi-UAV systems. Systems 2019, 7, 11. [Google Scholar] [CrossRef]
- Zhang, J.; Mao, Z.Z.; He, D.K. Real time optimization based on a serial hybrid model for gold cyanidation leaching process. Miner. Eng. 2015, 70, 250–263. [Google Scholar] [CrossRef]
- Hua, F.; Fang, Z.; Qiu, T. Application of convolutional neural networks to large-scale naphtha pyrolysis kinetic modeling. Chin. J. Chem. Eng. 2018, 26, 2562–2572. [Google Scholar] [CrossRef]
- Sun, B.; Yang, C.; Wang, Y.; Gui, W.; Craig, I.; Olivier, L. A comprehensive hybrid first principles/machine learning modeling framework for complex industrial processes. J. Process Control 2020, 86, 30–43. [Google Scholar] [CrossRef]
- Cai, W.; Zhang, W.; Hu, X.; Liu, Y. A hybrid information model based on long short-term memory network for tool condition monitoring. J. Intell. Manuf. 2020, 31, 1497–1510. [Google Scholar] [CrossRef]
- Aguiar, H.C.; Maciel Filho, R. Neural network and hybrid model: A discussion about different modeling techniques to predict pulping degree with industrial data. Chem. Eng. Sci. 2001, 56, 565–570. [Google Scholar] [CrossRef]
- Lahiri, S.K.; Ghanta, K.C. Prediction of pressure drop of slurry flow in pipeline by hybrid support vector regression and genetic algorithm model. Chin. J. Chem. Eng. 2008, 16, 841–848. [Google Scholar] [CrossRef]
- Dai, J.; Chen, N.; Yuan, X.; Gui, W.; Luo, L. Temperature prediction for roller kiln based on hybrid first-principle model and data-driven MW-DLWKPCR model. ISA Trans. 2020, 98, 403–417. [Google Scholar] [CrossRef] [PubMed]
- Liu, Y.; Chang, Y.; Wang, F.; Niu, D.; Zhao, L. Real-time optimization compensation method based on a novel two-level multi-block hybrid model for the hydrometallurgy process. Chem. Eng. Res. Des. 2022, 177, 136–156. [Google Scholar] [CrossRef]
- Yuan, X.; Li, L.; Wang, Y. Nonlinear dynamic soft sensor modeling with supervised long short-term memory network. IEEE Trans. Ind. Inform. 2019, 16, 3168–3176. [Google Scholar] [CrossRef]
- Guo, Y.; Wang, F.; Jia, M.; Zhang, S. Parallel hybrid model for mechanical draft counter flow wet-cooling tower. Appl. Therm. Eng. 2017, 125, 1379–1388. [Google Scholar] [CrossRef]
- Yu, F.; Mao, Z.; Yuan, P.; He, D.; Jia, M. Recursive parameter estimation for Hammerstein-Wiener systems using modified EKF algorithm. ISA Trans. 2017, 70, 104–115. [Google Scholar] [CrossRef] [PubMed]
- Yan, H.; Wang, F.; He, D.; Wang, Q. An operational adjustment framework for a complex industrial process based on hybrid Bayesian network. IEEE Trans. Autom. Sci. Eng. 2020, 17, 1699–1710. [Google Scholar] [CrossRef]
- Guo, Z.H.; Wu, J.; Lu, H.Y.; Wang, J.Z. A case study on a hybrid wind speed forecasting method using BP neural network. Knowl.-Based Syst. 2011, 24, 1048–1056. [Google Scholar] [CrossRef]
- Chen, J.; Gui, W.; Dai, J.; Jiang, Z.; Chen, N.; Li, X. A hybrid model combining mechanism with semi-supervised learning and its application for temperature prediction in roller hearth kiln. J. Process Control 2021, 98, 18–29. [Google Scholar] [CrossRef]
- Hadid, B.; Duviella, E.; Lecoeuche, S. Data-driven modeling for river flood forecasting based on a piecewise linear ARX system identification. J. Process Control 2020, 86, 44–56. [Google Scholar] [CrossRef]
- Zhou, T.; Gani, R.; Sundmacher, K. Hybrid data-driven and mechanistic modeling approaches for multiscale material and process design. Engineering 2021, 7, 1231–1238. [Google Scholar] [CrossRef]
- Hinchliffe, M.; Montague, G.; Willis, M.; Burke, A. Hybrid approach to modeling an industrial polyethylene process. AIChE J. 2003, 49, 3127–3137. [Google Scholar] [CrossRef]
- Liu, S.; Xu, L.; Li, D. Multi-scale prediction of water temperature using empirical mode decomposition with back-propagation neural networks. Comput. Electr. Eng. 2016, 49, 1–8. [Google Scholar] [CrossRef]
- Narayanan, H.; Sokolov, M.; Morbidelli, M.; Butté, A. A new generation of predictive models: The added value of hybrid models for manufacturing processes of therapeutic proteins. Biotechnol. Bioeng. 2019, 116, 2540–2549. [Google Scholar] [CrossRef] [PubMed]
- Ye, L.; Miao, A.; Zhang, H. Real-time optimization of gold cyanidation leaching process in a two-layer control architecture integrating self-optimizing control and modifier adaptation. Ind. Eng. Chem. Res. 2017, 56, 4002–4016. [Google Scholar] [CrossRef]
- Wang, Z.; Wang, L.; Yuan, Z.; Chen, B. Data-driven optimal operation of the industrial methanol to olefin process based on relevance vector machine. Chin. J. Chem. Eng. 2021, 34, 106–115. [Google Scholar] [CrossRef]
- Bijan, M.G.; Pillay, P. Efficiency estimation of the induction machine by particle swarm optimization using rapid test data with range constraints. IEEE Trans. Ind. Electron. 2018, 66, 5883–5894. [Google Scholar] [CrossRef]
- Yan, Z.C.; Luo, Y.S. A particle swarm optimization algorithm based on simulated annealing. Adv. Mater. Res. 2014, 989, 2301–2305. [Google Scholar] [CrossRef]
- Chang, Z.; Zhang, Y.; Chen, W. Electricity price prediction based on hybrid model of adam optimized LSTM neural network and wavelet transform. Energy 2019, 187, 115804. [Google Scholar] [CrossRef]
- Bai, B.; Zhang, J.; Wu, X.; Zhu, G.W.; Li, X. Reliability prediction-based improved dynamic weight particle swarm optimization and back propagation neural network in engineering systems. Expert Syst. Appl. 2021, 177, 114952. [Google Scholar] [CrossRef]
- Ke, K.; Hongbin, S.; Chengkang, Z.; Brown, C. Short-term electrical load forecasting method based on stacked auto-encoding and GRU neural network. Evol. Intell. 2019, 12, 385–394. [Google Scholar] [CrossRef]
Figure 1.
Schematic diagram of cascade leaching system.

Figure 2.
Air-agitation cyanidation leaching tank reactors (Pachuca extractor).

Figure 3.
Electrochemical principle of gold cyanidation leaching system. (A1: Cathode region (negative electrode) A2: Anode region (positive electrode). : Nengst interface layer thickness).
Figure 3.
Electrochemical principle of gold cyanidation leaching system. (A1: Cathode region (negative electrode) A2: Anode region (positive electrode). : Nengst interface layer thickness).

Figure 4.
Input and output schematic diagram of cascade leaching system.

Figure 5.
Parallel hybrid model of leaching system.

Figure 6.
Gate structure of LSTM neural network (Cell unit).

Figure 7.
Schematic diagram of single-layer LSTM network.
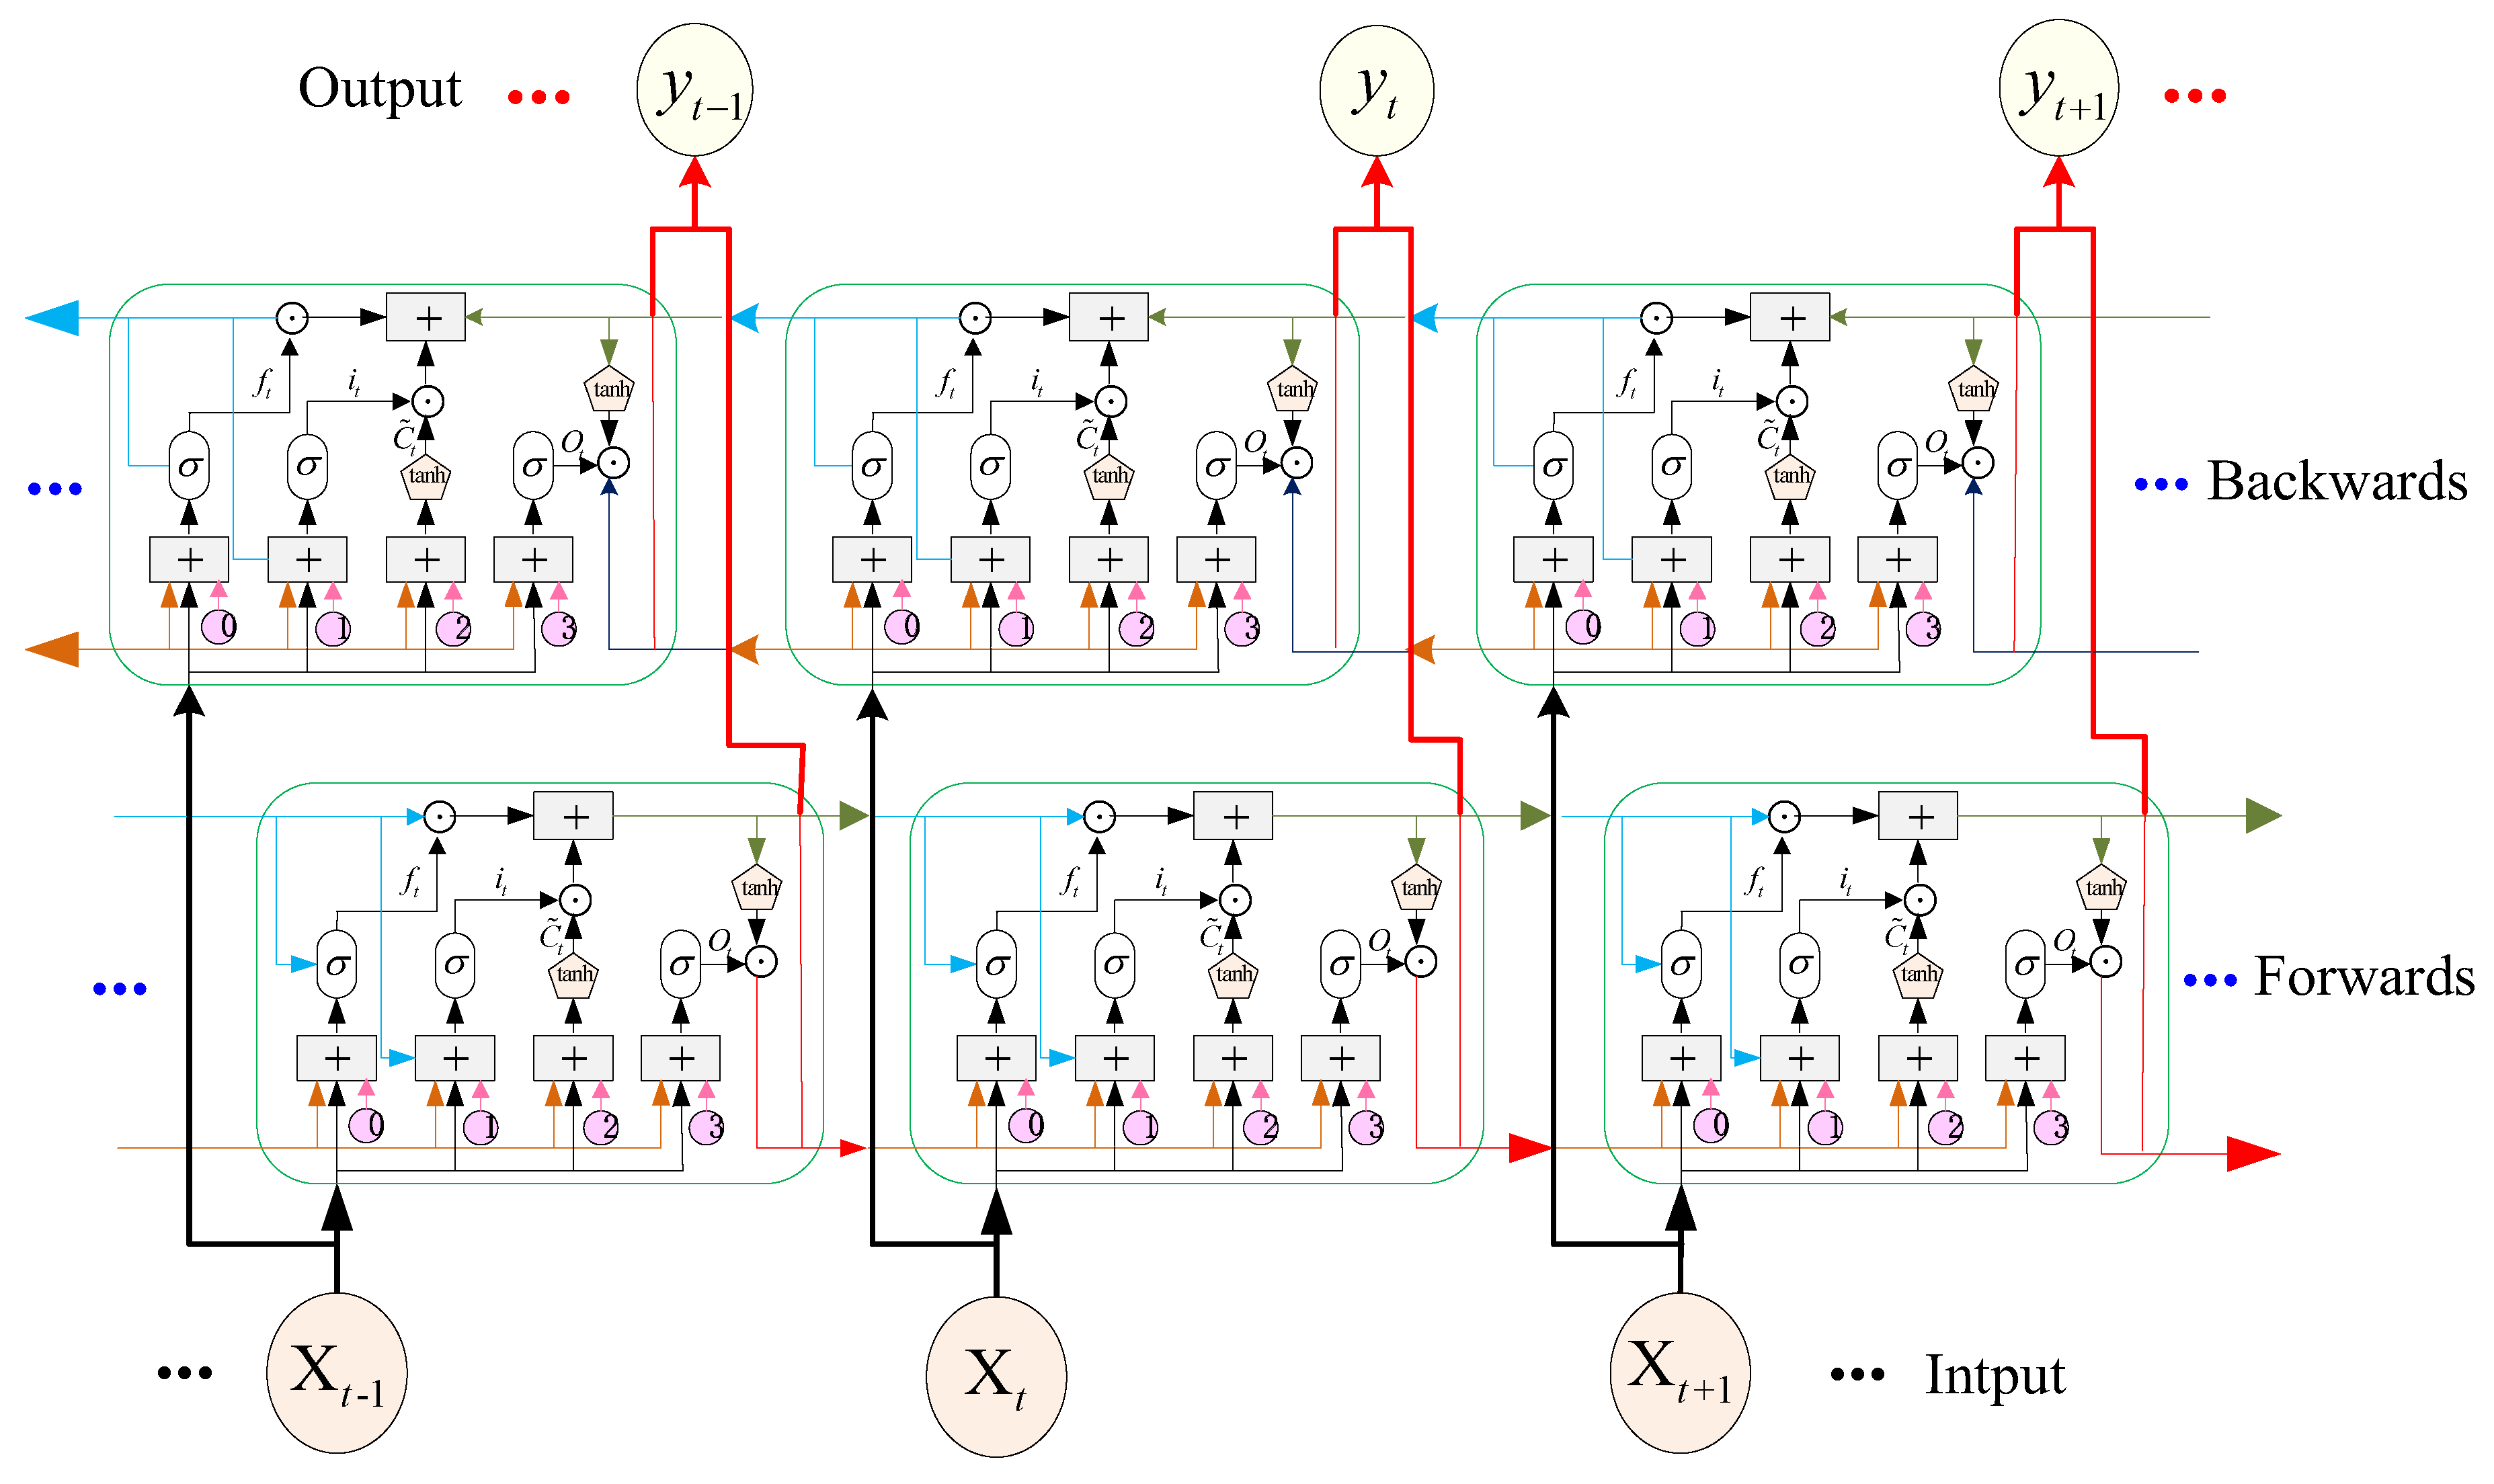
Figure 8.
Flowchart of the proposed hybrid intelligent modeling strategy.

Figure 9.
Part of the input sodium cyanide and the output leaching rate.

Figure 10.
Leaching rate prediction result based on mechanism model.

Figure 11.
Leaching rate prediction results based on the data model with BP and GRU networks.

Figure 12.
Leaching rate prediction results based on different hybrid models.


Table 1.
Network node parameters.
| 60 | 50 | 40 |
Table 2.
Parameters of Adam.
| Max Epoch | Gradient Threshold | Initial Learn Rate | Learn Rate Drop Period |
|---|---|---|---|
| 500 | 0.85 | 0.0025 | 250 |
| Learn rate drop factor | Adjustment parameter | Adjustment parameter | Small constant |
| 0.1 | 0.9 | 0.999 | 10−8 |
Table 3.
The variables and value in the mechanistic model.
| Variables | Value | Unit |
|---|---|---|
| 39 | % | |
| 0 | mg/kg | |
| 5 | mg/kg | |
| 0 | mg/kg | |
| 7 | mg/kg | |
| 80 | μm | |
| 250 | mg/kg | |
| 2500 | kg/h | |
| 68 | m3 | |
| 2.8 | g/cm3 | |
| 1 | g/cm3 |
Table 4.
Estimation of gold dissolution rate and cyanide ion consumption rate (N# means the Nth Reactor).
Table 4.
Estimation of gold dissolution rate and cyanide ion consumption rate (N# means the Nth Reactor).
| Parameter | 1# Reactor | 2# Reactor | 3# Reactor | 4# Reactor | 5# Reactor | 6# Reactor | 7# Reactor |
|---|---|---|---|---|---|---|---|
| 3.12 | 3.07 | 3.32 | 3.71 | 3.09 | 3.42 | 4.01 | |
| 1.16 | 1.02 | 1.43 | 2.22 | 2.65 | 1.49 | 2.42 |
Table 5.
Mean and variance of prediction errors by using different data modeling.
| Mechanistic Model | Data Model (LSTM) | Data Model (BP) | Data Model (GRU) | |
|---|---|---|---|---|
| Mean | 0.0021 | 0.0033 | 0.0051 | 0.0013 |
| Variance |
Table 6.
Mean and variance of prediction errors by using different hybrid modeling.
| Hybrid Model (BP) | Hybrid Model (LSTM p = 1) | Hybrid Model (LSTM N = 3 p = 1) | Hybrid Model (LSTM p = 10) | Hybrid Model (LSTM N = 3 p = 5) | |
|---|---|---|---|---|---|
| Mean | 0.0011 | 0.0029 | 0.0017 | 0.0024 | 0.0005 |
| Variance |
Disclaimer/Publisher’s Note: The statements, opinions and data contained in all publications are solely those of the individual author(s) and contributor(s) and not of MDPI and/or the editor(s). MDPI and/or the editor(s) disclaim responsibility for any injury to people or property resulting from any ideas, methods, instructions or products referred to in the content. |
© 2023 by the authors. Licensee MDPI, Basel, Switzerland. This article is an open access article distributed under the terms and conditions of the Creative Commons Attribution (CC BY) license (https://creativecommons.org/licenses/by/4.0/).
Share and Cite
MDPI and ACS Style
Dong, S.; Zhang, Y.; Zhou, X. Intelligent Hybrid Modeling of Complex Leaching System Based on LSTM Neural Network. Systems 2023, 11, 78. https://doi.org/10.3390/systems11020078
AMA Style
Dong S, Zhang Y, Zhou X. Intelligent Hybrid Modeling of Complex Leaching System Based on LSTM Neural Network. Systems. 2023; 11(2):78. https://doi.org/10.3390/systems11020078
Chicago/Turabian StyleDong, Shijian, Yuzhu Zhang, and Xingxing Zhou. 2023. "Intelligent Hybrid Modeling of Complex Leaching System Based on LSTM Neural Network" Systems 11, no. 2: 78. https://doi.org/10.3390/systems11020078
Note that from the first issue of 2016, this journal uses article numbers instead of page numbers. See further details here.