
A Study on the Spatial Correlation Effects of Digital Economy Development in China from a Non-Linear Perspective

1
School of Business, Research Institute of the Economic and Social Development in the Dabie Mountains, Xinyang Normal University, Xinyang 464031, China
2
School of Economics, Shandong University of Finance and Economics, Jinan 250014, China
3
School of Finance and Economics, Jiangsu University, Zhenjiang 212013, China
4
School of Resource and Environmental Science, Shijiazhuang University, Shijiazhuang 050037, China
*
Author to whom correspondence should be addressed.
Systems 2023, 11(2), 63; https://doi.org/10.3390/systems11020063
Submission received: 1 December 2022
/
Revised: 16 January 2023
/
Accepted: 18 January 2023
/
Published: 24 January 2023
Abstract
:Accurate analysis of the spatial correlation effects, spatial aggregation patterns, and critical factors in the development of China’s digital economy is of great significance to the high-quality development of China’s economy. Based on the monthly data of “The Tencent Internet Plus” digital economy index for 31 provinces in China from 2018 to 2020, the non-linear Granger causality test and social network analysis were applied to reveal the spatial correlation effects of China’s digital economy. The quadratic assignment procedure (QAP) was used to empirically examine the factors influencing the formation of non-linear spatial association networks. The results show that the spatially linked relationships of the digital economy in 31 Chinese provinces exhibit a significant non-linear spatially correlated network structure. Block model analysis reveals that the development of the digital economy between the four major sectors is closely linked, and the national linkage effect is significant. The results of the secondary assignment procedure indicate that capital stock, information infrastructure, and geographical proximity have a significant positive impact on the formation of spatial linkages in the digital economy. In contrast, technological innovation has a significant negative impact.
1. Introduction
The digital economy has become a new driving force for economic growth and quality improvement in China. The 20th CPC National Congress emphasized the need to accelerate the development of the digital economy, promote the deep integration of the digital economy and the real economy, and create internationally competitive digital industry clusters. The Plan for Development of the Digital Economy During the “14th Five-Year” Period (2021–2025), issued in January 2022, further stated that it is necessary to build on the new development stage, continuously strengthen, improve, and expand the digital economy, and provide strong support for the construction of a digital China. Since the 18th National Congress of the Communist Party of China, the Party and the government have issued a series of primary policy documents and guiding programs such as the Outline of the National Digital Economy Strategy, the Guidance on the “Internet Plus” Plan of Action and the Action Outline for Promoting the Development of Big Data. In the context of the new era, the Central Committee of the CPC has proposed a significant development strategy for building a “Digital China”. Under the high priority of the CPC and the government, China is vigorously promoting the construction of “new infrastructure” such as 5G, the Internet of Things, cloud computing, and artificial intelligence. As a pioneering force in building a new competitive advantage for the country in the information age, the digital economy has provided further momentum to optimize the industrial structure and promote high-quality development [1]. Along with the popularity of the internet and the continuous development and improvement of digital infrastructure such as big data, cloud computing, and artificial intelligence, the digital economy, which uses digital knowledge and information as crucial production factors, has significantly compressed the spatial and temporal distance of regional economic linkages and enhanced the breadth and depth of their linkages [2]. This relationship has broken through the traditional linear model and has taken on the characteristics of a complex non-linear spatial association. In this context, how do we scientifically identify the non-linear spatial correlations in the digital economy development in 31 provinces in China? What is the position of each province in the non-linear spatial correlation of the digital economy? What role do they play? What factors will influence the formation of non-linear correlations in digital economy development? The answers to these questions are of great significance for promoting the cross-regional synergistic development of China’s digital economy.
The rest of the study is as follows: The second part provides a systematic review of the existing literature. The third part introduces the research methodology and data sources, including the non-linear Granger causality test method, the social network analysis method, the quadratic assignment procedure (QAP) analysis method, and the sample. The fourth section introduces China’s digital economy’s spatially correlated network characteristics, including overall network characteristics, individual network characteristics, and block model analysis. The fifth part introduces the factors influencing the spatially correlated relationships of the digital economy, including econometric model construction and QAP regression analysis. The sixth part includes the research conclusions, contributions, shortcomings, and future development directions.
2. Literature Review
Since Tapscott [3] first introduced the “digital economy” concept, many institutions and scholars have conducted a lot of research on the digital economy. Existing studies focus on the following aspects: First, on the connotation of the digital economy [4,5]. For example, Tapscott argues that the digital economy primarily refers to e-commerce [3]. Moulton believes the digital economy should also encompass information technology [6]. Pan et al. [7] argued that the digital economy, as a branch of emerging economies, originated from network intelligence, representing the pattern change in China’s economic growth. Ma et al. [8] suggested that the digital economy is a technological revolution, including but not limited to the use of artificial intelligence, the Internet of Things, robotics, etc., which has fundamentally changed the way economic activities are conducted in almost all industries. Second, regarding the spatial correlation characteristics of the digital economy. The following three methods are mainly used to measure the spatial correlation of the digital economy: (1) The Moran index. Some scholars choose the spatial weight matrix to measure the spatial correlation of the digital economy [9,10,11,12,13]. In addition, it has been argued that the correlation between things becomes smaller as distance increases, whereby the inverse distance spatial weight matrix was used to measure the correlation of the digital economy [14,15,16,17,18]. Although this kind of research provides a more intuitive picture of the digital economy’s spatial correlation and spatial aggregation, it is limited to adjacent or geographically close areas, making it difficult to portray the spatial transmission effects of the digital economy between more distant provinces. Furthermore, due to the research methodology’s limitations, these studies cannot also characterize the network structure of the spatial transmission of the digital economy. (2) Gravity models. Some scholars have used gravity models to reveal the complex dependencies of the digital economy at the city, urban agglomeration, and regional levels [19,20,21,22,23]. They provide a new perspective for examining the spatial association of the digital economy, but such literature only uses a small number of statistical indicators to characterize the spatial association structure of the digital economy, reducing the complex spatial dependency to a single statistical quantity. (3) Granger causality test. Some scholars have used Granger causality tests to identify the spatial correlation of the digital economy between different regions [24,25,26,27,28]. The research aims to qualitatively identify the spatial dependency of the digital economy at the level of cities, urban agglomerations, and regions. In other words, whether an increase in the status of the digital economy in one region will enhance the development of the digital economy in other regions. This kind of research mainly adopts linear models, ignoring the non-linear characteristics of the formation and evolution of the digital economy [29]. Third, research on the factors influencing the spatial association of the digital economy. Studies have focused more on the overall structure and individual network characteristics of spatially correlated networks of the digital economy [2]. The key factors that determine the formation of spatial dependencies in the digital economy have not been further identified.
The marginal contributions of this study are as follows: firstly, the study considers the non-linear spillover relationship of the digital economy between provinces and identifies the non-linear transmission and spillover effects of the digital economy between provinces using the non-linear Granger causality test. Secondly, from the perspective of “relational data”, social network analysis is adopted to reveal the spatial correlation effects of China’s digital economy through indicators such as network density. At the same time, centrality analysis and block model analysis are used to reveal the position and role of Chinese provinces in the spatial association of the digital economy and their spatial aggregation patterns. Finally, the QAP is applied to further identify the key factors influencing the formation of spatially correlated relationships in the digital economy to propose feasible suggestions for enhancing cross-regional synergy in the development of China’s inter-provincial digital economy from a non-linear spatial correlation perspective.
3. Methodology and Data
3.1. Non-Linear Granger Causality Test
Granger and Newbold [30] pointed out that the connections between things in the real world are mainly non-linear. For this reason, Hiemstra and Jones [31] constructed a non-linear Granger causality test based on the traditional Granger causality test. This method has now become the primary method for testing non-linear associations between variables [32,33]. In this study, the non-linear Granger causality test for spatial correlations in China’s digital economy is conducted using the non-parametric statistic-based test proposed by Diks and Panchenko [34]. The specific construction process of the non-parametric statistic is as follows.
Given , is independent of . is considered not to be a strictly non-linear Granger cause of . Equation (1) is the original assumption.
In Equation (1), , . Assume and . To keep the distribution of constant, remove the time indicator and rewrite as . At this point, distributions of and are identical and both are assumed to be continuous random variables. When , the original assumption is equivalent to . At this point, the joint probability density function satisfies Equation (2).
With the introduction of a positive weight function , the original assumption can be rewritten as Equation (3).
Meanwhile, , and Equation (3) can be transformed into Equation (4).
If the local density function of at is expressed, it is Equation (5).
In Equation (5), , and is the indicator function. is the sample bandwidth function. With reference to Dergiades et al. [35], it is given that . At this point, the statistic is constructed as in Equation (6).
In Equation (6), and is distribution convergence. is an estimate of the asymptotic variance . According to the statistic , a non-linear Granger test can be performed in turn for the VAR model constructed from the two variables and .
3.2. Social Network Analysis
Within a region, the inter-provincial transmission relationships of the digital economy are organized together to form a multi-threaded and complex correlated network. Social network analysis methods provide a useful analytical tool for revealing the structural characteristics of the inter-provincial digital economy’s spatially correlated networks. Social network analysis has been applied to a wide range of fields, such as geography, economics, and sociology. It is an interdisciplinary analysis method based on a “relational” perspective [36]. In this study, the overall network structure characteristics of the digital economy are revealed through the measurement of indicators such as network density, network relevance, network hierarchy, and network efficiency. (1) Network density. Network density indicates the number of correlation relationships in a network. The higher the network density, the more correlation relationships there are. (2) Network relevance. If two points have high accessibility to each other—that is, the more paths connecting the two points—the higher the overall network relevance and robustness. (3) Network hierarchy. Network hierarchy describes the extent to which nodes in a directed graph are asymmetrically reachable. The smaller the proportion of symmetrically reachable point pairs to the total number of reachable point pairs, the higher the network hierarchy, meaning that the network has a certain degree of hierarchy. (4) Network efficiency. If a network exists with subjects, the theoretical minimum number of lines contained is . If there are fewer than , the network will break. If there are more than , multiple paths and loops are formed between the network subjects. Network efficiency is the number of extra lines between nodes while ensuring that the network does not break. It is important to note that network inefficiency differs from economic or social inefficiency in that the more lines between nodes in a network, the lower the efficiency value, but the higher the network relevance and robustness. Individual centrality indicators (degree centrality, intermediation centrality, and proximity centrality) are measured to reveal the position of China’s 31 provinces in the digital economy network. Centrality is an index to measure the centrality of each node in the network. The closer a node is to the center, the higher its “status” and “power” in the overall network, and the higher its centrality.
3.3. Quadratic Assignment Procedure Analysis
The variables selected in this econometric model are “relational data” in the form of matrices. In contrast, traditional estimation methods are based on “attribute data”, which cannot be statistically tested for “relational data”. This study, therefore, selects the variables from the social network analysis. Therefore, this paper chooses the QAP, a specific method for studying relationships between relational data in social network analysis. The main steps are as follows: firstly, a conventional multiple regression analysis is carried out on the long vector elements corresponding to the independent variable’s coefficient matrix and the dependent variable’s coefficient matrix. Secondly, a random permutation of the dependent variable matrix ranks is performed, and the regression is then recalculated, saving all coefficient values and the determination coefficient . This step is repeated hundreds of times in order to estimate the standard error of the statistics. For each coefficient, the program will calculate the proportion of the regression coefficients and that are greater than or equal to and less than or equal to the coefficients obtained in the first step of the calculation out of the regression coefficients obtained in the total random permutation process. Based on the percentage, the minimum level of significance, i.e., the p-value, for rejecting the original assumption can be derived and used as a basis for determining the significance of the effect of the independent variable difference matrix on the dependent variable difference matrix [37].
3.4. Sample and Data
The digital economy currently accounts for 4.5% to 15.5% of the global GDP. Compared to measuring the scale of the digital economy, it is more reasonable to measure the level of digital economy development in each region by an index [38]. The data in this study come from the “Internet+” Digital Economy Index (referred to as the Digital Economy Index in this study) published by Tencent Research Institute from January 2018 to December 2020. The index system covers 17 sub-industries, including cloud computing, social networking, news, and video. The index is not unit specific, as it is measured through standardization and weighting by the comparison method. The data of the index were collected using mobile terminals, and the sample size is large and comprehensive and widely used by many scholars.
4. Spatially Correlated Network Characteristics of China’s Digital Economy
4.1. Overall Network Characteristics
The stability of the data series is a prerequisite for the Granger causality test. If the data series is not stable, the statistics in the Granger causality test no longer have a standard limit distribution, thus affecting the correctness of the conclusions [39,40]. Therefore, the stability of the data series should be tested before conducting the Granger causality test. To test the stationarity of the digital economy index series, the Augmented Dickey-Fuller (ADF) method was used to conduct unit root tests on the digital economy indices of 31 Chinese provinces. The results show that the horizontal series is non-stationary, while the ADF test results of the second-order difference series of the digital economic index show that the original assumption of “at least one unit root” is rejected at the 1% significance level; that is, the digital economic index is classified as a stationary series after the second-order difference and belongs to the I(2) series. In this study, the second-order difference series of the digital economy will be used in the subsequent Brock–Dechert–Scheinkman (BDS) non-linearity test and non-linear Granger causality analysis. The BDS non-linear test results significantly reject the original assumption that there is a linear relationship; that is, the digital economy index series of 31 provinces in China have a significant non-linear dynamic change trend. Since the determination of the optimal lag order in the non-linear Granger causality test is not uniform [41], this study referred to Shu and Zhang’s [42] research and chose a lag order of four to construct a “maximum likelihood network” for the spatial association of China’s digital economy.
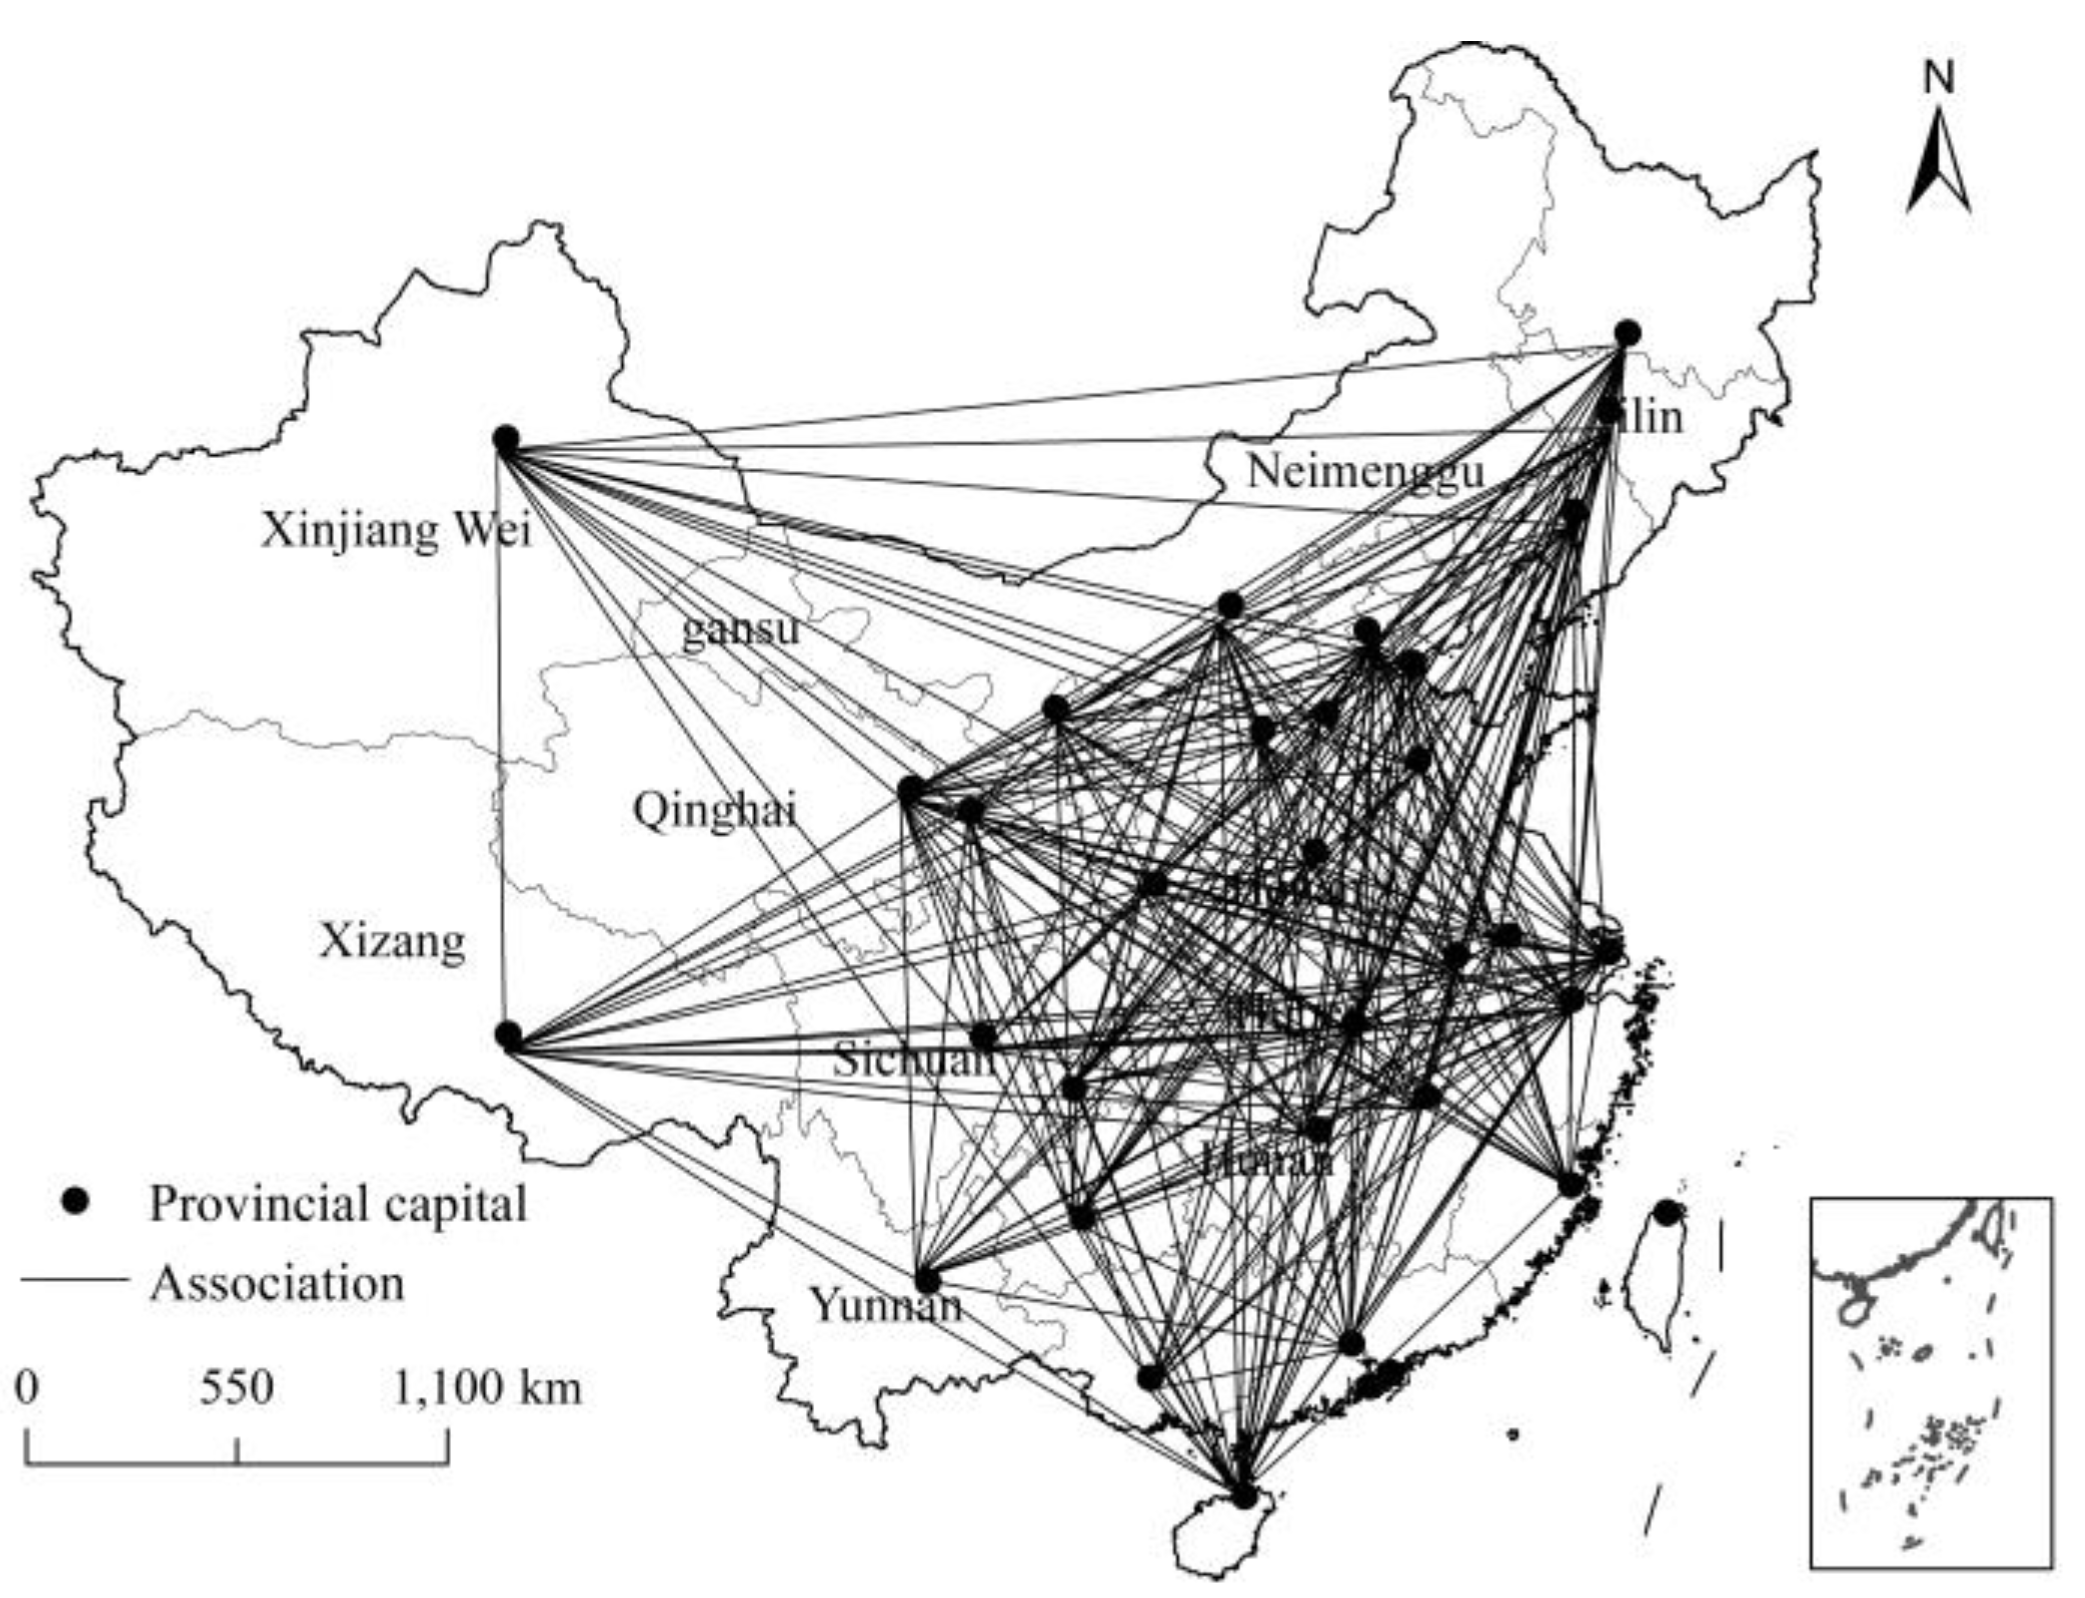
The non-linear Granger causality test results show that when the lag order is four, a maximum of 364 directed correlations can be identified in all 31 provinces. The spatial association network structure of China’s digital economy is shown in Figure 1 below, which shows that the spatial association of China’s digital economy has a significant non-linear network structure. It indicates that the spatial association of China’s digital economy has broken through the traditional geographical distance. Some provinces that are not geographically close to each other also have spatial associations. Specifically, the network density is 0.391 (364/930), indicating that the inter-provincial digital economy in China is more closely connected spatially. The network correlation degree is one, which suggests that the spatial connectivity of the digital economy network among the 31 provinces in China during the sample period is good, and there is a significant spatial correlation effect on the development of the digital economy among provinces. A network ranking of zero indicates that each province plays its own unique role in the spatially correlated network of the digital economy. The development of the digital economy between provinces influences and relies on each other. The symmetrical accessibility between network nodes is high, and the provinces are not strictly hierarchical in the spatially linked network. The network efficiency is 0.428, meaning that there are more linkage paths between provinces, and the spatial linkages show an evident phenomenon of multiple superpositions.
4.2. Individual Network Characteristics
The results of measuring the individual network characteristics of the spatial association of the digital economy in China are shown in Table 1. The average degree centrality of each node (province) in the spatially correlated digital economy network is 60. The degree of centrality of Beijing, Shanghai, and Zhejiang is higher than the national average, which indicates that these provinces have many connections with other provinces in the digital economy spatial association network and play an “engine” role in the digital economy spatial association network. The possible reasons are that these provinces have a better economic base, a higher degree of informatization, and a more robust innovation capacity. With the support of government policies to stimulate the development of the digital economy, the digital economy in the provinces mentioned above has developed rapidly, which in turn has driven the development of the digital economy in other regions through the spatial correlation effect under the role of market mechanisms. Xinjiang, Henan, and Guangxi provinces are ranked low in terms of degree centrality, which means that they are marginalized in the spatially correlated network of the digital economy and play the role of “followers”. These provinces are less connected to other provinces regarding digital economy development. There is a need to strengthen the spatial connections between these provinces and the core nodes to promote the development of the digital economy in the region. As can be seen from Table 1, the average value of the point-out degree of the 31 provinces in China is 12, and the provinces with a point-out degree more significant than the average value include Beijing, Shanghai, and Tianjin. This reflects that these provinces have a better digital economy and a significant spatial spillover effect on other provinces. Among them, Beijing’s point-out is much larger than its point-in, which indicates that Beijing is in the leading position in the network of spatially related relationships in the digital economy. The region’s influence on other regions is much higher than the influence of other regions. The average value of point-in for the 31 provinces across the country is also 12, and provinces with a point-in higher than this average include Tibet, Ningxia, and Xinjiang. They have a point-in rate that is not only much higher than their own point-out rate but also higher than the national point-in rate average. It can be seen that these provinces have a lower level of digital economy development and are more dependent on other provinces for their digital economy.
The average proximity to the center of each node (province) in the spatially correlated network of the digital economy is 72.025, with provinces such as Beijing, Shanghai, and Hubei having a higher proximity to the center than the national average. These provinces are faster in establishing links with other provinces in the spatially correlated digital economy network and play the role of central actors in it. Not only do they have access to more resources for their own digital economy development, but they are also able to establish efficient connections with the digital economy development of other provinces. This may be explained by the fact that these provinces have a higher level of digital economy development, are more economically and technologically correlated to other provinces, and are therefore more likely to have spatial spillover effects on those provinces with a lower level of digital economy development. Guangxi, Sichuan, and Henan are at the bottom of the ranking in terms of proximity to the center, with their proximity to the center well below the national average and their marginal position in the spatially correlated network of the digital economy, mainly due to their low level of economic development and poor digital economy infrastructure.
The average intermediary centrality of each node (province) in the digital economy spatial association network is 1.379. The top provinces in terms of intermediary centrality are Beijing, Shanghai, and Zhejiang. They have strong control over other provinces in the spatially correlated network of the digital economy and are the link between the nodes, which has an important impact on the accessibility and stability of the spatially correlated network of the digital economy. This is due to the gradual improvement of various digital economy infrastructures, such as the establishment of digital trade pilot zones and big data exchanges, and the increasing control and dominance of the provinces mentioned above over the development of the digital economy in other provinces. In addition, the total intermediary centrality of China’s spatially correlated digital economy network is 42.760. But the absolute intermediary centrality of the bottom five provinces is only 2.303, with an average value of less than 0.5, accounting for only 5.386% of the total intermediary centrality, which indicates that these provinces have less control over other provinces in the spatially correlated network. This also reflects the significant unevenness of the intermediary centrality of each province in the spatially correlated network of the digital economy. Most of the digital economy connections need to be realized through the digital economy-developed provinces such as Beijing, Shanghai, and Zhejiang.
4.3. Block Model Analysis
4.3.1. Distribution of Block Members
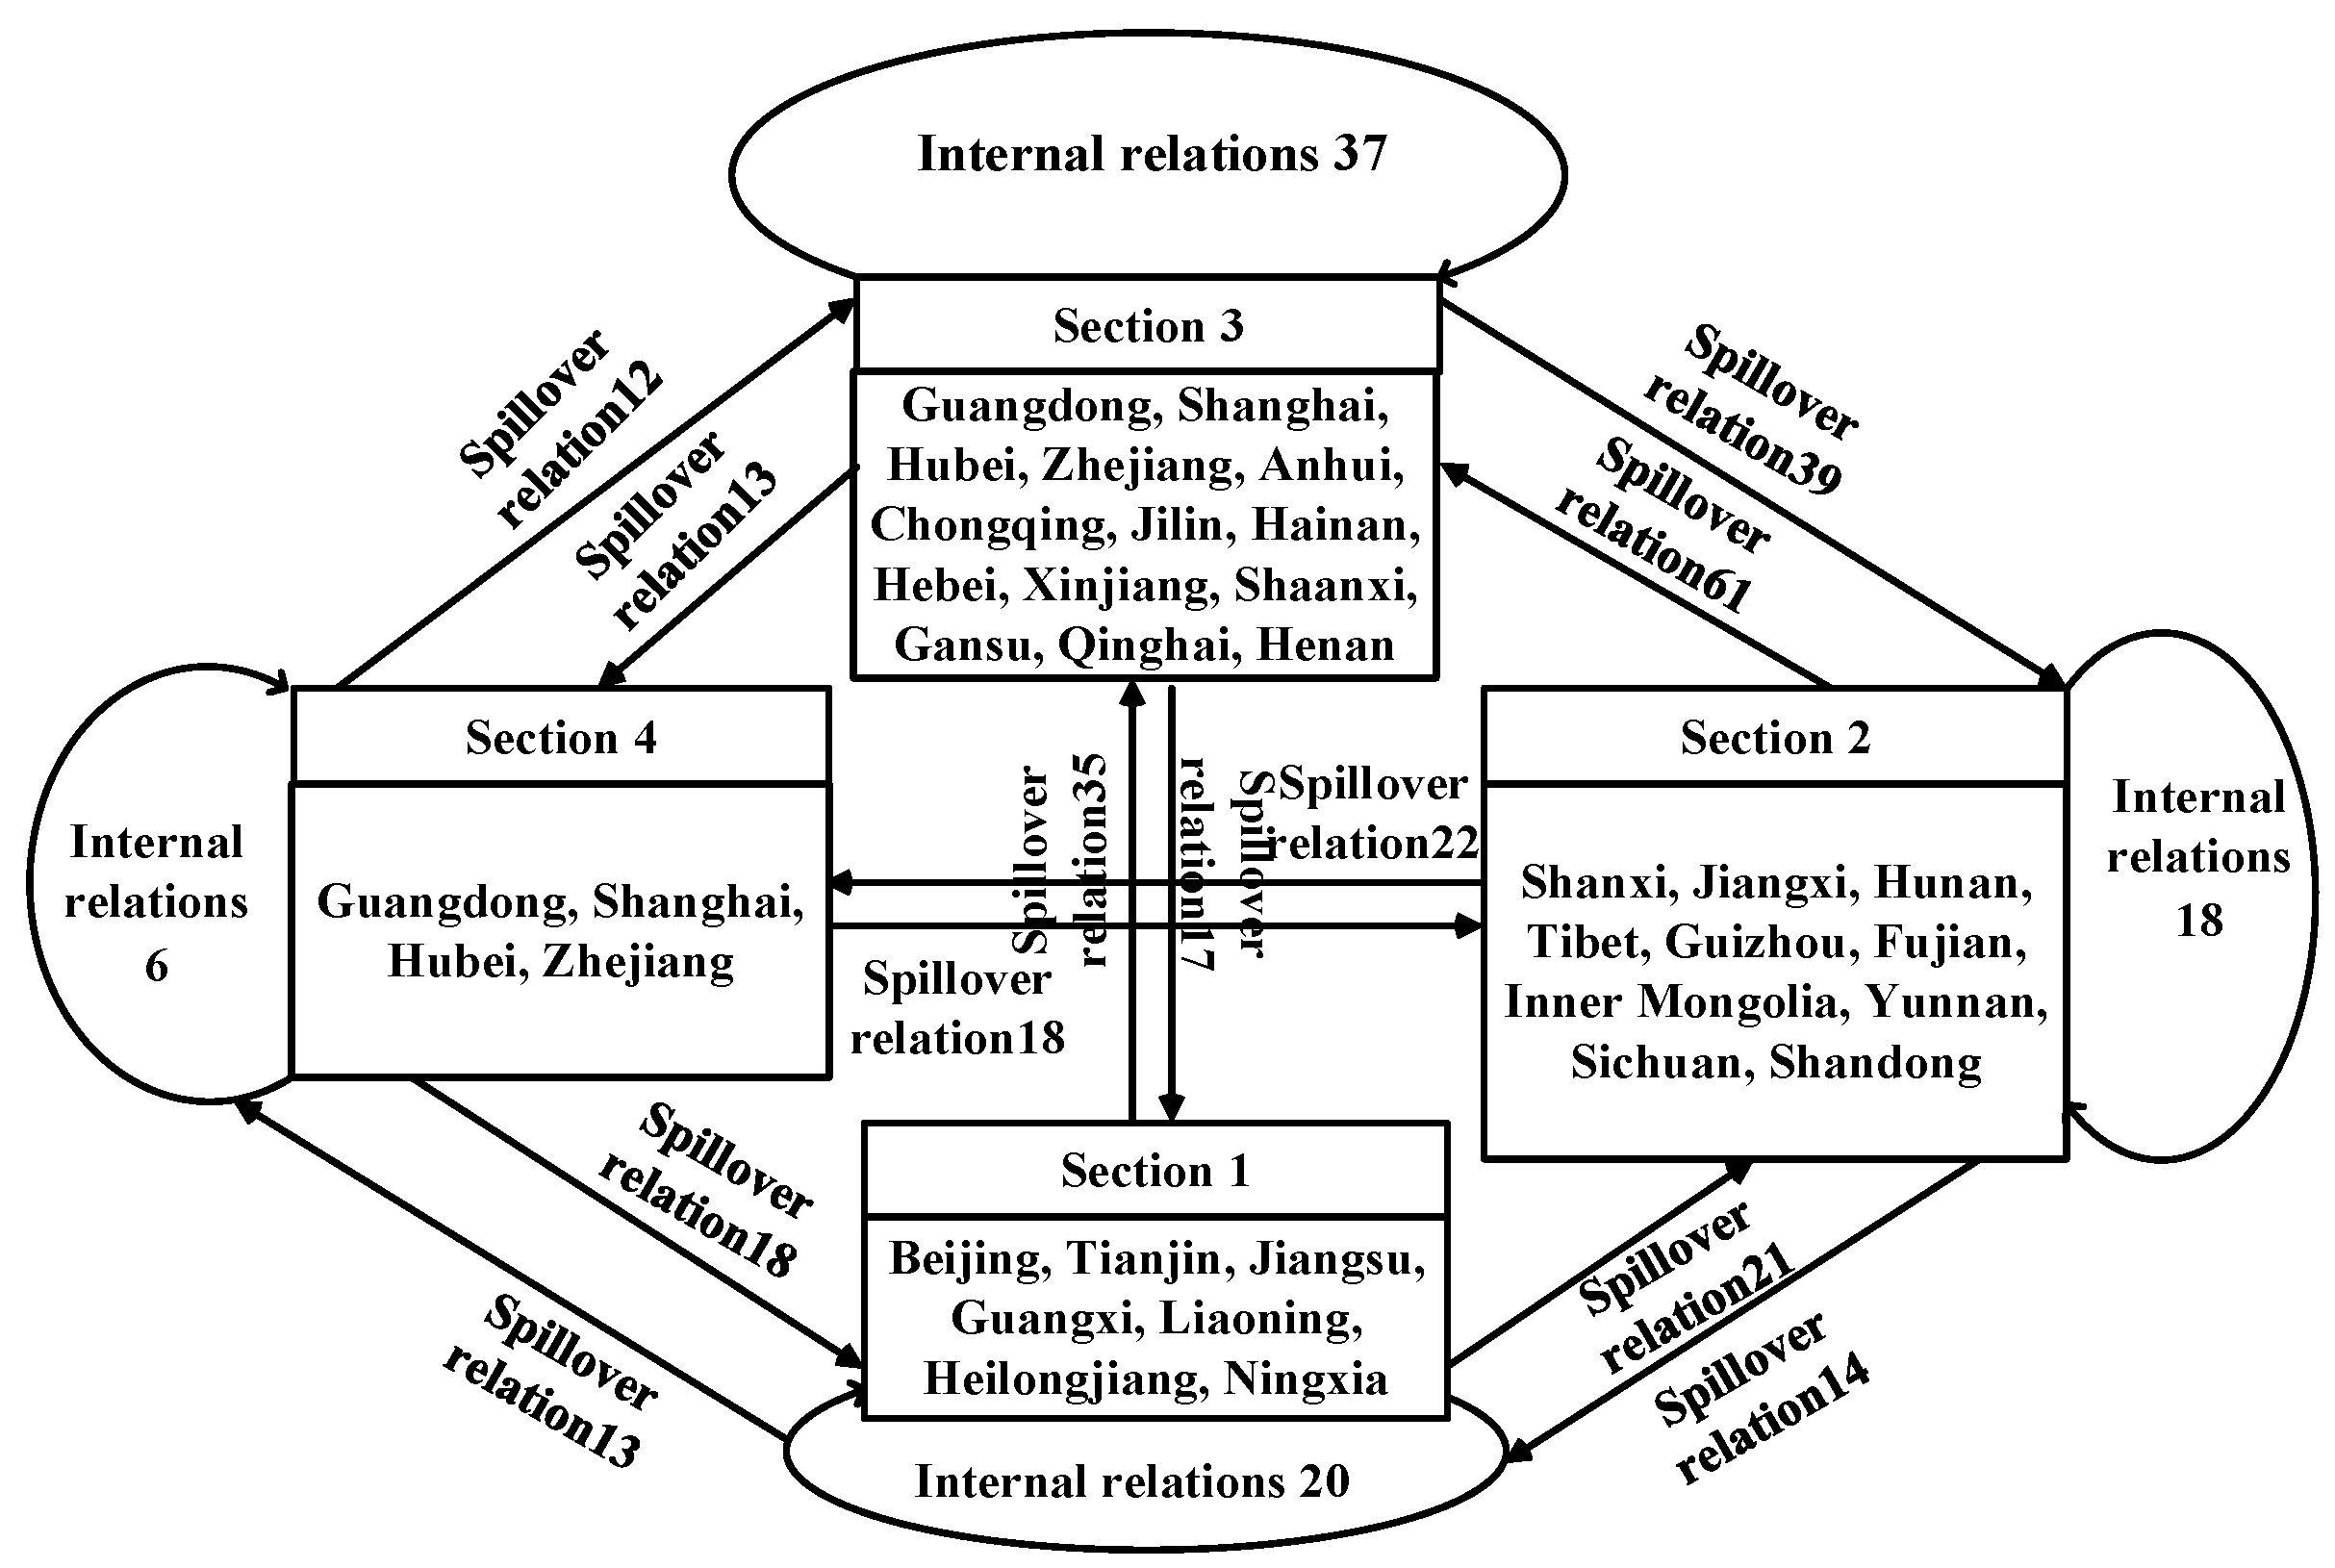
In this study, the CONCOR module is used in Ucinet software to divide all provinces into four blocks with a depth of 2 and a concentration of 0.2. Among them, there are seven members located in Block I, namely Beijing, Tianjin, Jiangsu, Guangxi, Liaoning, Heilongjiang, and Ningxia. There are ten members in Block II, including Shanxi, Jiangxi, Hunan, Tibet, Guizhou, Fujian, Inner Mongolia, Yunnan, Sichuan, and Shandong. There are ten members in Block III: Anhui, Chongqing, Jilin, Hainan, Hebei, Xinjiang, Shaanxi, Gansu, Qinghai, and Henan. Moreover, Guangdong, Shanghai, Zhejiang, and Hubei are located in Block IV.
4.3.2. Inter-Block Spillover and Reception Relationships
The spillover and reception relationships of the four major blocks in the digital economy spatial association relationship network are shown in Table 2. From the overall perspective of the blocks, there are 364 spatially correlated relationships across the 31 provinces in China, of which 81 relationships arise between provinces within each block. There are 283 connections between the four major segments, which indicates that the spatial correlations in China’s digital economy mainly occur between blocks. From the data on spatial spillover relationships between blocks, listed in Table 2, in terms of complete analysis, the total number of spillover relationships from the four significant blocks to other blocks are 69, 97, 69, and 48, respectively. Block II has the largest spillover relationship with other blocks, far exceeding Block I, Block III, and Block IV, while Block IV has the smallest spillover relationship with other blocks. In terms of receiving external block spillover relationships, the four significant blocks received 49, 78, 108, and 48 external spillover relationships, respectively. Block III, which is in the top position in terms of receiving external spillover relationships (108), is more than twice as high as Block IV (48) in the bottom position.
Due to the different number of provinces included in the four major blocks, the position and role of each block in the network cannot be scientifically assessed at the aggregate level alone. For this reason, intensity indicators are used to analyze the block model of the spatial association relationship of the digital economy. In terms of spillover and reception intensity, the spillover intensity of Block Ⅰ to other blocks is 41.07% of the maximum carrying intensity, while its reception intensity is only 29.17%, the lowest among the four blocks. This indicates that the provinces in Block I have perfect conditions for the developing digital economy and are less dependent on other provinces, making it a “net spillover block”. The spillover intensity of Block II to other blocks is 46.19% of the maximum carrying intensity, and its reception intensity is 37.14%. The members of this block have an intermediate level of digital economy development, sending relations to other blocks while receiving relations from external blocks. It plays a bridging role in the spatial correlation of digital economy development and is a “broker block”. The spillover intensity of Block III to other blocks is only 32.86% of the maximum bearable intensity, leaving 67.14% of the potential spillover space unused. Its reception intensity is as high as 51.42%, well above the spillover intensity. It ranks first among the four blocks and is in the mid-western region with a low level of digital economy development. The development of its digital economy is more dependent on high-level regions and is a “net beneficiary block”. The spillover intensity and reception intensity of Block IV to other blocks are both 44.44% of the maximum bearable intensity, and the total number of receiving relationships is similar to that of sending relationships, making it a “two-way spillover block”.
The image matrix obtained from the density criterion of is shown in Table 3. From Table 3 and Figure 2, it can be seen that Block I not only has a large number of internal relationships but also has spillover effects on Block III and Block IV. There is no significant spillover effect among the internal members of Block Ⅱ, and its spillover effect is mainly manifested in the spillover relationship between Block Ⅲ and Block Ⅳ. The spillover effect of Block III is mainly manifested as spillover between internal provinces, and the spillover effect on other blocks is not significant. Block IV has not only a large number of internal relationships but also spillover effects on Block I and Block II. In addition, like the diagonal elements of the matrix, only Block II is zero, which indicates that Block I, Block III, and Block IV all have strong spillover relationships among their internal members. The above analysis shows that each block in China’s digital economy spatial association relationship is playing its own comparative advantage, and the overall national correlation trend is becoming more and more significant.
5. Analysis of the Factors Influencing the Spatial Correlation of the Digital Economy
5.1. Econometric Model Construction
After analyzing the network characteristics of the spatial correlations in China’s digital economy, it is necessary to explore further what factors influence the formation of spatial correlations in the digital economy. The development of the digital economy is mainly based on the advancement of information technology, and the spatial spillover effect of information technology can provide strong support for the cross-regional synergistic development of the digital economy [43], which leads to the conclusion that geographical proximity has an important influence on the formation of spatial correlations in the digital economy. At the same time, different provinces play different roles in the spatial association network of China’s digital economy development. Regions with a better economic base have better digital economy development and vice versa. They emit significantly more connections in the spatial association network of the digital economy than regions with a lower level of digital economy development. This implies that inter-provincial differences in economic characteristics not only affect the level of development of the digital economy but are also an important factor influencing the generation of spatially correlated relationships in China’s digital economy. This study focuses on the impact of geographical distance and differences in economic characteristics on the spatial correlation of China’s digital economy. Geographical distance is characterized by geographical proximity or not. Economic characteristics are portrayed using indicators such as capital stock, level of information technology infrastructure, the status of urbanization, industrial structure, and level of technological innovation. Among them, the capital stock data refer to Zhang’s study [44], and the depreciation rate is 10.96%, which is calculated using the perpetual inventory method. The level of information infrastructure construction is measured using the length of long-distance fiber-optic cable lines [45]. The level of urbanization is represented by the proportion of the urban population to the total population in each province and city [46]. The share of tertiary industry output value is used as a proxy variable for industrial structure [47]. The level of technological innovation is measured using the number of patents granted per 10,000 people [48]. The relevant data are obtained from the China Urban Statistical Yearbook, China Statistical Yearbook, and China Science and Technology Statistical Yearbook for 2018 to 2020. Based on this, this study constructs an econometric model, as in Equation (7).
As the explained variable is a spatial correlation network of China’s inter-provincial digital economy constructed using the non-linear Granger test, it belongs to “relational data”. Therefore, it is necessary to convert the “attribute data” of regional economic characteristics into the “relationship data” of regional differences so that the QAP method can be used for analysis. Regional difference “relational data” is a difference matrix constructed by using the difference between the average value of the corresponding indicators of the economic characteristics of each province and the development level of related indicators in the sample period. . , , , , are, respectively, the regional difference matrix of capital stock, information infrastructure, urbanization level, industrial structure, technological innovation, and geographical proximity effect.
5.2. QAP Regression Analysis
Table 4 shows the results of the full-sample regressions of the factors influencing the formation of spatial connection relationships in China’s digital economy. Regional differences in capital stock, information technology infrastructure, technological innovation, and geographical proximity effects all pass the significance level test, which indicates that the above-mentioned influencing factors can significantly affect the formation of spatial correlations in China’s digital economy. Probability A represents the probability that the regression coefficient generated in the random replacement process is greater than or equal to the final regression coefficient. Probability B shows the probability that the regression coefficient generated in the stochastic replacement process is less than or equal to the final regression coefficient. The standardized regression coefficient of regional differences in capital stock is 0.162, which implies that regional differences in capital stock have a greater impact on the formation of spatial correlations in the digital economy; that is, the greater the inter-provincial differences in capital stock, the stronger the spatial correlations in the digital economy. Studies have found that capital accumulation has become a decisive force in regional economic disparities [49,50]. A high capital stock implies a relatively good level of regional economic development; the digital infrastructure of the region will be more complete, and the digital economy based on information technology will be more likely to have spatial spillover effects on the surrounding areas, which will promote the formation of spatial correlations in the digital economy [51]. The standardized regression coefficient of the regional difference in information technology infrastructure is 0.080, indicating that it is an important influence. A well-developed information technology infrastructure can drive the digital economy forward more rapidly. The digital economy is better developed in areas with better information technology infrastructure, and the digital economy benefits from the increasing marginal returns of information to show high growth, strong diffusion, and low-cost characteristics [52]. The greater the difference in information infrastructure, the stronger the “diffusion effect” of these regions in driving the development of the digital economy in the lagging regions under the market mechanism, thus enhancing the spatial correlation effect of the digital economy between regions. The standardized regression coefficient of regional differences in technological innovation is −0.153, meaning that the closer the technical innovation capacity between provinces, the more conducive it is to the formation of spatial correlations in the digital economy. The small difference in technological innovation capacity between regions will further promote inter-regional communication and exchanges in technology, which are conducive to the formation of a spatial association of the digital economy. The standardized regression coefficient for the geographic proximity effect is 0.062, which passes the significance level test. This indicates that the closer one is in geographic space, the more likely the spatial association of the digital economy is to occur, which is consistent with the first law of geography. Regional differences in urbanization levels and regional differences in industrial structure did not pass the significance test at the national level. They do not yet significantly impact the formation of spatial correlations in the digital economy in China as a whole.
6. Conclusions and Contributions
Based on the monthly digital economy indices of 31 Chinese provinces from January 2018 to December 2020 published by Tencent Research Institute, this study examines the spatial association effects of China’s digital economy development from a network perspective using social network analysis methods. It empirically investigates the relevant factors affecting the formation of spatial association relationships through a secondary assignment procedure. The study found that: (1) At the overall level, the spatial correlations in China’s digital economy show the characteristics of a complex non-linear network, and the spatial correlations among 31 provinces account for nearly 40% of the total number of relationships. There are no isolated nodes (provinces) in the spatial correlation network. The digital economy of other provinces influences the digital economy of any province. At the same time, the spatial correlations among provinces show an obvious phenomenon of multiple superpositions, and the network has strong stability. (2) At the individual level, provinces such as Beijing, Shanghai, and Zhejiang are at the core of the spatial association network, playing the role of “engine” in the development of China’s digital economy, and are the core driving force behind it. Provinces such as Tibet, Ningxia, and Xinjiang are at the periphery of the spatially correlated network, and these provinces are more dependent on provinces with higher levels of digital economy development. (3) The analysis of the block model shows that there are close relationships within and between the four major blocks, with both Block I and Block II having significant spatial spillover effects on Block III and Block IV. Block III has significant spatial spillover relationships between provinces within it. Block IV not only has a large number of internal spatial relationships but also has spillover effects on Block I and Block II. In the spatial correlation of China’s digital economy, all blocks are playing their respective comparative advantages, and the overall national connection trend is becoming more obvious. (4) The results of QAP estimation show that regional differences in capital stock, regional differences in information technology infrastructure, regional differences in technological innovation, and geographical proximity effects all play a key role in the formation of the spatial association of the digital economy, with capital stock differences, information technology infrastructure differences, and geographical proximity effects having significant positive effects, and technological innovation differences having significant negative effects.
The above results verify that China’s spatially correlated digital economy network has strong stability and an increasingly obvious trend of overall national connection. This is consistent with the studies of Wang et al. [53] and Chen et al. [54]. However, in terms of regional heterogeneity, each region in China has a different position and role in the spatially correlated network of the digital economy, and the development of the digital economy shows an uneven trend. Accordingly, this study offers the following policy implications.
Firstly, the spatial correlation effect of China’s digital economy development is fully utilized to provide a new perspective for promoting the development of the digital economy. Complex non-linear spatial correlations characterize China’s digital economy. Therefore, when promoting the development of the local digital economy, governments at all levels should not only pay attention to the size of the “attribute data” of the digital economy in each region but also fully consider the spatial correlation effect of the digital economy between provinces and play the role of the hub of the core node areas in the correlation network, so as to realize the overall improvement of the digital economy “from point to area” and “from part to whole”. Secondly, it is necessary to focus on the characteristics of the blocks of the spatially correlated network of the digital economy, and the formulation of differentiated support policies for the development of the digital economy. Different blocks have different internal connections and external spillover relationships, and each region has a different position and role in the spatially correlated network of the digital economy. Therefore, when formulating digital economy support policies, the government should pay attention to the agglomeration characteristics of each block in the digital economy spatially correlated network and the connection effects between blocks, fully consider the heterogeneity of different blocks, and formulate differentiated and targeted digital economy enhancement strategies. Finally, both government and market forces should be actively brought into play to achieve high-quality and balanced development of the digital economy. The formation of spatial correlations in the digital economy is influenced not only by the factors of the digital economy itself but also by factors such as capital stock, information technology infrastructure, and technological innovation capacity. On the one hand, governments at all levels should give full play to their own initiative to strengthen the inter-provincial inter-connectivity of the digital economy by adjusting the differences in capital stock, information technology infrastructure, and technological innovation capacity and promote the cross-regional synergistic enhancement of China’s digital economy. On the other hand, the government should guide the flow of digital economy production factors from regions with higher digital economies to lagging regions through market-based means, in order to enhance the level of digital economy development in lagging regions, reduce the spatial differences in China’s inter-provincial digital economy, and realize the cross-regional synergistic development of the digital economy.
This study clarifies the current situation, spatial correlation characteristics, and influencing factors of inter-provincial digital economy development in China. It lays the foundation for subsequent studies on the development of China’s digital economy, but there are still some limitations. First, the research on the digital economy focuses on the inter-provincial level and does not cover prefecture-level cities and counties. Second, the choice of indicators for the level of digital economy development needs to be further improved to better reflect the characteristics of the level of digital economy development in different regions. Third, the influencing factors of the formation of spatial correlations in the digital economy need to be further explored and clarified so as to provide more feasible suggestions for policy implementation. Therefore, in future research, a more detailed measurement of the level of digital economy development and further clarification of the influencing factors of the formation of spatial correlations in the digital economy are important directions worthy of in-depth study.
Author Contributions
Conceptualization, J.H.; methodology, J.H.; data curation, H.J.; software, X.D.; validation, A.Z.; formal analysis, A.Z., writing—original draft preparation, J.H.; writing—review and editing, J.H. and X.D.; visualization, H.J. and A.Z.; supervision, J.H. funding acquisition, J.H. All authors have read and agreed to the published version of the manuscript.
Funding
This paper was supported by grants from the National Natural Science Foundation of China (72203197), the National Social Science Foundation of China (21FJYB047), the University of Science and Technology Innovation Talent Support Plan in Henan Province (Humanities and Social Sciences) (2021-CX-054), the Foundation for Basic and Applied Basic Research in Guangdong Province (grant number: 2020A1515110425), and the Nanhu Scholars Program for Young Scholars of XYNU.
Institutional Review Board Statement
Not applicable.
Informed Consent Statement
Not applicable.
Data Availability Statement
The data sets generated and analyzed in the current study are available in the “China Urban Statistical Yearbook”, “China Statistical Yearbook”, “China Science and Technology Statistical Yearbook”, and Tencent Research Institute for the years 2018 to 2020.
Conflicts of Interest
The authors declare no conflict of interest.
References
- Ding, C.H.; Liu, C.; Zheng, C.Y.; Li, F. Digital economy, technological innovation and high-quality economic development: Based on spatial effect and mediation effect. Sustainability 2021, 14, 216. [Google Scholar] [CrossRef]
- Tang, L.Y.; Lu, B.K.; Tian, T.H. Spatial correlation network and regional differences for the development of digital economy in China. Entropy 2021, 23, 1575. [Google Scholar] [CrossRef] [PubMed]
- Tapscott, D. The Digital Economy: Promise and Peril in the Age of Networked Intelligence; McGraw-Hill: New York, NY, USA, 1996. [Google Scholar]
- Tapscott, D. Blueprint to the Digital Economy: Creating Wealth in the Era of e-Business; McGraw-Hill: New York, NY, USA, 1998. [Google Scholar]
- Jorgenson, D.W.; Vu, K.M. The ICT revolution, world economic growth, and policy issues. Telecommun. Policy 2016, 40, 383–397. [Google Scholar] [CrossRef]
- Moulton, B.R. GDP and the Digital Economy: Keeping up with the Changes; MIT Press: Cambridge, MA, USA, 2000. [Google Scholar]
- Pan, W.R.; Xie, T.; Wang, Z.W.; Ma, L.S. Digital economy: An innovation driver for total factor productivity. J. Bus. Res. 2022, 139, 303–311. [Google Scholar] [CrossRef]
- Ma, Q.; Tariq, M.; Mahmood, H.; Khan, Z. The nexus between digital economy and carbon dioxide emissions in China: The moderating role of investments in research and development. Technol. Soc. 2022, 68, 101910. [Google Scholar] [CrossRef]
- Wang, S.; Zhang, T. Research on the Spatial Effect of Government Science and Technology Expenditure on the Development of Digital Economy. J. Risk Anal. Crisis Response 2022, 12, 170–188. [Google Scholar] [CrossRef]
- Zhou, J.; Lan, H.L.; Zhao, C.; Zhou, J.P. Haze Pollution Levels, Spatial Spillover Influence, and Impacts of the Digital Economy: Empirical Evidence from China. Sustainability 2021, 13, 9076. [Google Scholar] [CrossRef]
- Zhu, W.J.; Chen, J.J. The spatial analysis of digital economy and urban development: A case study in Hangzhou, China. Cities 2022, 123, 103563. [Google Scholar] [CrossRef]
- Jiao, S.T.; Sun, Q.B. Digital Economic Development and Its Impact on Econimic Growth in China: Research Based on the Prespective of Sustainability. Sustainability 2021, 13, 10245. [Google Scholar] [CrossRef]
- Ma, D.; Zhu, Q. Innovation in emerging economies: Research on the digital economy driving high-quality green development. J. Bus. Res. 2022, 145, 801–813. [Google Scholar] [CrossRef]
- Cuaresma, J.C.; Lutz, S.U. Modelling and projecting digital trends in European regions: An econometric framework. Reg. Stud. 2021, 55, 1696–1710. [Google Scholar] [CrossRef]
- Zhao, S.Q.; Peng, D.Y.; Wen, H.W.; Wu, Y.Z. Nonlinear and spatial spillover effects of the digital economy on green total factor energy efficiency: Evidence from 281 cities in China. Environ. Sci. Pollut. Res. 2022, 1–21. [Google Scholar] [CrossRef]
- Zhang, W.; Liu, X.M.; Wang, D.; Zhou, J.P. Digital economy and carbon emission performance: Evidence at China’s city level. Energy Policy 2022, 165, 112927. [Google Scholar] [CrossRef]
- Lu, G.Y.; Wong, D.W. An adaptive inverse-distance weighting spatial interpolation technique. Comput. Geosci. 2008, 34, 1044–1055. [Google Scholar] [CrossRef]
- Barbieri, M.M.; Berger, J.O.; George, E.I.; Rockova, V. The median probability model and correlated variables. Bayesian Anal. 2022, 16, 1085–1112. [Google Scholar] [CrossRef]
- Koibichuk, V.; Ostrovska, N.; Kashiyeva, F.; Kwilinski, A. Innovation technology and cyber frauds risks of neobanks: Gravity model analysis. Mark. Manag. Innov. 2021, 1, 252–265. [Google Scholar] [CrossRef]
- Razniak, P.; Dorocki, S.; Winiarczyk-Razniak, A. Spatial changes in the command and control function of cities based on the corporate centre of gravity model. Misc. Geogr. 2020, 24, 35–41. [Google Scholar] [CrossRef] [Green Version]
- Hindman, M. The Internet Trap: How the Digital Economy Builds Monopolies and Undermines Democracy; Princeton University Press: Princeton, NJ, USA, 2018. [Google Scholar]
- Murray, A.D. Nodes and gravity in virtual space. Legisprudence 2011, 5, 195–221. [Google Scholar] [CrossRef]
- Jungmittag, A.; Welfens, P.J.J. Liberalization of EU telecommunications and trade: Theory, gravity equation analysis and policy implications. Int. Econ. Econ. Policy 2009, 6, 23–39. [Google Scholar] [CrossRef]
- Murthy, K.V.B.; Kalsie, A.; Shankar, R. Digital economy in a global perspective: Is there a digital divide? Transnatl. Corp. Rev. 2021, 13, 1–15. [Google Scholar] [CrossRef]
- Pradhan, R.P.; Arvin, M.B.; Nair, M.; Bennett, S.E.; Bahmani, S. Short-term and long-term dynamics of venture capital and economic growth in a digital economy: A study of European countries. Technol. Soc. 2019, 57, 125–134. [Google Scholar] [CrossRef]
- Dutta, A. Telecommunications and economic activity: An analysis of Granger causality. J. Manag. Inf. Syst. 2001, 17, 71–95. [Google Scholar]
- Chiou-Wei, S.Z.; Chen, C.F.; Zhu, Z. Economic growth and energy consumption revisited—Evidence from linear and nonlinear Granger causality. Energy Econ. 2008, 30, 3063–3076. [Google Scholar] [CrossRef]
- Song, M.L.; Zheng, C.B.; Wang, J.Q. The role of digital economy in China’s sustainable development in a post-pandemic environment. J. Enterp. Inf. Manag. 2021, 35, 58–77. [Google Scholar] [CrossRef]
- Liu, J.; Jia, F.X. Construction of a Nonlinear Model of Tourism Economy Forecast Based on Wireless Sensor Network from the Perspective of Digital Economy. Wirel. Commun. Mob. Comput. 2021, 2021, 8576534. [Google Scholar] [CrossRef]
- Granger, C.W.; Newbold, P. Forecasting Economic Time Series, 2nd ed.; Academic Press: Cambridge, MA, USA, 1986; pp. 67–68. [Google Scholar]
- Hiemstra, C.; Jones, J.D. Testing for linear and nonlinear Granger causality in the stock price-volume relation. J. Financ. 1994, 49, 1639–1664. [Google Scholar] [CrossRef]
- Zhao, L.L.; Wen, F.H.; Wang, X. Interaction among China carbon emission trading markets: Nonlinear Granger causality and time-varying effect. Energy Econ. 2020, 91, 104901. [Google Scholar] [CrossRef]
- Chow, S.C.; Cunado, J.; Gupta, R.; Wong, W.K. Causal relationships between economic policy uncertainty and housing market returns in China and India: Evidence from linear and nonlinear panel and time series models. Stud. Nonlinear Dyn. Econom. 2018, 22, 1–31. [Google Scholar] [CrossRef] [Green Version]
- Diks, C.; Panchenko, V. A new statistic and practical guidelines for nonparametric Granger causality testing. J. Econ. Dyn. Control. 2006, 30, 1647–1669. [Google Scholar] [CrossRef] [Green Version]
- Dergiades, T.; Martinopoulos, G.; Tsoulfidis, L. Energy consumption and economic growth: Parametric and non-parametric causality testing for the case of Greece. Energy Econ. 2013, 36, 686–697. [Google Scholar] [CrossRef] [Green Version]
- Wasserman, S.; Faust, K. Social Network Analysis: Methods and Applications; Cambridge University Press: Cambridge, UK, 1994. [Google Scholar]
- Liu, J. Whole Network Analysis: A Practical Guide to UCINET Software; People’s Publishing House: Shanghai, China, 2014; pp. 144–184. [Google Scholar]
- Headquarters, U.N. 2019 Digital Economy Report; United Nations Conference on Trade and Development: New York, NY, USA, 2019. [Google Scholar]
- Li, S.; Tang, G.; Yang, D.; Du, S. Research on the relationship between CPI and PPI based on VEC model. Open J. Stat. 2019, 9, 218–229. [Google Scholar] [CrossRef] [Green Version]
- Lopez, L.; Weber, S. Testing for Granger causality in panel data. Stata J. 2017, 17, 972–984. [Google Scholar] [CrossRef] [Green Version]
- Francis, B.B.; Mougoue, M.; Panchenko, V. Is there a symmetric nonlinear causal relationship between large and small firms? J. Empir. Financ. 2010, 17, 23–38. [Google Scholar] [CrossRef]
- Shu, J.H.; Zhang, J.E. Causality in the VIX futures market. J. Futures Mark. 2012, 32, 24–46. [Google Scholar] [CrossRef]
- Zhang, L.L.; Pan, A.; Feng, S.S.; Qin, Y.Y. Digital economy, technological progress, and city export trade. PLoS ONE 2022, 17, e0269314. [Google Scholar] [CrossRef]
- Zhang, J. Estimation of China’s provincial capital stock (1952–2004) with applications. J. Chin. Econ. Bus. Stud. 2008, 6, 177–196. [Google Scholar] [CrossRef]
- Zhang, L.X.; Liu, X.; Li, D.L.; Fu, Z.T. Evaluation of the rural informatization level in four Chinese regions: A methodology based on catastrophe theory. Math. Comput. Model. 2013, 58, 868–876. [Google Scholar] [CrossRef]
- Guan, X.L.; Wei, H.K.; Lu, S.S.; Dai, Q.; Su, H.J. Assessment on the urbanization strategy in China: Achievements, challenges and reflections. Habitat Int. 2018, 71, 97–109. [Google Scholar] [CrossRef]
- Hao, Y.; Zheng, S.Q.; Zhao, M.Y.; Wu, H.T.; Guo, Y.X.; Li, Y.W. Reexamining the relationships among urbanization, industrial structure, and environmental pollution in China-New evidence using the dynamic threshold panel model. Energy Rep. 2020, 6, 28–39. [Google Scholar] [CrossRef]
- Lin, S.F.; Xiao, L.; Wang, X.J. Does air pollution hinder technological innovation in China? A perspective of innovation value chain. J. Clean. Prod. 2021, 278, 123326. [Google Scholar] [CrossRef]
- Acosta, P.; Gasparini, L. Capital accumulation, trade liberalization, and rising wage inequality: The case of Argentina. Econ. Dev. Cult. Change 2007, 55, 793–812. [Google Scholar] [CrossRef] [Green Version]
- Mendez, C.; Kataoka, M. Disparities in regional productivity, capital accumulation, and efficiency across Indonesia: A club convergence approach. Rev. Dev. Econ. 2021, 25, 790–809. [Google Scholar] [CrossRef]
- Deng, H.Y.; Bai, G.; Shen, Z.Y.; Xia, L.Q. Digital economy and its spatial effect on green productivity gains in manufacturing: Evidence from China. J. Clean. Prod. 2022, 378, 134539. [Google Scholar] [CrossRef]
- Milskaya, E.; Seeleva, O. Main directions of development of infrastructure in digital economy. IOP Publ. 2019, 497, 012081. [Google Scholar] [CrossRef]
- Wang, H.T.; Hu, X.H.; Ali, N. Spatial Characteristics and Driving Factors toward the Digital Economy: Evidence from Prefecture-Level Cities in China. J. Asian Financ. Econ. Bus. 2022, 9, 419–426. [Google Scholar] [CrossRef]
- Chen, Z.; Ke, R.; Li, H. A study on the development of China’s digital economy based on provincial panel data. Acad. J. Bus. Manag. 2022, 4, 19–25. [Google Scholar]
Figure 1.
The spatial correlation network of China’s digital economy.

Figure 2.
Relationship between blocks.


Table 1.
Individual network characteristics of China’s digital economy spatial association network.
| Province | Degree Centrality | Proximity Centrality | Intermediate Centrality | |||||
|---|---|---|---|---|---|---|---|---|
| Point-Out Degree | Point-In Degree | Centrality | Ranking | Centrality | Ranking | Centrality | Ranking | |
| Beijing | 20 | 10 | 86.667 | 1 | 88.235 | 1 | 3.533 | 1 |
| Tianjin | 20 | 9 | 53.333 | 18 | 68.182 | 18 | 0.875 | 19 |
| Hebei | 18 | 14 | 63.333 | 12 | 73.171 | 12 | 1.629 | 10 |
| Shanxi | 16 | 19 | 50.000 | 22 | 66.667 | 22 | 0.868 | 21 |
| Inner Mongolia | 15 | 13 | 70.000 | 7 | 76.923 | 7 | 2.049 | 7 |
| Liaoning | 15 | 10 | 53.333 | 18 | 68.182 | 18 | 0.871 | 20 |
| Jilin | 13 | 17 | 70.000 | 7 | 76.923 | 7 | 1.624 | 12 |
| Heilongjiang | 13 | 9 | 66.667 | 9 | 75.000 | 9 | 1.808 | 8 |
| Shanghai | 13 | 14 | 76.667 | 5 | 81.081 | 5 | 2.888 | 3 |
| Jiangsu | 13 | 14 | 56.667 | 14 | 69.767 | 14 | 1.198 | 14 |
| Zhejiang | 12 | 7 | 80.000 | 3 | 83.333 | 3 | 2.815 | 4 |
| Anhui | 12 | 12 | 66.667 | 9 | 75.000 | 9 | 1.713 | 9 |
| Fujian | 12 | 10 | 50.000 | 22 | 66.667 | 22 | 0.561 | 28 |
| Jiangxi | 12 | 8 | 50.000 | 22 | 66.667 | 22 | 0.513 | 29 |
| Shandong | 11 | 9 | 50.000 | 22 | 66.667 | 22 | 0.730 | 23 |
| Henan | 11 | 9 | 46.667 | 28 | 65.217 | 28 | 0.728 | 24 |
| Hubei | 11 | 13 | 73.333 | 6 | 78.947 | 6 | 2.311 | 6 |
| Hunan | 11 | 11 | 53.333 | 18 | 68.182 | 18 | 0.674 | 25 |
| Guangdong | 11 | 11 | 46.667 | 28 | 65.217 | 28 | 0.820 | 22 |
| Guangxi | 10 | 12 | 36.667 | 31 | 61.224 | 31 | 0.269 | 31 |
| Hainan | 10 | 11 | 80.000 | 3 | 83.333 | 3 | 2.489 | 5 |
| Chongqing | 9 | 16 | 53.333 | 18 | 68.182 | 18 | 0.646 | 26 |
| Sichuan | 9 | 6 | 46.667 | 28 | 65.217 | 28 | 0.383 | 30 |
| Guizhou | 9 | 7 | 56.667 | 14 | 69.767 | 14 | 0.982 | 15 |
| Yunnan | 9 | 12 | 50.000 | 22 | 66.667 | 22 | 0.908 | 17 |
| Tibet | 9 | 24 | 56.667 | 14 | 69.767 | 14 | 0.948 | 16 |
| Shaanxi | 9 | 11 | 60.000 | 13 | 71.429 | 13 | 1.452 | 13 |
| Gansu | 8 | 10 | 66.667 | 9 | 75.000 | 9 | 1.628 | 11 |
| Qinghai | 8 | 10 | 83.333 | 2 | 85.714 | 2 | 3.385 | 2 |
| Ningxia | 8 | 13 | 56.667 | 14 | 69.767 | 14 | 0.885 | 18 |
| Xinjiang | 7 | 13 | 50.000 | 22 | 66.667 | 22 | 0.577 | 27 |
| Mean value | 12 | 12 | 60.000 | 72.025 | 1.379 | |||
Table 2.
Block spillover effect of the spatial relationship of China’s digital economy.
| Block | Number of Relations Received | Total Volume Analysis | Intensity Analysis | |||||
|---|---|---|---|---|---|---|---|---|
| Block I | Block II | Block III | Block IV | Total External Spillover | Total Spillover Received | Spillover Intensity | Reception Intensity | |
| Block I | 20 | 21 | 35 | 13 | 69 | 49 | 0.411 | 0.292 |
| Block I | 14 | 18 | 61 | 22 | 97 | 78 | 0.462 | 0.371 |
| Block I | 17 | 39 | 37 | 13 | 69 | 108 | 0.329 | 0.514 |
| Block I | 18 | 18 | 12 | 6 | 48 | 48 | 0.444 | 0.444 |
Table 3.
The density matrix and image matrix of China’s digital economy.
| Block | Number of Relations Received | Image Matrix | ||||||
|---|---|---|---|---|---|---|---|---|
| Block I | Block II | Block III | Block IV | Block I | Block II | Block III | Block IV | |
| Block I | 20 | 21 | 35 | 13 | 69 | 49 | 0.411 | 0.292 |
| Block II | 14 | 18 | 61 | 22 | 97 | 78 | 0.462 | 0.371 |
| Block III | 17 | 39 | 37 | 13 | 69 | 108 | 0.329 | 0.514 |
| Block IV | 18 | 18 | 12 | 6 | 48 | 48 | 0.444 | 0.444 |
Table 4.
QAP regression analysis.
| Variables | Non-Standardized Regression Coefficient | Standardized Regression Coefficient | Probability of Significance | Probability A | Probability B |
|---|---|---|---|---|---|
| Intercept term | 0.379 | 0.000 | --- | --- | --- |
| 0.003 | 0.162 | 0.042 | 0.042 | 0.958 | |
| 0.000001 | 0.080 | 0.038 | 0.038 | 0.962 | |
| 0.111 | 0.047 | 0.279 | 0.279 | 0.722 | |
| −0.001 | −0.013 | 0.408 | 0.592 | 0.408 | |
| −0.000001 | −0.153 | 0.042 | 0.959 | 0.042 | |
| 0.085 | 0.062 | 0.029 | 0.029 | 0.971 |
Disclaimer/Publisher’s Note: The statements, opinions and data contained in all publications are solely those of the individual author(s) and contributor(s) and not of MDPI and/or the editor(s). MDPI and/or the editor(s) disclaim responsibility for any injury to people or property resulting from any ideas, methods, instructions or products referred to in the content. |
© 2023 by the authors. Licensee MDPI, Basel, Switzerland. This article is an open access article distributed under the terms and conditions of the Creative Commons Attribution (CC BY) license (https://creativecommons.org/licenses/by/4.0/).
Share and Cite
MDPI and ACS Style
Huang, J.; Jin, H.; Ding, X.; Zhang, A. A Study on the Spatial Correlation Effects of Digital Economy Development in China from a Non-Linear Perspective. Systems 2023, 11, 63. https://doi.org/10.3390/systems11020063
AMA Style
Huang J, Jin H, Ding X, Zhang A. A Study on the Spatial Correlation Effects of Digital Economy Development in China from a Non-Linear Perspective. Systems. 2023; 11(2):63. https://doi.org/10.3390/systems11020063
Chicago/Turabian StyleHuang, Jie, Huali Jin, Xuhui Ding, and Aihua Zhang. 2023. "A Study on the Spatial Correlation Effects of Digital Economy Development in China from a Non-Linear Perspective" Systems 11, no. 2: 63. https://doi.org/10.3390/systems11020063
Note that from the first issue of 2016, this journal uses article numbers instead of page numbers. See further details here.