
The Development, Coupling Degree, and Value-Added Capability of the Digital Economy and Manufacturing Industry in China

1
College of Economics and Management, Nanjing University of Aeronautics and Astronautics, Nanjing 211106, China
2
Anhui Business College of Vocational Technology, Wuhu 241002, China
3
College of Economics and Management, Nanjing Forestry University, Nanjing 210037, China
*
Author to whom correspondence should be addressed.
Systems 2023, 11(2), 52; https://doi.org/10.3390/systems11020052
Submission received: 27 November 2022
/
Revised: 13 January 2023
/
Accepted: 14 January 2023
/
Published: 18 January 2023
(This article belongs to the Section Systems Practice in Social Science)
Abstract
:Our goal in this study was to measure the developments, coupling degrees, and value-added abilities of the digital economy and manufacturing industry in China. We clarified the relationship between the coupling degree and value-added ability of the system. We also identified the dynamic factors that affect the value-added ability of the system. On the basis of a literature review and theoretical analysis, we constructed a vector coupling model of the evolution of the system, and we used a combination of entropy weight, SFA, and other methods. We found that the development levels of the digital economy and manufacturing industry in China have continued to im-prove, but we noted considerable differences between different provinces. Furthermore, by using model decomposition, we calculated the average contribution rate of the digital economy, manufacturing industry, and the coupling degree of the two systems to the added value of the overall system. The digital economy has rapidly developed in all provinces and has played a notable role in promoting the value-added capacity of the system, especially in provinces that were lagging. This catch-up effect of the digital economy can narrow the economic gap between provinces. The digital economy is highly efficient, enabling, and inclusive, and thus can be coupled with the development of the manufacturing industry to produce synergies and enhance the value-added abilities of the two systems.
1. Introduction
The digital economy has become a new engine driving high-quality economic development in China. In 2020, the size of China’s digital economy was USD 5.4 trillion, ranking second in the world, only to the United States, which had a digital economy of USD 13.6 trillion. China’s digital economy accounted for 38.6% of GDP, whereas that of the United States accounted for more than 60% [1]. This illustrates the importance and broad room for the development of the digital economy in China. At present, China has entered a digital economy era characterized by data, platform support, software definition, and the Internet of everything. With the development of the digital economy, the boundary of the original factors affecting production has been broken, and data have been incorporated into the functioning of economic growth. With the continuous emergence and wide application of digital technology, the digital economy will lead to industrial changes and play an important role in promoting the transformation and upgrading of the manufacturing industry.
The manufacturing industry is the core of modern industrial systems. China has the widest range of manufacturing categories, as well as the largest and most complete manufacturing industry system in the world. However, China’s manufacturing industry is large but not strong, complete but not high-quality, so the transformation and upgrading of the industry is urgently required to improve the value chain. The coupled development of the digital economy and manufacturing industry, producing many advantages such as high efficiency, innovation, environmental friendliness, coordination, and sharing, can reduce the costs of the manufacturing industry and increase the added value, as well as expand the development space, of the digital economy [2,3]. If the digital economy and manufacturing industry develop separately, their ability to create added value will only depend on the development levels of the two systems. If the digital economy and manufacturing industry are coupled, additional synergies will be generated. The generation of strength through coupling is necessary to enhance the value-added ability of the two systems. Additionally, to generate this coupling strength, the coupling degree threshold must be crossed. Therefore, the coupled development of the manufacturing industry and digital economy, by crossing the coupling degree threshold, is the only way to enhance the ability of the system to add value.
The main contributions of this study are as follows: First, in terms of model construction, based on economic system evolution theory, through Lotka-Volterra derivation, and following the vector calculation rules, we constructed a vector coupling model of the evolution of the system, which enriches the methods in the literature for system coupling coordination calculation. Second, in terms of model improvement, the developed system evolution vector coupling model can calculate the coupling degree and the value-added ability of the two systems. This advances the field from the system coupling level to the system value-added level. Third, the theoretical component of our study enriches the theory and literature on evolutionary economy and promotes the progress of the measurement in evolutionary economic theory. Fourth, in terms of data and measurement, as we used eight years of data from China’s 30 provinces, the index system is data-rich. We combined the entropy weight method, the system evolution vector coupling model, and SFA to ensure the accuracy of the calculated results. Finally, in terms of the study results, we calculated accurate values of the development, coupling degree, and value-added capacity of the two systems (digital economy and manufacturing), clarifying the importance of the role of the digital economy in improving the value-added capacity of the system. Our study can also be used as a reference for other countries.
The remainder of this paper is structured as follows: Section 2 provides a literature review, further clarifying the content and innovation of this study by describing the relevant literature. Section 3 is devoted to theory and methods, in which we discuss the theoretical basis of the coupled development of the digital economy and manufacturing industry and added-value creation; then, we describe the calculation method and the construction of the measurement index system. Section 4 provides the results, included the results of the calculations of the development, coupling degree, and value-added ability of the digital economy and manufacturing industry. We outline an in-depth analysis of the calculation results. In Section 5, we provide a discussion as well as the implications of our findings, stating our conclusions and some limitations.
2. Literature Review
ICT has boosted employment [4], broadened the global purchasing channels [5], and improved total factor productivity in the manufacturing industry [6]. Leveraging big data analysis technologies, the manufacturing industry can further optimize and manage the production process and promote the development of green manufacturing [7]. The application of big data technologies positively correlates with the increase in the innovation capability in the manufacturing industry [8]. The application of big data enables manufacturing enterprises to build a new portfolio of production factors and increases production efficiency [9]. Additionally, the application of the industrial Internet has strongly promoted the high-quality development of the manufacturing industry [10]. With the help of the Internet, an intelligent manufacturing mode is being developed, where the ability to collect and analyze data has become a key factor in increasing the quality of manufacturing products [11]. The deep integration of the digital economy and manufacturing industry can improve the efficiency of independent innovation, promote the development of advanced manufacturing clusters, and lead to the constant creation of new models, formats, and industries [12]. With the developments of science and technology, the digital economy has extensively and deeply penetrated the traditional manufacturing industry, which has motivated the digital transformation of the traditional manufacturing industry [13].
China’s domestic researchers have long paid attention to the influence of information technology on industrial development [14]. With the rise of the Internet, the relationships between the Internet and the development of the manufacturing industry were studied [15]. As the digital economy thrives, the focus of researchers has gradually been shifting to the coupled development of the digital economy and manufacturing industry [16,17]. The theory of the coupled development of the digital economy and manufacturing industry has been mainly studied from the following three aspects: The first is exploring the reasons why the digital economy drives the transformation and upgrading of the manufacturing industry. The development of the manufacturing industry and digital transformation involves coupled processes and interactions. Technological innovation and hu-man capital are important factors allowing the digital economy to drive the upgrading of the manufacturing industry [17,18]. However, a single factor is insufficient for the transformation and upgrading of manufacturing enterprises: Some sort of transformation and upgrading driven by a configuration of multiple factors is needed. Three configurations can promote the transformation and upgrading of manufacturing enterprises based on driving factors: resources and innovation under the dominance of the digital environment, independent innovation with the help of the digital environment, and independent innovation within enterprises [19]. The digital economy has promoted the customization and diversification of manufacturing products, the intelligent and network-based development of manufacturing production technology, and the collaborative and flexible development of manufacturing production, organization, and management [16]. The digital economy has gradually empowered the manufacturing industry more through creating value than through remodeling value. This is embodied by transformation in four dimensions: from factor-driven to data-driven, from product-oriented to user-experience-oriented, from industrial association to enterprise community, and from competition and cooperation to mutual benefit and symbiosis [3]. The second aspect is analyzing the path of the coupling between the digital economy and manufacturing industry. Industrial coupling is achieved based on the decomposition and reconstruction of the industrial chain in terms of production mode and organizational form [20]. To promote the coupled development of the digital and manufacturing industries, we must consider the multidimensional ways data provide driving influences, innovation, demand, and supply, so as to provide strong momentum for the transformation of the manufacturing industry [3]. The manufacturing industry should be deeply coupled with the digital industry to transform quality, efficiency, and power. The government should implement measures to optimize the development environment, improve the new infrastructure, strengthen scientific and technological innovation, improve the industrial ecology, and promote the training of professionals to advance the coupled development of the digital and manufacturing industries [21]. The third aspect is analyzing the effect of coupling between the digital economy and manufacturing industry. The development of the digital economy produces dual effects: optimizing the allocation of data elements and improving the productivity of the manufacturing industry. The impact of digital economic development on manufacturing productivity is heterogeneous among different enterprises of different scales and in various regions [22,23]. The coupled development of the digital economy and manufacturing industry has promoted manufacturing innovation and it is moving up the value chain [24,25]. At present, the entropy weight method (EWM) can be used to measure the effect of coupling between the digital economy and manufacturing industry [26,27]. This method illustrates the system coupling between industries by measuring the technology coupling between them. Additionally, input–output analysis can be used to measure the coupling degree between the digital and manufacturing industries [28]. However, the digital economy includes not only the digital industry, but also digital infrastructure and industry digitization, among others. The measurement methods are therefore not sufficiently comprehensive. The method used most is the coupling coordination degree model [29], which is simple to calculate and easy to understand. However, this model essentially measures the distance and is a kind of static and mechanistic measurement method (The standard model of the coupling coordination degree between two systems is . If the digital economy is 1 and the manufacturing industry is 3, the calculation result is : If the digital economy is 2 and the manufacturing industry is 6, the result calculated with the model is still the same. In an economic development system, the coupling degrees of the above two situations being the same is hard to believe. In reality, the measurement results are the same only because the relative distance between them is not changed. As such, using this model to calculate the value-added capability of a system and decompose the effect would be challenging).
Through reviewing the literature, we found that the current studies on the digital economy and manufacturing industry are mostly based on qualitative analysis; the sup-port of quantitative studies is lacking. Researchers have focused more on the practical path through which the digital economy and manufacturing industry have developed and the motivation for this development, but studies on their coupling degree and value-added capability are scarce. Most of the studies have focused on the impact of the digital economy on the transformation and upgrading of the manufacturing industry, whereas the impact of the manufacturing industry on the digital economy remains to be ad-dressed. Most related studies have been constrained to measuring the coupling degree of a system, but few have been dedicated to the value-added capability. Economic development is a vector system with both direction and size. The coupling degree indicates the direction of system development, whereas the value-added capability (coupling performance) measures the size of development. The coupling between the digital economy and the manufacturing industry is necessary for increasing the value-added capability of the system, for which the threshold must be exceeded. In addition, the development level of the two systems is an important factor enhancing the value-added capability of the system. If the two systems poorly develop, the value-added capability of the system will be weak, regardless of the coupling degree. Therefore, the high-quality development, coupling degree, and value-added capability of the digital economy and manufacturing industry must be measured to clarify the relationships among them and define the driving factors to enhance the value-added capability of the system. This is an interconnected process, which requires a step-by-step exploration. Targeting the above-mentioned problems, this study provides the following contributions: First, we adopted a new perspective on the high-quality development, coupling degree, and value-added capability of the digital economy and manufacturing industry. Second, we applied a new method of measurement. Based on coevolution theory and the vector characteristics of the digital economy and the manufacturing industry, we built a coupled vector model of system evolution, in which we comprehensively used the entropy weight method, system evolution vector coupling model, SFA, and other methods for quantitative measurement. Third, we advanced the research level: We deepened the research in this field from the coupling to the value-added capability of a system. Furthermore, through the analysis of the evolution pattern of the coupling degree and value-added capability of the system, and the decom-position of system value-added capability, we clarified the relationships between the coupling degree of the digital economy and the manufacturing system and their value-added capability, and we identified the dynamic factors affecting the value-added capability of the system.
As such, the main innovative contributions of our study are as follows: first, the in-novation of the study perspective. We chose the development, coupling degree, and value-added ability of the digital economy and manufacturing industry as the study perspective. Second, our measurement methods are innovative. Based on the theory of coevolution and the vector characteristics of the digital economy and manufacturing system, we constructed a vector coupling model of system evolution. We comprehensively used entropy weight, the system evolution vector coupling model, SFA, and other methods for quantitative measurement. Third, this study is innovative because we deepened the research from the system coupling level to the system value-added level. Furthermore, through the analysis of the evolution of system coupling degree and value-added capability, as well as the decomposition of system value-added capacity, we clarified the relationship between the coupling degree of the digital economy and manufacturing industry and value-added capability, and we identified relevant factors that affect the system’s value-added capability.
3. Theory and Methods
3.1. Theoretical Foundations of Interaction between the Digital Economy and Manufacturing System
3.1.1. The Coupling Mechanism between Digital Technology and Manufactured Products
In the era of the digital economy, product manufacturing is centered on users’ needs. Enterprises need to quickly respond to user demands, perform targeted R&D, and diversify production [24]. Traditional manufacturers tend to adopt standardized production to take advantage of scale to cut costs. They are not able to meet users’ needs for small-batch and personalized production. In the digital economy era, the access to the Internet enables the rapid matching of production resources. The application of intelligent systems allows producers to meet the personalized needs of customers while reducing [30]. Moreover, industrialized large-scale production can easily lead to overcapacity. Conversely, digital production, with the application of digital technology, can be used to arrange the procurement of raw material, production, and sales according to data and user needs, enabling the accurate control of inputs and outputs, thus better solving the problem of overcapacity. The application of advanced digital technology for increasing the production capacity of the manufacturing industry has attained the impossible trinity in the industrial age, in which high-quality products, good services, and low prices could not be simultaneously achieved [7].
Digital technology can be used to access and collect the data on products from three dimensions: design, manufacturing, and operation. Digital technology is used to create a digital twin model in the digital world for physical products. As such, the problems that cannot be solved in the real world can be addressed in the digital world. Digital technology supports the testing, simulation, and restoration of products; as a result, a series of complex problems can be solved, and the risk of uncertainty can be considerably reduced [31]. In the era of the digital economy, digital products and technologies have penetrated all fields of production. The production in the manufacturing industry now requires the support of digital products and technologies. Additionally, digital products and technologies must be based on the physical manufactured products [22]. For example, the application of software in the digital economy is widespread in manufacturing production. Software is the force driving the future scientific, technological, and industrial revolutions, also bridging the coupled development of digital and manufacturing industries. All steps of R&D, manufacturing, management, and service in the manufacturing industry are inseparable from the application of software. The business links in the whole production cycle of the manufacturing industry have been modeled, coded, and instrumentalized with software, which has become the core of the intelligent manufacturing industry [32].
3.1.2. Coupling Mechanism between Digital Technology and Manufacturers
The competition among enterprises mainly occurs in terms of efficiency and cost, both of which are closely related to digital technology. By using digital technology, manufacturers can optimize design, R&D, manufacturing, management, and service, reduce costs, and improve production efficiency. Digitization can allow the efficient matching of the value production links of enterprises, as well as accelerate profit realization. Digitization can also be used to optimize the cost of manufacturers, and digital technology can increase the management efficiency and quality of enterprises [23]. In traditional enterprises, high-efficiency management is often accompanied by high risks. With multilayered approval flow, however, safety seems to be guaranteed, but at the cost of efficiency. Digital technology can be used to solve this contradiction by connecting and integrating business, personnel, data, and other elements on a platform. Platform-based solutions allow enterprise capabilities to continuously evolve and iterate, further empowering their employees and teams [27]. Digital platforms can connect all resources that are shared by all and can be directly mobilized to quickly support business. Additionally, digital platforms enable the standardization of business based on customer needs, thus ensuring the quality of the business. Enterprises often must deal with market changes and make the correct decisions to manage their effects. With their data resources and intelligent processing ability, digital platforms can help managers make decisions and increase work efficiency. Data platforms include all producers, production tools, and production factors; they optimize the allocation of resources with big data and artificial intelligence, and provide the capability outputs for enterprise employees and teams. As business processing and data recording increase, the output capability of digital platforms has also been improved [22].
3.1.3. The Coupling Mechanism between the Digital Economy and Manufacturing Industry
Economic theory states that the division of labor is the force driving increased pay and economic growth. A further analysis of the division of labor leads to three problems: First, the division of labor is limited by the extent of the market. Second, the expansion of the division of labor is accompanied by an increase in transaction costs. Third, the division of labor does not necessarily lead to a continuous increase in returns [33]. The coupling between the digital economy and manufacturing industry is the key to solving the above problems. The consumer and industrial Internet, which are based on information technology, have broken through time and space barriers, achieved the virtual integration and gathering in IT space of segmented markets in different times and places, expanded the market scale, reduced transaction costs, and increased transaction efficiency. The application of digital technology reduces these costs, breaks the constraint of transaction cost on the division of labor in the manufacturing industry, and continuously expands the boundary of the division of labor in the industrial chain. The coupled development of the manufacturing industry and digital economy is the only way to move up the value chain, and only the manufacturing industries at the high end of the value chain can secure continuously increasing returns [12].
The progress of digital technology has promoted the service-oriented manufacturing industry, which is an important direction for upgrading and developing the industry and is an important field in the development of the digital economy. The application of digital technology allows manufacturers to produce and provide product and service portfolios (product-service system) at a lesser cost than the sum of the costs of multiple enterprises providing the same amount of products and services separately (cost subadditivity of product service system) [8]. With digital technology, services such as digital delivery, fault diagnosis, and technical services can be completed, thus quickly responding to customers’ needs. The value of service-oriented manufacturing is produced by markedly enhancing the stickiness between manufacturers and customers, and even deprives other producers of the opportunity to enter the market. Moreover, through service-oriented manufacturing, manufacturers understanding the production frequency and development trends of the enterprises and industries they serve.
3.2. Methods
The coupling between the digital economy and manufacturing systems can be characterized by a vector: direction and size. The coupling between the digital economy and manufacturing industry means that the elements and forms of the two systems interact with each other, resulting in value-added capability. Therefore, to measure the coupling degree and value-added capability of the digital economy and manufacturing industry, we proceeded from the direction and size of the two systems. The coupling degree of the two systems is the direction of the interaction between them, whereas the value-added capability is the size of that interaction. The digital economy and manufacturing industry are interdependent, mutually promoted, mutually beneficial, and symbiotic. The operation of the two systems conforms to the growth law of the logistic model and meet the conditions of applying the Lotka–Volterra model. Therefore, the collaborative evolution model of the digital economy and manufacturing industry is as follows:
where represents the digital economy system, is the manufacturing system, is the growth limit of the digital economy, is the growth limit of the manufacturing industry, is the growth rate of the digital economy, is the growth rate of the manufacturing industry, is the efficiency of the manufacturing industry in promoting the development of the digital economy, and is the efficiency of the digital economy in promoting the development of the manufacturing industry. If a coordinate vector lets and all equal 0, then is called the equilibrium point of the following system of Equation (2):
By solving the system of Equation (2), we can obtain the equilibrium point of the coupled development of the digital economy and manufacturing industry as follows:
When , we obtain , which implies , meaning the point is . When , the point is . When , it is . When , it is . Therefore, the equilibrium points of the coupled development between the digital economy and manufacturing industry are , and .
In the next step, we further inferred the stable solutions among the four equilibrium point solutions of the system of Equation (2). The following system of Equation (3) was obtained from Equation (2).
In the linear differential equations system with constant coefficients, , where is the coefficient matrix. In the system of Equation (3), , so we have , where
so we can obtain the coefficients of the characteristic equation as follows:
In the case of ,; in the case of ,; in the case of . ; in the case of , .
We further discussed the above results based on economic realities. Among the four equilibrium points we obtained for the coevolution of the digital economy system and manufacturing system, is a zero-point solution, indicating that the digital economy and manufacturing industry have not yet developed, which is not in line with the situation in reality. The solution is a corner solution, indicating that the digital economy has fully developed while the manufacturing industry has not. is also a corner solution, indicating that the manufacturing industry has fully developed while the digital economy has not developed. The system evolution in this special situation does not align with the current reality of the digital economy and manufacturing industry. is an interior solution, which satisfies the condition for stability that and . It agrees with the characteristics in reality that the two systems promote each other and coevolve. Therefore, is a stable solution of the model. In such a case, the coupling coefficients of the two systems and are in a relatively balanced position. The coupling coefficient represents the synergy effect between the digital economy and manufacturing systems realized through elements sharing and technology spillovers. The product of and exactly expresses the direction of the coupled development of the two systems, and is in line with the theoretical analysis in this study. and are measurements of the coupling between the two systems [34], which can be calculated as follows:
The value range of should be . Both digital economy and manufacturing systems have the characteristics of a vector, with both direction and size. can be converted into the angle between the two systems. If the vectors of the two systems move in the same direction, , which means they are completely decoupled. If the vectors change in directions that are perpendicular, , and they are completely coupled. If the angle between the two vectors and the coupling maintains linear transformation relationships, then , where is the angle between the digital economic system vector and the manufacturing system vector (Figure 1). Therefore, . As ; the angle between the two vectors can be calculated as follows:
The coupling between the digital economy and manufacturing industry is important; what is more important is that they must have strong coupling performance. This coupling performance is considered the value-added capability of the two systems, which reflects the vector size. The value-added capability of the two systems depends on two aspects. The first is the coupling direction of the two systems, that is, the coupling degree. The coupling degree of the two systems is a necessary condition for strong coupling performance. If the digital economy and manufacturing industry are poorly coupled, even if both systems develop well, they will not have a high value-added capability. The second aspect is the respective development levels of the digital economy and manufacturing industry. This means that if the systems each develop poorly, the value-added capability will not be very high, even if the two systems are highly coupled. The development of the digital economy needs the support of the manufacturing industry, without which the value-added capability of the digital economy will not be high. The transformation and upgrading of the manufacturing industry also cannot occur without the digital economy. We used the area of the parallelogram composed of the two vector systems for the digital economy and manufacturing industry to define the value-added capability of the coupled development of the two systems. The area of the parallelogram depends on the magnitude and included angle of the two vectors of the digital economy and manufacturing industry (Figure 1). Therefore, the model for calculating the value-added capability of the coupling between the digital economy and manufacturing industry is . As , the model for calculating the value-added capability is
We measured the comprehensive index of digital economy and manufacturing industry development with the entropy weight method.
The dimensions and orders of magnitude of each index in the evaluation system are different, so standardization was required to enable horizontal comparison. We adopted the following methods to standardize the indices:
where is the maximum value in the indices, is the minimum value in the indices, and is the standardized result. After standardizing the indices, the proportion of the indices in year is calculated as follows:
The information entropy of the index can be calculated by :.
The redundancy of information entropy can be calculated by : , where is the year of evaluation.
The weight of an index can be calculated according to the redundancy of information entropy:
The comprehensive index of system development can be calculated according to the standardized index and index weight : , where is between [0, 1]. The larger the , the more developed the system, and vice versa.
Referring to a previous approach [14], we built a nonparametric stochastic frontier model (SFA) for the coupled development of the digital economy and manufacturing industry. We incorporated the provincial, municipal, and time effects into the model in nonparametric form to measure the promotion efficiency between the digital economy system and the manufacturing industry system. The SFA model does not restrict the coupling form of the digital economy and manufacturing industry, and the time and regional effects do not act on the coupling process in a simple linear form, which avoids the deviation of a simple linear process and aligns with the dynamics of the coupling between the digital economy and the manufacturing industry. The model of the digital economy promoting manufacturing industry development is as follows:
where is the comprehensive index of digital economy development, is the comprehensive index of the manufacturing industry development, is the uncontrollable stochastic interference, and is the loss of efficiency. Similarly, the model of the manufacturing industry promoting the development of the digital economy is
The efficiency value calculated under the SFA model is the ratio of system development value to frontier, that is, the values of and [35,36]. These two values represent the efficiency of mutual promotion between the two systems. The closer the system development value to the frontier, the stronger the interaction between the systems, and vice versa:
where represents the efficiency of the manufacturing industry in promoting the development of the digital economy; is the efficiency of the digital economy in promoting the development of the manufacturing industry; is the highest level of the digital economy development; and is the highest level of the manufacturing industry development. We calculated the coupling degree between the two systems as follows:
When the coupling coefficient , the two systems are completely coupled, and when , they are not fully coupled. Finally, according to Equations (6) and (10), we calculated the value-added capability of the two systems.
3.3. Index System
Considering the data availability and synthesizing the studies in the literature, we constructed an omnidirectional measurement index system for the high-quality development of the digital economy. Taking the comprehensive index of the digital economy as the target layer, we decomposed the comprehensive index of the digital economy into 17 indicators from three dimensions: digital economic infrastructure, industrial digitization, and digital industrialization. The construction of the digital economy high-quality development measurement index system is shown in Table 1. First, digital infrastructure is the foundation supporting the operation and development of the digital economy. The Organization for Economic Cooperation and Development (OECD) and the United States Bureau of Economic Analysis (BEA) have incorporated digital infrastructure into the digital economy measurement index system. Referring to the literature [37,38,39,40,41], the digital infrastructure indicators we constructed in this study included optical cable line length, mobile phone penetration, Internet broadband, and other infrastructure. The number of ICT employees also increased in the index system, which we used to measure the human capital conditions that support the operation of the digital economy. Second, industrial digitization is the increases in output and efficiency produced by the application of digital technology in traditional industrial sectors, indicating the deep integration of digital technology and traditional industries. Referring to the literature [37,38,42,43], we used e-commerce sales, online retail sales, and other indicators to measure the digitization of the industry. With reference to a previous study [44], we used the digital inclusive financial index to measure the effect of financial development on the digital economy. Finally, digital industrialization refers to the industry closely related to the study, promotion, and application of digital technology, which can provide technical support for the development of industrial digitalization. Software is the bridge between the physical world and the digital world, which is crucial for the development of the digital economy. Referring to the literature [37,45,46], we used the total amount of telecom business, software business income, and software product income to measure the level of digital industrialization.
The development of the manufacturing industry should take quality improvement as the direction, and scientific and technological innovation as the driving force; it should also adhere to green development, and increase efficiency, power, and quality with the aim of increasing economic benefits. Therefore, starting from the connotation of the high-quality development of the manufacturing industry, adhering to the principles of systematic science and availability, and synthesizing the studies in the literature, we constructed an index system for evaluating manufacturing development. As the target layer, we decomposed the comprehensive manufacturing industry index from the three dimensions of economic benefit, innovation development, and green development, which we further refined into 17 indicators to be measured from different perspectives. Finally, the high-quality manufacturing development measurement index system is shown in Table 1. First, economic benefit is a key feature of the development of the manufacturing industry. The manufacturing industry has a high production efficiency and a large production scale, and its benefits have important impacts on the development of the national economy. Referring to the literature [27,47,48,49,50], we calculated the economic benefits of the manufacturing industry by using industrial added value, main business income, and other indicators. Second, innovation capability is the core force driving the development and upgrading of the manufacturing industry. Only by continuously strengthening the technological innovation capability can the high-quality development of the manufacturing industry be realized. Referring to the literature [27,47,48,51,52,53], we used the manufacturing industry Redd expenditure and other indicators to measure the innovation capability of the manufacturing industry. Finally, green development is a new mode of modern industrial operation of the manufacturing industry that comprehensively considers environmental and resource benefits and promotes the reform of manufacturing methods and business processes, which will become the trend of the future development of the manufacturing industry. Referring to the literature [47,48,54], we used the total industrial energy consumption, industrial added value, and other indicators to measure the green development of the manufacturing industry.
4. Results
4.1. Comprehensive Index of Economy and Manufacturing Industry Development
Table 2 shows that the development of the digital economy in China has been constantly progressing. The mean value of the comprehensive digital economy index in the whole country has increased from 0.1003 in 2013 to 0.3048 in 2020, for an average annual growth rate of 17.4706%. The annual mean value of the comprehensive digital economy index in the eastern region (0.3223) was 2.45 times that of the northeast region (0.1314) (Provinces and municipalities in the eastern region: Beijing, Tianjin, Hebei, Shandong, Shanghai, Jiangsu, Zhejiang, Fujian, Guangdong, and Hainan. Provinces and municipalities in central region: Shanxi, Anhui, Henan, Hubei, Hunan, and Jiangxi. Provinces and municipalities in the western region: Inner Mongolia, Guangxi, Chongqing, Sichuan, Guizhou, Yunnan, Shaanxi, Gansu, Qinghai, Ningxia, and Xinjiang. Provinces and municipalities in the northeast region: Heilongjiang, Jilin, and Liaoning.). The value for Guangdong (0.5949), which ranked first, was 8.58 times that of the last place Qinghai (0.0693). Only the eastern region exceeded the national annual average level (0.2064). The statistics showed wide differences in the development of the digital economy across regions. In terms of the average annual growth rate, the western region was the fastest-growing, with a growth rate of 23.2909%, followed by the central region at 22.146%, the northeast region at 16.0851%, and the eastern region at 14.0909%. In addition, the average annual growth rates of Qinghai, Guizhou, Jiangxi, Gansu, Guangxi, and Yunnan were among the highest, all exceeding 25%. The data showed that the development of the digital economy has a notable catchup effect. Rapid development can also be achieved in regions with a weak foundation and low base. We observed a marked difference in the manufacturing industry, which is more demanding on regional conditions and needs long-term operation to achieve steady growth.
Table 3 shows that the development of China’s manufacturing industry has also been constantly progressing. The average comprehensive manufacturing industry index in China increased from 0.2696 in 2013 to 0.3415 in 2020, for an average annual growth rate of 3.4465%, far below the growth rate of 17.4706% of the digital economy. The annual mean value of the comprehensive manufacturing industry index in the eastern region (0.4147) was 1.88 times higher that of the western region (0.2205), and the value in Guangdong (0.6605), which was the highest, was 4.99 times that of the last-placed Qinghai (0.1322). The eastern and central regions both exceeded the national annual average (0.3032). The data showed that large differences remained in manufacturing industry development across the regions. Moreover, from 2013 to 2020, only 13 provinces/municipalities, such as Guangdong, Jiangsu, Zhejiang, and Shanghai, maintained continuous growth, while the others experienced fluctuations in growth. The eastern region was the fastest-growing region, with an average annual growth rate of 4.1633%, followed by the central region at 3.4668%, then the western region at 2.9435%, and the northeast region was the slowest, at 1.2572%. Compared with the average annual growth rate of the digital economy, these rates are much slower. Inner Mongolia and Ningxia even experienced negative annual growth. This shows that the level and speed of the development of the manufacturing industry need improvement, and the advantages of the digital economy must be used to realize transformation and upgrading. Finally, the results of the comprehensive digital economy index in this study are highly consistent with those of literatures [37,38]. The results of the comprehensive manufacturing industry index are also consistent with those of literatures [46,47,48]. The consistency indicates this foundation could be for the calculation of the coupling degree and value-added capability between the digital economy and the manufacturing industry.
4.2. Visual Analysis of the Comprehensive Development Index
Figure 2 depicts the trend in the mean value of the comprehensive development index of the digital economy and manufacturing industry in the whole country. China’s digital economy started from a low point, but has rapidly developed. Compared with 2013, the index in 2020 increased by 203.8883%. China’s manufacturing industry has also maintained a growth trend, with an increase of 26.6691% in 2020 compared with 2013. The growth rate of the digital economy was much faster than that of the manufacturing industry, almost catching up with the manufacturing industry in 2020 [50]. Figure 3 depicts a radar chart of the annual mean value of the comprehensive development index of the digital economy and manufacturing industry in the sample provinces and municipalities. The two systems essentially grew with the same trend. Provinces and municipalities with high development levels and speed in the manufacturing industry performed equally well in the digital economy, and vice versa. This shows that the developments of the two are highly related [49].
Figure 4 and Figure 5 depict further analyses of the dynamic evolution of the trend in the development of the digital economy and manufacturing. The figures show that, in terms of distribution, the kernel density function curve of the digital economy and manufacturing industry moved to the right over time, with the digital economy moving faster. This implied that the development level of the digital economy and manufacturing industry was constantly rising, and the digital economy was developing more quickly. Additionally, the peak of the kernel density function curve continued decreasing in value and increasing in width, which indicated that the developments of the digital economy and manufacturing industry were spatially different, and the differences tended to increase over time, especially for the digital economy. In terms of distribution extensibility, the kernel density function curve shows a notable tail in the right that continues to extend, which further shows that the spatial difference between the digital economy and manufacturing development is expanding.
4.3. Promotion Efficiency between the Digital Economy and Manufacturing Industry Development
Table 4 shows that the efficiency of China’s manufacturing industry in promoting the development of the digital economy was constantly increasing in general. The national average promotion efficiency of the sample provinces/municipalities increased from 0.2266 in 2013 to 0.3073 in 2020, which is an increase of 35.6134%. The annual mean value of the efficiency in the eastern region (0.3896) was 2.27 times higher than that in the western region (0.1714). Both the eastern and central regions were above the national annual average of 0.2643. The efficiency of Guangdong (0.6657), which ranked first, was 9.22 times higher than that of the last-ranked Qinghai (0.0722).
Table 5 shows that the efficiency of China’s digital economy in promoting the development of the manufacturing industry has continued to increase. The national average promotion efficiency of the sample provinces/municipalities increased from 0.4510 in 2013 to 0.5500 in 2020, an increase of 21.9512%. The annual average value of the promotion efficiency in the eastern region (0.5585) was 1.20 times higher than that in the northeast region (0.4661). The efficiency of the first-ranked Guangdong (0.6906) was 1.5839 times higher than that of the last-ranked Qinghai (0.4360). The results of the comparative analysis showed that in the sample provinces/municipalities, the average value of was larger than that of , and was larger than the digital economy and manufacturing comprehensive development index of the sample provinces/municipalities, and has been steadily improving (Figure 6). This showed that the efficiency of the digital economy in promoting the manufacturing industry was greater than that of the manufacturing industry in promoting the digital economy. In addition, the standard deviation of among the samples was smaller than that of and was smaller than the standard deviation of the digital economy and manufacturing industry comprehensive development index of the sample provinces/municipalities. In regions with different levels of development, the values of were close and very significant. This further proved that the digital economy is highly efficient, empowering, and inclusive in promoting the manufacturing industry.
4.4. Visual Analysis of the Promoting Effect
Figure 6 shows the mean value of the digital economy and manufacturing comprehensive development index in the whole country from 2013 to 2020 and the dynamic trend in their efficiency for and in promoting each other. The comprehensive manufacturing industry index grew almost parallel with , and the curve is below the curve of the comprehensive manufacturing industry index. The national average of the comprehensive digital economy development index and maintained a relatively parallel growth trend over time, and the curve is above the average curve of the comprehensive digital economy index. Figure 7 shows the annual mean value of the digital economy and the manufacturing industry comprehensive development index of the sample provinces and municipalities, and the dynamic trend of the annual mean value of their efficiency and in promoting each other. The comprehensive manufacturing industry index continued growing in a trend highly similar to the curve of , and the curve is within the curve of the comprehensive manufacturing industry index. This shows that the efficiency of the manufacturing industry in promoting the digital economy was closely related to its own development; the more developed the manufacturing industry, the more strongly the digital economy was promoted, and vice versa. The annual average curve of the comprehensive digital economy development index of each province and city is still highly similar to the curve, and the curve is outside the average curve of the comprehensive digital economy and manufacturing industry index as well as outside of the curve. This showed that the efficiency of the digital economy in promoting the manufacturing industry was positively related to its own development. The digital economy had a high spillover and driving effect, leading to a whole that was stronger than the sum of its parts.
Figure 8 shows that the standard deviation curve of the comprehensive manufacturing index maintained a trend similar to that of , and the standard deviation of was larger than that of the comprehensive manufacturing index. This further showed that the level of manufacturing industry development affected . Moreover, the more developed the manufacturing industry, the more efficiently the digital economy was promoted. The standard deviation of in Figure 8 is much lower than that of , and lower than that of the comprehensive digital economy and manufacturing industry index. This further supported the results of the previous analysis. Regardless of whether the region was developed or developing in terms of the digital economy and manufacturing industry, the digital economy played a vital role in promoting the manufacturing industry, and the promotion efficiency in these regions was close to each other and was maintained at a relatively high level. The digital economy has been highly efficient, empowering, and inclusive in promoting manufacturing industry. These characteristics indicate that the digital economy is an economic form that is particularly suitable for coupled development with the manufacturing industry. Their coupled development can continuously improve the value-added capability of the two systems.
4.5. Coupling Degree and Value-Added Ability between the Digital Economy and the Manufacturing Industry
Table 6 shows that the average coupling degree between the digital economy and manufacturing industry in the nationwide samples increased from 0.1058 in 2013 to 0.1815 in 2020, for an average annual growth rate of 8.0196%, indicating that the two systems in these provinces and municipalities were becoming more coupled. The annual mean value of the coupling degree between the digital economy and manufacturing industry in the eastern region was 0.2291, 0.1318 in the central region, 0.0820 in the western region, and 0.0866 in the northeast region. Only that in the eastern region exceeded the national average, indicating large differences in the coupling degree between the digital economy and the manufacturing industry among the regions [27].
Table 7 shows that the average value-added capability of the coupled development of the digital economy and manufacturing industry in China increased from 0.0091 in 2013 to 0.0590 in 2020, which is an increase of 6.4835 times and an average annual growth rate of 30.8970%. The value-added capability of the digital economy and manufacturing industry was low in the beginning, but quickly grew. In further analyses of the different regions, we found that the annual average value-added capability of the eastern region was 0.0759, 0.0139 in the central region, 0.0056 in the western region, and 0.0046 in the northeast region. Only that of the eastern region exceeded the national average (0.0306). Moreover, the annual average of the eastern region was 5.4604 times higher than that of the central region, 13.5536 times higher than that of the western region, and 16.5 times higher than that of the northeast region. This indicated wide differences in the value-added capability of the two systems across the regions. Therefore, further studies are needed of the causes of the differences to identify the driving factors to improve the systems’ value-added capability.
4.6. Visual Analysis of the Coupling Degree and the Value-Added Ability
Figure 9 shows that the digital economy, manufacturing industry, and their coupling degree and value-added capability all continuously grew from 2013 to 2020. The manufacturing industry, its coupling with the digital economy, and its value-added capability show similar trends. The digital economy was rapidly improving between the lines of the coupling degree and manufacturing industry. This showed that, on the basis of the development of the manufacturing industry and driven by the digital economy, the two systems have achieved coupled growth and improvement in value-added capability. Figure 10 shows that the annual average values of the manufacturing industry, digital economy, and the coupling degree between them in the sample provinces and municipalities maintained a relatively similar growth pattern. However, only the eastern region had a value-added capability that grew following the growth pattern of the above-mentioned three factors, whereas the value-added capacity curves in the central, western, and northeast regions rapidly decrease and flatten out. This indicated that the digital economy and manufacturing industry have achieved coupled development to a certain extent, but the value-added capability of the two systems had not yet substantially improved. This is because the coupling between the two systems is a necessary condition and the threshold variable for a notable increase in the value-added capability of the two systems. Figure 10 shows that some provinces and municipalities had not yet crossed the threshold of coupling between the digital economy and manufacturing industry. Although some provinces and municipalities had crossed the threshold, they had not yet reached the goal of considerably increasing their value-added capability. Only some provinces and municipalities in the eastern region achieved the goal of substantially increasing their value-added capability after crossing the coupling threshold. In Figure 10, the four curves show consistent growth trends.
Figure 11 and Figure 12 reveal the dynamic trends in the coupling degree and value-added capability of the digital economy and manufacturing industry in China from 2013 to 2020. We found that the curves in Figure 11 (kernel density of coupling degree between two systems) share the same pattern as those in Figure 4 (kernel density of the digital economy) and Figure 5 (kernel density of the manufacturing industry). The growth pattern of the three are also similar in Figure 10. This indicates that some provinces and municipalities have achieved the coupled development of the digital economy and manufacturing industry, and have crossed the coupled development threshold. As reflected in the figures, the curves follow similar growth trends. However, from further analysis of Figure 12, we found that the kernel density curve of the value-added capability of the two systems shows a noticeable right tail that is continuously expanding. Moreover, the values converge mostly within the range of 0–0.1. Only a few provinces and municipalities had crossed the threshold, with their value-added capability considerably increasing. Therefore, the kernel density of value-added capability was characterized by both convergence and extensibility. This showed that although the value-added capability of the digital economy and manufacturing system in most provinces and municipalities was constantly improving, it was still limited to a certain range. Only a few provinces and municipalities have crossed the threshold and achieved a noticeable increase. Therefore, the value-added capability of the system showed convergence and extensibility. We further proved that the coupling degree of the two systems is the necessary condition and threshold variable for substantial improvement in the value-added capability. Even if the threshold of coupled development is crossed, the goal of substantial improvement in value-added capacity has not yet been reached.
Table 8 provides a comparative analysis of the coupling degree and value-added capability between the digital economy and manufacturing industry in the sample provinces and municipalities. Accordingly, we divided the 30 provinces/municipalities into four categories: developed, moderately developed, moderately underdeveloped, and underdeveloped. Developed regions had a coupling degree that was more than twice the national average, moderately developed regions more than 1 times, underdeveloped regions were more than 0.8 times, and the rest were underdeveloped regions. Among the 30 sample provinces and municipalities in China, 11 provinces and municipalities were higher than the national average in terms of the coupling degree, among which 7 were in the eastern region; however, 14 provinces and municipalities were categorized as underdeveloped regions. We found large differences in coupling degree. We observed a still larger difference in the value-added capability of the system. Only 6 of the 30 sample provinces and municipalities had a higher value-added capability than the national average, all of which were located in the eastern region. Fujian was the only province in a transitional stage (moderately underdeveloped). The remaining 23 provinces and municipalities were underdeveloped in terms of value-added capability. Therefore, the value-added capability of the digital economy and manufacturing industry in those provinces and municipalities was polarized. We could loosely divide the samples into three categories: those that have not crossed the threshold of coupled development; those that have crossed the threshold, but not experienced a qualitative change in the value-added capability; and those that have crossed the threshold of coupled development, and have witnessed a qualitative change in their value-added capability (Taking the value-added capability of the system as the response variable, and the coupling degree of the system as the threshold variable and the explanatory variable, the results of a test with Hansen (2000) threshold model showed that the coupling degree of the system had a threshold effect. See the Appendix A for the results of the empirical threshold test.).
4.7. Analysis of the Evolution Pattern of the Coupling Degree and the Value-Added Capability of the Digital Economy and Manufacturing Industry System
We further analyzed the relationships between the evolution of the coupling degree and the value-added capability of the digital economy and manufacturing industry, and we clarified the path of the evolution of the coupling degree enhancing value-added capability. With the coupling degree between the digital economy and manufacturing industry as the abscissa and value-added capability as the ordinate, we generated a diagram to analyze the evolution pattern in four quadrants (Figure 13). In the first quadrant, the levels of the coupling degree and value-added capability of the digital economy and manufacturing industry are both high, indicating that the digital economy and manufacturing industry were well-coupled based on their own development; on that basis, the value-added capability was substantially improved. Quadrant one represents the optimal state. In the second quadrant, the coupling degree between the two systems is low, but the value-added capability is high. This shows that the two systems had not reached a high-level coupling in the evolution process, but only relied on their respective development to drive their value-added capability. In this case, the input of resources has not produced the best results. Value-added capacity without the foundation of coupled development is not optimal. In the third quadrant, the levels of the coupling degree and value-added capability of the two systems are both low, indicating that the two systems were each lagging and had low coupling degree and value-added capability. In the fourth quadrant, the coupling degree between the two systems is high, but the value-added capability is low, indicating that although the two systems had achieved coupled development and may have crossed the threshold, the value-added capability was only growing linearly and had not experienced a considerable increase. The fourth quadrant is a transitional stage between the third and first quadrants; it is also the key stage in exceeding the threshold. We further divided the patterns of system evolution into four cases, as shown in Figure 13. The first is a relatively static state, showing little movement in the coordinate of the coupling degree and value-added capability of the two systems, with no cross-quadrant development, showing only a change in quantity, not quality. The second is a substantial change in the systems’ value-added capability, without qualitative development in the coupling degree between the systems, but their value-added capability has achieved qualitative improvement. Patterns such as ①, ②, ③, and ④ are representative of this case. Patterns ① and ② indicate that the value-added capability has qualitatively improved without any qualitative change in the coupling degree of the systems. Patterns ③ and ④ are the opposite. The third is a substantial change in the systems’ coupling degree. The value-added capability of the system has not notably changed, but the coupling degree between the systems has achieved a notable increase. Patterns ⑤, ⑥, ⑦, and ⑧ are indicative of such a case. Patterns ⑤ and ⑥ demonstrate the case where the value-added capability of the systems has not qualitatively changed, but the coupling degree between the systems has qualitatively improved. Patterns ⑦ and ⑧ are the opposite. The fourth is a substantial change in both the value-added capability and the coupling degree, for example, patterns ⑨, ⑩, ⑪, and ⑫. The value-added capability and coupling degree of pattern ⑨ have qualitatively improved. Pattern ⑪ shows the opposite trend. For pattern ⑩, the coupling degree increased, but the value-added capability decreased. For pattern ⑫, the coupling degree decreased, but the value-added capability grew.
According to the above theoretical explanation of the system coupling degree and value-added capability evolution patterns, and combined with Figure 14 and Figure 15, we found that the coupling degree between the digital economy and manufacturing industry was positively related to their value-added capability. Overall, the levels of the coupling degree and value-added capability of most of the sample provinces and municipalities were low in 2013. A total of 19 provinces and municipalities had a coupling degree and value-added capability in the third quadrant. Five provinces and municipalities had reached the transitional stage in quadrant IV. Six provinces and municipalities broke through quadrant IV and reached quadrant I, reaching the optimal state of high coupling degree and high value-added capability. In 2020, the coupling degree and value-added capability in all provinces and municipalities had remarkably improved, with an annual mean coupling degree and value-added capability of 0.1815 and 0.0590, respectively. Compared with 2013, the overall distribution pattern in 2020 also changed. At this time, 10 provinces and municipalities were located in the third quadrant and 20 in the first quadrant (In the third quadrant, value-added capacity is lower than the average of 0.0091, and the coupling degree is lower than the average of 0.1059. In quadrant IV, the value-added capacity is lower than the average of 0.0091, and the coupling degree is greater than the average of 0.1059; in quadrant I, the value-added capacity is greater than the average of 0.0091, and the coupling degree is greater than the average of 0.1059. For convenience of comparison, the average value of 2013 is also used in Figure 15.). Most provinces and municipalities had crossed the threshold value, achieving rapid growth and cross-quadrant transition of coupling degree and value-added capability. However, some provinces and municipalities still had not achieved qualitative changes or cross-quadrant development compared with the baseline in 2013. Through the above analysis, we found the evolution path of the value-added capacity of the digital economy and manufacturing industry was quadrant III → quadrant IV → quadrant I. First is the state of pattern ⑥, where the coupling degree achieves quadrant crossing early, and the value-added capability increases but has not crossed into the next quadrant. With the enhancement in the coupling degree between the two systems, the value-added capability continues to improve, and the systems evolve from pattern ⑥ to ⑨ and enter the optimal state in quadrant I along the evolution path of pattern ⑨. This shows once again that the coupling between the digital economy and the manufacturing industry is the necessary condition and threshold variable for substantial improvement in the value-added capability of the systems. However, some provinces and municipalities were still at the low level in the first quadrant even though they had achieved considerable improvement in the value-added capability. Even if the threshold of coupled development was crossed, the goal of value-added capability improvement was far from being achieved.
4.8. The Decomposition of the Value-Added Capability of the Digital Economy and the Manufacturing Industry
We then further analyzed the dynamic factors affecting the value-added capability of the systems. We identified three dynamic trends in the value-added capability of the digital economy and manufacturing industry: rising, remaining unchanged, and declining. From the results, we found that the value-added capabilities of the sample provinces and municipalities were mainly rising, with four combined driving forces: First, under the condition that the development level of the manufacturing industry remains unchanged, the value-added capability was driven by the growth of the digital economy. Second, under the condition that the digital economy remains unchanged, the value-added capability is produced by the development of the manufacturing industry. Third, the growth of value-added capability is produced by the simultaneous growth of the digital economy and manufacturing industry. Fourth, the value-added capacity is produced from the coupling between the digital economy and manufacturing industry. If we suppose that the digital economy and manufacturing industry increase from and in the base period to and , respectively, then the coupling degree changes from to in the reporting period. The included angle changes from to , therefore:
According to the changes in , , and , we decomposed the value-added capability of the coupled development of the digital economy and the manufacturing industry in the study period into the following equation:
Substituting Equation (5) into Equation (11), we obtained the decomposition Equation (12) of the value-added capability of the coupled development of the digital economy and manufacturing industry in the study period:
According to Equation (12), we divided the increase in the value-added capability of the digital economy and manufacturing industry in the study period into eight types. Table 9 provides the description of each type.
With 2013 as the base period and 2020 as the reporting period, the decomposed results of the value-added capability of the digital economy and manufacturing system are shown in Table 10 and Table 11. From the national average, in 2020, the descending order of the value-added capability of the two systems were: Type III (0.0148) > Type VIII (0.0114) > Type I (0.0091) > Type V (0.0072) > Type IV (0.0054) > Type VIII (0.007). Type III, driven by the digital economy, was the major contributor to the increase in the value-added capability in 2020. The national average value-added capability of Type III was 0.0148, which ranked first among all types, with a proportion of 25.09%; it also ranked first in all regions and most of the sample provinces and municipalities. Moreover, Type III accounted for a particularly higher proportion in the relatively lagging northeast, western, and central regions. This showed that the digital economy contributed the most to the improvement in the systems’ value-added capability. In all regions that showed differences in the level of development, the digital economy was rapidly developing, playing a large role in promoting the systems’ value-added capability, especially in developing regions. Type V measures the contribution of the coupled development between the digital economy and manufacturing industry to the value-added capability of the systems. The national average of Type V was 0.0072, ranking fourth and accounting for 12.13% of the total. It also ranked fourth among all regions and most of the sample provinces and municipalities. This showed that the coupling between the digital economy and manufacturing industry also played an important role in improving the value-added capability of the system. Type VII is the contribution of the interaction between the digital economy and coupling degree between the two systems to the value-added capability of the systems. The national average of Type VII was 0.0114, ranking second and accounting for 19.24% of the total. Type VII also ranked second of all the regions and most of the sample provinces and municipalities. This once again showed that the digital economy and the coupling between the systems had an important influence on the value-added capability of the systems. Type II represents the contribution of the manufacturing industry to the systems’ value-added capability, which accounted for a relatively low proportion of all the samples, indicating that the manufacturing industry must transform and upgrade in order to contribute to enhancing the systems’ value-added capability. The results of the above analysis revealed that the development of the digital economy and the coupling between the two systems are important for enhancing the value-added capability of the systems. The digital economy could be characterized as highly efficient, empowering, and inclusive in promoting the value-added capability of the systems in all regions with different development levels. Therefore, the only path to increasing the value-added capability of the systems is to take full advantage of the spillover, convergence, and driving effects of the digital economy and its coupled development with the manufacturing industry.
Based on Table 10 and Table 11, we drew a chart demonstrating the trend in the different types of value-added capacity through China and in each region (Figure 16). The figure shows that the value-added capability in the eastern region was above the national average, while those of the other three regions were below the average. Types I, III, V, VII, and VIII in the eastern region all contributed to the value-added capacity of the system, so we concluded that the eastern region was experiencing thorough all-round development. The central, western, and northeast regions mainly relied on the contribution from Types III and VII. Types III, IV, VII, and VIII all involve the contribution of the digital economy factors. The above analysis illustrates two points: First, the digital economy plays a large role in improving the systems’ value-added capability. Second, the digital economy has not fully played its role in promoting the transformation and upgrading of the manufacturing industry. Except for the eastern region, the development of the manufacturing industry and the degree of coupling between the two systems have contributed little to the value-added capacity of the systems. This does not mean that the manufacturing industry is unimportant, but that the value-adding effect of the manufacturing industry on the system has not been fully exerted. If the development of the manufacturing industry and digital economy and the coupled development of the two are realized, such as in Guangdong, Jiangsu, Zhejiang, and Shanghai, the value-added capability of the systems will also be comprehensively increased [42]. Accelerating the development of the digital economy, fully allowing its role in promoting the transformation and upgrading of the manufacturing industry, and enhancing the coupling between the digital economy and manufacturing industry development are the only methods of enhancing the value-added capability of the system.
5. Discussion and Implications
5.1. Discussion
The vector coupling model of system evolution that we constructed in this study can calculate not only the coupling degree of both systems, but also their value-added abilities. This advances the research from the system coupling level to the system value-added level, enriching the literature on evolutionary economy and promoting the progress of evolutionary economic theory measurement. Based on the vector coupling model of system evolution, we calculated the development, coupling degree, and value-added ability of the digital economy and manufacturing industry in China. The calculated results are essentially consistent with those in the literature [27,37,38,47,48,49,50]. The calculation results showed that the development level of China’s digital economy and manufacturing industry has continued to increase, but with notable spatial differences. With the rapid development of the digital economy, the promotion of system value-added capacity is also crucial, especially in areas that are lagging. This catchup effect of the digital economy helps to minimize these spatial differences. The digital economy is highly efficient, enabling, and inclusive, so is suitable for coupling with the manufacturing industry; the threshold of cross-domain coupling must be crossed to further substantially improve the value-added ability of the system. The coupled development of the digital economy and manufacturing industry is the path to improving the value-added ability of the system.
5.2. Implications
First, the coupled development of the digital economy and manufacturing industry is conducive to promoting the transformation and upgrading of the manufacturing industry and expanding the space for the digital economy to develop. All provinces and municipalities, especially those in relatively lagging regions, must continue to accelerate the development of the digital economy and gradually promote its application from consumption and service to production. Full play should be given to the spillover, integration, and driving effects of the digital economy to promote the transformation and upgrading of the manufacturing industry, realizing the coupled development of the two, crossing the threshold of the coupling between the digital economy and manufacturing industry, and improving the value-added capability of the system from all aspects. If the digital economy and manufacturing industry are not developed, the value-added capability of the system cannot be substantially improved even if they are well-coupled; conversely, if the coupling degree between the digital economy and manufacturing industry is low, even if they separately develop well, the value-added capability of the system still cannot be considerably improved. Coupled development between systems is not an end in itself: the aim is to transform and upgrade the manufacturing industry, expand the development space of the digital economy, and finally improve the value-added capability of the two.
Second, the coupled development of the digital economy and manufacturing industry helps to give full play to the role of data and to strengthen the power of the system. The strength of the manufacturing industry in China lies in the system and is rooted in the huge supply chain and industrial networks of the industry. As China’s advantages of low-cost human resources and land gradually fade, we must rely on the coupled development of the digital economy and manufacturing industry to further strengthen the power of the system in this network. Digital technology helps include each manufacturer into a huge supply chain and industrial network, and the enterprises in the network can be effectively specialized and standardized. This will help individual enterprises to reduce costs, improve efficiency, and promote innovation. Additionally, the huge supply chain and industrial networks can compensate for the lack of flexibility and resilience caused by specialization. With the coupled development of the digital economy and manufacturing industry, a digital network system has been built based on geographical systems, which breaks the limitation of time and space, increases the scale of the supply chain and industrial networks, and deepens the division of labor, thus crossing the threshold of system coupling and constantly improving the value-added capability of the system.
Third, the coupled development of the digital economy and manufacturing industry will promote the development of SRDI enterprises and the innovation of key and core technologies. The development of SRDI enterprises will help overcome technical difficulties and compensate for the shortcomings of basic manufacturing. Specialized and refined production by enterprises can reduce costs, promote innovation, improve quality, and increase efficiency; however, they will simultaneously face problems in terms of the lack of flexibility and resilience. Specialization is targeted to a specific demand, and when the demand changes, specialized enterprises may struggle to respond flexibly. Therefore, SRDI enterprises must also be rooted in the huge manufacturing ecological network and find their positions within the network. Digital technology can help with mapping the physical manufacturing ecological network to the data space. SRDI enterprises must break through the limitations of time and space and use data to quickly match and use resources efficiently, thereby enhancing their resilience and flexibility. Innovation is the core of SRDI enterprises. The scale of market demand is an important force that stimulates innovation, but it often becomes a key factor restricting the innovation and development of these enterprises because SRDI enterprises are often in a market segment, where the demand for products is limited. This requires these enterprises to take advantage of the digital economy to expand their market and rapidly identify and match the demand, information, and resources.
Fourth, we must use leading enterprises to connect upstream and downstream industrial chains, build an ecological network for the manufacturing industry, and promote the digital transformation and development of the manufacturing industry. Through digital means, such as industrial Internet platforms, we must synergize the development of leading enterprises with that of small- and medium-sized enterprises, and we must coordinate the upstream and downstream of industrial chains to form an ecological network in the manufacturing industry. We must give full play to the empowering role of leading enterprises and use of their product chains to provide opportunities for small- and medium-sized enterprises in obtaining supply and technology, filling in their weak links, to establish a competitive ecological chain network. For example, Galanz takes advantage of its role as leader in the industrial chain to empower the whole industry. It incorporates two thousand upstream and downstream suppliers into the overall digital architecture through an industrial Internet platform. It drives upstream and downstream enterprises to accelerate digital transformation throughout the digital industry chain, helping enterprises in the industrial chain grow together, improve efficiency, reduce costs, and enhance the core cohesion and innovation of the middle and lower reaches of the industrial chain through data-based operation.
Fifth, through building an ecological network in the manufacturing industry, we can obtain data, promote innovation and collaboration, and support the coupled development of the digital economy and manufacturing industry. In addition to providing physical products to support the development of the digital economy, the manufacturing industry also has vast data resources, which will also promote the coupled development of the digital economy and manufacturing industry. Notably, technological innovation is the foundation of the development of the digital economy. As a rare ability, manufacturing is also a key link for technological innovation to achieve mass production and plays an important role in technological innovation and the development of the digital economy. The digital economy is an economic form with rapid innovation and change, and thus requires a large-scale manufacturing sector to meet the needs produced by these rapid changes and achieve the mass production of innovative products. Innovation is not only the result in the laboratories: it also needs the demanded resources supported by the manufacturing industry, as well as the support of ecological networks such as suppliers, parts, distribution, sales, and after-sales services. The digital economy needs to be coupled with the manufacturing industry to obtain economic benefits.
5.3. Limitations and Future Research
At present, the statistical caliber and statistical methods of the indicators of the digital economy of the China Bureau of Statistics are not perfect. Related statistical data, such as intelligent manufacturing and robots, are lacking, which also restricts the related studies on the digital economy. In this study, one limitation is the lack of more in-depth analysis of the relevant factors that affect system coupling and added-value creation. In a follow-up study, we will use empirical research methods to explore the relevant factors that affect system coupling and value addition. Researchers can also focus on a city, and the study content can be extended to the fields of digital innovation, governance, and government affairs. The scope for future digital economy research is vast.
Author Contributions
Conceptualization, formal analysis, methodology, writing-original draft, R.S.; validation and software, Y.F.; data curation and supervision, X.Z. All authors have read and agreed to the published version of the manuscript.
Funding
Jiangsu Social Science Fund research project (grant no.21GLC011); The key project of natural science research in colleges and universities in Anhui Province (grant no.KJ2020A 1073); Project of Philosophy and Social Science Research in Colleges and Universities of Jiangsu Province (grant no.2021SJA0122); 2021 Academic Funding Program for Top Talents in Disciplines (Specialties) (grant no.Smbjrc202102).
Institutional Review Board Statement
Not applicable.
Informed Consent Statement
Not applicable.
Data Availability Statement
The datasets generated and analyzed in this study are available from the corresponding author on reasonable request.
Acknowledgments
We express our most sincere gratitude to the editors and reviewers for theirs careful review of this study.
Conflicts of Interest
The authors declare no conflict of interest.
Appendix A
Panel Threshold Model Regression Test
1. Model building
The panel threshold model proposed by Hansen is used for testing, and the model is constructed as follows [55]:
In the model Is an indicator function that takes the value 1 or 0, val It is the value-added ability of the system. cou Is the degree of system coupling. tech, gov, fdi, scib, pop. The factors that may affect the explanatory variables are the ability to transform innovative achievements, government empowerment, regional openness, the intensity of financial investment in science and technology, and the size of the population. i On behalf of provinces and cities, t Represents time, δt It is a fixed effect of time. αi It is an individual fixed effect. εit Represents a random interference term. The model is a single-threshold model, and can also be extended to a multi-threshold model. The likelihood ratio statistic was simulated 500 times by “self-sampling” overlap to obtain the F and p values. The panel threshold model test results are shown in Table 5 and Figure 1. The panel threshold test of all cities shows that: cou It passed the first threshold test and reached the significance level below 1%. It shows that there is a threshold effect for the coupling degree of digital economy and manufacturing industry to enhance the value-added ability of the system.
2. Variable description
- (1)
- Explained variable:
Digital Economy and Value-added Capability of Manufacturing Systems (val)
- (2)
- Explanatory variable and threshold variable:
Coupling degree between digital economy and manufacturing industry (cou)
- (3)
- Control variables:
Ability to transform innovative achievements (tech):
The turnover of technology contracts measures the ability to transform innovative achievements.
Government empowerment (gov)
The scale of expenditure in the local financial budget is used to measure the intensity of government empowerment.
Level of regional openness (fdi)
Foreign direct investment amount/GDP is used to measure the degree of regional openness.
Intensity of financial investment in science and technology (scib)
The ratio of financial expenditure on science and technology to general budget expenditure is used to measure the intensity of financial investment in science and technology.
Population size (pop)
The population size is measured by the number of permanent residents at the end of the year.
The empirical research data are from China Statistical Yearbook from 2013 to 2020.

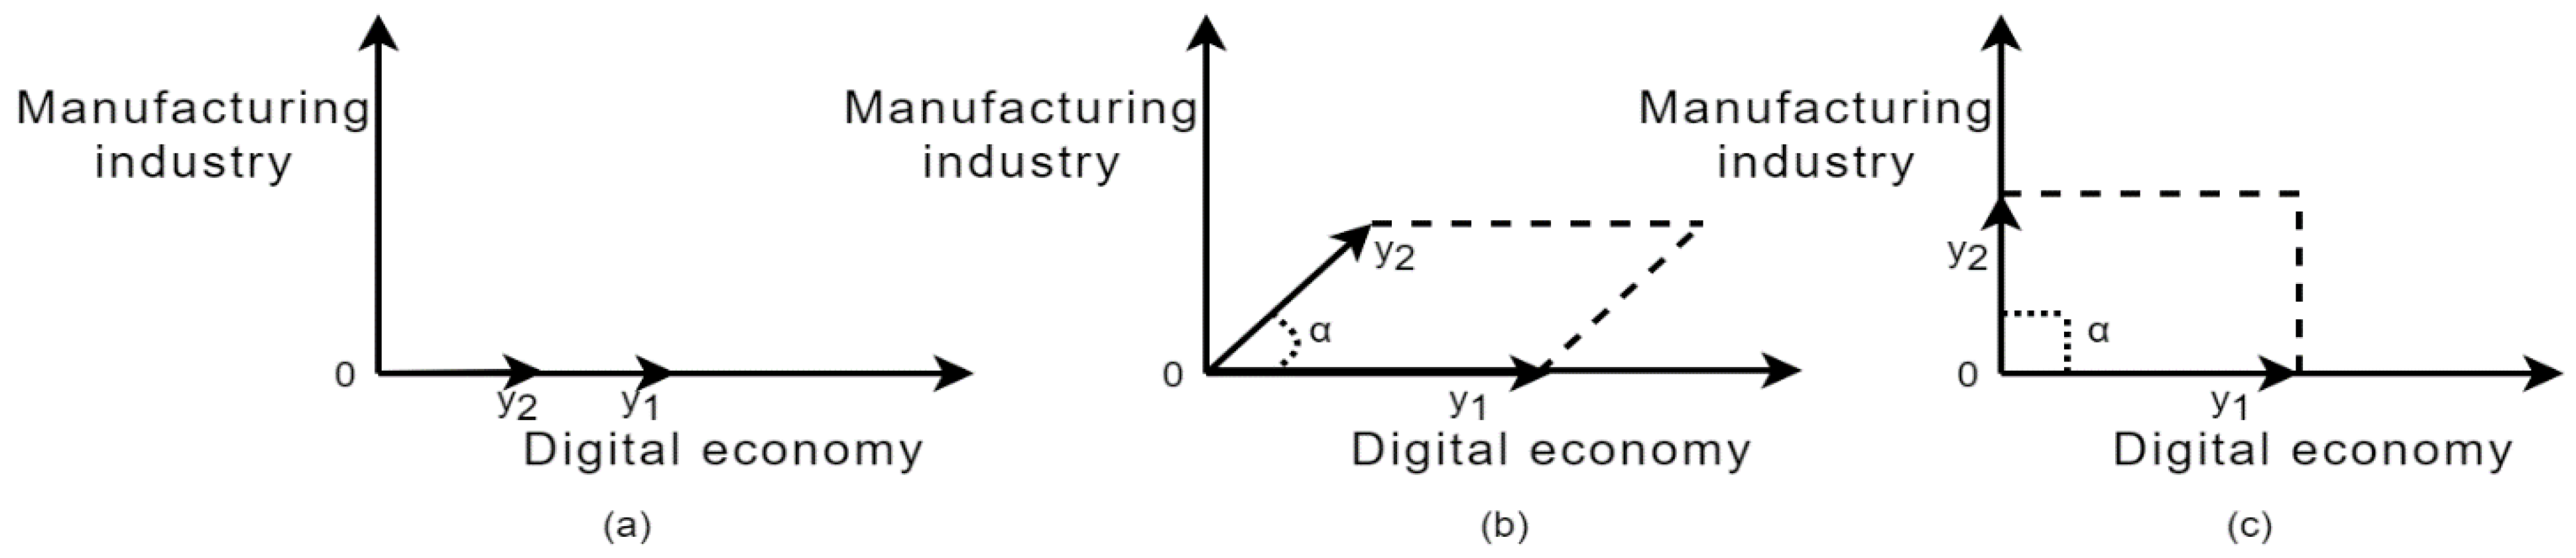
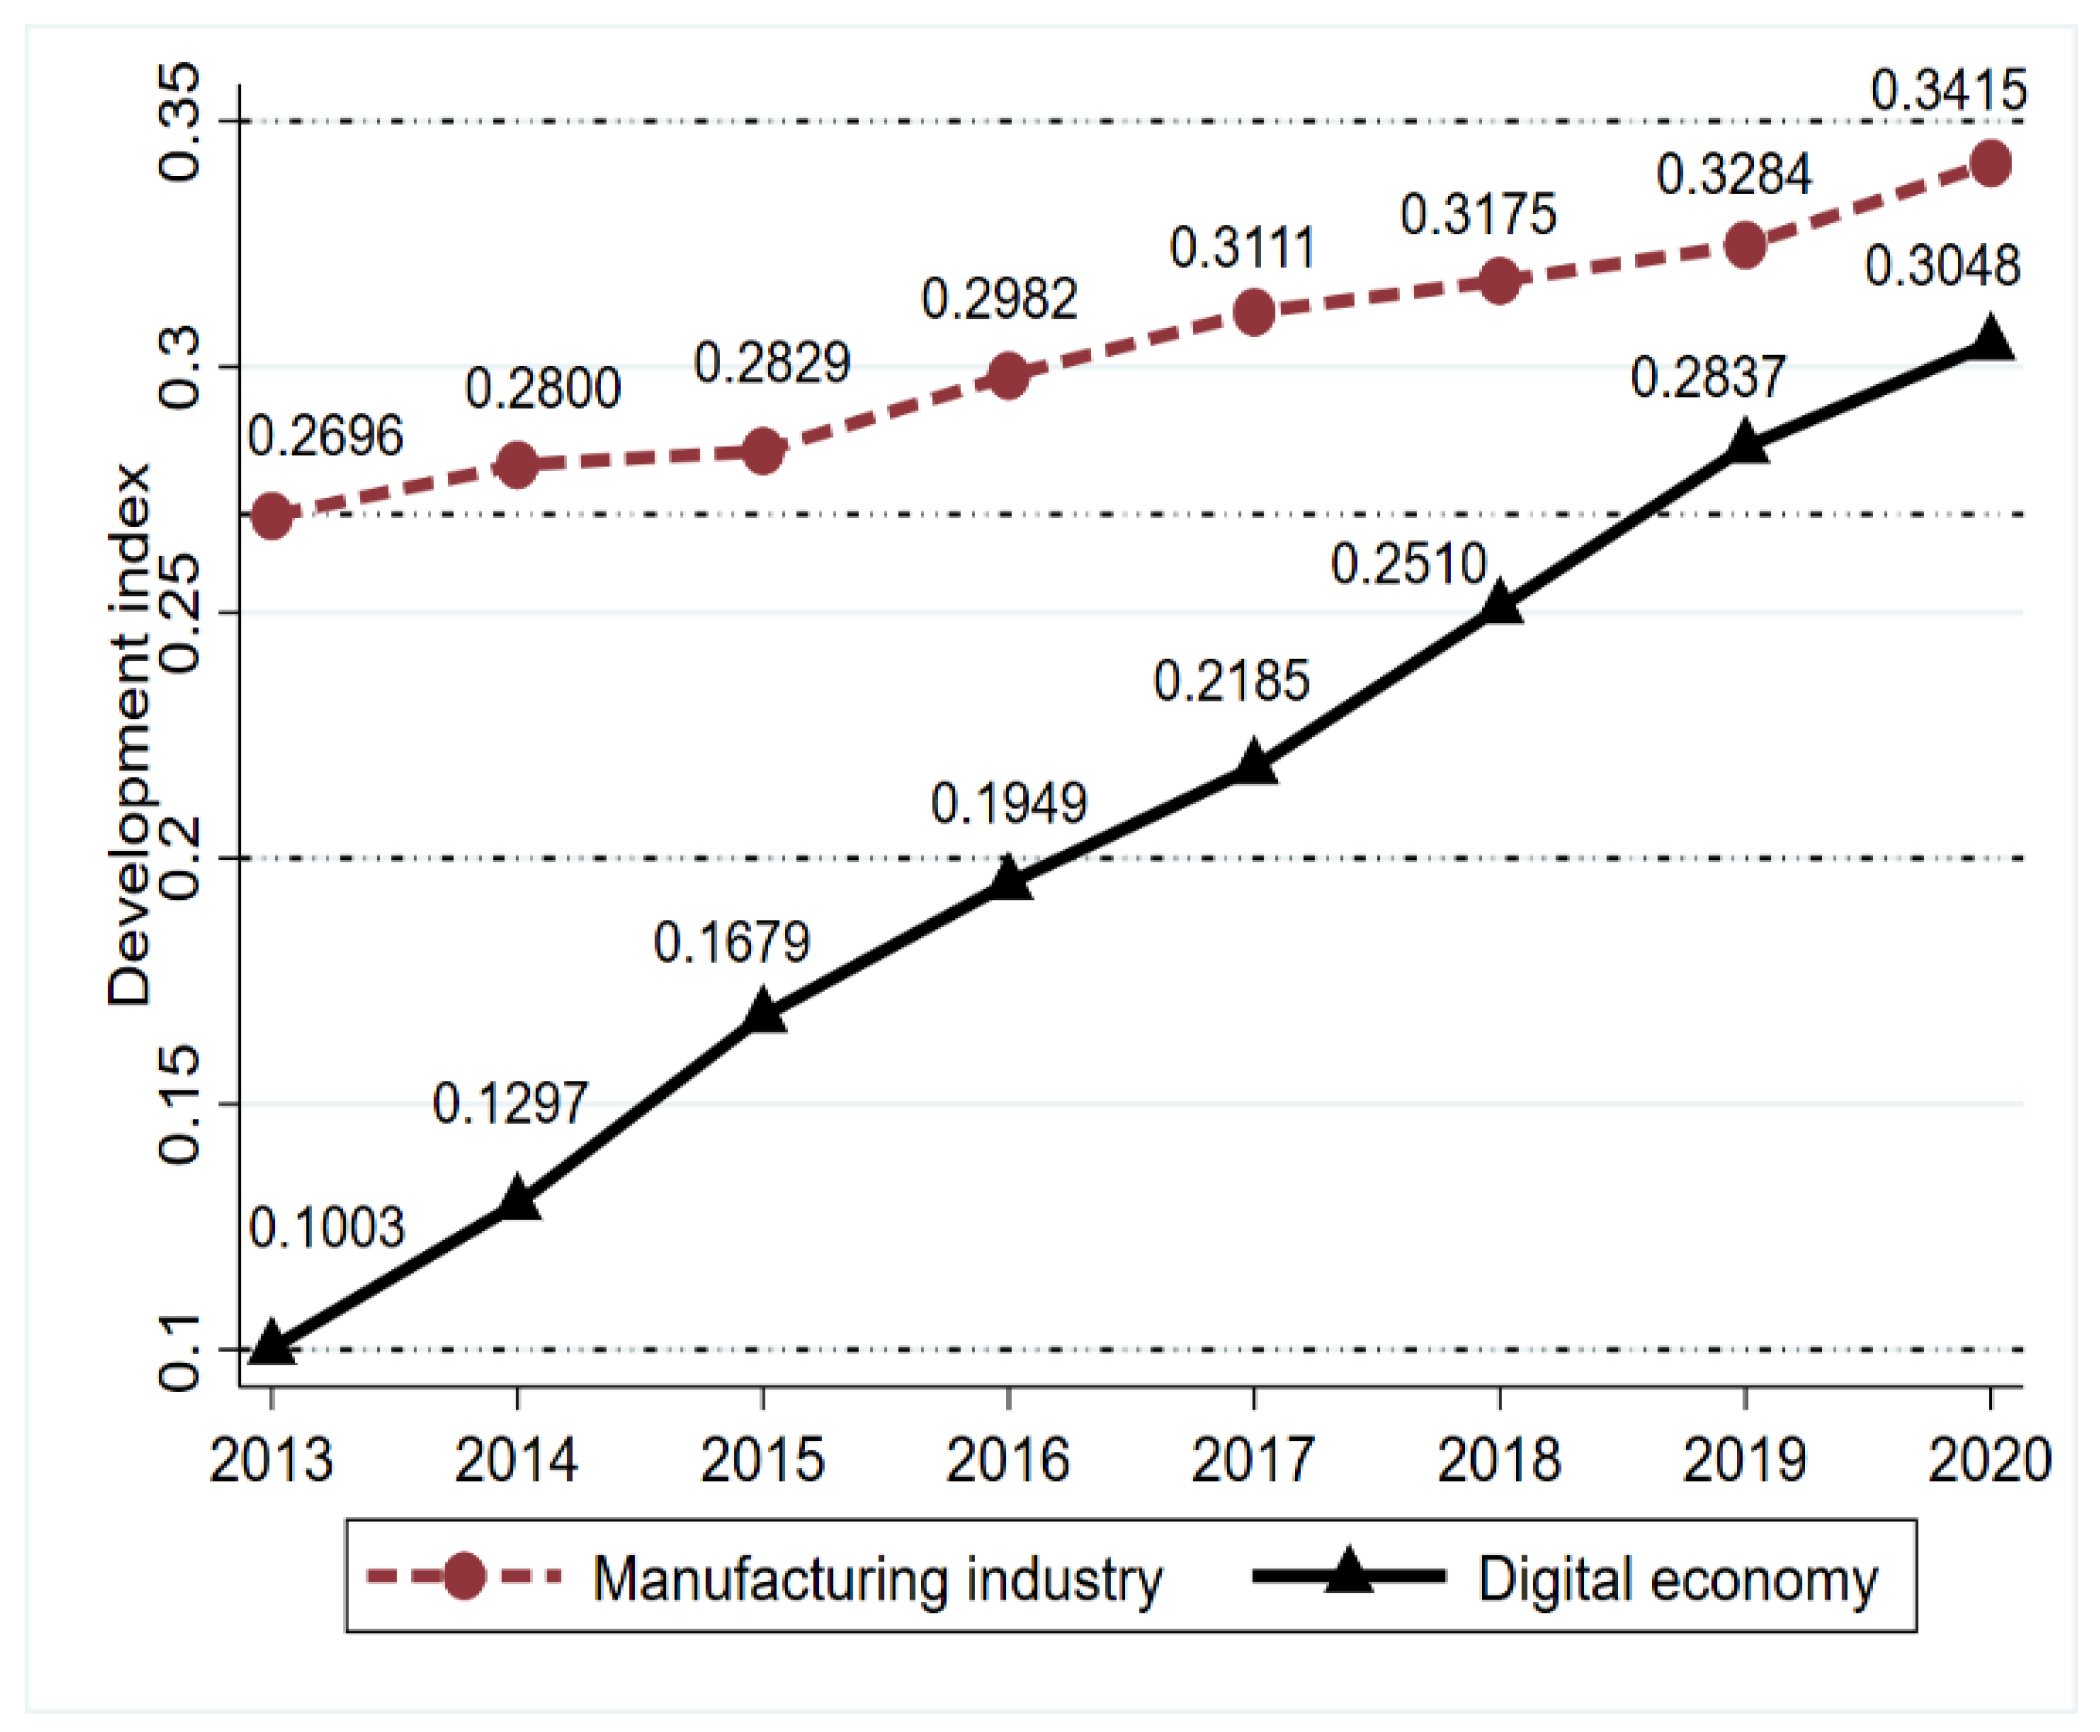
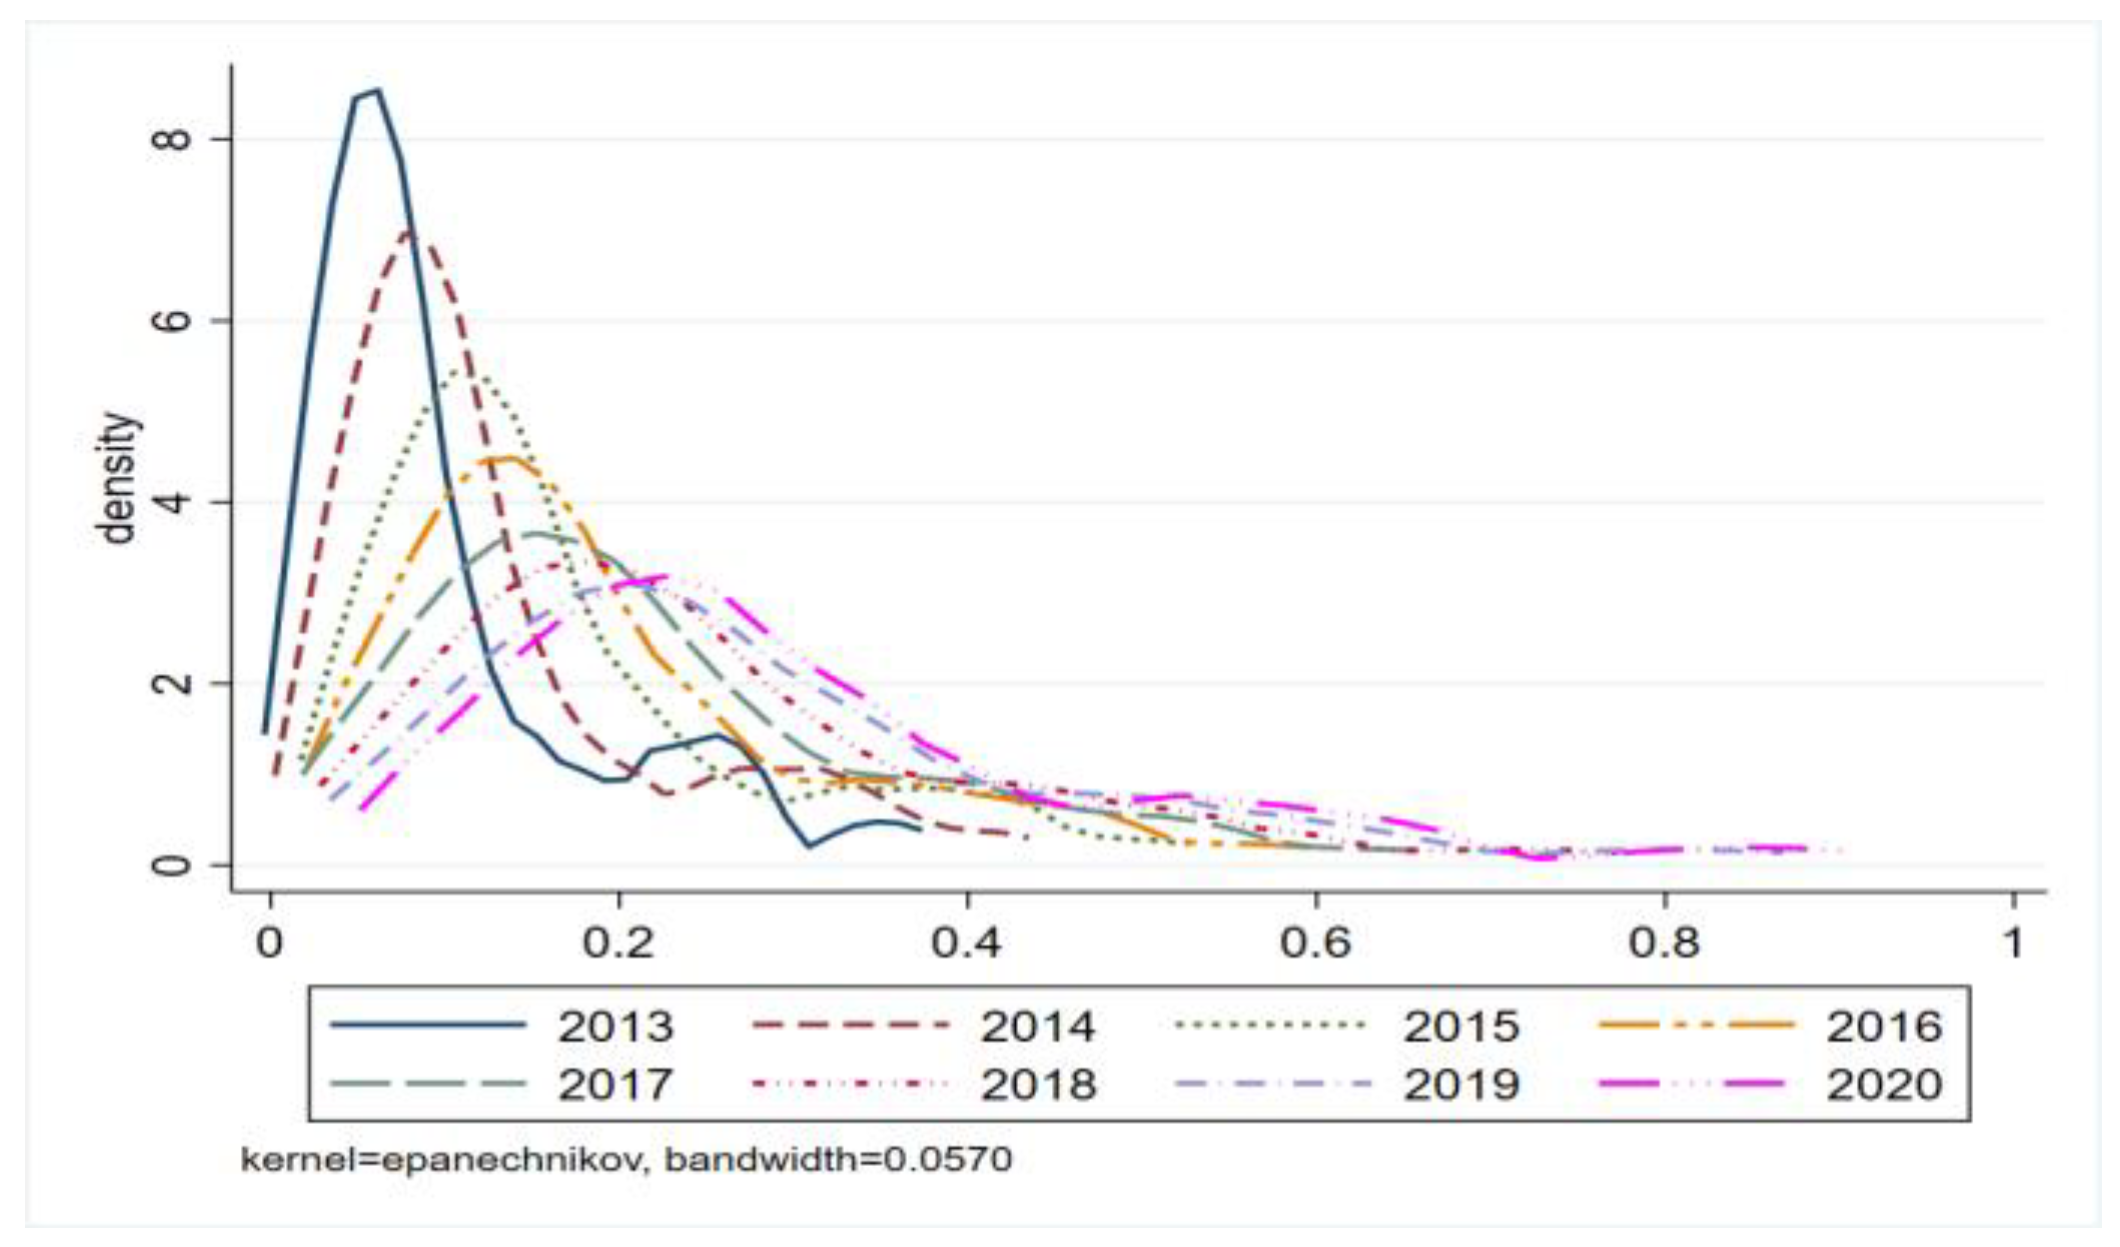
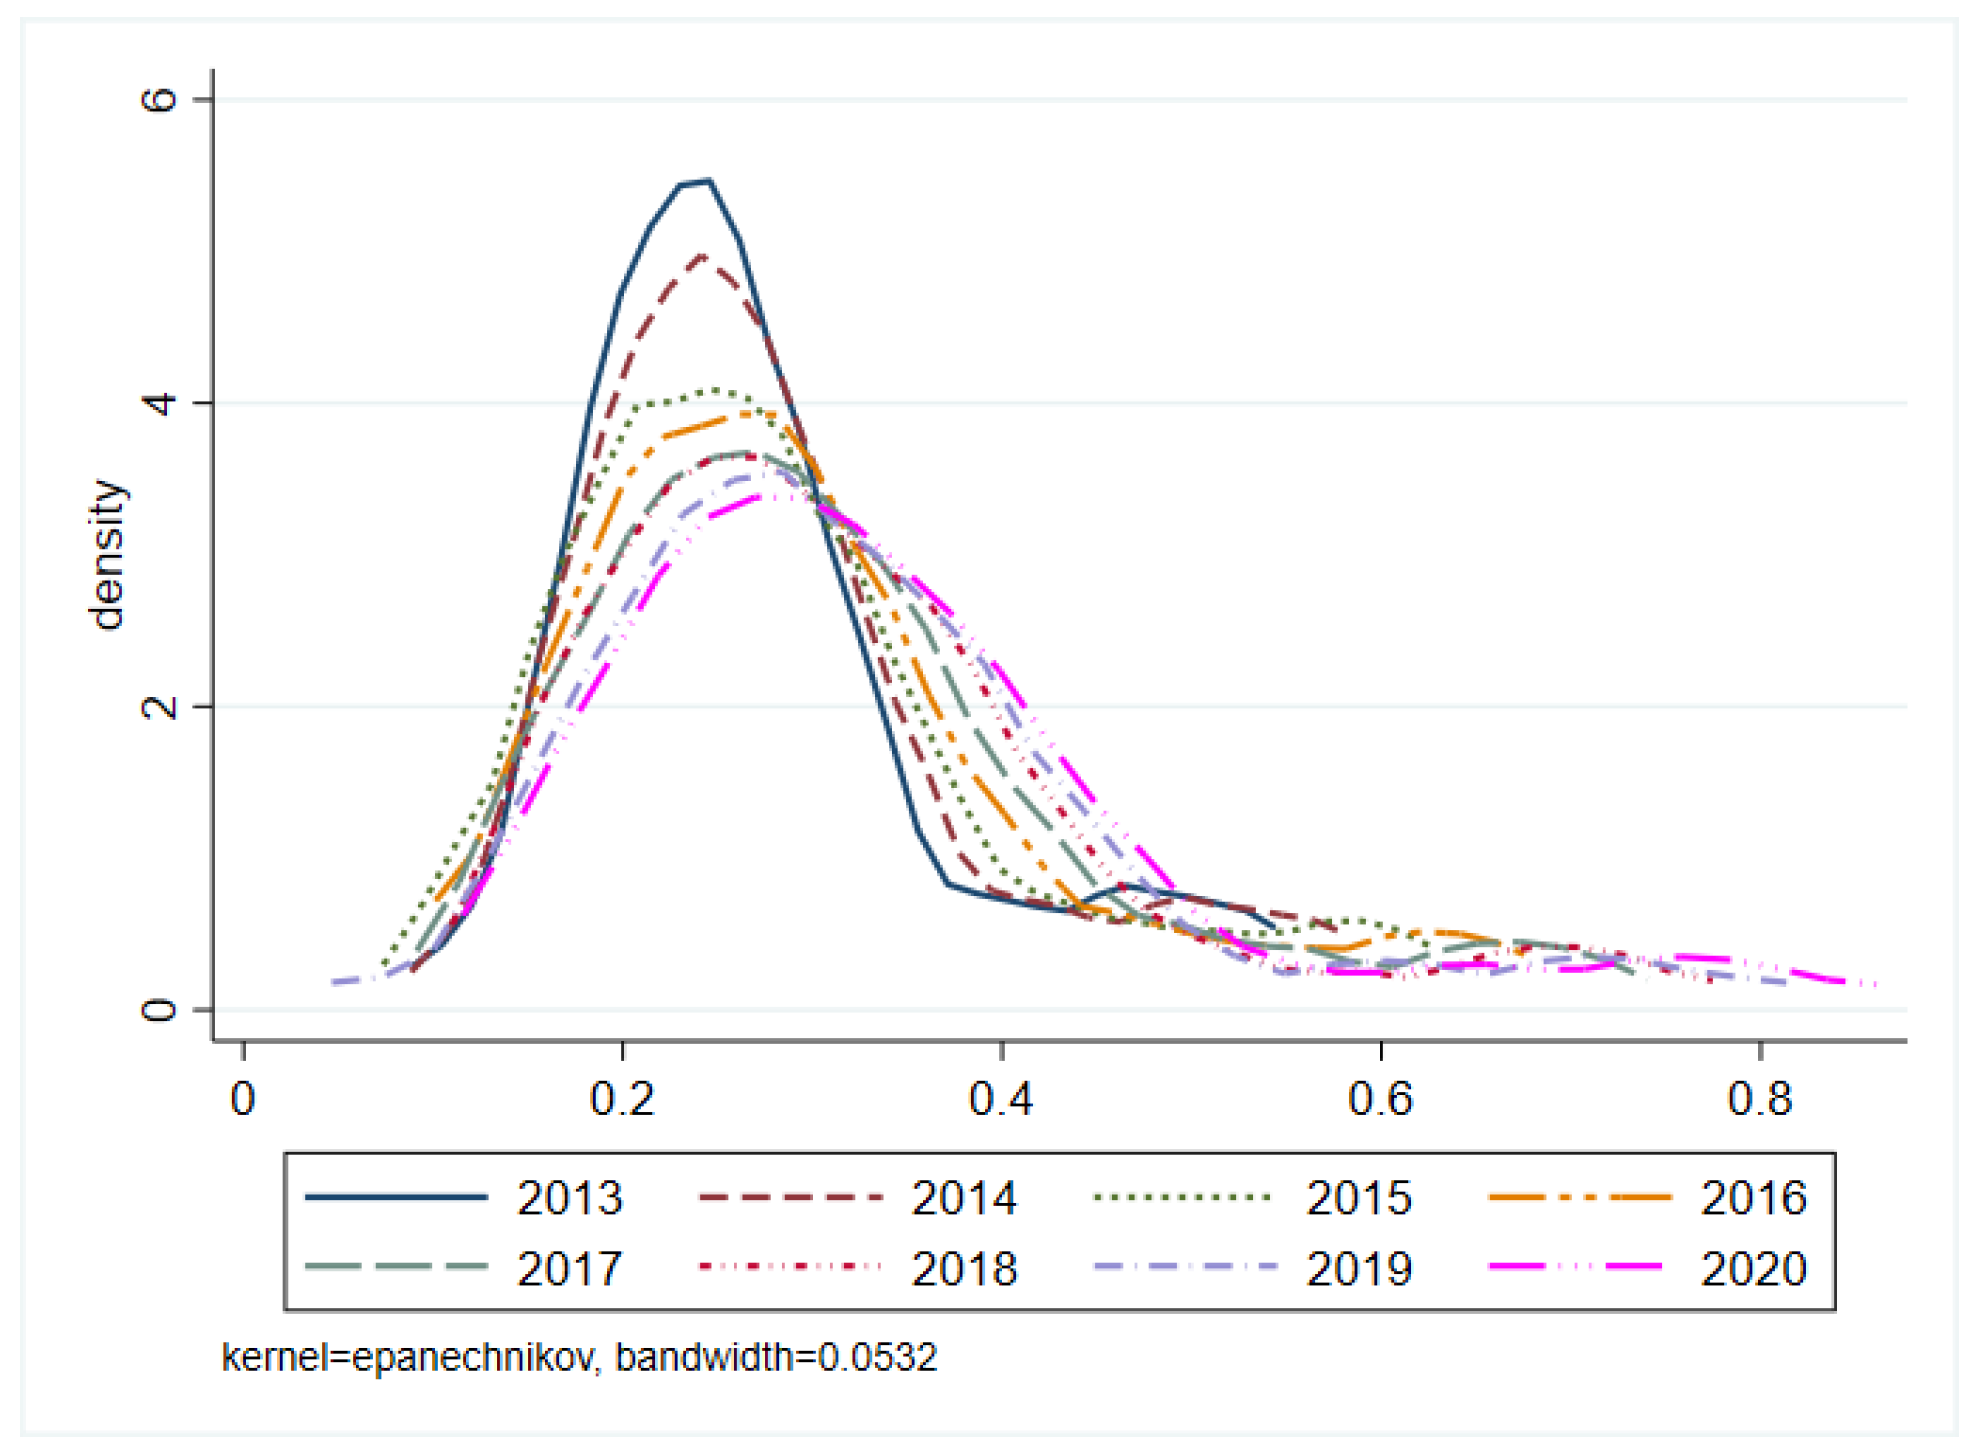
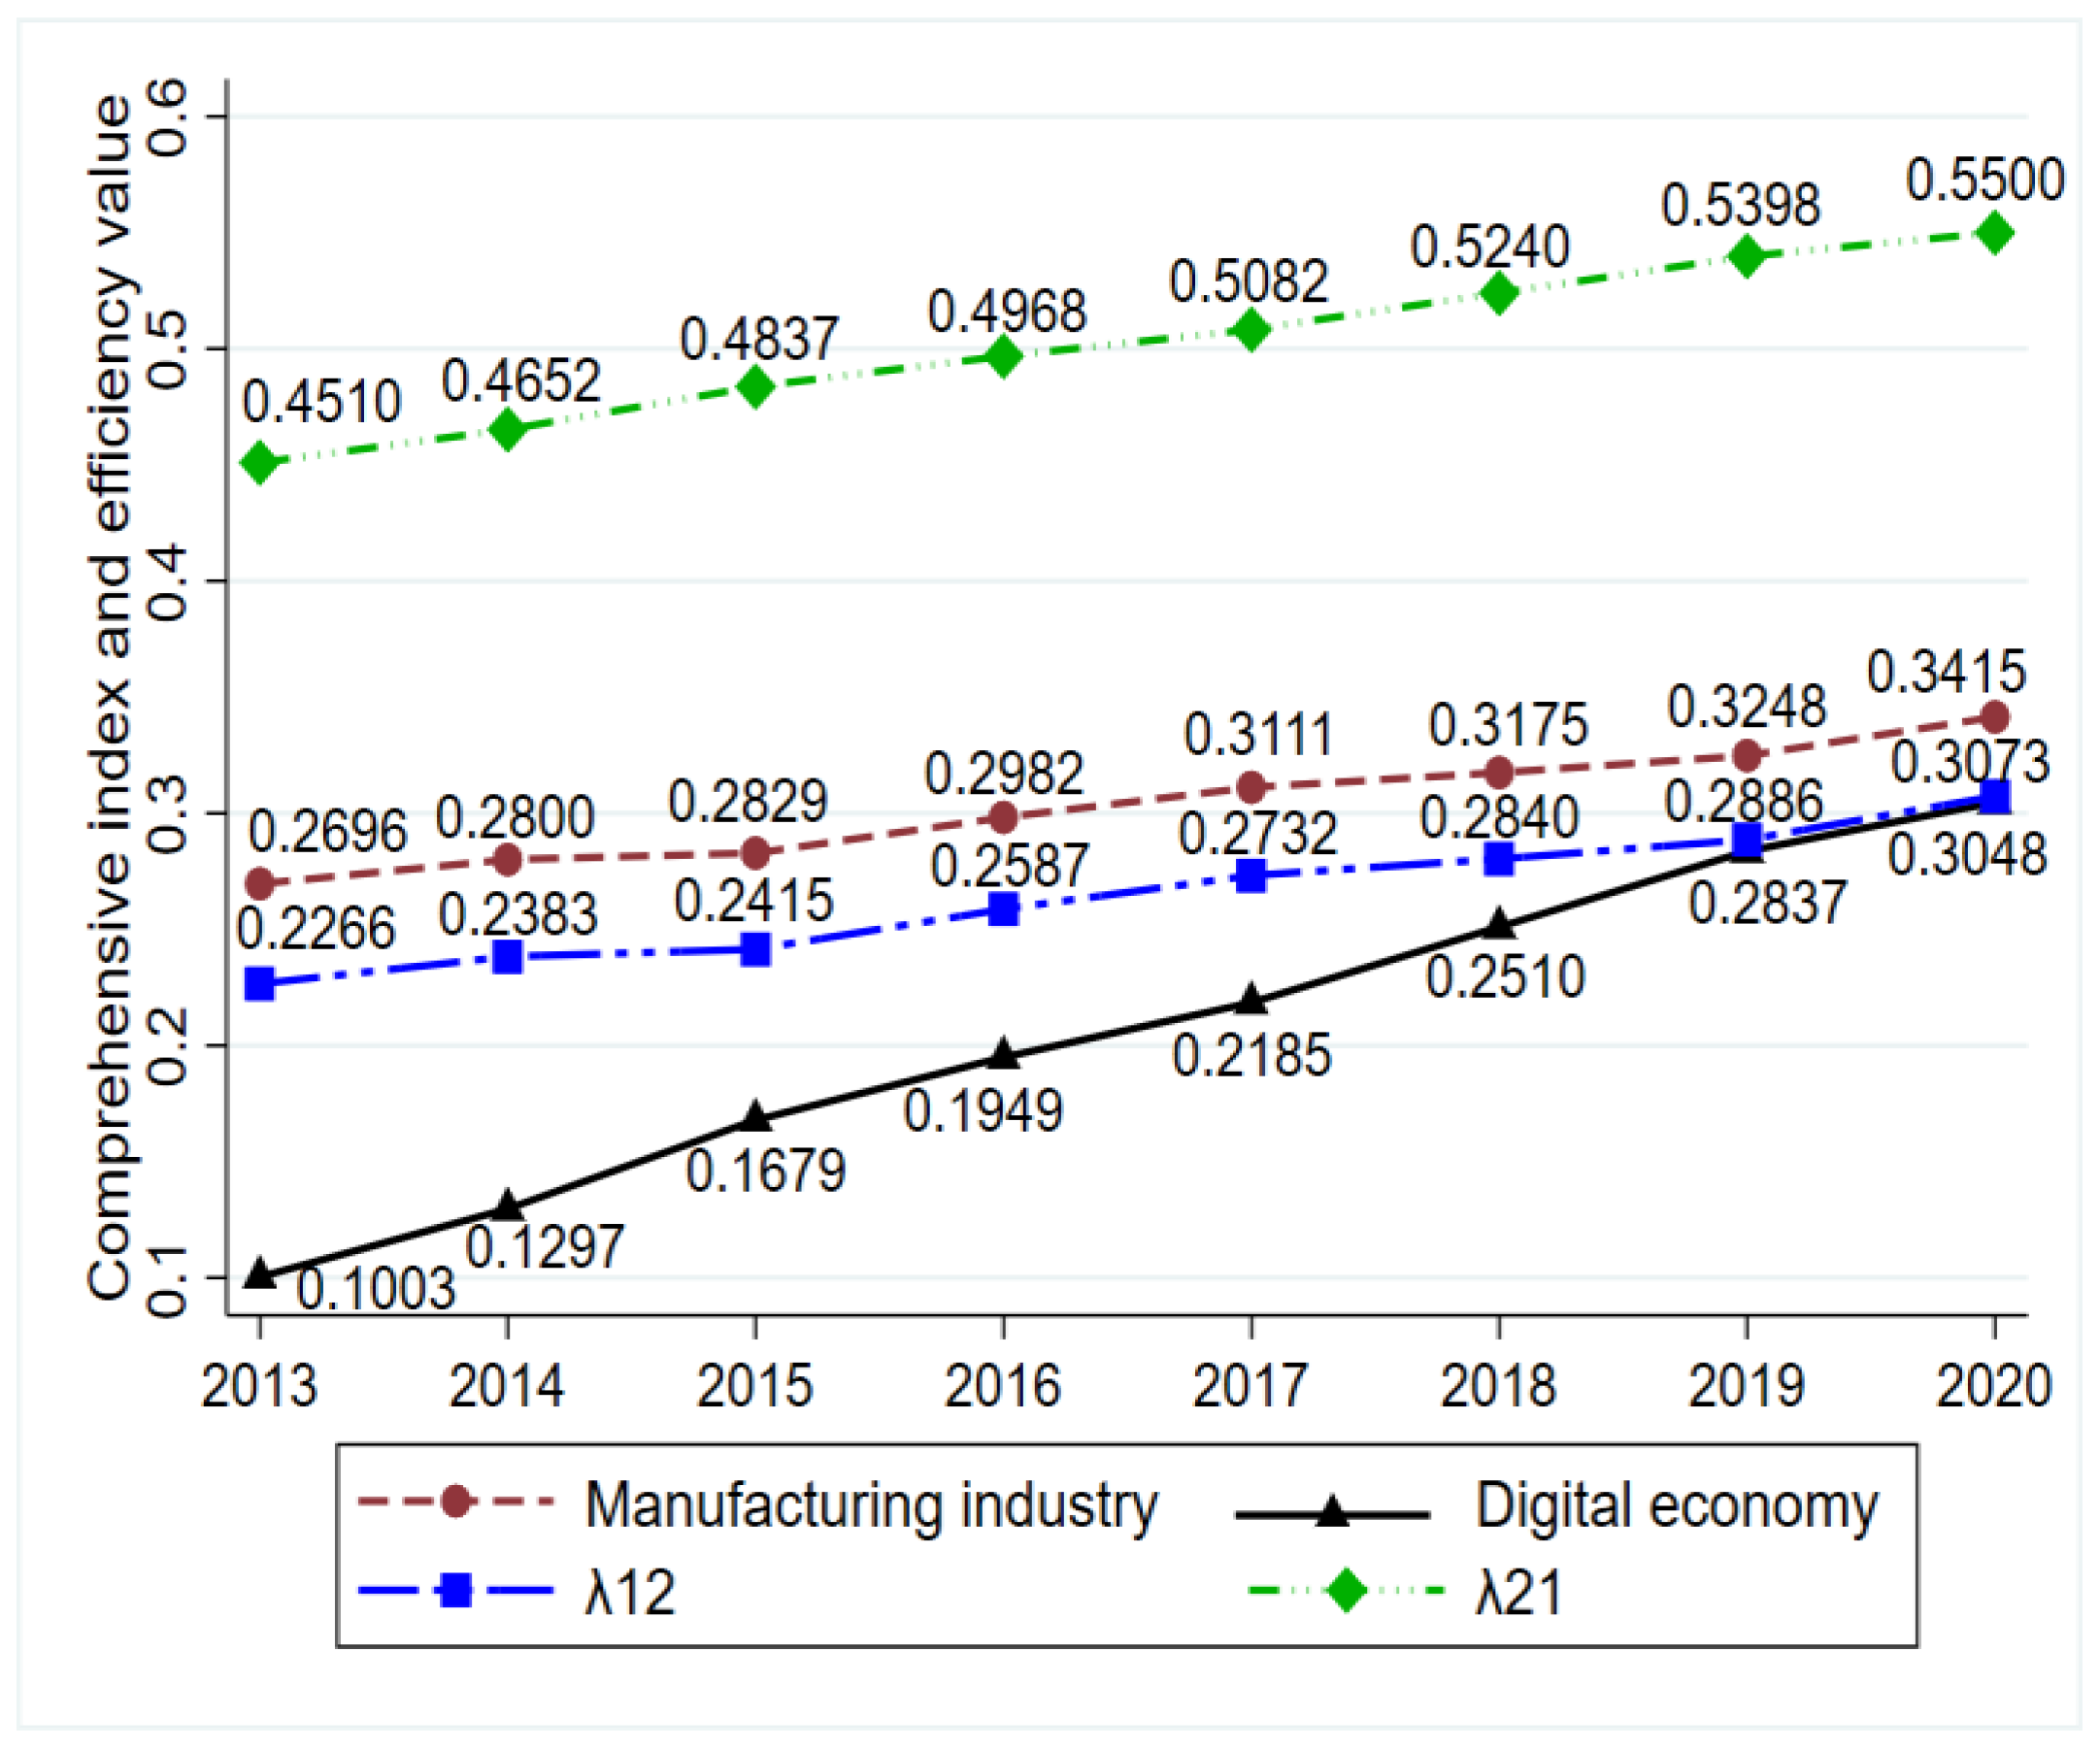
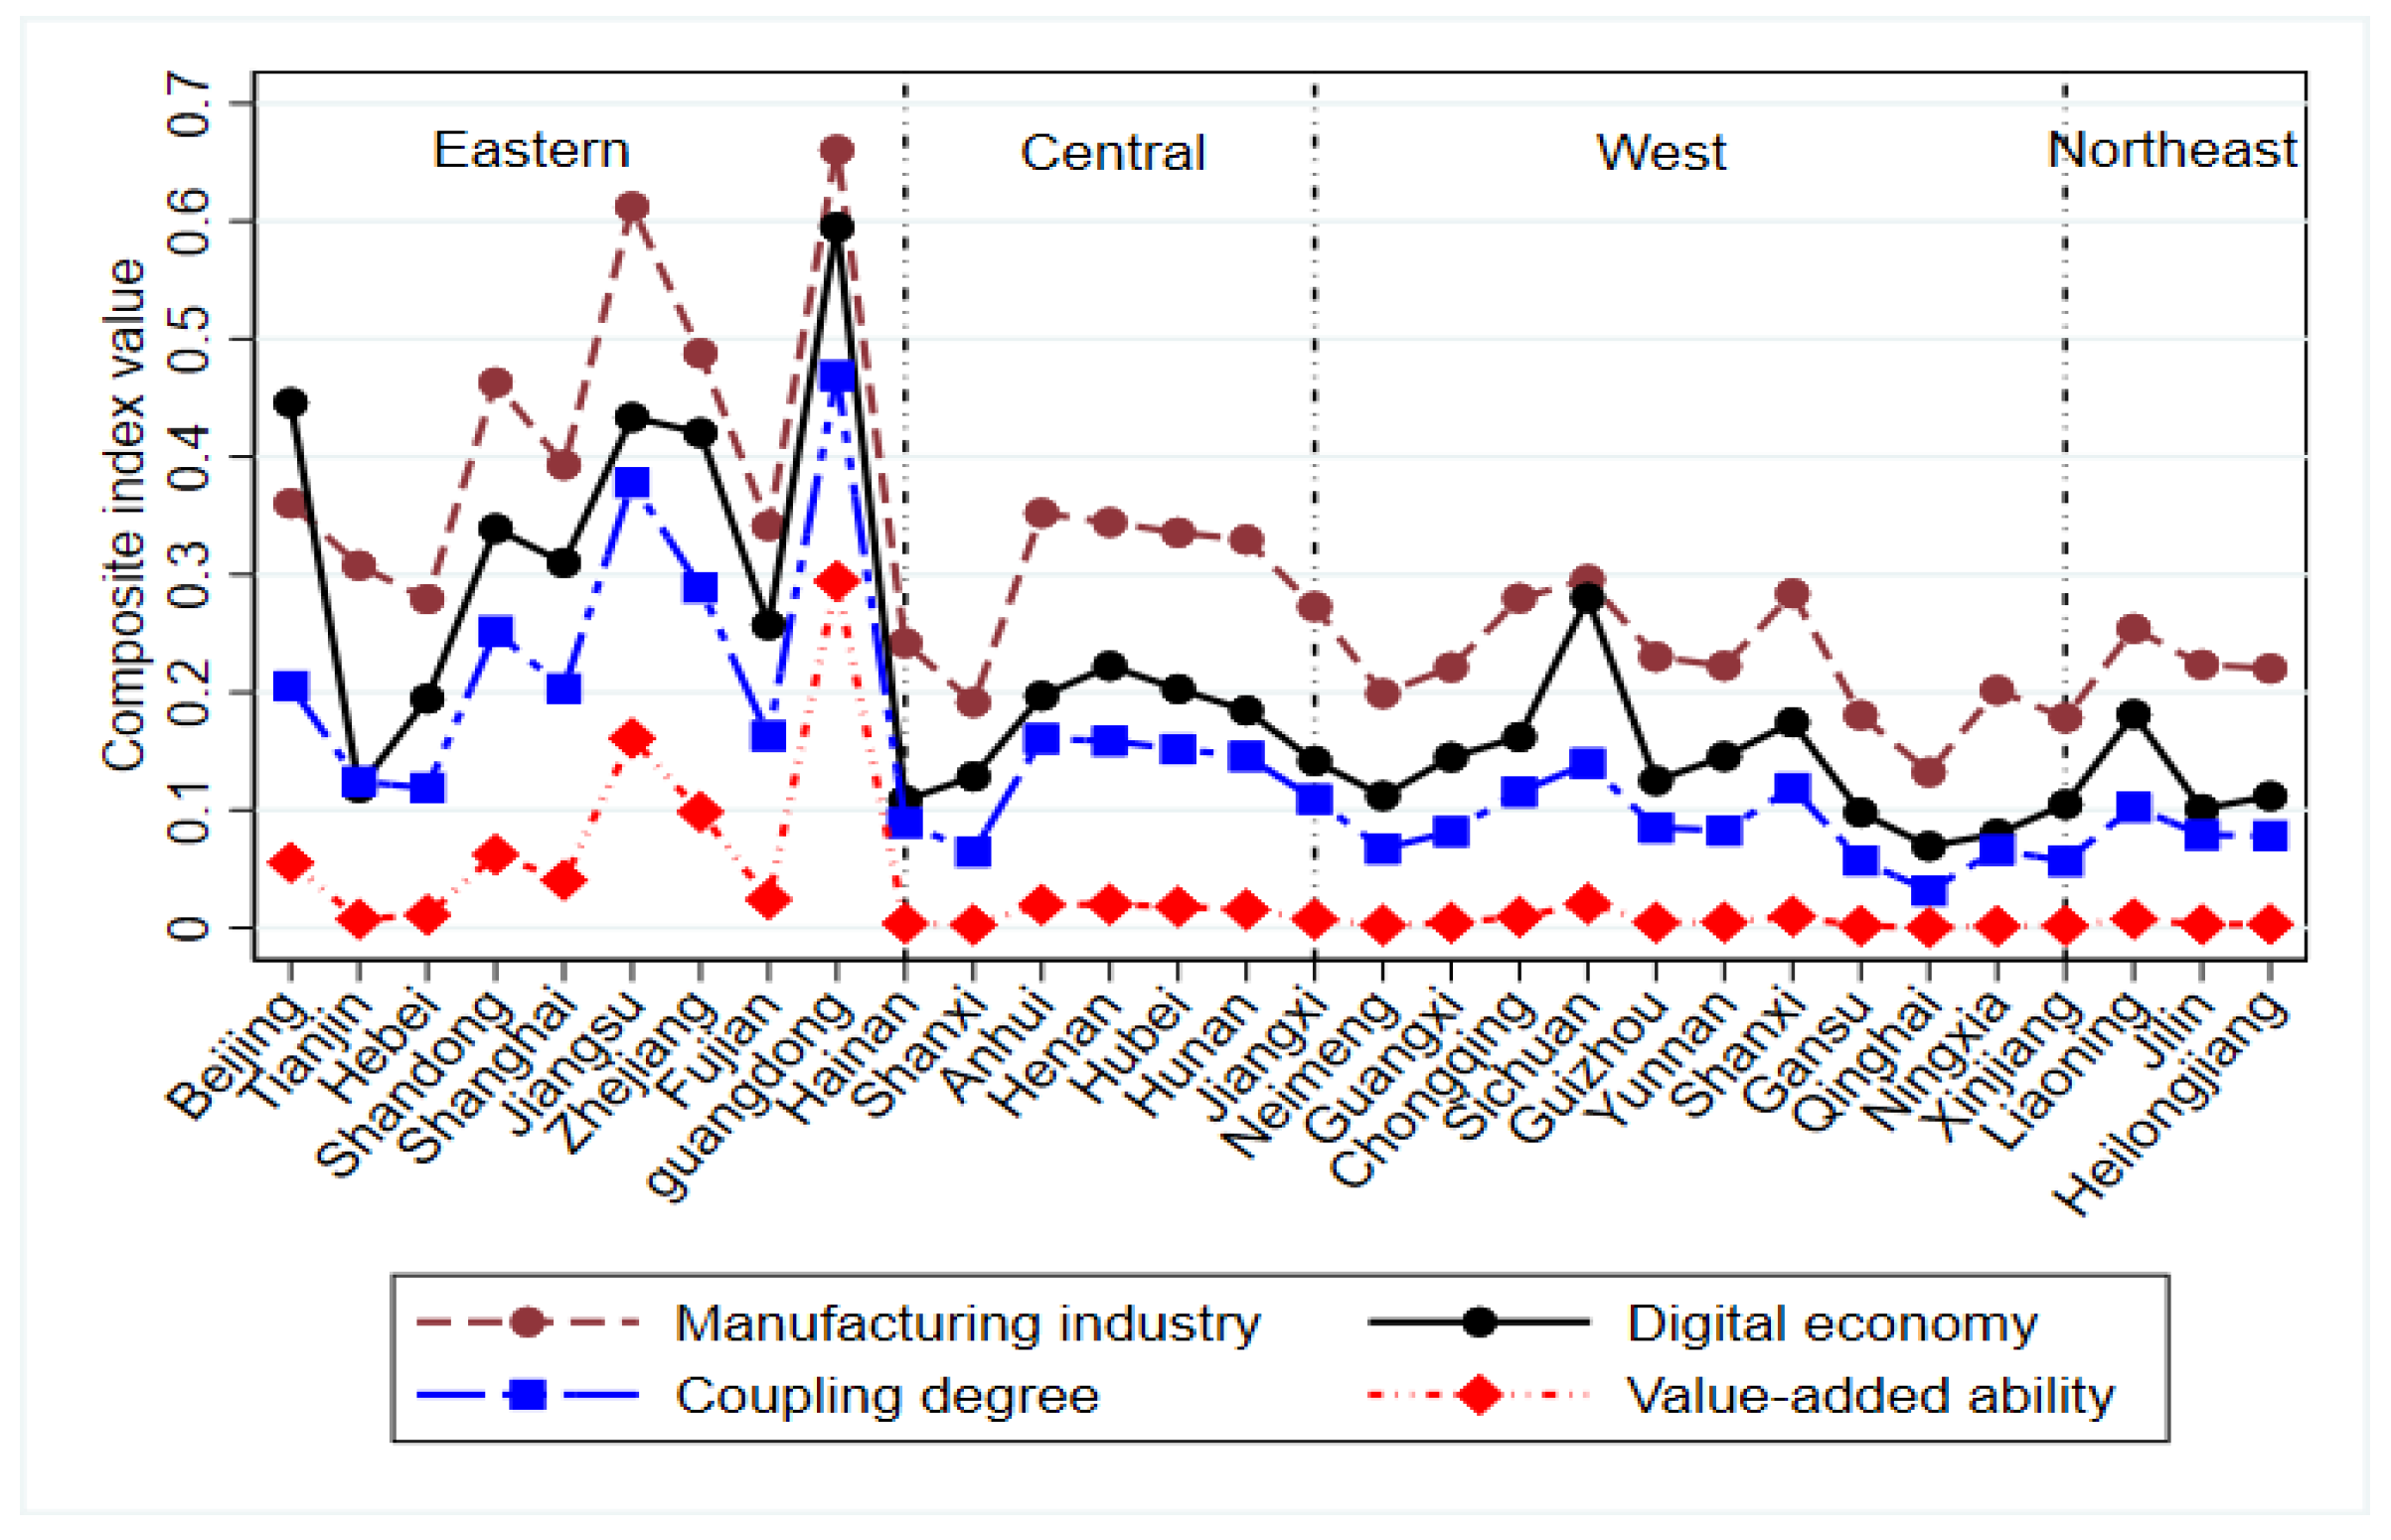
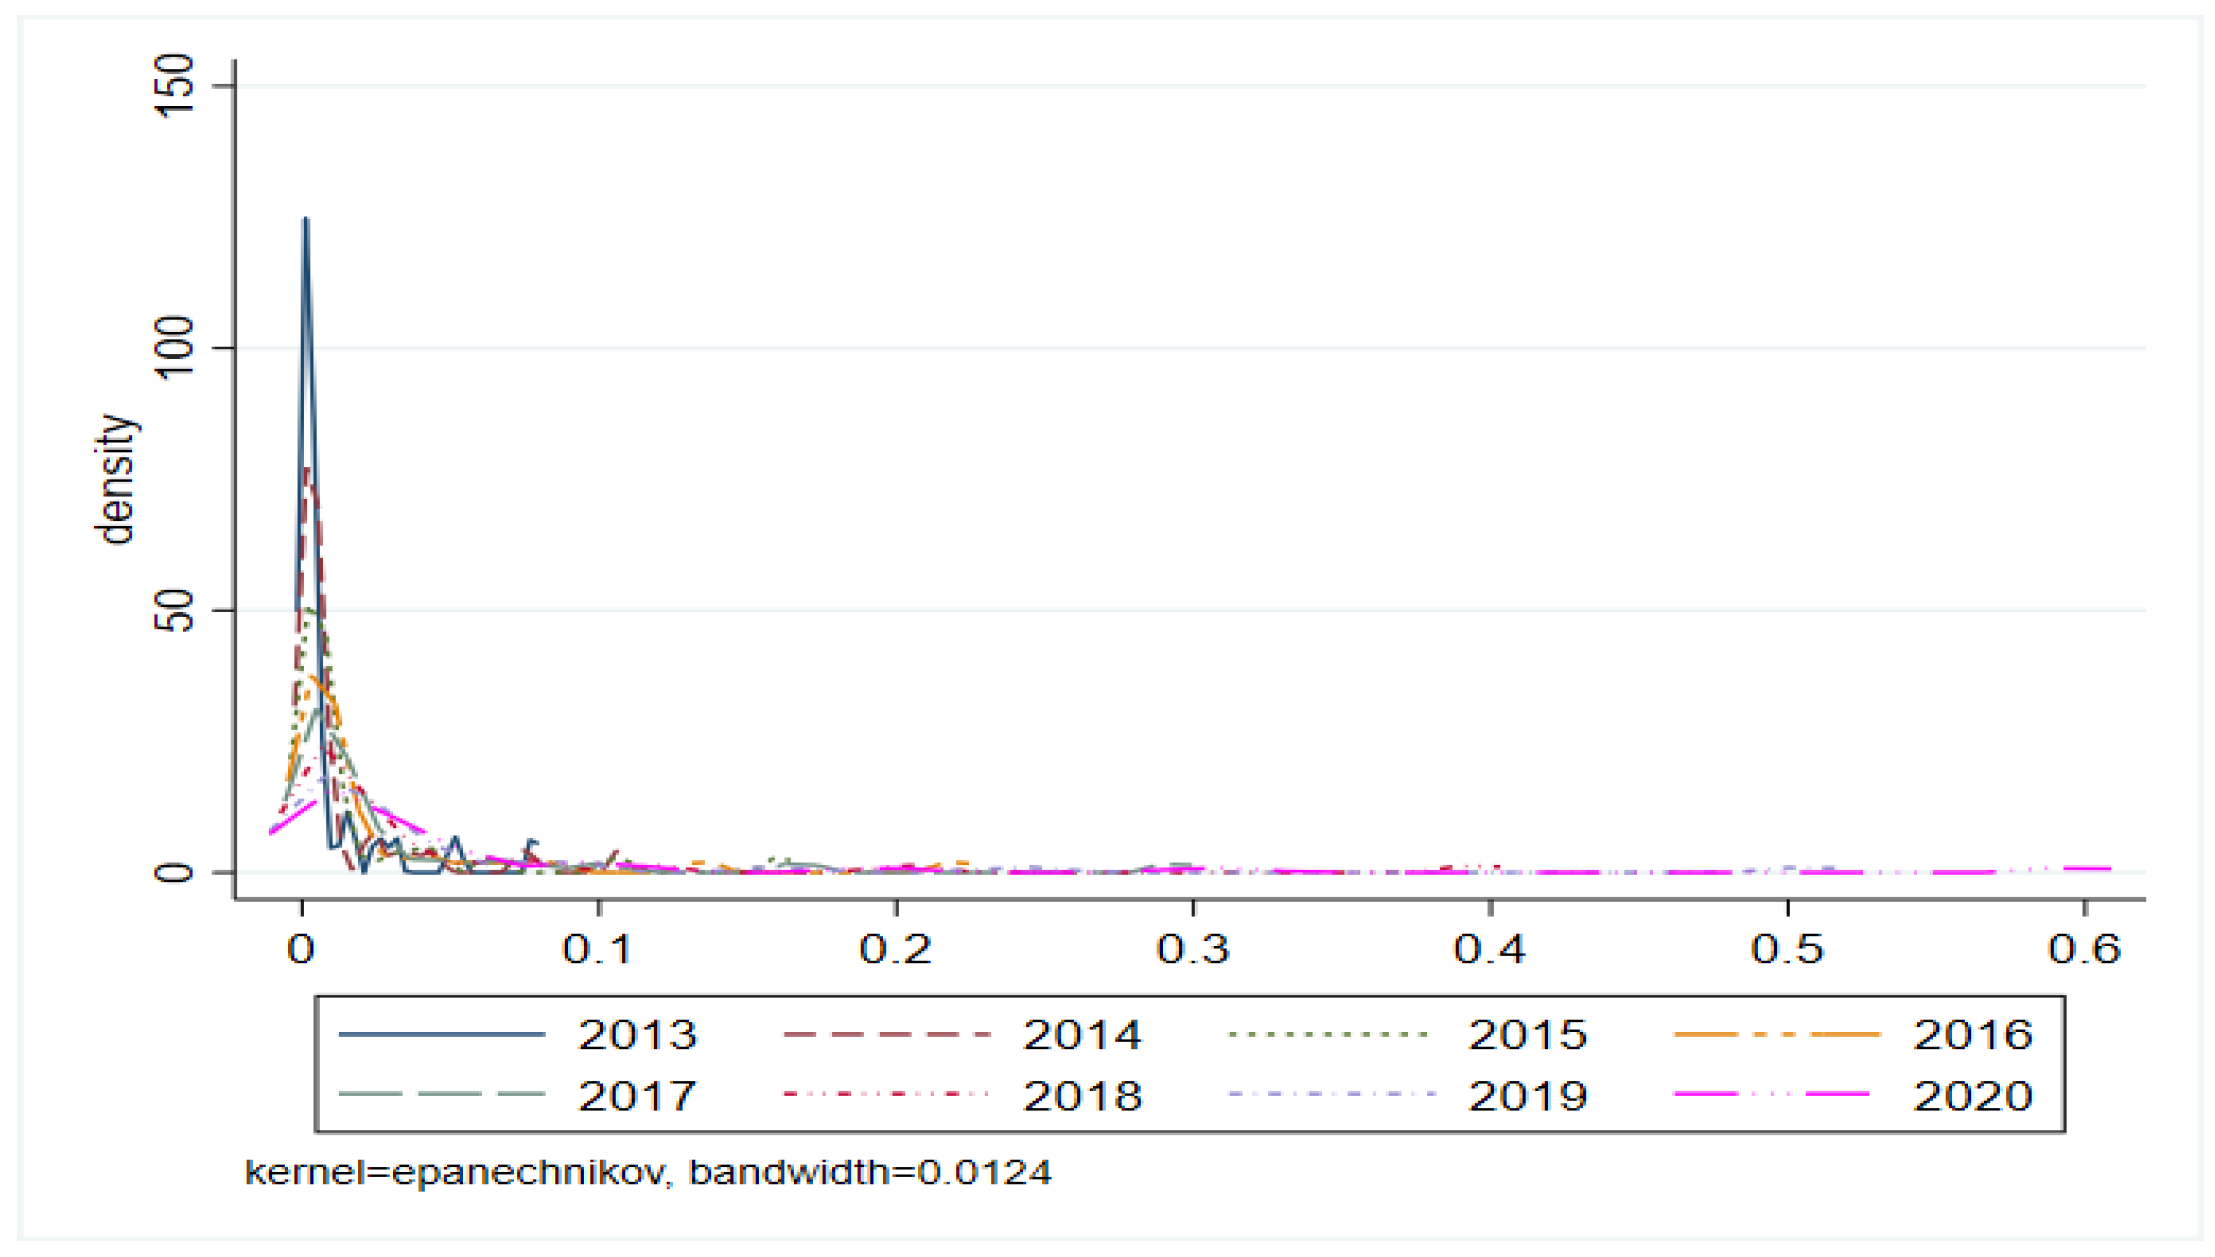
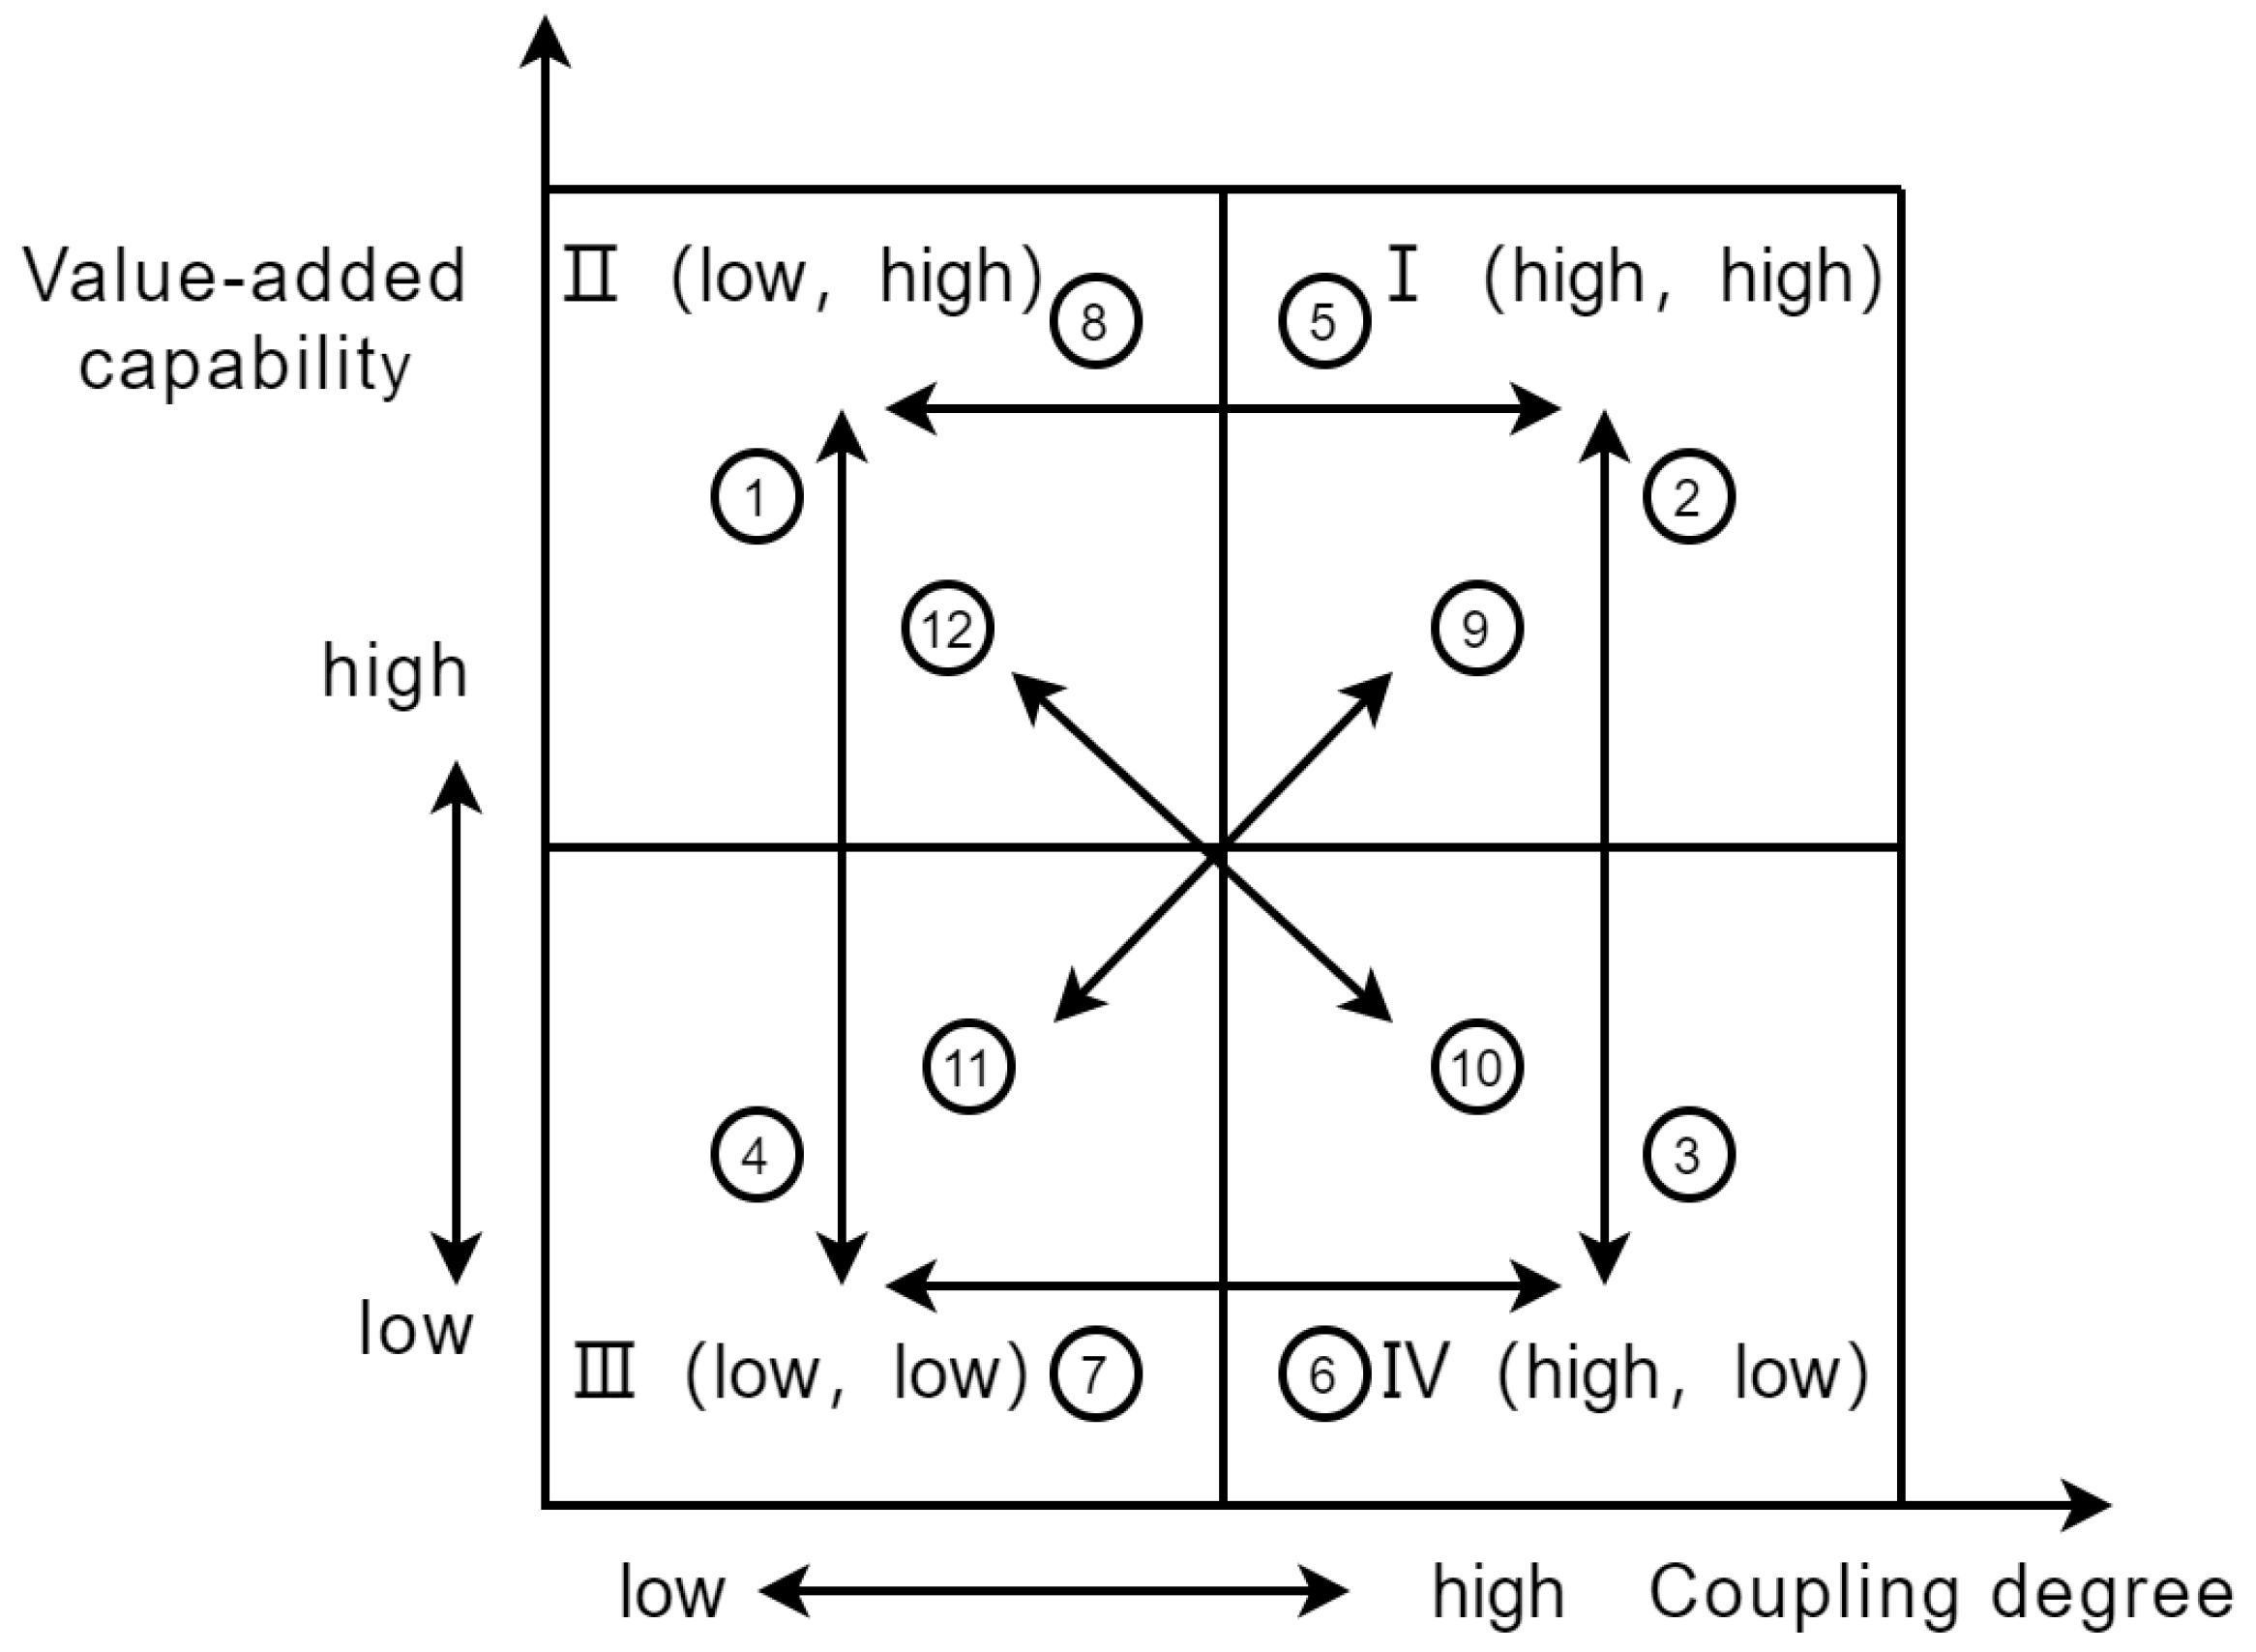
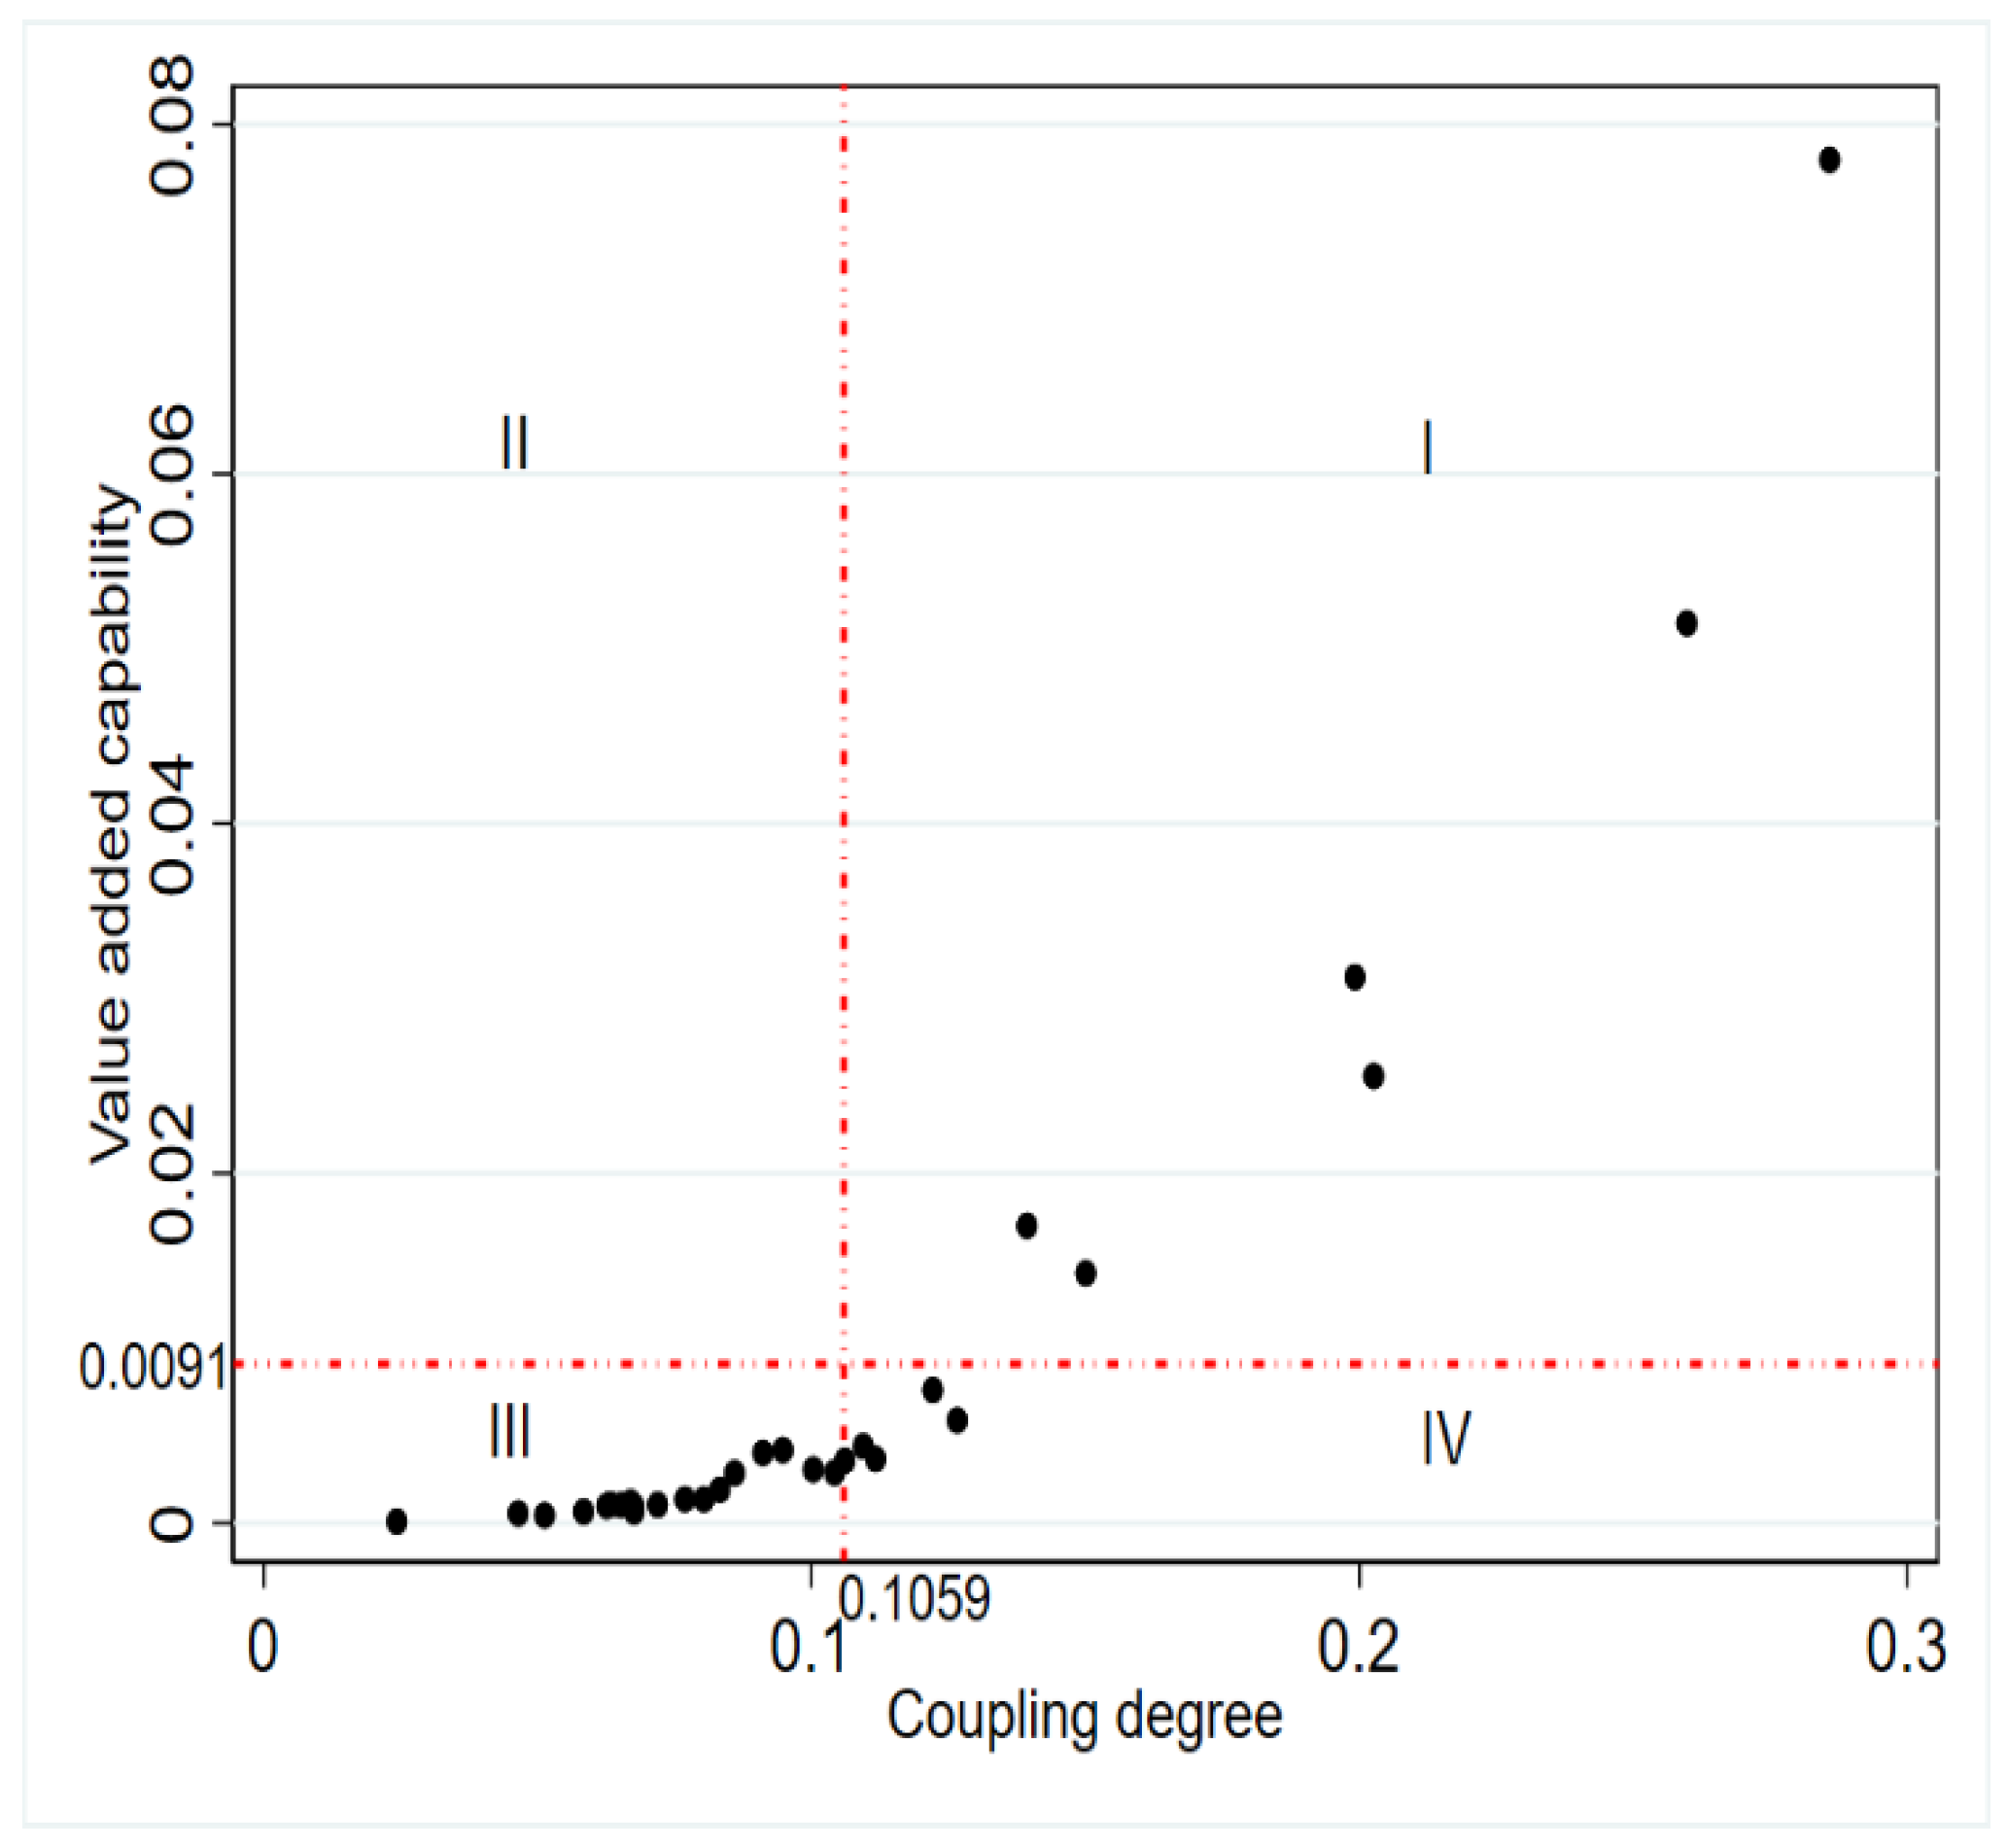
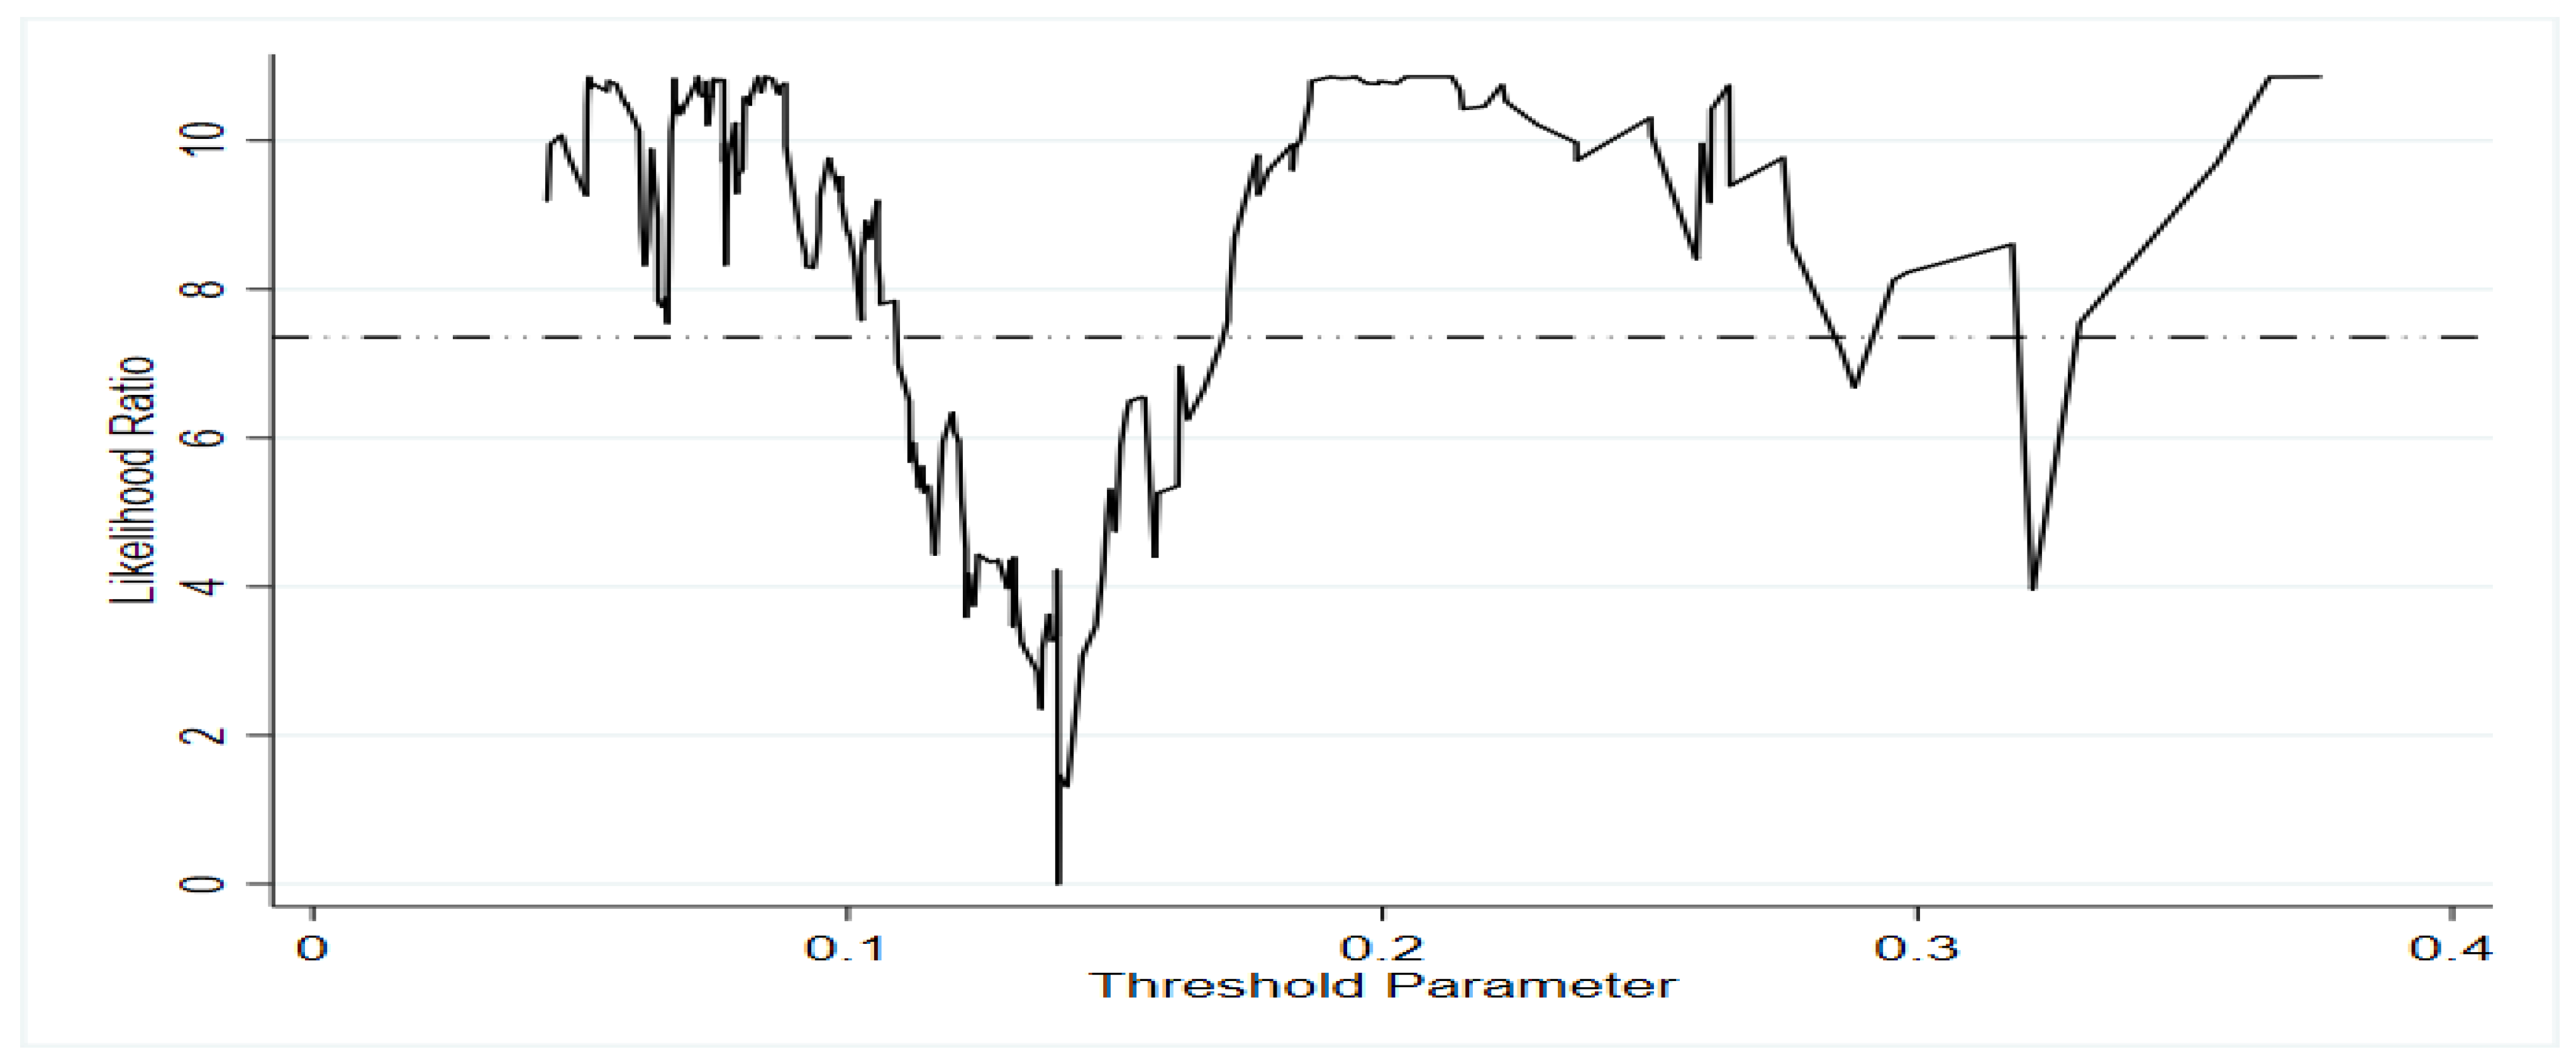
Table A1.
Test results of the threshold model of the coupling degree between the digital economy and the manufacturing industry.
Table A1.
Test results of the threshold model of the coupling degree between the digital economy and the manufacturing industry.
| Explained Variables: The Digital Economy and the Value-Added Capability of the Manufacturing System (val) | ||||||
|---|---|---|---|---|---|---|
| Threshold value | F-statistic | p value | Threshold interval | Threshold interval regression coefficient | p value of interval regression | Interval sample size |
| 0.1393 | 63.72 *** | 0.000 | 0.909 *** | 0.000 | 159 | |
| 0.839 *** | 0.000 | 71 | ||||
| 0.956 *** | 0.000 | 10 | ||||
Note: ***, represent the significance levels of 1%.
Figure A1.
Analysis Diagram of the Panel Threshold.

References
- China Academy of Information and Communication Research. Global Digital Economy White Paper—A New Dawn of Recovery under the Impact of the Epidemic (2021). China Academy of Information and Communication Research. 2021. Available online: http://www.caict.ac.cn/kxyj/qwfb/bps/202108/P020210913403798893557.pdf (accessed on 7 January 2023).
- Hui, N.; Yang, X. Digital economy drive and high-quality development of China’s manufacturing industry. J. Shaanxi Norm. Univ. 2022, 51, 133–147. [Google Scholar]
- Jiao, Y. Digital economy-enabled manufacturing transformation: From value reshaping to value creation. Economist 2020, 6, 87–94. [Google Scholar]
- Kılıçaslan, Y.; Töngür, Ü. ICT and employment generation: Evidence from Turkish manufacturing. Appl. Econ. Lett. 2019, 26, 1053–1057. [Google Scholar] [CrossRef]
- Rasel, F. ICT and global sourcing–evidence for German manufacturing and service firms. Econ. Innov. New Technol. 2017, 26, 634–660. [Google Scholar] [CrossRef] [Green Version]
- Kılıçaslan, Y.; Sickles, R.C.; Atay Kayış, A.A.; Gurel, Y.U. Impact of ICT on the productivity of the firm: Evidence from Turkish manufacturing. J. Prod. Anal. 2017, 47, 277–289. [Google Scholar] [CrossRef] [Green Version]
- Zhang, Y.; Ren, S.; Liu, Y.; Si, S.B. A big data analytics architecture for cleaner manufacturing and maintenance processes of complex products. J. Clean Prod. 2017, 142, 626–641. [Google Scholar] [CrossRef] [Green Version]
- Wamba, S.F.; Akter, S.; Edwards, A.; Chopin, G.; Gnanzou, D. How ‘big data’ can make big impact: Findings from a systematic review and a longitudinal case study. Int. J. Prod. Econ. 2015, 165, 234–246. [Google Scholar] [CrossRef]
- Sharma, R.; Mithas, S.; Kankanhalli, A. Transforming decision-making processes: A research agenda for understanding the impact of business analytics on organisations. Eur. J. Inf. Syst. 2014, 23, 433–441. [Google Scholar] [CrossRef] [Green Version]
- Liu, J.J.; Zhang, Z.Y.; Ayangbah, F. The impact of industrial internet on high quality development of the manufacturing industry. Cogent Econ. Financ. 2022, 10, 2135723. [Google Scholar]
- Shan, S.Q.; Wen, X.; Wei, Y.G.; Wang, Z.J.; Chen, Y. Intelligent manufacturing in industry 4.0: A case study of Sany heavy industry. Syst. Res. Behav. Sci. 2020, 37, 679–690. [Google Scholar] [CrossRef]
- Zhou, R.R.; Tang, D.C.; Da, D.; Chen, W.Y.; Kong, L.; Boamah, V. Research on China’s Manufacturing Industry Moving towards the Middle and High-End of the GVC Driven by Digital Economy. Sustainability 2022, 14, 7717. [Google Scholar] [CrossRef]
- Liu, Y.; Zhao, X.; Mao, F. The synergy degree measurement and transformation path of China’s traditional manufacturing industry enabled by digital economy. Math. Biosci. Eng. 2022, 19, 5738–5753. [Google Scholar] [PubMed]
- Xie, K.; Xiao, J.H.; Zhou, X.B.; Wu, J.P. The quality of industrialization and informatization integration in China: Theory and empirical evidence. Econ. Res. 2012, 47, 4–16+30. [Google Scholar]
- Wang, K.; Li, L.Y. An empirical study on the impact of "Internet+" on the development of China’s manufacturing industry. Quant. Econ. Tech. Econ. Res. 2018, 35, 3–20. [Google Scholar]
- Shi, Y.P. Integrated development of digital economy and manufacturing industry: Paths and suggestions. People’s Forum Acad. Front. 2021, 6, 34–39. [Google Scholar]
- Huang, Z.L.; Qin, S.Y.; Zhang, Y.H. How the digital economy drives the upgrading of manufacturing industry. Econ. Manag. 2022, 44, 80–97. [Google Scholar]
- Zheng, Q.J.; Jiang, W.M. Research on digital transformation of manufacturing enterprises under the perspective of digital economy. Jiangsu. Soc. Sci. 2022, 10, 137–149+244. [Google Scholar]
- Jia, J.F.; Zhao, R.N.; Liu, W.P. A study on the grouping of transformation and upgrading of manufacturing state-owned enterprises in the digital economy. Res. Dev. Manag. 2022, 34, 13–26. [Google Scholar]
- Li, C.F.; Li, D.D.; Zhou, C. The mechanism of the transformation and upgrading of manufacturing industry driven by digital economy. Bus. Res. 2020, 2, 73–82. [Google Scholar]
- He, X.H.; Ping, Q.Y.; Hu, W.F. Does digital technology promote the sustainable development of the marine equipment manufacturing industry in China. Mar. Pol. 2022, 136, 104868. [Google Scholar] [CrossRef]
- Qi, Q.L.; Tao, F. Digital twin and big data towards smart manufacturing and industry 4.0: 360 degree comparison. IEEE Access. 2018, 6, 3585–3593. [Google Scholar] [CrossRef]
- Tao, F.; Qi, Q.L.; Wang, L.H.; Nee, A.Y.C. Digital twins and cyber–physical systems toward smart manufacturing and industry 4.0: Correlation and comparison. Engineering 2019, 5, 653–661. [Google Scholar] [CrossRef]
- Yin, S.; Zhang, N.; Ullah, K.; Gao, S. Enhancing Digital Innovation for the Sustainable Transformation of Manufacturing Industry: A Pressure-State-Response System Framework to Perceptions of Digital Green Innovation and Its Performance for Green and Intelligent Manufacturing. Systems 2022, 10, 72. [Google Scholar] [CrossRef]
- Zhang, W.; Zhang, T.; Li, H.Y.; Zhang, H. Dynamic spillover capacity of R&D and digital investments in China’s manufacturing industry under long-term technological progress based on the industry chain perspective. Technol. Soc. 2022, 71, 102129. [Google Scholar]
- Guo, L.; Xu, L. The Effects of Digital Transformation on Firm Performance: Evidence from China’s Manufacturing Sector. Sustainability 2021, 13, 12844. [Google Scholar] [CrossRef]
- Lv, M.Y.; Ma, L.Y. Analysis of provincial big data and manufacturing industry integration measurement in China--based on Chinese provincial panel data from 2013–2018. Technol. Econ. 2022, 41, 88–100. [Google Scholar]
- Wu, X.T.; Zhang, Q.Y. Measuring the integration of digital economy industry and manufacturing industry based on input-output perspective. China. Circ. Econ. 2021, 35, 89–98. [Google Scholar]
- Wang, S.J.; Kong, W.; Ren, L.; Zhi, D.D.; Dai, B.T. Misconceptions and corrections of domestic coupled coordination models. J. Nat. Resour. 2021, 36, 793–810. [Google Scholar]
- Leng, J.W.; Wang, D.W.; Shen, W.M.; Li, X.Y.; Liu, Q.; Chen, X. Digital twins-based smart manufacturing system design in Industry 4.0: A review. J. Manuf. Syst. 2021, 60, 119–137. [Google Scholar] [CrossRef]
- Lee, J.; Azamfar, M.; Bagheri, B. A unified digital twin framework for shop floor design in industry 4.0 manufacturing systems. Manuf. Lett. 2021, 27, 87–91. [Google Scholar] [CrossRef]
- Kurfess, T.R.; Saldana, C.; Saleeby, K.; Dezfouli, M.P. A review of modern communication technologies for digital manufacturing processes in industry 4.0. J. Manuf. Sci. Eng. Trans. ASME. 2020, 142. [Google Scholar] [CrossRef]
- Young, A.A. Increasing returns and economic progress. Econ. J. 1928, 38, 527–542. [Google Scholar] [CrossRef]
- Yang, H.X.; Jiao, Y.; Chen, Q.J. Dualization and endogenous economic growth. Econ Manag. 2016, 38, 1–9. [Google Scholar]
- Kumbhakar, S.C. Production frontiers, panel data, and time-varying technical inefficiency. J. Econom. 1990, 46, 201–211. [Google Scholar] [CrossRef]
- Zhou, X.; Li, K.W.; Li, Q. An analysis on technical efficiency in post-reform China. China Econ. Rev. 2011, 22, 357–372. [Google Scholar] [CrossRef]
- Liu, J.; Yang, Y.J.; Zhang, S.F. Study on the measurement and drivers of China’s digital economy. Shanghai. Econ. Res. 2020, 6, 81–96. [Google Scholar]
- Wang, J.; Zhu, J.; Luo, Q. The development level and evolution measurement of China’s digital economy. Quant. Econ. Tech. Econ. Res. 2021, 38, 26–42. [Google Scholar]
- Wan, X.Y.; Luo, Y.Q. Measurement of development level of digital economy and its influence on total factor productivity. Reform. 2022, 335, 101–118. [Google Scholar]
- Wang, J.J.; She, G.J. Digital measure and regional economic development level more in China. China. Circ. Econ. 2021, 35, 3–17. [Google Scholar]
- Sheng, B.; Liu, Y.Y. Research on measurement and spatial differentiation of China’s digital economy development index. Nanjing. Soc. Sci. 2022, 411, 43–54. [Google Scholar]
- Xu, X.C.; Zhang, M.H. Measurement and research on the scale of China’s digital economy-based on the perspective of international comparison. China Ind. Econ. 2020, 386, 23–41. [Google Scholar]
- Jiao, Y. Regional differences and dynamic evolution of high-quality digital economy in China. Econ. Syst. Reform. 2021, 231, 34–40. [Google Scholar]
- Jin, C.Y.; Xu, A.T.; Qiu, K.Y. Measurement and spatial correlation of provincial digital economy in China. Statist. Inf. Forum. 2022, 37, 11–21. [Google Scholar]
- Guo, H.; Quan, Q.H. Integrated development of digital economy and real economy: Measurement evaluation and realization path. Econ. Rev. 2022, 444, 72–82. [Google Scholar]
- Jiang, X.G.; He, J.B.; Fang, L. Measurement of high quality development level, regional difference and improvement path of manufacturing industry. Shanghai. Econ. Res. 2019, 370, 70–78. [Google Scholar]
- Qu, L.; Wang, L.; Ji, H.Y. Analysis on the high quality development of China’s regional manufacturing Industry. Quant. Econ. Tech. Econ. Res. 2021, 38, 45–61. [Google Scholar]
- Zhang, L.; Zhu, N. Research on high quality Development evaluation of manufacturing industry in Central China based on entropy method. J. Xiangtan Univ. 2022, 46, 46–51. [Google Scholar]
- Zhang, A.Q.; Zhang, H.C. Analysis of high quality development level of manufacturing industry under the background of digital transformation. Sci. Tech. Manag. Res. 2021, 41, 68–75. [Google Scholar]
- Wang, M.J.; Yu, D.H. Regional difference measurement, dynamic evolution and source decomposition of high quality development in manufacturing industry. Stat. Decis. 2022, 38, 5–9. [Google Scholar]
- Xu, B.; Nie, Y.X. Research on Construction and evaluation of high quality development index system of manufacturing industry. Res. Tech. Econ. Manag. 2021, 302, 119–123. [Google Scholar]
- Wang, F.; Shi, X. Study on measurement and influencing factors of high quality development level of China’s manufacturing industry. China Soft Sci. 2022, 374, 22–31. [Google Scholar]
- Luo, X.B.; Huang, L. Measurement and inter-provincial comparison of high-quality transformation and upgrading of China’s manufacturing industry: Based on the perspective of “Four Modernizations”. Econ Probl. 2020, 496, 43–52. [Google Scholar]
- Guo, F.; Wang, J.Y.; Wang, F.; Kong, T.; Zhang, X.; Cheng, Z.Y. Measuring the development of digital inclusive finance in China: Index compilation and spatial characteristics. Economics 2020, 19, 1401–1418. [Google Scholar]
- Hansen, B.E. Sample splitting and threshold estimation. Econometrica 2000, 68, 575–603. [Google Scholar] [CrossRef]
Figure 1.
Three forms of value-added capability of coupling between the digital economy and the manufacturing industry((a) graph is , (b) graph is , (c) graph is ).
Figure 1.
Three forms of value-added capability of coupling between the digital economy and the manufacturing industry((a) graph is , (b) graph is , (c) graph is ).

Figure 2.
The digital economy and manufacturing industry comprehensive development index in whole country.
Figure 2.
The digital economy and manufacturing industry comprehensive development index in whole country.

Figure 3.
The digital economy and manufacturing industry comprehensive development index of provinces and municipalities from 2013 to 2020.
Figure 3.
The digital economy and manufacturing industry comprehensive development index of provinces and municipalities from 2013 to 2020.
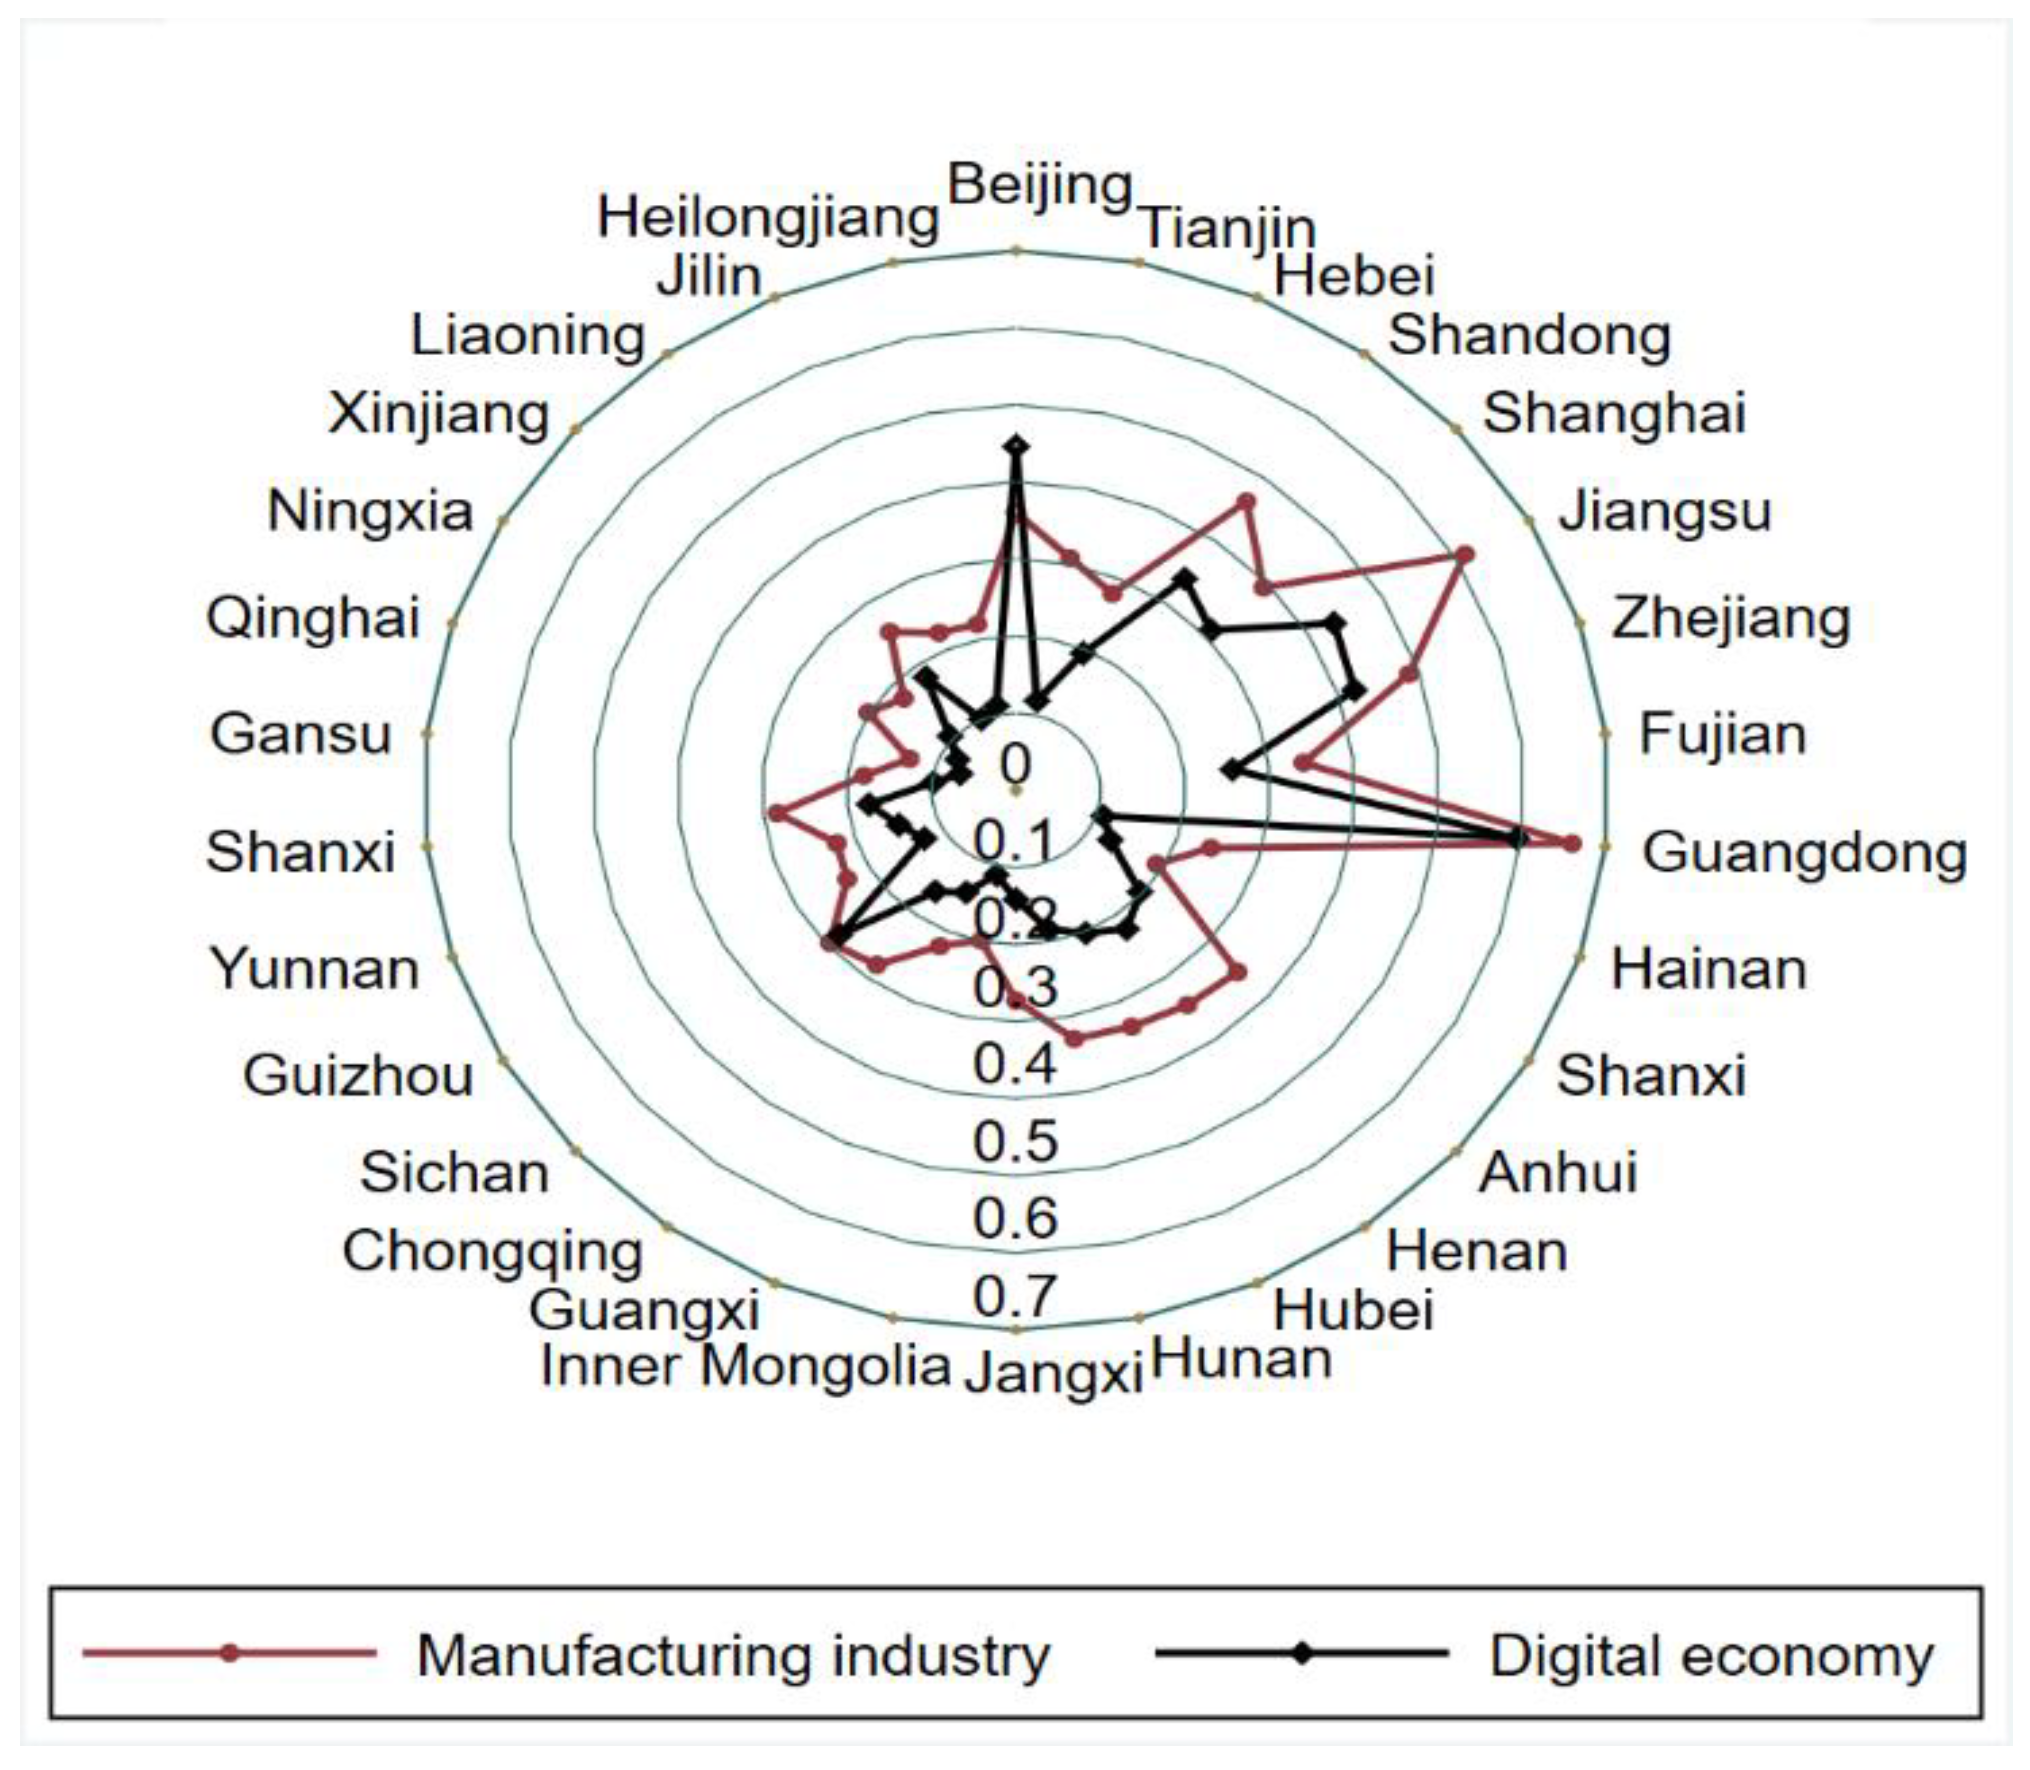
Figure 4.
The kernel density of digital economy development from 2013 to 2020.

Figure 5.
The kernel density of manufacturing industry development from 2013 to 2020.

Figure 6.
The national digital economy, the manufacturing industry, and their promotion efficiencies.
Figure 6.
The national digital economy, the manufacturing industry, and their promotion efficiencies.

Figure 7.
The digital economy, the manufacturing industry, and their promotion efficiencies in sample provinces and municipalities.
Figure 7.
The digital economy, the manufacturing industry, and their promotion efficiencies in sample provinces and municipalities.
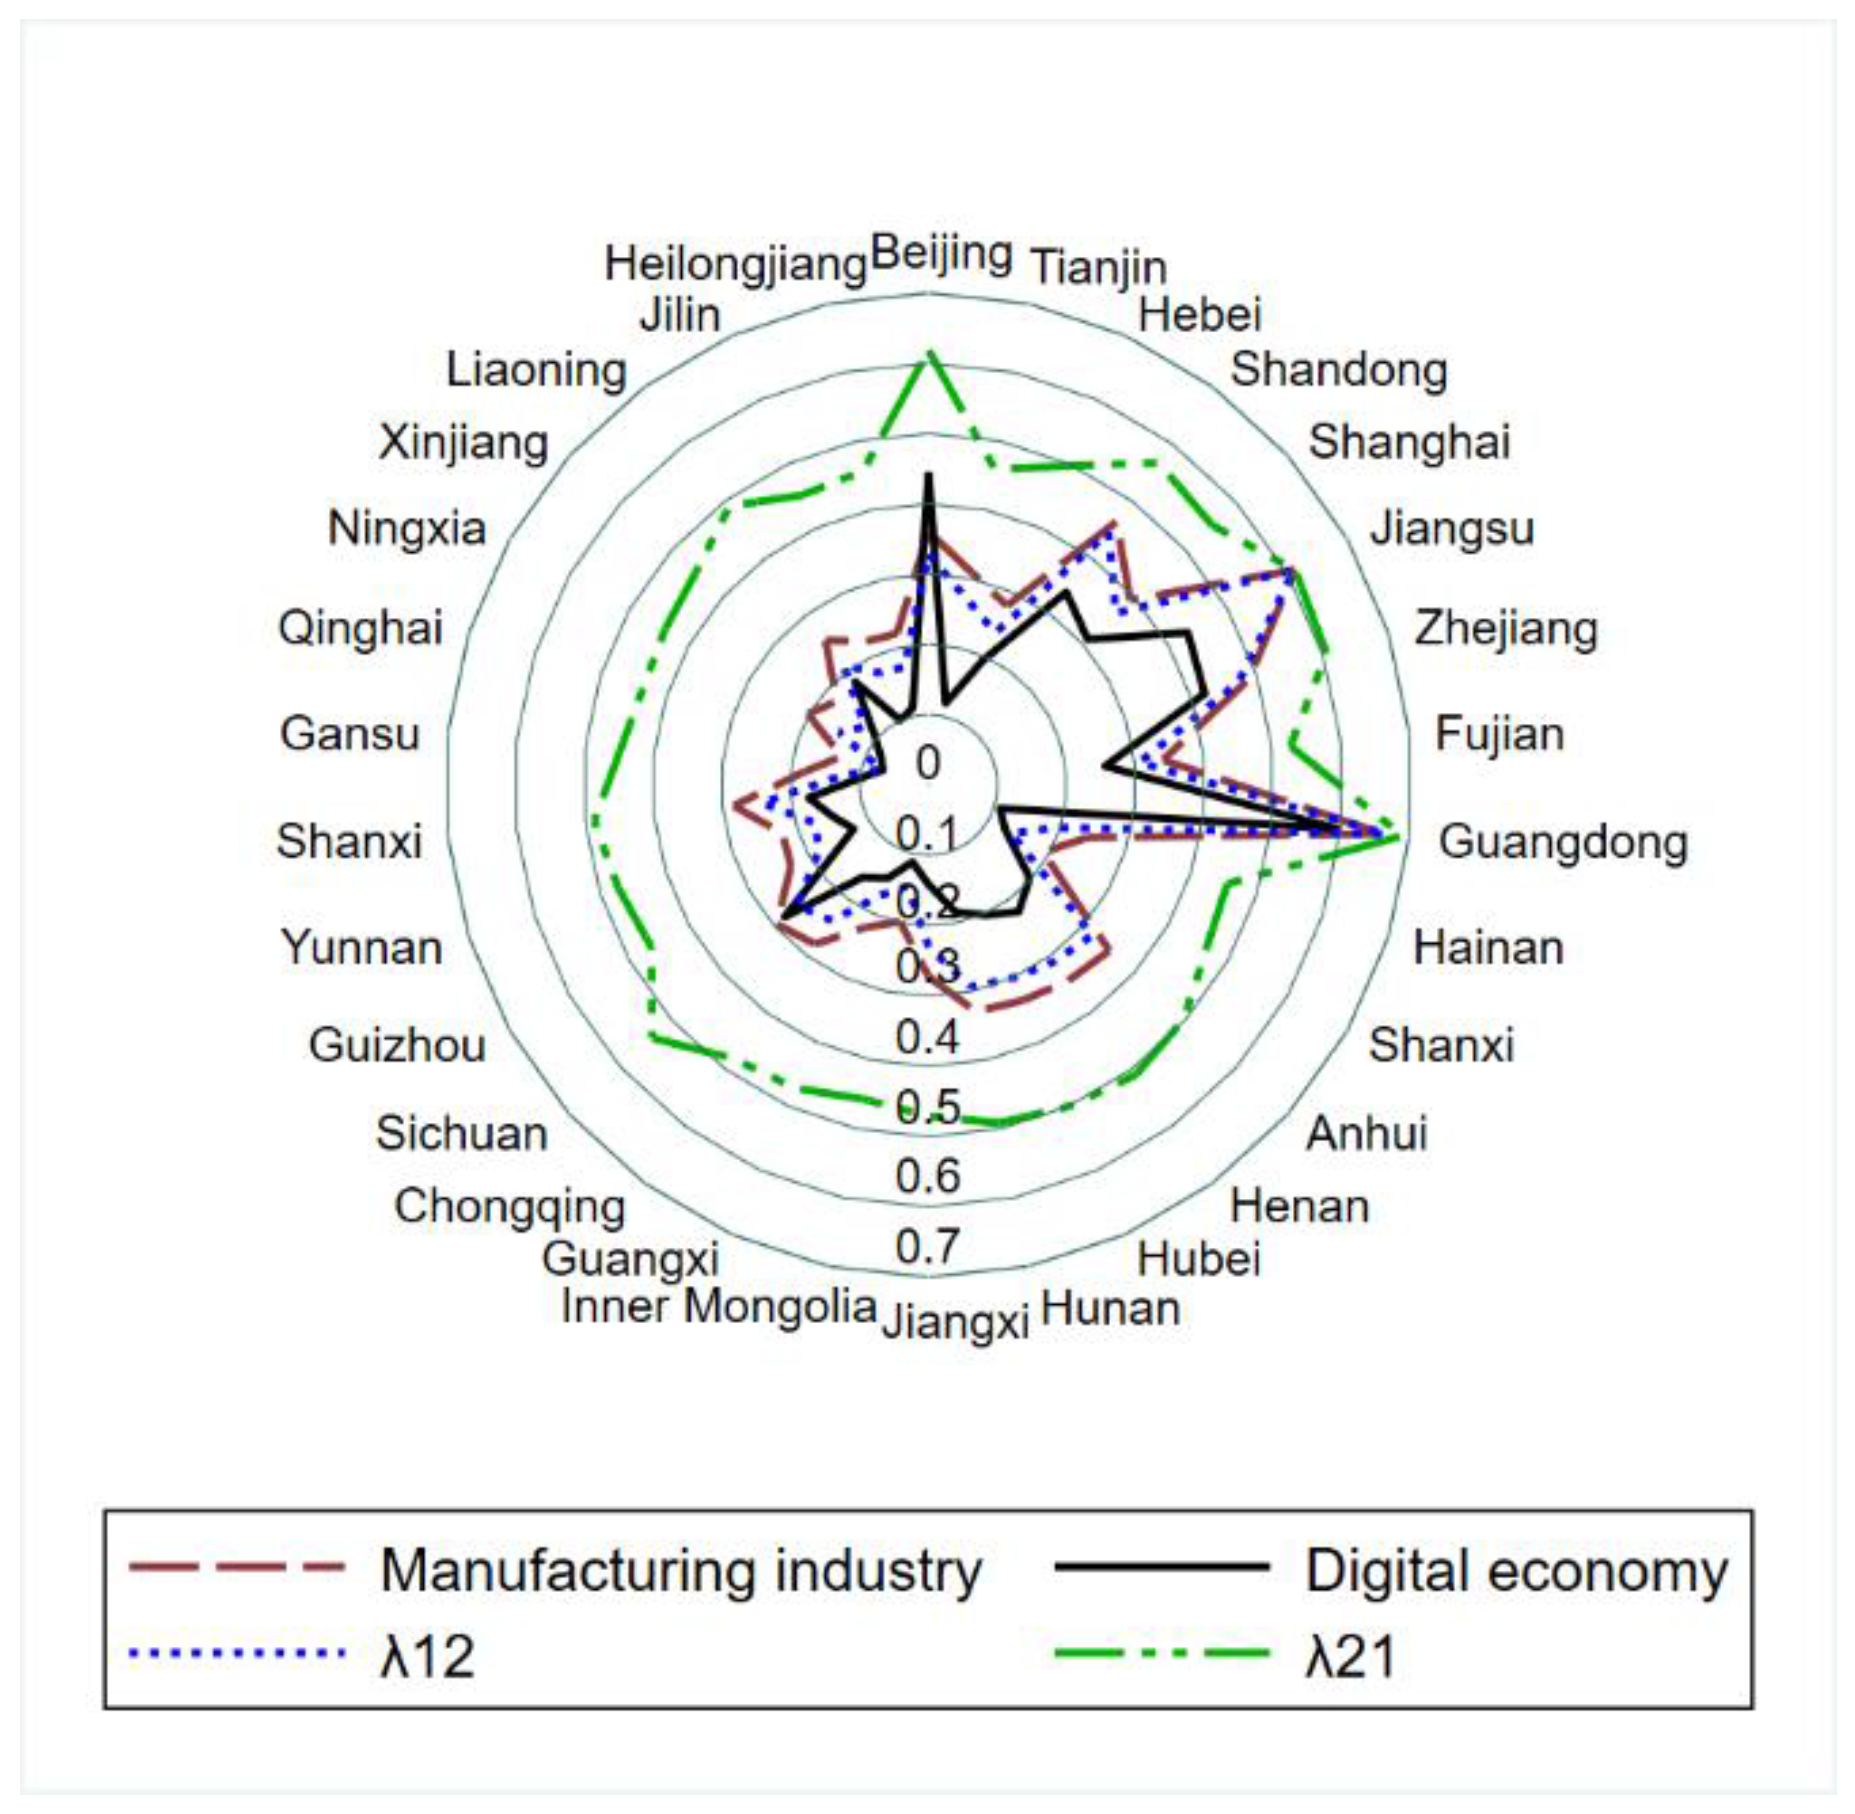
Figure 8.
The digital economy, the manufacturing industry, and standard deviation of their promotion efficiencies in sample provinces and municipalities.
Figure 8.
The digital economy, the manufacturing industry, and standard deviation of their promotion efficiencies in sample provinces and municipalities.
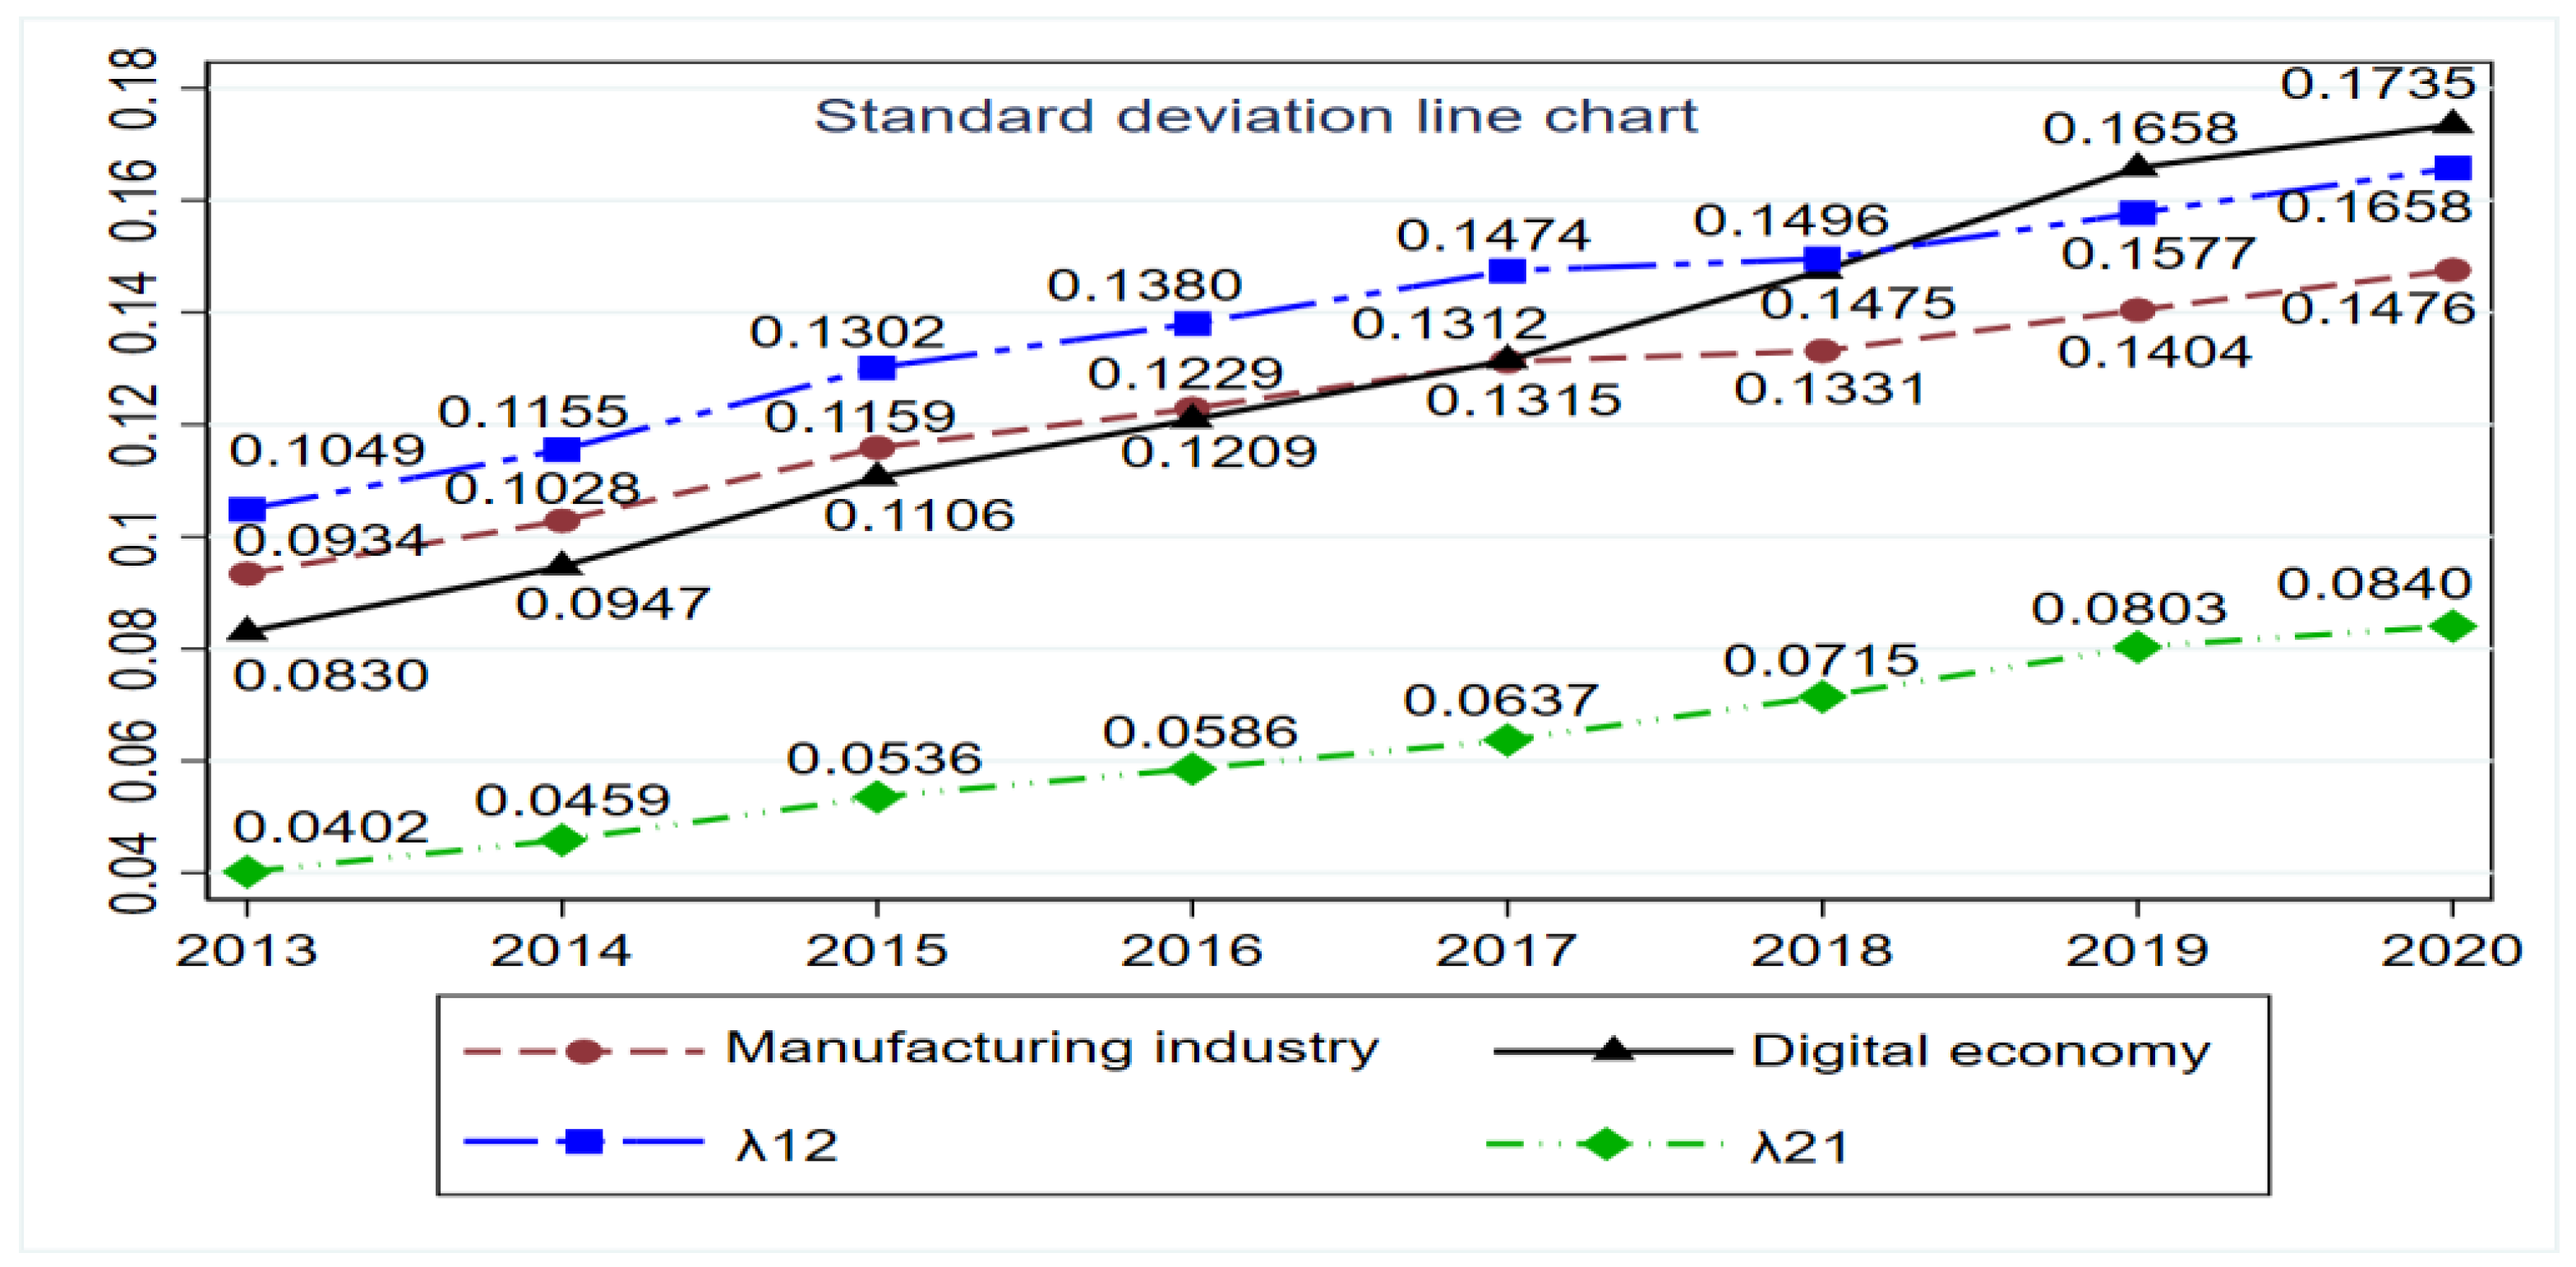
Figure 9.
Dynamic trends in the coupling degree and the value-added capability of the manufacturing industry and the digital economy in China.
Figure 9.
Dynamic trends in the coupling degree and the value-added capability of the manufacturing industry and the digital economy in China.
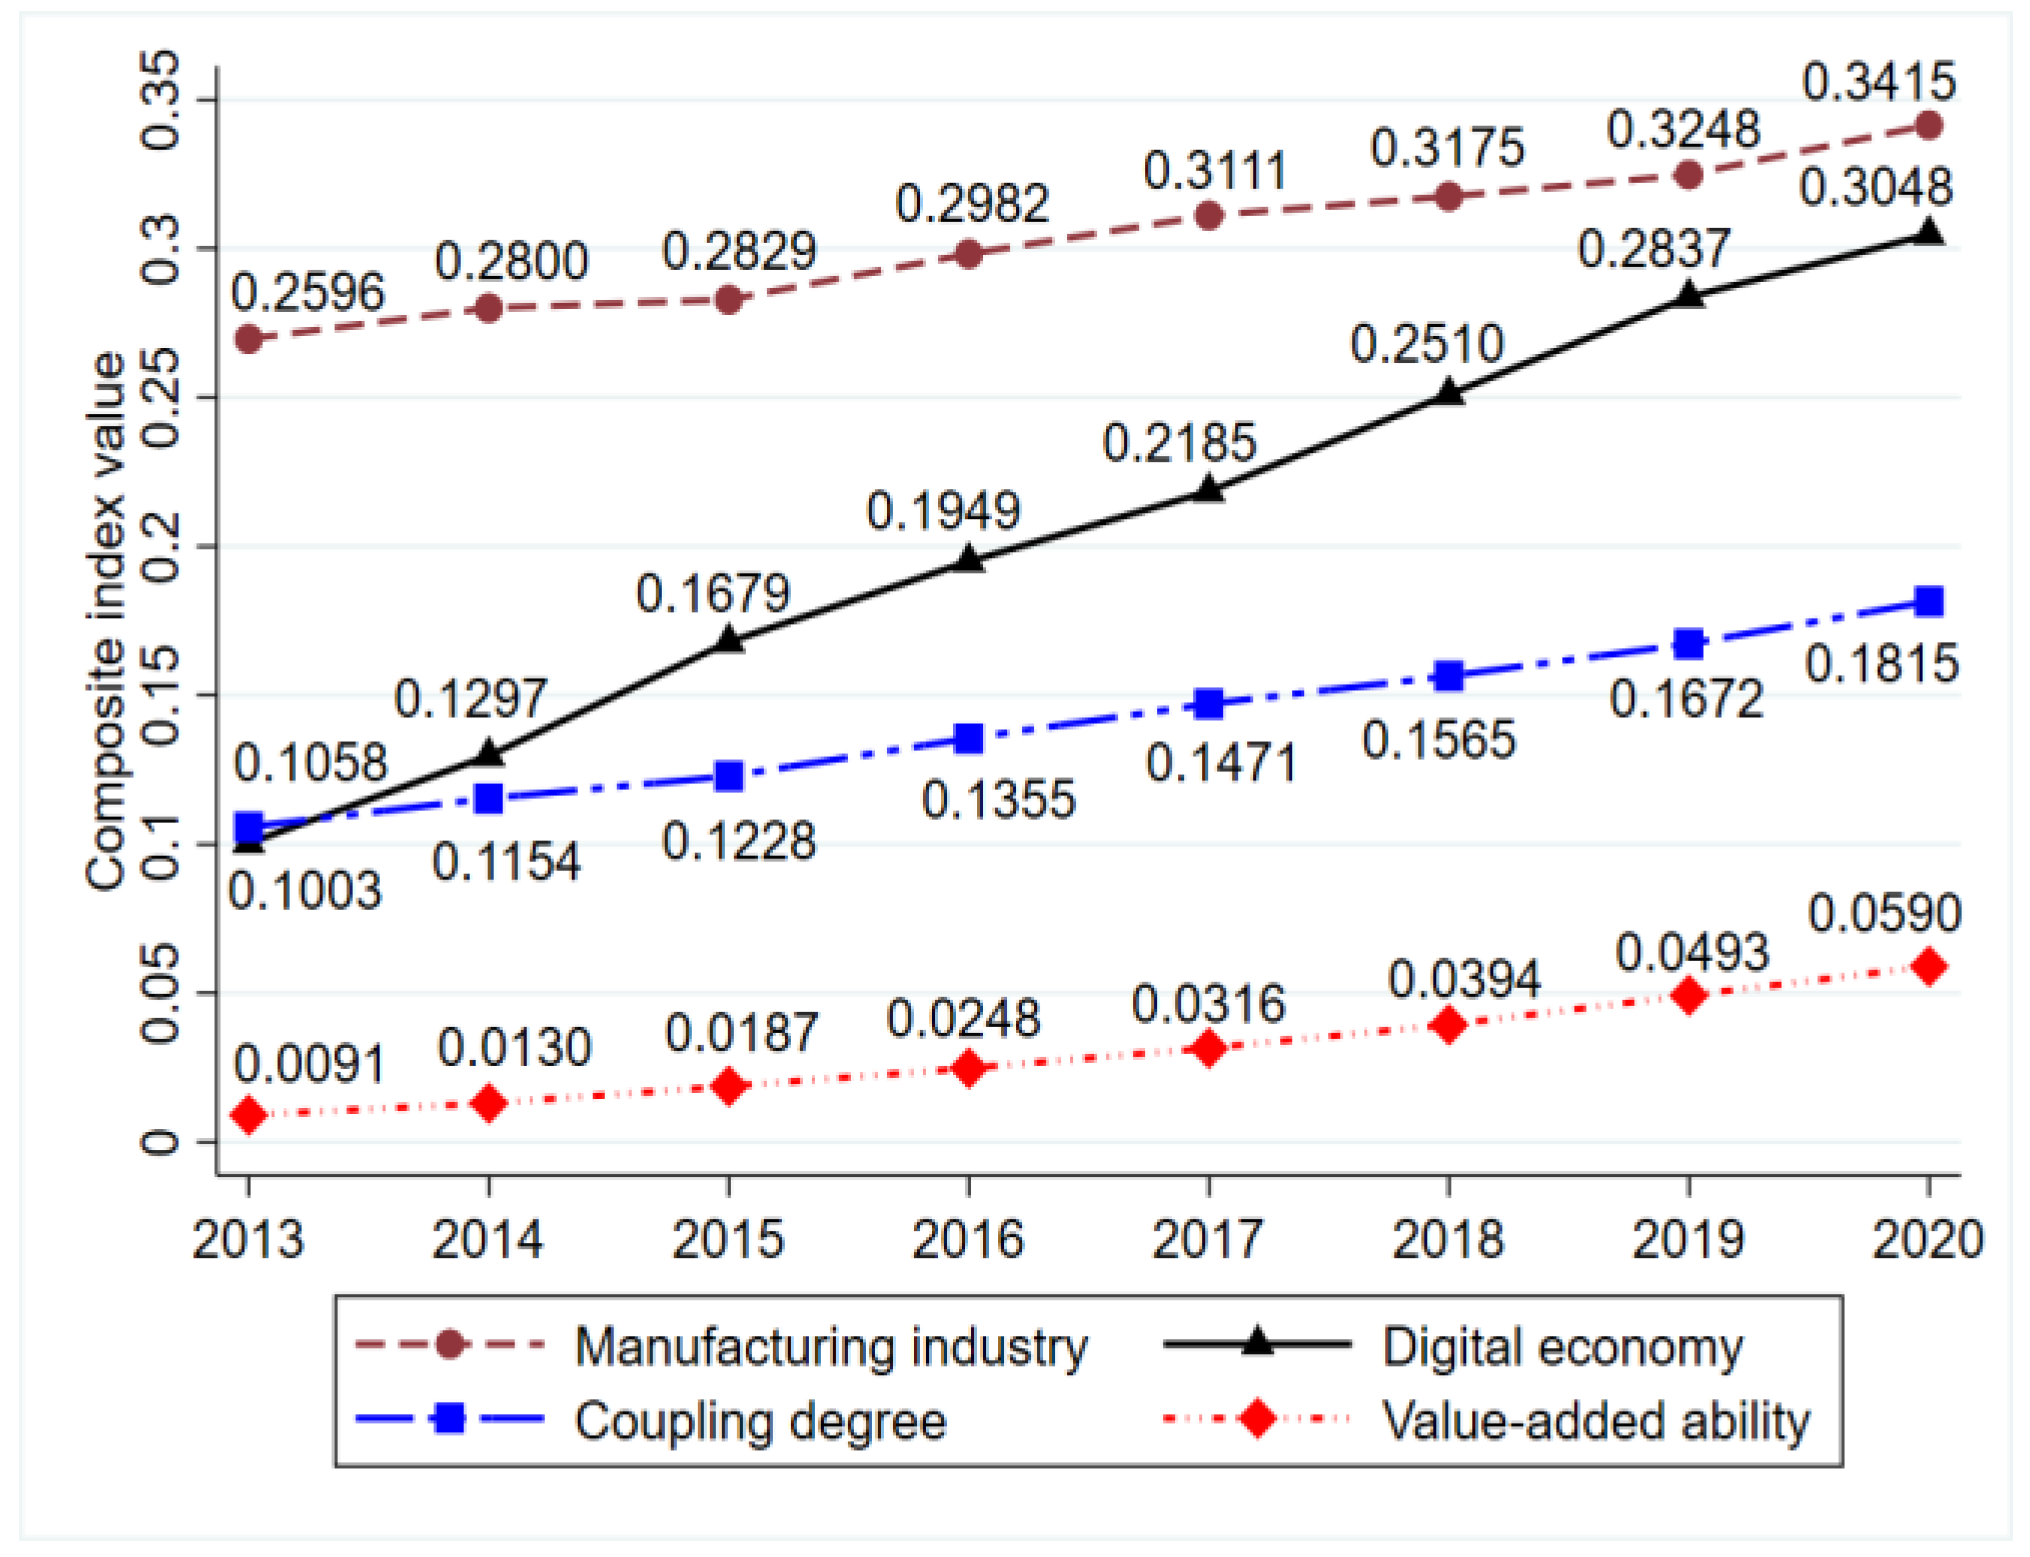
Figure 10.
The coupling degree and the value-added capability of the manufacturing industry and the digital economy in sample provinces and municipalities.
Figure 10.
The coupling degree and the value-added capability of the manufacturing industry and the digital economy in sample provinces and municipalities.

Figure 11.
Kernel density of the coupling degree from 2013 to 2020 in China.
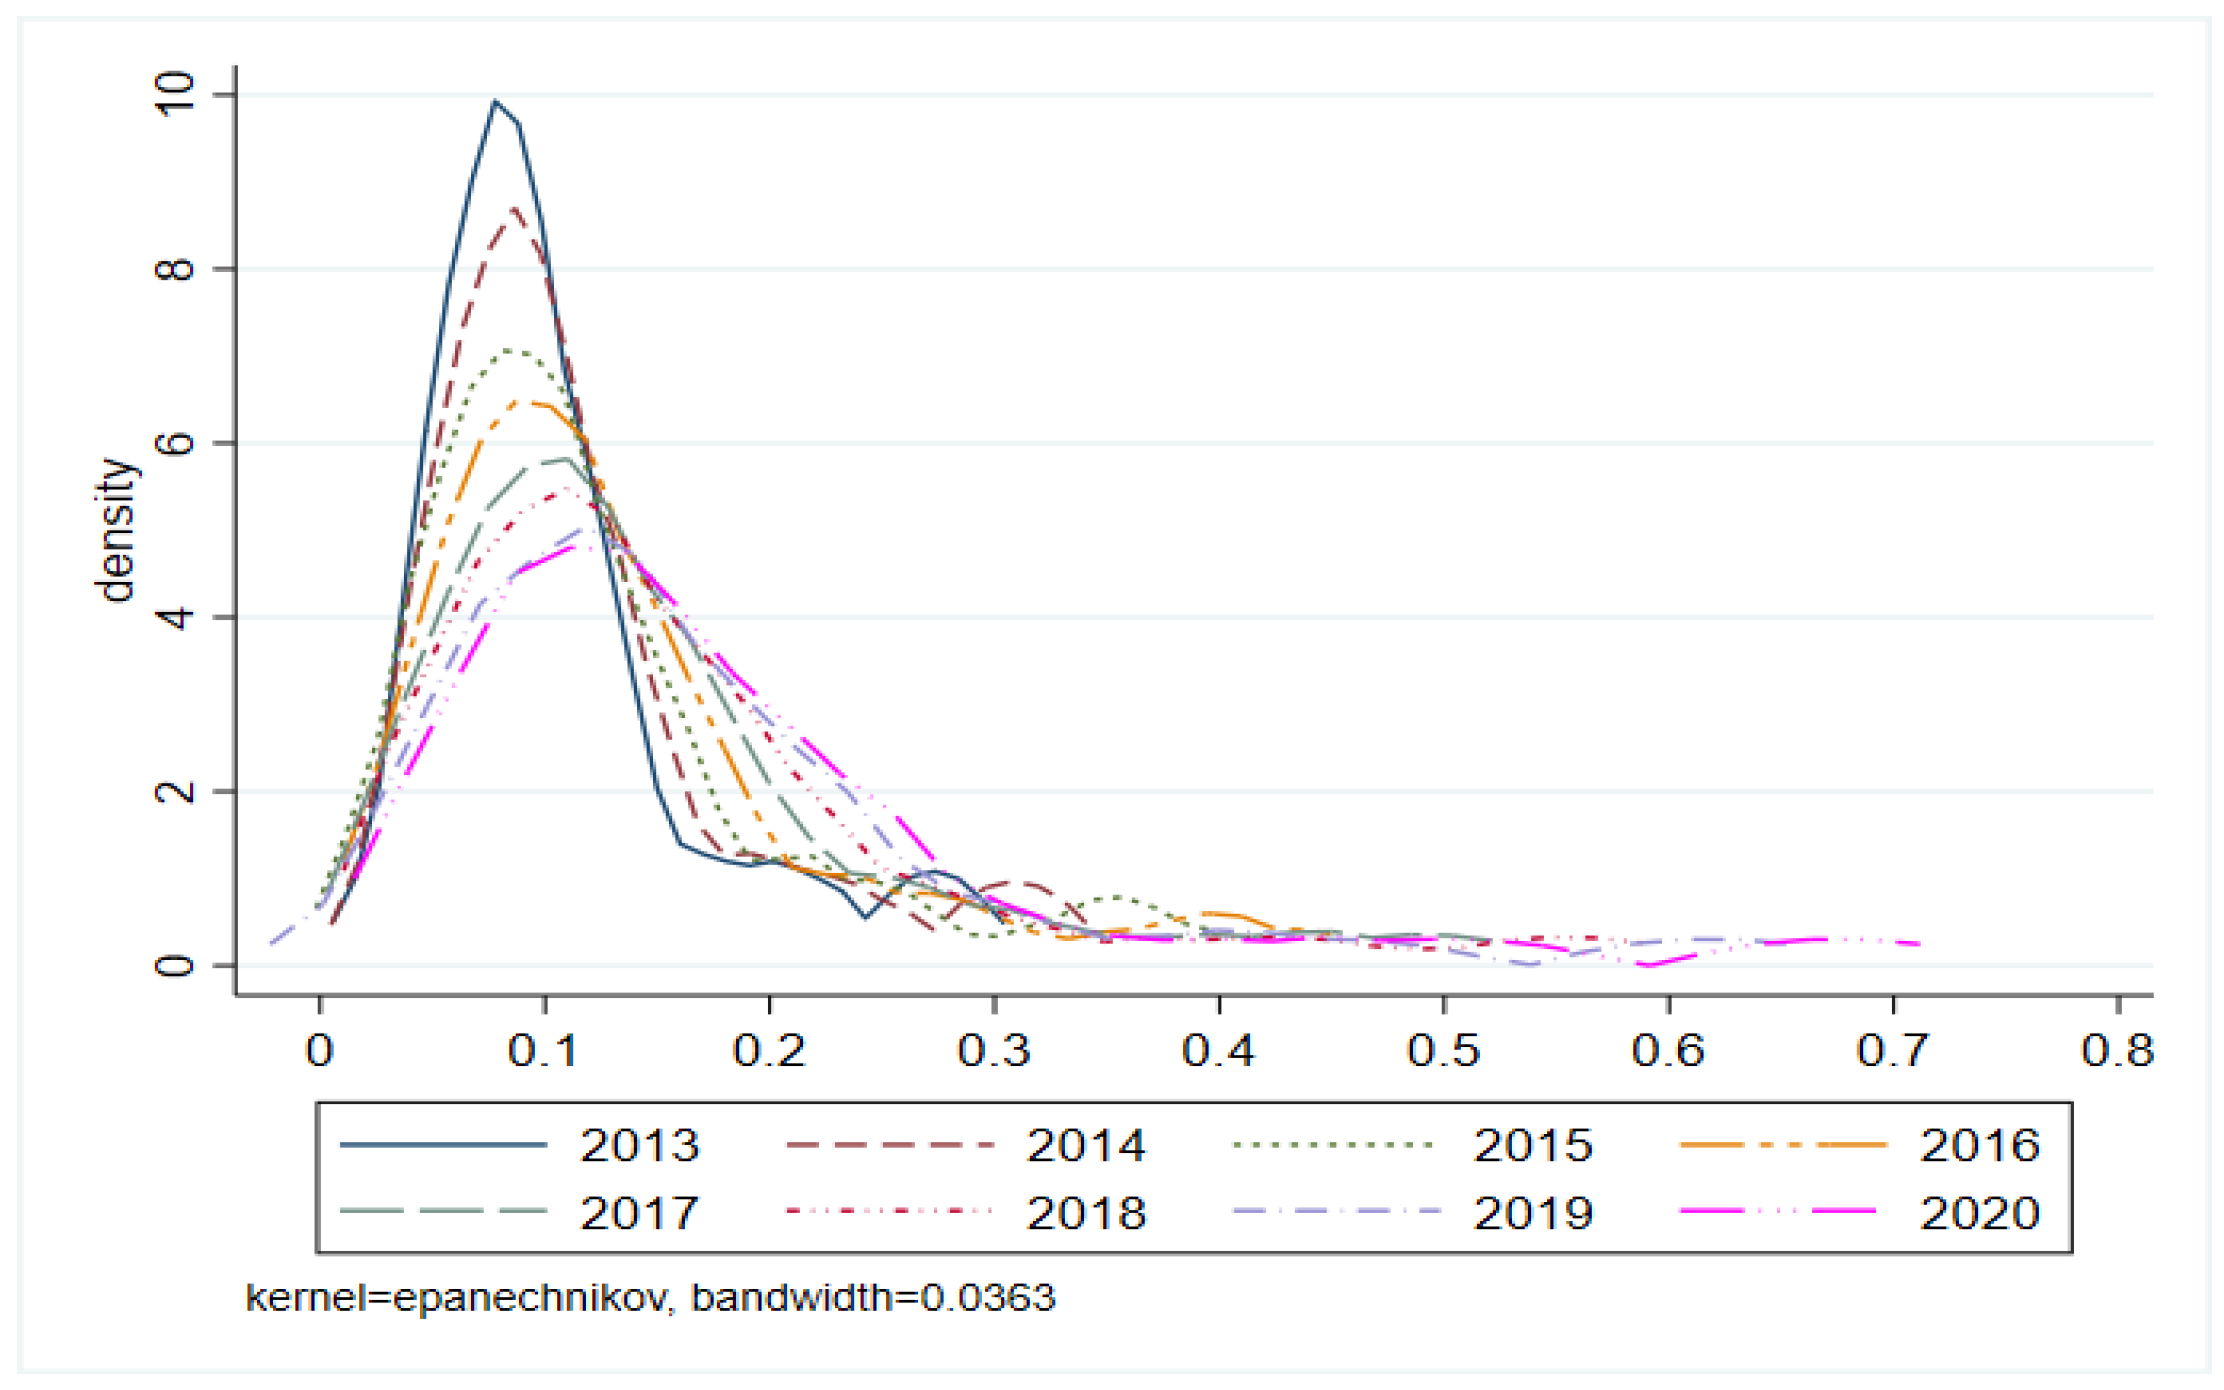
Figure 12.
Kernel density of value-added capability from 2013 to 2020 in China.

Figure 13.
Coupling between the digital economy and manufacturing industry and the evolution pattern of value-added capability.
Figure 13.
Coupling between the digital economy and manufacturing industry and the evolution pattern of value-added capability.

Figure 14.
The distribution pattern of system coupling and value-added capability in 2013.

Figure 15.
The distribution pattern of system coupling and value-added capability in 2020.
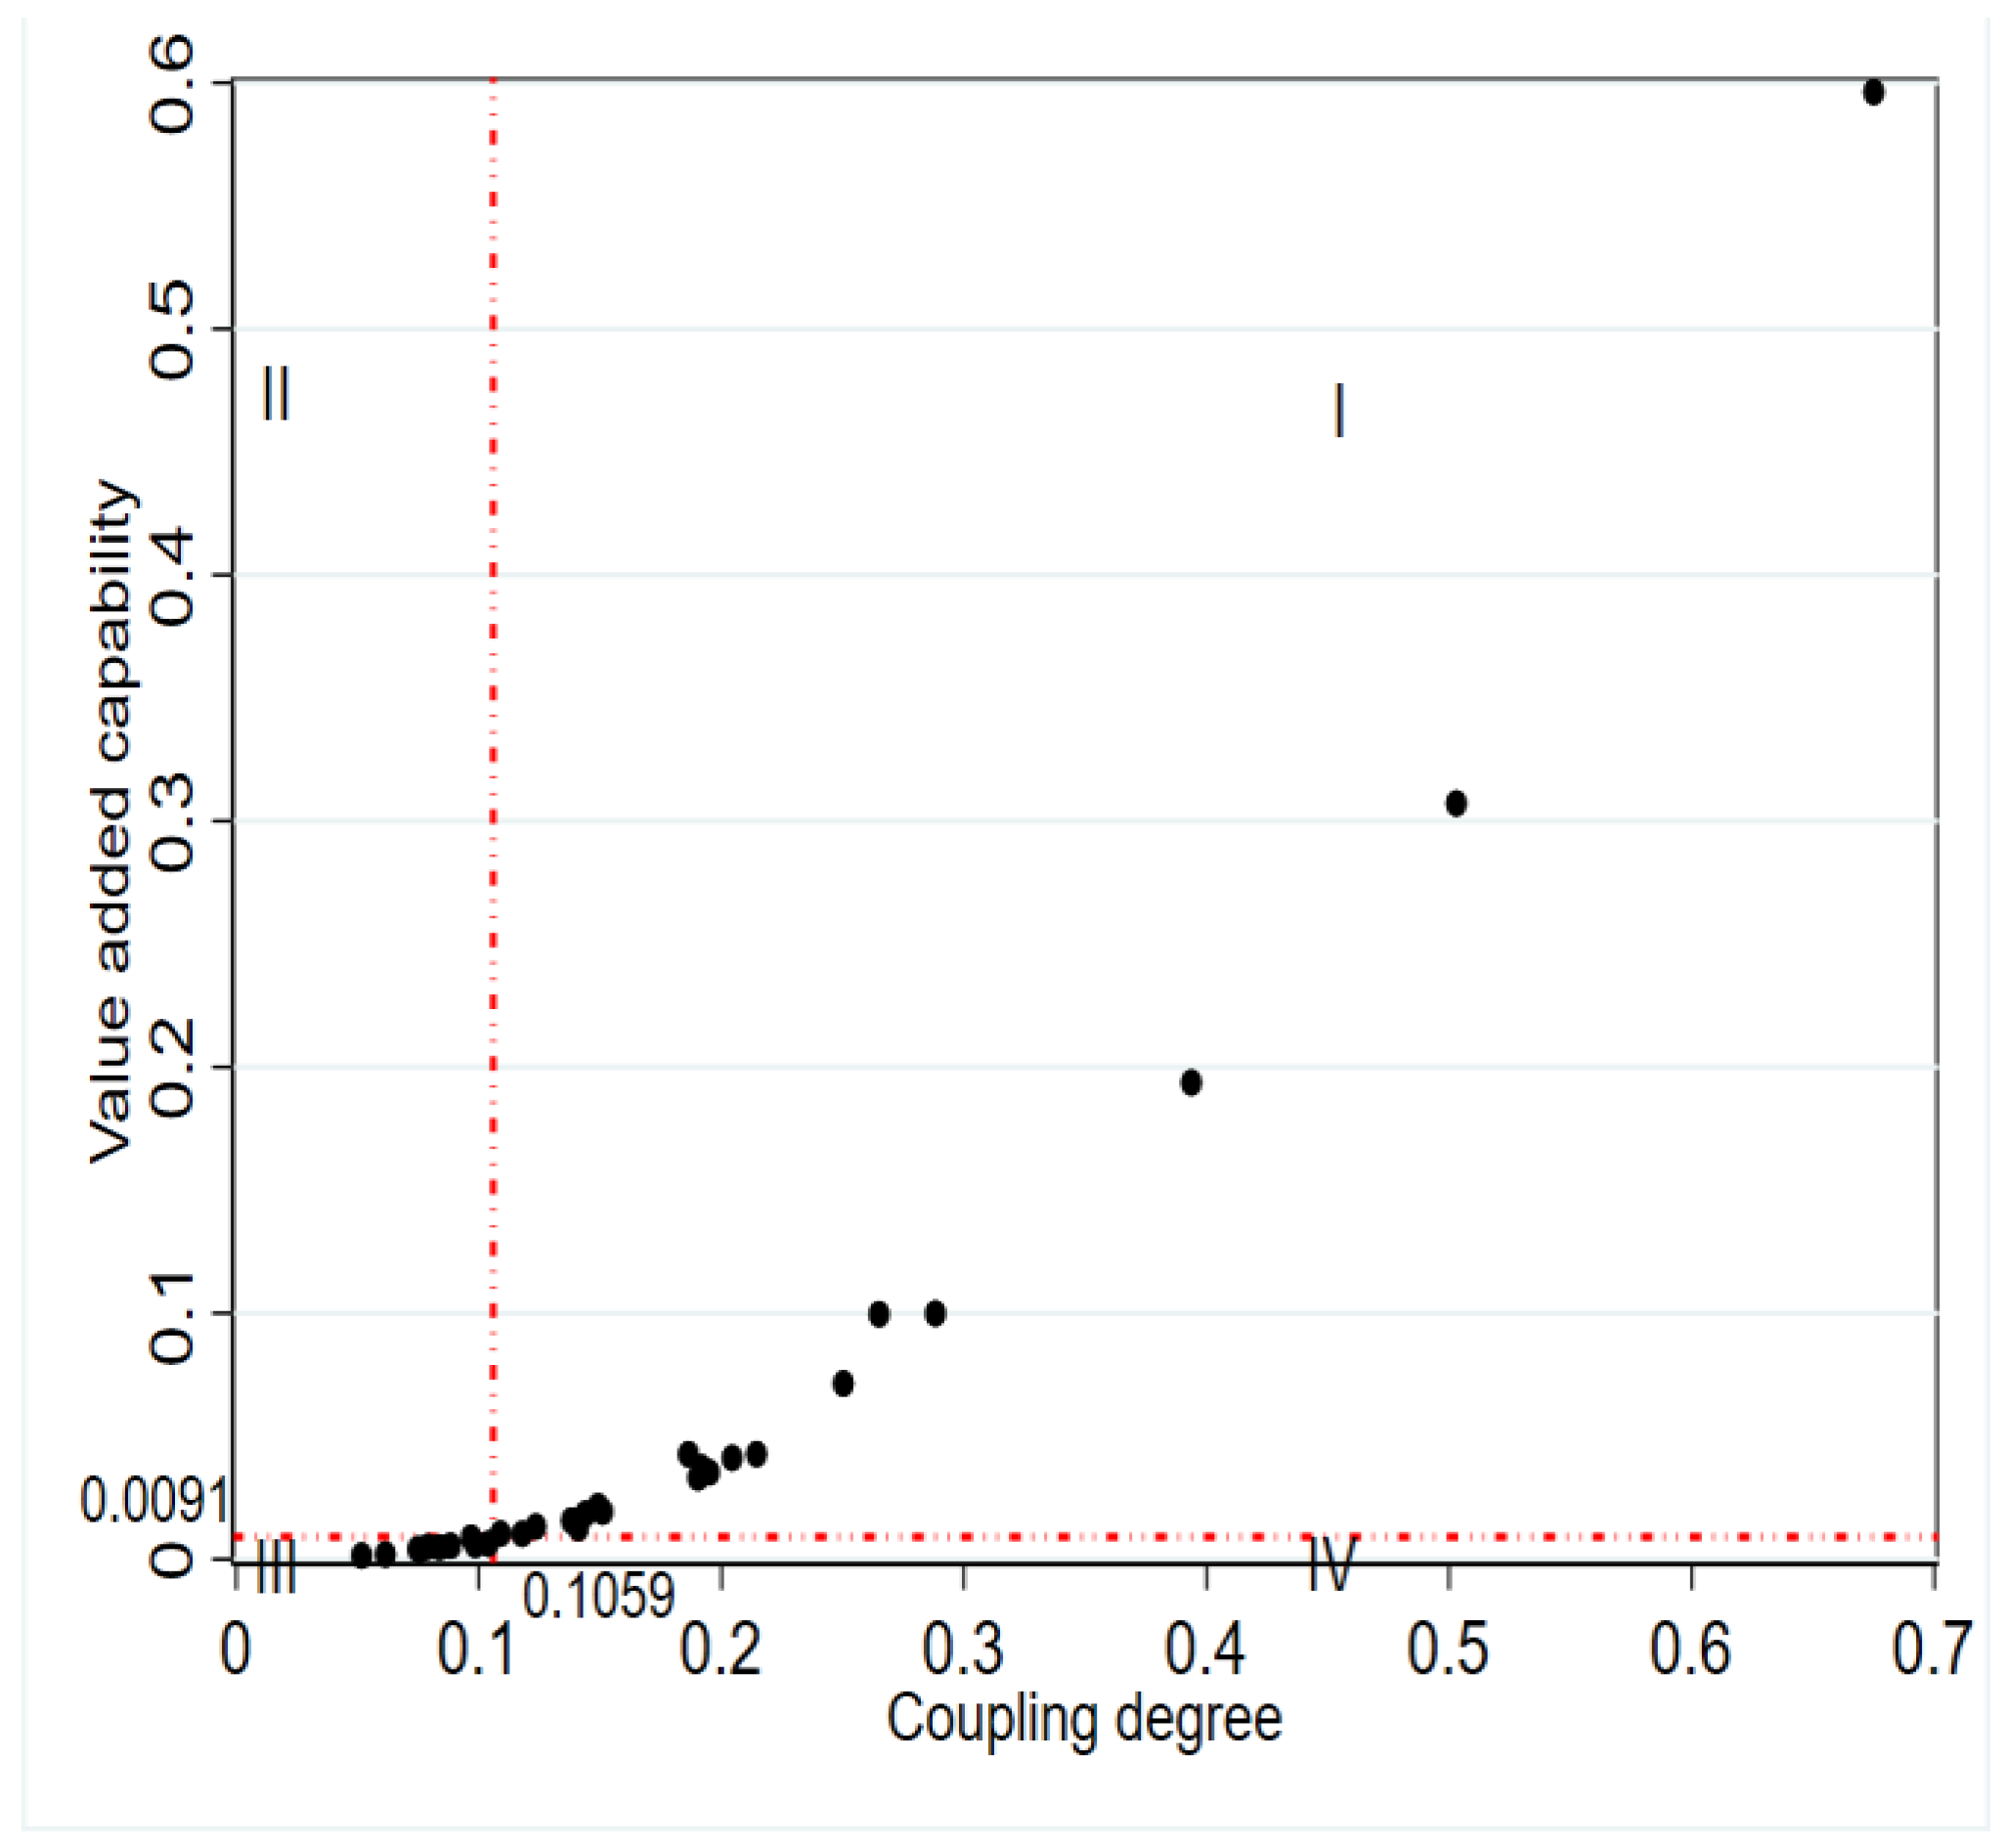
Figure 16.
Area map of the different types of value-added capacity of the digital economy and the manufacturing industry.
Figure 16.
Area map of the different types of value-added capacity of the digital economy and the manufacturing industry.
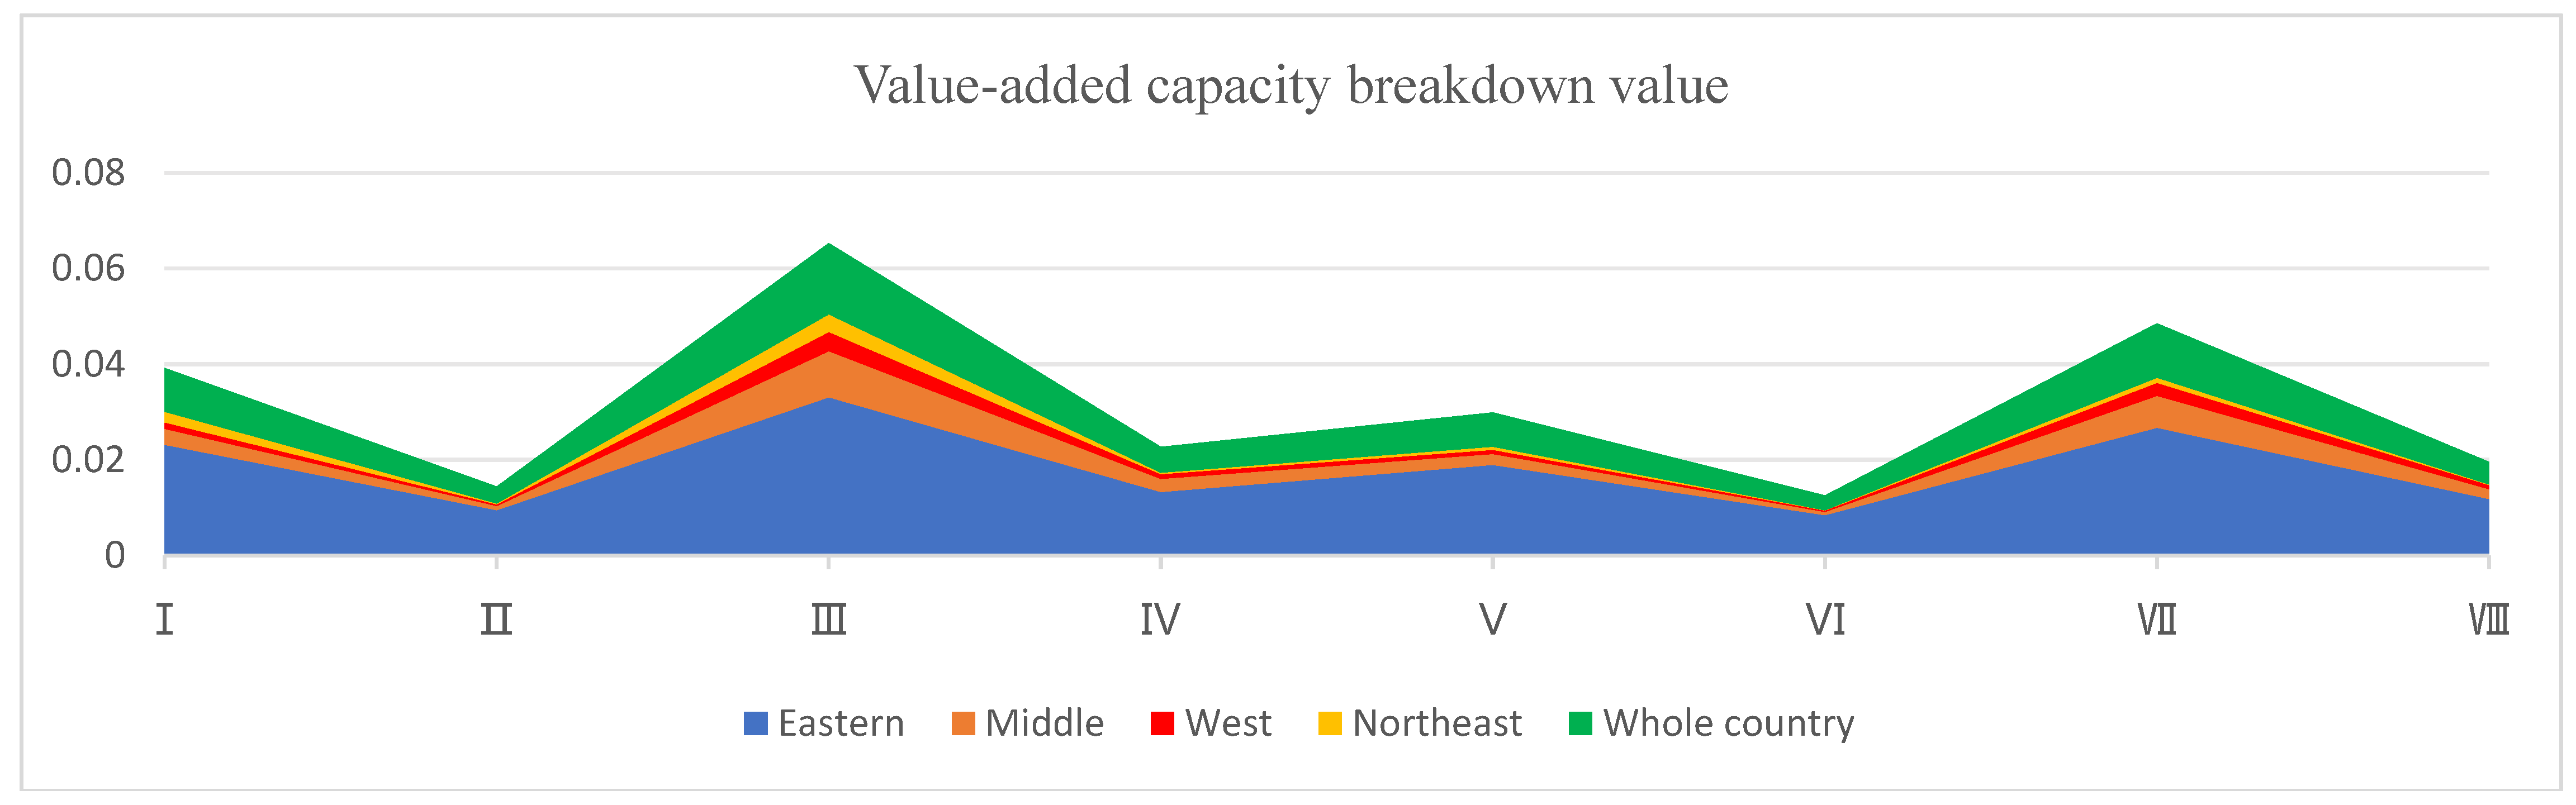
Table 1.
Evaluation index system for development of the digital economy and the manufacturing industry.
Table 1.
Evaluation index system for development of the digital economy and the manufacturing industry.
| Index | Variable | Unit | Data Source | Reference | |
|---|---|---|---|---|---|
| Digital Economy | Digital Economy Infrastructure | Length of optical cable line | km | China Statistical Yearbook | [37,38,39,40,41] |
| Number of mobile phone base stations | 10,000 stations | ||||
| Mobile phone penetration rate | phones/100 people | ||||
| Number of domain names per thousand people | 10,000 names | ||||
| Number of broadband access ports | 10,000 ports | ||||
| Number of broadband access users | 10,000 users | ||||
| Number of ICT employees | 10,000 employees | ||||
| Industry Digitization | Electronic business sales | RMB 100,000,000 | Statistical Yearbook of China Electronic Information Industry China Statistical Yearbook | [37,38,42,43] | |
| Online retail sales | RMB 100,000,000 | ||||
| Number of enterprises offering APP | enterprise | ||||
| Number of computers used in enterprises | computer | ||||
| Number of enterprises with e-commerce transactions | enterprise | ||||
| Number of enterprises with e-commerce transactions/total number of enterprises | % | ||||
| Digital financial inclusion index | / | Peking University Digital Finance Index | [44] | ||
| Digital Industrialization | Total telecom business | RMB 100,000,000 | China Statistical Yearbook | [37,45,46] | |
| Software business revenue | RMB 10,000 | ||||
| Software product revenue | RMB 10,000 | ||||
| Manufacturing Industry | Economic Returns | Industrial added value | RMB 100,000,000 | China Industrial Statistics Yearbook China Statistical Yearbook | [27,47,48,49,50] |
| Main business revenue | RMB 100,000,000 | ||||
| Total operating profits | RMB 100,000,000 | ||||
| Total operating profits/main business revenue | % | ||||
| Manufacturers liabilities/manufacturers assets | % | ||||
| Innovative Development | R&D expenditure of the manufacturing industry | RMB | China Stock Market and Accounting Research Database (CSMAR) China Statistical Yearbook | [27,47,48,51,52,53] | |
| R&D expenditure of the manufacturing industry/main business revenue | % | ||||
| Full-time equivalent of R&D personnel | person/year | ||||
| Number of valid invention patents | patents | ||||
| Number of valid invention patents/R&D expenditure of the manufacturing industry | patents/RMB 10,000 | ||||
| Number of valid invention patents/FTE of R&D personnel | patent/person/year | ||||
| Sales revenue of new products | RMB 10,000 | ||||
| Number of legal entities in manufacturing industry | entity | ||||
| Number of listed manufacturing enterprises | enterprise | ||||
| Green Development | Total industrial energy consumption/industrial added value | tons/RMB | According to China Energy Statistical Yearbook | [47,48,54] | |
| Comprehensive utilization of industrial solid waste/output of industrial solid waste | % | China Statistical Yearbook | |||
| Total investment in industrial pollution control /GDP | % | ||||
Note: Manufacturers liabilities/manufacturers assets and total industrial energy consumption/industrial added value are negative indicators. The other indicators are positive indicators.
Table 2.
Calculation results of the comprehensive digital economy development index of provinces and municipalities in China from 2013 to 2020.
Table 2.
Calculation results of the comprehensive digital economy development index of provinces and municipalities in China from 2013 to 2020.
| Regions | 2013 | 2014 | 2015 | 2016 | 2017 | 2018 | 2019 | 2020 | Annual Mean | Average Annual Growth Rate (%) | |
|---|---|---|---|---|---|---|---|---|---|---|---|
| Eastern | Beijing | 0.2586 | 0.3287 | 0.3938 | 0.4278 | 0.4705 | 0.5115 | 0.5713 | 0.6053 | 0.4459 | 13.1264 |
| Tianjin | 0.0629 | 0.0803 | 0.1028 | 0.1114 | 0.1182 | 0.1366 | 0.1610 | 0.1778 | 0.1189 | 16.2881 | |
| Hebei | 0.0885 | 0.1103 | 0.1459 | 0.1850 | 0.2119 | 0.2425 | 0.2742 | 0.2986 | 0.1946 | 19.2371 | |
| Shandong | 0.1887 | 0.2179 | 0.2638 | 0.3211 | 0.3556 | 0.4258 | 0.4546 | 0.4855 | 0.3391 | 14.6152 | |
| Shanghai | 0.1795 | 0.2314 | 0.2753 | 0.2941 | 0.3168 | 0.3491 | 0.4023 | 0.4311 | 0.3100 | 13.5752 | |
| Jiangsu | 0.2557 | 0.3078 | 0.3748 | 0.4054 | 0.4465 | 0.5026 | 0.5663 | 0.6092 | 0.4335 | 13.3228 | |
| Zhejiang | 0.2494 | 0.2916 | 0.3676 | 0.4107 | 0.4410 | 0.4824 | 0.5479 | 0.5725 | 0.4204 | 12.7917 | |
| Fujian | 0.1327 | 0.1622 | 0.2060 | 0.2496 | 0.2999 | 0.3247 | 0.3471 | 0.3345 | 0.2571 | 14.5842 | |
| Guangdong | 0.3506 | 0.4053 | 0.4880 | 0.5503 | 0.6069 | 0.7095 | 0.8026 | 0.8459 | 0.5949 | 13.4972 | |
| Hainan | 0.0416 | 0.0717 | 0.1002 | 0.1139 | 0.1196 | 0.1297 | 0.1432 | 0.1472 | 0.1084 | 21.7755 | |
| Mean | 0.1808 | 0.2207 | 0.2718 | 0.3069 | 0.3387 | 0.3814 | 0.4271 | 0.4508 | 0.3223 | 14.0909 | |
| Central | Shanxi | 0.0546 | 0.0765 | 0.1016 | 0.1208 | 0.1364 | 0.1623 | 0.1775 | 0.1980 | 0.1285 | 20.6621 |
| Anhui | 0.0712 | 0.1091 | 0.1543 | 0.1786 | 0.2061 | 0.2491 | 0.2940 | 0.3139 | 0.1970 | 24.4948 | |
| Henan | 0.0931 | 0.1248 | 0.1716 | 0.2139 | 0.2399 | 0.2776 | 0.3154 | 0.3417 | 0.2223 | 20.8607 | |
| Hubei | 0.0897 | 0.1196 | 0.1665 | 0.1965 | 0.2111 | 0.2468 | 0.2870 | 0.3054 | 0.2028 | 19.6581 | |
| Hunan | 0.0763 | 0.1039 | 0.1350 | 0.1681 | 0.1947 | 0.2314 | 0.2698 | 0.2978 | 0.1846 | 21.7529 | |
| Jiangxi | 0.0459 | 0.0685 | 0.1098 | 0.1166 | 0.1516 | 0.1849 | 0.2168 | 0.2399 | 0.1417 | 27.9447 | |
| Mean | 0.0718 | 0.1004 | 0.1398 | 0.1658 | 0.1900 | 0.2253 | 0.2601 | 0.2828 | 0.1795 | 22.1460 | |
| Western | Inner Mongolia | 0.0540 | 0.0666 | 0.0851 | 0.1046 | 0.1240 | 0.1358 | 0.1552 | 0.1717 | 0.1121 | 18.1436 |
| Guangxi | 0.0494 | 0.0770 | 0.1047 | 0.1307 | 0.1486 | 0.1812 | 0.2186 | 0.2488 | 0.1449 | 26.6809 | |
| Chongqing | 0.0612 | 0.0897 | 0.1232 | 0.1524 | 0.1767 | 0.2065 | 0.2336 | 0.2536 | 0.1621 | 23.1588 | |
| Sichuan | 0.1152 | 0.1560 | 0.2180 | 0.2653 | 0.3007 | 0.3487 | 0.3998 | 0.4378 | 0.2802 | 21.4747 | |
| Guizhou | 0.0376 | 0.0580 | 0.0920 | 0.1211 | 0.1382 | 0.1629 | 0.1880 | 0.2023 | 0.1250 | 28.5020 | |
| Yunnan | 0.0506 | 0.0752 | 0.1105 | 0.1375 | 0.1517 | 0.1825 | 0.2152 | 0.2403 | 0.1455 | 25.7435 | |
| Shanxi | 0.0719 | 0.1000 | 0.1318 | 0.1677 | 0.1893 | 0.2181 | 0.2507 | 0.2672 | 0.1746 | 21.1062 | |
| Gansu | 0.0313 | 0.0486 | 0.0758 | 0.0939 | 0.1056 | 0.1269 | 0.1438 | 0.1583 | 0.0980 | 27.3070 | |
| Qinghai | 0.0199 | 0.0321 | 0.0560 | 0.0685 | 0.0782 | 0.0923 | 0.0990 | 0.1084 | 0.0693 | 29.5754 | |
| Ningxia | 0.0296 | 0.0512 | 0.0689 | 0.0805 | 0.0889 | 0.1029 | 0.1057 | 0.1116 | 0.0799 | 22.6950 | |
| Xinjiang | 0.0463 | 0.0602 | 0.0818 | 0.0933 | 0.1058 | 0.1352 | 0.1495 | 0.1672 | 0.1049 | 20.5090 | |
| Mean | 0.0515 | 0.0741 | 0.1043 | 0.1287 | 0.1462 | 0.1721 | 0.1963 | 0.2152 | 0.1361 | 23.2909 | |
| Northeast | Liaoning | 0.1114 | 0.1343 | 0.1636 | 0.1710 | 0.1876 | 0.2052 | 0.2306 | 0.2470 | 0.1813 | 12.2108 |
| Jilin | 0.0427 | 0.0603 | 0.0800 | 0.0956 | 0.1109 | 0.1309 | 0.1365 | 0.1512 | 0.1010 | 20.3534 | |
| Heilongjiang | 0.0498 | 0.0715 | 0.0891 | 0.1021 | 0.1209 | 0.1351 | 0.1536 | 0.1730 | 0.1119 | 19.8946 | |
| Mean | 0.0680 | 0.0887 | 0.1109 | 0.1229 | 0.1398 | 0.1571 | 0.1735 | 0.1904 | 0.1314 | 16.0851 | |
| Whole Country | Mean | 0.1003 | 0.1297 | 0.1679 | 0.1949 | 0.2185 | 0.2510 | 0.2837 | 0.3048 | 0.2064 | 17.4706 |
Table 3.
Calculation results of the comprehensive manufacturing industry development index of provinces and municipalities in China from 2013 to 2020.
Table 3.
Calculation results of the comprehensive manufacturing industry development index of provinces and municipalities in China from 2013 to 2020.
| Region | 2013 | 2014 | 2015 | 2016 | 2017 | 2018 | 2019 | 2020 | Annual Mean | Average Annual Growth Rate (%) | |
|---|---|---|---|---|---|---|---|---|---|---|---|
| Eastern | Beijing | 0.3029 | 0.3174 | 0.3428 | 0.3521 | 0.3715 | 0.3814 | 0.4070 | 0.4070 | 0.3603 | 4.3413 |
| Tianjin | 0.2821 | 0.2941 | 0.3033 | 0.3098 | 0.3156 | 0.3197 | 0.3127 | 0.3248 | 0.3078 | 2.0538 | |
| Hebei | 0.2397 | 0.2571 | 0.2625 | 0.2762 | 0.2871 | 0.3014 | 0.2993 | 0.3106 | 0.2792 | 3.7978 | |
| Shandong | 0.4331 | 0.4588 | 0.4646 | 0.4847 | 0.4961 | 0.4551 | 0.4418 | 0.4703 | 0.4631 | 1.3058 | |
| Shanghai | 0.3408 | 0.3639 | 0.3748 | 0.3938 | 0.4089 | 0.4091 | 0.4202 | 0.4324 | 0.3930 | 3.4776 | |
| Jiangsu | 0.5073 | 0.5449 | 0.5715 | 0.6118 | 0.6389 | 0.6542 | 0.6599 | 0.7098 | 0.6123 | 4.9432 | |
| Zhejiang | 0.4067 | 0.4319 | 0.4514 | 0.4749 | 0.4988 | 0.5126 | 0.5426 | 0.5835 | 0.4878 | 5.3010 | |
| Fujian | 0.3008 | 0.3109 | 0.3148 | 0.3325 | 0.3462 | 0.3599 | 0.3753 | 0.3902 | 0.3413 | 3.7945 | |
| Guangdong | 0.5125 | 0.5460 | 0.5913 | 0.6391 | 0.6943 | 0.7286 | 0.7642 | 0.8078 | 0.6605 | 6.7266 | |
| Hainan | 0.2104 | 0.2246 | 0.2275 | 0.2555 | 0.2664 | 0.2334 | 0.2543 | 0.2630 | 0.2419 | 3.5146 | |
| Mean | 0.3536 | 0.3750 | 0.3905 | 0.4130 | 0.4324 | 0.4356 | 0.4477 | 0.4700 | 0.4147 | 4.1633 | |
| Central | Shanxi | 0.1992 | 0.1799 | 0.1622 | 0.1666 | 0.1981 | 0.2078 | 0.2082 | 0.2091 | 0.1914 | 1.0877 |
| Anhui | 0.2955 | 0.3067 | 0.3219 | 0.3500 | 0.3689 | 0.3796 | 0.3824 | 0.4123 | 0.3522 | 4.9047 | |
| Henan | 0.3197 | 0.3355 | 0.3403 | 0.3458 | 0.3538 | 0.3391 | 0.3513 | 0.3683 | 0.3442 | 2.0835 | |
| Hubei | 0.2864 | 0.3023 | 0.3091 | 0.3298 | 0.3373 | 0.3618 | 0.3748 | 0.3833 | 0.3356 | 4.2709 | |
| Hunan | 0.2828 | 0.2924 | 0.3118 | 0.3171 | 0.3405 | 0.3478 | 0.3662 | 0.3778 | 0.3296 | 4.2444 | |
| Jiangxi | 0.2364 | 0.2485 | 0.2606 | 0.2685 | 0.2811 | 0.2865 | 0.2958 | 0.3050 | 0.2728 | 3.7127 | |
| Mean | 0.2700 | 0.2776 | 0.2843 | 0.2963 | 0.3133 | 0.3204 | 0.3298 | 0.3426 | 0.3043 | 3.4668 | |
| Western | Inner Mongolia | 0.2071 | 0.2043 | 0.1852 | 0.1877 | 0.1985 | 0.1965 | 0.2068 | 0.2051 | 0.1989 | −0.0264 |
| Guangxi | 0.2042 | 0.2053 | 0.2173 | 0.2240 | 0.2315 | 0.2262 | 0.2295 | 0.2327 | 0.2213 | 1.9113 | |
| Chongqing | 0.2394 | 0.2520 | 0.2602 | 0.2662 | 0.2915 | 0.3002 | 0.3057 | 0.3239 | 0.2799 | 4.4425 | |
| Sichuan | 0.2449 | 0.2646 | 0.2717 | 0.2873 | 0.3079 | 0.3204 | 0.3318 | 0.3379 | 0.2958 | 4.7279 | |
| Guizhou | 0.1915 | 0.2050 | 0.2157 | 0.2210 | 0.2344 | 0.2420 | 0.2541 | 0.2775 | 0.2301 | 5.4630 | |
| Yunnan | 0.1984 | 0.2017 | 0.2110 | 0.2144 | 0.2207 | 0.2260 | 0.2522 | 0.2547 | 0.2224 | 3.6871 | |
| Shanxi | 0.2721 | 0.2678 | 0.2637 | 0.2731 | 0.2841 | 0.2964 | 0.3050 | 0.3087 | 0.2839 | 1.8465 | |
| Gansu | 0.1772 | 0.1755 | 0.1567 | 0.1708 | 0.1759 | 0.1834 | 0.1975 | 0.2087 | 0.1807 | 2.5622 | |
| Qinghai | 0.1204 | 0.1239 | 0.1109 | 0.1436 | 0.1375 | 0.1563 | 0.0961 | 0.1690 | 0.1322 | 9.8098 | |
| Ningxia | 0.2123 | 0.2217 | 0.1837 | 0.2278 | 0.1919 | 0.1949 | 0.1945 | 0.1878 | 0.2018 | −0.9360 | |
| Xinjiang | 0.1652 | 0.1749 | 0.1488 | 0.1468 | 0.1696 | 0.1963 | 0.2033 | 0.2222 | 0.1784 | 4.8202 | |
| Mean | 0.2030 | 0.2088 | 0.2023 | 0.2148 | 0.2221 | 0.2308 | 0.2342 | 0.2480 | 0.2205 | 2.9435 | |
| Northeast | Liaoning | 0.2527 | 0.2481 | 0.2239 | 0.2396 | 0.2584 | 0.2670 | 0.2642 | 0.2786 | 0.2541 | 1.5734 |
| Jilin | 0.2192 | 0.2164 | 0.2144 | 0.2204 | 0.2113 | 0.2256 | 0.2288 | 0.2521 | 0.2235 | 2.1197 | |
| Heilongjiang | 0.2284 | 0.2250 | 0.2120 | 0.2148 | 0.2172 | 0.2158 | 0.2185 | 0.2298 | 0.2202 | 0.1357 | |
| Mean | 0.2334 | 0.2298 | 0.2168 | 0.2249 | 0.2290 | 0.2361 | 0.2371 | 0.2535 | 0.2326 | 1.2572 | |
| Whole Country | Mean | 0.2696 | 0.2800 | 0.2829 | 0.2982 | 0.3111 | 0.3175 | 0.3248 | 0.3415 | 0.3032 | 3.4465 |
Table 4.
Measurement results of manufacturing industry efficiency ( ) in promoting digital economy development in sample provinces and municipalities from 2013 to 2020.
Table 4.
Measurement results of manufacturing industry efficiency ( ) in promoting digital economy development in sample provinces and municipalities from 2013 to 2020.
| Region | 2013 | 2014 | 2015 | 2016 | 2017 | 2018 | 2019 | 2020 | Annual Mean | |
|---|---|---|---|---|---|---|---|---|---|---|
| Eastern | Beijing | 0.2640 | 0.2803 | 0.3088 | 0.3192 | 0.3411 | 0.3521 | 0.3809 | 0.3809 | 0.3284 |
| Tianjin | 0.2407 | 0.2541 | 0.2645 | 0.2718 | 0.2783 | 0.2828 | 0.2749 | 0.2886 | 0.2695 | |
| Hebei | 0.1930 | 0.2126 | 0.2186 | 0.2340 | 0.2462 | 0.2623 | 0.2599 | 0.2726 | 0.2374 | |
| Shandong | 0.4102 | 0.4391 | 0.4456 | 0.4682 | 0.4810 | 0.4350 | 0.4200 | 0.4520 | 0.4439 | |
| Shanghai | 0.3066 | 0.3325 | 0.3447 | 0.3661 | 0.3830 | 0.3833 | 0.3957 | 0.4094 | 0.3652 | |
| Jiangsu | 0.4935 | 0.5359 | 0.5657 | 0.6110 | 0.6414 | 0.6586 | 0.6650 | 0.7211 | 0.6115 | |
| Zhejiang | 0.3806 | 0.4089 | 0.4308 | 0.4572 | 0.4840 | 0.4995 | 0.5333 | 0.5792 | 0.4717 | |
| Fujian | 0.2616 | 0.2730 | 0.2773 | 0.2972 | 0.3126 | 0.3280 | 0.3453 | 0.3621 | 0.3071 | |
| Guangdong | 0.4994 | 0.5370 | 0.5880 | 0.6417 | 0.7037 | 0.7422 | 0.7822 | 0.8312 | 0.6657 | |
| Hainan | 0.1601 | 0.1760 | 0.1792 | 0.2108 | 0.2229 | 0.1859 | 0.2094 | 0.2192 | 0.1954 | |
| Mean | 0.3210 | 0.3449 | 0.3623 | 0.3877 | 0.4094 | 0.4130 | 0.4267 | 0.4516 | 0.3896 | |
| Central | Shanxi | 0.1475 | 0.1258 | 0.1059 | 0.1108 | 0.1463 | 0.1572 | 0.1576 | 0.1586 | 0.1387 |
| Anhui | 0.2556 | 0.2682 | 0.2854 | 0.3168 | 0.3382 | 0.3502 | 0.3533 | 0.3869 | 0.3193 | |
| Henan | 0.2828 | 0.3006 | 0.3060 | 0.3122 | 0.3211 | 0.3046 | 0.3184 | 0.3374 | 0.3104 | |
| Hubei | 0.2454 | 0.2633 | 0.2710 | 0.2942 | 0.3026 | 0.3301 | 0.3448 | 0.3542 | 0.3007 | |
| Hunan | 0.2414 | 0.2522 | 0.2739 | 0.2799 | 0.3062 | 0.3144 | 0.3351 | 0.3481 | 0.2939 | |
| Jiangxi | 0.1892 | 0.2028 | 0.2164 | 0.2253 | 0.2394 | 0.2455 | 0.2560 | 0.2663 | 0.2301 | |
| Mean | 0.2270 | 0.2355 | 0.2431 | 0.2565 | 0.2756 | 0.2837 | 0.2942 | 0.3086 | 0.2655 | |
| Western | Inner Mongolia | 0.1563 | 0.1532 | 0.1318 | 0.1346 | 0.1467 | 0.1444 | 0.1561 | 0.1541 | 0.1472 |
| Guangxi | 0.1531 | 0.1544 | 0.1678 | 0.1753 | 0.1838 | 0.1779 | 0.1815 | 0.1851 | 0.1724 | |
| Chongqing | 0.1927 | 0.2067 | 0.2160 | 0.2228 | 0.2511 | 0.2610 | 0.2671 | 0.2875 | 0.2381 | |
| Sichuan | 0.1988 | 0.2209 | 0.2289 | 0.2464 | 0.2696 | 0.2836 | 0.2964 | 0.3033 | 0.2560 | |
| Guizhou | 0.1388 | 0.1539 | 0.1660 | 0.1720 | 0.1870 | 0.1955 | 0.2092 | 0.2354 | 0.1822 | |
| Yunnan | 0.1466 | 0.1503 | 0.1607 | 0.1645 | 0.1717 | 0.1776 | 0.2070 | 0.2099 | 0.1736 | |
| Shanxi | 0.2294 | 0.2245 | 0.2200 | 0.2306 | 0.2428 | 0.2567 | 0.2663 | 0.2705 | 0.2426 | |
| Gansu | 0.1228 | 0.1209 | 0.0997 | 0.1155 | 0.1213 | 0.1297 | 0.1456 | 0.1582 | 0.1267 | |
| Qinghai | 0.0590 | 0.0629 | 0.0483 | 0.0850 | 0.0782 | 0.0992 | 0.0317 | 0.1136 | 0.0722 | |
| Ningxia | 0.1622 | 0.1727 | 0.1300 | 0.1796 | 0.1393 | 0.1427 | 0.1422 | 0.1346 | 0.1504 | |
| Xinjiang | 0.1093 | 0.1201 | 0.0909 | 0.0886 | 0.1142 | 0.1442 | 0.1521 | 0.1733 | 0.1241 | |
| Mean | 0.1517 | 0.1582 | 0.1509 | 0.1650 | 0.1732 | 0.1830 | 0.1868 | 0.2023 | 0.1714 | |
| Northeast | Liaoning | 0.2076 | 0.2024 | 0.1752 | 0.1929 | 0.2140 | 0.2236 | 0.2204 | 0.2366 | 0.2091 |
| Jilin | 0.1700 | 0.1668 | 0.1646 | 0.1712 | 0.1611 | 0.1771 | 0.1807 | 0.2069 | 0.1748 | |
| Heilongjiang | 0.1803 | 0.1765 | 0.1619 | 0.1651 | 0.1677 | 0.1661 | 0.1691 | 0.1818 | 0.1711 | |
| Mean | 0.1860 | 0.1819 | 0.1672 | 0.1764 | 0.1809 | 0.1890 | 0.1901 | 0.2084 | 0.1850 | |
| Whole Country | Mean | 0.2266 | 0.2383 | 0.2415 | 0.2587 | 0.2732 | 0.2804 | 0.2886 | 0.3073 | 0.2643 |
Table 5.
Measurement results of digital economy efficiency () in promoting manufacturing industry development in sample provinces and municipalities from 2013 to 2020.
Table 5.
Measurement results of digital economy efficiency () in promoting manufacturing industry development in sample provinces and municipalities from 2013 to 2020.
| Region | 2013 | 2014 | 2015 | 2016 | 2017 | 2018 | 2019 | 2020 | Annual Mean | |
|---|---|---|---|---|---|---|---|---|---|---|
| Eastern | Beijing | 0.5277 | 0.5616 | 0.5931 | 0.6096 | 0.6303 | 0.6502 | 0.6791 | 0.6956 | 0.6184 |
| Tianjin | 0.4329 | 0.4413 | 0.4522 | 0.4564 | 0.4597 | 0.4686 | 0.4804 | 0.4885 | 0.4600 | |
| Hebei | 0.4453 | 0.4558 | 0.4731 | 0.4920 | 0.5050 | 0.5199 | 0.5352 | 0.5470 | 0.4967 | |
| Shandong | 0.4938 | 0.5080 | 0.5302 | 0.5579 | 0.5747 | 0.6087 | 0.6226 | 0.6376 | 0.5667 | |
| Shanghai | 0.4894 | 0.5145 | 0.5358 | 0.5449 | 0.5559 | 0.5715 | 0.5973 | 0.6112 | 0.5525 | |
| Jiangsu | 0.5263 | 0.5515 | 0.5840 | 0.5988 | 0.6187 | 0.6459 | 0.6767 | 0.6975 | 0.6124 | |
| Zhejiang | 0.5232 | 0.5437 | 0.5805 | 0.6014 | 0.6160 | 0.6361 | 0.6678 | 0.6798 | 0.6061 | |
| Fujian | 0.4667 | 0.4810 | 0.5022 | 0.5233 | 0.5477 | 0.5597 | 0.5705 | 0.5644 | 0.5269 | |
| Guangdong | 0.5722 | 0.5988 | 0.6388 | 0.6690 | 0.6964 | 0.7461 | 0.7912 | 0.8122 | 0.6906 | |
| Hainan | 0.4225 | 0.4371 | 0.4509 | 0.4576 | 0.4603 | 0.4652 | 0.4718 | 0.4737 | 0.4549 | |
| Mean | 0.4900 | 0.5093 | 0.5341 | 0.5511 | 0.5665 | 0.5872 | 0.6093 | 0.6208 | 0.5585 | |
| Central | Shanxi | 0.4289 | 0.4395 | 0.4516 | 0.4609 | 0.4685 | 0.4810 | 0.4884 | 0.4983 | 0.4646 |
| Anhui | 0.4369 | 0.4552 | 0.4771 | 0.4889 | 0.5022 | 0.5231 | 0.5448 | 0.5544 | 0.4978 | |
| Henan | 0.4475 | 0.4628 | 0.4855 | 0.5060 | 0.5186 | 0.5369 | 0.5552 | 0.5679 | 0.5101 | |
| Hubei | 0.4459 | 0.4603 | 0.4831 | 0.4976 | 0.5047 | 0.5220 | 0.5414 | 0.5503 | 0.5007 | |
| Hunan | 0.4393 | 0.4527 | 0.4678 | 0.4838 | 0.4967 | 0.5145 | 0.5331 | 0.5467 | 0.4918 | |
| Jiangxi | 0.4246 | 0.4356 | 0.4556 | 0.4589 | 0.4758 | 0.4920 | 0.5074 | 0.5186 | 0.4711 | |
| Mean | 0.4372 | 0.4510 | 0.4701 | 0.4827 | 0.4944 | 0.5116 | 0.5284 | 0.5394 | 0.4893 | |
| Western | Inner Mongolia | 0.4286 | 0.4347 | 0.4436 | 0.4531 | 0.4625 | 0.4682 | 0.4776 | 0.4856 | 0.4567 |
| Guangxi | 0.4263 | 0.4397 | 0.4531 | 0.4657 | 0.4744 | 0.4902 | 0.5083 | 0.5229 | 0.4726 | |
| Chongqing | 0.4320 | 0.4458 | 0.4621 | 0.4762 | 0.4880 | 0.5024 | 0.5156 | 0.5253 | 0.4809 | |
| Sichuan | 0.4582 | 0.4779 | 0.5080 | 0.5309 | 0.5480 | 0.5713 | 0.5961 | 0.6145 | 0.5381 | |
| Guizhou | 0.4206 | 0.4305 | 0.4469 | 0.4610 | 0.4693 | 0.4813 | 0.4935 | 0.5004 | 0.4629 | |
| Yunnan | 0.4269 | 0.4388 | 0.4559 | 0.4690 | 0.4759 | 0.4908 | 0.5067 | 0.5188 | 0.4729 | |
| Shanxi | 0.4372 | 0.4508 | 0.4662 | 0.4837 | 0.4941 | 0.5081 | 0.5239 | 0.5318 | 0.4870 | |
| Gansu | 0.4175 | 0.4260 | 0.4391 | 0.4479 | 0.4536 | 0.4639 | 0.4721 | 0.4791 | 0.4499 | |
| Qinghai | 0.4120 | 0.4180 | 0.4295 | 0.4356 | 0.4403 | 0.4471 | 0.4504 | 0.4549 | 0.4360 | |
| Ningxia | 0.4167 | 0.4272 | 0.4358 | 0.4414 | 0.4455 | 0.4522 | 0.4536 | 0.4564 | 0.4411 | |
| Xinjiang | 0.4248 | 0.4316 | 0.4420 | 0.4476 | 0.4537 | 0.4679 | 0.4748 | 0.4834 | 0.4532 | |
| Mean | 0.4274 | 0.4383 | 0.4529 | 0.4647 | 0.4732 | 0.4858 | 0.4975 | 0.5066 | 0.4683 | |
| Northeast | Liaoning | 0.4564 | 0.4675 | 0.4816 | 0.4852 | 0.4933 | 0.5018 | 0.5141 | 0.5220 | 0.4902 |
| Jilin | 0.4231 | 0.4316 | 0.4411 | 0.4487 | 0.4561 | 0.4658 | 0.4685 | 0.4757 | 0.4513 | |
| Heilongjiang | 0.4265 | 0.4370 | 0.4456 | 0.4519 | 0.4610 | 0.4678 | 0.4768 | 0.4862 | 0.4566 | |
| Mean | 0.4353 | 0.4454 | 0.4561 | 0.4619 | 0.4701 | 0.4785 | 0.4865 | 0.4946 | 0.4661 | |
| Whole Country | Mean | 0.4510 | 0.4652 | 0.4837 | 0.4968 | 0.5082 | 0.5240 | 0.5398 | 0.5500 | 0.5024 |
Table 6.
Measurement results of the coupling degree between the digital economy and the manufacturing industry in sample provinces and municipalities from 2013 to 2020.
Table 6.
Measurement results of the coupling degree between the digital economy and the manufacturing industry in sample provinces and municipalities from 2013 to 2020.
| Region | 2013 | 2014 | 2015 | 2016 | 2017 | 2018 | 2019 | 2020 | Annual Mean | Average Annual Growth Rate (%) | |
|---|---|---|---|---|---|---|---|---|---|---|---|
| Eastern | Beijing | 0.1393 | 0.1574 | 0.1832 | 0.1946 | 0.2150 | 0.2290 | 0.2587 | 0.2650 | 0.2053 | 9.7133 |
| Tianjin | 0.1042 | 0.1121 | 0.1196 | 0.1240 | 0.1279 | 0.1325 | 0.1321 | 0.1410 | 0.1242 | 4.4507 | |
| Hebei | 0.0859 | 0.0969 | 0.1034 | 0.1151 | 0.1243 | 0.1364 | 0.1391 | 0.1491 | 0.1188 | 8.2394 | |
| Shandong | 0.2026 | 0.2230 | 0.2363 | 0.2612 | 0.2764 | 0.2648 | 0.2615 | 0.2882 | 0.2517 | 5.3119 | |
| Shanghai | 0.1500 | 0.1711 | 0.1847 | 0.1995 | 0.2129 | 0.2190 | 0.2363 | 0.2503 | 0.2030 | 7.6278 | |
| Jiangsu | 0.2597 | 0.2955 | 0.3304 | 0.3659 | 0.3968 | 0.4254 | 0.4500 | 0.5030 | 0.3783 | 9.9334 | |
| Zhejiang | 0.1991 | 0.2223 | 0.2501 | 0.2749 | 0.2982 | 0.3178 | 0.3561 | 0.3937 | 0.2890 | 10.2451 | |
| Fujian | 0.1221 | 0.1313 | 0.1392 | 0.1555 | 0.1712 | 0.1836 | 0.1970 | 0.2044 | 0.1630 | 7.6623 | |
| Guangdong | 0.2858 | 0.3215 | 0.3756 | 0.4293 | 0.4900 | 0.5538 | 0.6189 | 0.6751 | 0.4687 | 13.0893 | |
| Hainan | 0.0676 | 0.0769 | 0.0808 | 0.0964 | 0.1026 | 0.0865 | 0.0988 | 0.1038 | 0.0892 | 6.8767 | |
| Mean | 0.1616 | 0.1808 | 0.2003 | 0.2216 | 0.2415 | 0.2549 | 0.2749 | 0.2974 | 0.2291 | 9.1170 | |
| Central | Shanxi | 0.0633 | 0.0553 | 0.0478 | 0.0511 | 0.0685 | 0.0756 | 0.0770 | 0.0790 | 0.0647 | 4.2373 |
| Anhui | 0.1117 | 0.1221 | 0.1362 | 0.1549 | 0.1698 | 0.1832 | 0.1925 | 0.2145 | 0.1606 | 9.8031 | |
| Henan | 0.1266 | 0.1391 | 0.1486 | 0.1580 | 0.1665 | 0.1635 | 0.1768 | 0.1916 | 0.1588 | 6.1648 | |
| Hubei | 0.1094 | 0.1212 | 0.1309 | 0.1464 | 0.1527 | 0.1723 | 0.1867 | 0.1950 | 0.1518 | 8.6484 | |
| Hunan | 0.1061 | 0.1142 | 0.1281 | 0.1354 | 0.1521 | 0.1618 | 0.1786 | 0.1903 | 0.1458 | 8.7417 | |
| Jiangxi | 0.0803 | 0.0884 | 0.0986 | 0.1034 | 0.1139 | 0.1208 | 0.1299 | 0.1381 | 0.1092 | 8.0714 | |
| Mean | 0.0996 | 0.1067 | 0.1150 | 0.1249 | 0.1373 | 0.1462 | 0.1569 | 0.1681 | 0.1318 | 7.7747 | |
| Western | Inner Mongolia | 0.0670 | 0.0666 | 0.0585 | 0.0610 | 0.0679 | 0.0676 | 0.0745 | 0.0748 | 0.0672 | 1.8665 |
| Guangxi | 0.0653 | 0.0679 | 0.0760 | 0.0817 | 0.0872 | 0.0872 | 0.0923 | 0.0968 | 0.0818 | 5.8471 | |
| Chongqing | 0.0833 | 0.0922 | 0.0998 | 0.1061 | 0.1226 | 0.1311 | 0.1377 | 0.1510 | 0.1155 | 8.9279 | |
| Sichuan | 0.0911 | 0.1056 | 0.1163 | 0.1308 | 0.1477 | 0.1621 | 0.1767 | 0.1864 | 0.1396 | 10.8125 | |
| Guizhou | 0.0584 | 0.0663 | 0.0742 | 0.0793 | 0.0878 | 0.0941 | 0.1032 | 0.1178 | 0.0851 | 10.5788 | |
| Yunnan | 0.0626 | 0.0660 | 0.0733 | 0.0772 | 0.0817 | 0.0872 | 0.1049 | 0.1089 | 0.0827 | 8.3537 | |
| Shanxi | 0.1003 | 0.1012 | 0.1026 | 0.1115 | 0.1200 | 0.1304 | 0.1395 | 0.1439 | 0.1187 | 5.3403 | |
| Gansu | 0.0513 | 0.0515 | 0.0438 | 0.0517 | 0.0550 | 0.0602 | 0.0687 | 0.0758 | 0.0572 | 6.2624 | |
| Qinghai | 0.0243 | 0.0263 | 0.0207 | 0.0370 | 0.0344 | 0.0444 | 0.0143 | 0.0517 | 0.0316 | 40.2981 | |
| Ningxia | 0.0676 | 0.0738 | 0.0567 | 0.0793 | 0.0621 | 0.0645 | 0.0645 | 0.0615 | 0.0662 | 0.4808 | |
| Xinjiang | 0.0465 | 0.0518 | 0.0402 | 0.0397 | 0.0518 | 0.0675 | 0.0722 | 0.0838 | 0.0567 | 10.2447 | |
| Mean | 0.0652 | 0.0699 | 0.0693 | 0.0778 | 0.0835 | 0.0906 | 0.0953 | 0.1048 | 0.0820 | 7.0736 | |
| Northeast | Liaoning | 0.0948 | 0.0946 | 0.0844 | 0.0936 | 0.1056 | 0.1122 | 0.1133 | 0.1235 | 0.1027 | 4.1489 |
| Jilin | 0.0719 | 0.0720 | 0.0726 | 0.0768 | 0.0735 | 0.0825 | 0.0847 | 0.0984 | 0.0790 | 4.7953 | |
| Heilongjiang | 0.0769 | 0.0771 | 0.0721 | 0.0746 | 0.0773 | 0.0777 | 0.0806 | 0.0884 | 0.0781 | 2.1124 | |
| Mean | 0.0812 | 0.0812 | 0.0764 | 0.0817 | 0.0854 | 0.0908 | 0.0929 | 0.1034 | 0.0866 | 3.6533 | |
| Whole Country | Mean | 0.1058 | 0.1154 | 0.1228 | 0.1355 | 0.1471 | 0.1565 | 0.1672 | 0.1815 | 0.1415 | 8.0196 |
Table 7.
Results of the value-added capability of coupled development of the digital economy and the manufacturing industry from 2013 to 2020 in China.
Table 7.
Results of the value-added capability of coupled development of the digital economy and the manufacturing industry from 2013 to 2020 in China.
| Region | 2013 | 2014 | 2015 | 2016 | 2017 | 2018 | 2019 | 2020 | Annual Mean | Annual Average Growth Rate (%) | |
|---|---|---|---|---|---|---|---|---|---|---|---|
| Eastern | Beijing | 0.0170 | 0.0255 | 0.0383 | 0.0453 | 0.0579 | 0.0687 | 0.0919 | 0.0996 | 0.0555 | 29.5763 |
| Tianjin | 0.0029 | 0.0041 | 0.0058 | 0.0067 | 0.0074 | 0.0090 | 0.0104 | 0.0127 | 0.0074 | 24.0574 | |
| Hebei | 0.0029 | 0.0043 | 0.0062 | 0.0092 | 0.0118 | 0.0155 | 0.0178 | 0.0215 | 0.0111 | 34.0701 | |
| Shandong | 0.0256 | 0.0343 | 0.0444 | 0.0621 | 0.0742 | 0.0783 | 0.0802 | 0.0999 | 0.0624 | 22.2075 | |
| Shanghai | 0.0143 | 0.0224 | 0.0295 | 0.0357 | 0.0425 | 0.0482 | 0.0613 | 0.0714 | 0.0407 | 26.5166 | |
| Jiangsu | 0.0515 | 0.0751 | 0.1062 | 0.1348 | 0.1665 | 0.2038 | 0.2427 | 0.3072 | 0.1610 | 29.4070 | |
| Zhejiang | 0.0312 | 0.0431 | 0.0635 | 0.0816 | 0.0993 | 0.1184 | 0.1578 | 0.1937 | 0.0986 | 30.1214 | |
| Fujian | 0.0076 | 0.0103 | 0.0141 | 0.0201 | 0.0276 | 0.0332 | 0.0397 | 0.0412 | 0.0242 | 27.9577 | |
| Guangdong | 0.0780 | 0.1071 | 0.1606 | 0.2196 | 0.2932 | 0.3951 | 0.5067 | 0.5963 | 0.2946 | 34.0373 | |
| Hainan | 0.0009 | 0.0019 | 0.0029 | 0.0044 | 0.0051 | 0.0041 | 0.0056 | 0.0063 | 0.0039 | 36.5114 | |
| Mean | 0.0232 | 0.0328 | 0.0472 | 0.0620 | 0.0786 | 0.0974 | 0.1214 | 0.1450 | 0.0759 | 30.2143 | |
| Central | Shanxi | 0.0011 | 0.0012 | 0.0012 | 0.0016 | 0.0029 | 0.0040 | 0.0045 | 0.0051 | 0.0027 | 26.9698 |
| Anhui | 0.0037 | 0.0064 | 0.0105 | 0.0151 | 0.0200 | 0.0268 | 0.0335 | 0.0428 | 0.0198 | 43.0553 | |
| Henan | 0.0059 | 0.0091 | 0.0135 | 0.0182 | 0.0219 | 0.0239 | 0.0304 | 0.0373 | 0.0200 | 31.0419 | |
| Hubei | 0.0044 | 0.0068 | 0.0105 | 0.0148 | 0.0169 | 0.0239 | 0.0311 | 0.0353 | 0.0180 | 35.6026 | |
| Hunan | 0.0036 | 0.0054 | 0.0084 | 0.0113 | 0.0157 | 0.0202 | 0.0274 | 0.0331 | 0.0156 | 37.8873 | |
| Jiangxi | 0.0014 | 0.0024 | 0.0044 | 0.0051 | 0.0076 | 0.0100 | 0.0130 | 0.0157 | 0.0074 | 43.9047 | |
| Mean | 0.0033 | 0.0052 | 0.0081 | 0.0110 | 0.0142 | 0.0181 | 0.0233 | 0.0282 | 0.0139 | 36.3228 | |
| Western | Inner Mongolia | 0.0012 | 0.0014 | 0.0014 | 0.0019 | 0.0026 | 0.0028 | 0.0038 | 0.0041 | 0.0024 | 20.3920 |
| Guangxi | 0.0010 | 0.0017 | 0.0027 | 0.0037 | 0.0047 | 0.0056 | 0.0072 | 0.0088 | 0.0044 | 36.7767 | |
| Chongqing | 0.0019 | 0.0033 | 0.0050 | 0.0067 | 0.0099 | 0.0127 | 0.0153 | 0.0193 | 0.0093 | 40.0713 | |
| Sichuan | 0.0040 | 0.0068 | 0.0108 | 0.0156 | 0.0213 | 0.0281 | 0.0363 | 0.0427 | 0.0207 | 41.0827 | |
| Guizhou | 0.0007 | 0.0012 | 0.0023 | 0.0033 | 0.0045 | 0.0058 | 0.0077 | 0.0103 | 0.0045 | 49.9238 | |
| Yunnan | 0.0010 | 0.0016 | 0.0027 | 0.0036 | 0.0043 | 0.0056 | 0.0089 | 0.0104 | 0.0048 | 41.3774 | |
| Shanxi | 0.0031 | 0.0042 | 0.0056 | 0.0080 | 0.0101 | 0.0131 | 0.0166 | 0.0185 | 0.0099 | 29.5872 | |
| Gansu | 0.0004 | 0.0007 | 0.0008 | 0.0013 | 0.0016 | 0.0022 | 0.0031 | 0.0039 | 0.0018 | 37.1991 | |
| Qinghai | 0.0001 | 0.0002 | 0.0002 | 0.0006 | 0.0006 | 0.0010 | 0.0002 | 0.0015 | 0.0005 | 125.5512 | |
| Ningxia | 0.0007 | 0.0013 | 0.0011 | 0.0023 | 0.0017 | 0.0020 | 0.0021 | 0.0020 | 0.0016 | 25.6983 | |
| Xinjiang | 0.0006 | 0.0009 | 0.0008 | 0.0009 | 0.0015 | 0.0028 | 0.0034 | 0.0049 | 0.0020 | 40.2755 | |
| Mean | 0.0013 | 0.0021 | 0.0030 | 0.0043 | 0.0057 | 0.0074 | 0.0095 | 0.0115 | 0.0056 | 36.6039 | |
| Northeast | Liaoning | 0.0042 | 0.0049 | 0.0048 | 0.0060 | 0.0080 | 0.0096 | 0.0108 | 0.0133 | 0.0077 | 18.4197 |
| Jilin | 0.0011 | 0.0015 | 0.0020 | 0.0025 | 0.0027 | 0.0038 | 0.0041 | 0.0059 | 0.0029 | 28.6105 | |
| Heilongjiang | 0.0014 | 0.0019 | 0.0021 | 0.0026 | 0.0032 | 0.0036 | 0.0042 | 0.0055 | 0.0031 | 22.3570 | |
| Mean | 0.0022 | 0.0028 | 0.0030 | 0.0037 | 0.0046 | 0.0057 | 0.0064 | 0.0082 | 0.0046 | 20.9368 | |
| Whole Country | Mean | 0.0091 | 0.0130 | 0.0187 | 0.0248 | 0.0316 | 0.0394 | 0.0493 | 0.0590 | 0.0306 | 30.8970 |
Table 8.
Classification and ranking of provinces and municipalities in terms of the coupling degree and the value-added capability of the digital economy and the manufacturing industry from 2013 to 2020.
Table 8.
Classification and ranking of provinces and municipalities in terms of the coupling degree and the value-added capability of the digital economy and the manufacturing industry from 2013 to 2020.
| Region Type | Coupling Degree | Value-Added Capability |
|---|---|---|
| Developed | Guangdong (0.4687), Jiangsu (0.3783), Zhejiang (0.2890), Shandong (0.2517) | Guangdong (0.2946), Jiangsu (0.1610), Zhejiang (0.0986), Shandong (0.0624) |
| Moderately Developed | Beijing (0.2053), Shanghai (0.2030), Fujian (0.1630), Anhui (0.1606), Henan (0.1588), Hubei (0.1518), Hunan (0.1458) | Beijing (0.0555), Shanghai (0.0407) |
| Moderately Underdeveloped | Sichuan (0.1396), Tianjin (0.1242), Hebei (0.1188), Shaanxi (0.1187), Chongqing (0.1155) | Fujian (0.0242) |
| Underdeveloped | Jiangxi (0.1092), Liaoning (0.1027), Hainan (0.0892), Guizhou (0.0851), Yunnan (0.0827), Guangxi (0.0818), Jilin (0.0790), Heilongjiang (0.0781), Inner Mongolia (0.0672), Ningxia (0.0662), Shanxi (0.0647), Gansu (0.0572), Xinjiang (0.0567), Qinghai (0.0316) | Sichuan (0.0207), Henan (0.0200), Anhui (0.0198), Hubei (0.0180), Hunan (0.0156), Hebei (0.0111), Shaanxi (0.0099), Chongqing (0.0093), Liaoning (0.0077), Jiangxi (0.0074), Tianjin (0.0074), Yunnan (0.0048), Guizhou (0.0045), Guangxi (0.0044), Hainan (0.0039), Heilongjiang (0.0031), Jilin (0.0029), Shanxi (0.0027), Inner Mongolia (0.0024), Xinjiang (0.0020), Gansu (0.0018), Ningxia (0.0016), Qinghai (0.0005) |
Note: Values in brackets are the annual mean of the coupling degree and the value-added capability of the digital economy and the manufacturing industry in sample provinces and municipalities. The national annual means of the coupling degree and the value-added capability were 0.1415 and 0.0306, respectively.
Table 9.
The decomposed types of the value-added capability of the coupled development between the digital economy and the manufacturing industry.
Table 9.
The decomposed types of the value-added capability of the coupled development between the digital economy and the manufacturing industry.
| Type | Type I | Type II | Type III | Type IV |
| Description | Original value-added capability | Value-added effect driven by manufacturing industry development on basis of coupling degree of both systems and digital economy in the base period. | Value-added effect driven by digital economy development on basis of coupling degree of both systems and manufacturing industry in the base period. | Value-added effect driven by interactive influence of digital economy and manufacturing industry on basis of coupling degree of both systems in the base period. |
| Type | Type V | Type VI | Type VII | Type VIII |
| Description | Value-added effect driven by coupling degree of both systemson basis of digital economy and manufacturing industry in the base period. | Value-added effect driven by manufacturing industry development and coupling degree of two systems on basis of digital economy in the base period. | Value-added effect driven by digital economy and coupling degree of both systems on basis of manufacturing industry in the base period. | Value-added effect driven by coupling degree of both systems and interactive influence of digital economy and manufacturing industry. |
Table 10.
Results of the decomposed value-added capability of coupled development between the digital economy and the manufacturing industry in 2020.
Table 10.
Results of the decomposed value-added capability of coupled development between the digital economy and the manufacturing industry in 2020.
| Region | Values of Decomposed Value-Added Capability | ||||||||
|---|---|---|---|---|---|---|---|---|---|
| Type | Type I | Type Ⅱ | Type III | Type IV | Type V | Type VI | Type VII | Type VIII | |
| Eastern | Beijing | 0.0170 | 0.0058 | 0.0228 | 0.0078 | 0.0147 | 0.0050 | 0.0197 | 0.0068 |
| Tianjin | 0.0029 | 0.0004 | 0.0053 | 0.0008 | 0.0010 | 0.0002 | 0.0018 | 0.0003 | |
| Hebei | 0.0029 | 0.0008 | 0.0068 | 0.0020 | 0.0021 | 0.0006 | 0.0049 | 0.0015 | |
| Shandong | 0.0256 | 0.0022 | 0.0402 | 0.0035 | 0.0102 | 0.0009 | 0.0160 | 0.0014 | |
| Shanghai | 0.0143 | 0.0038 | 0.0200 | 0.0054 | 0.0092 | 0.0025 | 0.0128 | 0.0034 | |
| Jiangsu | 0.0515 | 0.0206 | 0.0711 | 0.0284 | 0.0407 | 0.0162 | 0.0562 | 0.0225 | |
| Zhejiang | 0.0312 | 0.0136 | 0.0404 | 0.0176 | 0.0276 | 0.0120 | 0.0358 | 0.0155 | |
| Fujian | 0.0076 | 0.0023 | 0.0116 | 0.0034 | 0.0050 | 0.0015 | 0.0076 | 0.0023 | |
| Guangdong | 0.0780 | 0.0449 | 0.1102 | 0.0635 | 0.0788 | 0.0454 | 0.1114 | 0.0642 | |
| Hainan | 0.0009 | 0.0002 | 0.0024 | 0.0006 | 0.0005 | 0.0001 | 0.0013 | 0.0003 | |
| mean | 0.0232 | 0.0095 | 0.0331 | 0.0133 | 0.0190 | 0.0084 | 0.0267 | 0.0118 | |
| Central | Shanxi | 0.0011 | 0.0001 | 0.0028 | 0.0001 | 0.0003 | 0.0000 | 0.0007 | 0.0000 |
| Anhui | 0.0037 | 0.0015 | 0.0125 | 0.0049 | 0.0033 | 0.0013 | 0.0112 | 0.0044 | |
| Henan | 0.0059 | 0.0009 | 0.0157 | 0.0024 | 0.0029 | 0.0004 | 0.0079 | 0.0012 | |
| Hubei | 0.0044 | 0.0015 | 0.0106 | 0.0036 | 0.0034 | 0.0011 | 0.0081 | 0.0027 | |
| Hunan | 0.0036 | 0.0012 | 0.0104 | 0.0035 | 0.0028 | 0.0009 | 0.0081 | 0.0027 | |
| Jiangxi | 0.0014 | 0.0004 | 0.0058 | 0.0017 | 0.0010 | 0.0003 | 0.0041 | 0.0012 | |
| mean | 0.0033 | 0.0009 | 0.0096 | 0.0027 | 0.0023 | 0.0007 | 0.0067 | 0.0020 | |
| Western | Inner Mongolia | 0.0012 | 0.0000 | 0.0026 | 0.0000 | 0.0001 | 0.0000 | 0.0003 | 0.0000 |
| Guangxi | 0.0010 | 0.0001 | 0.0042 | 0.0006 | 0.0005 | 0.0001 | 0.0020 | 0.0003 | |
| Chongqing | 0.0019 | 0.0007 | 0.0060 | 0.0021 | 0.0015 | 0.0005 | 0.0048 | 0.0017 | |
| Sichuan | 0.0040 | 0.0015 | 0.0113 | 0.0043 | 0.0041 | 0.0016 | 0.0115 | 0.0044 | |
| Guizhou | 0.0007 | 0.0003 | 0.0029 | 0.0013 | 0.0007 | 0.0003 | 0.0029 | 0.0013 | |
| Yunnan | 0.0010 | 0.0003 | 0.0037 | 0.0010 | 0.0007 | 0.0002 | 0.0027 | 0.0008 | |
| Shanxi | 0.0031 | 0.0004 | 0.0083 | 0.0011 | 0.0013 | 0.0002 | 0.0036 | 0.0005 | |
| Gansu | 0.0004 | 0.0001 | 0.0018 | 0.0003 | 0.0002 | 0.0000 | 0.0009 | 0.0002 | |
| Qinghai | 0.0001 | 0.0000 | 0.0004 | 0.0002 | 0.0001 | 0.0000 | 0.0005 | 0.0002 | |
| Ningxia | 0.0007 | −0.0001 | 0.0018 | −0.0002 | −0.0001 | 0.0000 | −0.0002 | 0.0000 | |
| Xinjiang | 0.0006 | 0.0002 | 0.0015 | 0.0005 | 0.0004 | 0.0002 | 0.0012 | 0.0004 | |
| Mean | 0.0013 | 0.0003 | 0.0040 | 0.0010 | 0.0009 | 0.0003 | 0.0027 | 0.0009 | |
| Northeast | Liaoning | 0.0042 | 0.0004 | 0.0051 | 0.0005 | 0.0013 | 0.0001 | 0.0015 | 0.0002 |
| Jilin | 0.0011 | 0.0002 | 0.0027 | 0.0004 | 0.0004 | 0.0001 | 0.0010 | 0.0001 | |
| Heilongjiang | 0.0014 | 0.0000 | 0.0034 | 0.0000 | 0.0002 | 0.0000 | 0.0005 | 0.0000 | |
| Mean | 0.0022 | 0.0002 | 0.0037 | 0.0003 | 0.0006 | 0.0001 | 0.0010 | 0.0001 | |
| Whole Country | Mean | 0.0091 | 0.0035 | 0.0148 | 0.0054 | 0.0072 | 0.0031 | 0.0114 | 0.0047 |
Table 11.
Percentages of the decomposed value-added capability of coupled development between the digital economy and the manufacturing industry in 2020.
Table 11.
Percentages of the decomposed value-added capability of coupled development between the digital economy and the manufacturing industry in 2020.
| Region | Percentages of the Values of Decomposed Value-Added Capability (%) | ||||||||
|---|---|---|---|---|---|---|---|---|---|
| Type | Type I | Type Ⅱ | Type III | Type IV | Type V | Type VI | Type VII | Type VIII | |
| Eastern | Beijing | 17.08 | 5.87 | 22.88 | 7.86 | 14.73 | 5.06 | 19.74 | 6.78 |
| Tianjin | 22.80 | 3.45 | 41.61 | 6.30 | 7.95 | 1.20 | 14.50 | 2.19 | |
| Hebei | 13.27 | 3.92 | 31.49 | 9.31 | 9.62 | 2.84 | 22.81 | 6.74 | |
| Shandong | 25.59 | 2.20 | 40.27 | 3.46 | 10.19 | 0.88 | 16.03 | 1.38 | |
| Shanghai | 20.01 | 5.37 | 28.04 | 7.53 | 12.82 | 3.44 | 17.96 | 4.83 | |
| Jiangsu | 16.75 | 6.69 | 23.16 | 9.25 | 13.24 | 5.29 | 18.31 | 7.31 | |
| Zhejiang | 16.12 | 7.01 | 20.88 | 9.08 | 14.25 | 6.19 | 18.46 | 8.02 | |
| Fujian | 18.48 | 5.49 | 28.09 | 8.35 | 12.11 | 3.60 | 18.41 | 5.47 | |
| Guangdong | 13.07 | 7.54 | 18.47 | 10.65 | 13.21 | 7.62 | 18.67 | 10.76 | |
| Hainan | 14.76 | 3.69 | 37.48 | 9.37 | 7.84 | 1.96 | 19.91 | 4.98 | |
| Mean | 15.99 | 6.53 | 22.81 | 9.17 | 13.08 | 5.82 | 18.45 | 8.14 | |
| Central | Shanxi | 21.06 | 1.04 | 55.29 | 2.73 | 5.22 | 0.26 | 13.71 | 0.68 |
| Anhui | 8.58 | 3.39 | 29.25 | 11.57 | 7.67 | 3.03 | 26.16 | 10.34 | |
| Henan | 15.76 | 2.39 | 42.07 | 6.39 | 7.90 | 1.20 | 21.08 | 3.20 | |
| Hubei | 12.46 | 4.22 | 29.93 | 10.13 | 9.50 | 3.22 | 22.83 | 7.73 | |
| Hunan | 10.79 | 3.63 | 31.36 | 10.53 | 8.38 | 2.81 | 24.33 | 8.17 | |
| Jiangxi | 8.67 | 2.52 | 36.64 | 10.64 | 6.16 | 1.79 | 26.02 | 7.56 | |
| Mean | 11.79 | 3.24 | 34.10 | 9.57 | 8.03 | 2.42 | 23.60 | 7.25 | |
| Western | Inner Mongolia | 28.45 | −0.27 | 61.96 | −0.58 | 3.32 | −0.03 | 7.23 | −0.07 |
| Guangxi | 11.76 | 1.64 | 47.52 | 6.64 | 5.65 | 0.79 | 22.82 | 3.19 | |
| Chongqing | 9.90 | 3.49 | 31.13 | 10.97 | 7.94 | 2.80 | 24.97 | 8.80 | |
| Sichuan | 9.42 | 3.58 | 26.39 | 10.02 | 9.64 | 3.66 | 27.02 | 10.26 | |
| Guizhou | 6.38 | 2.86 | 27.97 | 12.56 | 6.43 | 2.89 | 28.22 | 12.67 | |
| Yunnan | 9.47 | 2.69 | 35.47 | 10.06 | 6.95 | 1.97 | 26.02 | 7.38 | |
| Shanxi | 16.61 | 2.24 | 45.08 | 6.07 | 7.12 | 0.96 | 19.32 | 2.60 | |
| Gansu | 11.35 | 2.02 | 46.15 | 8.21 | 5.41 | 0.96 | 21.99 | 3.91 | |
| Qinghai | 6.15 | 2.48 | 27.40 | 11.05 | 6.91 | 2.79 | 30.79 | 12.42 | |
| Ningxia | 33.01 | −3.81 | 91.28 | −10.54 | −2.98 | 0.34 | −8.25 | 0.95 | |
| Xinjiang | 11.44 | 3.94 | 29.87 | 10.29 | 9.16 | 3.15 | 23.90 | 8.24 | |
| Mean | 11.56 | 2.81 | 35.14 | 8.86 | 7.66 | 2.45 | 23.86 | 7.65 | |
| Northeast | Liaoning | 31.47 | 3.22 | 38.30 | 3.91 | 9.45 | 0.97 | 11.51 | 1.18 |
| Jilin | 17.96 | 2.69 | 45.70 | 6.85 | 6.57 | 0.99 | 16.73 | 2.51 | |
| Heilongjiang | 24.93 | 0.15 | 61.61 | 0.37 | 3.71 | 0.02 | 9.16 | 0.05 | |
| Mean | 26.79 | 2.41 | 45.27 | 3.82 | 7.48 | 0.76 | 12.23 | 1.24 | |
| Whole Country | Mean | 15.42 | 5.89 | 25.09 | 9.11 | 12.13 | 5.19 | 19.24 | 7.93 |
Disclaimer/Publisher’s Note: The statements, opinions and data contained in all publications are solely those of the individual author(s) and contributor(s) and not of MDPI and/or the editor(s). MDPI and/or the editor(s) disclaim responsibility for any injury to people or property resulting from any ideas, methods, instructions or products referred to in the content. |
© 2023 by the authors. Licensee MDPI, Basel, Switzerland. This article is an open access article distributed under the terms and conditions of the Creative Commons Attribution (CC BY) license (https://creativecommons.org/licenses/by/4.0/).
Share and Cite
MDPI and ACS Style
Su, R.; Fang, Y.; Zhao, X. The Development, Coupling Degree, and Value-Added Capability of the Digital Economy and Manufacturing Industry in China. Systems 2023, 11, 52. https://doi.org/10.3390/systems11020052
AMA Style
Su R, Fang Y, Zhao X. The Development, Coupling Degree, and Value-Added Capability of the Digital Economy and Manufacturing Industry in China. Systems. 2023; 11(2):52. https://doi.org/10.3390/systems11020052
Chicago/Turabian StyleSu, Rengang, Yinhai Fang, and Xianglian Zhao. 2023. "The Development, Coupling Degree, and Value-Added Capability of the Digital Economy and Manufacturing Industry in China" Systems 11, no. 2: 52. https://doi.org/10.3390/systems11020052
Note that from the first issue of 2016, this journal uses article numbers instead of page numbers. See further details here.