
Assessing the Effect of the Economy for the Common Good System on Business Performance


Business Administration Department, University of València, ES46022 València, Spain
*
Author to whom correspondence should be addressed.
Systems 2023, 11(2), 106; https://doi.org/10.3390/systems11020106
Submission received: 9 December 2022
/
Revised: 7 February 2023
/
Accepted: 11 February 2023
/
Published: 15 February 2023
(This article belongs to the Special Issue Diversity of Enterprise Ecosystems: Theories, Methods and Applications)
Abstract
:Extant literature has pointed to organizational hybridity to lever sustainable business transformation. Moreover, some authors hold that there is a possible trade-off between sustainability and performance. However, there is still little empirical evidence on the impact that such sustainability-driven hybridization systems have on performance. Thus, the present study’s main goal is to fill this gap by providing empirical evidence on the impact of the implementation of the Economy for the Common Good, as a sustainability-driven organizational system, on business performance. To do so, the authors relied on a sample of 206 businesses from five European countries. Then, the authors followed a quantitative research approach based on a hierarchical regression analysis that allowed them to test for linear, curvilinear, and moderating effects. The authors found a positive relationship between the implementation of a sustainability-driven hybridization system and firm performance. Besides, they identified some curvilinear effects pointing to the existence of a “too much of a good thing” effect, along with some moderating effects derived from organizational size.
1. Introduction
According to the Brundtland Commission, sustainable development (SD) is development “which meets the needs of the present without compromising the ability of future generations to meet their own needs” ([1] p. 8).
In 2015, the United Nations (UN) launched the 2030 agenda for SD which consists of 17 goals and 169 related targets to operationalize SD. In this line, in a speech at the Global Economic Forum held in Davos in 2016, Mr. Ki-moon (the UN Secretary-General) referred to the business role in the 2030 agenda as follows: “businesses can provide essential solutions and resources that put our world on a more sustainable path”, thus highlighting the key role that businesses are called to play in the implementation of a successful sustainability agenda. Consequently, SD is to be achieved through the cooperation of businesses and society.
In contrast, the body of literature aimed at analyzing the intersection of SDGs and business practices is still scarce. This may be due, in part, to the novelty of the SDG framework and lack of understanding of how to operationalize the SDGs [2,3,4,5].
In this line, Johnson and Schaltegger [6] point to corporate sustainability (CS) as the business approach that addresses SD. Therefore, the current body of literature on CS and existing CS frameworks can shed light on the challenge of understanding how to operationalize the SDGs at the business level.
Following Dyllick and Hockerts [7], CS entails the integration of economic, ecological, and social aspects in an organization’s short and long-term planning. Moreover, according to Engert et al. [8], CS demands a strategic approach to ensure that it is an integrated part of the business strategy and processes to make real progress. Hence, they argue that CS needs to encompass a holistic perspective, moving from being a set of disconnected actions and weak sustainability reporting to becoming a coherent part of the firm’s vision, culture, governance, management, and performance systems. For his part, Galbreath [9] considers CS as a part of strategy formulation, as it can provide firms with competitive advantages. Therefore, we hold that, following the same logic, the SDGs should be integrated into strategic management, as they can also become a path to cost reduction and market differentiation.
However, according to Silvestre and Fonseca [10], the integration of CS into firms’ long-term planning, strategic management, processes, and activities is still challenging, disconnected, and often conducted in isolation, due to the existence of a gap between sustainability intentions and sustainability practices, and there is a need to foster empirical research in this field. Indeed, some authors argue that “one main aspect to the operationalization of CS is the implementation of management instruments, concepts, and systems, i.e., sustainability management tools” ([6] p. 481).
In this sense, the literature has pointed to organizational hybridity to lever sustainable business transformation [11,12], thus considering organizational hybridity a process that facilitates organizational change toward more sustainable and responsible strategies and production processes [13].
Consequently, we argue that implementing SDGs into business strategy will require the development of sustainability management tools to enable such transformation through organizational hybridization processes. Besides, as these tools are to be put into practice in the context of for-profit organizations, their impact on the firm’s competitive position and performance needs to be evaluated.
Hence, the present research is aimed at empirically testing the impact of the implementation of the Economy for the Common Good (ECG) framework, as a hybrid organizational model that allows the sustainable transformation of businesses through the integration of SDGs [5,14,15,16,17], on the performance of 206 European firms. In this sense, this study contributes to the knowledge to advance by providing empirical evidence on the impacts of the integration of SDGs through the ECG organizational system on business performance. To this end, we applied hierarchical regression analysis to test for linear and curvilinear relationships along with the possible moderating effects of organizational size.
This paper is structured into five sections. After the present introduction, in Section 2 we present the conceptual framework, based on extant literature on CS, SDGs, hybrid organizations, and their connections to competitive advantage and performance. At the end of Section 2, we present the development of hypotheses. In Section 3, we present the research methodology and sample profile. In Section 4, the findings are discussed. Finally, the conclusions are presented in Section 5.
2. Conceptual Framework and Hypothesis Development
2.1. The ECG as a Holistic Organizational System to Integrate CS into Business Strategy
Pinelli and Maiolini [18] state that CS has businesses’ sustainability agendas as a starting point. However, according to them, such agendas often lack strategic thinking. Consequently, these agendas usually turn out to be ineffective or inadequate. For that reason, they propose to analyze the determinant factors that influence organizations’ sustainability agendas according to two key variables: the organization’s posture towards stakeholders’ expectations, and the employment of static (reactive) or developmental (proactive) models to give a response to stakeholders’ expectations.
Hence, they classify the scope and features of such sustainability agendas by employing a matrix with four quadrants describing how a sustainability agenda can evolve, based on an organizational learning process. In like manner, an organization’s sustainability agenda is expected to evolve from considering sustainability as a means to achieve economic performance based on company-specific resources and expertise to an agenda that considers sustainability as an end strategy to promote SD based on the importance of the different issues for the stakeholders. It is important to realize that this classification is following two of the three most widely used organizational theories applied to CS [19,20]: stakeholder theory [21]) and the resource-based view [22].
For its part, the ECG sustainability framework has as its main purpose to re-align business goals with society allowing the integration of SDGs into business operation [15,16,17]. Thus, following the same logic as the concept of shared value [23], it works on the idea that businesses can co-create three types of value (i.e., social, environmental, and economic), and, consequently, the creation of social and environmental value reinforces businesses’ ability to create economic value. It is worth mentioning that, no matter whether organizations are aware of such an ability, they possess it. To do this, the ECG is a system that relies on two interconnected sustainability management tools to enable businesses to implement and monitor their sustainability agendas: the common good matrix (CGM) and the common good balance sheet (CGBS) [5,17,24]. In sum, the ECG sustainability framework is suitable to design and handle a sustainability agenda that considers sustainability as an end strategy to promote SD based on the importance of the different issues for the stakeholders, following the classification by Pinelli and Maiolini [18].
Thus, on the one hand, the CGM guides the implementation process. It is conceived as a strategic matrix to guide the integration of sustainability strategies into business operation. To do so, the CGM takes stakeholders’ management as a reference and drives it according to four cross-values: human dignity, solidarity and social justice, environmental sustainability, and transparency and co-determination (the CGM can be consulted at https://www.ecogood.org/apply-ecg/common-good-matrix/ (accessed on 6 July 2022)). Likewise, the CGM allows the identification of different sources of non-economic value creation for the different stakeholder groups. Thus, it is a system that facilitates the implementation of sustainability-driven management following a multi-stakeholder orientation.
On the other hand, associated with the CGM, the ECG model proposes a set of indicators to monitor the process evolution which constitutes the ECG measurement theory. By its side, the CGBS takes such a set of indicators as a starting point and works as an integrated report that allows process monitoring. The main novelty of the CGBS as an integrated report, however, is that it works as a source of information related to sustainability concerns for both internal and external stakeholders and quantifies how sustainable the stakeholders’ management of the firms is using a scoring system. Thus, the firms could get a maximum score of 1000 points. Depending on their score, the ECG system classifies them into one of four levels of sustainable management: (1) beginner level, between 1 and 100 points; (2) advanced, between 101 and 300 points; (3) experienced, between 301 and 600 points; and (4) exemplary, between 601 and 1000 points.
Moreover, there are two versions of the CGBS. One version is designed to be applied in large enterprises, and another simplified version is designed to be applied in micro, small, and medium enterprises (MSMEs). This can be relevant in the European context as, according to the annual report on European SMEs [25], 99% of European businesses are MSMEs, generating 56.4% of added value and 66.6% of employment in the non-financial business sector. Consequently, in the European context, the integration of the SDGs into business operations through CS practices and sustainability management tools requires adaptation to MSMEs.
Additionally, the extant literature on CS points to the need to distinguish between those organizations that do and those that do not make effective contributions to SD. In this line, Dyllick and Muff [14] provide a clarification of the meaning of sustainable business by introducing a typology from business as usual to true business sustainability or sustainability 3.0. In fact, in their work, they mention ECG businesses along with B-Corporations as holistic organizational models that practice sustainability 3.0. In the same way, they state that the ECG organizational model allows starting of the decision-making process with sustainability challenges, facing of value creation taking the triple bottom line as a base [26], and holding an outside-in organizational perspective. In our view, it is an important contribution to legitimize and popularize the ECG organizational model, which includes strategies, management systems, tools, and performance measures.
More recently, some authors [10,27] agree that the integration of CS into daily business practices is necessary for its adequate development due to the following reasons: it improves competitivity and general well-being, it appeals to a holistic vision of the different sustainability dimensions, it allows the typifying of organizations, actions, and activities, it is a relevant part of organizational strategic planning, and it acts as a conceptual structure in the decision-making process. Accordingly, we argue that the ECG organizational model may leverage the competitiveness of the business where it is implemented. In short, those businesses that get higher scores on the different indicators used in the CGBS would be more likely to become more competitive and, consequently, experience performance improvements after its implementation.
2.2. Sustainable-Driven Hybrid Organizations and SDGs Integration
One of the consequences of the 2030 agenda and the launch of the SDGs is that it puts the focus on the need for a sustainable turn in business. As a result, some authors [11,12,13,28] point to organizational hybridity as the approach that deals with issues related to organizational change toward more sustainable and responsible strategies and production processes. Hence, they highlight the importance of organizational hybridity to lever sustainability-driven business transformation. Moreover, Bretos et al. [29] state that HOs are great promoters of social well-being while pursuing SDGs.
Following Mair et al. [30], hybrid organizations (HOs) are characterized by three attributes: a variety of stakeholders, the pursuit of multiple and often conflicting goals, and engagement in diverse inconsistent activities. Accordingly, these organizations do not fit into one of the ideal-typical organizational categories, combining elements of different organizational logic [31]. In like manner, Porter and Kramer [23] also point out the relevance of hybrid organizational behavior as an antecedent of shared value creation, considering social enterprises as an example of hybrid organizations.
Moreover, Campos et al. [32], after comparing the main traits of social business with those characterizing the ECG organizational system, find out that they share the following elements: looking for balance through sustainability, prioritizing social and environmental purposes over economic or financial performance, basing their operation on the principles of cooperation, transparency, and democratic participation, and contributing to the common good by creating social and environmental value through their ethically responsible behavior. Accordingly, these authors conclude that the ethical and social behavior of firms, when applying the ECG sustainability framework, drives organizations to integrate some behaviors usually tied to social businesses. Consequently, we hold that ECG businesses become HOs as they adopt some behaviors from social businesses.
In this vein, recent studies [33,34] have analyzed how HOs such as the B Corps contribute to the SDGs. Given that Dylick and Muff [14] define the B Corp and the ECG as alternative organizational systems for sustainable businesses, and some authors have also related the different cells of the CGM to different SDGs [5,15,16], we hold that ECG business can also be considered HOs with a potential contribution to the SDGs agenda.
However, B Corp and ECG firms fulfill two of the three traits that, according to Mair et al. [30], characterize HOs, i.e., they serve a wide variety of external and internal stakeholders and pursue multiple conflicting goals. In contrast, as they are mainly market-driven, for-profit organizations, the third characteristic of HOs is not as evident as the two first mentioned. Following Jancsary et al. [31], the organizational skills derived from hybridity that contribute to the integration of the SDGs into these organizations have more to do with multivocal skills. Consequently, we argue that by adopting the ECG organizational system, businesses evolve through a hybridization process. This, in turn, facilitates the coexistence of SDG pursuit with performance requirements.
2.3. Hypothesis Development
Previous developments in the CS literature point to the operationalization of sustainability processes and operations into business strategy as being an antecedent of competitive advantage and business performance [10,23,35,36,37,38].
However, some authors hold that research studies should be aimed at increasing knowledge and consolidating the idea of integrating sustainability by focusing on businesses’ connection to ethical values, performance in the long term, formal processes to embed SD into organizations, and good practices and policies [39].
It is worth mentioning that, according to Linnenluecke and Griffiths [40], sustainability integration processes require the pre-existence of some transformation skills resulting from organizational culture. In this sense, we argue that, in the case of ECG businesses, such skills are the result of the hybridization process described in Section 2.2.
Given that the ECG organizational system is stakeholder-oriented, as it takes stakeholder management as a reference to integrate CS into business strategy [5,17], and previous studies point to stakeholder management as showing a positive correlation with business performance [41], we can expect that organizations that are more effective in integrating sustainability-driven stakeholder management through the ECG system show better performance levels.
Therefore, we propose the following hypothesis:
Hypothesis 1.
There is a positive linear relationship between the ECG score of the organizations and their performance.
In addition, some authors find that the relationship between social responsibility and financial performance shows a curvilinear pattern [42]. Taking into consideration that the ECG organizational system integrates some values coming from the social responsibility approach, i.e., respect for human dignity, solidarity, social justice, and transparency and co-determination, we propose the following hypothesis:
Hypothesis 2.
There is a positive curvilinear relationship between the ECG score of the organizations and their performance.
Finally, the extant literature points to organizational size as a relevant internal factor with some effects on the relationship between CS integration and business performance [8,10,38]. Therefore, we propose the following hypotheses:
Hypothesis 3.
Organizational size moderates the linear relationship between the ECG score of the organizations and their performance.
Hypothesis 4.
Organizational size moderates the curvilinear relationship between the ECG score of the organizations and their performance.
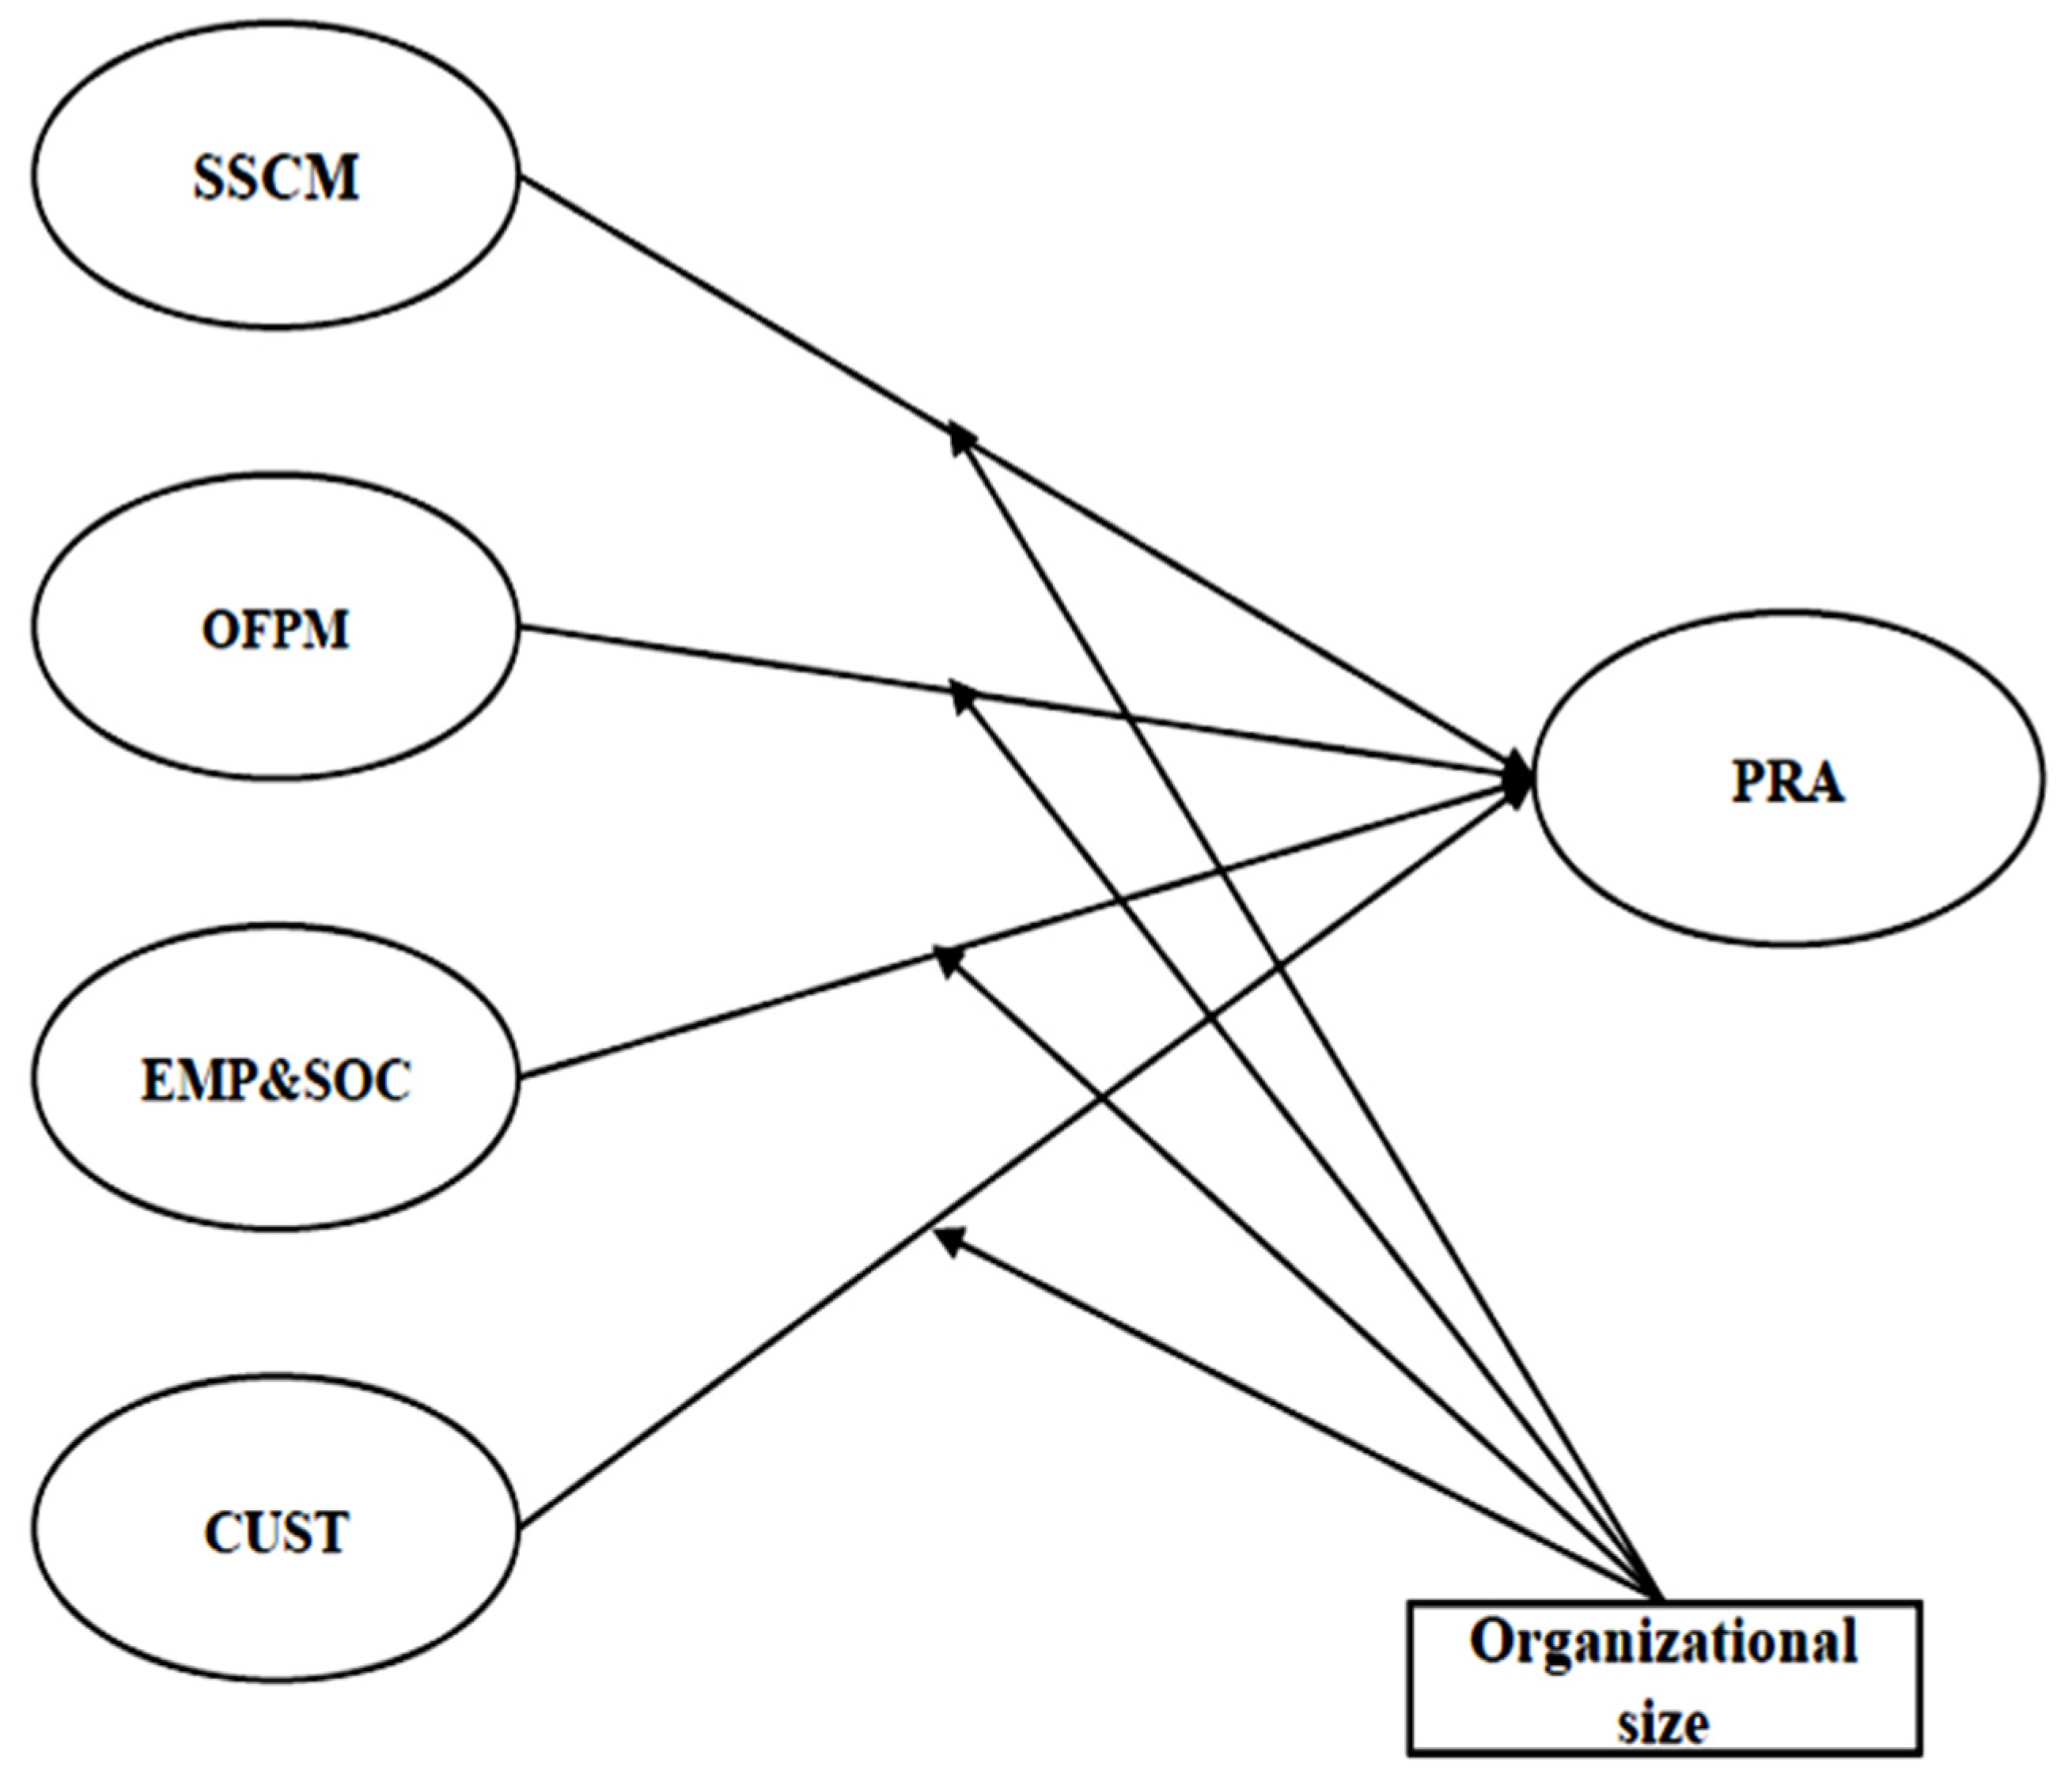
Figure 1, below, depicts the research model.
3. Methodology
3.1. Data Collection and Sample Profile
Data were collected in European ECG firms as a part of a larger study using the following procedure. Firstly, we identified the firms that implemented the ECG system from 2011 to 2017 in Europe. From this set, we selected the ones that had produced and audited their CGBS with the collaboration of an external certified auditor. Thereafter, we gathered their externally audited CGBS and extracted the scores they got in the different items comprising the CGM and CGBS.
In addition, we designed a cross-sectional study based on a questionnaire distributed among the above-mentioned firms. Such a questionnaire asked about the perceived impact that the ECG system has had on different performance measures, along with measures of organizational size. It also picked up information on the industry, age, and country of origin, these being variables treated as control variables for statistical purposes. We distributed the questionnaire through an e-mail addressed to the firms’ managers during the first quarter of 2018. The e-mail contained a link that allowed the firms to fill out the questionnaire on the online platform “Survey Monkey”. This facilitated data gathering.
Therefore, we avoided the issue of potential common method bias (CMB) by employing two different sources of information [43], i.e., the survey we passed to the organizations’ managers and the scores from externally produced and audited CGBS. Thus, the respondents providing the measure of the predictor (online survey) and criterion variables (items from the externally produced and audited CGBS) were not the same person.
The population comprised, overall, 400 European firms that had implemented the ECG system by producing and auditing their CGBS up to 31 December 2017. We sent the questionnaire to the overall population and got 206 full and valid responses, i.e., the sample comprised 51.50% of the population.
Five European countries contained most of the ECG firms included in the sample—Germany (39.8%), Austria (30.1%), Spain (19.4%), Italy (7.8%), and Switzerland (2.4%)—whilst the rest of the European countries accounted for 0.49%. This sample profile by country is very similar to the one of the population, with 45.1% of the ECG firms from Germany, 35.5% from Austria, 11.2% from Spain, and 4.3% from Italy.
3.2. Endogenous Construct
To empirically test the impact of the implementation of the ECG system on firms’ overall performance, we proceeded to define firms’ overall performance as the endogenous construct for this study. Hence, we measured the endogenous construct by the combination of two previous measurement scales [41,44]. Firstly, we took the multi-item perceptual measure employed by Patel et al. [41] to measure overall firm performance as a base.
However, instead of measuring the items included in the original scale by Patel et al. [41] based on a 0–100 Likert-type scale, we employed a 1–5 Likert-type scale. We considered the 1–5 scale more appropriate because our purpose was to test the impact of a specific sustainability tool on business performance, and, thus, we needed to ask respondents about the perceived effects on different performance items from a sustainability tool implementation, as in the case of Johnson [44].
Thus, we labeled the endogenous construct as performance in terms of perceived relative advantage (PRA). We measured PRA using the following items: company reputation, competitiveness, costs, customer acquisition and retention, employee motivation, employee productivity, internal operations, product and service innovation, and sales. Respondents were asked to rate the effects of the ECG system on these items on a 1–5 Likert-type scale (1: very negative effects, 2: negative effects, 3: no effect, 4: positive effects, 5: very positive effects).
3.3. Exogenous Constructs
In line with the purpose of the present study, we took as exogenous constructs the measurement scales proposed by the ECG system, i.e., the management of the different stakeholders according to the ECG values and principles.
Accordingly, the exogenous constructs were sustainable supply chain management orientation (SSCM), owner and financial partner management orientation (OFPM), employee and society management orientation (EMP&SOC), and customer management orientation (CUST).
Table 1, below, depicts the items we used to measure every one of the exogenous constructs. Hence, we defined the items according to the CGM and obtained the scores from the CGBS of the 206 firms included in the sample. These measurement scales were recently validated by employing exploratory factor analysis (EFA) and confirmatory factor analysis (CFA) [5,17].
In addition, as some of the hypotheses proposed to test the possible moderating effects of organizational size, we measured this variable following the recommendations of the European Commission. Thus, we defined the number of employees and revenue thresholds as described in Table 1. Finally, we employed the industry, age, and country of origin of the firms as control variables in the study.
3.4. Analysis Technique
The present study aimed to empirically test the impact of the different measurement scales employed in the ECG system to measure the sustainability-oriented management of stakeholders on firms’ overall performance. Therefore, we employed hierarchical regression analysis as a suitable technique to analyze the relationship between the endogenous construct (PRA) and the exogenous ones (SSCHM, OFPM, EMP&SOC, CUST) [45]. At the same time, the present study is the first one whose purpose is to test the impacts of the ECG system implementation on firms’ performance. Altogether, this drove us to choose hierarchical regression to test the hypotheses, as this analysis technique allowed us to enter blocks of variables in the analysis, following theory [46].
Moreover, some of the hypotheses we proposed included testing, curvilinear (quadratic) effects, and moderating effects. To reduce multicollinearity effects, we worked on standardized independent variables [47,48].
Thus, we proceeded in nine steps, as follows: in Step 1 we introduced control variables, in Step 2 we tested linear effects, in Steps 3, 4, and 5 linear moderating effects, in Steps 6 and 7 curvilinear (quadratic) effects, and in Steps 8 and 9 curvilinear effects with linear moderation. This multi-step procedure is commonly employed to test curvilinear relationships (quadratic effects) and moderating effects [49,50].
4. Results and Discussion
Table 2 below shows the means, standard deviations, reliabilities (alpha coefficients), and correlations for and among the study variables. As Table 2 depicts, the exogenous variables and the endogenous ones show statistically significant correlations among them whilst control variables did not. Besides, the alpha coefficients of the variables under study (at the diagonal) were all above the recommended threshold of 0.7. Thus, we concluded that the scales employed to measure the variables under study were reliable. Results report generated by Jasp statistical software can be found in Supplementary Materials.
Table 3, below, depicts the results of the moderated hierarchical regression analyses we employed to test the research hypotheses.
Accordingly, in Step 1 we introduced the control variables into a regression equation taking PRA as the endogenous variable. None of the control variables were statistically significant at 0.05, and the proportion of variance explained was 0.020.
In Step 2, we introduced the main effect variables and controlled for potential linear trends. As we can observe in Table 3, all the exogenous variables were statistically significant at the 0.01 level, thus indicating that multi-stakeholder management following the values and principles of the ECG organizational system has had a positive impact on businesses’ performance. For this reason, we accepted Hypothesis 1. However, not all the exogenous variables had the same impact on the businesses’ performance in terms of linear effects. Hence, EMP&SOC was a variable that showed a higher impact (β = 0.451) and OFPM a lower impact (β = 0.135). Additionally, it is worth mentioning that Step 2 regression made it possible to explain 62.5% of the variance of PRA, and the R2 change and F2 change were statistically significant at the 0.01 level.
In Step 3, we introduced the two-way interactions with linear trends analyzing the moderating effects of organizational size measured through the number of employees. The number of employees did not result in a statistically significant moderation variable. Moreover, the R2 change and F2 change were not statistically significant. Consequently, we did not keep these moderating terms in the analysis.
In Step 4, we introduced the two-way interactions with linear trends analyzing the moderating effects of organizational size measured through annual revenue. Annual revenue only resulted in a statistically significant moderation variable (p < 0.05), when applied to EMP&SOC. However, the R2 change and F2 change were not statistically significant. We decided to re-test the model keeping only the moderation term that resulted in statistical significance (Step 5). Thereafter, we examined the R2 change and F2 change in Step 5 and found out that such changes were statistically significant at 0.05 level.
Considering these results obtained from Steps 3 and 4, we mainly rejected Hypothesis 3, as we only found annual revenue to have a significant moderating effect between one of the items of the ECG scoring system (the sustainable management of the relationship with employees and local society) and business performance.
Then, in Step 6, we added the curvilinear (quadratic) terms to the exogenous variables already considered in Step 5. The curvilinear terms aim was to analyze the possible presence of “the too much of a good thing management effect” (TMGT) in the relationship between the sustainable management of stakeholders following the ECG values and principles and businesses’ performance [51] (Pierce and Aguinis, 2013).
Thus, the variables SSCM2 (β = −0.122) and OFPM2 (β = −0.120) resulted in statistical significance at the 0.01 level, whilst this was not the case for EMP&SOC2 and CUST2. However, the R2 change and F2 change were not statistically significant in Step 6. Under these circumstances, we decided to re-test the model keeping only the quadratic variables that were statistically significant in Step 6.
We, therefore, did this in Step 7 and found out that the variables SSCM2 (β = −0.117) and OFPM2 (β = −0.117) were statistically significant (p < 0.01), with the R2 change and F2 change statistically significant at the 0.01 level. Therefore, we partially accepted Hypothesis 2.
The negative sign of the quadratic terms indicate that the TMGT management effect was present, i.e., the positive effects of sustainable supply chain management and sustainable management of relationships with owners and financial service providers on business performance reached an inflection point when these effects turned negative. In contrast, the sustainable management of relationships with employees and society and with customers did not show any statistically significant quadratic pattern by which we can conclude that their potential contribution to business performance does not reach any asymptote.
Thereafter, in Steps 8 and 9 we analyzed the two-way interactions of the linear moderating terms (number of employees and annual revenue) with the curvilinear terms. As Table 3 shows, none of these interactions were statistically significant. Neither the R2 change nor the F2 change was statistically significant in Steps 8 and 9. In light of these results, we rejected Hypothesis 4.
Accordingly, the model we tested in Step 7 was the one that achieved the higher adjusted R2, reaching 0.654; i.e., this model explains 65.4% of the variance of business performance (PRA) through the linear positive effects of the sustainable management of the relationships with stakeholders following the values and principles of the ECG organizational system (SSCM, OFPM, EMP&SOC, CUST), the quadratic effects of SSCM and OFPM, and the linear moderating effects of annual revenue and EMP&SOC.
To conclude the analysis, we performed a post hoc power test. The model we tested in Step 7 achieved a power level of 0.929 (1-β), being f2 = 0.15 and α = 0.01.
In sum, the results drove us to accept Hypothesis 1, which holds that there is a positive linear relationship between the ECG score of the organizations and their performance. In addition, we partially accepted Hypothesis 2, as only in the case of SSCM and OFPM did we find negative quadratic effects that limited the positive linear impact.
However, the results drove us to mostly reject Hypothesis 3, which holds that organizational size moderates the relationship between the implementation of the ECG sustainability framework and business performance. Our hierarchical regression only detected one statistically significant linear moderating effect of annual revenue and EMP&SOC on business performance.
Finally, in line with the results, we rejected Hypothesis 4, as neither the number of employees nor the annual revenue moderates the curvilinear relationship between the ECG score of the organizations and their performance.
5. Conclusions
5.1. Contributions
Given that previous works have pointed to the operationalization of CS as one of the most challenging management topics in the present day, mainly due to businesses’ lack of knowledge regarding the impacts of their activities [8,10,33,34,38,52,53,54,55,56], the present study aimed to analyze the operationalization of SDGs into business management. To this end, it took the body of CS literature as one that could potentially provide a framework of management tools and systems to embed SD, and thus SDGs, into business strategy.
Moreover, this study also analyzed the role of the ECG system in the hybridization process of ordinary businesses. In this sense, we pointed out that, by adopting the ECG organizational system, businesses evolve through a hybridization process. This, in turn, facilitates the coexistence of SDG pursuit with performance requirements due to the development of multivocal skills it supposes.
Thus, the present study tries to fill this gap in the literature by assessing the impact of the operationalization of CS through the ECG organizational system on the performance of a sample of 206 European businesses. Our findings suggest that, overall, higher levels of sustainability-driven management of stakeholders according to the ECG scores were positively associated with better firm performance. These results are in line with the findings that Engert et al. [8,38] deduced in their literature reviews by following a theoretical approach. Consequently, our study contributes to the advance of knowledge on CS operationalization by providing empirical evidence of the impact of a specific CS system (the ECG) on business performance.
Another interesting contribution is that we identified the existence of an inverse U-shaped relationship (curvilinear effect) between some of the variables of the ECG system (SSCM and OFPM) and firms’ performance. Hence, we found a TMGT management effect.
The TMGT management effect we identified can be relevant for practitioners, as it can help them to drive their efforts in terms of sustainability management. Overall, the sustainable management of relationships with stakeholders following the ECG values and principles has a positive effect on performance. However, in the case of the supply chain and the relationship with owners and financial providers, this positive effect has a limit that, once reached, turns this effect negative. In contrast, regarding management of the relationships with employees and society and with customers, sustainable management following the ECG values and principles always has a positive impact on performance.
5.2. Limitations and Future Research
The present study also has some limitations, mainly because it examines the impact of embedding SDGs into organizations’ strategy on performance through the operationalization of CS using the ECG organizational system; i.e., we focused our analysis on one specific system. Future research should examine the impact produced by other sustainability systems that are being employed to operationalize CS.
On the other hand, our sample, despite being international, refers to the European context. Hence, future research could expand the sample to other continents and examine possible differences.
Supplementary Materials
The following supporting information can be downloaded at: https://www.mdpi.com/article/10.3390/systems11020106/s1, results report generated by Jasp statistical software.
Author Contributions
Conceptualization, V.C. and J.R.S.; methodology, V.C.; software, A.T.E.; validation, V.C.; formal analysis, V.C. and J.R.S.; investigation, V.C. and J.R.S.; resources, V.C.; data curation, A.T.E.; writing—original draft preparation, V.C.; writing—review and editing, V.C., J.R.S. and A.T.E.; visualization, A.T.E.; supervision, V.C.; project administration, V.C. and J.R.S. All authors have read and agreed to the published version of the manuscript.
Funding
This research received no external funding.
Data Availability Statement
Dataset available upon request.
Acknowledgments
We used Jasp free statistical software to perform the statistical analysis. Therefore, we would like to thank the University of Amsterdam and the Jasp software developers for their contribution to open science. More information on https://jasp-stats.org/ (accessed on 2 April 2021).
Conflicts of Interest
The authors declare no conflict of interest.
References
- World Commission on Environment and Development. Our Common Future; United Nations: New York, NY, USA, 1987. [Google Scholar]
- Van Zanten, J.; Van Tulder, R. Multinational enterprises and the Sustainable Development Goals: An institutional approach to Corporate engagement. J. Int. Bus. Policy 2018, 1, 208–233. [Google Scholar] [CrossRef]
- Howard-Grenvile, J.; Davis, G.; Dyllick, T.; Miller, C.; Thau, S.; Tsui, A. Sustainable development for a better world: Contributions of leadership, management and organizations. Acad. Manag. Discov. 2019, 5, 335–366. [Google Scholar] [CrossRef]
- Sachs, J.; Schmidt-Traub, G.; Mazzucato, M.; Messner, D.; Nakicenovic, N.; Rockström, J. Six transformations to achieve the Sustainable Development Goals. Nat. Sustain. 2019, 2, 805–814. [Google Scholar] [CrossRef]
- Ejarque, A.T.; Campos, V. Assessing the Economy for the Common Good measurement theory ability to integrate the SDGs into MSMEs. Sustainability 2020, 12, 10305. [Google Scholar] [CrossRef]
- Johson, M.; Schaltegger, S. Two decades of sustainability management tools for SMEs: How far have we come? J. Small Bus. Manag. 2016, 54, 481–505. [Google Scholar] [CrossRef]
- Dyllick, T.; Hockerts, K. Beyond the business case for Corporate Sustainability. Bus. Strategy Environ. 2002, 11, 130–141. [Google Scholar] [CrossRef]
- Engert, S.; Rauter, R.; Baumgartner, R. Exploring the integration of Corporate Sustainability into Strategic Management: A literature review. J. Clean. Prod. 2016, 112, 2833–2850. [Google Scholar] [CrossRef]
- Galbreath, J. Building Corporate Social Responsibility into strategy. Eur. Bus. Rev. 2009, 21, 109–127. [Google Scholar] [CrossRef]
- Silvestre, W.; Fonseca, A. Integrative sustainable intelligence: A holistic model to integrate Corporate Sustainability strategies. Corp. Soc. Responsib. Environ. Manag. 2020, 27, 1578–1590. [Google Scholar] [CrossRef]
- Haigh, N.; Walker, J.; Bacq, S.; Kickul, J. Hybrid Organizations: Origins, strategies, impacts, and implications. Calif. Manag. Rev. 2015, 57, 5–12. [Google Scholar] [CrossRef]
- Candi, M.; Melia, M.; Colurcio, M. Two birds with one stone: The quest for addressing both business goals and social needs with innovation. J. Bus. Ethics 2019, 160, 1019–1033. [Google Scholar] [CrossRef]
- Alexius, S.; Furusten, S. Enabling sustainable transformation: Hybrid organizations in early phases of path generation. J. Bus. Ethics 2020, 165, 547–563. [Google Scholar] [CrossRef] [Green Version]
- Dyllick, T.; Muff, K. Clarifying the meaning of Sustainable Business: Introducing a typology from business-as-usual to true business sustainability. Organ. Environ. 2016, 29, 156–174. [Google Scholar] [CrossRef] [Green Version]
- Geisenbauer, B.; (University of Bremen, Bremen, Germany); Müller-Christ, G.; (University of Bremen, Bremen, Germany). Die Sustainable Development Goals für und durch KMU: Ein leitfaden für kleine und mittlere unthernehmen. Personal communication, 2018. [Google Scholar]
- Müller-Christ, G.; Geisenbauer, B.; Tegeler, M. Die Umsetzung der SDGs im deutschen Bildungssystem: Studie im aufrag des rats für nachhaltige entwicklung der bundesregierung. Z. Für Int. Bild. Und Enwicklungspädagogik 2018, 41, 19–26. [Google Scholar] [CrossRef]
- Felber, C.; Campos, V.; Sanchis, J.R. The Common Good Balance Sheet, an adequate tool to capture non-financials? Sustainability 2019, 11, 3791. [Google Scholar] [CrossRef] [Green Version]
- Pinelli, M.; Maiolini, R. Strategies for sustainable development: Organizational motivations, stakeholders’ expectations, and sustainability agendas. Sustain. Dev. 2017, 25, 288–298. [Google Scholar] [CrossRef]
- Montiel, I.; Delgado-Ceballos, J. Defining and measuring Corporate Sustainability: Are we there yet? Organ. Environ. 2014, 27, 113–139. [Google Scholar] [CrossRef]
- Kock, C.; Santaló, J.; Diestre, L. Corporate Governance and environment: What type of governance creates greener companies? J. Manag. Stud. 2012, 49, 492–514. [Google Scholar] [CrossRef]
- Freeman, R. Strategic Management: A Stakeholder Perspective; Prentice-Hall: New York, NY, USA, 1984. [Google Scholar]
- Teece, D.; Kay, N. The Evolution of the Theory of the Firm; Eduard Elgar Publishing: Cheltenham, UK, 2019. [Google Scholar]
- Porter, M.; Kramer, M. How to reinvent capitalism and unleash a wave of innovation and growth. Harv. Bus. Rev. 2011, 89, 62–77. [Google Scholar]
- Talavera, C.; Sanchis, J.R. Alliances between for-profit and non-profit organizations as an instrument to implement the Economy for the Common Good. Sustainability 2020, 12, 9511. [Google Scholar] [CrossRef]
- European Commission. Annual Report on European SMEs; European Commission: Brussels, Belgium, 2021. [Google Scholar]
- Elkington, J. Cannibals with Forks: The Triple Bottom Line of 21st Century Business; Capstone: Oxford, UK, 1997. [Google Scholar]
- Baumgartner, R.; Rauter, R. Strategic perspectives of Corporate Sustainability management to develop a sustainable organization. J. Clean. Prod. 2017, 140, 81–92. [Google Scholar] [CrossRef]
- Horne, J.; Recker, M.; Michelfelder, I.; Jay, J.; Kratzer, J. Exploring entrepreneurship related to the Sustainable Development Goals: Mapping new venture activities with semi-automated content analysis. J. Clean. Prod. 2020, 242, 118052. [Google Scholar] [CrossRef]
- Bretos, I.; Diaz-Fonceca, M.; Marcuello, C. International expansion of Social Enterprises as a catalyst for scaling up social impact across borders. Sustainability 2020, 12, 3262. [Google Scholar] [CrossRef] [Green Version]
- Mair, J.; Mayer, J.; Lutz, E. Navigating institutional plurality: Organizational governance in hybrid organizations. Organ. Stud. 2015, 36, 713–739. [Google Scholar] [CrossRef] [Green Version]
- Jancsary, D.; Meyer, R.; Hollerer, M.; Barbeiro, V. Toward a structural model of organizational-level institutional pluralism and logic interconnectedness. Organ. Sci. 2017, 28, 1150–1167. [Google Scholar] [CrossRef] [Green Version]
- Campos, V.; Sanchis, J.R.; Ejarque, A.T. Social Entrepreneurship and Economy for the Common Good: Study of their relationship through a bibliometric analysis. J. Entrep. Innov. 2020, 21, 156–167. [Google Scholar] [CrossRef]
- Stubbs, W. Strategies, practices, and tensions in managing business model innovation for sustainability: The case of Australian BCorp. Soc. Responsib. Environ. Manag. 2019, 26, 331–344. [Google Scholar] [CrossRef]
- Tabares, S. Do hybrid organizations contribute to Sustainable Development Goals? Evidence from B Corps in Colombia. J. Clean. Prod. 2021, 280, 124615. [Google Scholar] [CrossRef]
- Ganescu, M. Corporate Social Responsibility, a strategy to create and consolidate sustainable businesses. Theor. Appl. Econ. 2012, 19, 91–106. [Google Scholar]
- Peters, M.; Zelewski, S. Competitive strategies, their relevance for sustainable development in the food industry. J. Mgmt. Sustain. 2013, 3, 148. [Google Scholar] [CrossRef] [Green Version]
- Stead, J.; Stead, W. Sustainable Strategic Management; Routledge: London, UK, 2014. [Google Scholar]
- Engert, S.; Baumgartner, R. Corporate Sustainability strategy: Bridging the gap between formulation and implementation. J. Clean. Prod. 2016, 113, 822–834. [Google Scholar] [CrossRef]
- Ortiz-Avram, D.; Dommanovich, J.; Kronenberg, C.; Scholz, M. Exploring the integration of Corporate Social Responsibility into the strategies of small and medium-sized enterprises: A systematic literature review. J. Clean. Prod. 2018, 201, 254–271. [Google Scholar] [CrossRef]
- Linnenluecke, M.; Griffits, A. Corporate Sustainability and organizational culture. J. World Bus. 2010, 45, 357–366. [Google Scholar] [CrossRef]
- Patel, V.; Manley, S.; Hair, J., Jr.; Ferrell, O.; Pieper, T. Is stakeholder orientation relevant for European firms? Eur. Manag. J. 2016, 34, 650–660. [Google Scholar] [CrossRef]
- Barnett, M.; Salomon, R. Beyond dichotomy: The curvilinear relationship between social responsibility and financial performance. Strateg. Manag. J. 2006, 27, 1101–1122. [Google Scholar] [CrossRef]
- Podsakoff, N.; MacKenzie, S.B.; Lee, J.Y.; Podsakoff, N.P. Common method biases in behavioral research: A critical review of the literature and recommended remedies. J. Appl. Psychol. 2003, 88, 879–903. [Google Scholar] [CrossRef]
- Johnson, M.P. Sustainability management and Small and Medium-sized Enterprises: Managers’ awareness and implementation of innovative tools. Corp. Soc. Responsib. Environ. Manag. 2015, 22, 271–285. [Google Scholar] [CrossRef]
- Hair, J.; Black, W.; Babin, B.; Anderson, R. Multivariate Data Analysis, 7th ed.; Pearson: Harlow, UK, 2013. [Google Scholar]
- Cleff, T. Applied Statistics and Multivariate Data Analysis for Business and Economics: A Modern Approach Using SPSS, Stata, and Excel; Springer: Berlin, Germany, 2019. [Google Scholar] [CrossRef]
- Aiken, L.; West, S.; Reno, R. Multiple Regression: Testing and Interpreting Interactions; Sage: Thousand Oaks, CA, USA, 1991. [Google Scholar]
- Mc Clelland, G.; Irwing, J.; Disatnik, D.; Sivan, L. Multicollinearity is a red herring in the search for moderator variables: A guide to interpreting moderated multiple regression models. Behav. Res. Methods 2017, 49, 394–402. [Google Scholar] [CrossRef] [Green Version]
- Janssen, O. Fairness perceptions as a moderator in the curvilinear relationships between job demands, and job performance and job satisfaction. Acad. Manag. J. 2001, 44, 1039–1050. [Google Scholar] [CrossRef]
- Le, H.; Oh, I.S.; Robbins, S.B.; Lies, R.; Holland, E.; Westrick, P. Too much of a good thing: Curvilinear relationships between personality traits and job performance. J. Appl. Psychol. 2011, 96, 113–133. [Google Scholar] [CrossRef] [Green Version]
- Pierce, J.R.; Aguinis, H. The Too-Much-of-a-Good-Thing Effect in Management. J. Manag. 2013, 39, 313–338. [Google Scholar] [CrossRef]
- Shields, J.; Shelleman, J. Integrating sustainability into SME strategy. J. Small Bus. Strategy 2015, 25, 59–78. [Google Scholar]
- Kyaw, K.; Olugbode, M.; Petracci, B. The role of the institutional framework in the relationship between earnings management and corporate social performance. Corp. Soc. Responsib. Environ. Manag. 2017, 24, 543–554. [Google Scholar] [CrossRef]
- Manning, B.; Braam, G.; Reimsbach, D. Corporate governance and sustainable business conduct effects of board monitoring effectiveness and stakeholder engagements on corporate sustainability performance and disclosure choices. Corp. Soc. Responsib. Environ. Manag. 2019, 26, 351–366. [Google Scholar] [CrossRef]
- Rosati, F.; Faria, L. Addressing the SDGs in sustainability reports: The relationship with institutional factors. J. Clean. Prod. 2019, 215, 1312–1326. [Google Scholar] [CrossRef]
- Rosati, F.; Faria, L. Business contribution to the Sustainable Development agenda: Organizational factors related to early adoption of SDG reporting. Corp. Soc. Responsib. Environ. Manag. 2019, 26, 588–597. [Google Scholar] [CrossRef]
Figure 1.
Research model.


Table 1.
Measurement scales.
| Dimension | Items | Scale Type | Source |
|---|---|---|---|
| Sustainable supply chain management orientation (SSCM) | A1. Human dignity in the supply chain A2. Solidarity and social justice in the supply chain A3. Environmental sustainability in the supply chain A4. Transparency and co-determination in the supply chain | Absolute scores from the firms’ Common Good balance sheet | Ejarque and Campos (2020) [5]; Felber et al. (2019) [17] |
| Owners and financial partners management orientation (OFPM) | B1. Ethical position concerning the financial resources B2. Social position concerning social resources B3. Use of funds concerning social and environmental impacts B4. Ownership and co-determination | ||
| Employees and society management orientation (EMP&SOC) | C2. Self-determined working arrangements C4. Co-determination and transparency within the organization E2. Contribution to society | ||
| Customer management orientation (CUST) | D1. Ethical customer relations D2. Cooperation and solidarity with other companies D4. Customer participation and product transparency | ||
| Performance in terms of perceived relative advantage (PRA) | Company reputation Competitiveness Costs Customer acquisition and retention Employee motivation Employee productivity Internal Operations Product and service innovation Sales | Likert scale (perceived effects from tool implementation): ranging from 1 “very negative effect” to 5 “very positive effect” | Patel et al. (2016) [41]; Johnson (2015) [44] |
| Organizational size | Number of Employees | European Commission recommendations https://ec.europa.eu/docsroom/documents/42921 (accessed on 12 March 2021) | |
| Annual Revenue | |||
Table 2.
Means, standard deviations, and correlations for and among study variables.
| M | SD | 1 | 2 | 3 | 4 | 5 | 6 | 7 | 8 | 9 | 10 | |
|---|---|---|---|---|---|---|---|---|---|---|---|---|
| 1. Ind. | 2.859 | 0.468 | - | |||||||||
| 2. Age | 5.539 | 1.855 | −0.053 | - | ||||||||
| 3. Count. | 2.995 | 1.183 | 0.078 | 0.039 | - | |||||||
| 4. NE | 1.636 | 0.860 | −0.043 | −0.338 ** | −0.078 | - | ||||||
| 5. Rev. | 1.684 | 1.092 | −0.040 | −0.347 ** | −0.024 | 0.781 ** | - | |||||
| 6. SSCM | 10.930 | 7.672 | −0.117 | 0.156 * | −0.121 | −0.151 * | −0.065 | 0.993 | ||||
| 7. OFPM | 3.103 | 1.044 | −0.023 | 0.190 ** | 0.129 | −0.098 | −0.080 | 0.415 ** | 0.976 | |||
| 8. EMP &SOC | 51.387 | 19.001 | −0.094 | −0.112 | −0.163 * | 0.186 ** | 0.164 * | 0.181 ** | 0.181 * | 0.793 | ||
| 9. CUST | 30.398 | 16.507 | −0.017 | 0.011 | −0.058 | 0.049 | 0.085 | 0.342 ** | 0.387 ** | 0.363 ** | 0.704 | |
| 10. PRA | 3.672 | 0.336 | −0.081 | 0.094 | −0.143 * | 0.058 | 0.042 | 0.490 ** | 0.436 ** | 0.621 ** | 0.588 ** | 0.901 |
Note: N = 206. Ind: Industry, Age: number of years in operation, Count: country of origin, NE: number of employees, Rev: revenue, SSCM: sustainable supply chain management orientation, OFPM: owner and financial partner management orientation, EMP&SOC: employee and society management orientation, CUST: customer management orientation, PRA: performance in terms of perceived relative advantage. The reliabilities (alpha coefficients) are reported in the diagonal. Significant correlations at * p < 0.05, ** p < 0.01 (2-tailed test).
Table 3.
Results of the hierarchical regression analyses.
| Step 1 | Step 2 | Step 3 | Step 4 | Step 5 | Step 6 | Step 7 | Step 8 | Step 9 | ||||||||||
|---|---|---|---|---|---|---|---|---|---|---|---|---|---|---|---|---|---|---|
| B | β | B | β | B | β | B | β | B | β | B | β | B | β | B | β | B | β | |
| Intercept | 3.644 ** | - | 3.644 ** | - | 3.645 ** | - | 3.629 ** | - | 3.634 ** | - | 3.734 ** | - | 3.739 ** | - | 3.725 ** | - | 3.741 ** | - |
| Industry | −0.036 | 0.065 | 0.003 | 0.005 | 0.001 | 0.003 | 0.001 | 0.003 | 0.003 | 0.005 | −0.002 | −0.004 | −0.002 | −0.004 | −0.001 | −0.003 | 0.000 | 0.000 |
| Age | 0.053 | 0.096 | 0.045 | 0.081 | 0.049 | 0.089 | 0.052 | 0.095 * | 0.050 | 0.091 * | 0.029 | 0.052 | 0.029 | 0.052 | 0.033 | 0.059 | 0.019 | 0.035 |
| Country | −0.078 | −0.142 * | −0.025 | −0.045 | −0.031 | −0.055 | −0.026 | −0.046 | −0.025 | −0.046 | −0.015 | −0.026 | −0.014 | −0.025 | −0.014 | −0.026 | −0.007 | −0.012 |
| SSCM | 0.130 | 0.236 ** | 0.137 | 0.248 ** | 0.138 | 0.249 ** | 0.141 | 0.256 ** | 0.158 | 0.287 ** | 0.157 | 0.285 ** | 0.165 | 0.299 ** | 0.156 | 0.283 ** | ||
| OFPM | 0.075 | 0.135 ** | 0.073 | 0.132 ** | 0.072 | 0.131 ** | 0.070 | 0.127 ** | 0.114 | 0.206 ** | 0.112 | 0.202 ** | 0.107 | 0.193 ** | 0.118 | 0.213 ** | ||
| EMP&SOC | 0.249 | 0.451 ** | 0.249 | 0.450 ** | 0.298 | 0.539 ** | 0.274 | 0.497 ** | 0.263 | 0.476 ** | 0.266 | 0.482 ** | 0.269 | 0.487 ** | 0.269 | 0.487 ** | ||
| CUST | 0.159 | 0.287 ** | 0.150 | 0.271 ** | 0.127 | 0.229 ** | 0.136 | 0.246 ** | 0.141 | 0.255 ** | 0.145 | 0.262 ** | 0.145 | 0.262 ** | 0.147 | 0.266 ** | ||
| NE X SSCM | 0.003 | 0.006 | ||||||||||||||||
| NE X OFPM | 0.033 | 0.059 | ||||||||||||||||
| NE X EMP&SOC | 0.012 | 0.019 | ||||||||||||||||
| NE X CUST | 0.015 | 0.035 | ||||||||||||||||
| Rev. X SSCM | −0.031 | −0.065 | ||||||||||||||||
| Rev. X OFPM | 0.023 | 0.044 | ||||||||||||||||
| Rev. X EMP&SOC | 0.118 | 0.187 * | 0.064 | 0.102 * | 0.057 | 0.090 | 0.064 | 0.101 * | 0.059 | 0.094 | 0.063 | 0.100 | ||||||
| Rev. X CUST | −0.054 | −0.128 | ||||||||||||||||
| SSCM2 | −0.057 | −0.122 ** | −0.054 | −0.117 ** | −0.050 | −0.109 * | −0.053 | −0.115 * | ||||||||||
| OFPM2 | −0.053 | −0.120 ** | −0.052 | −0.117 ** | −0.047 | −0.106 * | −0.055 | −0.125 * | ||||||||||
| EMP&SOC2 | 0.002 | 0.005 | ||||||||||||||||
| CUST2 | 0.007 | 0.025 | ||||||||||||||||
| NE X SSCM2 | 0.012 | 0.023 | ||||||||||||||||
| NE X OFPM2 | 0.021 | 0.036 | ||||||||||||||||
| NE X EMP&SOC2 | −0.023 | −0.045 | ||||||||||||||||
| NE X CUST2 | 0.005 | 0.035 | ||||||||||||||||
| Rev. X SSCM2 | −0.030 | −0.065 | ||||||||||||||||
| Rev. X OFPM2 | −0.023 | −0.045 | ||||||||||||||||
| Rev. X EMP&SOC2 | −0.012 | −0.025 | ||||||||||||||||
| Rev. X CUST2 | 0.005 | 0.037 | ||||||||||||||||
| R2 | 0.035 | 0.637 | 0.645 | 0.654 | 0.645 | 0.672 | 0.671 | 0.674 | 0.677 | |||||||||
| Adjusted R2 | 0.020 | 0.625 | 0.625 | 0.634 | 0.631 | 0.651 | 0.654 | 0.650 | 0.653 | |||||||||
| R2 Change | 0.035 | 0.603 ** | 0.008 | 0.016 | 0.008* | 0.027 ** | 0.026 ** | 0.003 | 0.006 | |||||||||
| F2 Change | 2.409 | 82.296 ** | 1.025 | 2.278 | 4.258 * | 3.926 ** | 7.796 ** | 0.372 | 0.855 | |||||||||
N = 206. SSCM: sustainable supply chain management orientation, OFPM: owner and financial partner management orientation, EMP&SOC: employees and society management orientation, CUST: customer management orientation, NE: number of employees, Rev: annual revenue. Significant at * p < 0.05; ** p < 0.01 (2-tailed test).
Disclaimer/Publisher’s Note: The statements, opinions and data contained in all publications are solely those of the individual author(s) and contributor(s) and not of MDPI and/or the editor(s). MDPI and/or the editor(s) disclaim responsibility for any injury to people or property resulting from any ideas, methods, instructions or products referred to in the content. |
© 2023 by the authors. Licensee MDPI, Basel, Switzerland. This article is an open access article distributed under the terms and conditions of the Creative Commons Attribution (CC BY) license (https://creativecommons.org/licenses/by/4.0/).
Share and Cite
MDPI and ACS Style
Campos, V.; Sanchis, J.R.; Ejarque, A.T. Assessing the Effect of the Economy for the Common Good System on Business Performance. Systems 2023, 11, 106. https://doi.org/10.3390/systems11020106
AMA Style
Campos V, Sanchis JR, Ejarque AT. Assessing the Effect of the Economy for the Common Good System on Business Performance. Systems. 2023; 11(2):106. https://doi.org/10.3390/systems11020106
Chicago/Turabian StyleCampos, Vanessa, Joan R. Sanchis, and Ana T. Ejarque. 2023. "Assessing the Effect of the Economy for the Common Good System on Business Performance" Systems 11, no. 2: 106. https://doi.org/10.3390/systems11020106
Note that from the first issue of 2016, this journal uses article numbers instead of page numbers. See further details here.